Submitted:
30 September 2024
Posted:
03 October 2024
You are already at the latest version
Abstract
Keywords:
1. Introduction
2. Materials and Methods
3. Results
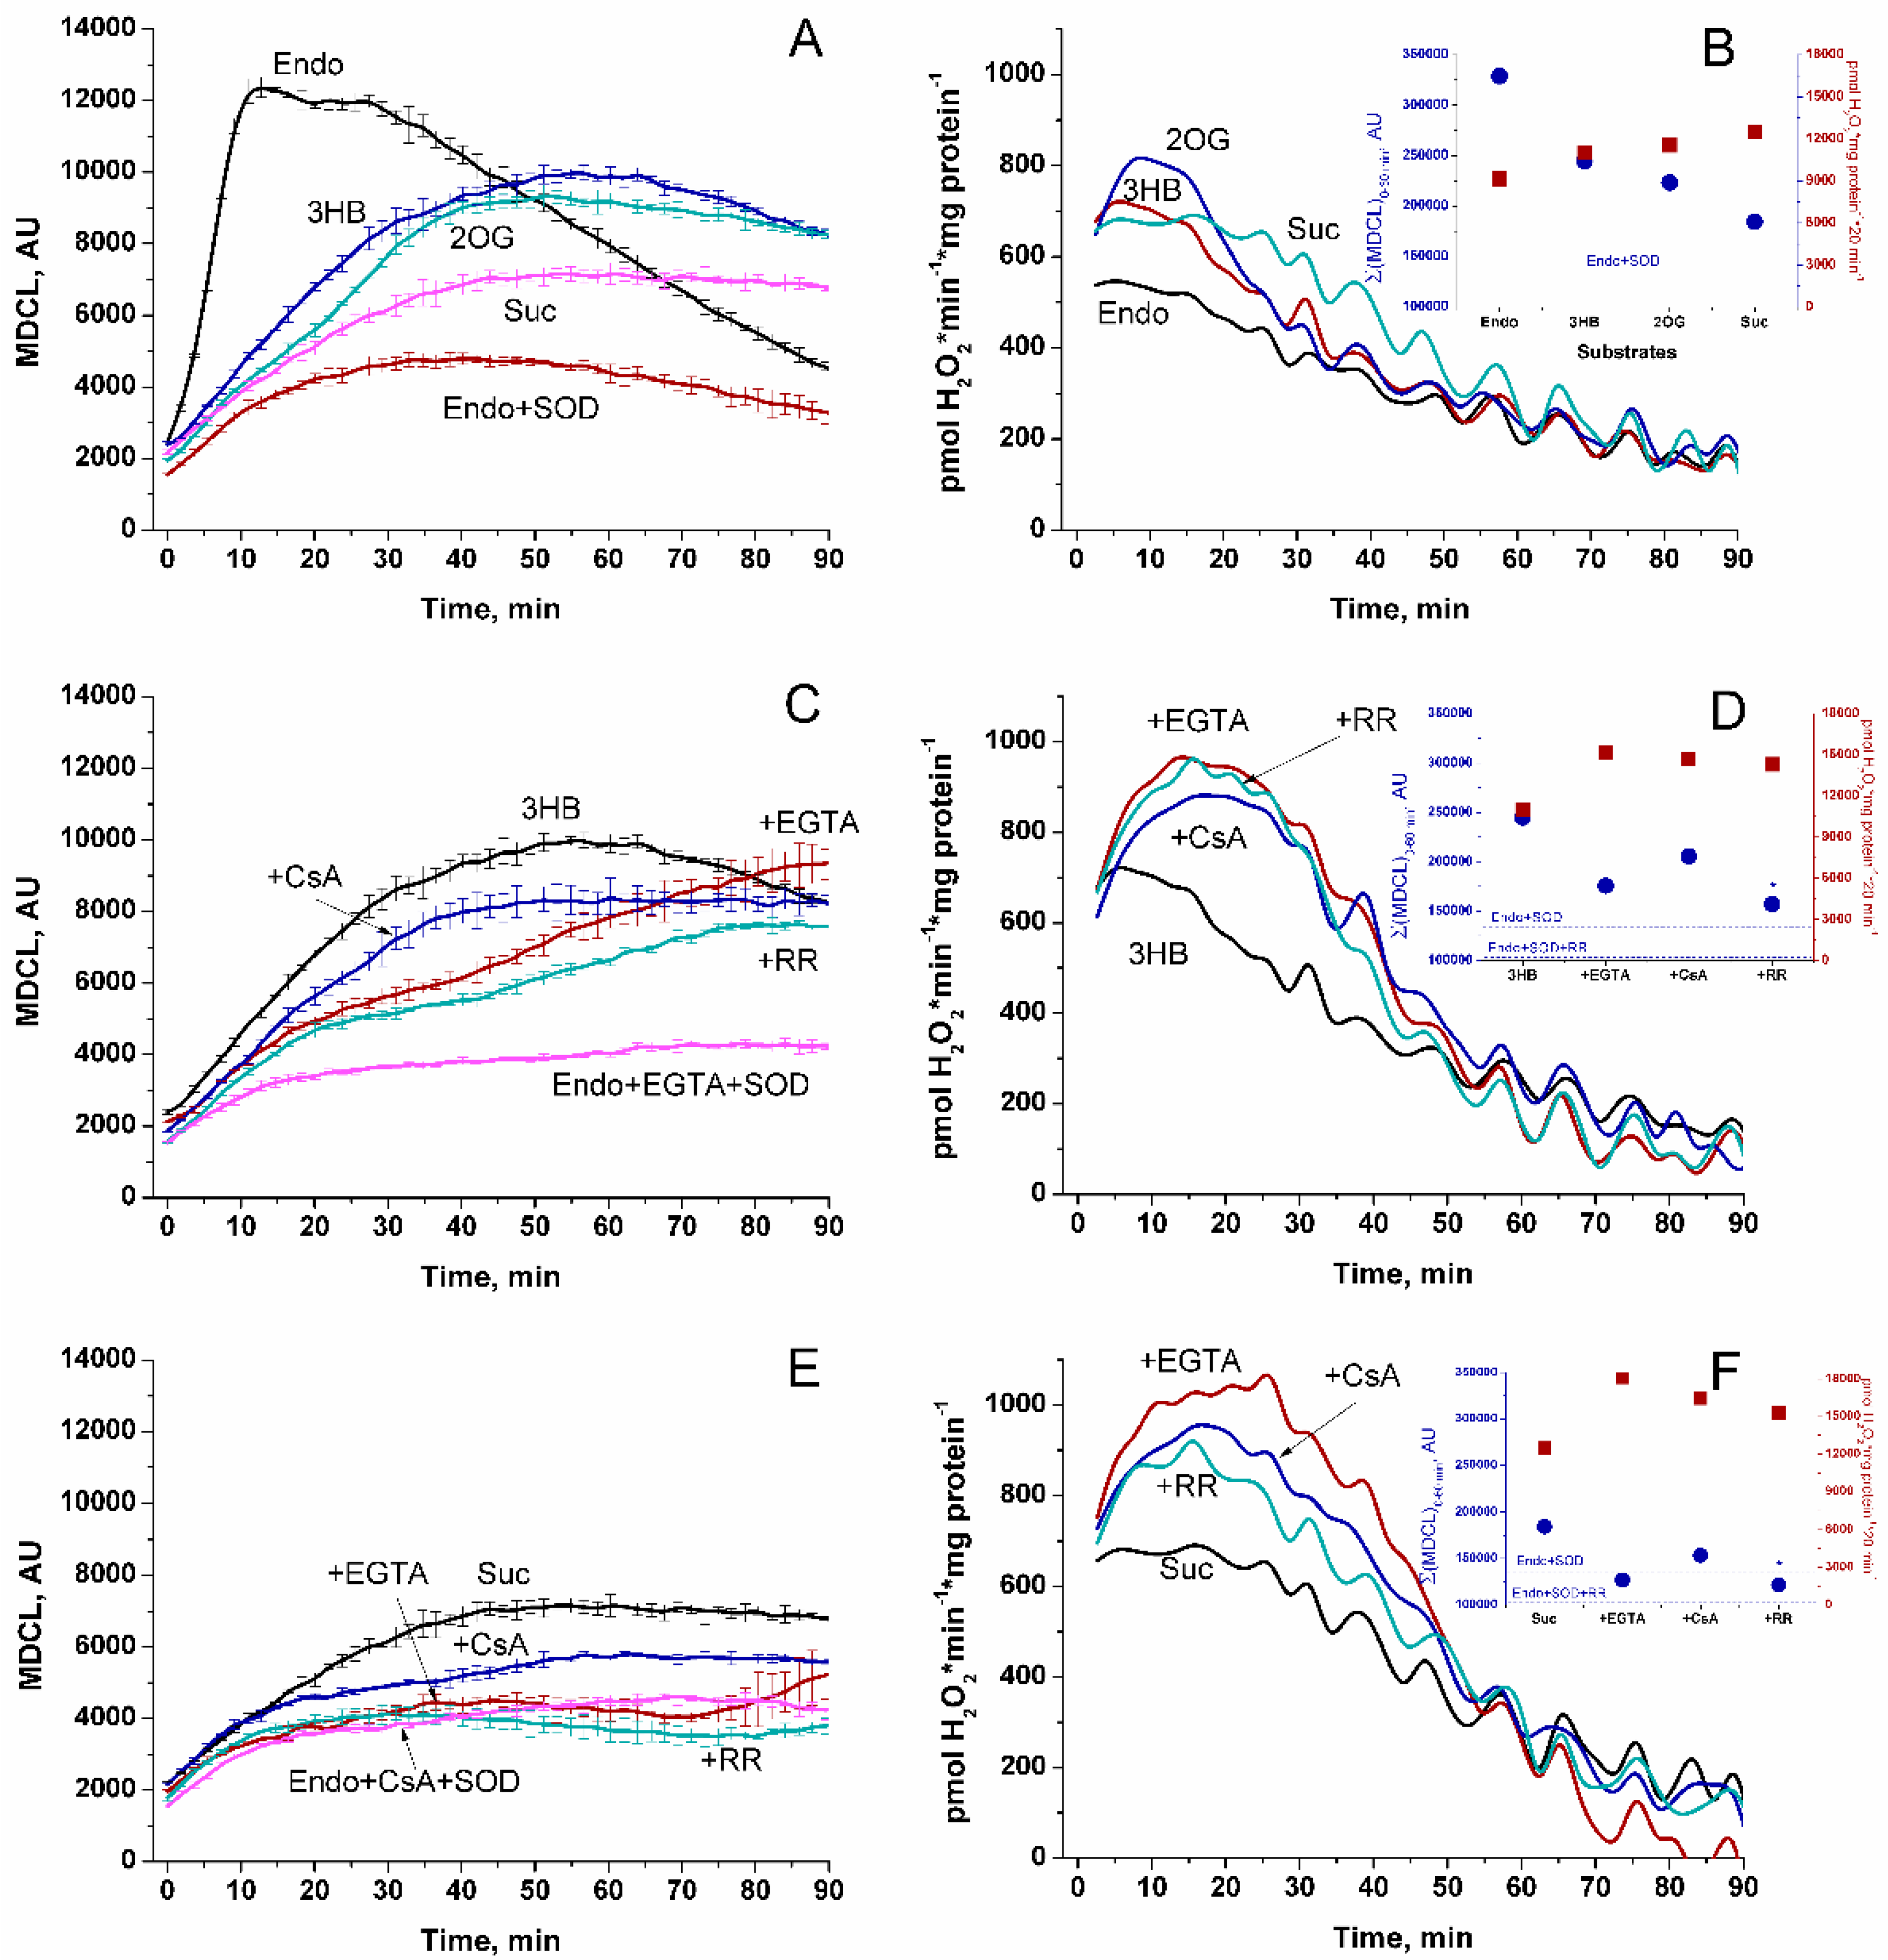
3.1. Effect of Respiratory Substrates and Permeability Transition Pore Inhibitors on the Release of SA and H2O2 from Mitochondria
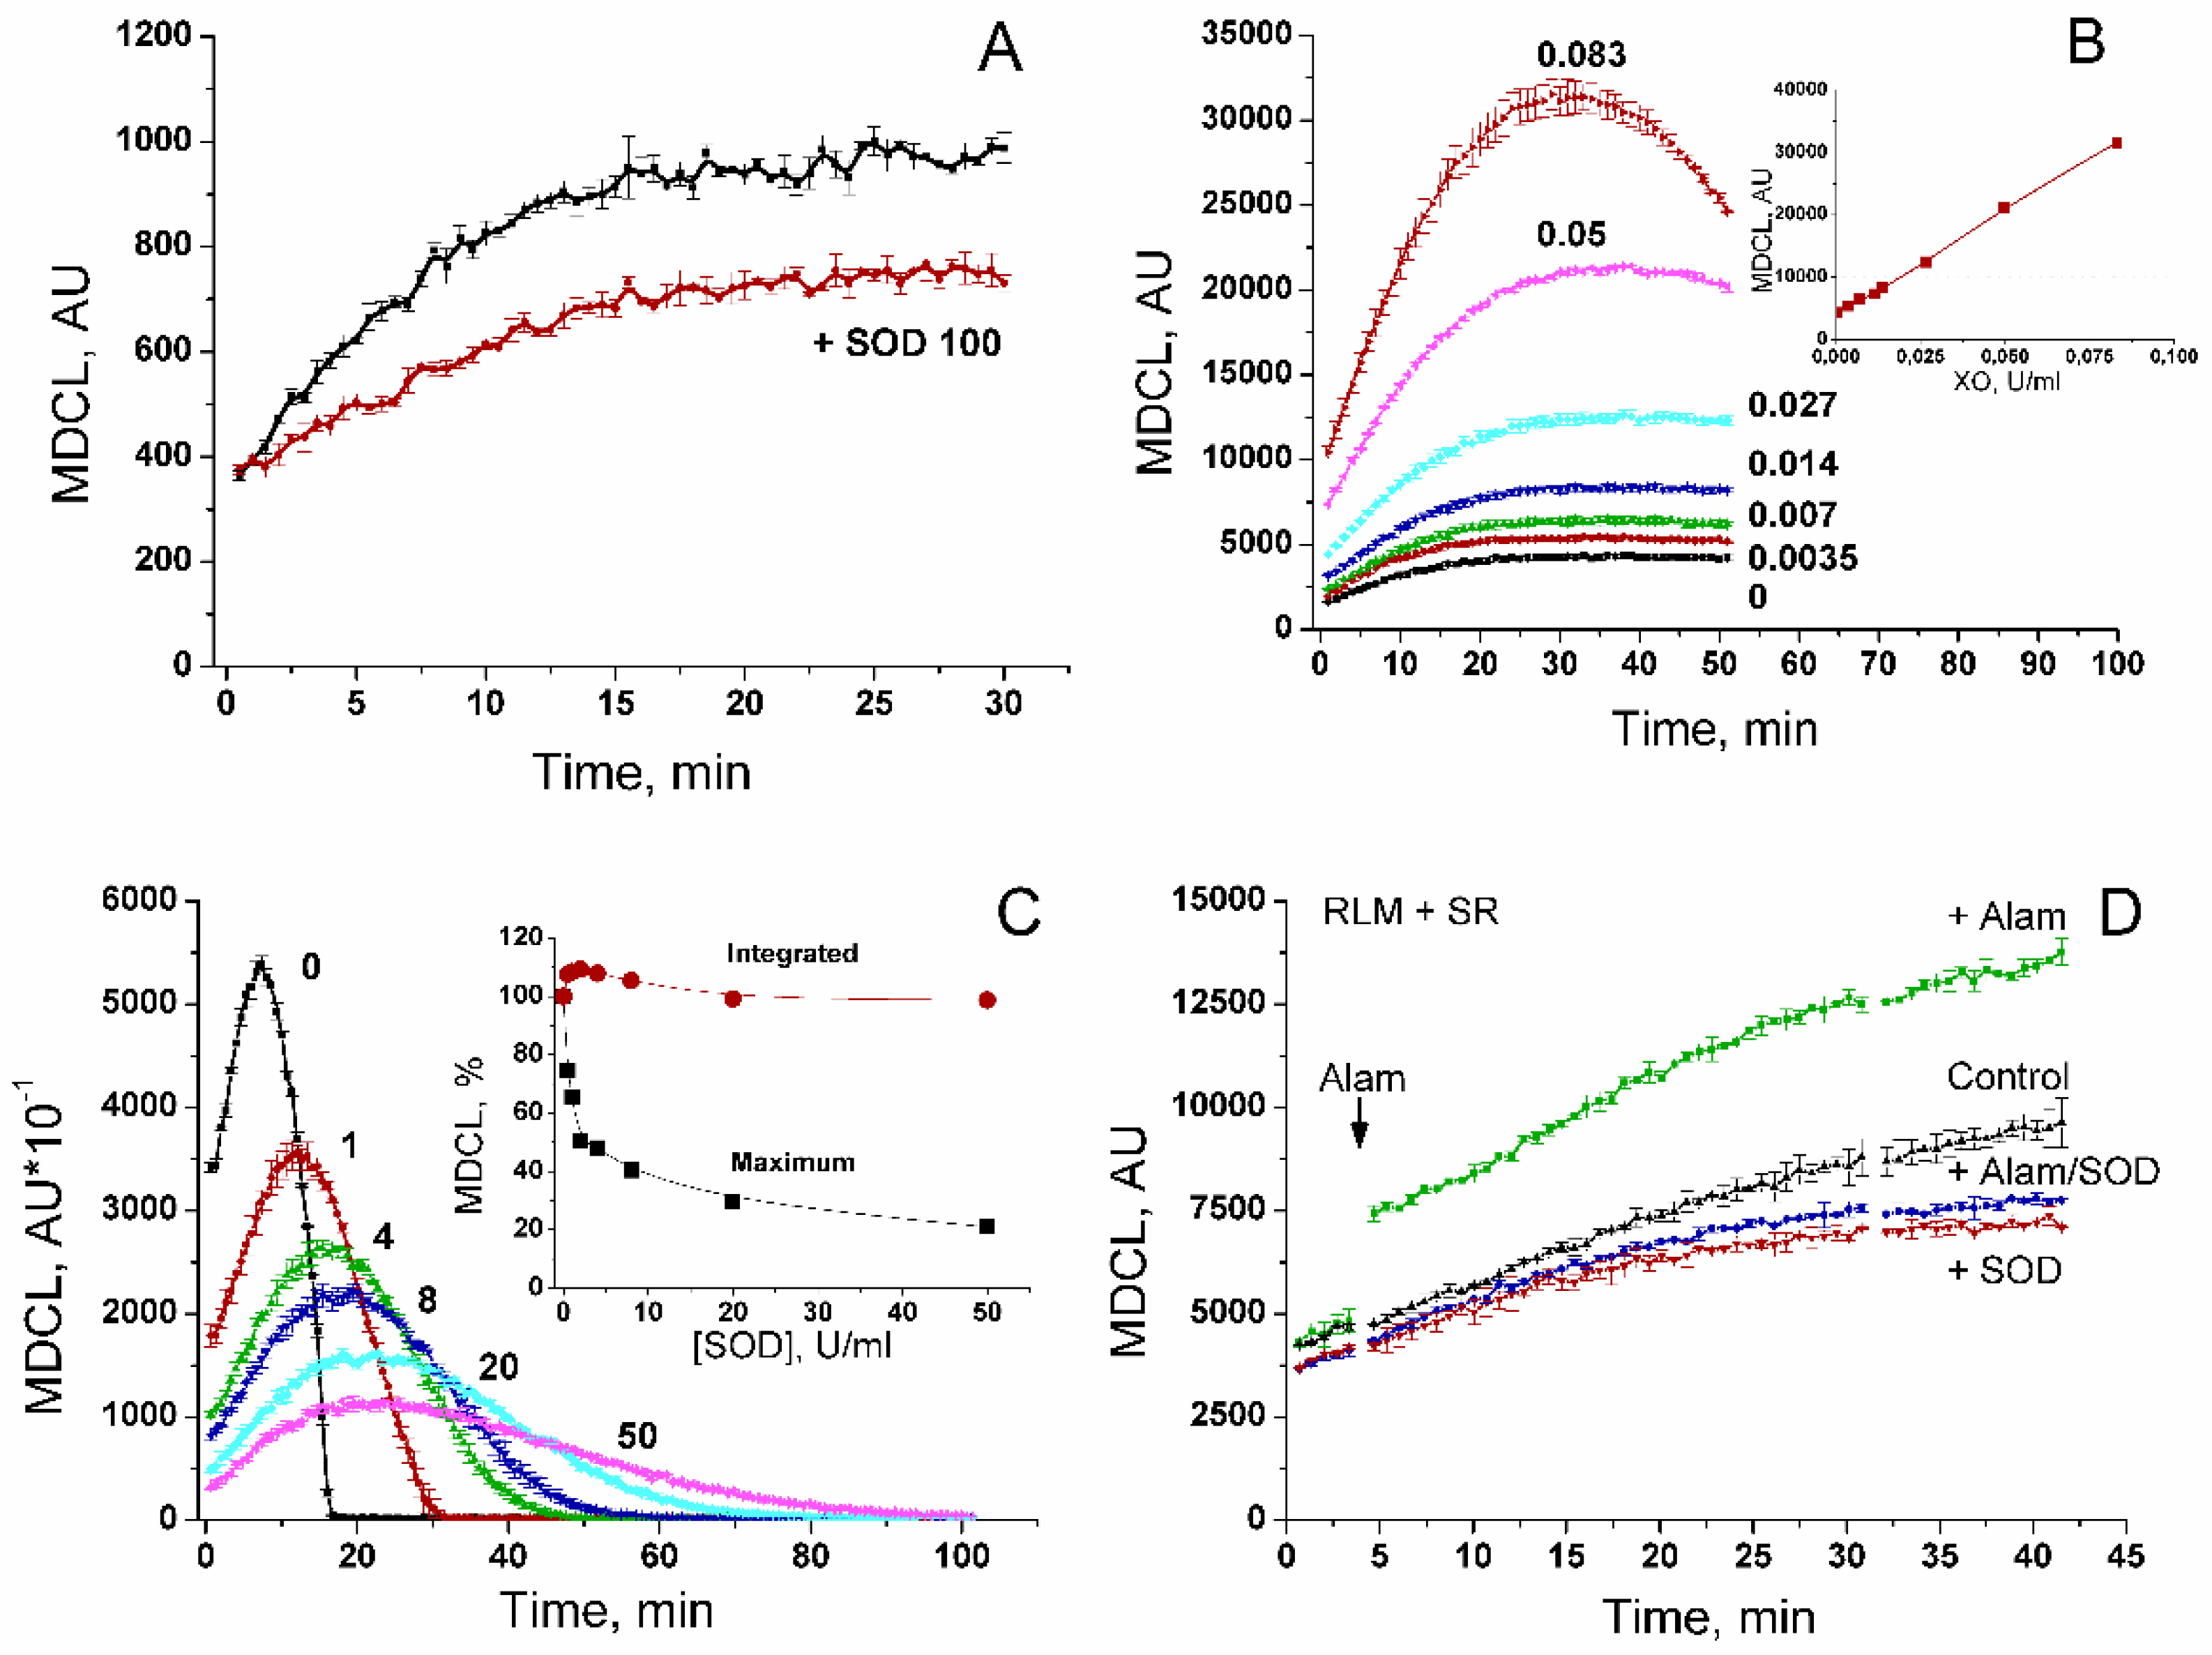
3.2. Composition of an MDCL Signal in a Mitochondrial Suspension
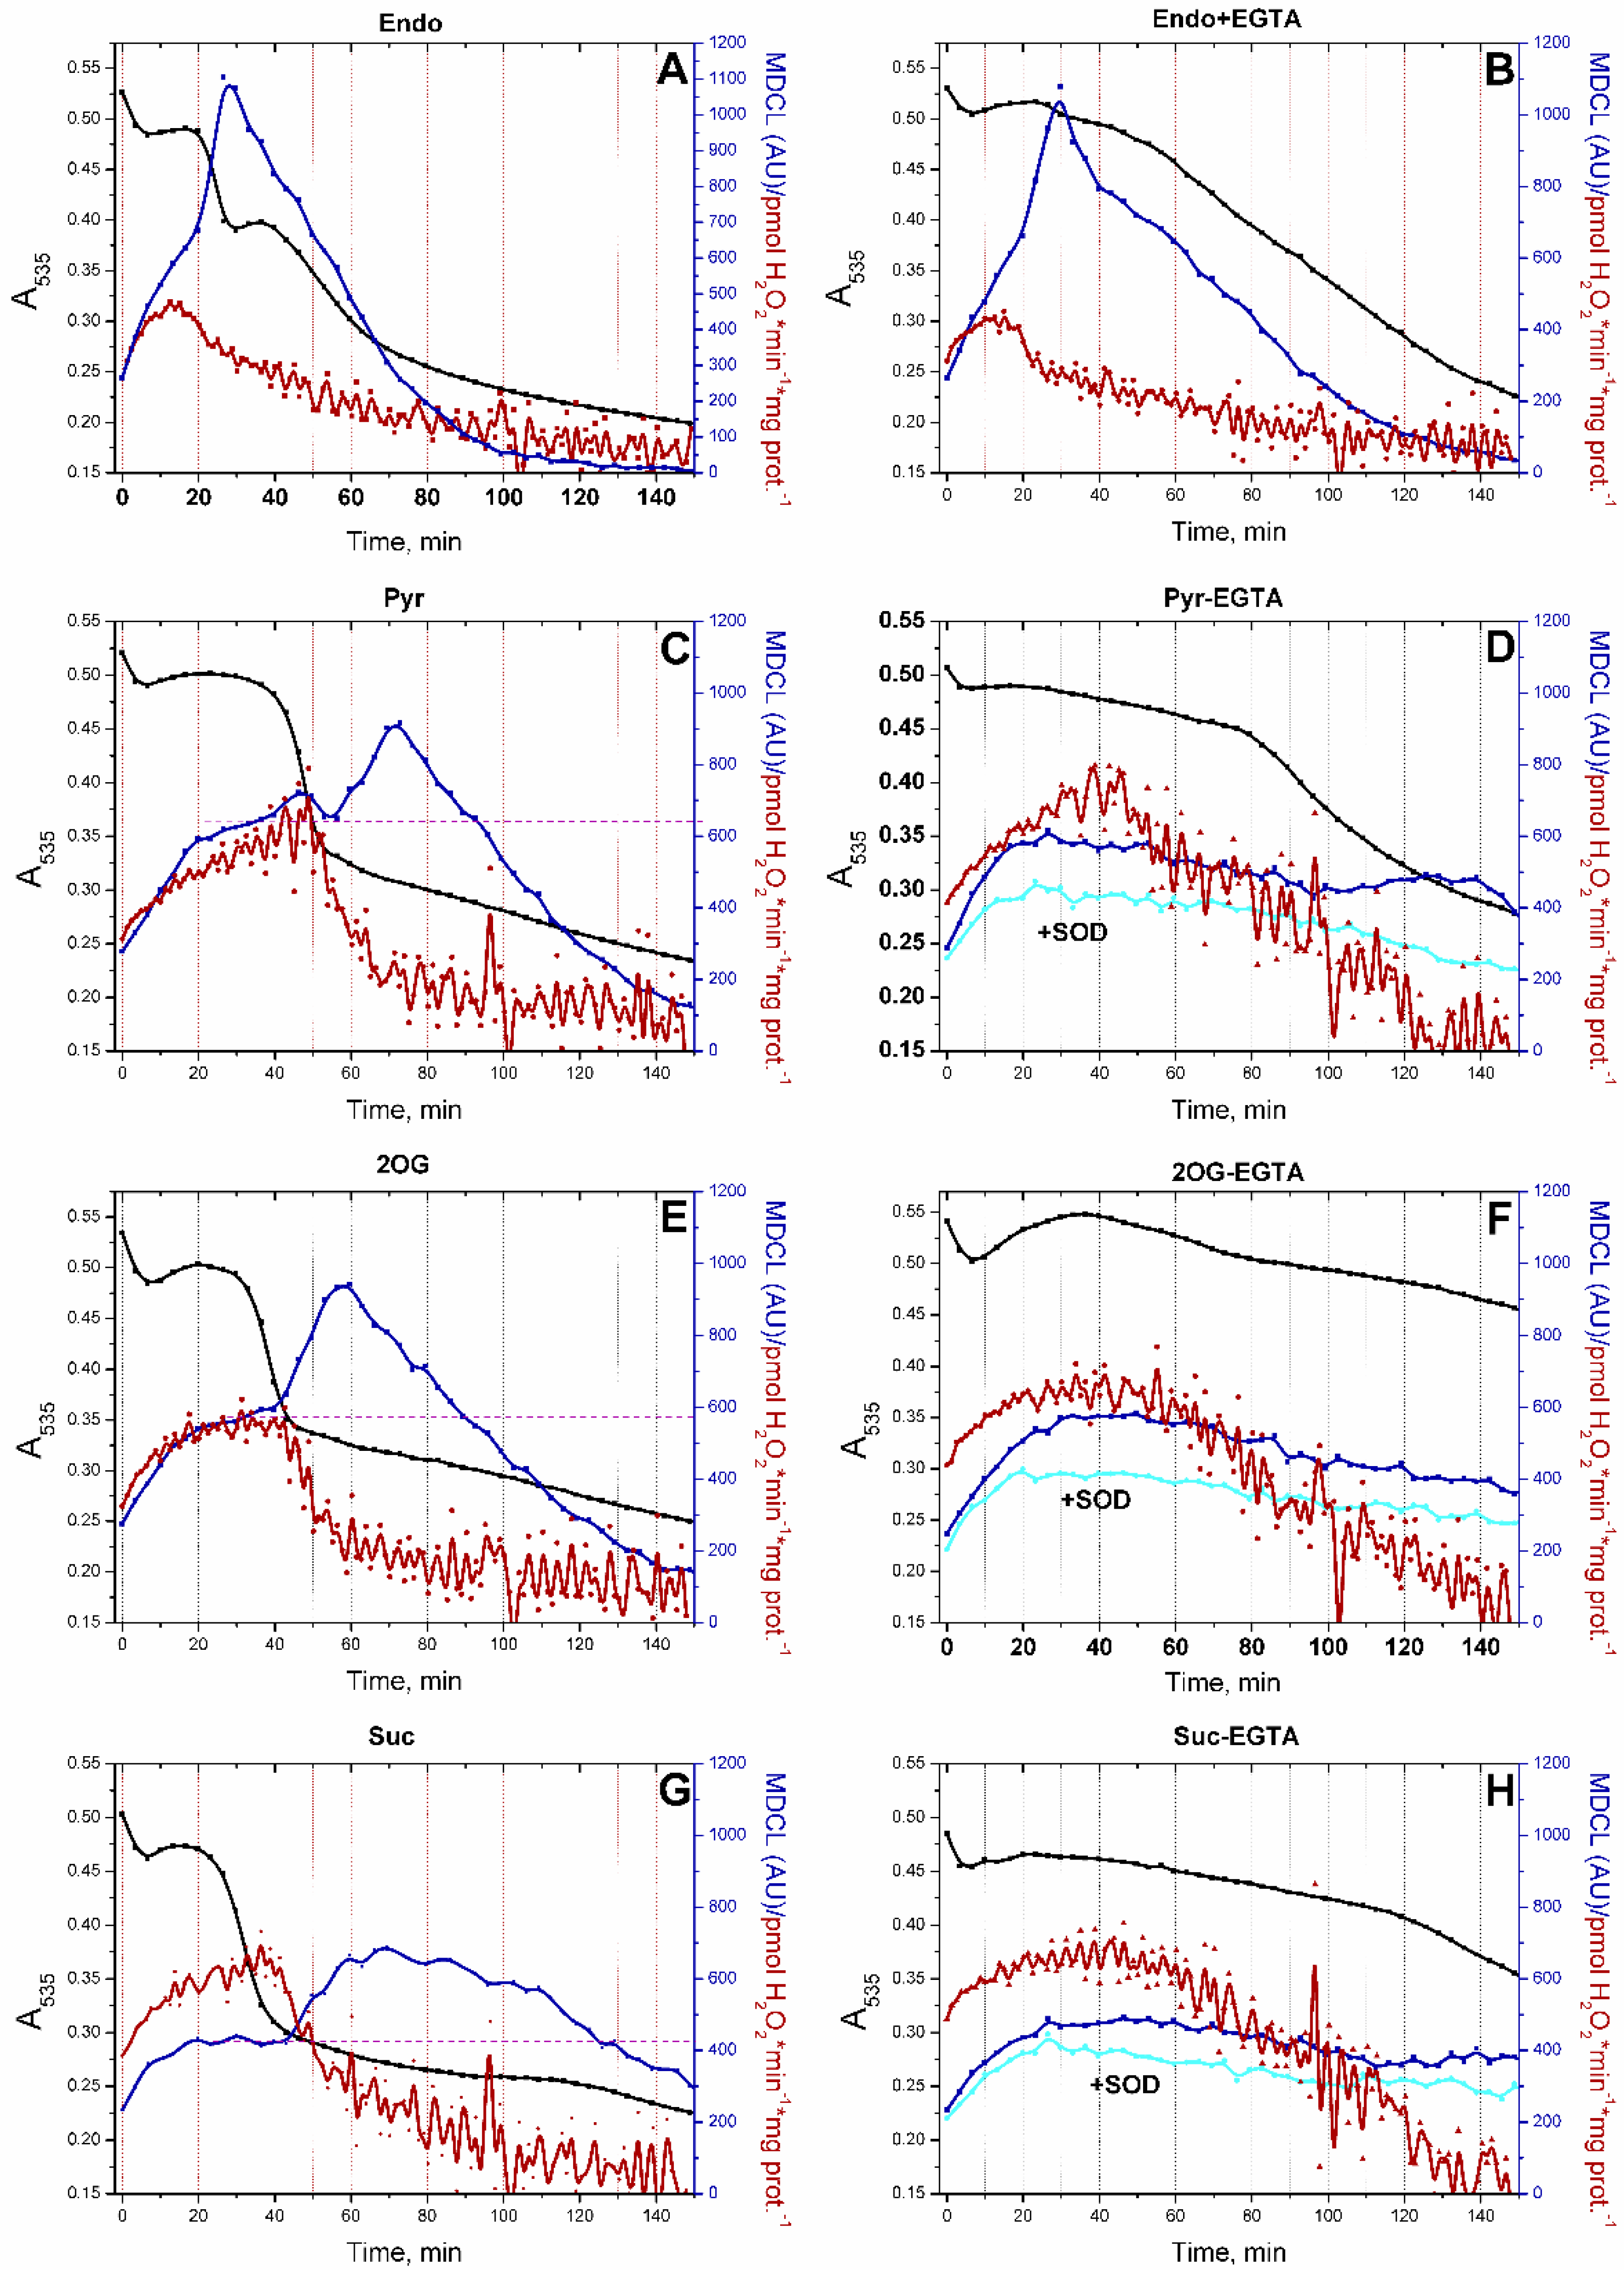
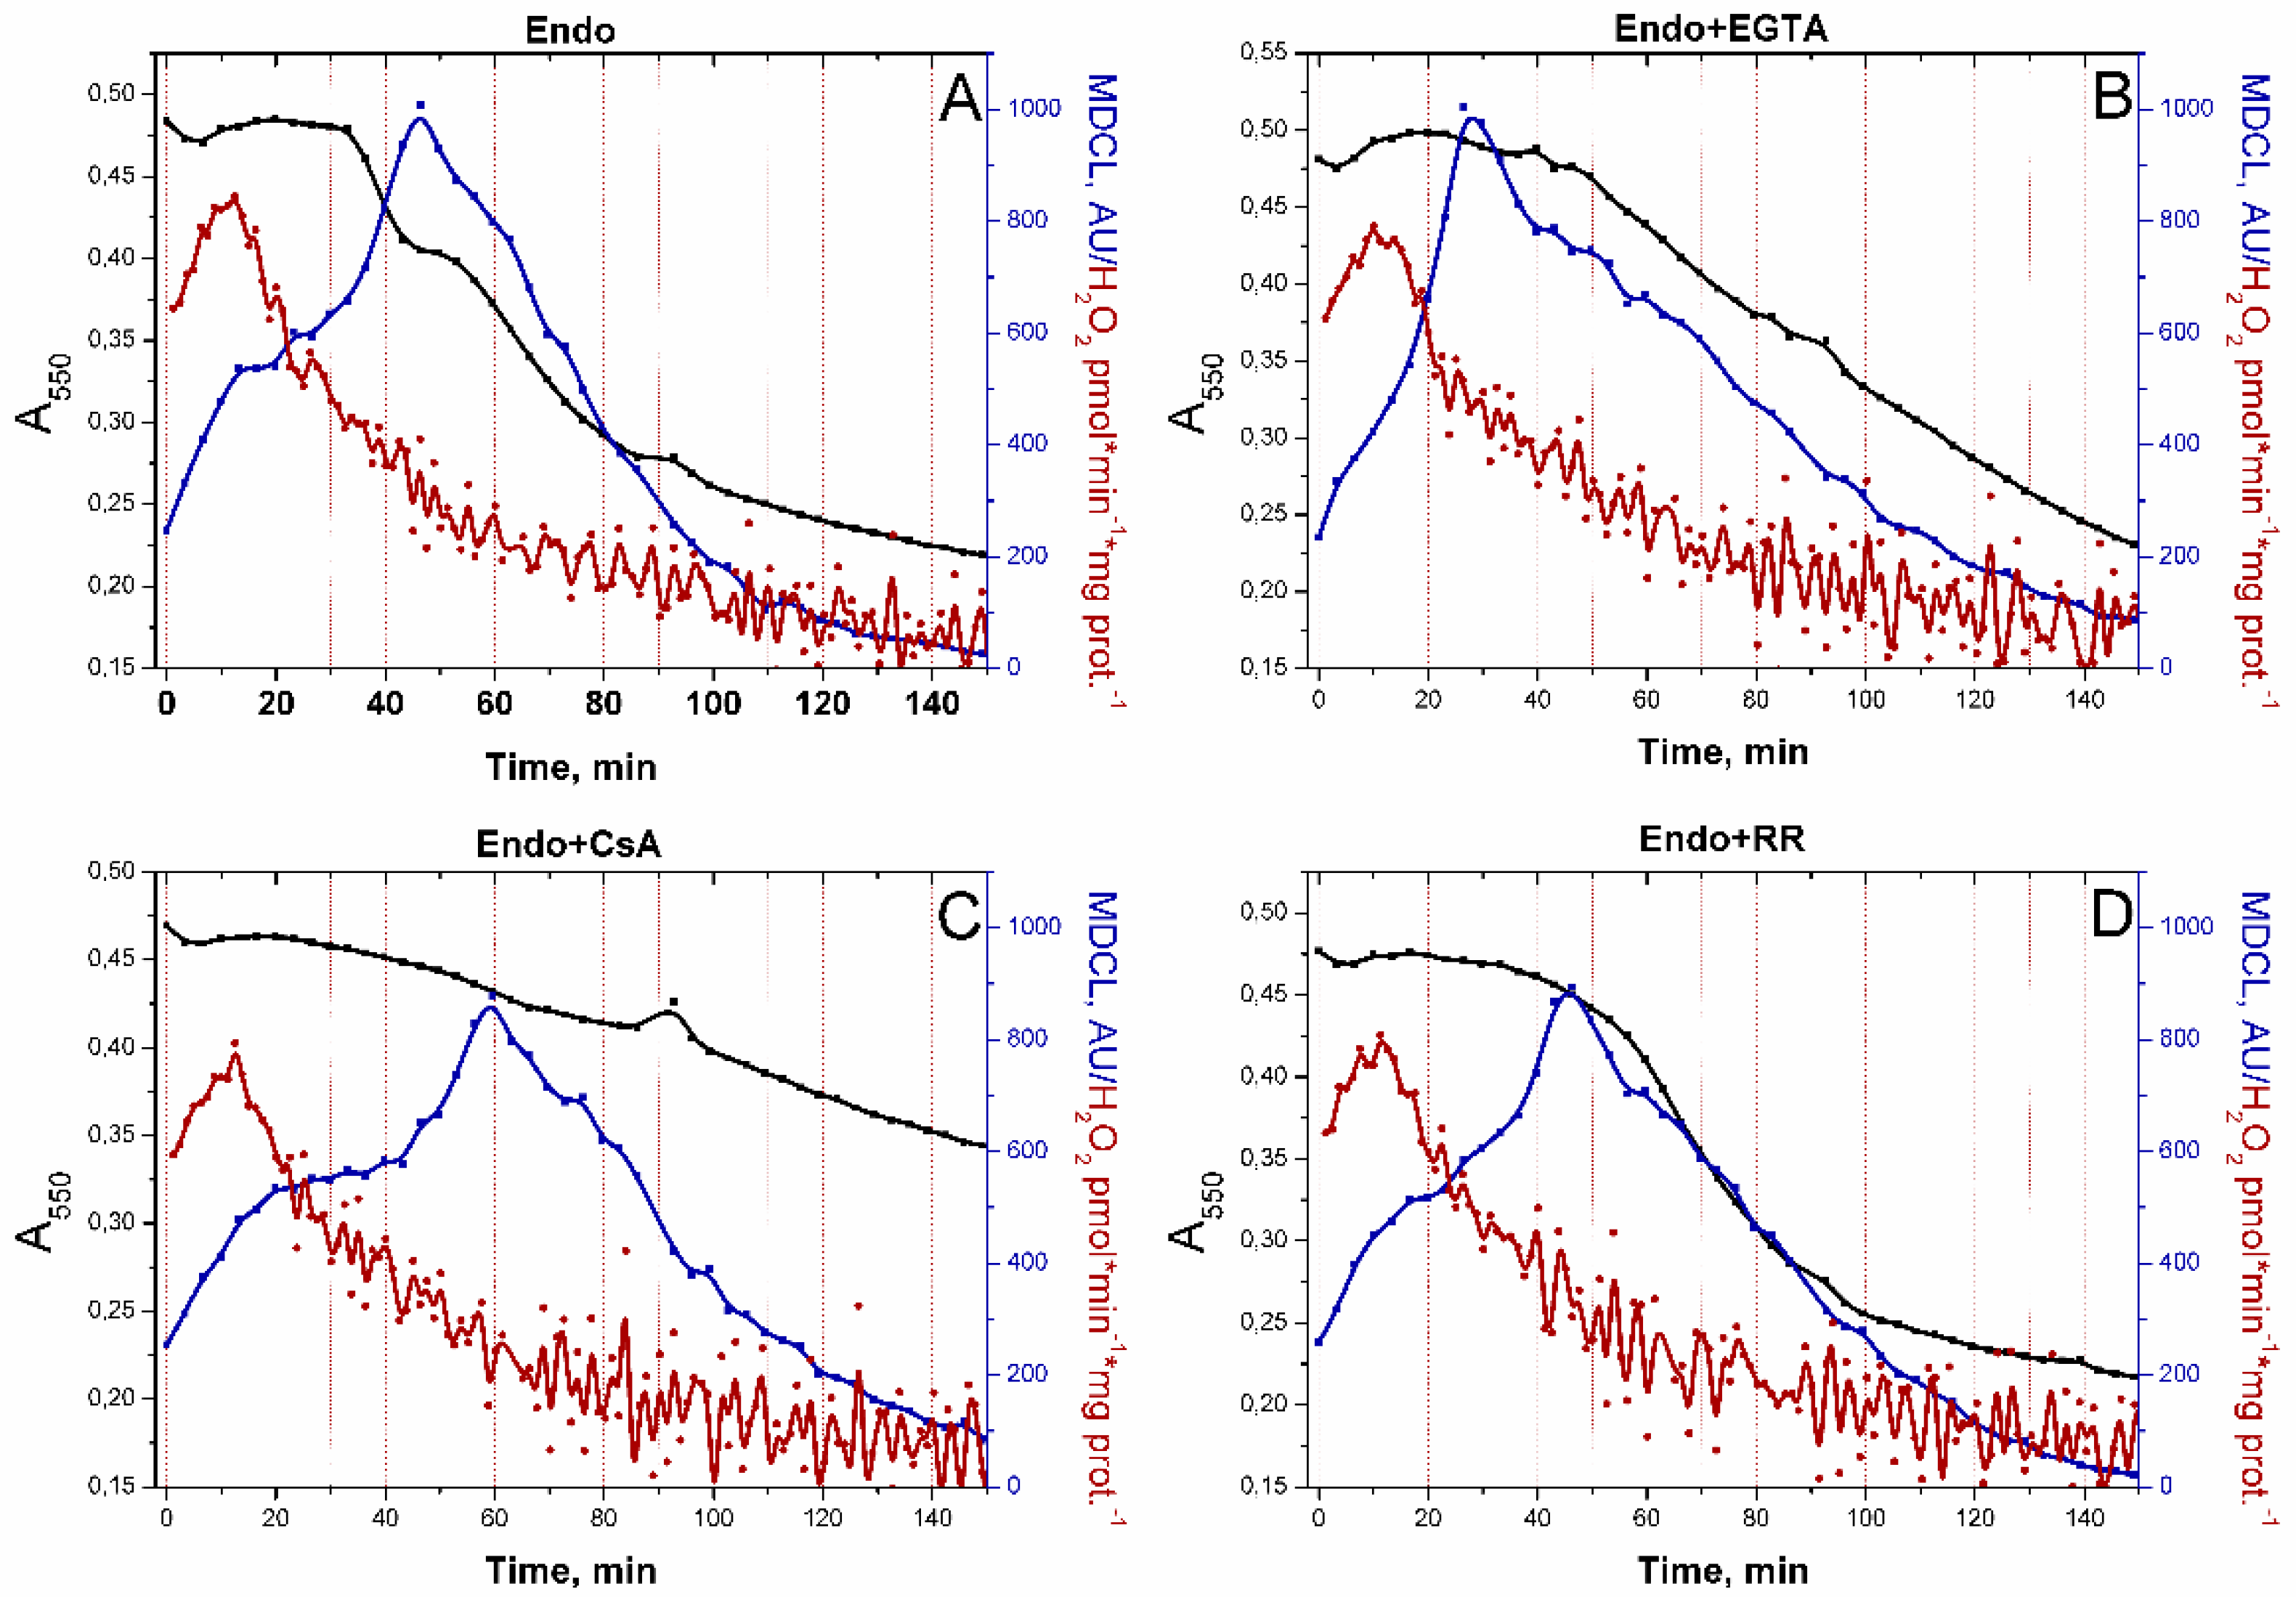
3.3. PTP Opening Switches the Type of a ROS Signal Emitted by Mitochondria
3.4. PTP Antagonists Do Not Prevent SA Flashes in the Absence of Added Substrates
3.5. Modulation of the Type of a ROS Signal by Different Respiratory Substrates
3.6. Effect of Respiratory Substrates on the Spontaneous and Xanthine Oxidase-Dependent Generation of SA
3.7. Effect of Adenine Nucleotides on the SA/H2O2 Release from RLM
4. Discussion
Supplementary Materials
Author Contributions
Funding
Institutional Review Board Statement
Informed Consent Statement
Data Availability Statement
Conflicts of Interest
References
- Forrester, S.J.; Kikuchi, D.S.; Hernandes, M.S.; Xu, Q.; Griendling, K.K. Reactive Oxygen Species in Metabolic and Inflammatory Signaling. Circ. Res. 2018, 122(6), 877–902. [Google Scholar] [CrossRef] [PubMed]
- Lennicke, C.; Cochemé, H.M. Redox metabolism: ROS as specific molecular regulators of cell signaling and function. Mol. Cell. 2021, 81(18), 3691–3707. [Google Scholar] [CrossRef] [PubMed]
- Sies, H.; Jones, D.P. Reactive oxygen species (ROS) as pleiotropic physiological signalling agents. Nat. Rev. Mol. Cell Biol. 2020, 7, 363–383. [Google Scholar] [CrossRef] [PubMed]
- Wu, R.; Li, S.; Hudlikar, R.; Wang, L.; Shannar, A.; Peter, R.; Chou, P.J.; Kuo, H.D.; Liu, Z.; Kong, A.N. Redox signaling, mitochondrial metabolism, epigenetics and redox active phytochemicals. Free Radic Biol. Med. 2022, 179, 328–336. [Google Scholar] [CrossRef] [PubMed]
- Held, J.M. Redox Systems Biology: Harnessing the Sentinels of the Cysteine Redoxome. Antioxid. Redox Signal. 2020, 32(10), 659–676. [Google Scholar] [CrossRef]
- Magnani, N.D.; Marchini, T.; Calabró, V.; Alvarez, S.; Evelson, P. Role of Mitochondria in the Redox Signaling Network and Its Outcomes in High Impact Inflammatory Syndromes. Front. Endocrinol. (Lausanne) 2020, 11, 568305. [Google Scholar] [CrossRef]
- Jomova, K.; Raptova, R.; Alomar, S.Y.; Alwasel, S.H.; Nepovimova, E.; Kuca, K.; Valko, M. Reactive oxygen species, toxicity, oxidative stress, and antioxidants: chronic diseases and aging. Arch. Toxicol. 2023, 97(10), 2499–2574. [Google Scholar] [CrossRef]
- Wang, W.; Gong, G.; Wang, X.; Wei-LaPierre, L.; Cheng, H.; Dirksen, R.; Sheu, S.S. Mitochondrial Flash: Integrative Reactive Oxygen Species and pH Signals in Cell and Organelle Biology. Antioxid. Redox Signal. 2016, 25(9), 534–549. [Google Scholar] [CrossRef]
- Sheu, S.S.; Wang, W.; Cheng, H.; Dirksen, R.T. Superoxide flashes: illuminating new insights into cardiac ischemia/ reperfusion injury. Future Cardiol. 2008, 4, 551–554. [Google Scholar] [CrossRef]
- Wang, W.; Fang, H.; Groom, L.; Cheng, A.; Zhang, W.; Liu, J.; Wang, X.; Li, K.; Han, P.; Zheng, M.; et al. Superoxide flashes in single mitochondria. Cell 2008, 134, 279–290. [Google Scholar] [CrossRef]
- Pouvreau, S. Superoxide flashes in mouse skeletal muscle are produced by discrete arrays of active mitochondria operating coherently. PLoS One 2010, 5, 13035. [Google Scholar] [CrossRef] [PubMed]
- Zhang, X.; Huang, Z.; Hou, T.; Xu, J.; Wang, Y.; Shang, W.; Ye, T.; Cheng, H.; Gao, F.; Wang, X. Superoxide constitutes a major signal of mitochondrial superoxide flash. Life Sci. 2013, 93, 178–186. [Google Scholar] [CrossRef] [PubMed]
- Wei-LaPierre, L.; Gong, G.; Gerstner, B.J.; Ducreux, S.; Yule, D.I.; Pouvreau, S.; Wang, X.; Sheu, S.S.; Cheng, H.; Dirksen, R.T.; et al. Respective contribution of mitochondrial superoxide and pH to mitochondria-targeted circularly permuted yellow fluorescent protein (mt-cpYFP) flash activity. J. Biol. Chem. 2013, 288, 10567–10577. [Google Scholar] [CrossRef] [PubMed]
- Wei, L.; Salahura, G.; Boncompagni, S.; Kasischke, K.A.; Protasi, F.; Sheu, S.S.; Dirksen, R.T. Mitochondrial superoxide flashes: metabolic biomarkers of skeletal muscle activity and disease. FASEB J. 2011, 25, 3068–3078. [Google Scholar] [CrossRef]
- Kuznetsov, A.V.; Javadov, S.; Saks, V.; Margreiter, R.; Grimm, M. Synchronism in mitochondrial ROS flashes, membrane depolarization and calcium sparks in human carcinoma cells. Biochim. Biophys. Acta Bioenerg. 2017, 1858(6), 418–431. [Google Scholar] [CrossRef]
- Zhou, L.; Aon, M.A.; Almas, T.; Cortassa, S.; Winslow, R.L.; O’Rourke, B. A reaction-diffusion model of ROS-induced ROS release in a mitochondrial network. PLoS Comput. Biol. 2010, 6(1), 1000657. [Google Scholar] [CrossRef]
- Hou, T.; Wang, X.; Ma, Q.; Cheng, H. Mitochondrial flashes: new insights into mitochondrial ROS signalling and beyond. J. Physiol. 2014, 592(17), 3703–3713. [Google Scholar] [CrossRef]
- Fang, H.; Chen, M.; Ding, Y.; Shang, W.; Xu, J.; Zhang, X.; Zhang, W.; Li, K.; Xiao, Y.; Gao, F.; et al. Imaging superoxide flash and metabolism-coupled mitochondrial permeability transition in living animals. Cell Res. 2011, 21(9), 1295–1304. [Google Scholar] [CrossRef]
- Mikkola, R.; Andersson, M.; Kharechkina, E.; Kruglova, S.; Kruglov, A. Fusaricidin-Type Compounds Create Pores in Mitochondrial and Plasma Membranes of Mammalian Cells. Biomolecules 2019, 9(9), 433. [Google Scholar] [CrossRef]
- Kharechkina, E.S.; Nikiforova, A.B.; Kruglov, A.G. Pyridine nucleotides regulate the superoxide anion flash upon permeabilization of mitochondrial membranes: An MCLA-based study. Free Radic Biol. Med. 2018, 124, 473–483. [Google Scholar] [CrossRef]
- Li, K.; Zhang, W.; Fang, H.; Xie, W.; Liu, J.; Zheng, M.; Wang, X.; Wang, W.; Tan, W.; Cheng, H. Superoxide flashes reveal novel properties of mitochondrial reactive oxygen species excitability in cardiomyocytes. Biophys. J. 2012, 102(5), 1011–1021. [Google Scholar] [CrossRef] [PubMed]
- Gong, G.; Liu, X.; Wang, W. Regulation of metabolism in individual mitochondria during excitation-contraction coupling. J. Mol. Cell Cardiol. 2014, 76, 235–246. [Google Scholar] [CrossRef] [PubMed]
- Hou, Y.; Ghosh, P.; Wan, R.; Ouyang, X.; Cheng, H.; Mattson, M.P.; Cheng, A. Permeability transition pore-mediated mitochondrial superoxide flashes mediate an early inhibitory effect of amyloid beta1-42 on neural progenitor cell proliferation. Neurobiol. Aging 2014, 35(5), 975–989. [Google Scholar] [CrossRef] [PubMed]
- Hou, Y.; Mattson, M.P.; Cheng, A. Permeability transition pore-mediated mitochondrial superoxide flashes regulate cortical neural progenitor differentiation. PLoS One 2013, 8(10), 76721. [Google Scholar] [CrossRef]
- Hou, Y.; Ouyang, X.; Wan, R.; Cheng, H.; Mattson, M.P.; Cheng, A. Mitochondrial superoxide production negatively regulates neural progenitor proliferation and cerebral cortical development. Stem Cells 2012, 30(11), 2535–2547. [Google Scholar] [CrossRef]
- Ying, Z.; Chen, K.; Zheng, L.; Wu, Y.; Li, L.; Wang, R.; Long, Q.; Yang, L.; Guo, J.; Yao, D.; et al. Transient activation of mitoflashes modulates nanog at the early phase of somatic cell reprogramming. Cell Metab. 2016, 23, 220–226. [Google Scholar] [CrossRef]
- Zhang, M.; Sun, T.; Jian, C.; Lei, L.; Han, P.; Lv, Q.; Yang, R.; Zhou, X.; Xu, J.; Hu, Y.; et al. Remodeling of Mitochondrial Flashes in Muscular Development and Dystrophy in Zebrafish. PLoS One 2016, 10(7), 0132567. [Google Scholar] [CrossRef]
- Xiao, Y.; Karam, C.; Yi, J.; Zhang, L.; Li, X.; Yoon, D.; Wang, H.; Dhakal, K.; Ramlow, P.; Yu, T.; et al. ROS-related mitochondrial dysfunction in skeletal muscle of an ALS mouse model during the disease progression. Pharmacol. Res. 2018, 138, 25–36. [Google Scholar] [CrossRef]
- Ma, Q.; Fang, H.; Shang, W.; Liu, L.; Xu, Z.; Ye, T.; Wang, X.; Zheng, M.; Chen, Q.; Cheng, H. Superoxide flashes: early mitochondrial signals for oxidative stress-induced apoptosis. J. Biol. Chem. 2011, 286(31), 27573–27581. [Google Scholar] [CrossRef]
- Shen, E.Z.; Song, C.Q.; Lin, Y.; Zhang, W.H.; Su, P.F.; Liu, W.Y.; Zhang, P.; Xu, J.; Lin, N.; Zhan, C.; et al. Mitoflash frequency in early adulthood predicts lifespan in Caenorhabditis elegans. Nature 2014, 508(7494), 128–132. [Google Scholar] [CrossRef]
- McBride, S.; Wei-LaPierre, L.; McMurray, F.; MacFarlane, M.; Qiu, X.; Patten, D.A.; Dirksen, R.T.; Harper, M.E. Skeletal muscle mitoflashes, pH, and the role of uncoupling protein-3. Arch. Biochem. Biophys. 2019, 663, 239–248. [Google Scholar] [CrossRef] [PubMed]
- Azarias, G.; Chatton, J.Y. Selective ion changes during spontaneous mitochondrial transients in intact astrocytes. PLoS One 2011, 6, 28505. [Google Scholar] [CrossRef] [PubMed]
- Schwarzlander, M.; Logan, D.C.; Fricker, M.D.; Sweetlove, L.J. The circularly permuted yellow fluorescent protein cpYFP that has been used as a superoxide probe is highly responsive to pH but not superoxide in mitochondria: implications for the existence of superoxide ‘flashes’. Biochem. J. 2011, 437, 381–387. [Google Scholar] [CrossRef] [PubMed]
- Schwarzlander, M.; Murphy, M.P.; Duchen, M.R.; Logan, D.C.; Fricker, M.D.; Halestrap, A.P.; Muller, F.L.; Rizzuto, R.; Dick, T.P.; Meyer, A.J.; et al. Mitochondrial ‘flashes’: a radical concept repHined. Trends Cell Biol. 2012, 22, 503–508. [Google Scholar] [CrossRef] [PubMed]
- Schwarzlander, M.; Wagner, S.; Ermakova, Y.G.; Belousov, V.V.; Radi, R.; Beckman, J.S.; Buettner, G.R.; Demaurex, N.; Duchen, M.R.; Forman, H.J.; et al. The ‘mitoflash’ probe cpYFP does not respond to superoxide. Nature 2014, 514, E12–E14. [Google Scholar] [CrossRef] [PubMed]
- Zielonka, J.; Kalyanaraman, B. Hydroethidine- and MitoSOX-derived red fluorescence is not a reliable indicator of intracellular superoxide formation: another inconvenient truth. Free Radic Biol. Med. 2010, 48(8), 983–1001. [Google Scholar] [CrossRef] [PubMed]
- Wei, L.; Dirksen, R.T. Perspectives on: SGP symposium on mitochondrial physiology and medicine: mitochondrial superoxide flashes: from discovery to new controversies. J. Gen. Physiol. 2012, 139(6), 425–434. [Google Scholar] [CrossRef]
- Wei-LaPierre, L.; Ainbinder, A.; Tylock, K.M.; Dirksen, R.T. Substrate-dependent and cyclophilin D-independent regulation of mitochondrial flashes in skeletal and cardiac muscle. Arch. Biochem. Biophys. 2019, 665, 122–131. [Google Scholar] [CrossRef]
- Rosselin, M.; Santo-Domingo, J.; Bermont, F.; Giacomello, M.; Demaurex, N. L-OPA1 regulates mitoflash biogenesis independently from membrane fusion. EMBO Rep. 2017, 18(3), 451–463. [Google Scholar] [CrossRef]
- Schwarzlander, M.; Logan, D.C.; Johnston, I.G.; Jones, N.S.; Meyer, A.J.; Fricker, M.D.; Sweetlove, L.J. Pulsing of membrane potential in individual mitochondria: a stressinduced mechanism to regulate respiratory bioenergetics in Arabidopsis. Plant Cell 2012, 24, 1188–1201. [Google Scholar] [CrossRef]
- Loschen, G.; Flohé, L.; Chance, B. Respiratory chain linked H2O2 production in pigeon heart mitochondria. FEBS Lett. 1971, 18, 261–264. [Google Scholar] [CrossRef] [PubMed]
- Korshunov, S.S.; Skulachev, V.P.; Starkov, A.A. High protonic potential actuates a mechanism of production of reactive oxygen species in mitochondria. FEBS Lett. 1997, 416, 15–18. [Google Scholar] [CrossRef] [PubMed]
- Kareyeva, A.V.; Grivennikova, V.G.; Vinogradov, A.D. Mitochondrial hydrogen peroxide production as determined by the pyridine nucleotide pool and its redox state. Biochim. Biophys. Acta 2012, 1817(10), 1879–1885. [Google Scholar] [CrossRef] [PubMed]
- Votyakova, T.V.; Reynolds, I.J. Detection of hydrogen peroxide with Amplex Red: interference by NADH and reduced glutathione auto-oxidation. Arch. Biochem. Biophys. 2004, 431(1), 138–144. [Google Scholar] [CrossRef] [PubMed]
- Johnson, D.; Lardy, H.A. Isolation of liver or kidney mitochondria. Methods Enzymol. 1967, 10, 94–96. [Google Scholar]
- Kharechkina, E.S.; Nikiforova, A.B.; Teplova, V.V.; Odinokova, I.V.; Krestinina, O.V.; Baburina, Y.L.; Kruglova, S.A.; Kruglov, A.G. Regulation of permeability transition pore opening in mitochondria by external NAD(H). Biochim. Biophys. Acta Gen. Subj. 2019, 1863(5), 771–783. [Google Scholar] [CrossRef]
- Gornall, A.G.; Bardawill, C.J.; David, M.M. Determination of serum proteins by means of the biuret reaction. J. Biol. Chem. 1949, 177, 751–766. [Google Scholar] [CrossRef]
- Towne, V.; Will, M.; Oswald, B.; Zhao, Q. Complexities in horseradish peroxidase-catalyzed oxidation of dihydroxyphenoxazine derivatives: Appropriate ranges for pH values and hydrogen peroxide concentrations in quantitative analysis. Analytical Biochemistry 2004, 334(2), 290–296. [Google Scholar] [CrossRef]
- Hirano, T.; Takahashi, Y.; Kondo, H.; Maki, S.; Kojima, S.; Ikeda, H.; Niwa, H. The reaction mechanism for the high quantum yield of Cypridina (Vargula) bioluminescence supported by the chemiluminescence of 6-aryl-2-methylimidazo [1,2-a]pyrazin-3(7H)-ones (Cypridina luciferin analogues). Photochem. Photobiol. Sci. 2008, 7(2), 197–207. [Google Scholar] [CrossRef]
- Suzuki, N.; Suetsuna, K.; Mashiko, S.; Yoda, B.; Nomoto, T.; Toya, Y. Reaction rates for the chemiluminescence of Cypridina luciferin analogs with superoxide: a quenching experiment with superoxide dismutase. Agric. Biol. Chem. 1991, 55(1), 157–160. [Google Scholar] [CrossRef]
- Forman, H.J.; Fridovich, I. Superoxide dismutase: a comparison of rate constants. Arch. Biochem. Biophys. 1973, 158(1), 396–400. [Google Scholar] [CrossRef] [PubMed]
- Yamaguchi, S.; Kishikawa, N.; Ohyama, K.; Ohba, Y.; Kohno, M.; Masuda, T.; Takadate, A.; Nakashima, K.; Kuroda, N. Evaluation of chemiluminescence reagents for selective detection of reactive oxygen species. Anal. Chim. Acta 2010, 665(1), 74–78. [Google Scholar] [CrossRef] [PubMed]
- Teranishi, K.; Hisamatsu, M.; Yamada, T. Chemiluminescence of 2-methyl-6-arylimidazo-[1,2-a]pyrazin-3(7H)-one in protic solvents: electron-donating substituent effect on the formation of the neutral singlet excited-state molecule. Luminescence 1999, 14(6), 297–302. [Google Scholar] [CrossRef]
- Kambayashi, Y.; Ogino, K. Reestimation of Cypridina luciferin analogs (MCLA) as a chemiluminescence probe to detect active oxygen species--cautionary note for use of MCLA. J. Toxicol. Sci. 2003, 28(3), 139–148. [Google Scholar] [CrossRef] [PubMed]
- Kruglov, A.G.; Nikiforova, A.B.; Shatalin, Y.V.; Shubina, V.V.; Fisyuk, A.S.; Akatov, V.S. Sulfur-containing compounds quench 3,7-dihydro-2-methyl-6-(4-methoxyphenyl)imidazol [1,2-a]pyrazine-3-one chemiluminescence: Discrimination between true antioxidants and quenchers using xanthine oxidase. Anal. Biochem. 2010, 406(2), 230–232. [Google Scholar] [CrossRef]
- Yin, F.; Sancheti, H.; Cadenas, E. Mitochondrial thiols in the regulation of cell death pathways. Antioxid. Redox Signal. 2012, 17(12), 1714–1727. [Google Scholar] [CrossRef]
- Gus’kova, R.A.; Ivanov, I.I.; Kol’tover, V.K.; Akhobadze, V.V.; Rubin, A.B. Permeability of bilayer lipid membranes for superoxide (O2-.) radicals. Biochim. Biophys. Acta 1984, 778(3), 579–585. [Google Scholar] [CrossRef]
- Cordeiro, R.M. Reactive oxygen species at phospholipid bilayers: distribution, mobility and permeation. Biochim. Biophys. Acta 2014, 1838 1 Pt B, 438–444. [Google Scholar] [CrossRef]
- Lustgarten, M.S.; Bhattacharya, A.; Muller, F.L.; Jang, Y.C.; Shimizu, T.; Shirasawa, T.; Richardson, A.; Van Remmen, H. Complex I generated, mitochondrial matrix-directed superoxide is released from the mitochondria through voltage dependent anion channels. Biochem. Biophys. Res. Commun. 2012, 422(3), 515–521. [Google Scholar] [CrossRef]
- Lançar-Benba, J.; Foucher, B.; Saint-Macary, M. Characterization, purification and properties of the yeast mitochondrial dicarboxylate carrier (Saccharomyces cerevisiae). Biochimie 1996, 78(3), 195–200. [Google Scholar] [CrossRef]
- Dierks, T.; Stappen, R.; Salentin, A.; Krämer, R. Probing the active site of the reconstituted aspartate/glutamate carrier from bovine heart mitochondria: carbodiimide-catalyzed acylation of a functional lysine residue. Biochim. Biophys. Acta 1992, 1103(1), 13–24. [Google Scholar] [CrossRef] [PubMed]
- Kruglov, A.G.; Teplova, V.V.; Saris, N.E. The effect of the lipophilic cation lucigenin on mitochondria depends on the site of its reduction. Biochem. Pharmacol. 2007, 74(4), 545–556. [Google Scholar] [CrossRef] [PubMed]
- Kruglov, A.G.; Subbotina, K.B.; Saris, N.E. Redox-cycling compounds can cause the permeabilization of mitochondrial membranes by mechanisms other than ROS production. Free Radic Biol. Med. 2008, 44(4), 646–656. [Google Scholar] [CrossRef] [PubMed]
- Nikiforova, A.B.; Saris, N.E.; Kruglov, A.G. External mitochondrial NADH-dependent reductase of redox cyclers: VDAC1 or Cyb5R3? Free Radic Biol. Med. 2014, 74, 74–84. [Google Scholar] [CrossRef] [PubMed]
- Oosthuizen, M.M.; Engelbrecht, M.E.; Lambrechts, H.; Greyling, D.; Levy, R.D. The effect of pH on chemiluminescence of different probes exposed to superoxide and singlet oxygen generators. J. Biolumin. Chemilumin. 1997, 12(6), 277–284. [Google Scholar] [CrossRef]
- Kruglov, A.G.; Yurkov, I.S.; Teplova, V.V.; Evtodienko, Y.V. Lucigenin-derived chemiluminescence in intact isolated mitochondria. Biochemistry (Moscow) 2002, 67(11), 1262–1270. [Google Scholar] [CrossRef]
- Budd, S.L.; Castilho, R.F.; Nicholls, D.G. Mitochondrial membrane potential and hydroethidine-monitored superoxide generation in cultured cerebellar granule cells. FEBS Lett. 1997, 415(1), 21–24. [Google Scholar] [CrossRef]
- Grivennikova, V.G.; Vinogradov, A.D. Generation of superoxide by the mitochondrial Complex I. Biochim. Biophys. Acta 2006, 1757(5-6), 553–561. [Google Scholar] [CrossRef]
- Grivennikova, V.G.; Vinogradov, A.D. Partitioning of superoxide and hydrogen peroxide production by mitochondrial respiratory complex I. Biochim. Biophys. Acta 2013, 1827(3), 446–454. [Google Scholar] [CrossRef]
- Bleier, L.; Dröse, S. Superoxide generation by complex III: from mechanistic rationales to functional consequences. Biochim. Biophys. Acta 2013, 1827(11-12), 1320–1331. [Google Scholar] [CrossRef]
- Speijer, D. Can All Major ROS Forming Sites of the Respiratory Chain Be Activated By High FADH2/NADH Ratios?: Ancient evolutionary constraints determine mitochondrial ROS formation. Bioessays 2019, 41(1), 1800180. [Google Scholar] [CrossRef] [PubMed]
- Tretter, L.; Takacs, K.; Hegedus, V.; Adam-Vizi, V. Characteristics of alpha-glycerophosphate-evoked H2O2 generation in brain mitochondria. J. Neurochem. 2007, 100(3), 650–663. [Google Scholar] [CrossRef] [PubMed]
- Koufos, O.; Mailloux, R.J. Protein S-glutathionylation and sex dimorphic effects on hydrogen peroxide production by dihydroorotate dehydrogenase in liver mitochondria. Free Radic Biol. Med. 2023, 194, 123–130. [Google Scholar] [CrossRef] [PubMed]
- Henriques, B.J.; Katrine, J.; Olsen, R.; Gomes, C.M.; Bross, P. Electron transfer flavoprotein and its role in mitochondrial energy metabolism in health and disease. Gene 2021, 776, 145407. [Google Scholar] [CrossRef]
- Loschen, G.; Azzi, A.; Richter, C.; Flohé, L. Superoxide radicals as precursors of mitochondrial hydrogen peroxide. FEBS Lett。 1974, 42(1), 68–72. [Google Scholar] [CrossRef]
- Dionisi, O.; Galeotti, T.; Terranova, T.; Azzi, A. Superoxide radicals and hydrogen peroxide formation in mitochondria from normal and neoplastic tissues. Biochim. Biophys. Acta 1975, 403(2), 292–300. [Google Scholar] [CrossRef]
- Boveris, A. Mitochondrial production of superoxide radical and hydrogen peroxide. Adv Exp Med Biol 1977, 78, 67–82. [Google Scholar] [CrossRef]
- Arce-Molina, R.; Cortés-Molina, F.; Sandoval, P.Y.; Galaz, A.; Alegría, K.; Schirmeier, S.; Barros, L.F.; San Martín, A. A highly responsive pyruvate sensor reveals pathway-regulatory role of the mitochondrial pyruvate carrier MPC. Elife 2020, 9, 53917. [Google Scholar] [CrossRef]
- Stern, A.; Fokra, M.; Sarvin, B.; Alrahem, A.A.; Lee, W.D.; Aizenshtein, E.; Sarvin, N.; Shlomi, T. Inferring mitochondrial and cytosolic metabolism by coupling isotope tracing and deconvolution. Nat. Commun. 2023, 14(1), 7525. [Google Scholar] [CrossRef]
- Sazanov, L.A. A giant molecular proton pump: structure and mechanism of respiratory complex I. Nat. Rev. Mol. Cell Biol. 2015, 16(6), 375–388. [Google Scholar] [CrossRef]
- Sazanov, L.A.; Hinchliffe, P. Structure of the hydrophilic domain of respiratory complex I from Thermus thermophilus. Science 2006, 311, 1430–1436. [Google Scholar] [PubMed]
- Vasquez-Vivar, J.; Kalyanaraman, B.; Kennedy, M.C. Mitochondrial aconitase is a source of hydroxyl radical. An electron spin resonance investigation. J. Biol. Chem. 2000, 275(19), 14064–14069. [Google Scholar] [CrossRef] [PubMed]
- Sadek, H.A.; Szweda, P.A.; Szweda, L.I. Modulation of mitochondrial complex I activity by reversible Ca2+ and NADH mediated superoxide anion dependent inhibition. Biochemistry 2004, 43(26), 8494–8502. [Google Scholar] [CrossRef] [PubMed]
- Wong, H.S.; Mezera, V.; Dighe, P.; Melov, S.; Gerencser, A.A.; Sweis, R.F.; Pliushchev, M.; Wang, Z.; Esbenshade, T.; McKibben, B.; et al. Superoxide produced by mitochondrial site IQ inactivates cardiac succinate dehydrogenase and induces hepatic steatosis in Sod2 knockout mice. Free Radic Biol. Med. 2021, 164, 223–232. [Google Scholar] [CrossRef]
- Sawyer, D.T.; Joan, S. Valentine How super is superoxide? Accounts of Chemical Research 1981, 14(12), 393–400. [Google Scholar] [CrossRef]
- Wardman, P. Molecular mechanisms of oxygen and “electron-affinic” radiosensitizers. Int. J. Radiat. Oncol. Biol. Phys. 1989, 16(1), 286–288. [Google Scholar] [CrossRef]
- Benon Bielski, H.J.; Diane, E.C.; Ravindra, L.A.; Alberta, B.R. Reactivity of HO2/O−2 Radicals in Aqueous Solution. J. Phys. Chem. Ref. Data 1985, 14(4), 1041–1100. [Google Scholar] [CrossRef]
- Koppenol, W.H.; Stanbury, D.M.; Bounds, P.L. Electrode potentials of partially reduced oxygen species, from dioxygen to water. Free Radic Biol. Med. 2010, 49(3), 317–322. [Google Scholar] [CrossRef]
- Wood, P.M. The potential diagram for oxygen at pH 7. Biochem. J. 1988, 253(1), 287–289. [Google Scholar] [CrossRef]
- Bindoli, A.; Fukuto, J.M.; Forman, H.J. Thiol chemistry in peroxidase catalysis and redox signaling. Antioxid. Redox Signal. 2008, 10(9), 1549–1564. [Google Scholar] [CrossRef]
- Zelko, I.N.; Mariani, T.J.; Folz, R.J. Superoxide dismutase multigene family: a comparison of the CuZn-SOD (SOD1), Mn-SOD (SOD2), and EC-SOD (SOD3) gene structures, evolution, and expression. Free Radic Biol. Med. 2002, 33(3), 337–349. [Google Scholar] [CrossRef] [PubMed]
- Brigelius-Flohé, R.; Maiorino, M. Glutathione peroxidases. Biochim. Biophys. Acta 2013, 1830, 3289–3303. [Google Scholar] [CrossRef] [PubMed]
- Veal, E.A.; Underwood, Z.E.; Tomalin, L.E.; Morgan, B.A.; Pillay, C.S. Hyperoxidation of Peroxiredoxins: Gain or Loss of Function? Antioxid. Redox Signal. 2018, 28(7), 574–590. [Google Scholar] [CrossRef] [PubMed]
- Glorieux, C.; Calderon, P.B. Catalase, a remarkable enzyme: targeting the oldest antioxidant enzyme to find a new cancer treatment approach. Biol. Chem. 2017, 398(10), 1095–1108. [Google Scholar] [CrossRef] [PubMed]
- Zorov, D.B.; Filburn, C.R.; Klotz, L.O.; Zweier, J.L.; Sollott, S.J. Reactive oxygen species (ROS)-induced ROS release: a new phenomenon accompanying induction of the mitochondrial permeability transition in cardiac myocytes. J. Exp. Med 2000, 192, 1001–1014. [Google Scholar] [CrossRef] [PubMed]
- Sies, H. Strategies of antioxidant defense. Eur. J. Biochem. 1993, 215(2), 213–219. [Google Scholar] [CrossRef] [PubMed]
- Zini, R.; Berdeaux, A.; Morin, D. The differential effects of superoxide anion, hydrogen peroxide and hydroxyl radical on cardiac mitochondrial oxidative phosphorylation. Free Radic. Res. 2007, 41(10), 1159–1166. [Google Scholar] [CrossRef]
- Ježek, P.; Jabůrek, M.; Holendová, B.; Engstová, H.; Dlasková, A. Mitochondrial Cristae Morphology Reflecting Metabolism, Superoxide Formation, Redox Homeostasis, and Pathology. Antioxid. Redox Signal. 2023, 39(10-12), 635–683. [Google Scholar] [CrossRef]
- Thorpe, G.W.; Reodica, M.; Davies, M.J.; Heeren, G.; Jarolim, S.; Pillay, B.; Breitenbach, M.; Higgins, V.J.; Dawes, I.W. Superoxide radicals have a protective role during H2O2 stress. Mol. Biol. Cell 2013, 24(18), 2876–2884. [Google Scholar] [CrossRef]
- Hao, S.; Cai, D.; Gou, S.; Li, Y.; Liu, L.; Tang, X.; Chen, Y.; Zhao, Y.; Shen, J.; Wu, X.; et al. Does each Component of Reactive Oxygen Species have a Dual Role in the Tumor Microenvironment? Curr Med Chem. 2023. [Google Scholar] [CrossRef]
Disclaimer/Publisher’s Note: The statements, opinions and data contained in all publications are solely those of the individual author(s) and contributor(s) and not of MDPI and/or the editor(s). MDPI and/or the editor(s) disclaim responsibility for any injury to people or property resulting from any ideas, methods, instructions or products referred to in the content. |
© 2024 by the authors. Licensee MDPI, Basel, Switzerland. This article is an open access article distributed under the terms and conditions of the Creative Commons Attribution (CC BY) license (http://creativecommons.org/licenses/by/4.0/).


