Preprint
Article

Modeling and Simulation of Fatigue Crack Initiation Process Based on Field Theory of Multiscale Plasticity (FTMP) Part I: PSB Ladder Formation and Verification

Altmetrics

Downloads

55

Views

41

Comments

0

A peer-reviewed article of this preprint also exists.

This version is not peer-reviewed

Submitted:

01 October 2024

Posted:

02 October 2024

You are already at the latest version

Alerts
Abstract
In this study, we successfully reproduced the PSB with laddered patterning, showcasing the predictive capability of the framework of Field Theory of Multiscale Plasticity (FTMP), without relying on ad hoc models, intricate mathematical models, or elaborate finite element discretization. The FTMP-incorporated CP-FEM simulation not only reasonably replicates the experimentally observed laddered morphology and PSB but also effectively simulates surface roughening and grooving, independent of vacancy formation and diffusion. These results highlight the significance of laddered morphology and set the stage for further investigations into the effects of vacancy formation in future studies in Part II. Leveraging incompatibility tensor-based degrees of freedom, the FTMP framework offers exceptional capabilities for natural modeling dislocation substructures typically overlooked in conventional approaches, positioning it as a transformative tool for advancing our understanding of the mechanism that dictate slip band-fatigue crack transitions.
Keywords: 
Subject: Engineering  -   Mechanical Engineering

1. Introduction

Research into metal fatigue has a long-standing history, with significant contributions dating back over half a century. Early investigations by Thompson et al. [1] revealed that fatigue cracks initiate within slip bands of a single grain, highlighting the critical role of microscopic dislocation structures in fatigue crack formation. Building on this foundation, Woods et al. [2] emphasized the presence of persistent slip bands (PSBs), characterized by uniformly arranged dislocation walls, often referred to as ladder walls. Polák et al. [3,4,5,6] further explored the relationship between these dislocation substructures and the resultant surface morphology. Essmann et al. [7,8] conducted extensive studies on irreversible deformation associated with the ladder structure of PSBs and its influence on crack initiation at the PSB-matrix interface. They examined the crucial role of vacancies commonly found in fatigued metals, [9,10] including their agglomeration into crack nucleation sites. Subsequent studies along similar lines have continued to advance our understanding of the relationship between PSB ladder structures and the processes of fatigue crack initiation, an inquiry that remains ongoing.
The significance of deformation-induced patterning in plasticity is paramount for understanding the multiscale nature of material mechanics. This importance arises from the dynamic changes in dislocation substructures influenced by long-range stress fields and misorientation, particularly in materials that yield dislocation structures with cellular morphology [11,12]. These dislocation patterns play a crucial role in the storage and release of elastic strain energy, influencing not only the deformation capacity but also the strength and toughness of materials. A notable exception is the ladder structure observed in PSBs, which predominantly facilitates deformation during cyclic loading and typically does not produce long-range stress field due to its composition of edge dislocation dipoles [13]. This PSB ladder structure significantly impacts the mechanisms of fatigue crack initiation, as described above [14,15,16,17,18]. However, the underlying reasons for this patterning and its critical roles remain undefined, partly due to limitations in conventional approaches to plasticity.
While analogy-based methods, such as reaction-diffusion equations grounded in the concept of dissipative structures, can address patterning-related issues, they often provide limited insights beyond mere analogy [19,20]. These methods do not elucidate the mechanisms involved in crack initiation. Recent research, fueled by advances in computational capabilities, has increasingly relied on dislocation dynamics (DD) [21,22,23] and molecular dynamics (MD) simulations [24], employing multiscale methods to model these phenomena. However, these studies often focus narrowly on specific aspects, such as passing stress [13,25], rather than capturing the complete picture that includes the roles of PSB ladders and the processes of crack nucleation e.g., [24,26]
Modeling fatigue presents significant challenges, particularly concerning crack initiation, as it must consider the effects of dislocation substructures, that is, the laddered morphology in PSBs. The foundational work by Repetto and Ortiz [27] on finite element simulations of fatigue crack initiation emphasized the role of vacancy-induced elongation in the PSB region, which leads to surface protrusion as a key factor; however, their study did not account for the laddered morphology explicitly. In contrast, Nakai et al. [28,29,30] reported that cracks primarily evolve from intrusions rather than extrusions. Their research identified a potential critical condition for the transition from intrusions to cracks, based on detailed observations made using atomic force microscopy (AFM) combined with interrupted fatigue tests. According to their findings, extrusions and/or surface reliefs do not develop into cracks. Through their systematic series of i studies on several materials, they successfully identified a potential critical condition for the transition from intrusions to cracks, with further details presented in Section 2.
Focusing on the transition from slip bands to cracks, particularly once this critical condition is reached, may provide a more effective framework and minimize ambiguities in the modeling process. Integrating this critical condition with our Field Theory of Multiscale Plasticity (FTMP)-based approach [31,32,33,34,35] can significantly reduce computational costs, as FTMP does not always require intricate fine mesh divisions to reproduce deformation-induced substructural patterns accurately. This versatile theoretical framework facilitates the study of deformation-induced patterning, which is crucial for controlling mechanical properties across multiscale contexts [31,32].
This study aims to elucidate the roles of the laddered structure in PSBs on the fatigue crack initiation process through FTMP-incorporated crystal plasticity (CP)-based finite element method (FEM) simulations. Part I of the paper presents a preliminary series of simulations utilizing a simplified vacancy model to examine surface roughening behavior and the subsequent grooving processes.

2. Background

Two pivotal research findings have catalyzed the current series of studies. First, Yokoi et al. [36,37] demonstrated that the addition of copper (Cu) to steels can dramatically alter dislocation substructures, transforming them from cellular to planar configurations. This transformation results in finer surface intrusions and extrusions, significantly delaying the initiation of fatigue cracks, as illustrated in Figure 1(a). This finding underscores the crucial role of dislocation substructures in influencing the fatigue crack initiation process.
Second, Nakai et al. [28,29,30]. investigated the transition process from slip bands to cracks through a systematically designed series of interrupted AFM observations. They revealed that surface grooving—an evident manifestation of slip bands—evolves into fatigue cracks when the slip distance (or groove depth) exceeds a critical threshold, which varies among different materials, as shown in Figure 1(b). This finding highlights a key mechanism in dictating the transition from slip banding to fatigue cracking. Notably, surface reliefs (bottom left) do not contribute to crack formation; only grooves serve as precursors to crack nucleation, at least according to their studies. In this context, the effect of Cu addition on the screw core structure of α-Fe has been studied separately through ab initio calculations [38]. Cross slip by screw dislocations is considered critical for dynamic recovery, which drives cell formation. We reported a transition of the core structure from isotropic to fully extended, a change that tends to inhibit cross slip, thereby hindering dynamic recovery and the resulting cell formation. This provides one possible explanation for why the addition of Cu leads to vein-like or planar dislocation substructures, rather than cellular morphology.
By explicitly simulating these critical aspects through deformation analyses, we aim to provide groundbreaking insights that enhance our understanding of the fatigue crack initiation process in practical applications. For the former, the case of copper solid solution yielding a 2D vein structure represents the most fundamental scenario. Here, we confine our focus to the widely observed PSB ladder structure, with other matrix morphologies left for future investigation.

3. Theory and Kinematics

3.1. Brief Description About FTMP

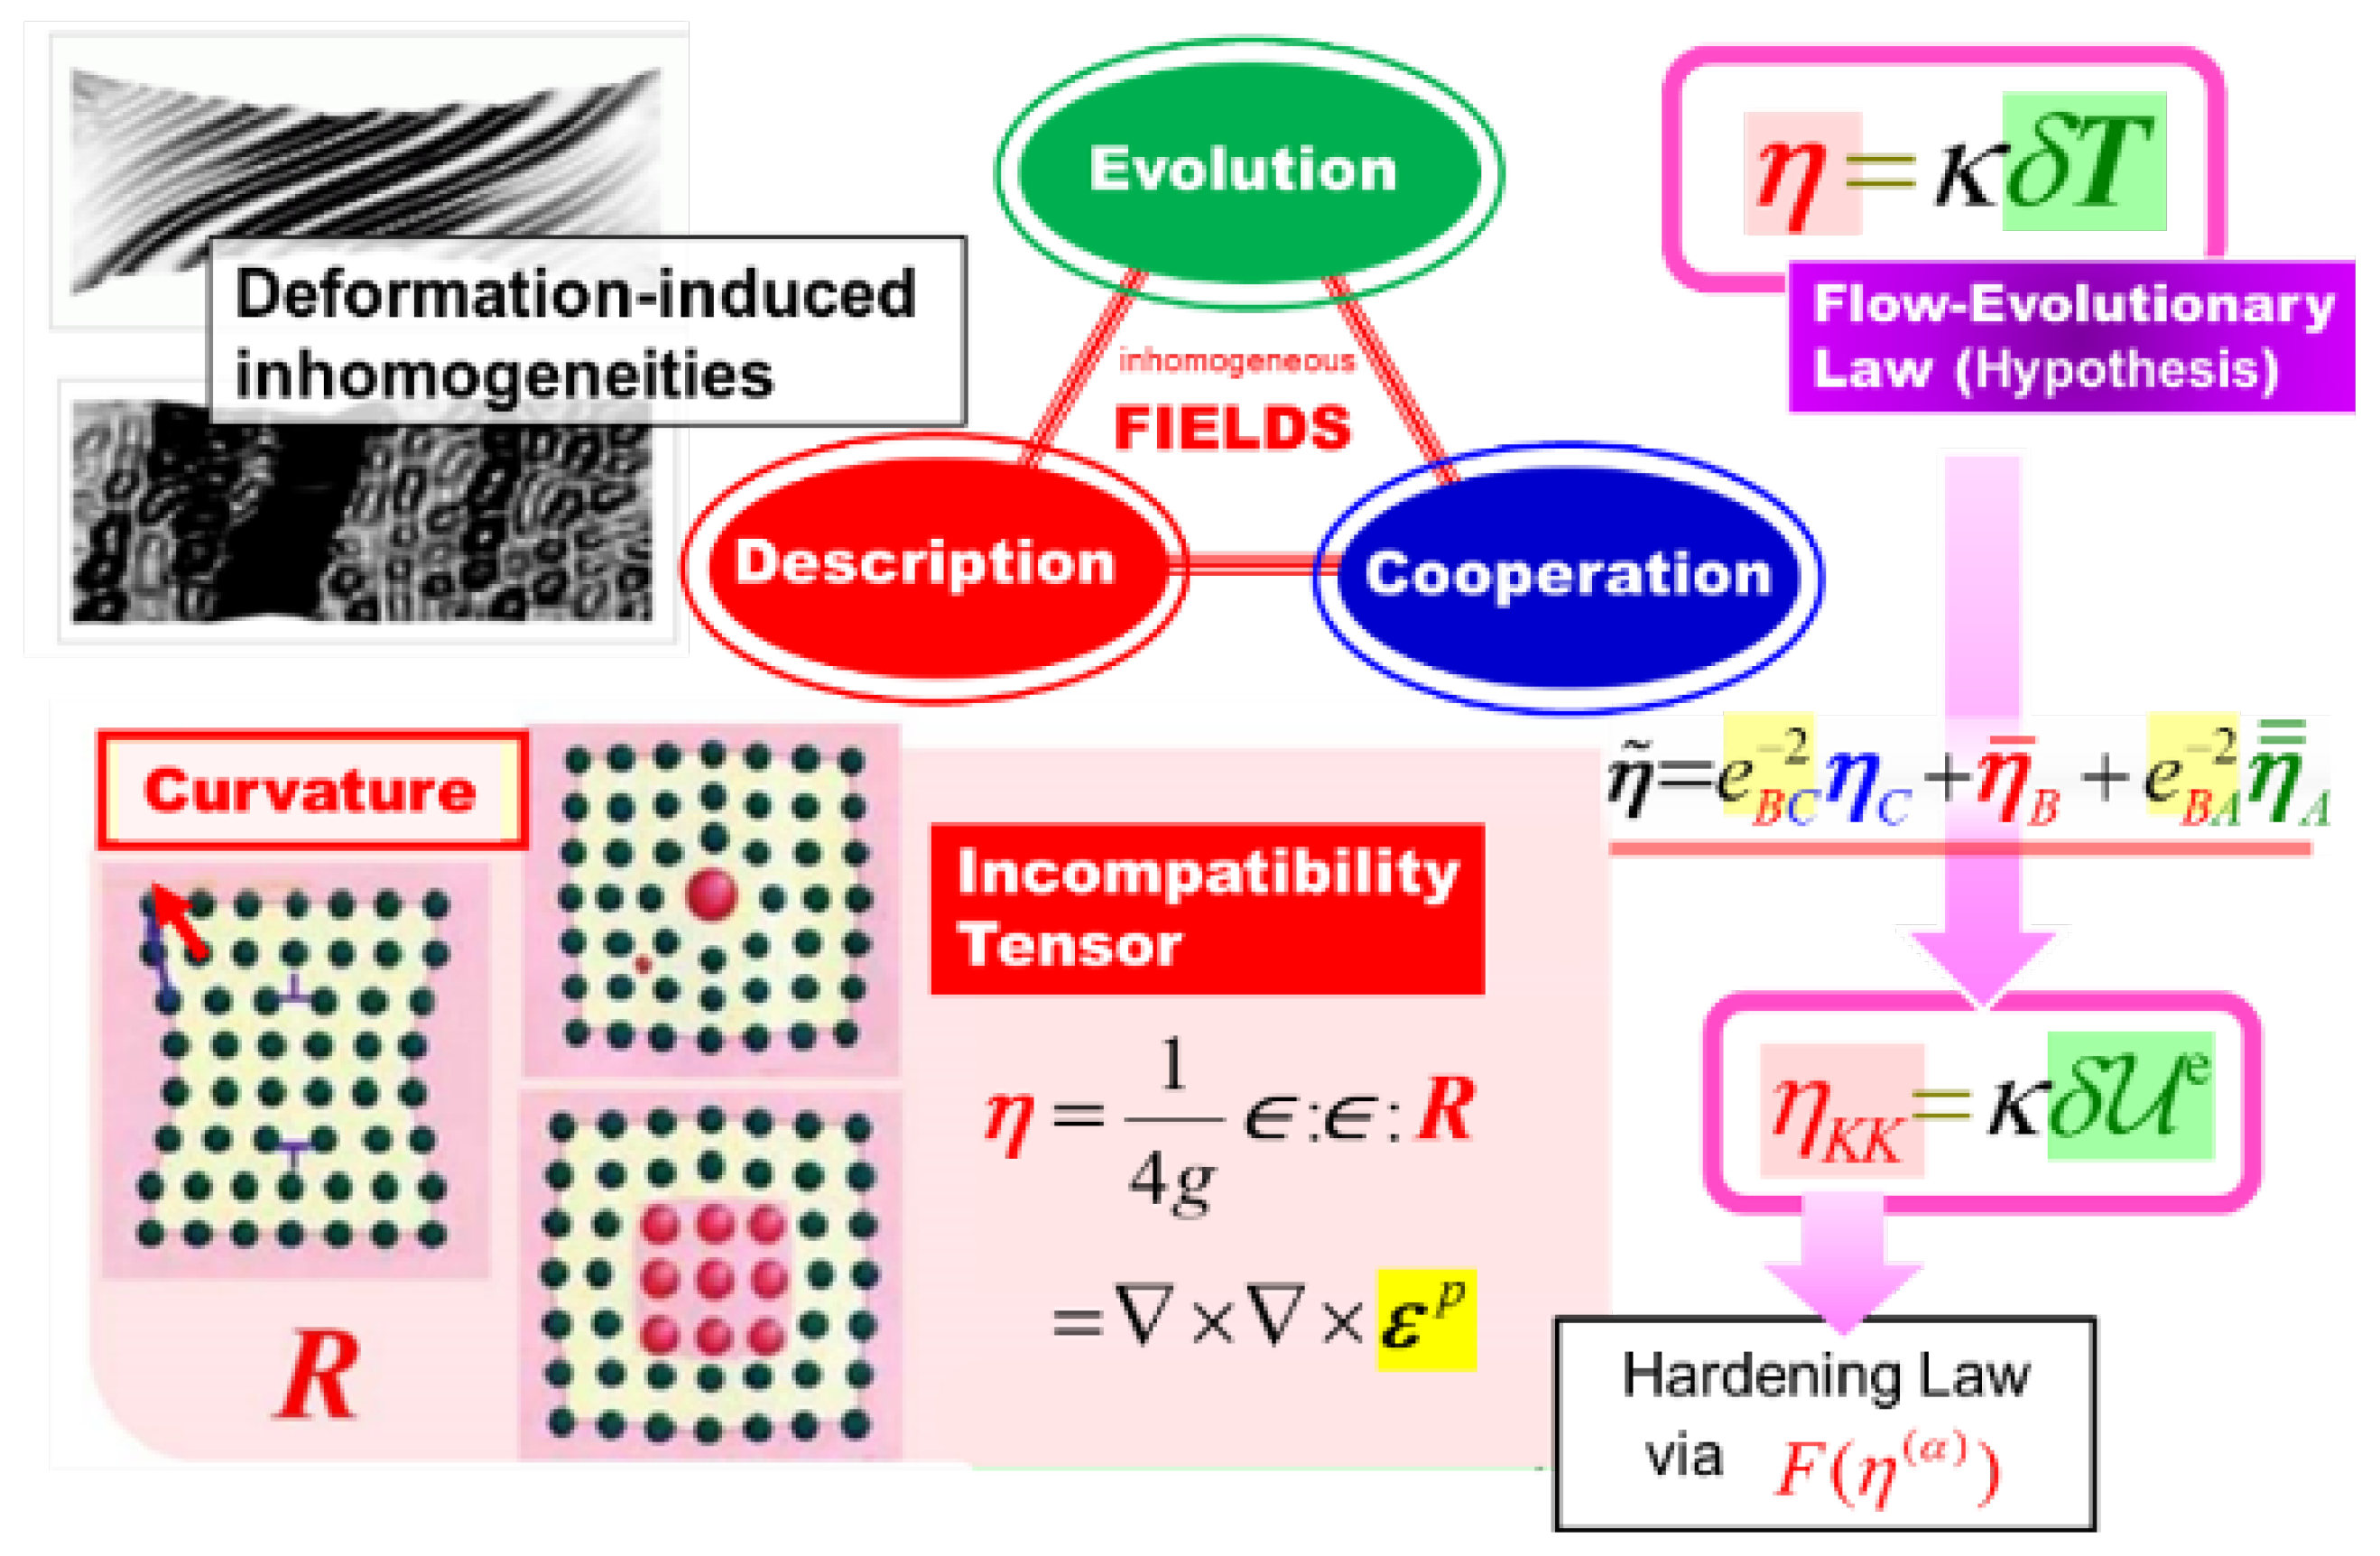
The Field Theory of Multiscale Plasticity (FTMP) [31,32,33,34,35] is a comprehensive framework encompassing three critical aspects: (a) evolution, (b) description, and (c) cooperation, as illustrated in Figure 2 (top center). It primarily addresses “inhomogeneously evolving” deformation fields, which typically manifest as dislocation substructures (top left: simulated examples). Notably, the theory’s ability to describe these aspects of evolution distinguishes it from many others. Furthermore, the interaction formalism facilitates explicit treatments of (c) cooperation across multiple scales.
For the mathematical description of these inhomogeneous fields, differential geometric concepts are predominantly employed, particularly the curvature tensor R k l m ... n and the torsion tensor S k l .. j , defined as:
S k l .. j = Γ [ k l ] j R k l m ... n = 2 [ k Γ l ] m n + Γ [ k p n Γ l ] m p
where Γ i j k represents the coefficient of connection. These tensors correspond to the incompatibility tensor (bottom left in Figure 2) and the dislocation density tensor, respectively, drawing on the non-Riemannian plasticity framework advocated by K. Kondo [39,40]. Both can be contracted into second-rank tensors without loss of information by applying the alternating tensor i j k as follows:
α i j = 1 2 i k l S k l .. j η i j = 1 4 g i k l j m n R k l m ... n g = det ( g i j )
with g i j the metric tensor. The incompatibility tensor η i j is further defined as the double curl of the plastic strain tensor ε i j p , while the dislocation density tensor α i j is derived from the curl of the plastic distortion tensor β i j p .
α i j = i k l k β l j p η i j = i k l j m n k m ε l n p or   α = × β p η = × × ε l n p
Consequently, strain gradients are intrinsically integrated into the theory. It is important to note that the dislocation density tensor, which represents the first gradient of strain, encompasses the concept of geometrically necessary dislocations (GNDs) [33,35,41].
At the core of FTMP is the concept known as the “flow-evolutionary law,” which serves as a working hypothesis (top right) [34,35]:
η i j = κ δ T i j
where κ refers to the duality coefficient. This relationship connects the incompatibility tensor η i j with the fluctuation of the energy-momentum tensor δ T i j , where the fluctuation is defined as the deviation from the spatial average, i.e., δ T i j T i j T i j .
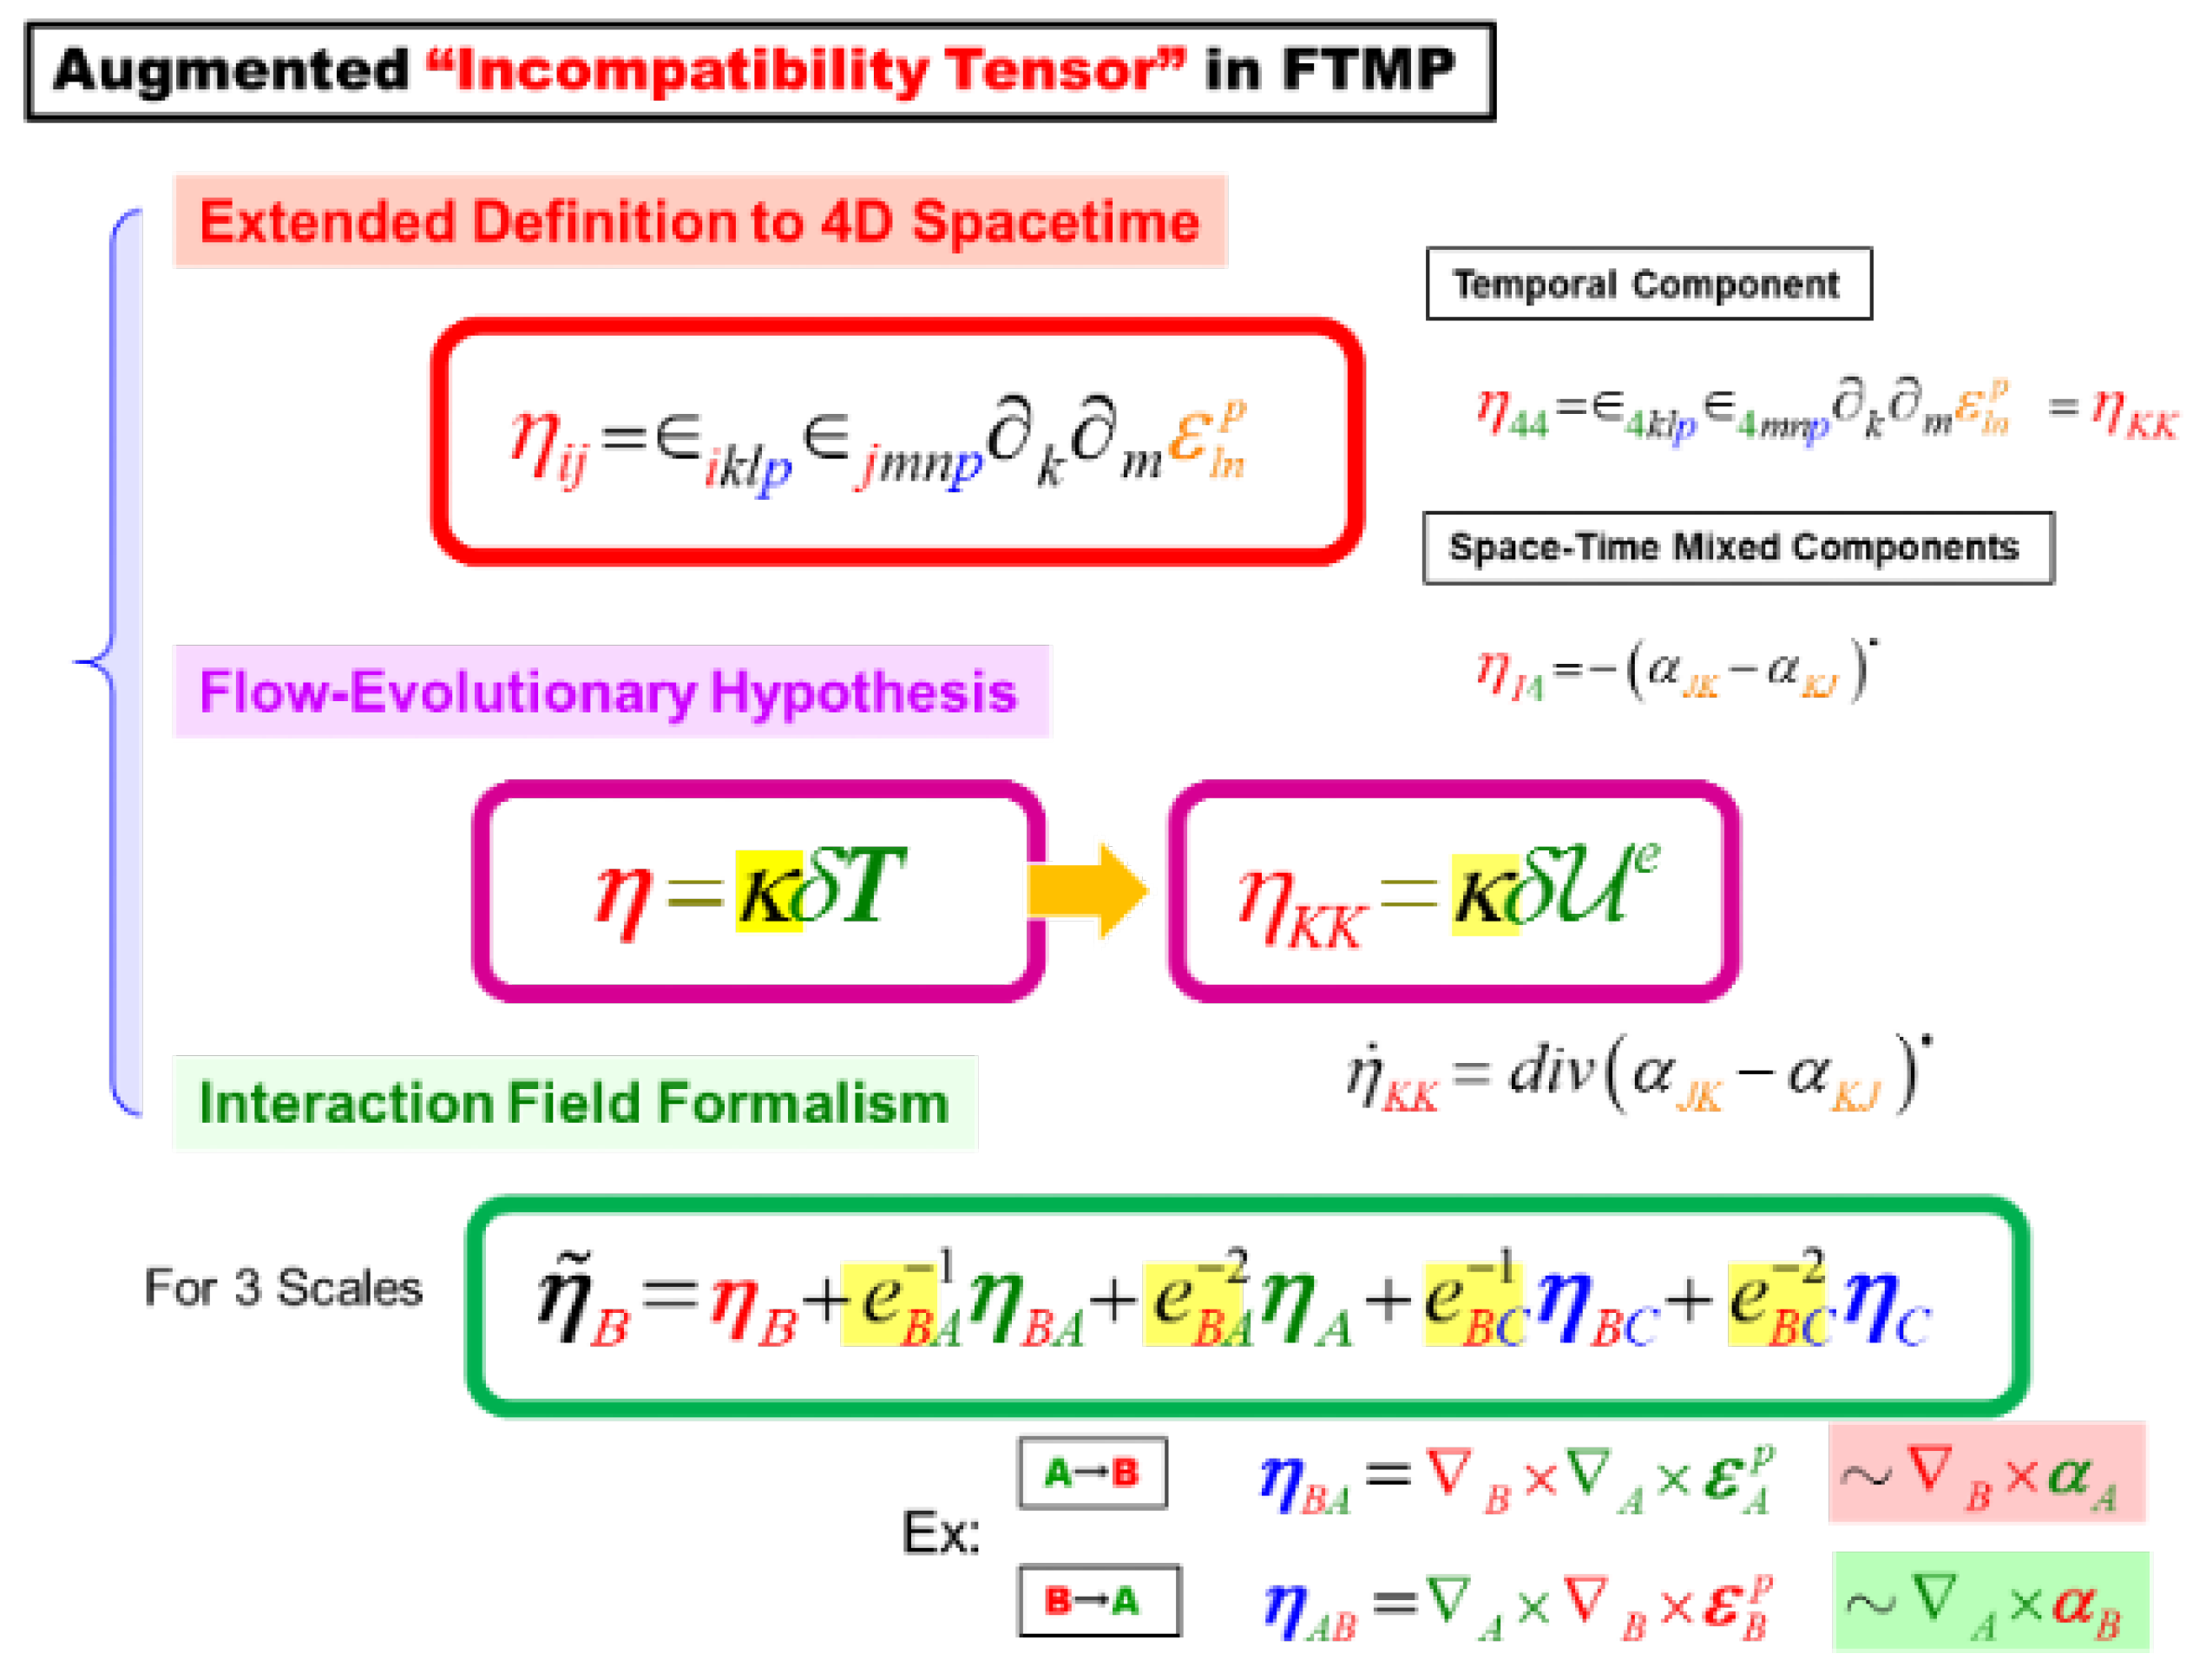
The FTMP framework extensively utilizes the incompatibility tensor, Equation (3)2, among other elements. Its enhanced applications, presented in Figure 3, are categorized into three aspects: an extended definition to four-dimensional (4D) spacetime, the flow-evolutionary hypothesis (Equation (4)), and the interaction formalism applicable across multiple scales. The 4D-extended definition of Equation (3)2 is expressed as:
η i j = i k l p j m n p k m ε l n p
In this context, the indices indicated by lowercase letters denote four-dimensional spacetime (1, 2, 3 for spatial dimensions and 4 for time), while capital letters are used for spatial components when necessary for clarity. The pure temporal component of the 4D-extended incompatibility tensor η 44 results in the spatial trace, represented as:
η 44 = 4 k l p 4 m n p k m ε l n p = η K K = t r s p η
Thus, the pure temporal component of Eq.(1) becomes:
η K K = κ δ U e + K
where U e denotes the elastic strain energy and K represents the kinetic energy. In static conditions, as is often the case, this simplifies to:
η K K = κ δ U e
as presented in the bottom right of Figure 1. Equation (8) visualizes the dynamic interrelationships between excessive strain energy being converted or redistributed into the incompatibility-related degrees of freedom, which drive the field evolutions during the course of elasto-plastic deformation.
In practice, there is no need to directly solve Equation (8). Instead, we can incorporate the incompatibility-based underlying degrees of freedom into the hardening law of the constitutive equation used in CP-FEM simulations, as detailed separately below (also see the bottom right of Figure 2). This integration allows the system to autonomously manage excessive storage of elastic strain energy, leading to significant field evolutions, such as substructure formation. In this context, the evolution of dislocation substructures arises naturally from system-wide accommodations facilitated by incompatibility. If this approach is correct, the necessary dislocation patterning can spontaneously emerge, provided that we properly integrate the incompatibility-related degrees of freedom into the simulation; otherwise, it may not occur. Thus, we anticipate that the laddered patterning in PSBs can be effectively reproduced without the need for any ad hoc models, underscoring the robustness of the FTMP framework.
The divergence free condition for the incompatibility tensor in the 4D space-time reads:
d i v 4 D η = 0 η ˙ 44 + d i v η A 4 = 0
Here, η ˙ 44 = η ˙ K K according to Eq.(3), while the space-temporal mixed component η 4 A is given as:
η A 4 = α B C α C B ·
Ultimately, we establish the following relationship between the incompatibility rate and the edge dislocation density flux by substituting E.(10) into Eq.(9).
η ˙ K K = d i v α B C α C B ·
This relationship allows multiple interpretations regarding pair-wise dislocation creation and annihilation processes, making it useful for modeling various detailed processes related to dislocation fields. The present study utilizes this model to investigate vacancy sources arising from the pair annihilation of edge dislocations in Part II.

3.2. Kinematics of Crystal Plasticity

The FTMP concepts can be integrated with the conventional kinematics framework of crystal plasticity [42,43], serving as a foundational vehicle for their application. We essentially adhere to this framework, beginning with Lee’s elastic-plastic decomposition of the deformation gradient tensor to accurately capture the finite deformation conditions:
F = F * F p
where F * accounts for elastic deformation, including lattice rotation and F p serves as its plastic counterpart.
The constitutive equation for elasticity in a rate form, suitable for finite crystal plasticity, is expressed as:
( τ ( J ) * ) = C e : d * with   ( τ ( J ) * ) = σ + σ t r d
where ( τ ( J ) * ) is the Jaumann rate of the Kirchhoff Stress tensor, viewed from an observer on the rotating lattice. σ expresses the Cauchy stress tensor, C e is the elasticity tensor, and d * represents the elastic part of the strain rate tensor d . The relation J ˙ = t r d = t r d * has been used in the second equation, with J ˙ denoting the Jacobian rate.
Ultimately, we reach:
τ ( J ) = C e : d α = 1 N R α γ ˙ α with   R α = C e : P α + β α β α = W α σ σ W α
Here, P α = s α m α s y m and W α = s α m α s k e w are evaluated using the unit vectors for the slip direction s α and slip plane normal m α , with ( α ) referring to the slip systems.

3.3. Constitutive Equation for CP-FEM

We employ the general constitutive equation proposed in [34,35] based on dislocation dynamics, applicable both to FCC and BCC metals in a wide range of strain rate and temperature.
γ ˙ ( α ) = A ˙ S R τ * ( α ) τ * ( α ) B S R exp 1 τ ( α ) τ P e i e r l s * ( α ) Ω ( α ) K ( α ) p q + C S R τ * ( α ) τ ( α ) τ P e i e r l s * ( α ) Ω ( α )
where τ P e i e r l s * ( α ) in the Macaulay bracket ( + / 2 ) expresses the critical stress for the Peierls mechanism, further given as,
τ P e i e r l s * ( α ) = τ ^ P e i e r l s * 1 B S R p 1 ln γ ˙ 0 P γ ˙ ( α ) 1 / q P 1 / p P
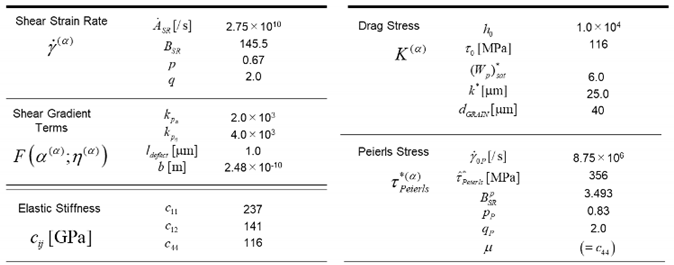
For FCC metals, we typically set τ P e i e r l s * ( α ) = 0 , while for BCC metals, we can reasonably assume C S R = 0 . The present study neglects the back stress, i.e., Ω ( α ) = 0 , for simplicity. The material parameters used in this series of simulations are compiled in Table 1. The evolution of the drag stress is governed by,
K ˙ ( α ) = Q α β H γ γ ˙ ( β ) Q α β = δ α β + f α κ S κ β + F k ( α k ( β ) ; η k ( β ) )
where H γ represents the referential hardening moduli, H γ = h 0 h 0 / n τ 0 γ + 1 n 1 with γ = α γ α , f α β is the interaction matrix for pairwise dislocation reactions, and Q α β is the hardening ratio that accounts for additional hardening or softening from the straining/loading history. Here, F k ( α k ( β ) ; η k ( β ) ) collectively represents the strain gradient terms for the dislocation density and incompatibility fields. The explicit forms are given as [34,35],
F ( α ( α ) ) = k p α α ( α ) b 1 / 2 F ( η ( α ) ) = sgn ( η ( α ) ) k p η l d e f e c t b η ( α ) 1 / 2
The parameters include l d e f e c t that represents the targeted inhomogeneous fields, which coincides with the Burgers vector b in the case of individual dislocations, along with the coefficients k p α and k p η . For evaluating the slip system-wise dislocation density and incompatibility fields, the following projections are employed.
α ( α ) = t ( α ) s ( α ) + s ( α ) s ( α ) : α η ( α ) = t ( α ) s ( α ) + s ( α ) s ( α ) + s ( α ) m ( α ) : η
where t ( α ) = s ( α ) × m ( α ) represents the line direction in the case of dislocations. Note that the choice of projection directions can affect the evolved patterning, requiring careful attention, especially regarding the incompatibility term, whereas the dislocation density tensor has a clear physical meaning, specifically representing the edge and screw components via t ( α ) s ( α ) and s ( α ) s ( α ) projections, respectively. All the material parameters used in the present study is listed in Table 1.

4. Model and Analytical Condition

The finite element (FE) model used for the preliminary analyses is illustrated in Figure 4, which also outlines the analytical conditions. This model, oriented along a single slip direction [ 1 5 ¯ 2 ] is discretized into 24 × 80 × 4 crossed-triangular elements. The evaluation radius for the strain gradient calculation is set to r G R = 1.0 μ m , within which the average slope of the strain values is determined using the least squares method. Cyclic straining is applied under conditions controlled by the plastic strain amplitude of Δ ε p / 2 = 0.6 % .

5. Results and Discussion

5.1. General Features

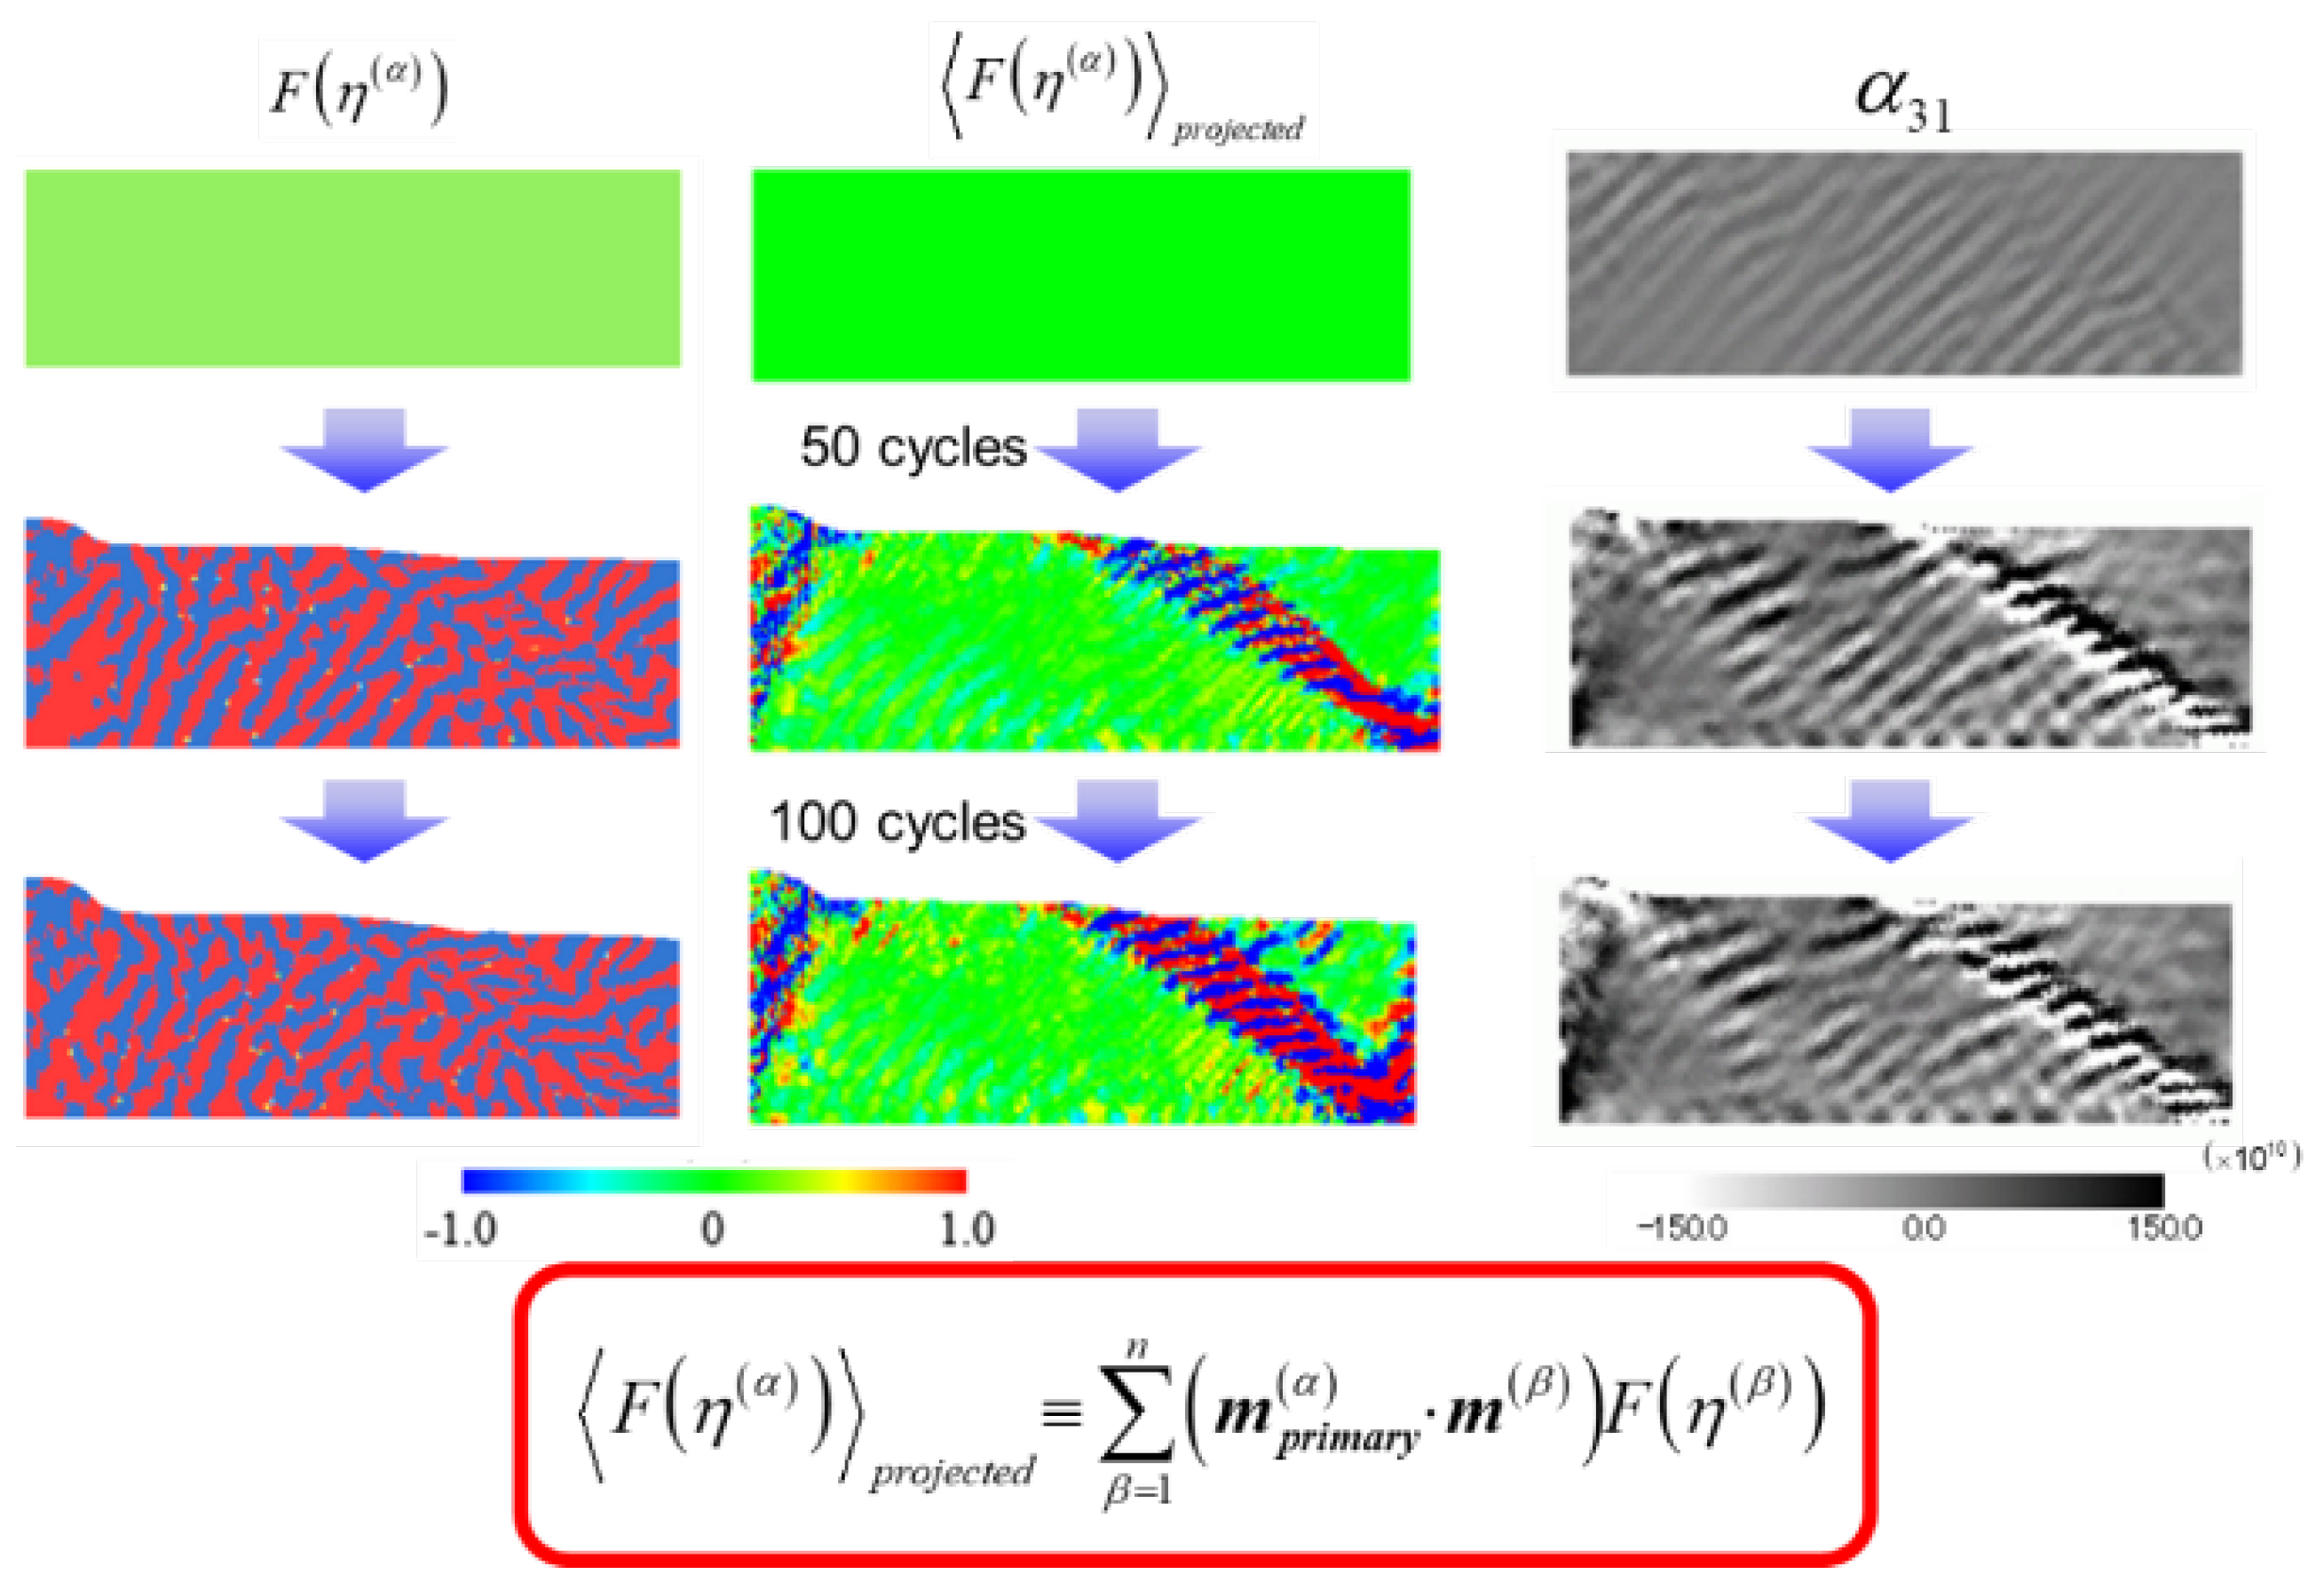
Figure 5 presents a simulated incompatibility contour on a representative slip system (α), along with its projected counterpart on the primary slip system, as illustrated in the process below. Here, m ( α ) represents the slip plane normal. The projection onto the primary slip plane, expressed by m p r i m a r y ( α ) , effectively cancels the incompatibility pattern in the matrix region, leaving only the ladder-like pattern along the slip band. This suggests that the incompatibility-based patterning can essentially be categorized as a fluctuation, resulting in a net value of zero overall, in general. In contrast, the dislocation density contour, represented by the edge component α 31 shown on the rightmost side of Figure 5, naturally exhibits a ladder-like structure even without this projection. This indicates that the resultant dislocation substructure corresponds to the projected incompatibility distribution.
The reproduced PSB accompanied by laddered patterning, as anticipated above (see Section 3.1), underscores the predictive power of the FTMP framework, without any additional ingredients nor specifically-designated intricate mathematical models, moreover, essentially no need elaborates finite element discretization. This reinforces our confidence in modeling seamlessly the fatigue crack initiation processes that such specific dislocation structure can be accurately reproduced without reliance on ad hoc models.
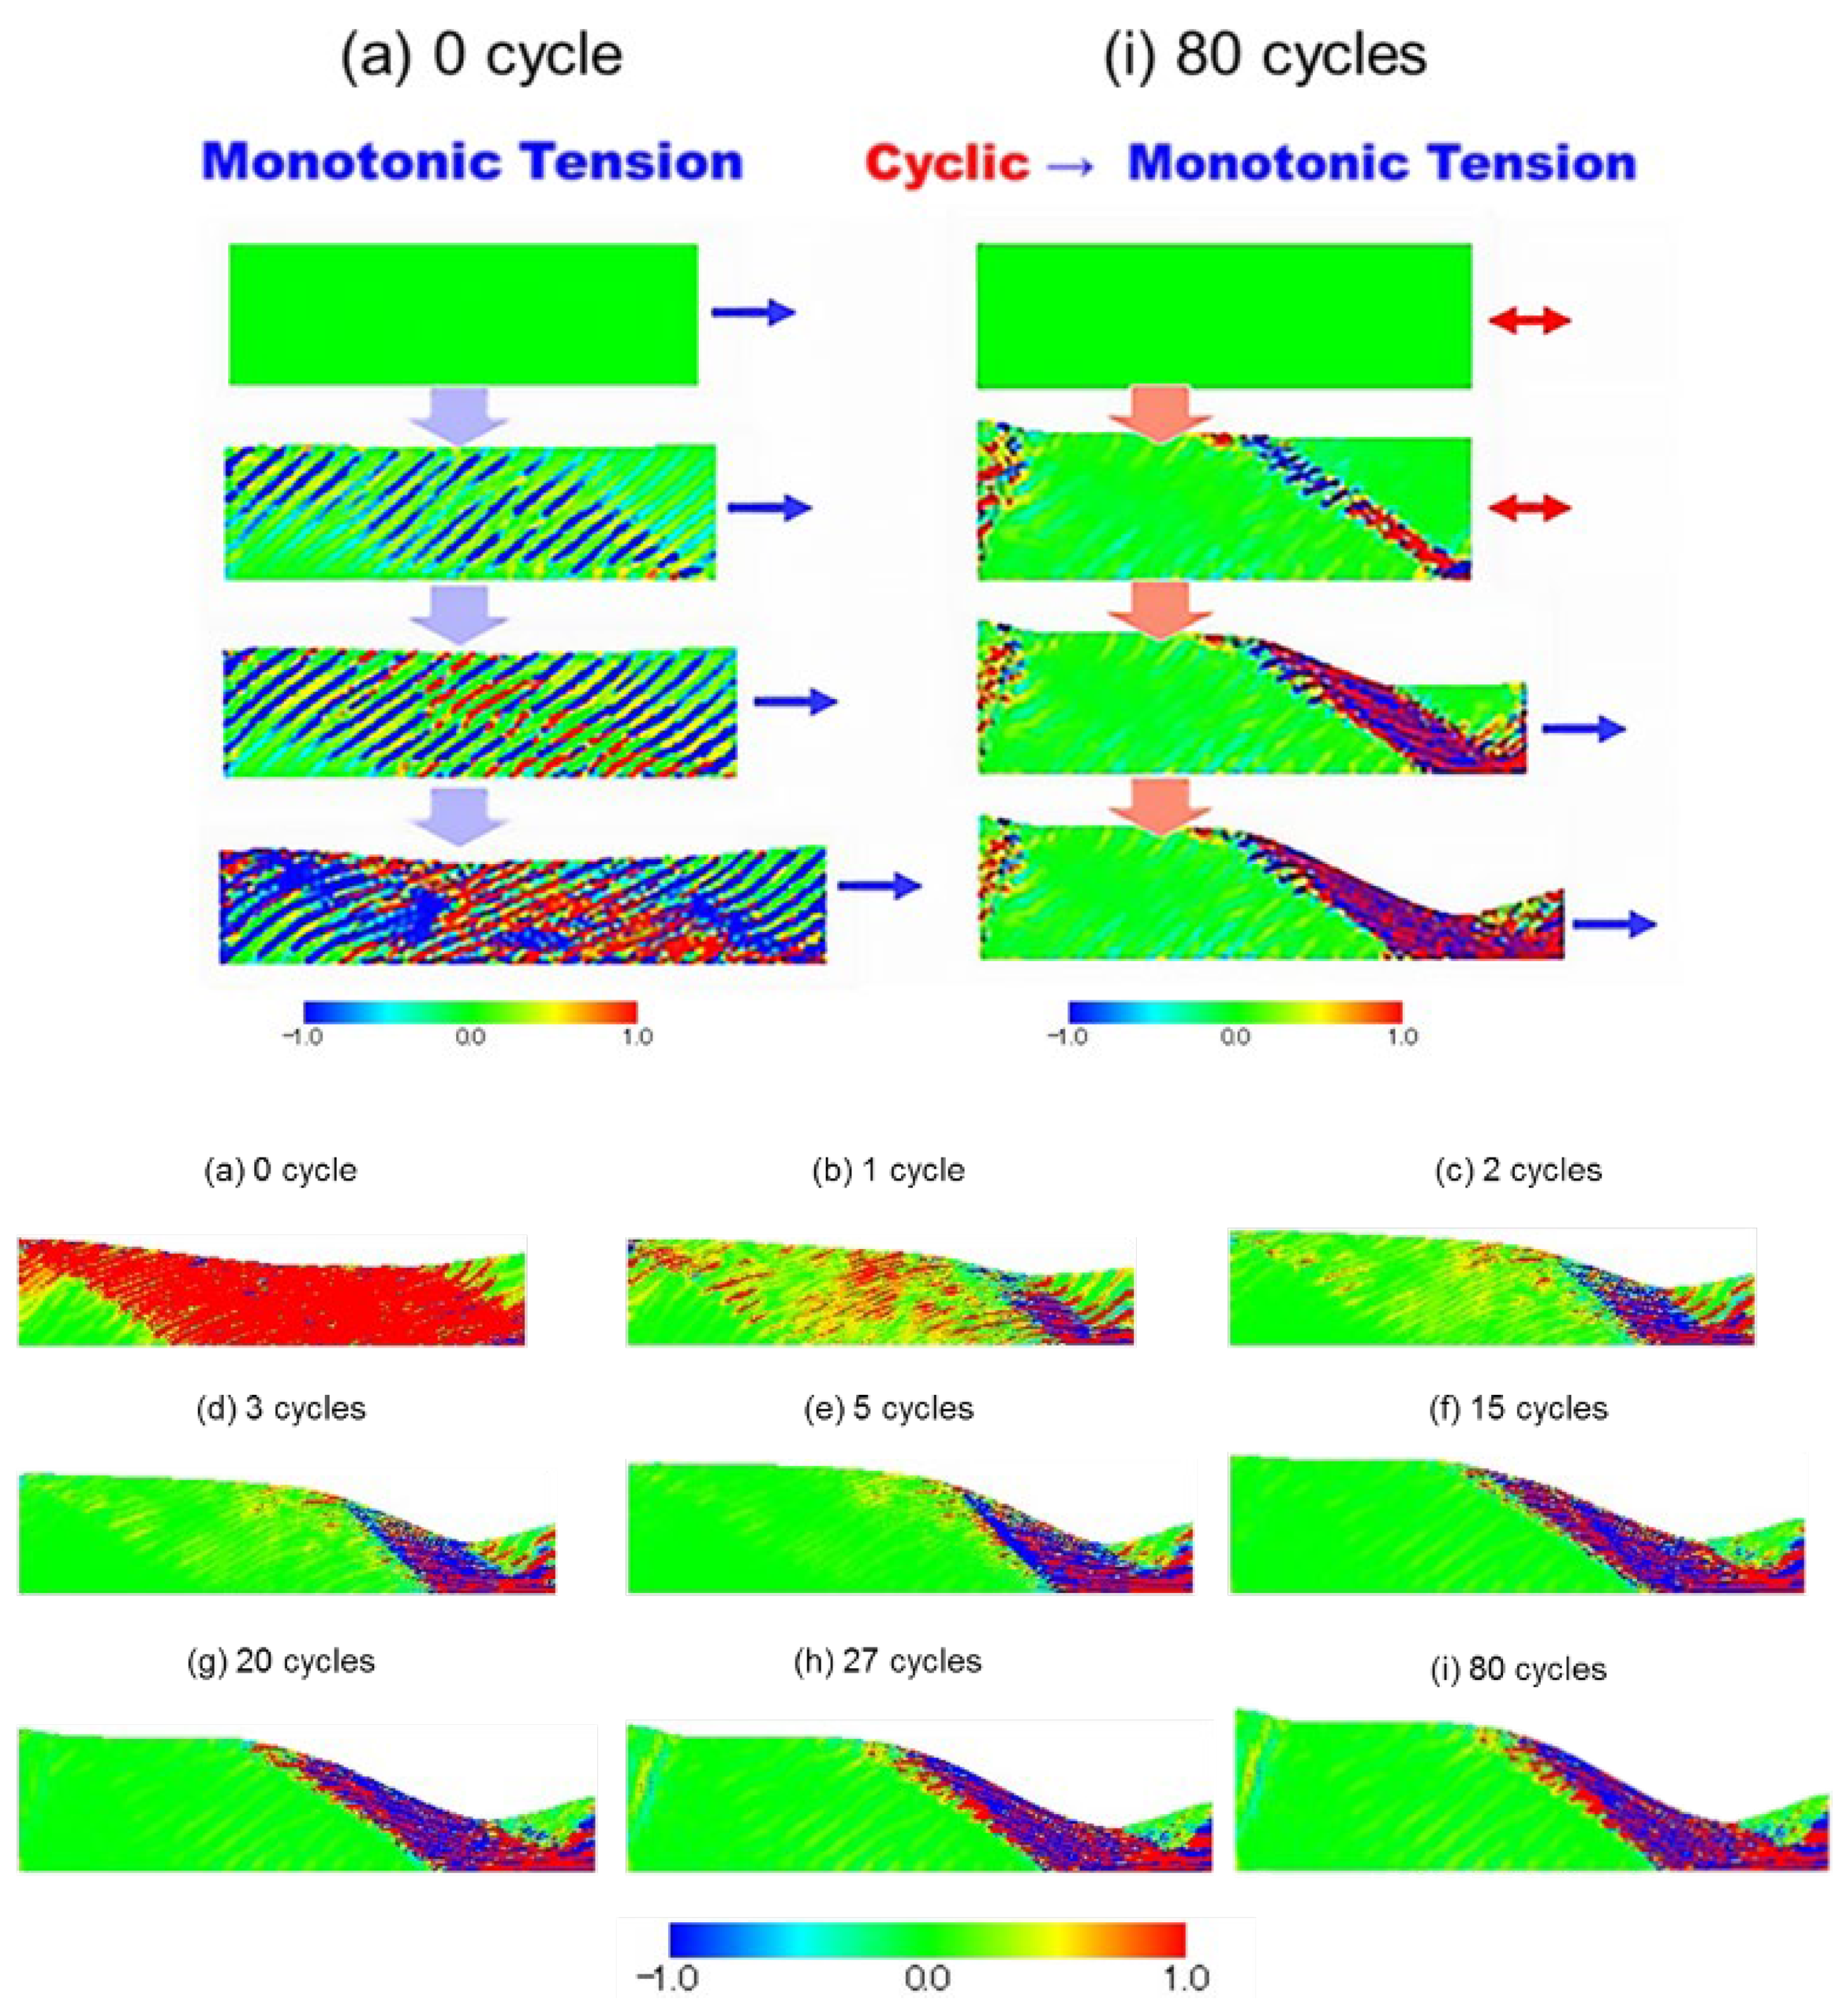
To demonstrate how the ladder-patterned region is softened, the sample is monotonically pulled after interrupting the cyclic straining. Figure 6a compares the samples pulled before the onset of cyclic straining (0 cycles) and after 80 cycles. As expected, the laddered sample exhibits landslide-like localized deformation, while the 0-cycle sample shows relatively uniform elongation. The results of monotonic tension after various straining cycles are presented in Figure 6b, indicating that 15 cycles of straining lead to complete softening of the PSB.
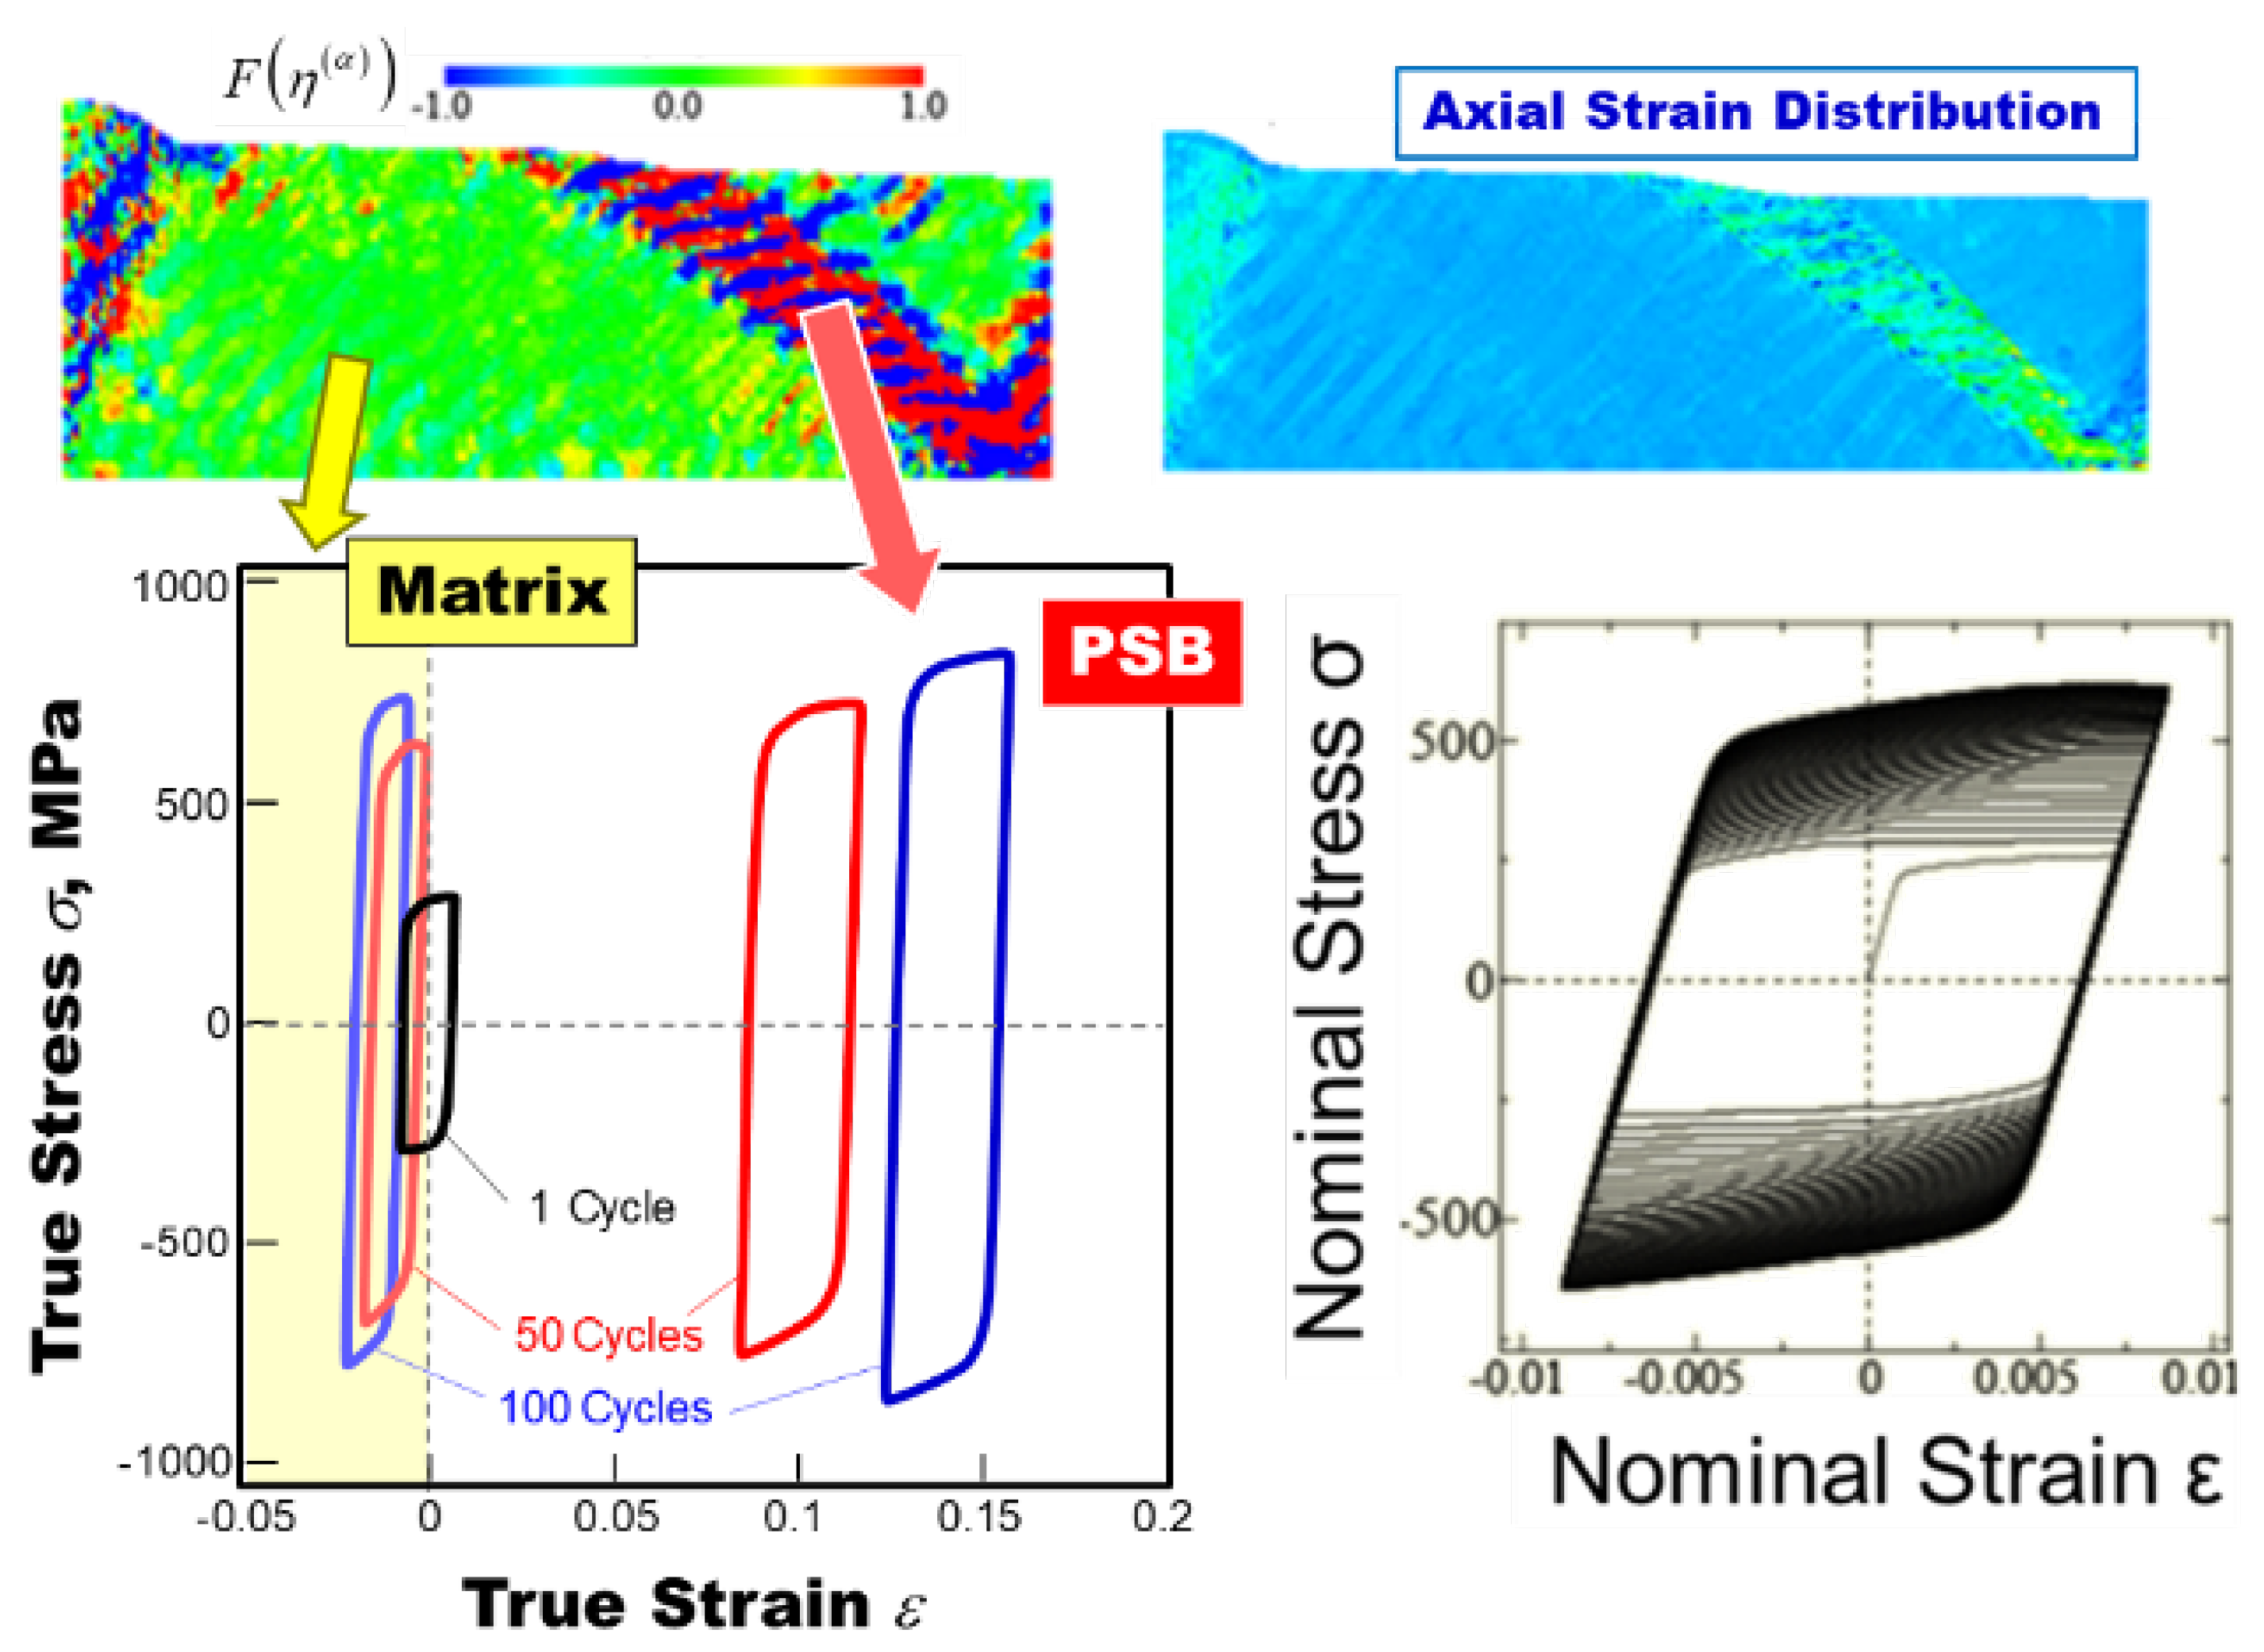
Figure 7 compares the hysteresis loops for the matrix and PSB regions. The PSB region exhibits a plastic strain amplitude three times larger, highlighting strain localization along the laddered band, with this region accounting for approximately 14% of the total volume. Notably, the loop for the PSB region tends to shift toward the tension side to balance system-wide deformation, ensuring symmetric push-pull straining. It is worth mentioning that this concentration of deformation is less than what is typically observed in reality, primarily because the present simulation does not distinctly capture vein structures in the matrix region, which can impede deformation. However, reproducing the vein morphology in the matrix is not within the scope of this study at this stage.

5.2. Specific Features

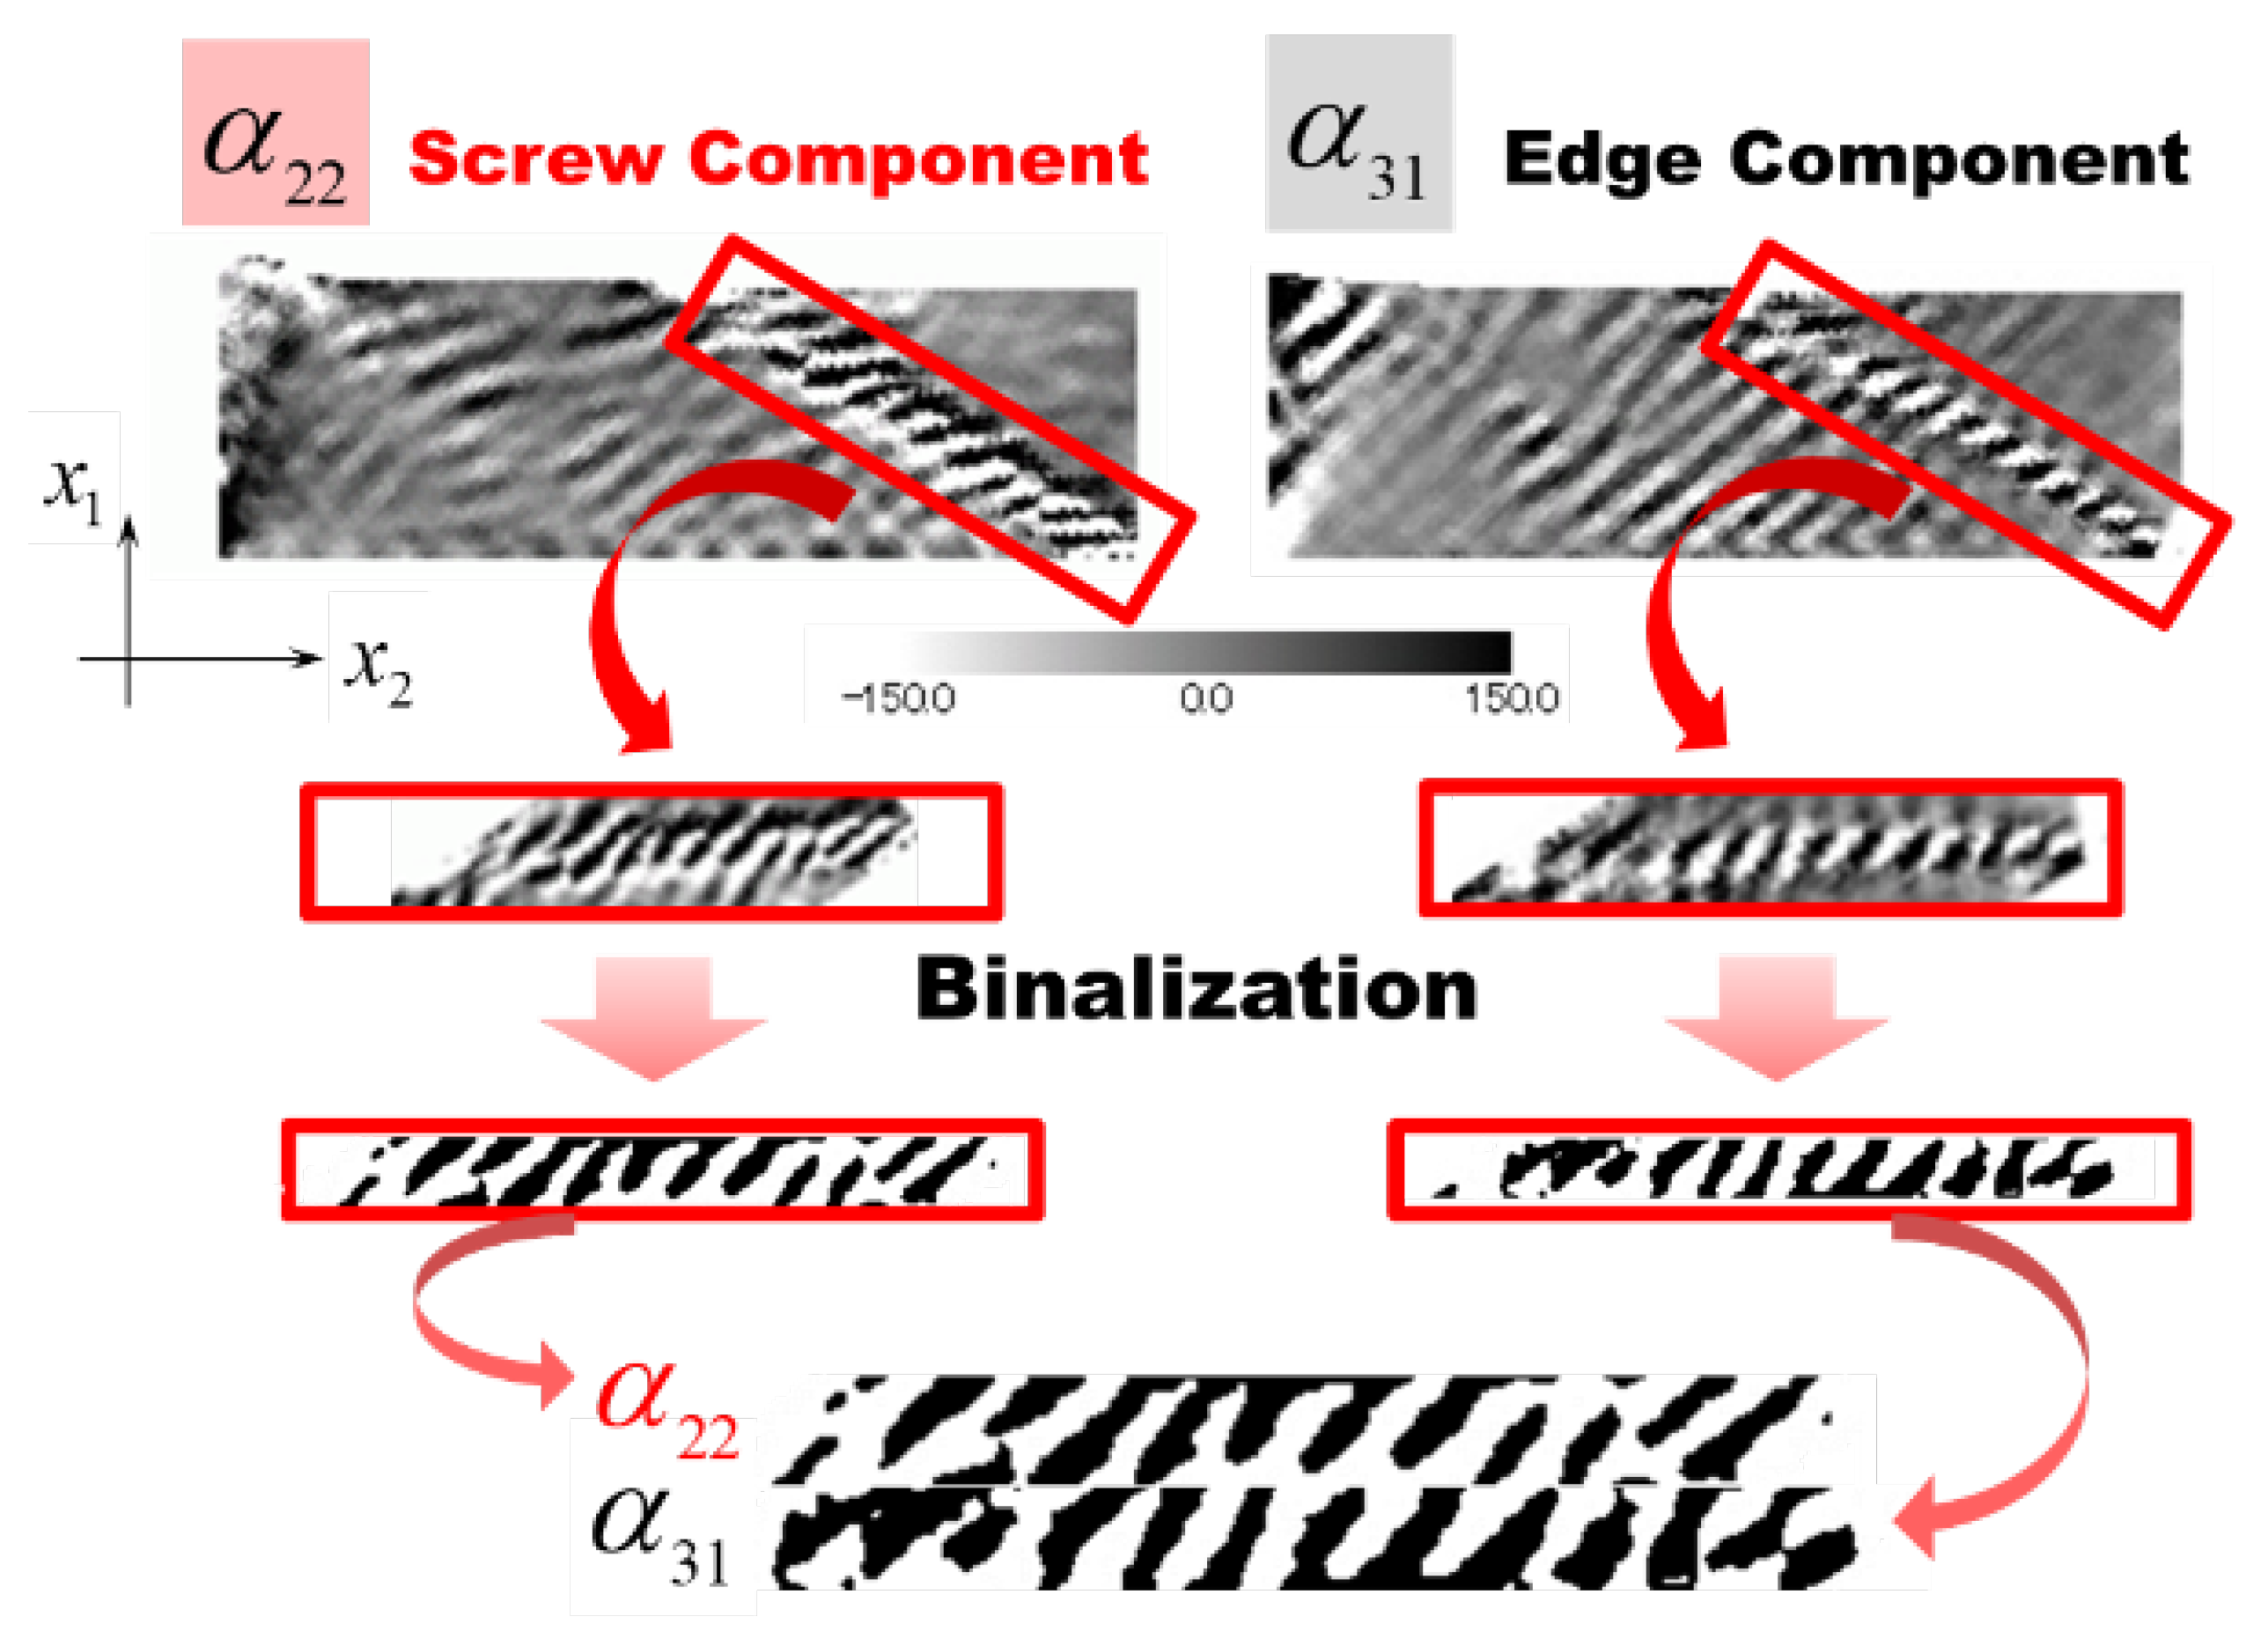
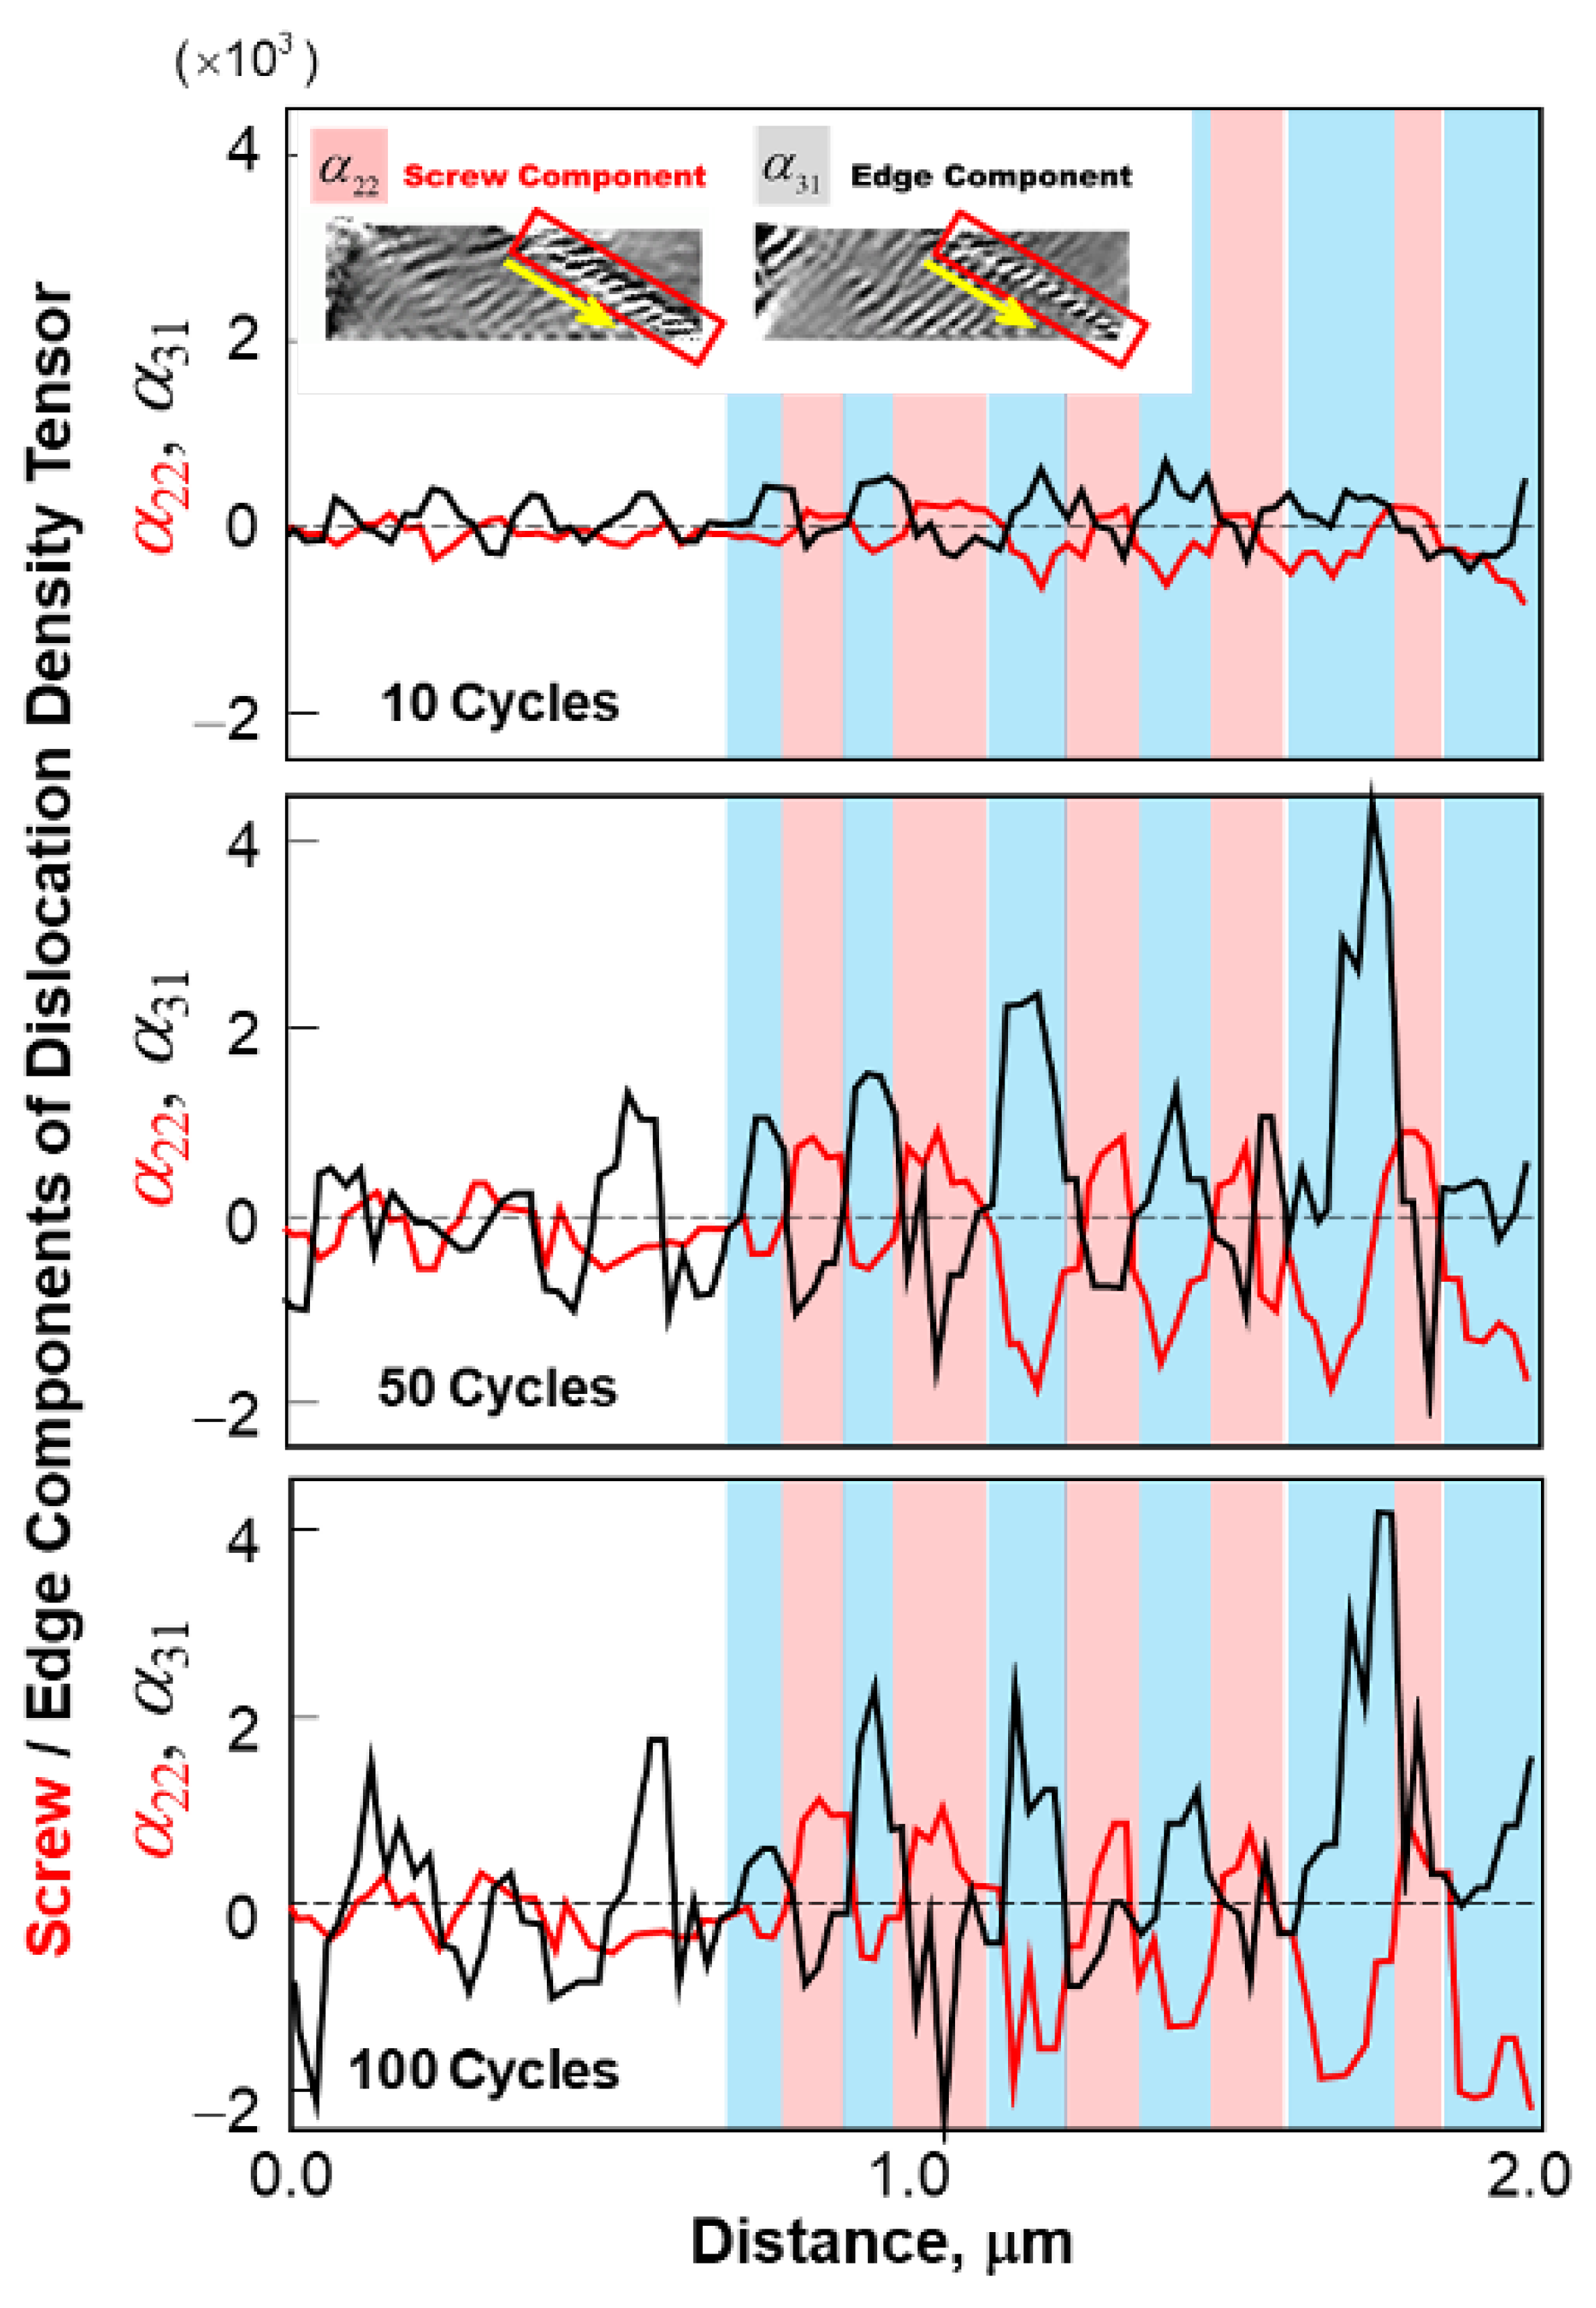
Let us examine how the reproduced patterns reflect reality. Figure 8 analyzes the laddered region in terms of component-wise dislocation density distribution, while Figure 9 illustrates the growth of their cross-sectional distributions with increasing straining cycles. Here, we display α 22 and α 31 as representatives for the screw and edge components, respectively, while α 11 and α 32 show similar trends, although it is not presented. The following points are clearly demonstrated: first, the ladder morphology comprises both screw and edge dislocation components; second, these components are alternately aligned, closely resembling experimental observations, as also confirmed in Figure 9. Furthermore, there is essentially no misorientation developed throughout the sample, with a deviation of less than 1 degree, consistent with experimental observations. To be noted that incompatibility-induced substructures are accompanied by misorientation developments in general.
On the less desirable side, we observe a slightly larger amplitude for α 31 than for α 22 in Figure 9, indicating that the structure is less capable of carrying deformation, as the screw segments play a key role in this capacity. This also contributes to the previously mentioned smaller strain concentration, alongside the less-developed vein-like morphology in the matrix region. Additionally, another difference remains in the width ratio of the ladder wall to channel regions, which ought to be much smaller, indicating potential room for further improvement.

5.3. Surface Roughening and Groove Formation

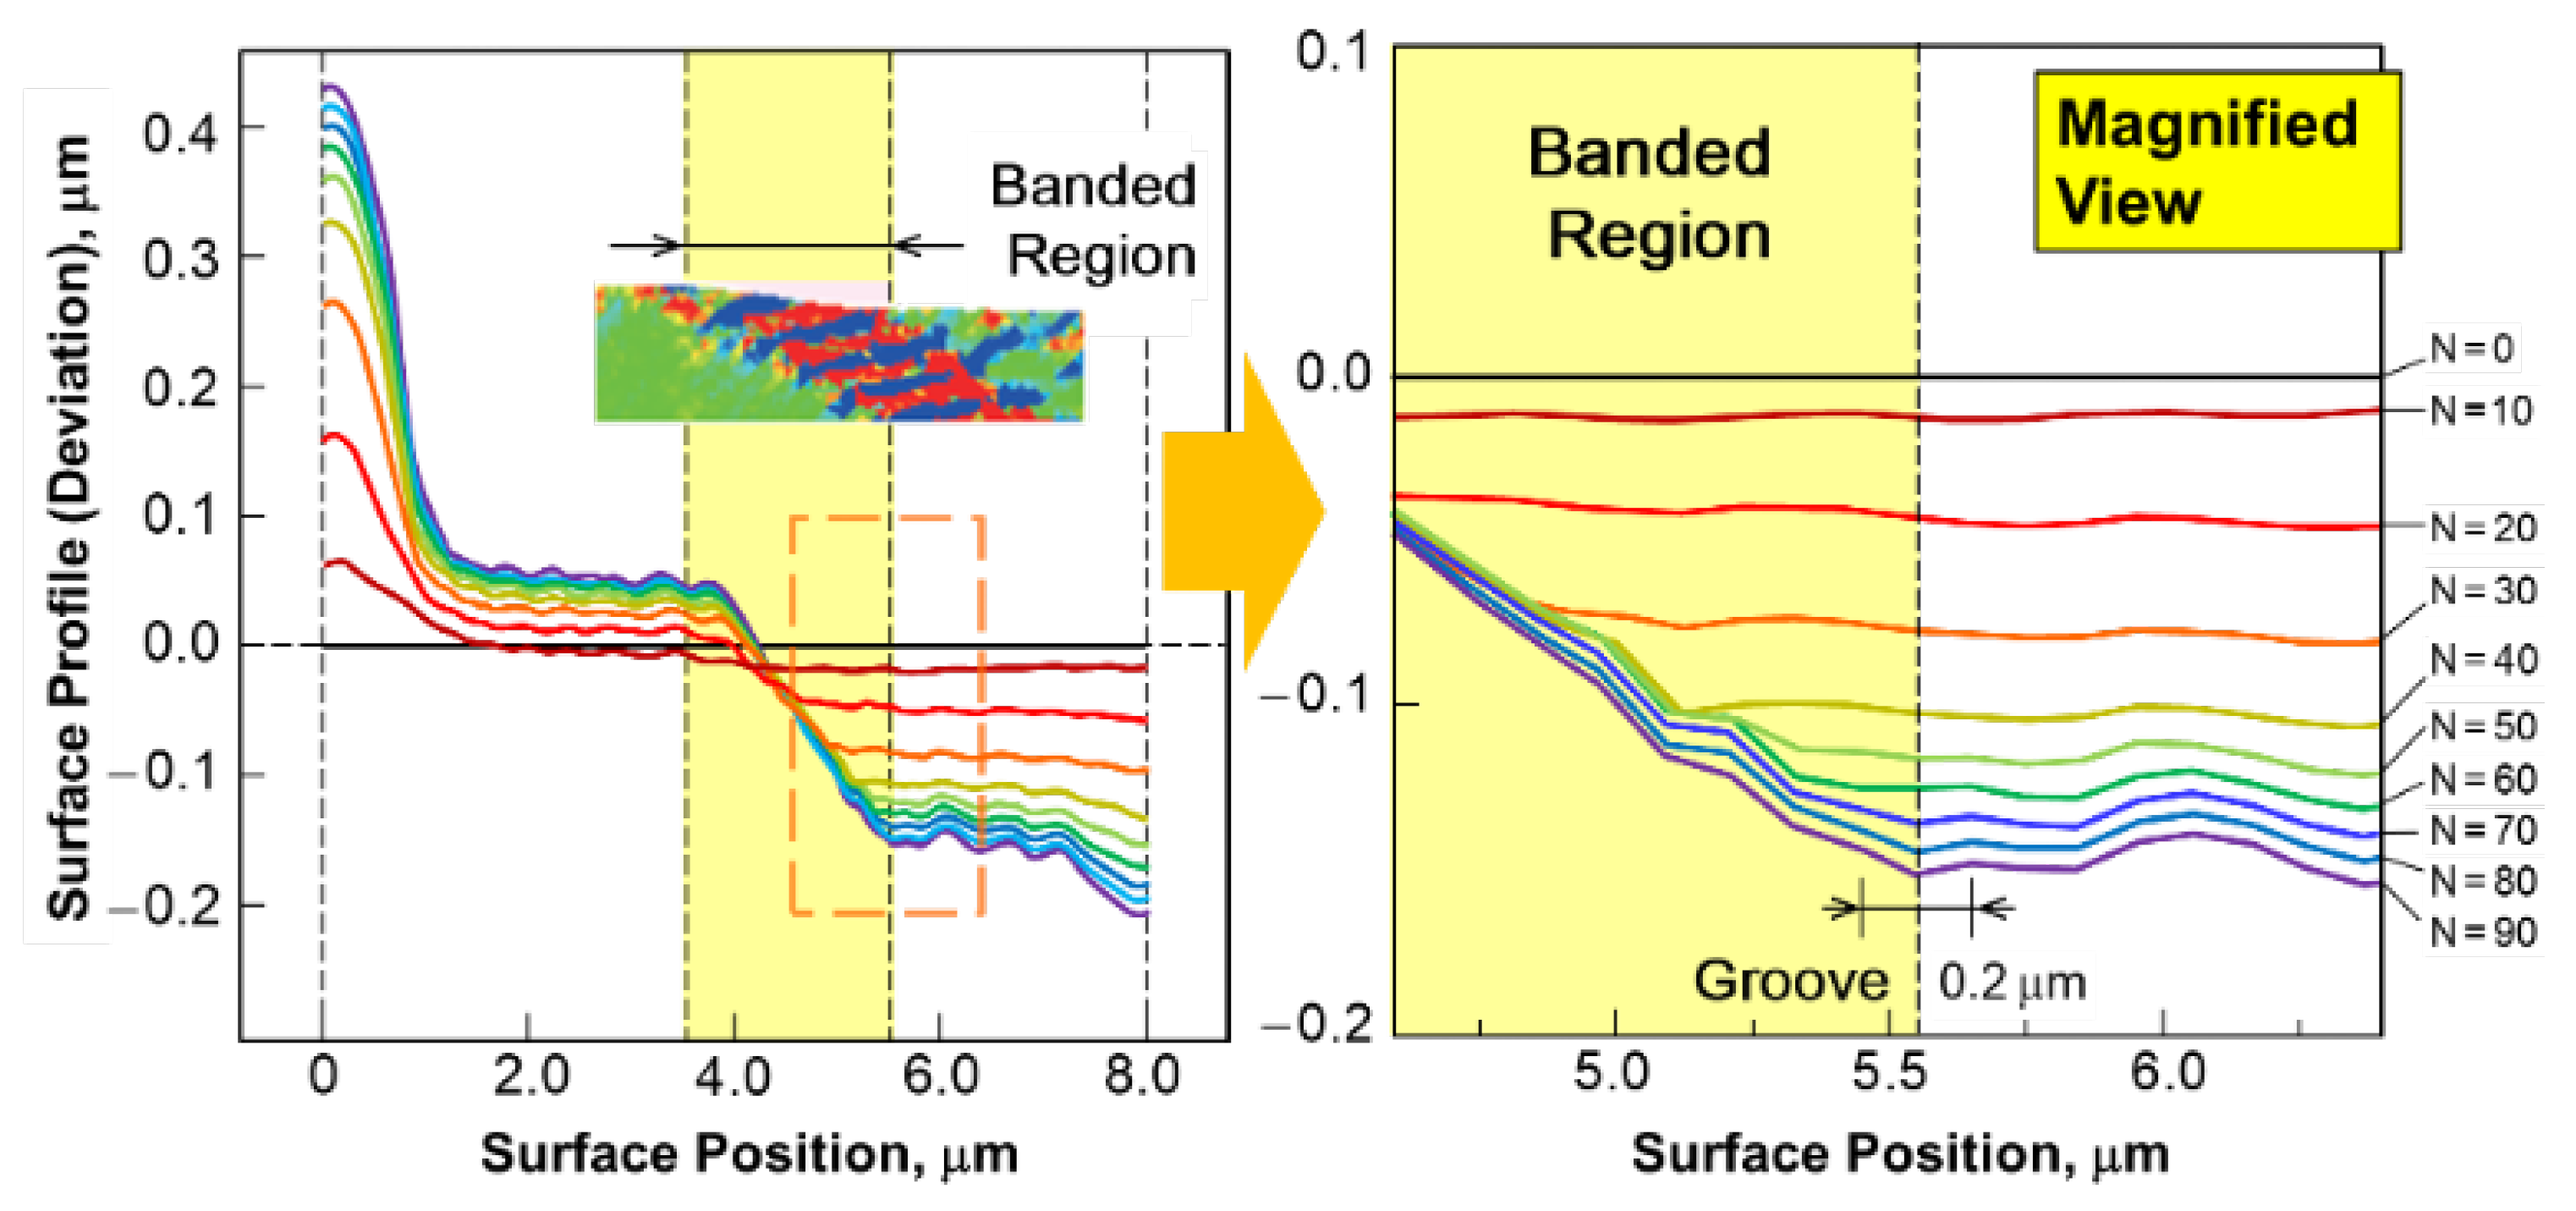
The strain concentration described earlier promotes surface roughening around the banded region, ultimately leading to grooving in that area. Figure 10 illustrates the evolving surface profile with increasing straining cycles, highlighting surface undulation up to N=90 cycles. This local deformation creates a sample-wide biased surface slope, including a protruded left edge, as the system seeks overall equilibrium. Notably, the banded region displays a significantly larger slope, indicative of localized strain that contributes to grooving at its right edge. The magnified view on the left captures the early stage of groove formation at the intersection of the PSB and the surface, where a shallow but distinct groove tip is evident at the right edge of the laddered band. These observations clearly demonstrate that spontaneous substructuring alone can effectively reproduce surface roughening and initiate the formation of groove embryos.

5.4. Preliminary Analysis with Vacancy Effect Using a Simplified Model

To anticipate the effect of the formed pattern on the subsequent behavior of the PSB and the resulting development of surface undulations, we introduce a simplified model for vacancy formation. This serves as a prelude to the explicit treatments of vacancy source model coupled with diffusion analysis that will be explored in Part II. Assuming that the gradient of the elastic strain energy attended with the formed laddered pattern can promote vacancy diffusion, combined with the flow-evolutionary law Equation (8), we introduce the following simplified model via the incompatibility term:
η c v = κ v δ U e
The idea here is inspired by a systematic series of diffusion analyses describe in Appendix A1, where the diffusion equation for vacancy concentration is solved against an assumed ladder pattern specified by an a priori elastic strain energy distribution. In this diffusion analyses, diffusion is solely enhanced by the gradient of the elastic strain energy, which is now reflected through the incompatibility term F ( η c v ) in the present analysis. We incorporate this term into the original F ( η ) in the hardening ratio Q α β , (Equation (17)2) anticipating a positive contribution to groove formation and further growth.
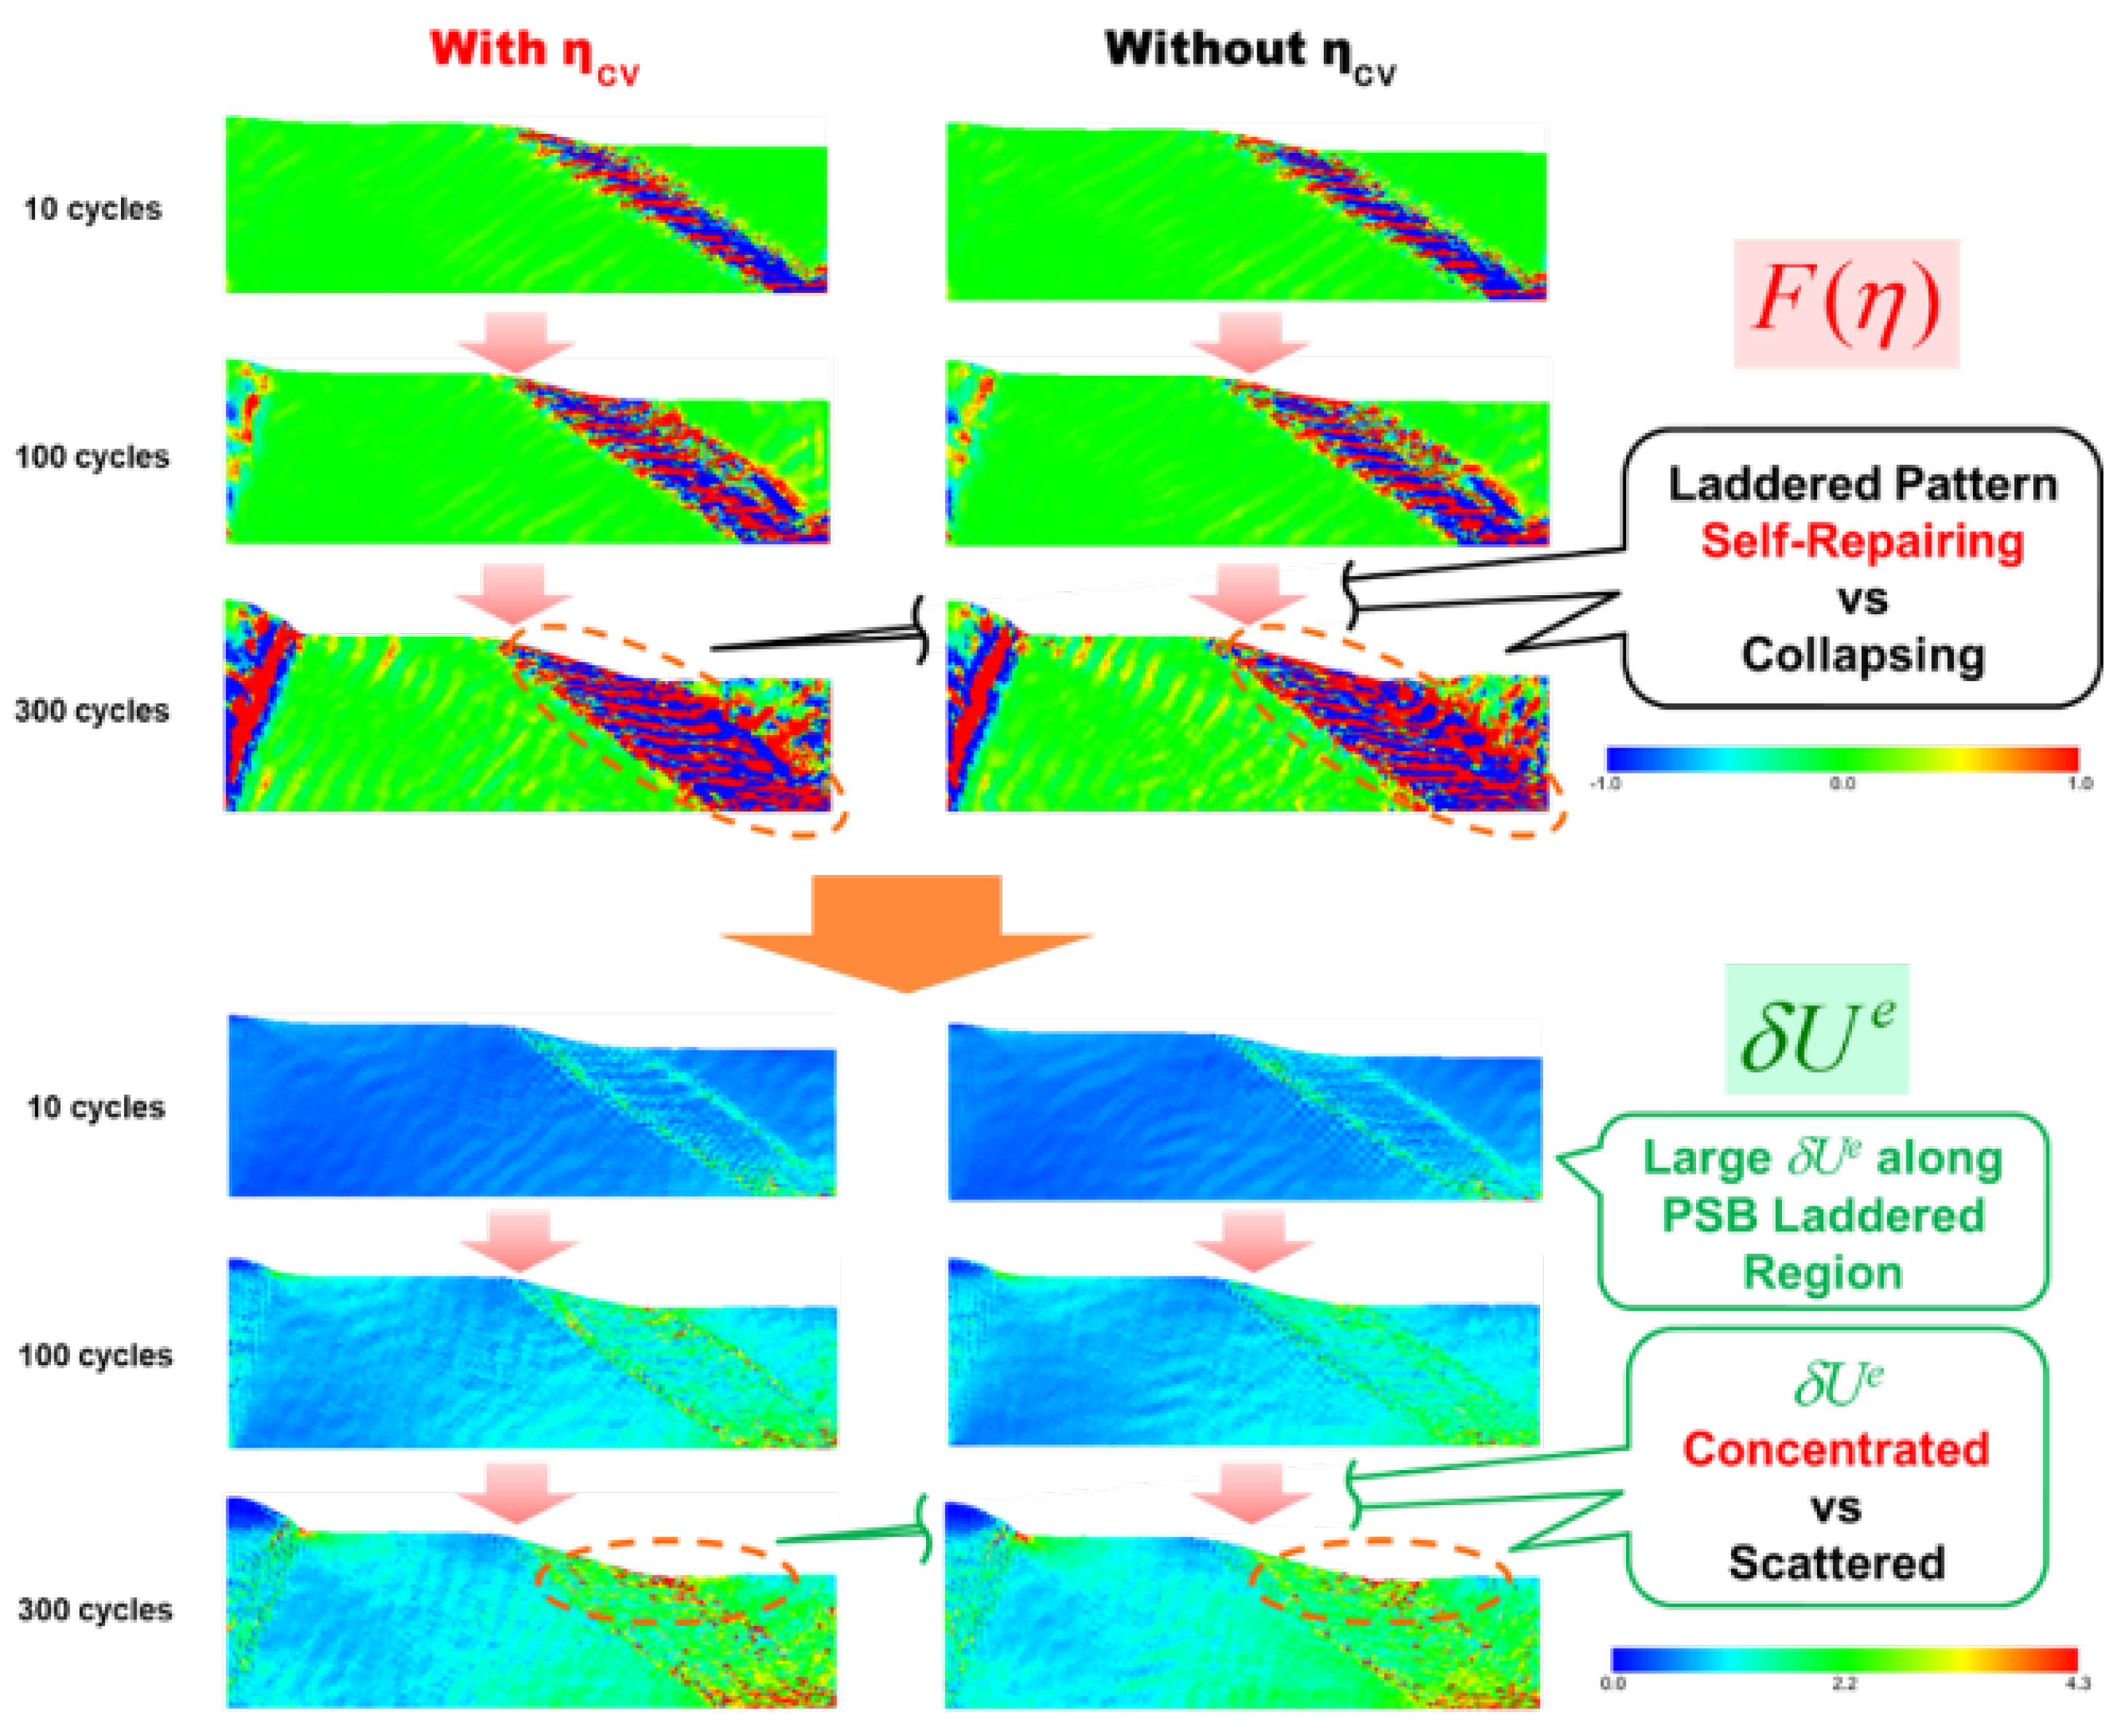
Figure 11 presents a comparison of incompatibility contours (top) and the corresponding elastic strain energy fluctuations (bottom) ( F ( η ) and δ U e ) to assess the effect of the simplified vacancy model on the evolution of laddered patterns in the PSB region. In the absence of the vacancy model (right row), the laddered pattern tends to collapse partially along the righthand side edge of PSB as straining cycles progress, as indicated by the incompatibility contours. This ultimately results in a relatively scattered distribution of δ U e around the PSB edge on the sample surface. In contrast, incorporating the vacancy model (left row) appears to stabilize the pattern, leading to a concentration of δ U e . We anticipate that this contribution to elastic strain energy fluctuations will foster the healthy development of surface grooves.
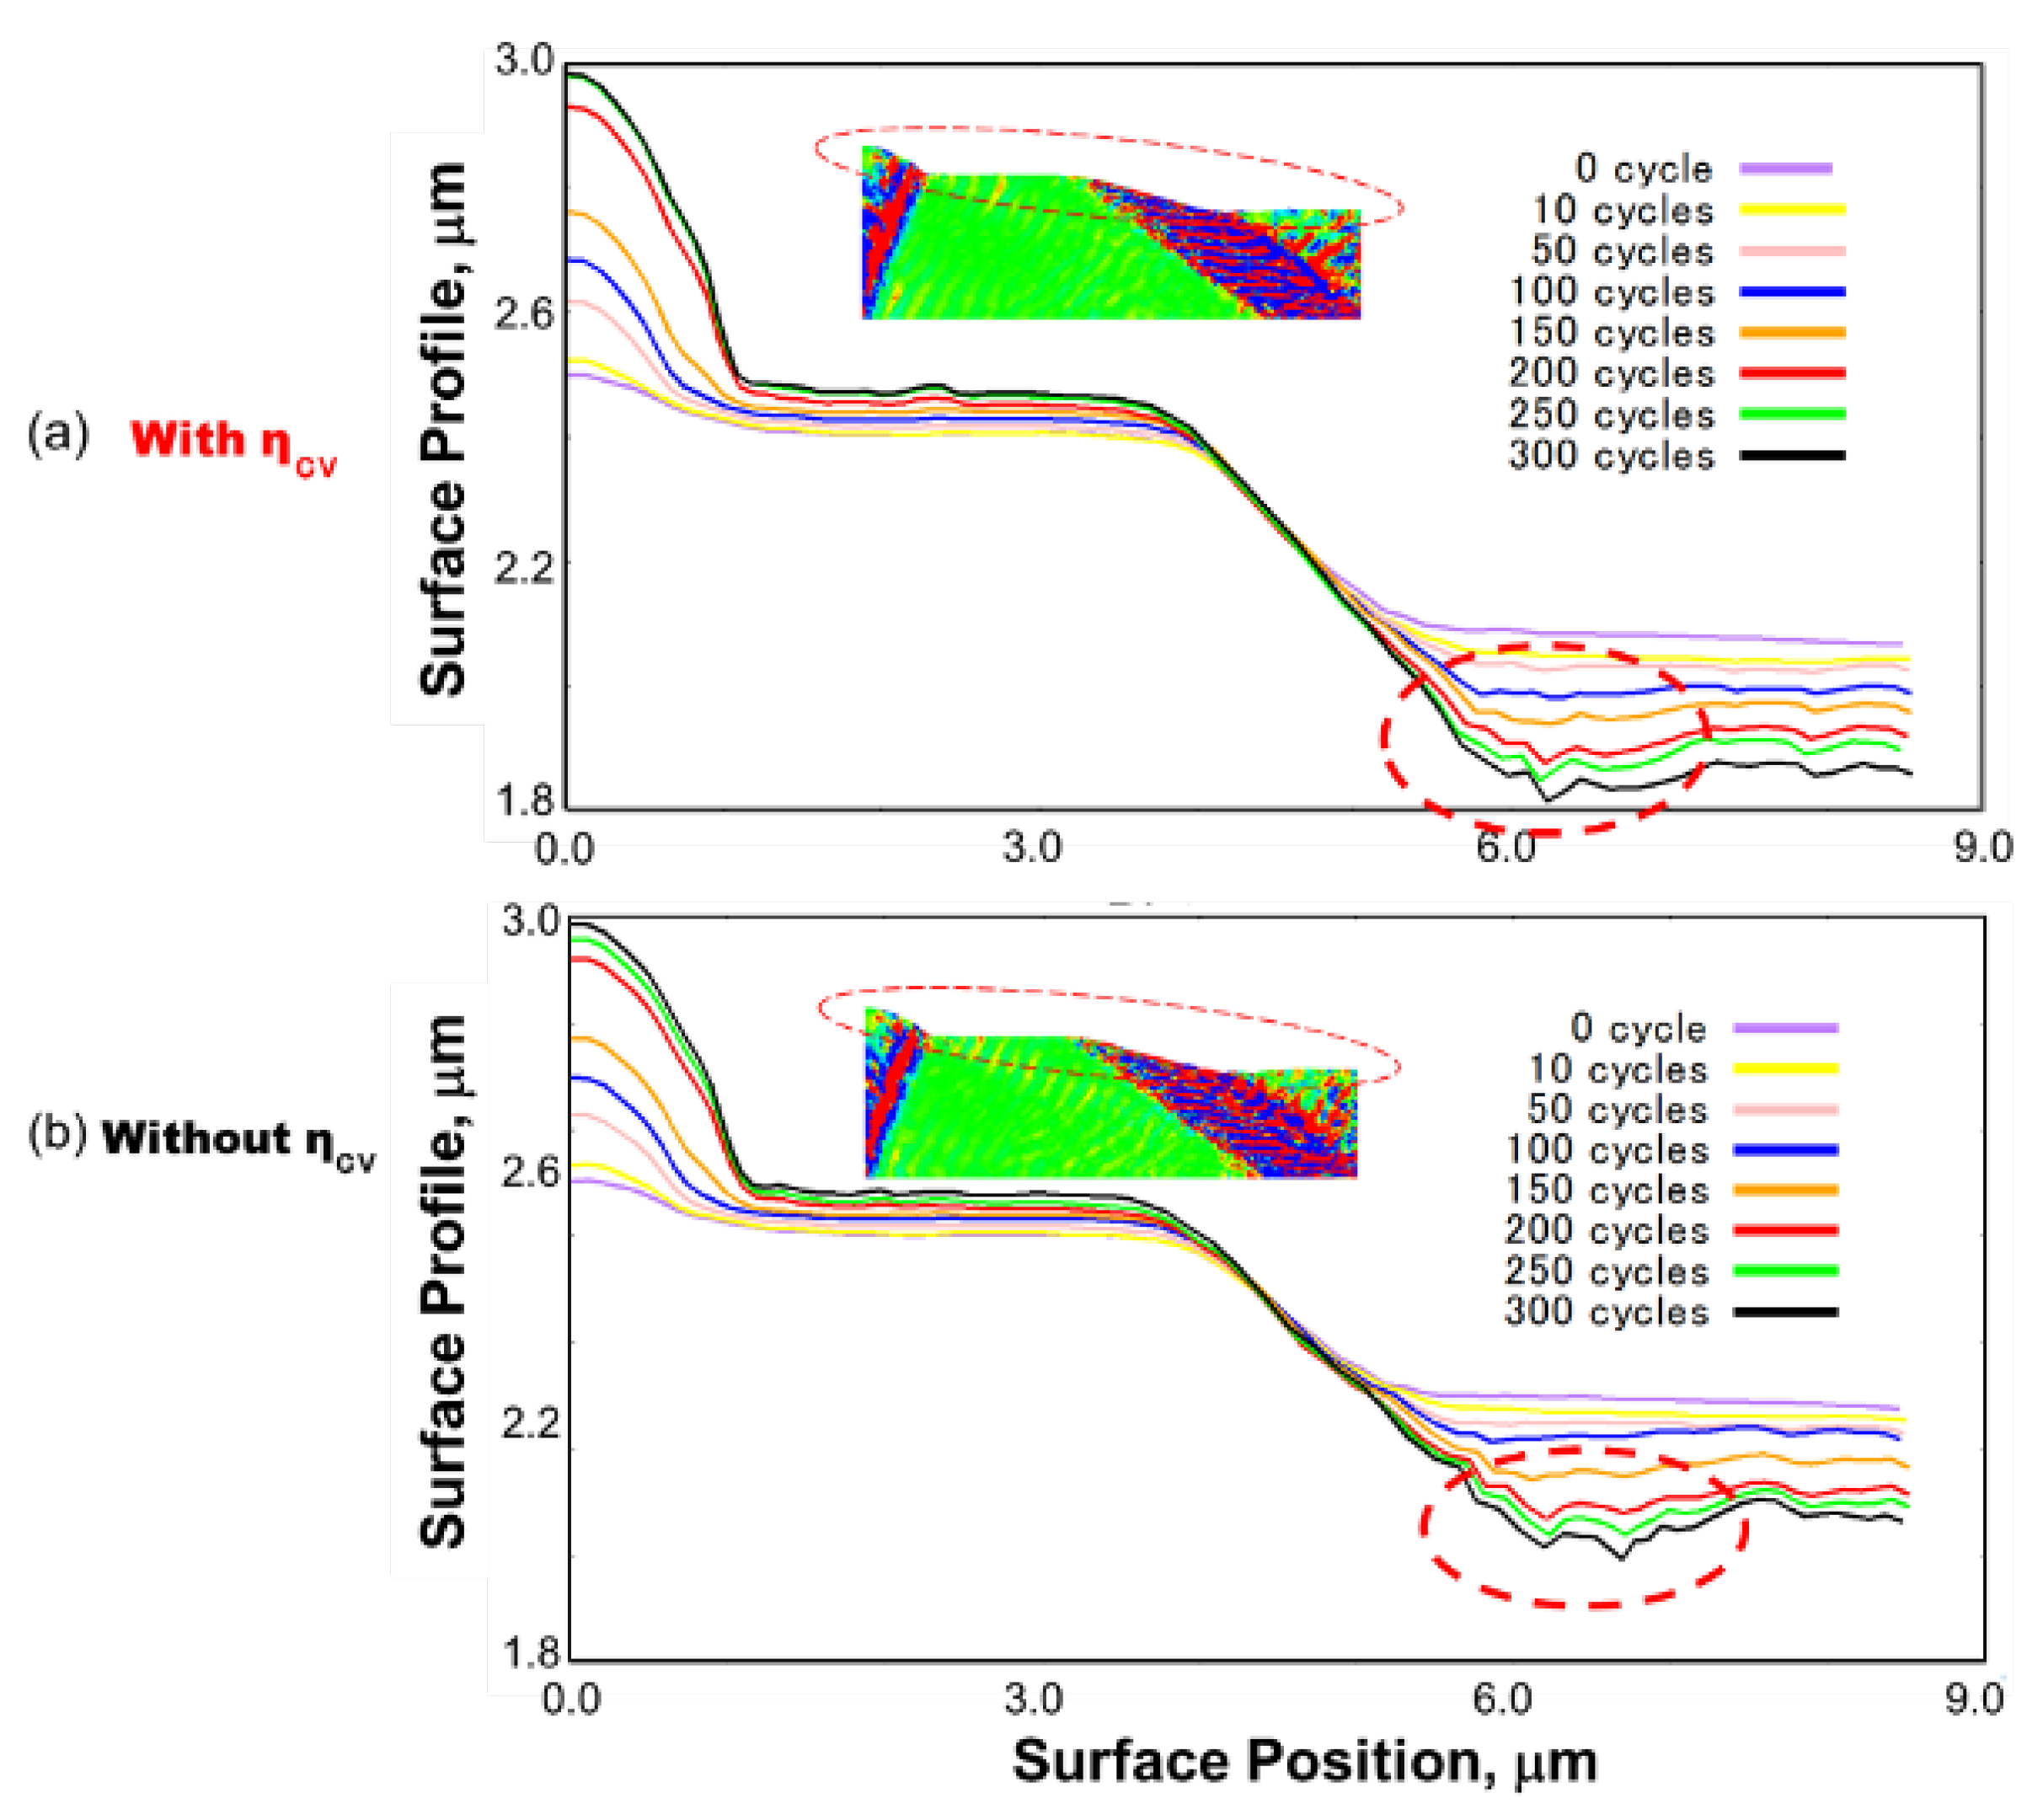
Figure 12 compares the evolution of surface profiles with and without the contribution of η c v . The inclusion of η c v leads to the formation of a single groove, whereas its absence results in a splitting of the groove peaks, becoming evident after 200 straining cycles. This behavior corresponds to the concentrated and diffused strain energy distributions seen in Figure 11.
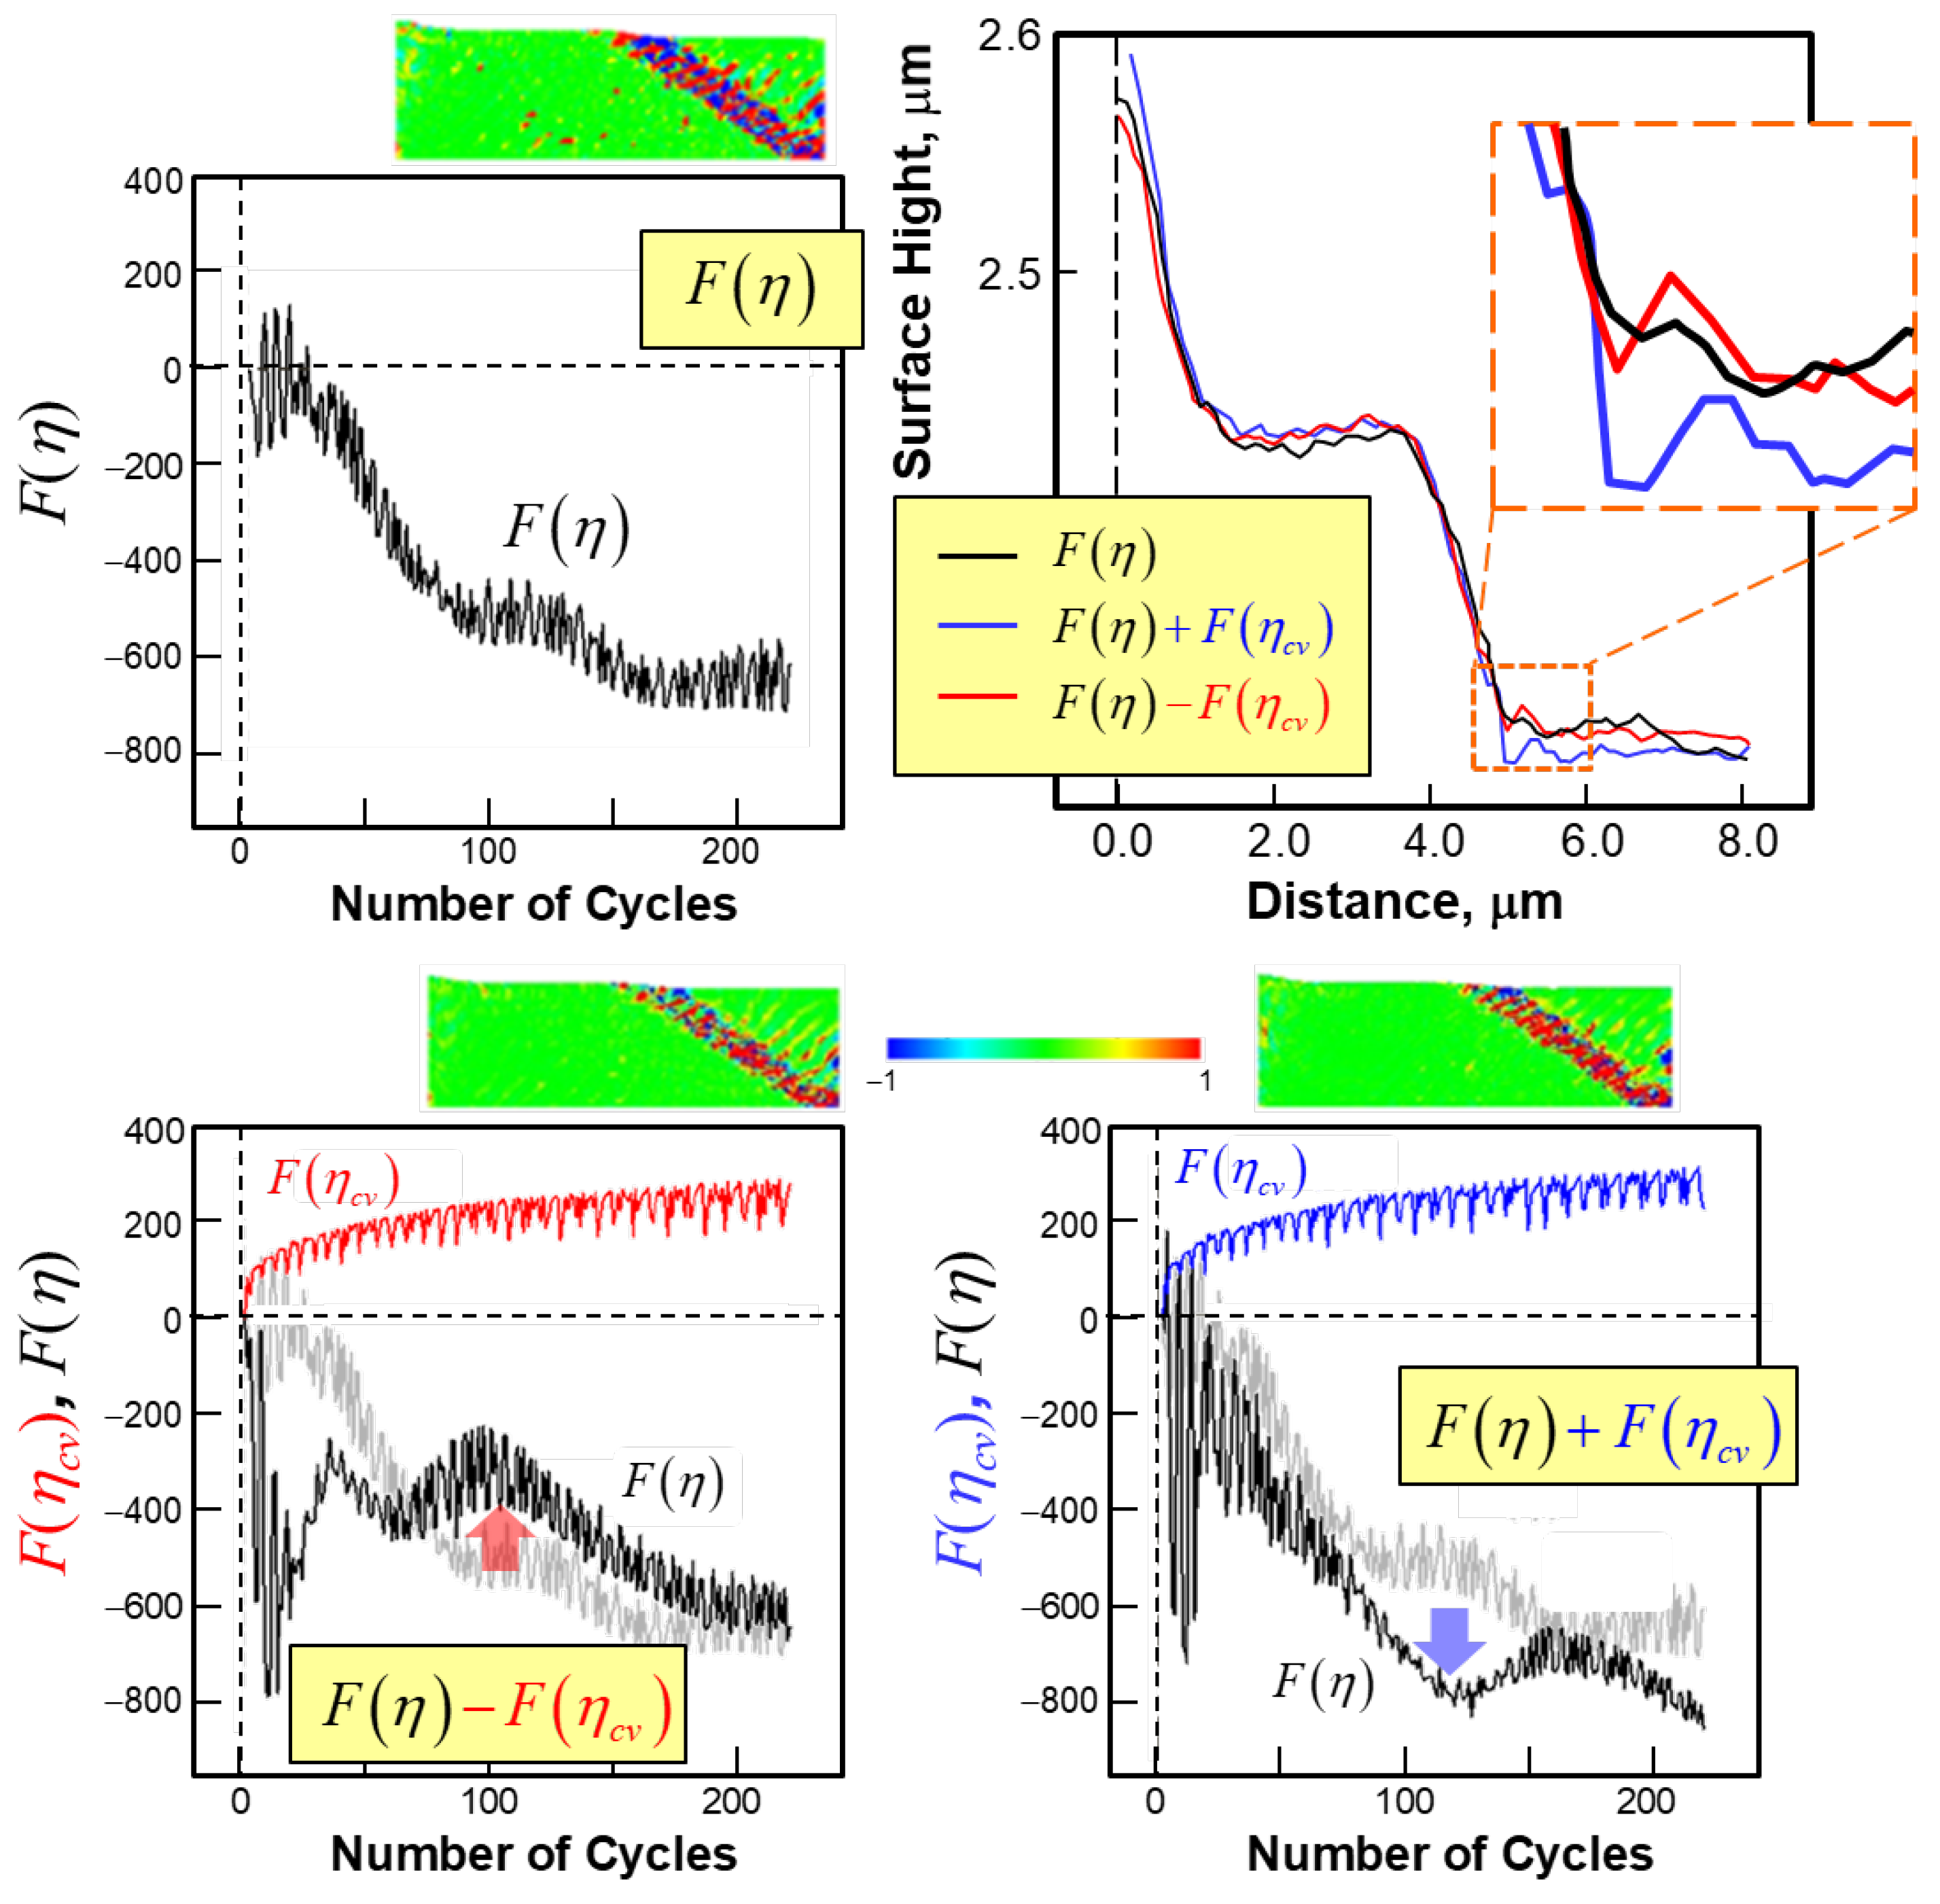
To further investigate the role of η c v in the final surface grooving, we examine the individual variations of the incompatibility terms, F ( η ) and F ( η c v ) , with respect to straining cycles in Figure 13. The term F ( η c v ) itself increases parabolically with the number of cycles while exhibiting periodic oscillations, simply reflecting the applied cyclic straining. Adding F ( η c v ) significantly increases the overall variation of F ( η ) in the negative direction (bottom right), while subtracting it leads to a mild decrease in the overall change (bottom left). This upward trend in F ( η ) enhances local deformation, resulting in a converging and sharpened groove, as confirmed by the final surface profile displayed at the top right of Figure 13.
These results clearly demonstrate that the addition of F ( η c v ) positively promotes grooving by significantly sharpening and deepening the groove profile, as anticipated. This ultimately leads to an accumulation of strain energy at the right edge of the PSB-sample surface intersection, whereas, in the absence of this term, the elastic strain energy tends to diffuse. We will utilize the final surface profile (b) for restart analyses to be conducted in Part II of the present study.

5.5. Discussion and Future Scope

In this study, we have successfully demonstrated that the FTMP-incorporated CP-FEM simulation can effectively reproduce the empirically observed laddered morphology and the PSB. Moreover, this simulation adeptly captures the dynamics of surface roughening and the eventual formation of grooves, even in the absence of vacancy formation and diffusion. These findings underscore the significance of the incompatibility tensor-based underlying degrees of freedom, which possess a remarkable capability to reproduce dislocation substructures—features that are often lacking in conventional CP-FEM approaches. This advancement not only helps enhance our understanding of PSB laddered patterning but also opens new avenues for further exploring the complex interplay of microstructural features that dictate the eventual crack initiation process, as will be extended in Part II.
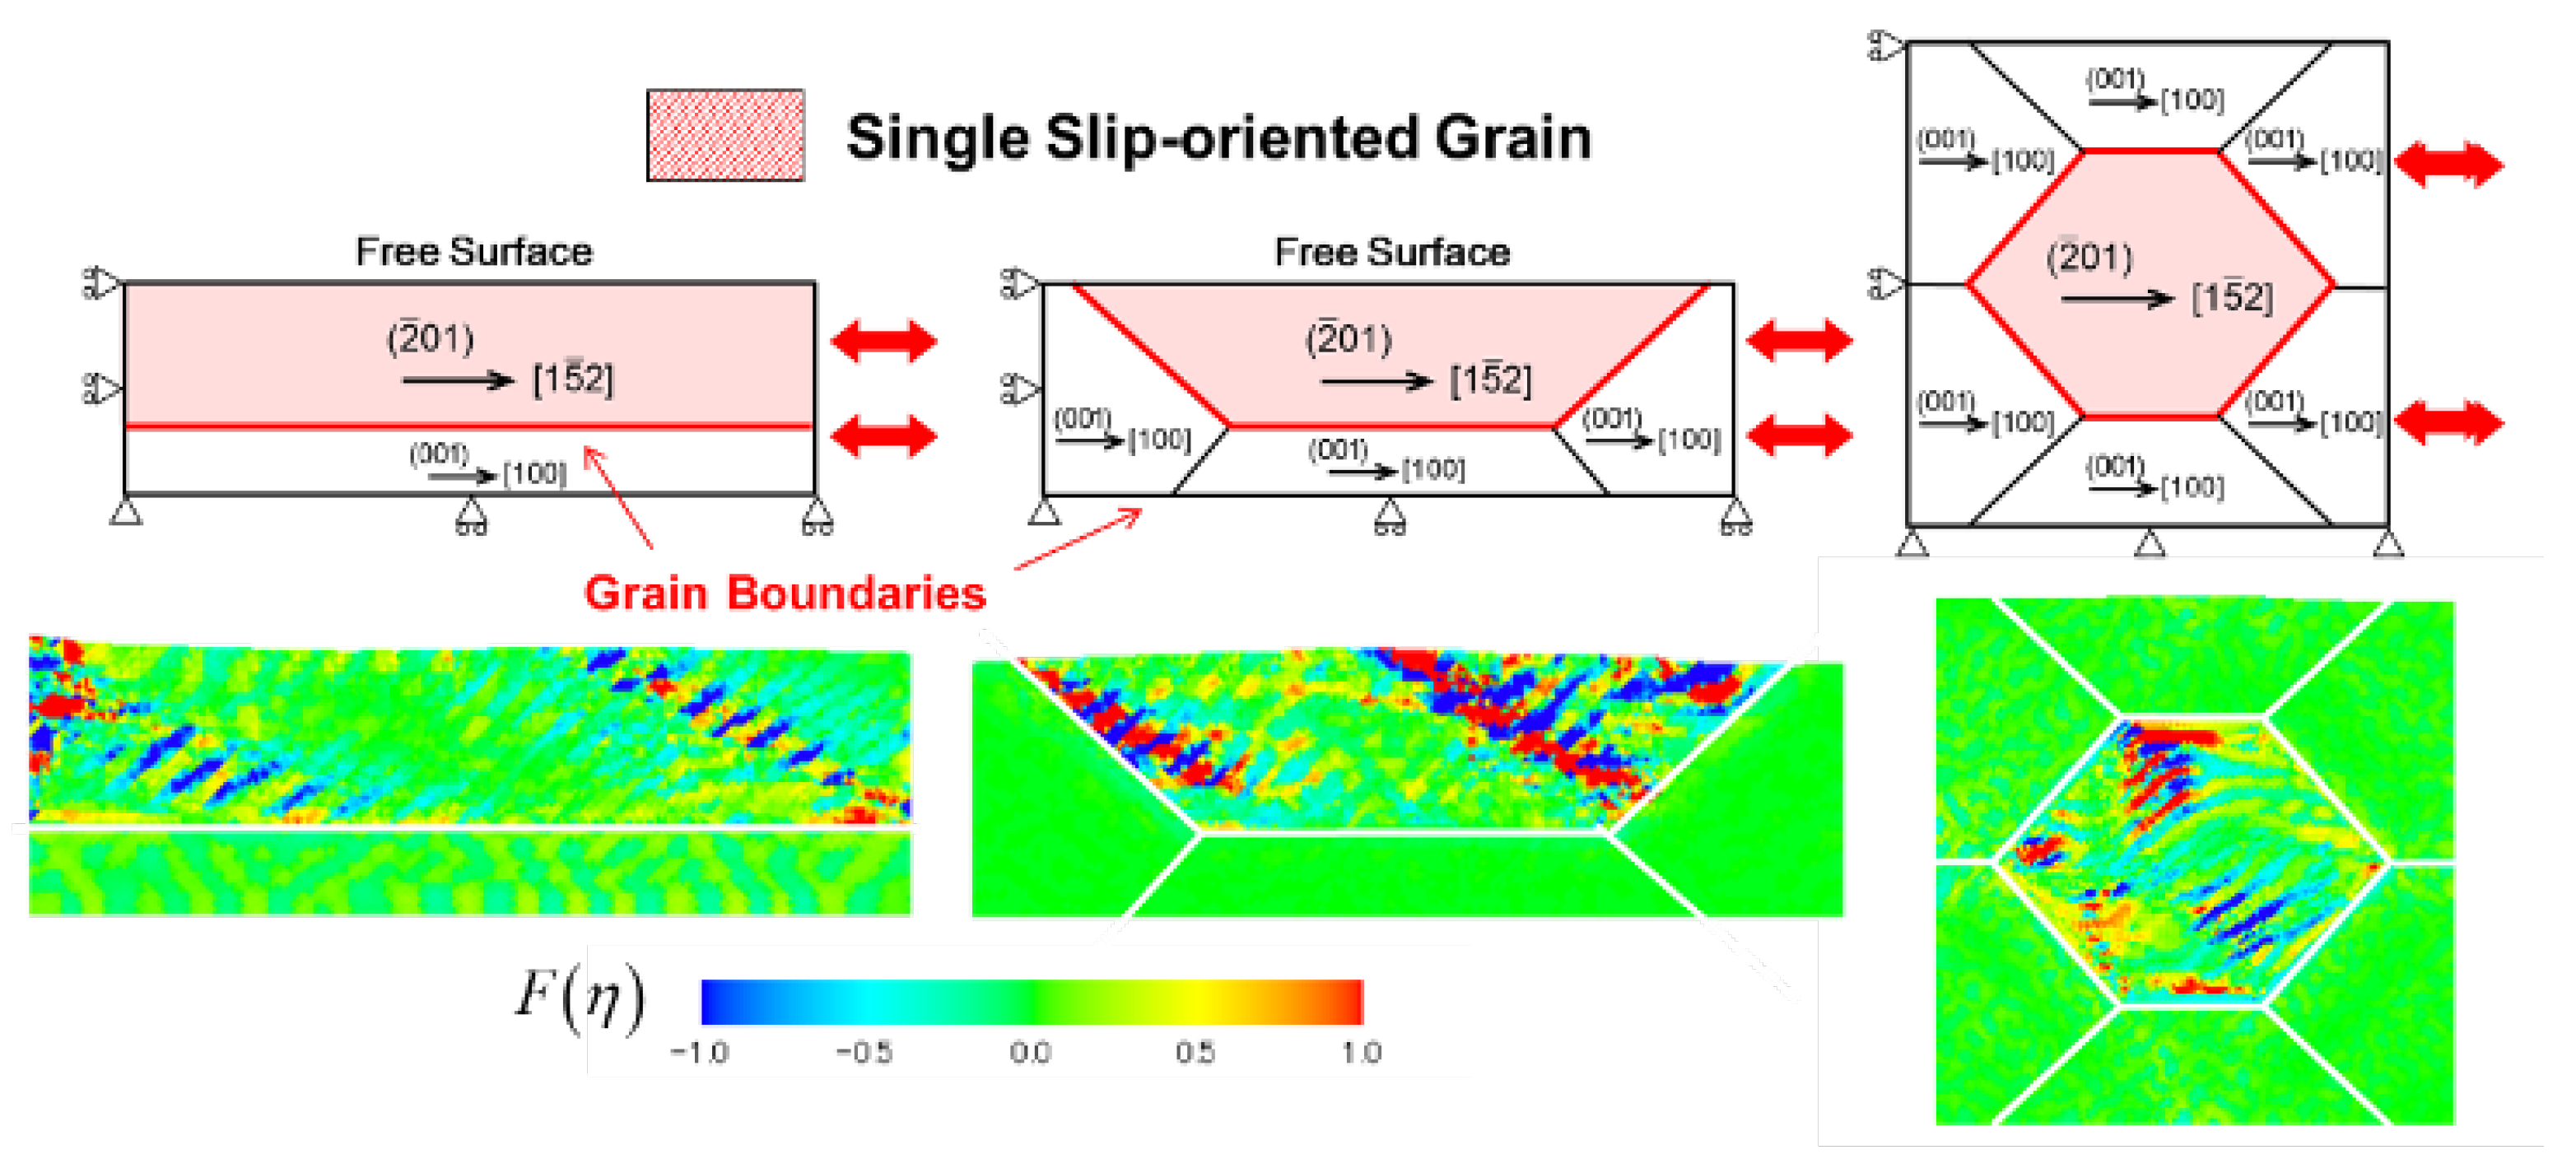
The current simulation can be seamlessly extended to multi-grain scenarios, as demonstrated in Figure 14. This figure showcases three preliminary examples featuring single slip-oriented grains located in (a) the upper half, (b) the surface-facing grain, and (c) the central grain. In each case, we observe similar PSB-ladder formations exclusively in the single-slip oriented grain as observed previously, which intriguingly terminate at the grain boundaries. These results underscore the potential for expanding the present study to polycrystalline simulations, highlighting the versatility and applicability of our approach.

6. Conclusion

In this study, we first demonstrate that PSB ladder substructuring during cyclic straining can be effectively reproduced through simple deformation analyses, showcasing the predictive capability of the FTMP framework. Notably, this achievement does not require any ad hoc models, intricate mathematical formulations, or elaborate finite element discretization. This reinforces our confidence in the practical feasibility of computational modeling for fatigue crack initiation processes and supports our advancement to the next stage of research without relying on complex modeling approaches.
Furthermore, the FTMP-incorporated CP-FEM simulation not only replicates the empirically observed laddered morphology and PSB with satisfactory accuracy, but also adeptly simulates surface roughening and eventual grooving—independent of vacancy formation and diffusion. This highlights the crucial role of laddered morphology in these processes and lays the groundwork for further investigations into the effects of vacancy formation through explicit diffusion analyses in Part II. These advancements stem from the incompatibility tensor-based underlying degrees of freedom, which offer exceptional capabilities in modeling dislocation substructures often overlooked by conventional CP-FEM approaches. Thus, the robustness of the FTMP framework is validated, positioning it as a transformative tool in materials science and paving the way for deeper insights into slip band-fatigue crack transition.

Appendix A1

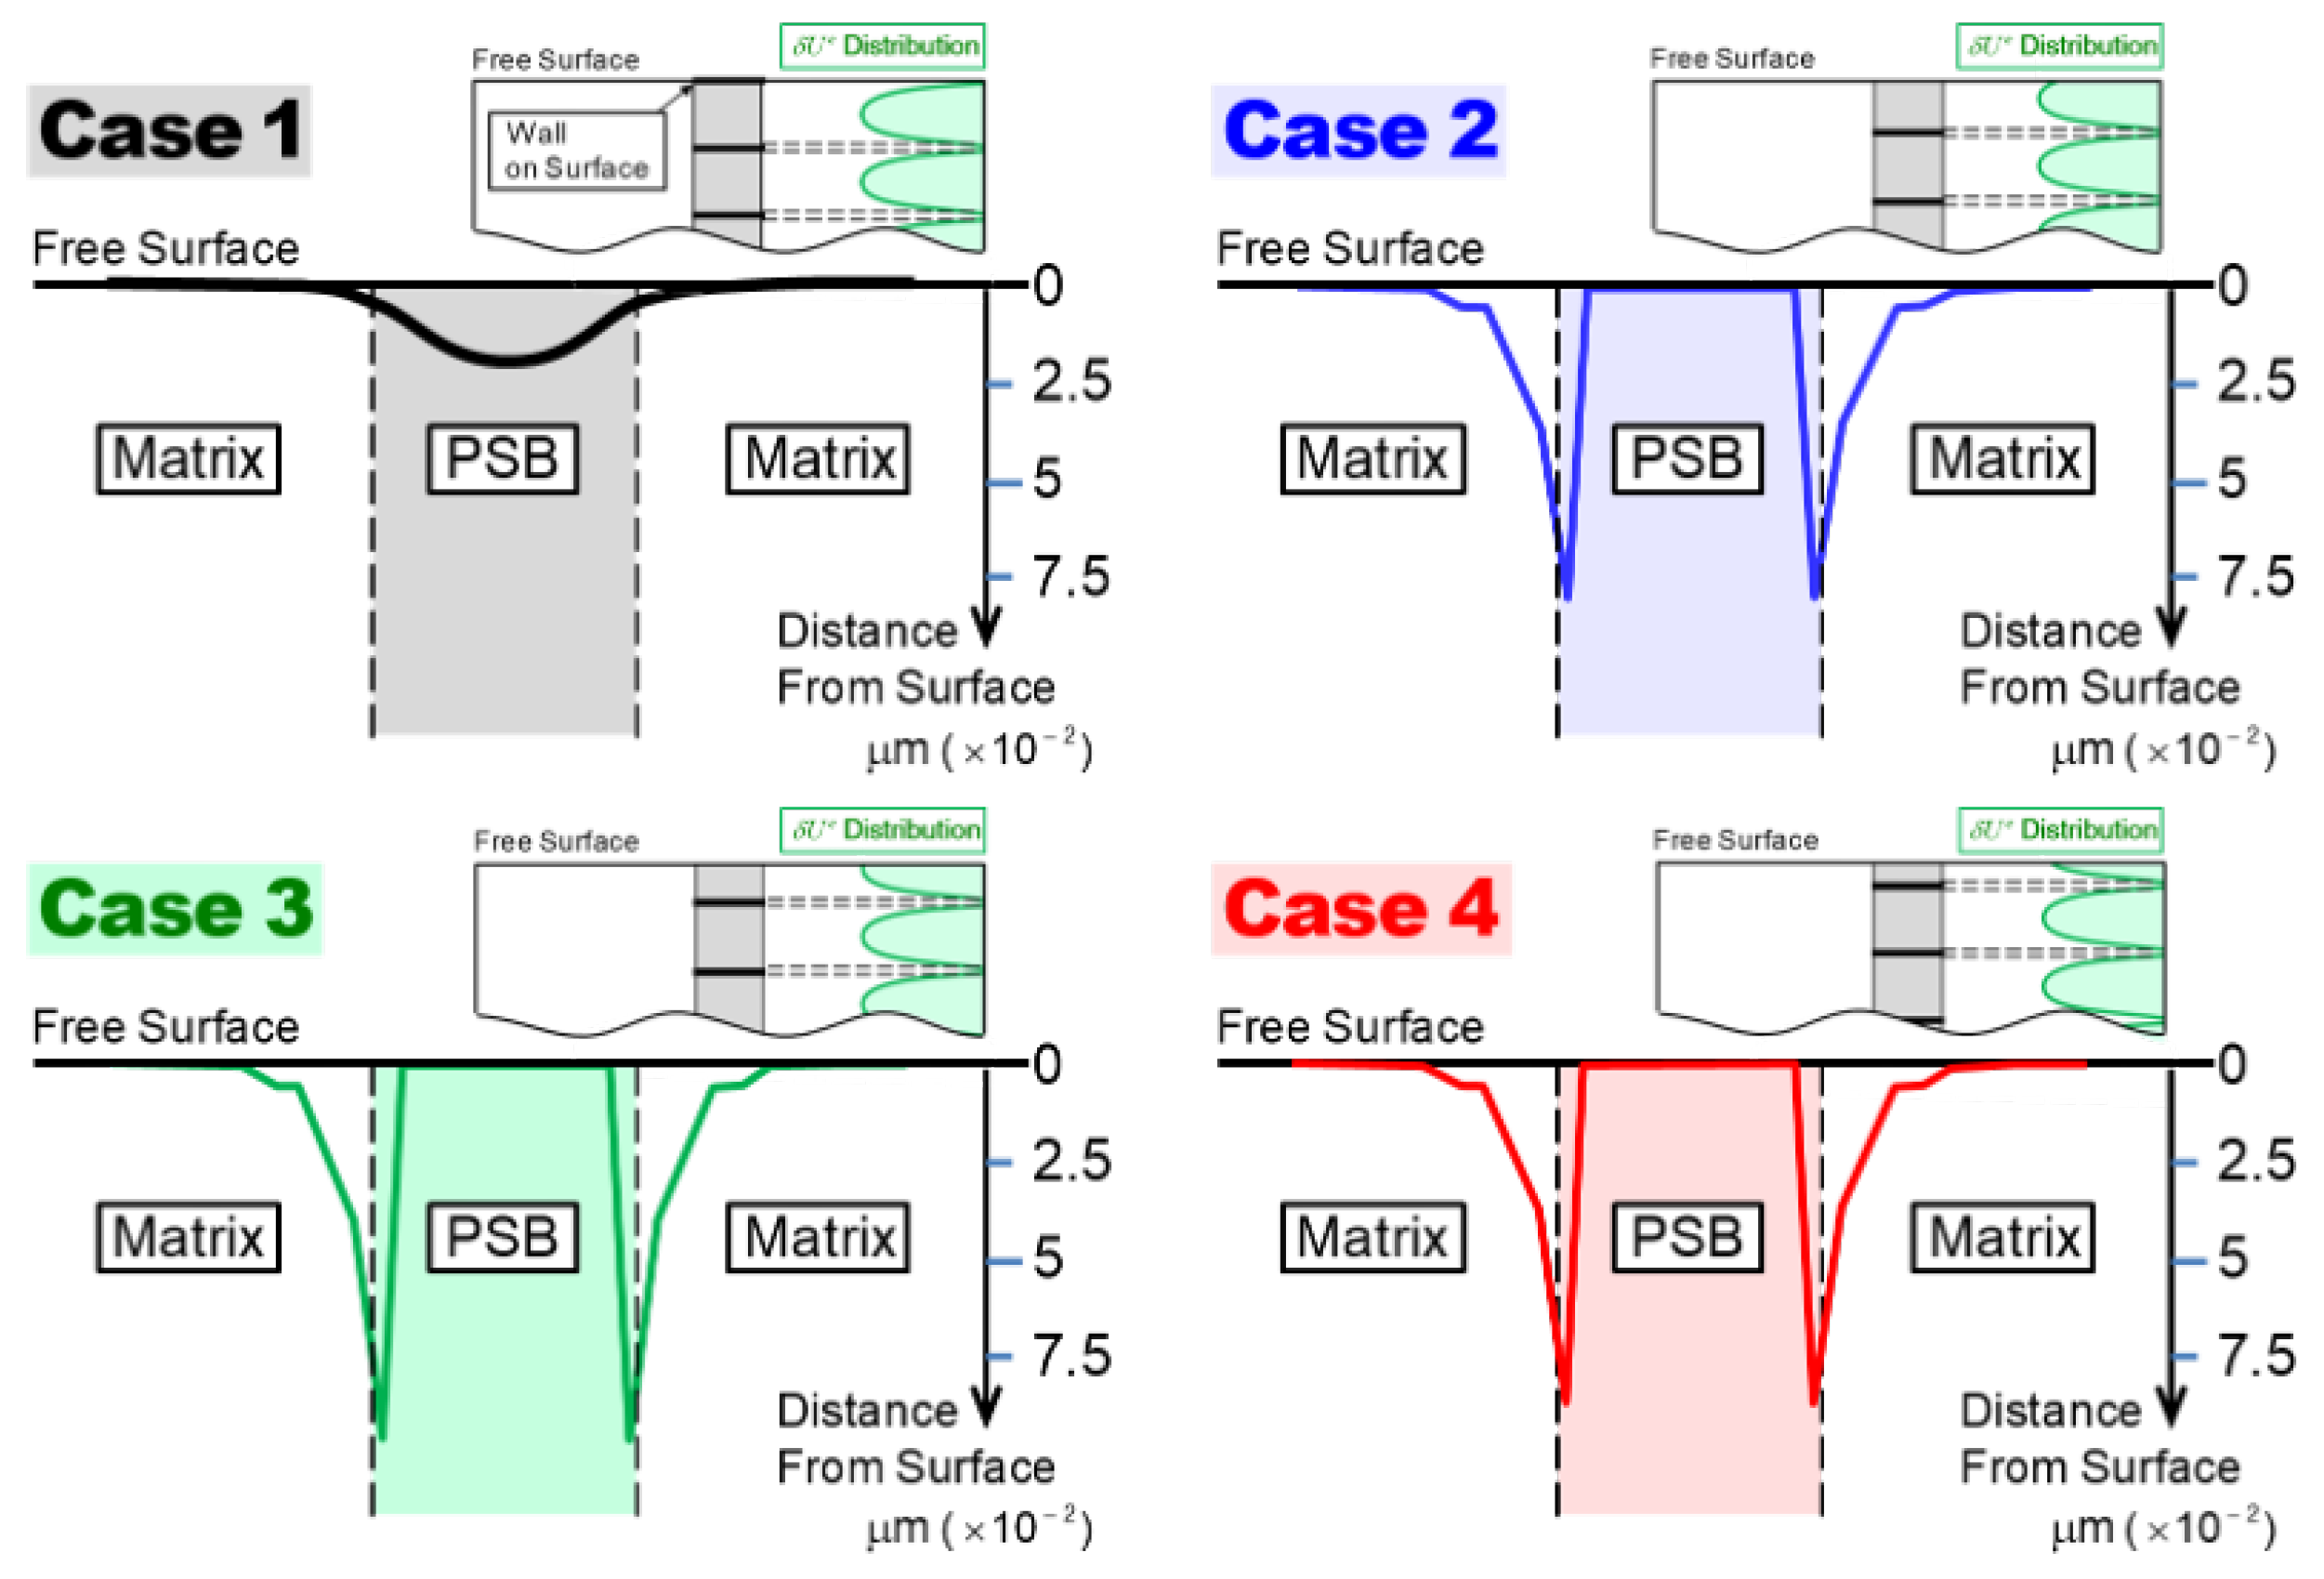
At the preparatory stage, we conducted pure diffusion analyses, assuming a PSB-laddered strain energy distribution a priori, to examine the effects of laddered morphology on vacancy diffusion and the resulting surface recession, including the wall position relative to the sample surface. This was achieved by solving the diffusion equation employed by Repetto and Ortiz [27] using the finite difference method (FDM). The analytical model and the key results are summarized in Figure A1 and Figure A2. The initial vacancy concentration is assumed to be uniformly distributed across the sample, with an equilibrium value of c v e q = exp ( Δ G v / k T ) . Here, Δ G v represents the free energy change per vacancy, approximately 0.9eV for α -Fe at room temperature, while k, T are Boltzmann constant and absolute temperature, respectively. The model considers only the contribution of lattice diffusion, represented by Dlattice =1.5 × 10⁻¹⁵m2/s, while neglecting pipe diffusion. The findings are as follows:
(i)
Insensitivity to the wall position.
(ii)
Wherever vacancies are generated—whether in the channel or wall regions—they first flow into the wall, then out of the wall edges into the PSB-matrix interface, subsequently diffusing toward the surface along that interface.
(iii)
Ladder walls play a critical role in developing and enhancing surface grooving; without them, surface recession does not occur.
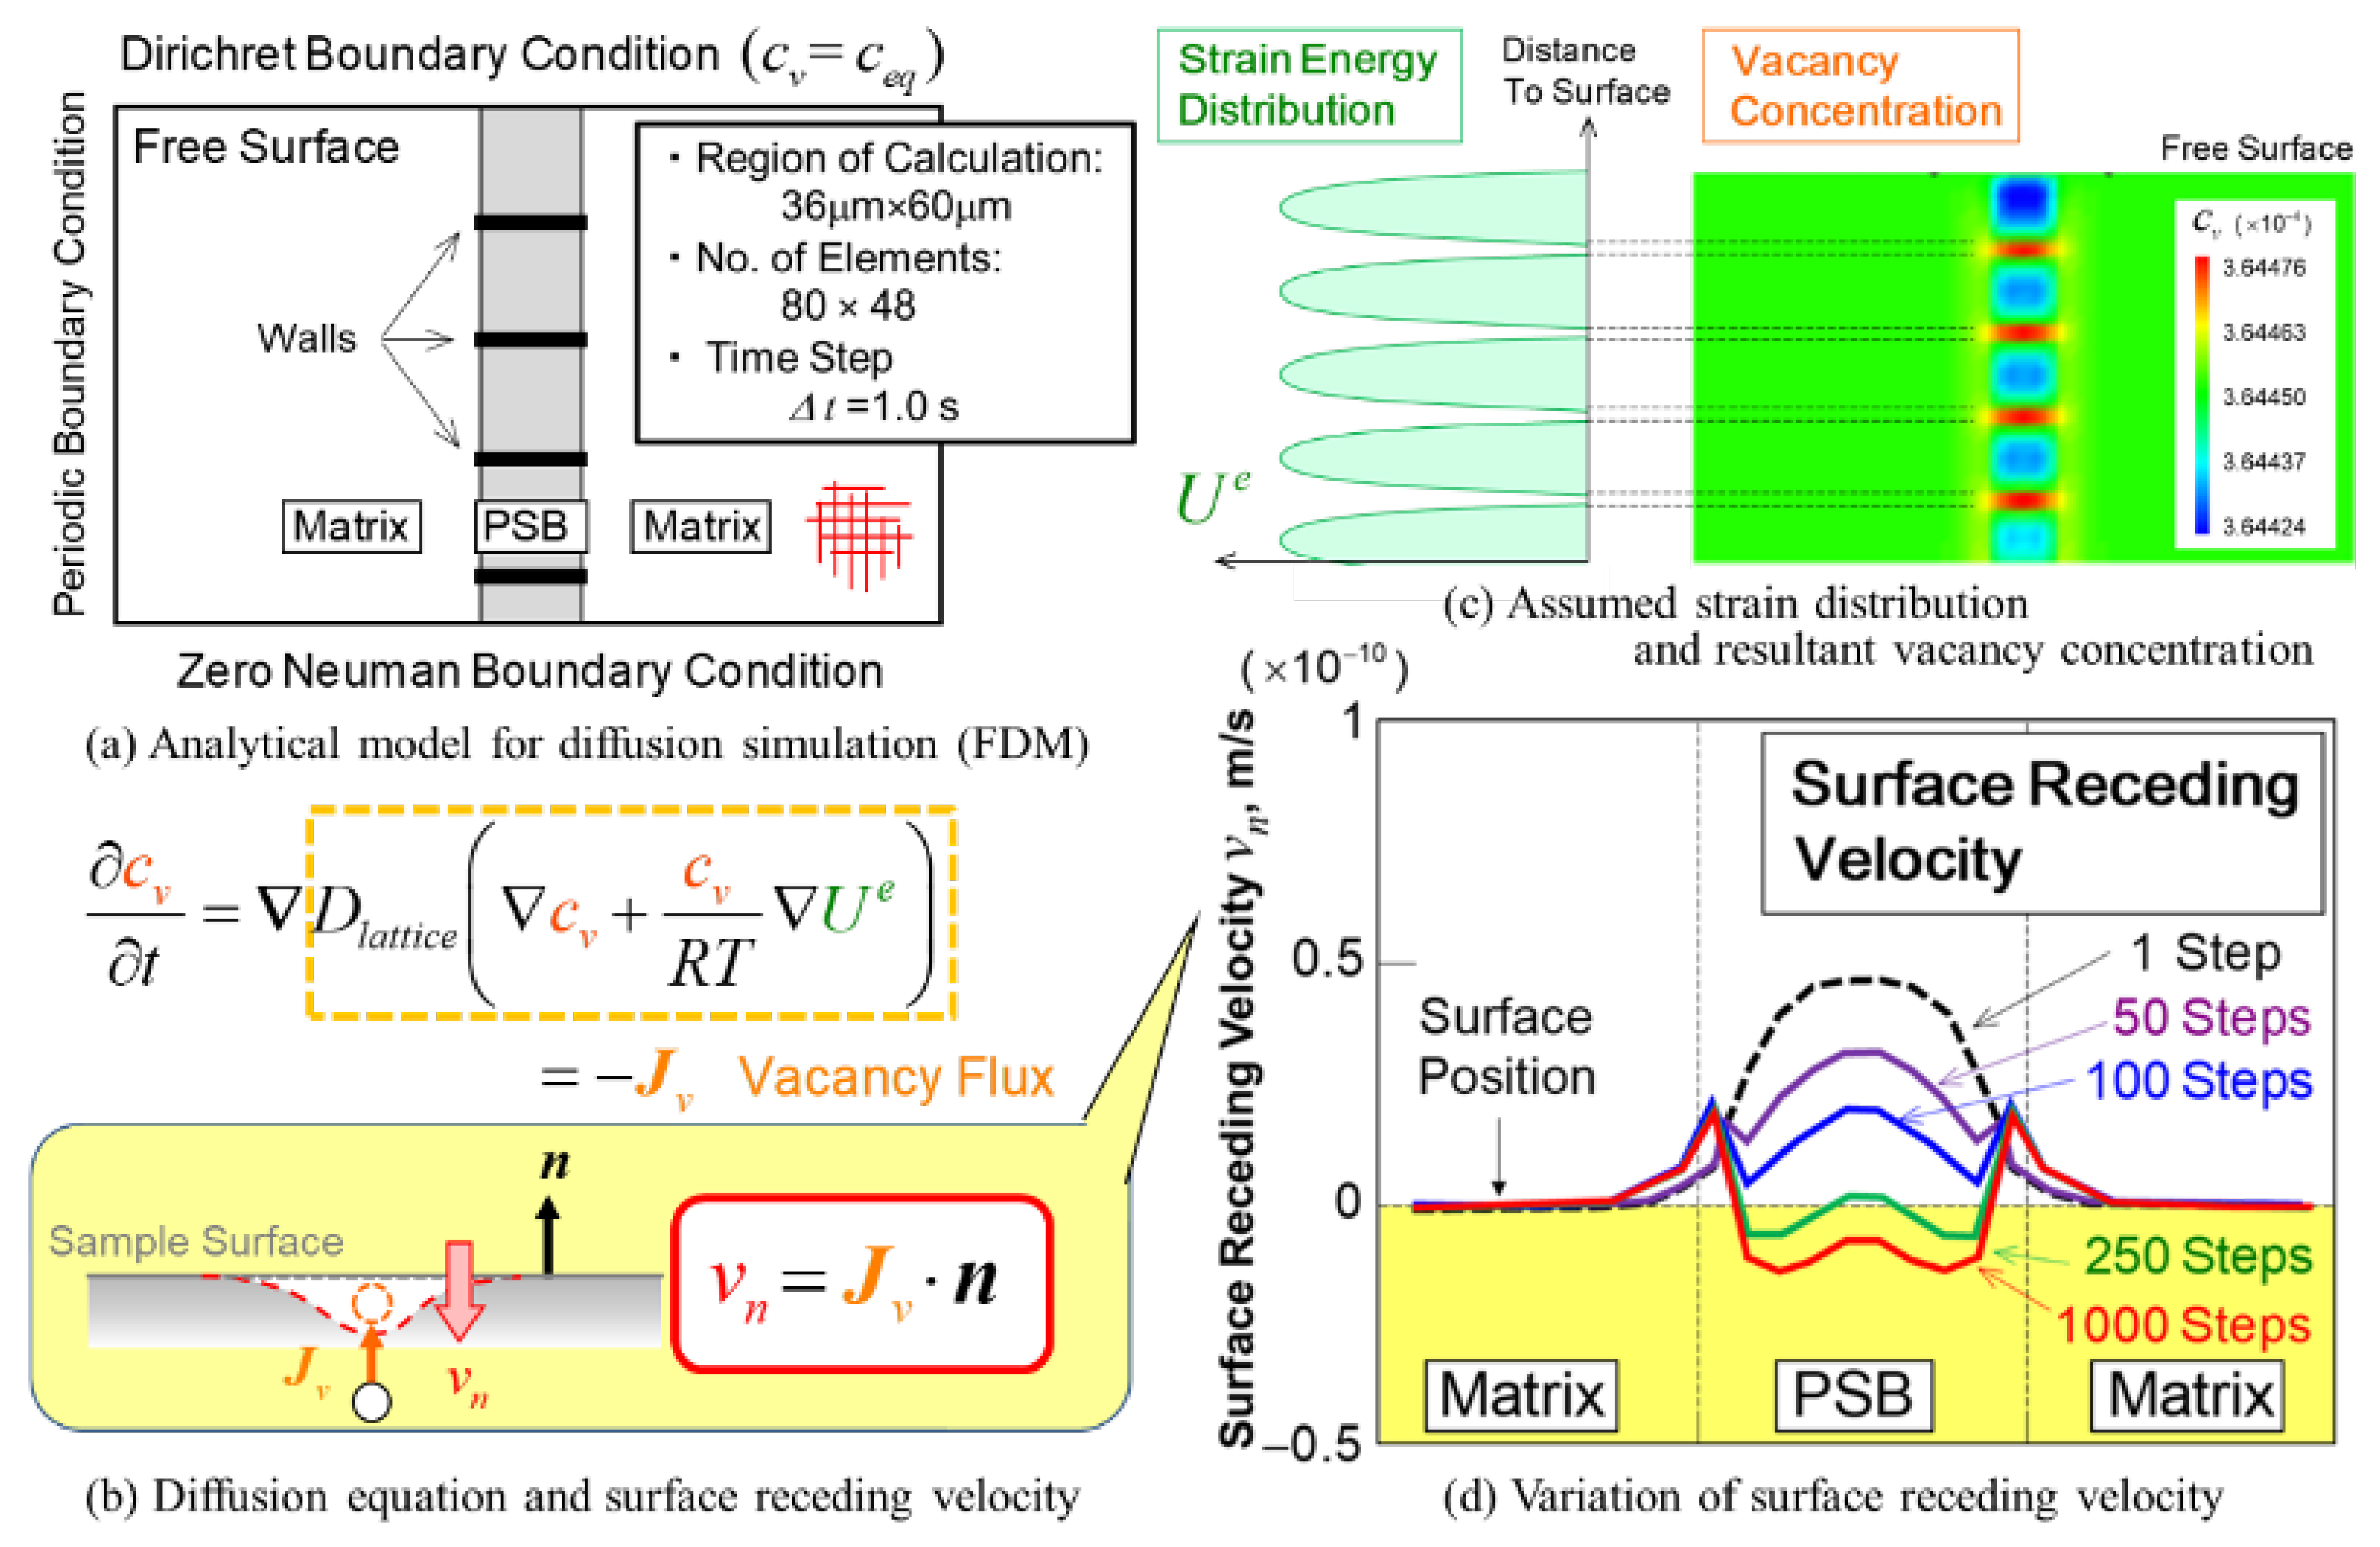
Figure A1. Overview of preparatory diffusion analyses using the finite difference method (FDM): (a) analytical model assuming a priori the ladder walls defined by elastic strain energy distribution (c), (b) diffusion equation employed, and (d) resultant surface receding velocity distribution via vacancy flux indicated in (b).
Preprints 119965 g0a1
Figure A2. Simulated surface profiles at t =1,000 simulation steps, comparing the effect of ladder wall position relative to the sample surface for Cases 1 through 4.
Preprints 119965 g0a2

References

  1. Thompson. N.; Wadsworth. N.J.; Louat. N. The Origin of Fatigue Fracture in Copper. Philos. Mag. 1956, 1, 113–26. [Google Scholar] [CrossRef]
  2. Woods. P.J. Low-amplitude Fatigue of Copper and Copper-5 at. % Aluminium Single Crystals. Philos. Mag. 1973, 28, 155–91. [Google Scholar] [CrossRef]
  3. Polák, J. On the Role of Point Defects in Fatigue Crack Initiation. Mater. Sci. 1987, 92, 71–80. [Google Scholar] [CrossRef]
  4. Polák, J.; Petrenec, M.; Man, J. Dislocation Structure and Surface Relief in Fatigued Metals. Mater. Sci. A 2005, 400–401, 405–408. [Google Scholar] [CrossRef]
  5. Polák, J. Production, Annihilation and Migration of Point Defects in Cyclic Straining. Materialia 2020, 14, 100938. [Google Scholar] [CrossRef]
  6. Polák, J. Role of Persistent Slip Bands and Persistent Slip Markings in Fatigue Crack Initiation in Polycrystals. Crystals 2023, 13, 220. [Google Scholar] [CrossRef]
  7. Essmann, U.; Mughrabi, H. Annihilation of Dislocations during Tensile and Cyclic Deformation and Limits of Dislocation Densities. Philo. Mag. A 1979, 40, 731–756. [Google Scholar] [CrossRef]
  8. Essmann, U. Irreversibility of cyclic slip in persistent slip bands of fatigued pure f.c.c. metals. Philo. Mag. A 1982, 45, 171–190. [Google Scholar] [CrossRef]
  9. Jones, W. J. D.; Dover, W. D. Enhanced Diffusion Rates during the Fatigue of Metals. Nature 1966, 209, 704–704. [Google Scholar] [CrossRef]
  10. Robergre, R.; Herman, H. Fatigue—Generation of Vacancies. Nature 1966, 211, 178–179. [Google Scholar] [CrossRef]
  11. Mughrabi, H. Dislocation Wall and Cell Structures and Long-Range Internal Stresses in Deformed Metal Crystals. Acta Metall. 1983, 31, 1367–1379. [Google Scholar] [CrossRef]
  12. Mughrabi, H.; Ungar, T.; Kienle, W.; Wilkens, M. Long-Range Internal Stress and Asymmetric X-Ray Line Broadening in Tensile Deformed [001]-Oriented Copper Single Crystals. Phil. Mag. A 1986, 53, 793–813. [Google Scholar] [CrossRef]
  13. Mughrabi, H.; Ackerman, F.; Herz, K. Persistent Slip Bands in Fatigued Face-Centered and Body-Centered Cubic Metals. in Fatigue Mechanics, Special Technical Publication 675 (ed. Long, J.), pp. 1979. [Google Scholar] [CrossRef]
  14. Bao-Tong, M.; Laird, C. Overview of Fatigue Behavior in Copper Single Crystals—I. Surface Morphology and Stage I Crack Initiation Sites for Tests at Constant Strain Amplitude. Acta Metall. 1989, 37, 325–336. [Google Scholar] [CrossRef]
  15. Essmann. U.; Gosele U.; Mughrabi H. A Model of Extrusions and Intrusions in Fatigued Metals. Philos. Mag. A 1981, 44, 405–426. [Google Scholar] [CrossRef]
  16. Suresh, S. Fatigue of Materials, 2nd ed.; Cambridge University Press, Cambridge, UK 1998; pp.53-68. [CrossRef]
  17. Bretschneider, J.; Holste, C.; Kleinert, W. Mechanical Behaviour and Development of Dislocation Arrangements of f.c.c. Single Crystals Fatigued at 77 K. MSEA 1995, 191, 61–72. [Google Scholar] [CrossRef]
  18. Li, P.; Li, S. X.; Wang, Z. G.; Zhang, Z. F. Fundamental Factors on Formation Mechanism of Dislocation Arrangements in Cyclically Deformed Fcc Single Crystals. Prog. Mater. Sci. 2011, 56, 328–377. [Google Scholar] [CrossRef]
  19. Ghoniem, N. M.; Walgraef, D. Instabilities and Self-Organization in Materials: Part I. Fundamentals. ibid Part II: Applications. Oxford University Press, 2008.
  20. Walgraef, D.; Aifantis, E. C. Dislocation Patterning in Fatigued Metals as a Result of Dynamical Instabilities. J. Appl. Phys. 1985, 58, 688–691. [Google Scholar] [CrossRef]
  21. Ghoniem, N. M.; Tong, S.-H.; Sun, L. Z. Parametric Dislocation Dynamics: A Thermodynamics-Based Approach to Investigations of Mesoscopic Plastic Deformation. Phys. Rev. 1999, B61, 913–927. [Google Scholar] [CrossRef]
  22. Kubin, L.; Sauzay, M. Persistent slip bands: the bowing and passing model revisited. Acta Mater. 2017, 132, 517–524. [Google Scholar] [CrossRef]
  23. Kubin, L.; Sauzay, M. Persistent slip bands: similitude and its consequences. Acta Mater. 2016, 104, 295–302. [Google Scholar] [CrossRef]
  24. Dodaran, M.; Khonsari, M. M.; Shao, S. Critical operating stress of persistent slip bands in Cu. Comput. Mater. Sci. 2019, 165, 114–120. [Google Scholar] [CrossRef]
  25. Brown, L.M. Dislocation bowing and passing in persistent slip bands. Philos. Mag. 2006, 86, 4055–4068. [Google Scholar] [CrossRef]
  26. El-Awady, J. A.; Ghoniem, N. M.; Mughrabi, H. Dislocation modelling of localized plasticity in persistent slip bands. TMS 2007, 23-35. Dislocation modelling of localized plasticity in persistent slip bands (researchgate.net).
  27. Repetto, E.; Ortiz, M. A Micromechanical Model of Cyclic Deformation and Fatigue-Crack Nucleation in f.c.c. Single Crystals. Acta Mater. 1997, 45, 2577–2595. [Google Scholar] [CrossRef]
  28. Nakai, Y. Evaluation of Fatigue Damage and Fatigue Crack Initiation Process by Means of Atomic-Force Microscopy. J. Soc. Mater. Sci. Jpn. 2001, 50, 73–81. [Google Scholar] [CrossRef] [PubMed]
  29. Nakai, Y.; Kusukawa, T. Quantitative Evaluation of Slip-Band Growth and Crack Initiation in Fatigue of 70-30 Brass by Means of Atomic-Force Microscopy. Trans. Jpn. Soc. Mech. Eng. 2001, 67, 476–482. [Google Scholar] [CrossRef]
  30. Nakai, Y.; Maeda, K. Observations of fatigue Slip-Band Growth and Crack Initiation in α-Brass under Cyclic Shear Stresses by Means of Atomic-Force Microscopy. J. Mater. Sci. Soc. Jpn. 2003, 52, 625–630. [Google Scholar] [CrossRef]
  31. Hasebe, T. Interaction Fields Based on Incompatibility Tensor in Field Theory of Plasticity-Part I: Theory. IMMIJ 2009, 2, 1–14. [Google Scholar] [CrossRef]
  32. Hasebe, T. Interaction Fields Based on Incompatibility Tensor in Field Theory of Plasticity-Part II: Application. IMMIJ 2009, 2, 15–30. [Google Scholar] [CrossRef]
  33. Hasebe, T.; Sugiyama, M.; Adachi, H.; Fukutani, S.; Iida, M. Modeling and Simulations of Experimentally-Observed Dislocation Substructures Based on Field Theory of Multiscale Plasticity (FTMP) Combined with TEM and EBSD-Wilkinson Method for FCC and BCC Poly/Single Crystals. Mater. Trans. 2014, 55, 779–787. [Google Scholar] [CrossRef]
  34. Hasebe, T. Field Theoretical Multiscale Modeling of Polycrystal Plasticity. Trans. MRS-J 2004, 29, 3619–3624. [Google Scholar]
  35. Hasebe, T. Multiscale Crystal Plasticity Modeling based on Field Theory. CMES 2006, 11, 145–156. [Google Scholar] [CrossRef]
  36. Yokoi, T.; Takahashi, M.; Maruyama, N.; Sugiyama, M. Application of Controlled Cu Nano-Precipitation for Improvement in Fatigue Properties of Steels. Nippon Steel Tech. Rep. 2005, 91, 49–55. [Google Scholar]
  37. Yokoi, T.; Takahshi, M.; Maruyama, N.; Sugiyama, M. Cyclic Stress Response and Fatigue Behavior of Cu Added Ferritic Steels. J. Maters. Sci. 2001, 36, 5757–5765. [Google Scholar] [CrossRef]
  38. Chen, Z.; Kioussis, N.; Ghoniem, N.; Hasebe, T. Lubricant Effect of Copper Nanoclusters on the Dislocation Core in α − Fe. Phys. Rev. B 2008, 77, 014103. [Google Scholar] [CrossRef]
  39. Kondo, K. Non-Riemannian Geometry of Imperfect Crystals from a Macroscopic Viewpoint RRAG Memoirs, 1 D-I, 458–469. Published online by Cambridge University Press, 1955.
  40. Kondo, K. RAAG Memoirs of Unifying Study of Basic Problems in Engineering and Physical Science by Means of Geometry, Gakujutsu Bunken Fukyu-kai, 1960.
  41. Ashby, B. F. The Deformation of Plastically Non-Homogeneous Materials. Philos. Mag. 1970, 21, 399–424. [Google Scholar] [CrossRef]
  42. Khan, A. S. and Huang, S. Continuum Theory of Plasticity, Wiley Interscience, 1995.
  43. Nemat-Nasser, S. Plasticity, A Treatise on Finite Deformation of Heterogeneous Inelastic Materials, Cambridge University Press, 2004.
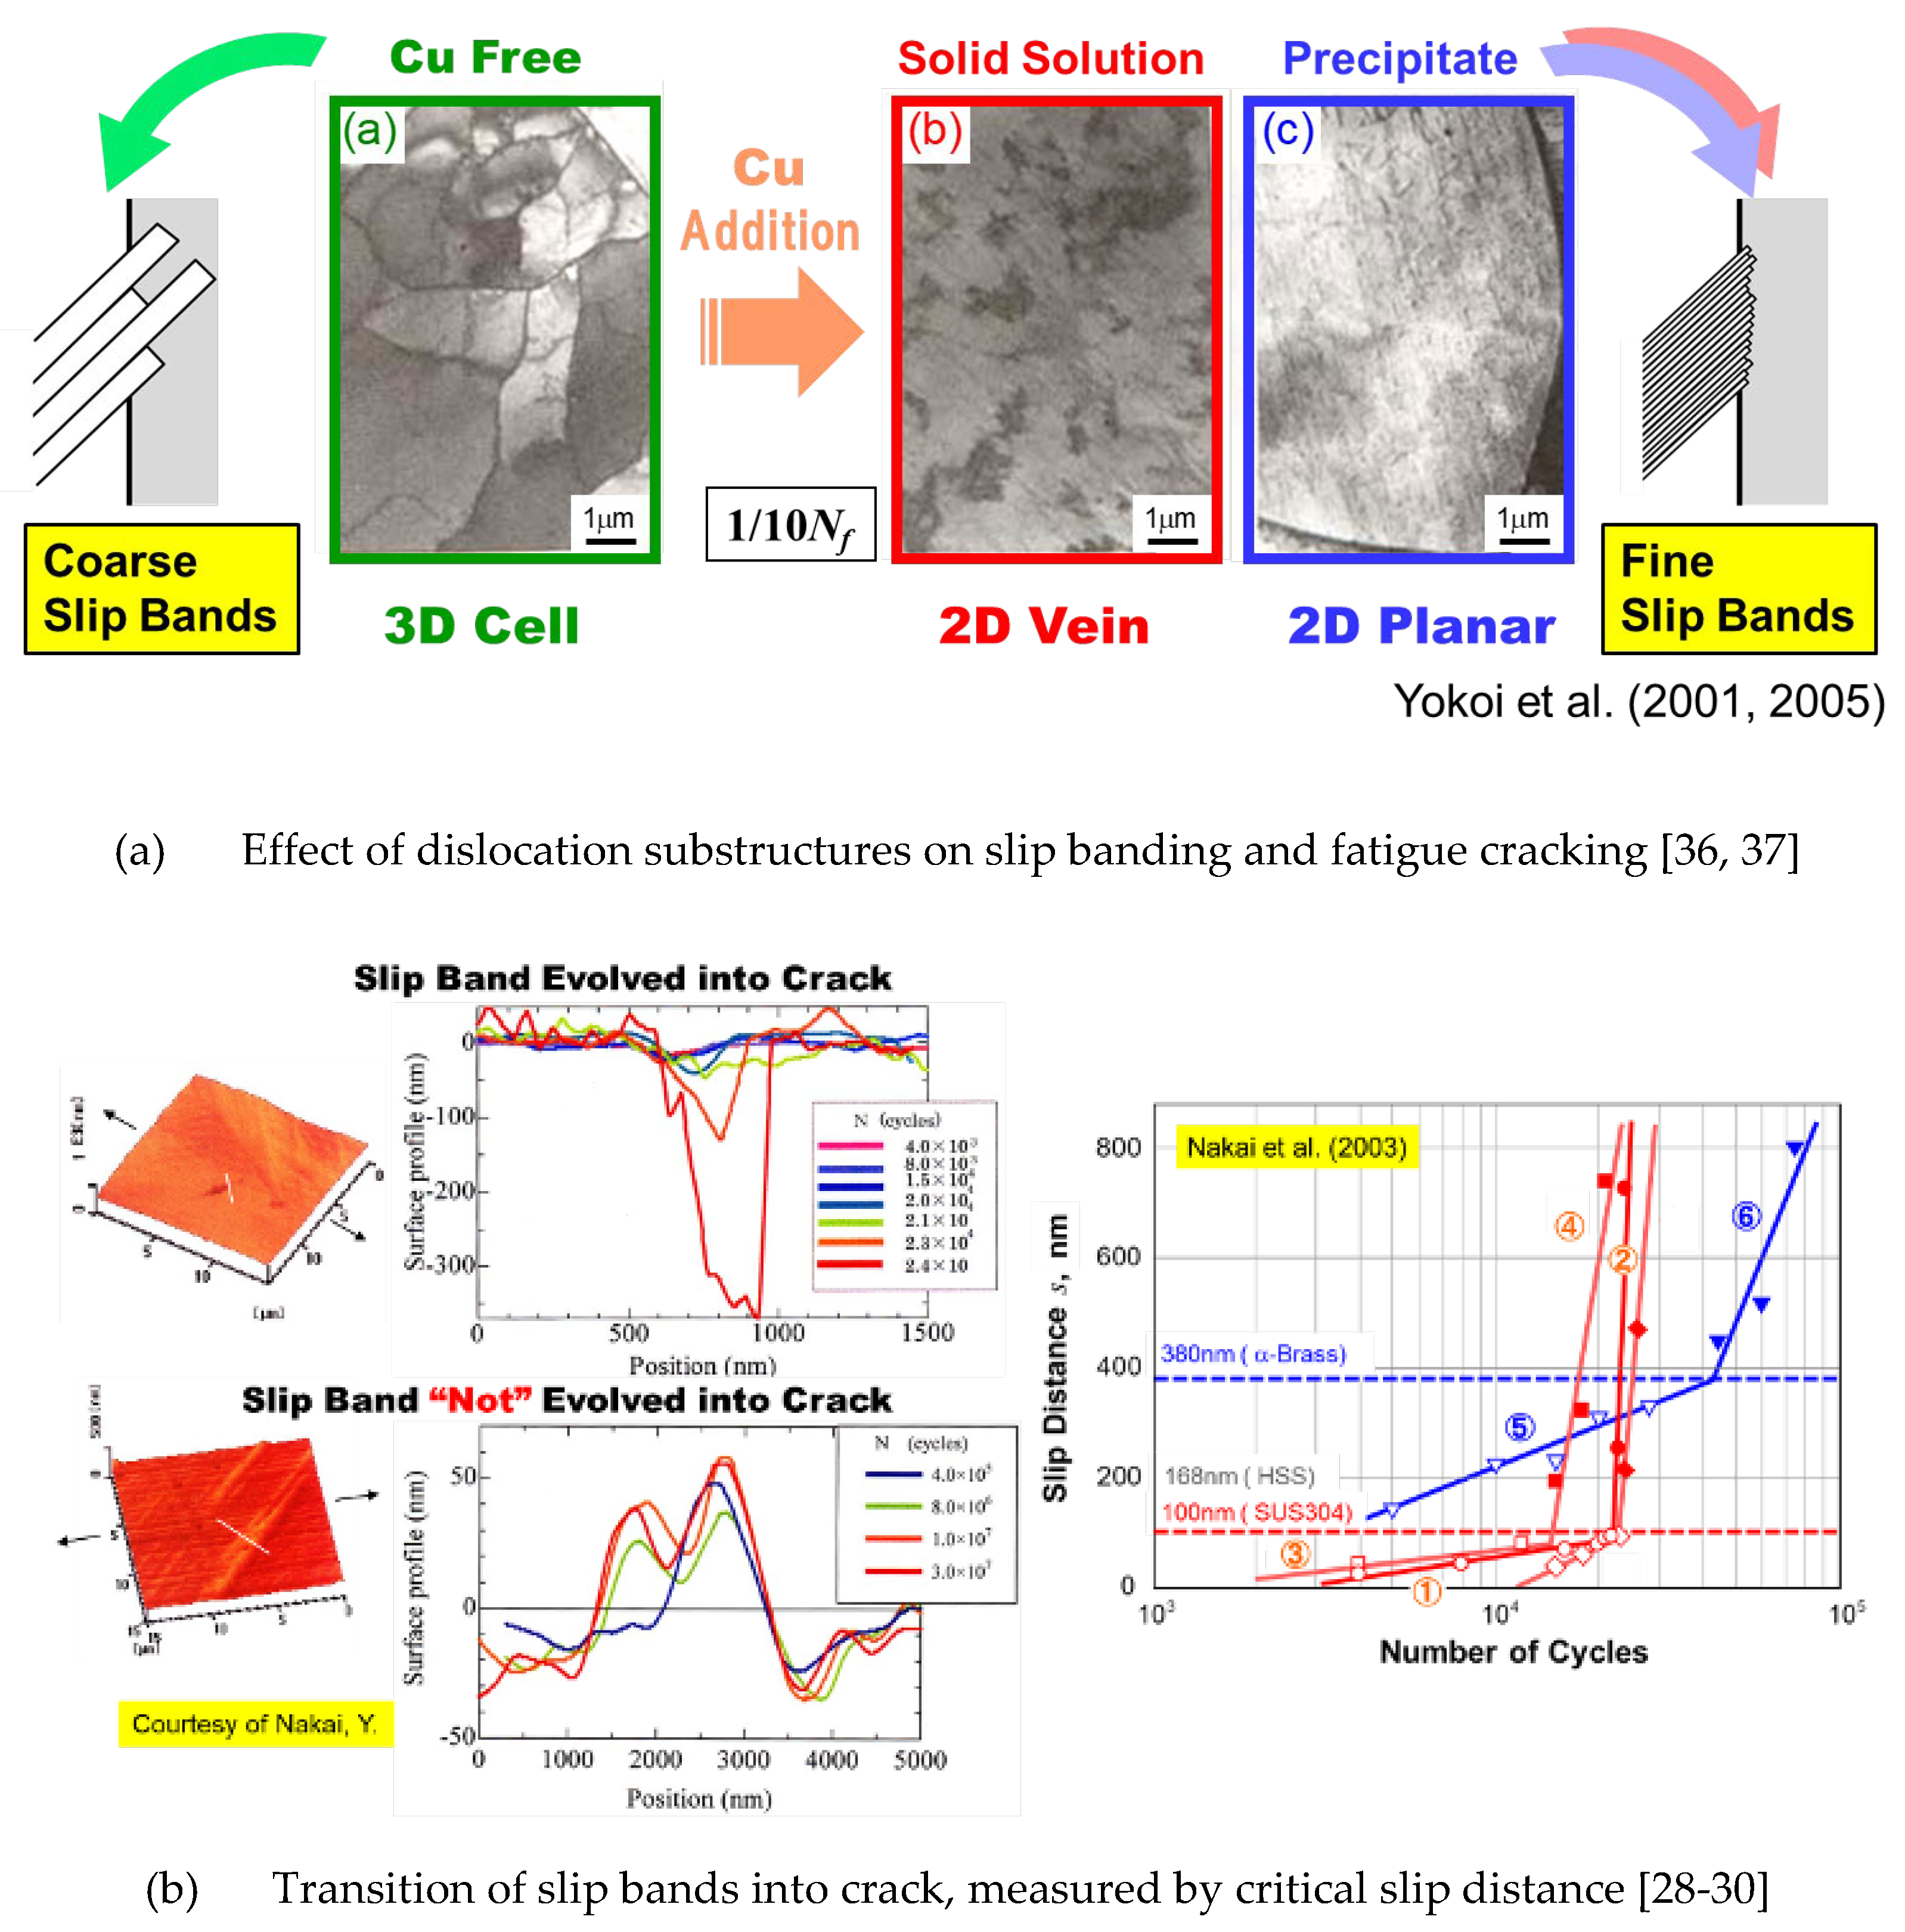
Figure 1. Informative excremental results for modeling fatigue crack initiation process.
Preprints 119965 g001
Figure 2. Overview of FTMP as a new theory of multiscale plasticity.
Preprints 119965 g002
Figure 3. Augmented “incompatibility tensor” in FTMP.
Preprints 119965 g003
Figure 4. FE model for preliminary analyses: Single slip-oriented single crystal.
Preprints 119965 g004
Figure 5. Incompatibility contours before and after projection onto primary slip plane, together with dislocation density contour.
Preprints 119965 g005
Figure 6. a. Comparison of sample deformation under monotonic tension before and after cyclic straining, illustrating that the laddered region has been significantly softened. b. Comparison of sample deformation under monotonic tension for samples interrupted after various cyclic strain cycles. The labels (a) through (i) indicate the specific interrupting cycles.
Preprints 119965 g006
Figure 7. Comparison of simulated hysteresis loops between the matrix and PSB regions.
Preprints 119965 g007
Figure 8. Comparison of dislocation density contours between edge and screw components, where binarized versions are rearranged vertically in the bottom for making comparison easier.
Preprints 119965 g008
Figure 9. Cross-sectional distributions of dislocation density along PSB (x-axis) comparing two components of dislocation density tensor, i.e., screw and edge, at 10, 50 and 100 cycles.
Preprints 119965 g009
Figure 10. Variation in surface profile with straining cycles, accompanied by a magnified view illustrating the evolving groove at the PSB-matrix interface region.
Preprints 119965 g010
Figure 11. Effect of the simplified vacancy model on the evolution of incompatibility and the associated elastic strain energy fluctuations.
Preprints 119965 g011
Figure 12. Evolution of surface grooving as a function of straining cycles, comparing scenarios with and without the simplified vacancy model. This highlights the influence of the vacancy model on the development of surface features over time.
Preprints 119965 g012
Figure 13. Variation of incompatibility terms with the number of cycles, illustrating the effect of the simplified vacancy model on surface grooving.
Preprints 119965 g013
Figure 14. Examples of extended simulation results showing incompatibility contours in multi-grain scenarios featuring grain boundaries.
Preprints 119965 g014
Table 1. Material parameters used in CP-FEM simulations.
Preprints 119965 i001
Disclaimer/Publisher’s Note: The statements, opinions and data contained in all publications are solely those of the individual author(s) and contributor(s) and not of MDPI and/or the editor(s). MDPI and/or the editor(s) disclaim responsibility for any injury to people or property resulting from any ideas, methods, instructions or products referred to in the content.
Copyright: This open access article is published under a Creative Commons CC BY 4.0 license, which permit the free download, distribution, and reuse, provided that the author and preprint are cited in any reuse.
Prerpints.org logo

Preprints.org is a free preprint server supported by MDPI in Basel, Switzerland.

Subscribe

© 2024 MDPI (Basel, Switzerland) unless otherwise stated