Submitted:
01 October 2024
Posted:
01 October 2024
You are already at the latest version
Abstract
Keywords:
1. Introduction
2. Materials and Methods
3. Results
3.1. Feedstock Preparation and Magnetorheological Properties
3.2. Development of LIGA Process and Soft Magnetic Microarrays
4. Discussion
Supplementary Materials
Author Contributions
Data Availability Statement
Acknowledgments
Conflicts of Interest
References
- Hu, W.; et al. Small-scale soft-bodied robot with multimodal locomotion. Nature 2018, 554, 81–85. [Google Scholar] [CrossRef]
- Cui, J.; et al. Nanomagnetic encoding of shape-morphing micromachines. Nature 2019, 575, 164–168. [Google Scholar] [CrossRef]
- Ren, Z.; et al. Multi-functional soft-bodied jellyfish-like swimming. Nature communications 2019, 10, 2703. [Google Scholar] [CrossRef]
- Kim, Y.; et al. Printing ferromagnetic domains for untethered fast-transforming soft materials. Nature 2018, 558, 274–279. [Google Scholar] [CrossRef]
- Roh, S.; et al. 3D-printed silicone soft architectures with programmed magneto-capillary reconfiguration. Advanced Materials Technologies 2019, 4, 1800528. [Google Scholar] [CrossRef]
- Wang, L.; et al. Bioinspired fluoride-free magnetic microcilia arrays for anti-icing and multidimensional droplet manipulation. ACS nano 2023, 18, 526–538. [Google Scholar] [CrossRef]
- Yang, Z.; Park, J.K.; Kim, S. Magnetically responsive elastomer–silicon hybrid surfaces for fluid and light manipulation. Small 2018, 14, 1702839. [Google Scholar] [CrossRef]
- Zhou, Q.; et al. Magnetized micropillar-enabled wearable sensors for touchless and intelligent information communication. Nano-Micro Letters 2021, 13, 1–16. [Google Scholar] [CrossRef]
- Hajji, I.; et al. Droplet microfluidic platform for fast and continuous-flow RT-qPCR analysis devoted to cancer diagnosis application. Sensors and Actuators B: Chemical 2020, 303, 127171. [Google Scholar] [CrossRef]
- Zhou, Q.; et al. Tilted magnetic micropillars enabled dual-mode sensor for tactile/touchless perceptions. Nano Energy 2020, 78, 105382. [Google Scholar] [CrossRef]
- Huang, X.; et al. 3D-assembled microneedle ion sensor-based wearable system for the transdermal monitoring of physiological ion fluctuations. Microsystems & Nanoengineering 2023, 9, 25. [Google Scholar]
- Ni, K.; et al. Core–shell magnetic micropillars for reprogrammable actuation. ACS nano 2021, 15, 4747–4758. [Google Scholar] [CrossRef]
- Park, J.E.; et al. Programmable stepwise collective magnetic self-assembly of micropillar arrays. ACS nano 2022, 16, 3152–3162. [Google Scholar] [CrossRef]
- Park, J.E.; et al. On-demand dynamic chirality selection in flower corolla-like micropillar arrays. ACS nano 2022, 16, 18101–18109. [Google Scholar] [CrossRef]
- Jeon, J.; et al. Shape-programmed fabrication and actuation of magnetically active micropost arrays. ACS applied materials & interfaces 2020, 12, 17113–17120. [Google Scholar]
- Park, J.E.; et al. Enhancement of Magneto-Mechanical Actuation of Micropillar Arrays by Anisotropic Stress Distribution. Small 2020, 16, 2003179. [Google Scholar] [CrossRef]
- Lin, Y.; et al. Magnetically induced low adhesive direction of nano/micropillar arrays for microdroplet transport. Advanced Functional Materials 2018, 28, 1800163. [Google Scholar] [CrossRef]
- Peng, Y.; et al. Active droplet transport induced by moving meniscus on a slippery magnetic responsive micropillar array. Langmuir 2023, 39, 5901–5910. [Google Scholar] [CrossRef]
- Park, J.W.; et al. Development of stimuli-responsive flexible micropillar composites via magneto-induced injection molding and characterization of magnetic particle alignment. Polymer Testing 2024, 130, 108316. [Google Scholar] [CrossRef]
- Azuma, D.; Ito, N.; Ohta, M. Recent progress in Fe-based amorphous and nanocrystalline soft magnetic materials. Journal of magnetism and magnetic materials 2020, 501, 166373. [Google Scholar] [CrossRef]
- Feizabad, M.H.K.; et al. Improvement of soft magnetic properties of Fe0. 7Nb0. 1Zr0. 1Ti0. 1 amorphous alloy: A kinetic study approach. Journal of Non-Crystalline Solids 2018, 493, 11–19. [Google Scholar] [CrossRef]
- Shi, L.; Wang, K.; Yao, K. Maintaining high saturation magnetic flux density and reducing coercivity of Fe-based amorphous alloys by addition of Sn. Journal of non-crystalline solids 2020, 528, 119710. [Google Scholar] [CrossRef]
- Chen, Q.; et al. Synthesis and enhanced microwave absorption performance of CIP@ SiO2@ Mn0. 6Zn0. 4Fe2O4 ferrite composites. Journal of Alloys and Compounds 2019, 779, 720–727. [Google Scholar] [CrossRef]
- German, R. ; Powder Injection Molding. Metal Powder Industries Federation, New Jersey, 1990.
- Park, J.M.; et al. Fabrication of tapered micropillars with high aspect-ratio based on deep X-ray lithography. Materials 2019, 12, 2056. [Google Scholar] [CrossRef]
- Shin, D.S.; et al. Microstructural and core loss behaviors of addictive Fe-17 at% P based on Fe-3.5 wt% Si alloys in powder injection molding. Journal of Alloys and Compounds 2018, 749, 758–767. [Google Scholar] [CrossRef]
- Chandler, H.D. A physical basis for non-Newtonian power-law viscosity. Soft Materials 2019, 17, 137–142. [Google Scholar] [CrossRef]
- Nguyen, L.T.; Mertens, C.; Prez, F.E.D. Aza-Michael Chemistry for PDMS-Based Covalent Adaptable Elastomers: Design and Dual Role of the Silica Filler. Macromolecules 2024, 57, 4817–4825. [Google Scholar] [CrossRef]
- Palacios-Pineda, L.M.; et al. Experimental investigation of the magnetorheological behavior of PDMS elastomer reinforced with iron micro/nanoparticles. Polymers 2017, 9, 696. [Google Scholar] [CrossRef]
- Lee, J.H.; et al. Polymer-magnetic composite particles of Fe3O4/poly (o-anisidine) and their suspension characteristics under applied magnetic fields. Polymers 2019, 11, 219. [Google Scholar] [CrossRef]
- Anupama, A.; Kumaran, V.; Sahoo, B. Application of monodisperse Fe3O4 submicrospheres in magnetorheological fluids. Journal of Industrial and Engineering Chemistry 2018, 67, 347–357. [Google Scholar] [CrossRef]
- Krishnan, J.M. Deshpande, A.P.; Kumar, P.S. Rheology of complex fluids. 2010: Springer.
- Maurya, C.S. and C. Sarkar, Rheological response of soft flake-shaped carbonyl iron water-based MR fluid containing iron nanopowder with hydrophilic carbon shell. Rheologica Acta 2021, 60, 277–290. [Google Scholar] [CrossRef]
- Husband, R.J.; et al. X-ray free electron laser heating of water and gold at high static pressure. Communications Materials 2021, 2, 61. [Google Scholar] [CrossRef]
- Li, K.; et al. A review of magnetic ordered materials in biomedical field: Constructions, applications and prospects. Composites Part B: Engineering 2022, 228, 109401. [Google Scholar] [CrossRef]
- Tagliabue, A.; Eblagon, F.; Clemens, F. Analysis of styrene-butadiene based thermoplastic magnetorheological elastomers with surface-treated iron particles. Polymers 2021, 13, 1597. [Google Scholar] [CrossRef]
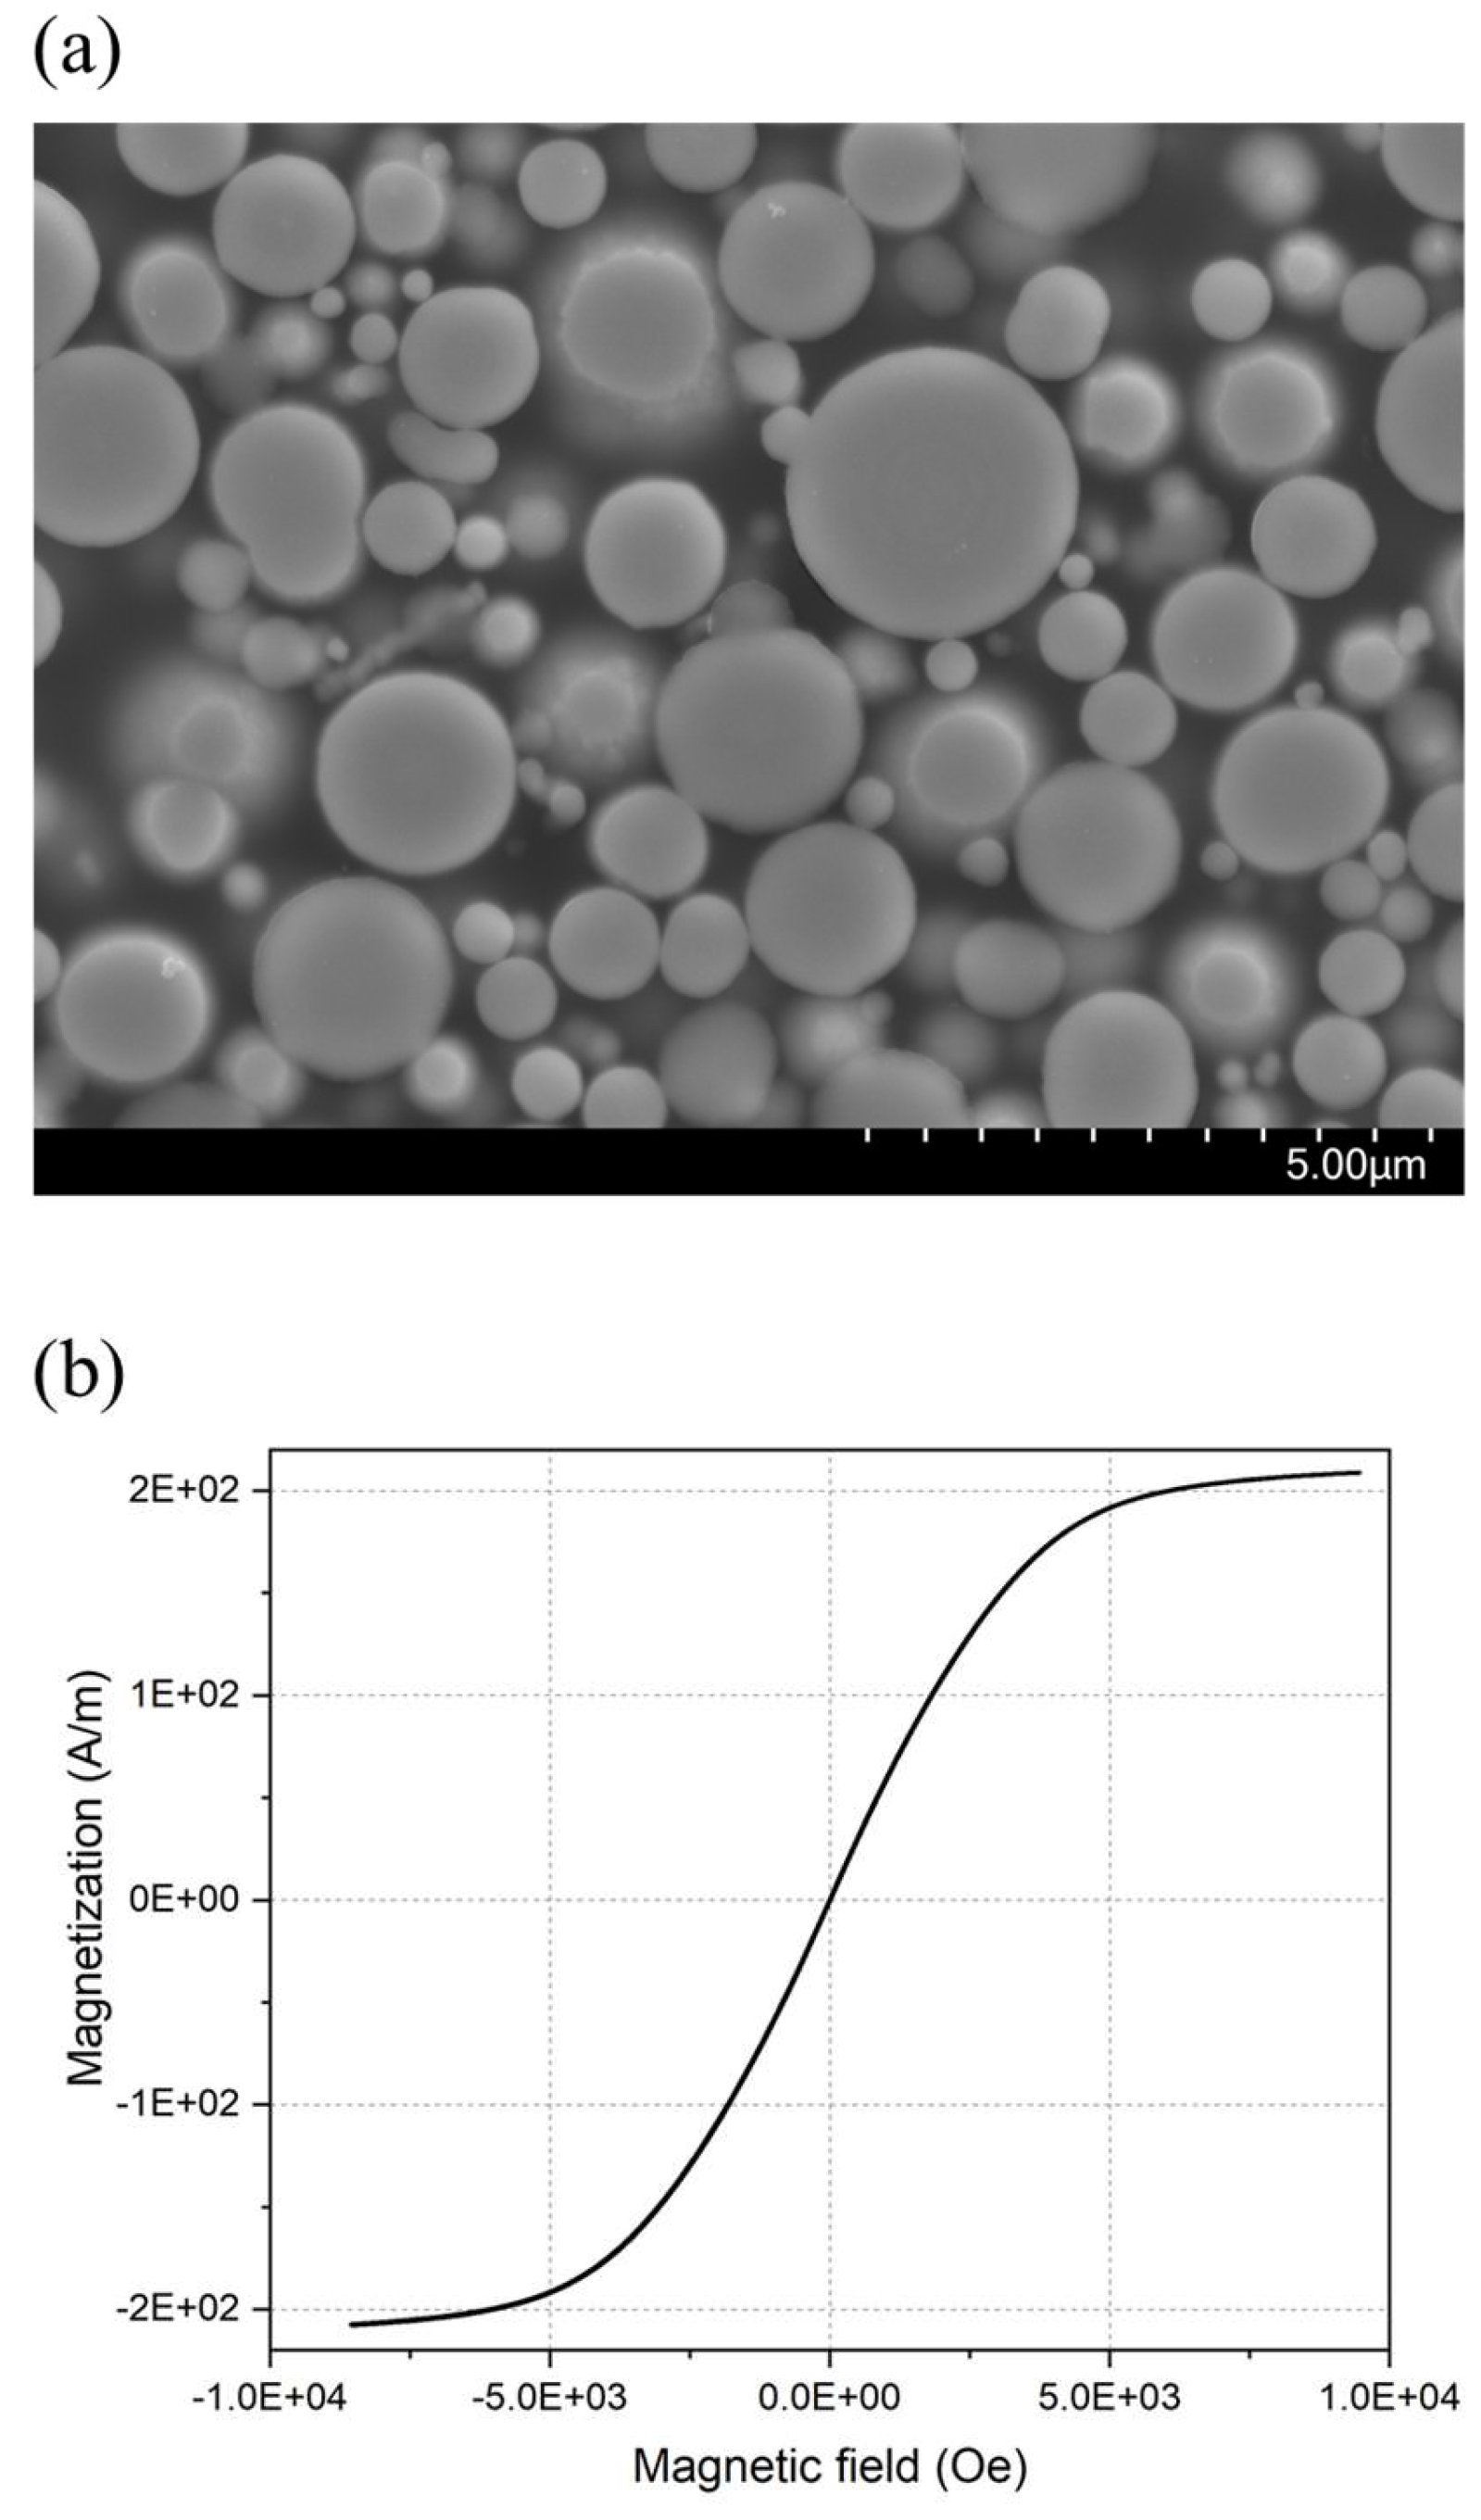
| Carbonyl iron powder (CIP, HQ grade) | Physical properties | Magnetic properties | ||||
| Average particle diameter (APD) | Pycnometer density |
Residual induction (Mr) | Intrinsic coercive force (HCi) | Positive magnetization (MS, positive) |
Negative magnetization (MS, negative) |
|
| 1.4 μm | 3.8 g/cm3 | 0.75 emu/g | 11.60 Oe | -212.12 emu/g | 212.99 emu/g | |
| Styrene-ethylene/butylene styrene (SEBS-130AB) elastomer | Physical properties | Mechanical properties | ||||
| Hardness | Density | Tensile strength (break) | Elongation (break) | 100% modulus | Tear stress | |
| 30 shore A | 0.9 g/cm3 | 4.4 MPa | 850 % | 1.2 MPa | 13 kN/m | |
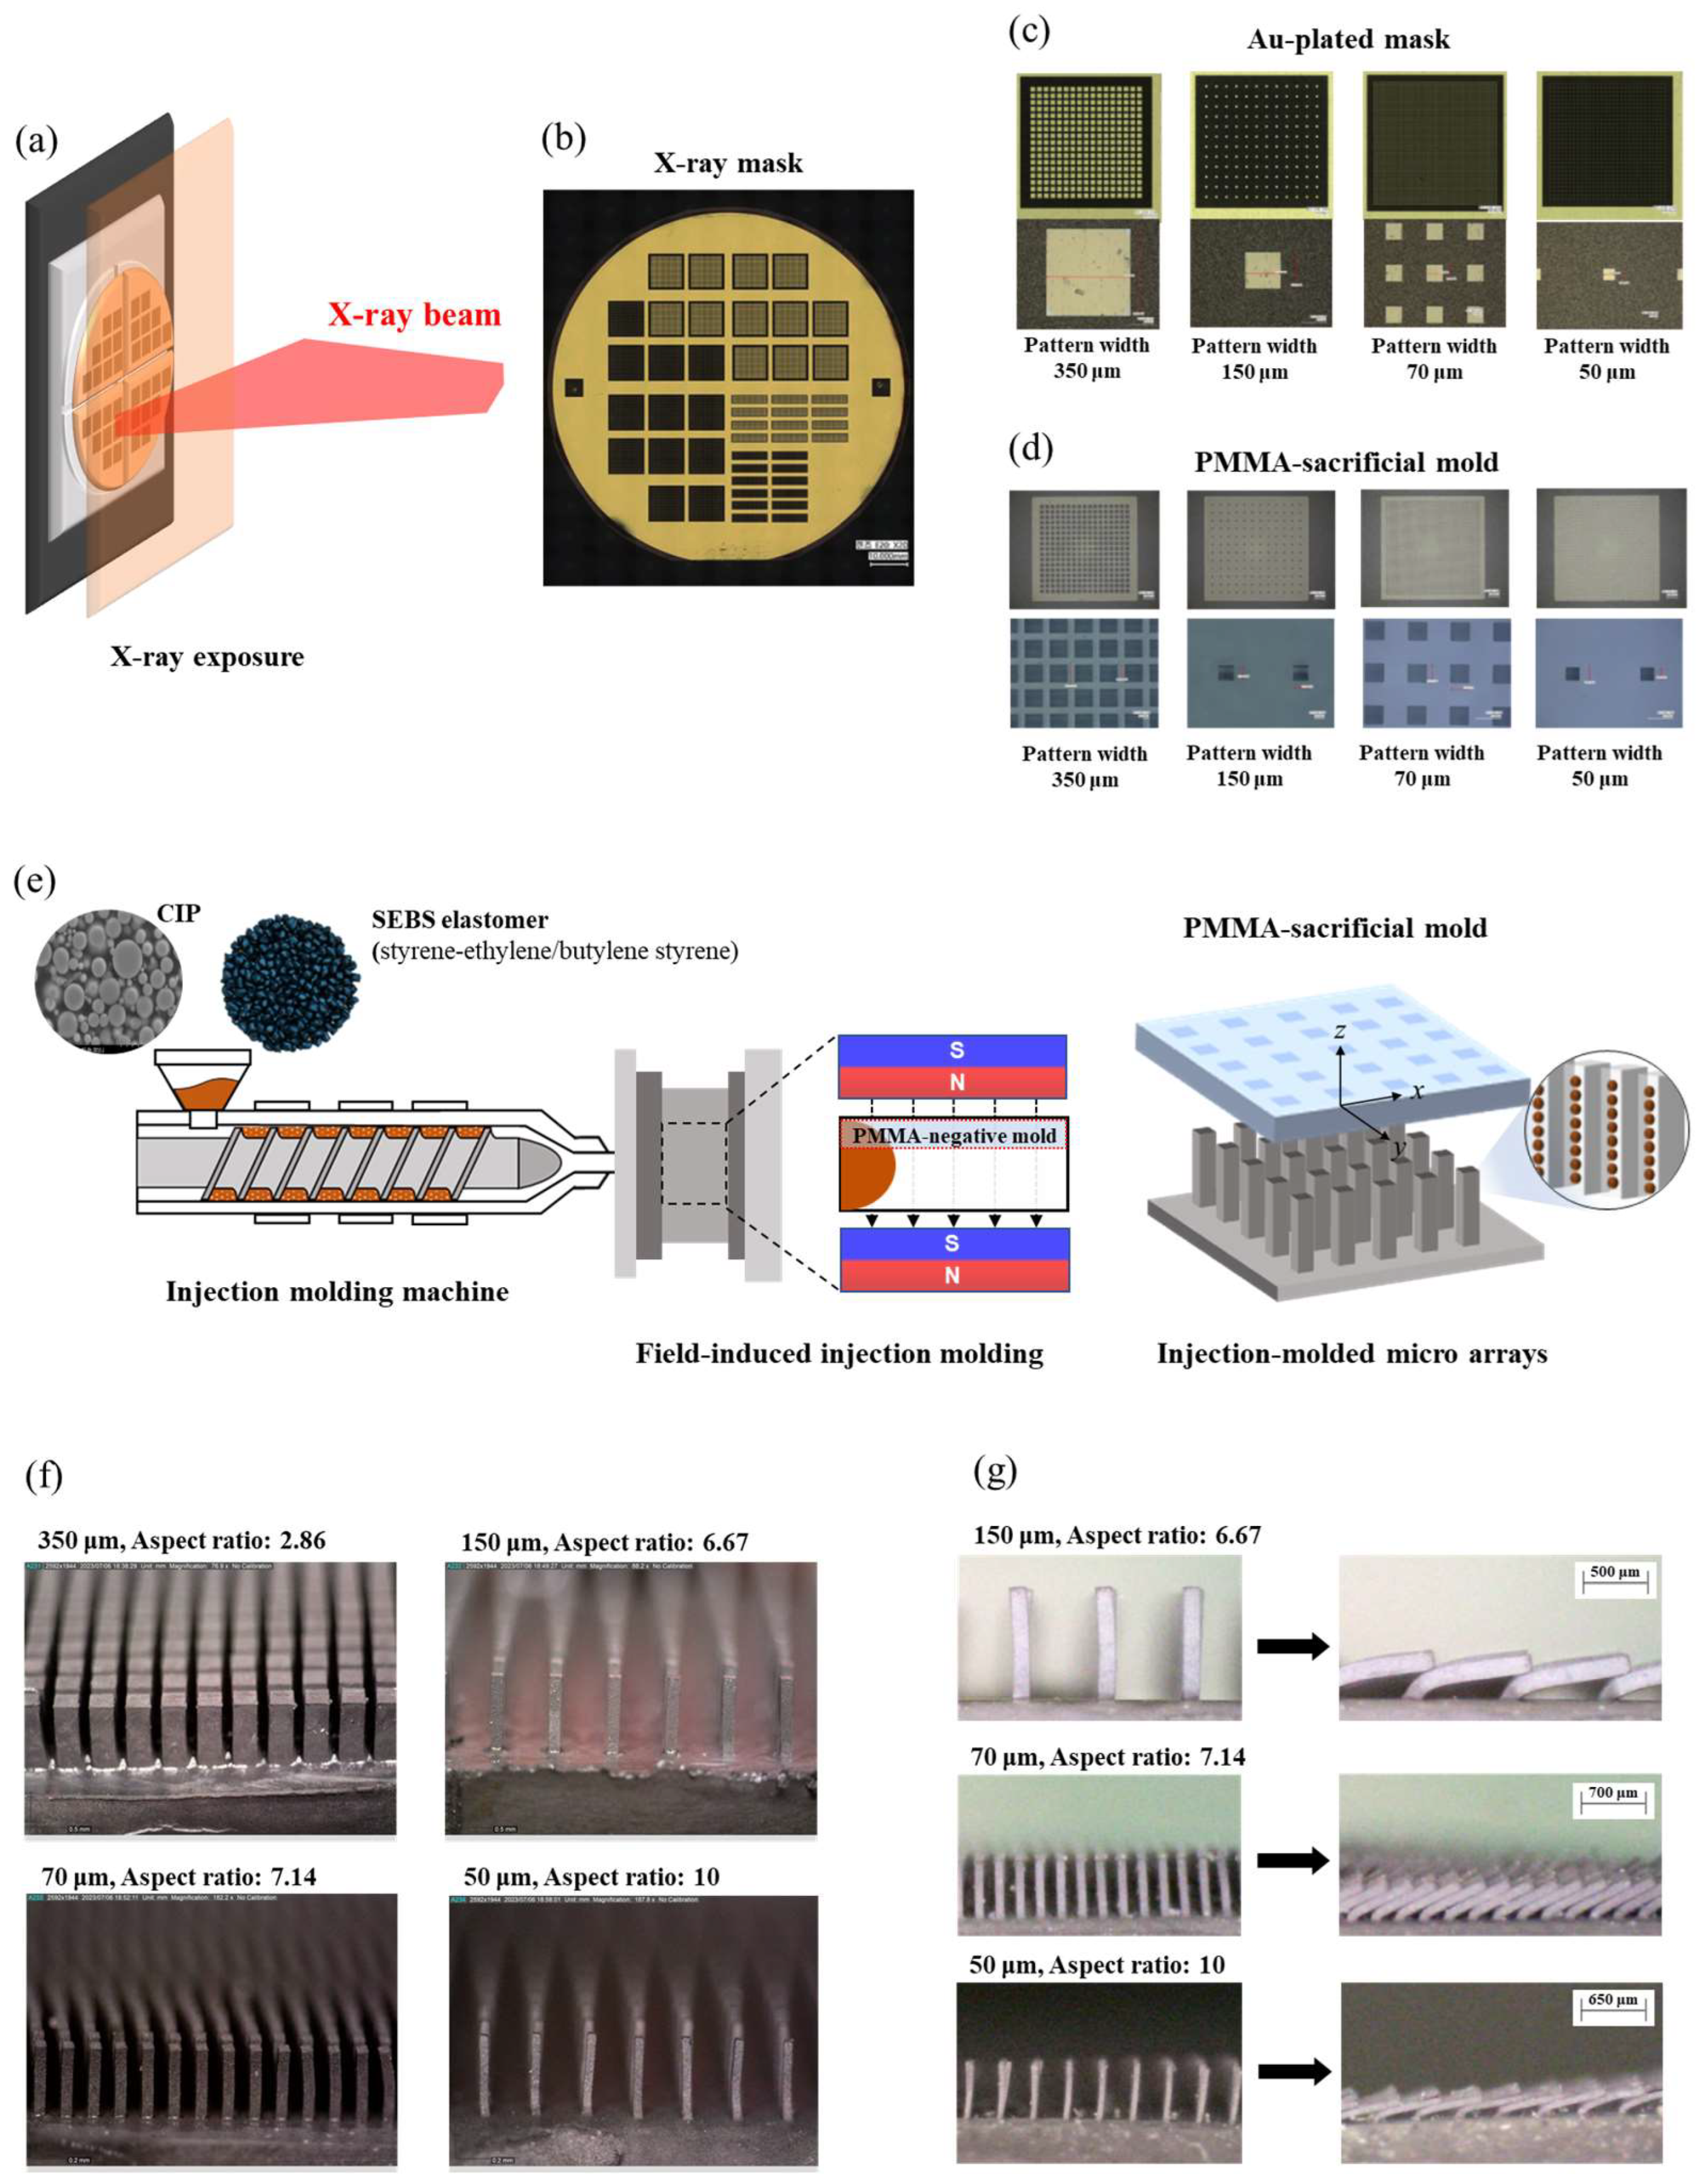
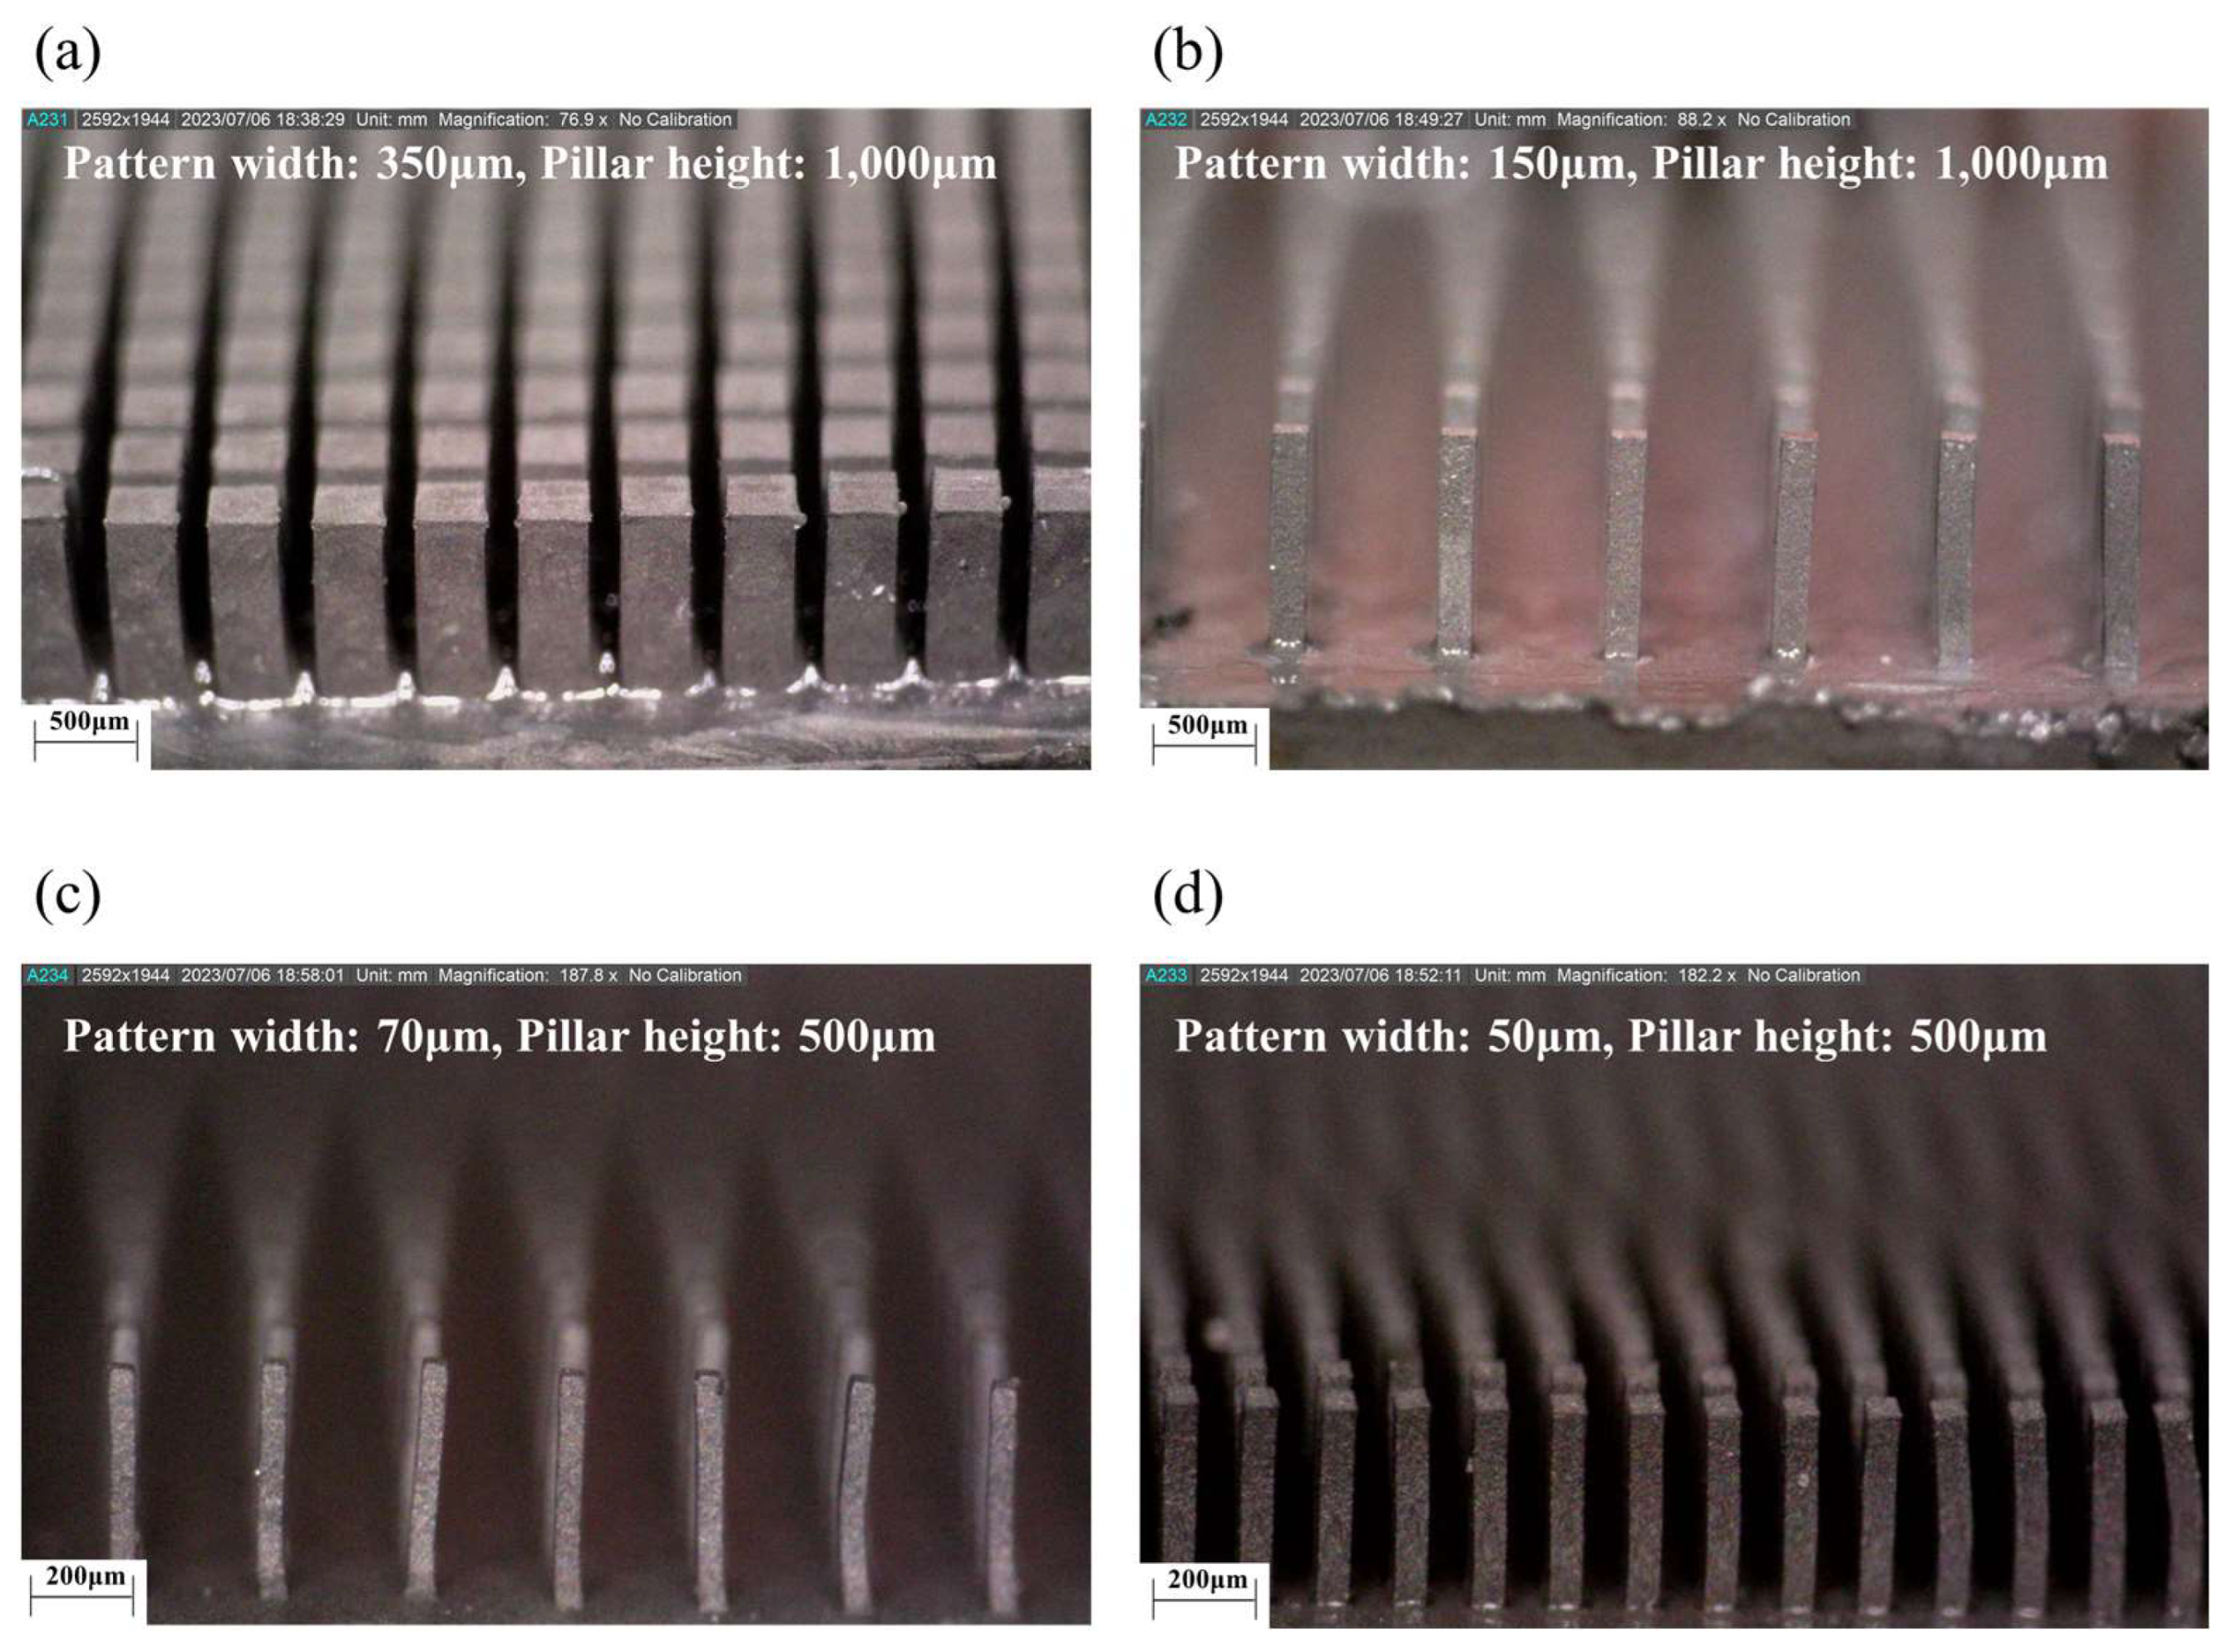
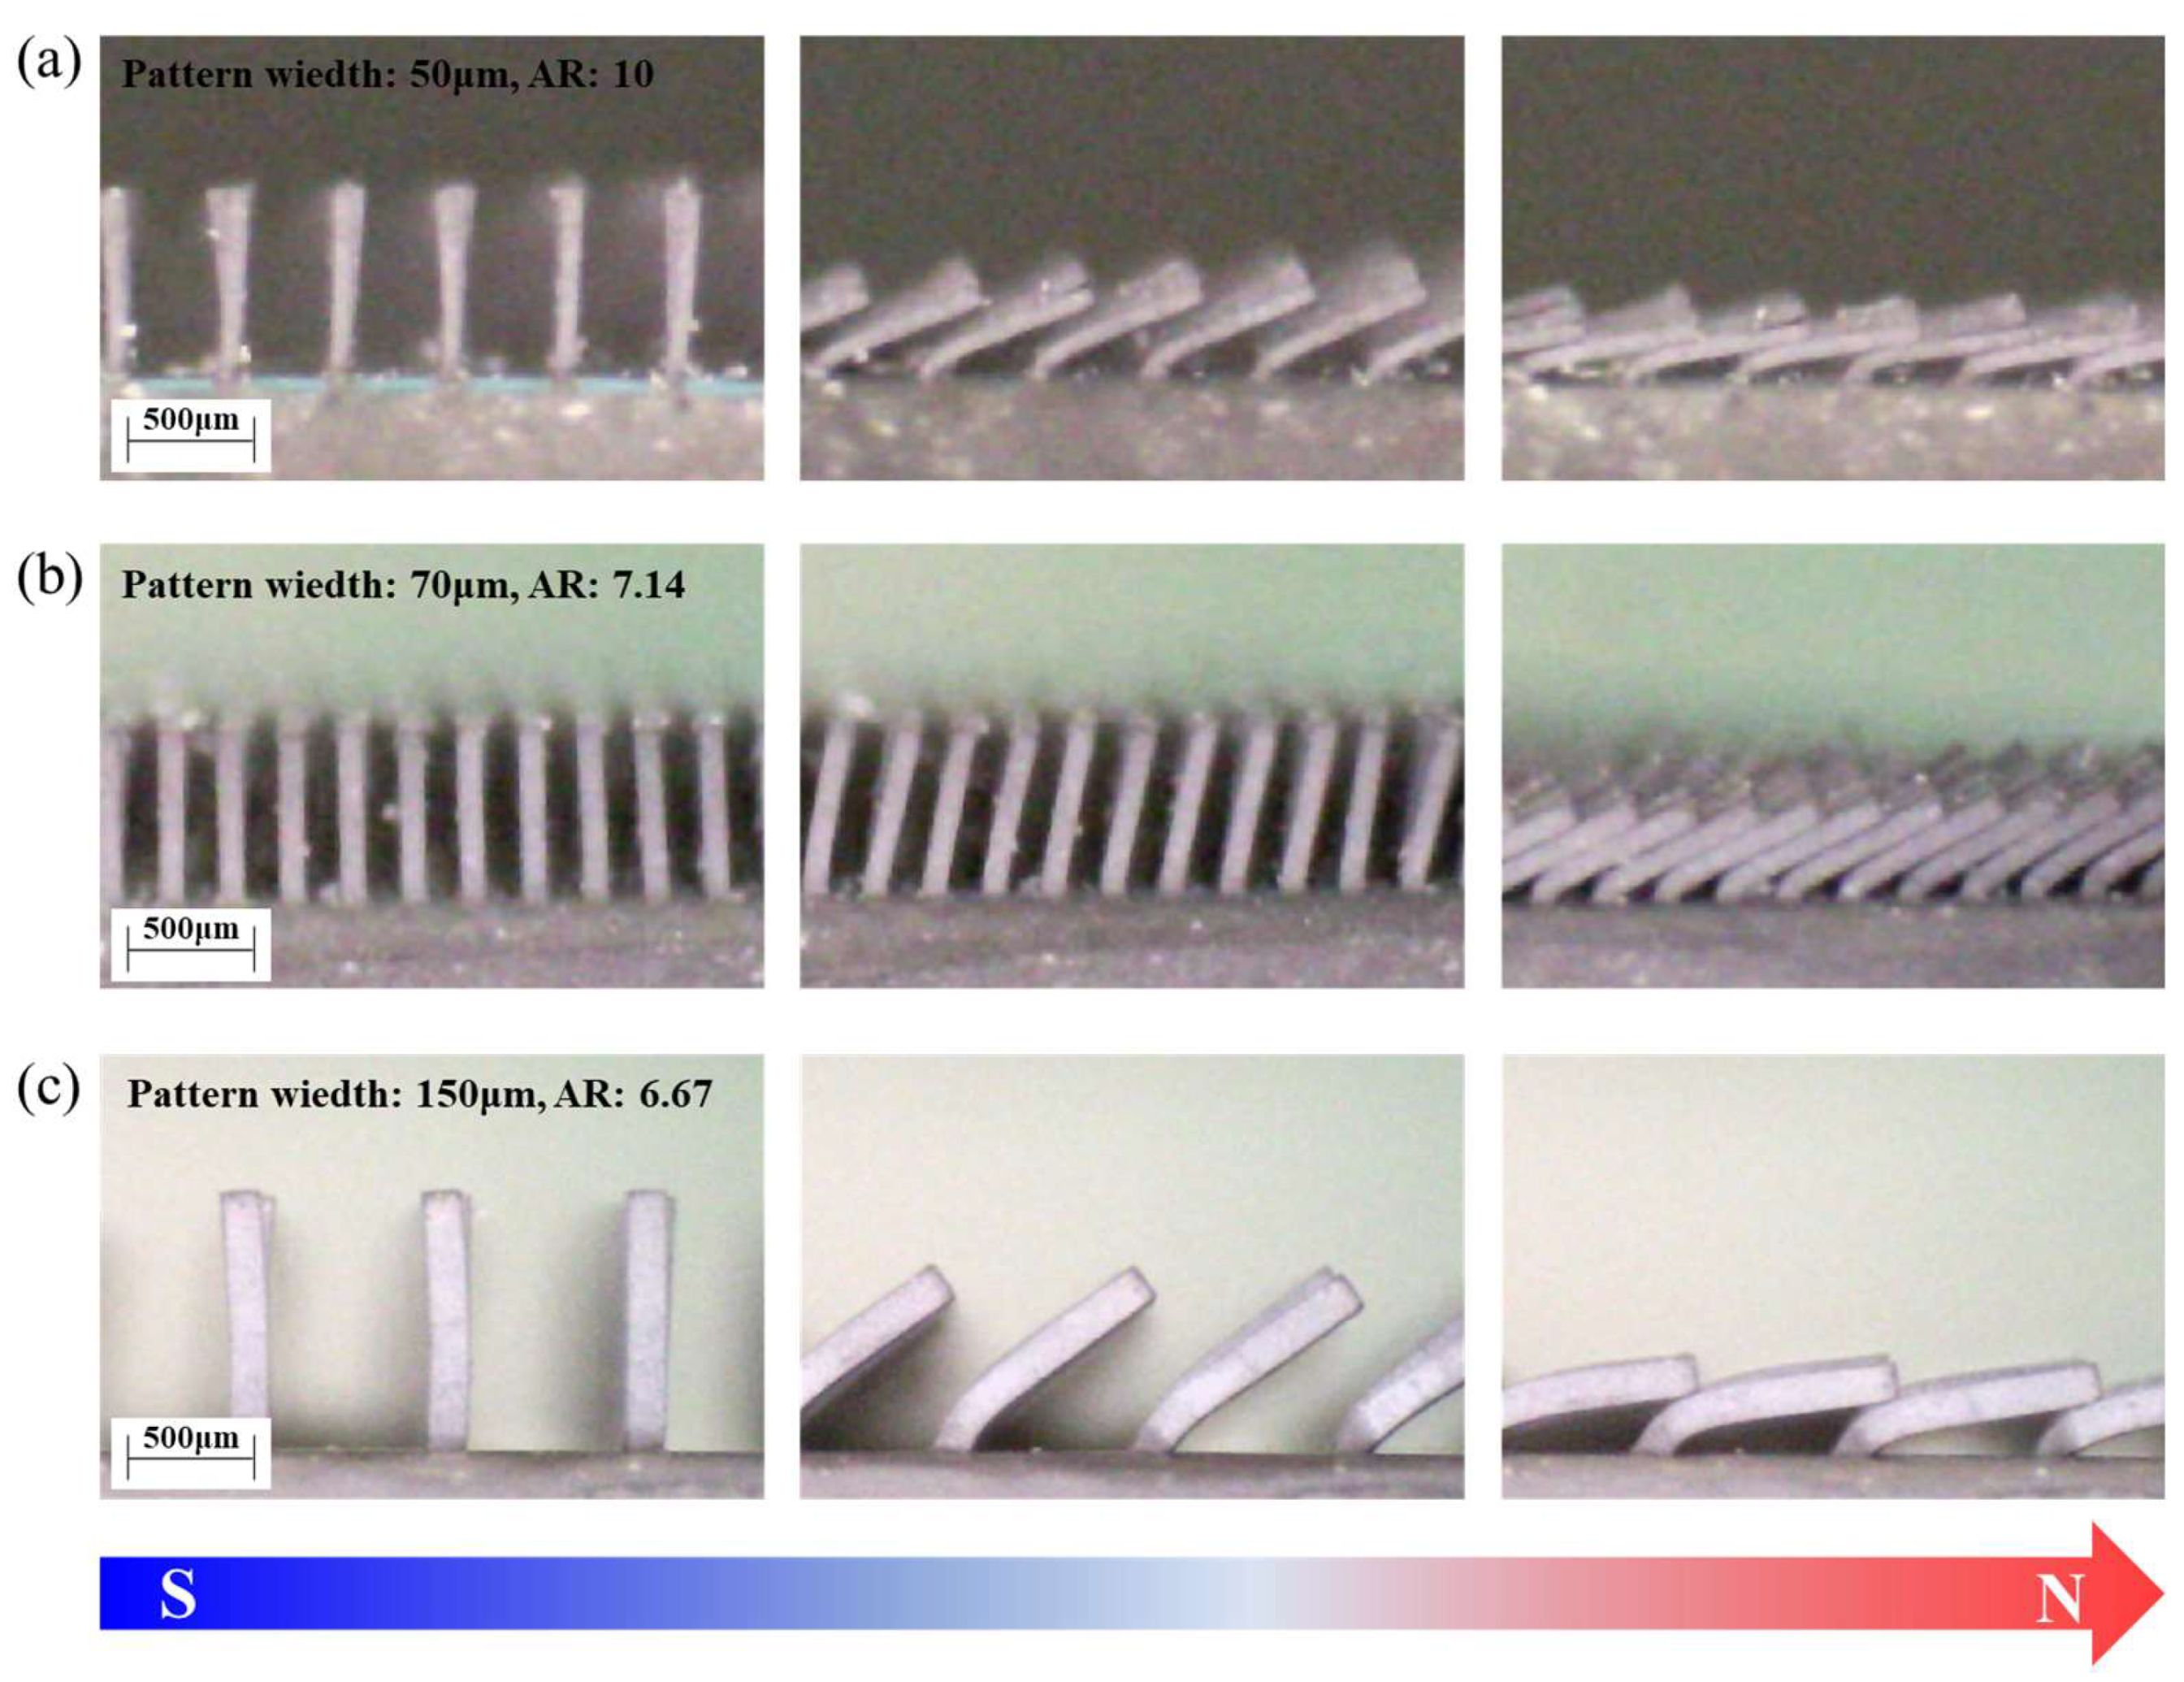
| Square patterns size (µm) | Pillar spacing (µm) |
Pillar height (µm) |
Aspect ratio (height to pattern width) |
| 350 | 150 | 1,000 | 2.86 |
| 150 | 600 | 1,000 | 6.67 |
| 70 | 100 | 500 | 7.14 |
| 50 | 250 | 500 | 10.00 |
Disclaimer/Publisher’s Note: The statements, opinions and data contained in all publications are solely those of the individual author(s) and contributor(s) and not of MDPI and/or the editor(s). MDPI and/or the editor(s) disclaim responsibility for any injury to people or property resulting from any ideas, methods, instructions or products referred to in the content. |
© 2024 by the authors. Licensee MDPI, Basel, Switzerland. This article is an open access article distributed under the terms and conditions of the Creative Commons Attribution (CC BY) license (http://creativecommons.org/licenses/by/4.0/).


