1. Introduction
Protein of Relevant Evolutionary and Lymphoid Interest (PRELI) is characterized by its distinct expression patterns and evolutionary conservation. It plays critical roles in various cellular processes, particularly immune system function and stress responses (relating to oxidative stress and mitochondrial function). PRELI is involved in lymphoid tissue development and the differentiation of immune cells. Its expression is closely regulated during lymphocyte development, reflecting its crucial role in shaping immune cell functionality and maintaining immune homeostasis [
1,
2,
3]. The evolutionary conservation of the protein highlights its fundamental role in preserving cellular integrity and adaptability [
1,
2,
3]. In hepatic cancer, PRELI interacts with cancer stem cells. Exosomes, small extracellular vesicles, can carry PRELI and other biomolecules, influencing communication within the tumor microenvironment. Understanding how PRELI-containing exosomes affect liver cancer stem cells (LCSCs) is crucial for uncovering mechanisms underlying tumor progression and developing therapeutic strategies [
1,
4].
LCSCs are a subpopulation of cells within liver tumors that possess self-renewal and differentiation ability and drive tumorigenesis. These cells contribute to tumor initiation, progression, metastasis, and resistance to conventional therapies. LCSCs are characterized by specific surface markers, such as CD133, CD90, Epithelial cell adhesion molecule (EpCAM), CD24, and CD13, which distinguish them from the bulk of differentiated cancer cells [
5]. LCSCs play a crucial role in hepatic cancer progression due to their ability to undergo asymmetric division, resulting in the generation of new stem cells and differentiated cancer cells. This hierarchical organization contributes to the heterogeneity of liver cancers, allowing LCSCs to adapt to various microenvironments and resist treatment. The differentiation process is tightly regulated by key signaling pathways, including Wnt/β-catenin, Notch, Hedgehog, and transforming growth factor beta (TGF-β) pathways, which are frequently dysregulated in liver cancers [
6]. Targeting LCSCs offers a promising approach to improving treatment outcomes in patients with liver cancer. Strategies include the inhibition of key signaling pathways, the use of immune-based therapies, and the development of drugs that specifically target LCSCs or their microenvironment. Current research is focused on overcoming the challenges of LCSC plasticity and resistance to ensure effective targeting without harming normal stem cells in the liver. Recent advances in understanding LCSCs have led to the development of novel therapeutic approaches, such as differentiation therapy, which aims to drive LCSCs into a more differentiated state, rendering them more susceptible to conventional treatments. Additionally, leveraging immune checkpoint inhibitors and chimeric antigen receptor T (CAR-T) cell therapies against LCSC-specific markers shows potential for selectively eradicating these cells [
7].
Exosomes are small extracellular vesicles secreted by various cells, including cancer cells, with key roles in intercellular communication by transferring proteins, RNA, and microRNAs (miRNAs). In cancer, exosomes contribute to tumor growth, metastasis, and drug resistance, making them both a challenge and an opportunity in cancer therapy. Leveraging their natural role in communication, exosomes have emerged as promising therapeutic tools, serving as drug delivery vehicles or as direct therapeutic agents [
8]. Exosomes can be engineered to deliver therapeutic agents, such as drugs or siRNAs, directly to cancer cells, enhancing targeting specificity and reducing side effects. Their ability to cross biological barriers and biocompatibility make them ideal for precision therapy. Additionally, miRNA-loaded exosomes can reprogram cancer cells, thereby inhibiting tumor growth and improving responses to existing treatments [
9]. Despite their potential, standardizing production, ensuring safety, and scaling up remain challenging and are active areas of research. Nonetheless, exosome-based therapies offer a novel approach to personalized cancer treatment [
10].
In this study, we investigated the functions of exosomes derived from PRELI-regulated LCSCs in liver cancer. We performed comprehensive miRNA profiling of these exosomes to elucidate their potential roles. Our findings provide a basis for the development of novel biological pharmaceutical materials targeting liver cancer.
2. Materials and Methods
2.1. Cell Culture and Establishment of Dosages
Liver cancer stem cells (LCSCs) (sku: 36116-43; Celprogen, Torrance, CA, USA ) and normal hepatocytes (NH) (THLE-3; ATCC, Manassas, VA, USA) were cultured with Human Liver Cancer Stem Cell Media (Celprogen) and BEGM (Bronchial Epithelial Cell Growth Medium) (Lonza, Workingham, UK) using BEGM Bullet Kits (Lonza). The cultured LCSCs and NH were exposed to various concentrations of the induced exosomes with adjusted concentration (2 109 particles/mL) for one day to establish exosomal treatment dosages (S1). To evaluate viability, all exposed cells were stained with Annexin V-conjugated propidium iodide (PI) (Invitrogen, Carlsbad, CA, USA) and analyzed using a flow cytometer (FACSCalibur, BD Biosciences, San Jose, CA, USA) and FlowJo 10.10 software (BD Biosciences) (S1).
2.2. PRELI Knockdown and Overexpression
For PRELI knockdown, cultured LCSCs were exposure to Lipofectamine 2000 reagent (Invitrogen, Waltham, MA, USA) with PRELI siRNA or control siRNA oligonucleotides (negative and positive) (Bioneer, Daejeon, Korea) for 48 h. For PRELI overexpression, the cultured LCSCs were exposed to PRELI Lentiviral Activation Particles (h): sc-411975-LAC (Santa Cruz Biotechnology, Houston, TX, USA) with RetroNectin (Takara, Tokyo, Japan) for 48 h.
2.3. Purification of Induced Exosomes and microrna Profiling
To isolate induced exosomes, the supernatants were collected from LCSCs under PRELI knock-down and overexpression conditions. The control exosomes (CE), up-regulated PRELI exosomes (UPE), and down-regulated PRELI exosomes (DPE) were isolated and purified from the supernatants (10 mL) using the exoEasy Maxi Kit (QIAGEN, Hilden, Germany) and CD68 Exo Flow Capture Kit (System Biosciences, Palo Alto, CA, USA). The concentrations of isolated exosomes were evaluated using the Exosome Standards Kit (SAE0193; Sigma-Aldrich, St. Louis, MO, USA). The isolated and purified exosomes were sequenced by ebiogen Inc. (Seoul, Republic of Korea) to analyze exosomal functions. The Agilent 2100 Bio-analyzer and RNA 6000PicoChip (Agilent Technologies, Amstelveen, The Netherlands) were used to evaluate RNA quality. RNA was quantified using a NanoDrop 2000 spectrophotometer (Thermo Fisher Scientific, Waltham, MA, USA). Small RNA libraries were prepared and sequenced using the Agilent 2100 Bio-analyzer instrument for a high-sensitivity DNA assay (Agilent Technologies, Inc., Santa Clara, CA, USA), and the NextSeq500system was used for single-end 75 bp sequencing (Illumina, San Diego, CA, USA). To obtain an alignment file, the sequences were mapped using Bowtie 2 (CGE Risk, Lange Vijverberg, The Netherlands), and read counts were extracted from the alignment file using bedtools (v2.25.0) (GitHub, Inc., San Francisco, CA, USA) and R language (version 3.2.2) (R studio, Boston, MA, USA) to evaluate miRNA expression levels. miRWalk 2.0 (Ruprecht-Karls-Universität Heidelberg, Medizinische Fakultät Mannheim, Germany) was used for the miRNA target analysis, and ExDEGA v.2.0 (ebiogen Inc., Seoul, Republic of Korea) was used to generate radar charts.
2.4. Western Blotting and Exosomal Images
Total proteins were extracted from the induced exosomes (CE, UPE, and DPE) using a DC Protein Assay Kit (BIO-RAD, Hercules, CA, USA). The lysed total protein was electrophoresed using the KOMA EzWay™ PAG System (Bellingham, WA, USA), followed by blotting on a nitrocellulose membrane, blocking for 1 h with 5% skim milk (Sigma) in phosphate-buffered saline with Tween 20 (PBST; Sigma), and washing with PBST. The blots were then reacted overnight with anti-CD-63 (Abcam, Cambridge, UK), anti-PRELI (sc-100817, Santa Cruz Biotechnology) and FITC-anti-CD-63 (Abcam, Cambridge, UK) antibodies diluted 1:10,000 at 4°C. Next, samples treated with anti-CD63 were washed with PBST and treated with HRP-conjugated anti-rabbit and anti-mouse IgG (Sigma) diluted 1:5000. The blots were treated with ECL Reagent (Sigma) and analyzed using iBright FL1000, iBright Analysis 4.0.0 (Invitrogen, Waltham, MA, USA), and Prism 7 (GraphPad, San Diego, CA, USA).
2.5. Evaluating of Exosomal Purification and Transfection
The isolated exosomes were stained with FITC-anti-CD-63 and evaluated using a flow cytometer (BD FACSCalibur, BD Biosciences), FlowJo 10.6.1 (BD Biosciences), a fluorescence microscope (Eclipse Ts-2, Nikon, Shingawa, Japan), the imaging software NIS-elements V5.11 (Nikon), and Prism 7 (GraphPad). To evaluate transfection, LCSCs were exposed to FITC-labeled miRNAs (hsa-miR-378a-3p; Cy5-5’-UCUGGCUCAGGUGGCAUUGGAG, hsa-miR-25-3p; Cy5-5’-CAUUGCACUUGUCUCGGUCUGA, hsa-miR-423-3p; Cy5-5’-AGCUCGGUCUGAGGCCCCUCAG) (BIONEER, Daejeon, Korea) for 1 day. During incubation, LCSCs were transfected with miRNAs using Lipofectamine 2000 reagent (Invitrogen) with control siRNA oligonucleotide (negative) (Bioneer) and GFP-GAPDH siRNA (Bioneer) for one day. The treated LCSCs were evaluated for transfection efficiency using a fluorescence microscope (Eclipse Ts-2, Nikon) and NIS-elements V5.11 (Nikon).
2.6. Evaluation of Marker Expression and ATK/mTORC1 Signaling
After exposure to CE, UPE, DPE with the labeled miRNAs for one day, markers (CD13, 24, 90, 133, EpCAM, and OV-6) on LCSCs and NH were stained with FITC-anti-CD 133 (Abcam, Cambridge, UK), FITC-anti-EpCAM (Abcam), FITC-anti-CD90 (Abcam), FITC-anti-CD24 (Abcam), FITC-anti-CD13 (Abcam), and FITC-anti-OV-6 (Novus Biologicals, Centennial, CO, USA) for 3 days at 37°C. Similarly, the cells treated with the labeled miRNAs for one day were stained with these antibodies for 3 days at 37°C. Expression levels in stained cells were evaluated using a flow cytometer (BD FACSCalibur), FlowJo 10.6.1 (BD Biosciences), and Prism 7 (GraphPad).
2.7. Modeling of Sorafenib Resistant Hepatocyte and Blocking of Candidate microRNAs
NH were cultured with sorafenib (Sigma) at serial concentrations (0.005,0.007, 0.010, and 0.015 μmol/L) for 70 days to model drug-resistant cells [
1]. After the exposure, the cellular viability and the expression levels of PRELI were evaluated using Annexin V-PI (Invitrogen) and immunocytochemistry with FITC-anti-PRELI (sc-100817, Santa Cruz Biotechnology) respectively and were analyzed using a flow cytometer (BDFACScalibur, BD Biosciences), and FlowJo 10.6.1 (BD Biosciences). To suppress the miRNA candidates, NH were exposed to the synthesized siRNA against hsa-miR-378a-3p, hsa-miR-25-3p and hsa-miR-423-3p; FITC-3’-AGACCGAGUCCACCGUAACCUC, FITC-3’-GUAACGUGAACAGCCAGACU, FITC-3’- UCGAGCAGACUCCGGGGAGUC during 48 h. The transfected cells were exposed to sorafenib and were evaluated their cellular viability using Annexin V-PI (Invitrogen), a flow cytometer (BDFACScalibur, BD Biosciences), and FlowJo 10.6.1 (BD Biosciences).
2.8. Statistical Analysis
All data were analyzed using one way analysis of variance (ANOVA) and post hoc Scheffe’s tests using Prism 7 (GraphPad).
4. Discussion
The biological functions of exosomes derived from LCSCs under PRELI modulation were evaluated. The primary aim of this research was to determine the potential clinical value of DPE and three associated miRNAs (hsa-miR378a-3p, hsa-miR25-3p, and hsa-miR423-3p) as pharmaceutical biomaterials for the treatment and prevention of liver cancer.
Recent research has shown that the suppression of PRELI in hepatocytes leads to significant changes in signaling pathways and expression patterns [
11]. Specifically, the p53, Hippo, and Notch pathways are involved in liver cell regulation, repair, and carcinogenesis. For example, p53 activation has been linked to inflammatory responses and apoptosis in hepatocytes, which can paradoxically promote liver carcinogenesis [
11,
12]. Additionally, the Hippo pathway plays a critical role in liver regeneration and repair, particularly in damaged livers where hepatocyte proliferation is impaired [
13]. This suppression also affects hepatocyte signaling pathways, like hepatocyte growth factor (HGF), involved in proliferation and survival during liver injury [
12,
13]. Furthermore, the up-regulation of PRELI activates resistance to anti-cancer drugs in hepatocarcinoma cells [
1].
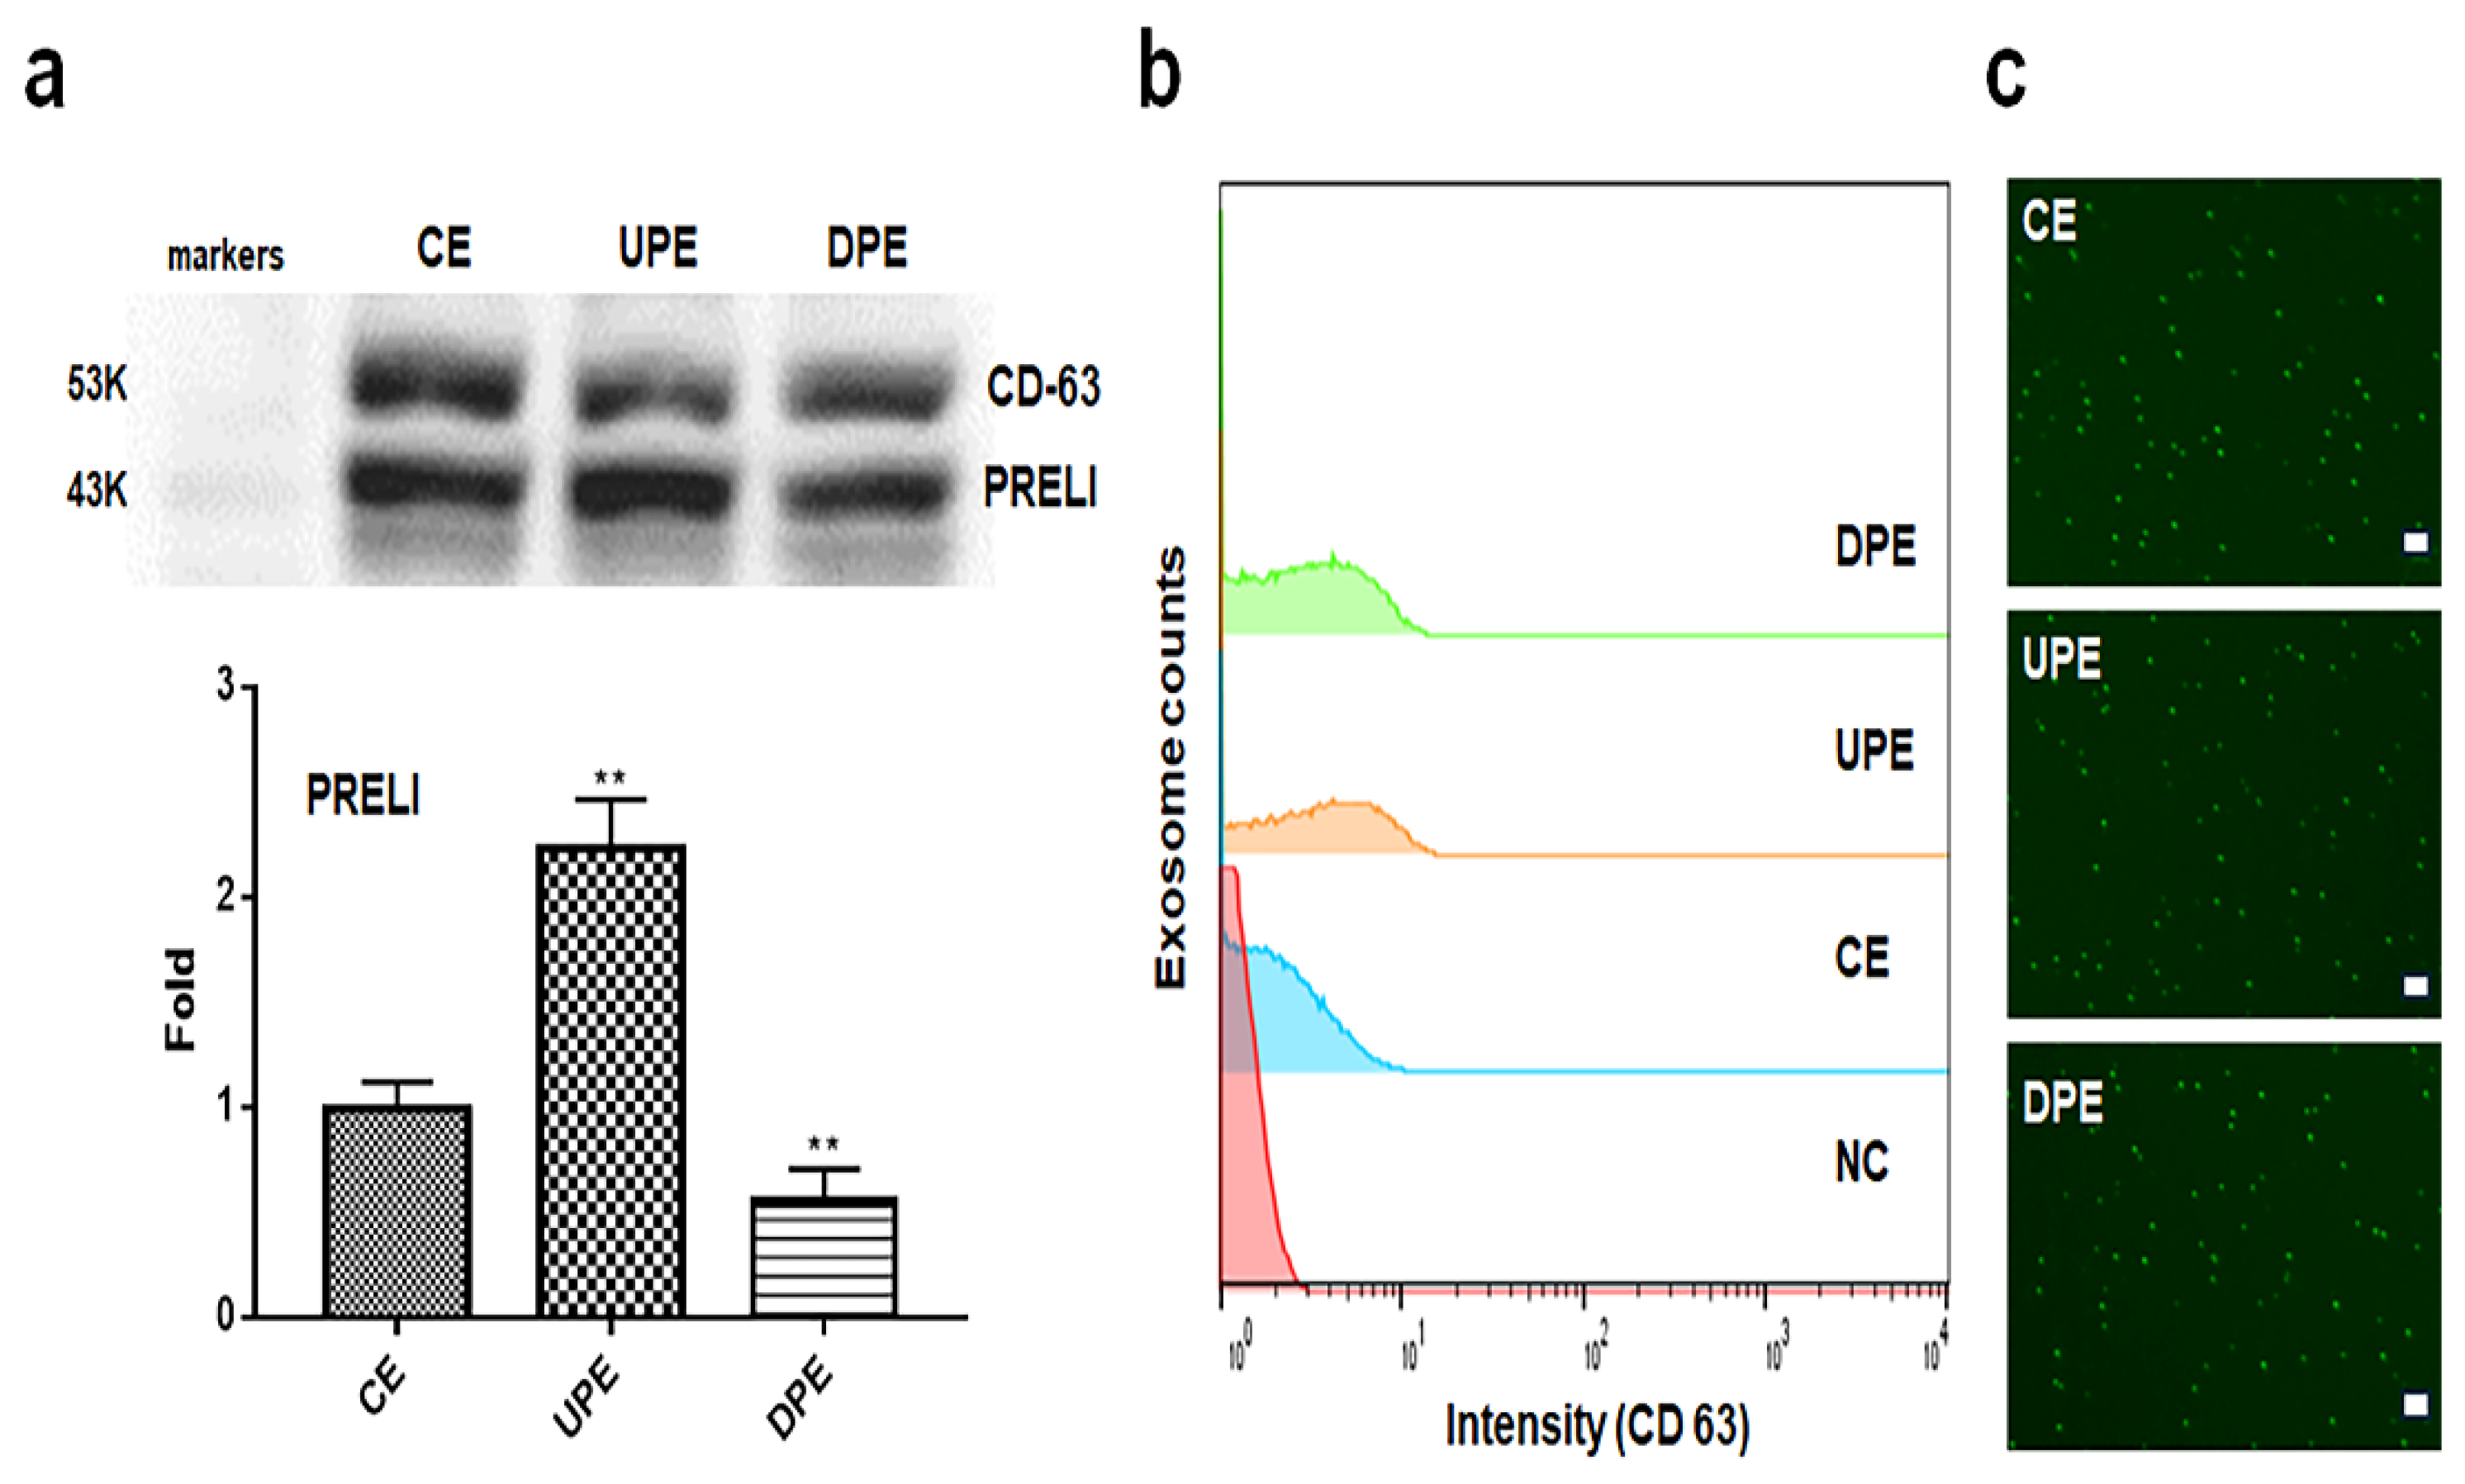
The upregulation of PRELI in exosomes from hepatocytes suggests that PRELI packaged into exosomes participates in intercellular communication, especially during stress or injury conditions. Additionally, it may have roles in mitochondrial stress responses, cellular protection, or survival under adverse conditions, such as liver injury or cancer. PRELI upregulation in these exosomes may reflect an adaptive response to stress in hepatocytes, potentially influencing mitochondrial dynamics, apoptosis, or survival pathways, including p53, Notch, or Hippo pathways in recipient cells. In this study, PRELI was modified in exosomes (
Figure 1), resulting in alterations in miRNA profiles in the induced exosomes from LCSCs (
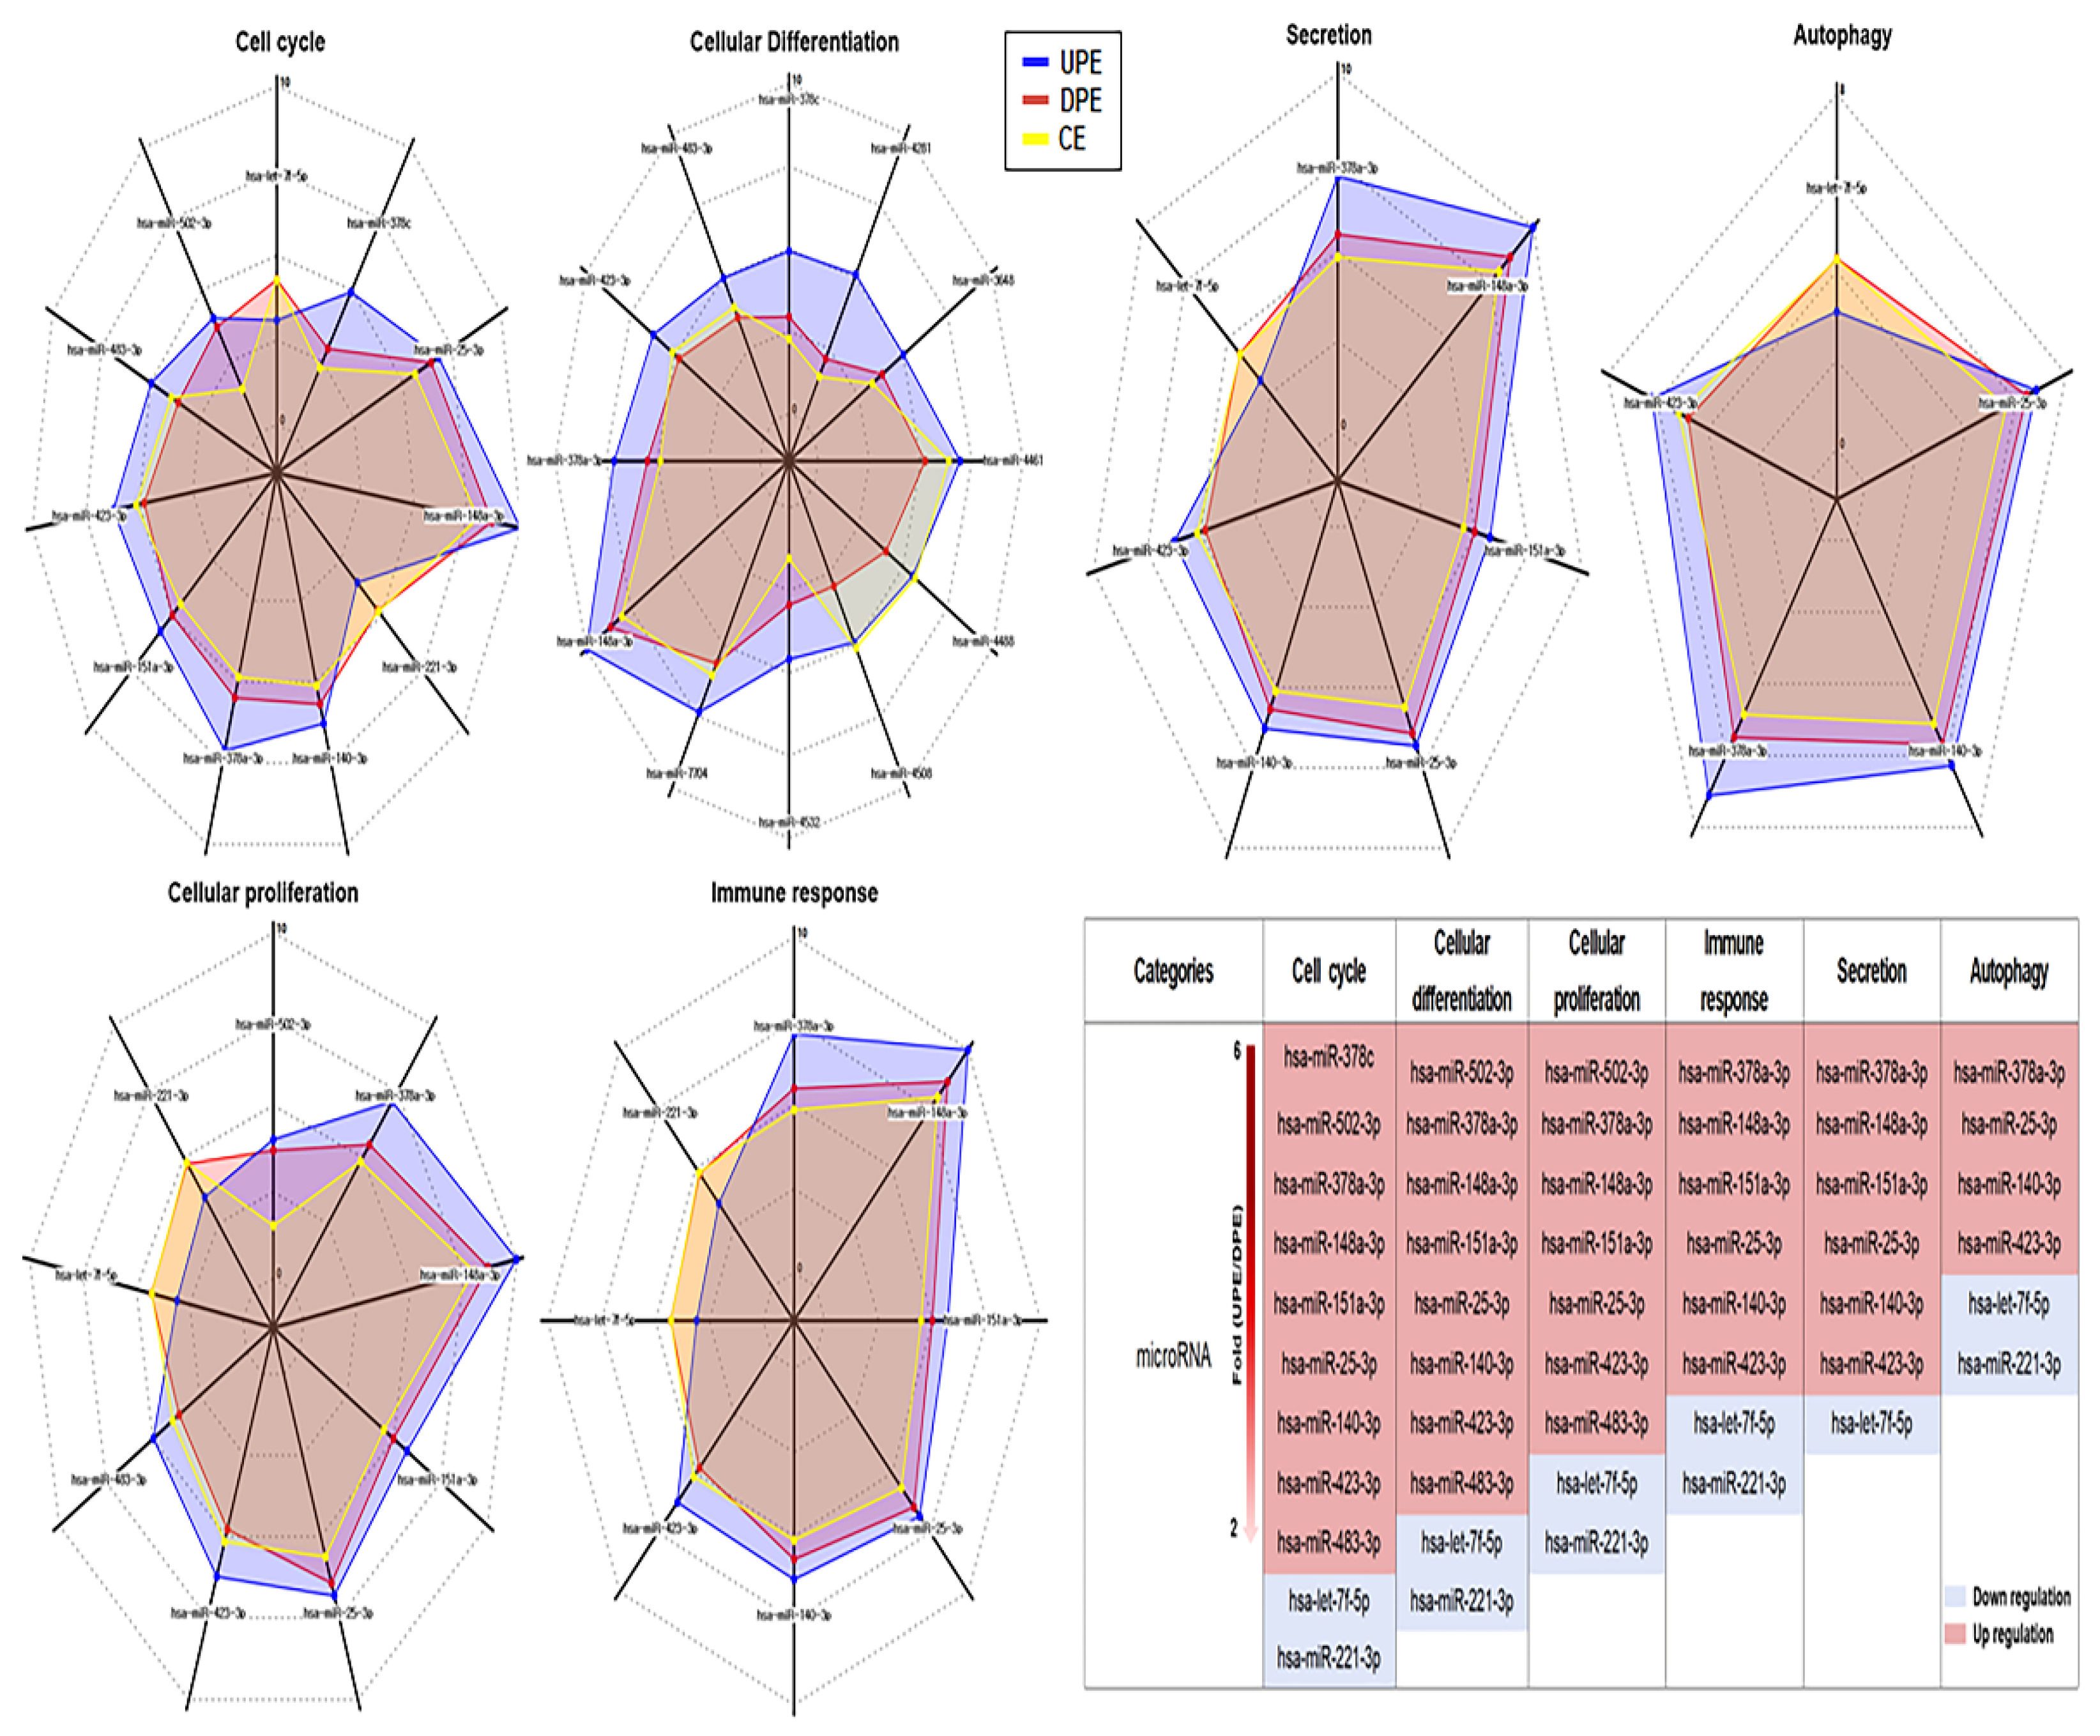
Figure 2). Among several significantly altered miRNAs, hsa-miR378a-3p, hsa-miR25-3p, and hsa-miR423-3p were related to all major functional categories (
Figure 2 and 3). hsa-miR378a-3p is involved in regulating the stem-like properties of LCSCs. It can promote self-renewal and maintain the undifferentiated state of these cells [
14]. Additionally, this gene helps LCSCs evade apoptosis, contributing to tumor persistence and progression [
14]. hsa-miR25-3p enhances cell proliferation, inhibits cell death, downregulates tumor-suppressor genes, and promotes cell growth in LCSCs [
15]. hsa-miR423-3p enhances the invasive ability of LCSCs, contributing to metastasis, and regulates the stemness and aggressive behavior of cancer cells [
16]. These results suggest that the upregulation of PRELI in hepatocytes and LCSCs plays crucial roles in the carcinogenesis of normal hepatocytes and promotes cancer-related processes. The three exosomal miRNAs induced by PRELI play vital roles in these processes during hepatocarcinogenesis. Although modulating PRELI expression is a therapeutic strategy against liver cancers, the three miRNAs may serve as more effective targets for the prevention and treatment of liver cancers.
LCSCs express various markers, including CD13, CD24, CD90, CD133, EpCAM, and oval cell marker 6 (OV-6), on their surfaces [
17]. CD24, CD90, and CD133 are associated with the AKT/mTOR signal pathway, CD13 and 133 are ERK signaling pathway components, and OV-6 and EpCAM are Wnt/β-catenin signaling pathway components [
17]. Additionally, CD24, CD133, and EpCAM activate signaling pathways associated with resistance to anti-hepatocarcinoma drugs, including sorafenib, cisplatin, doxorubicin, and fluorouracil (5-FU) [
18,
19,
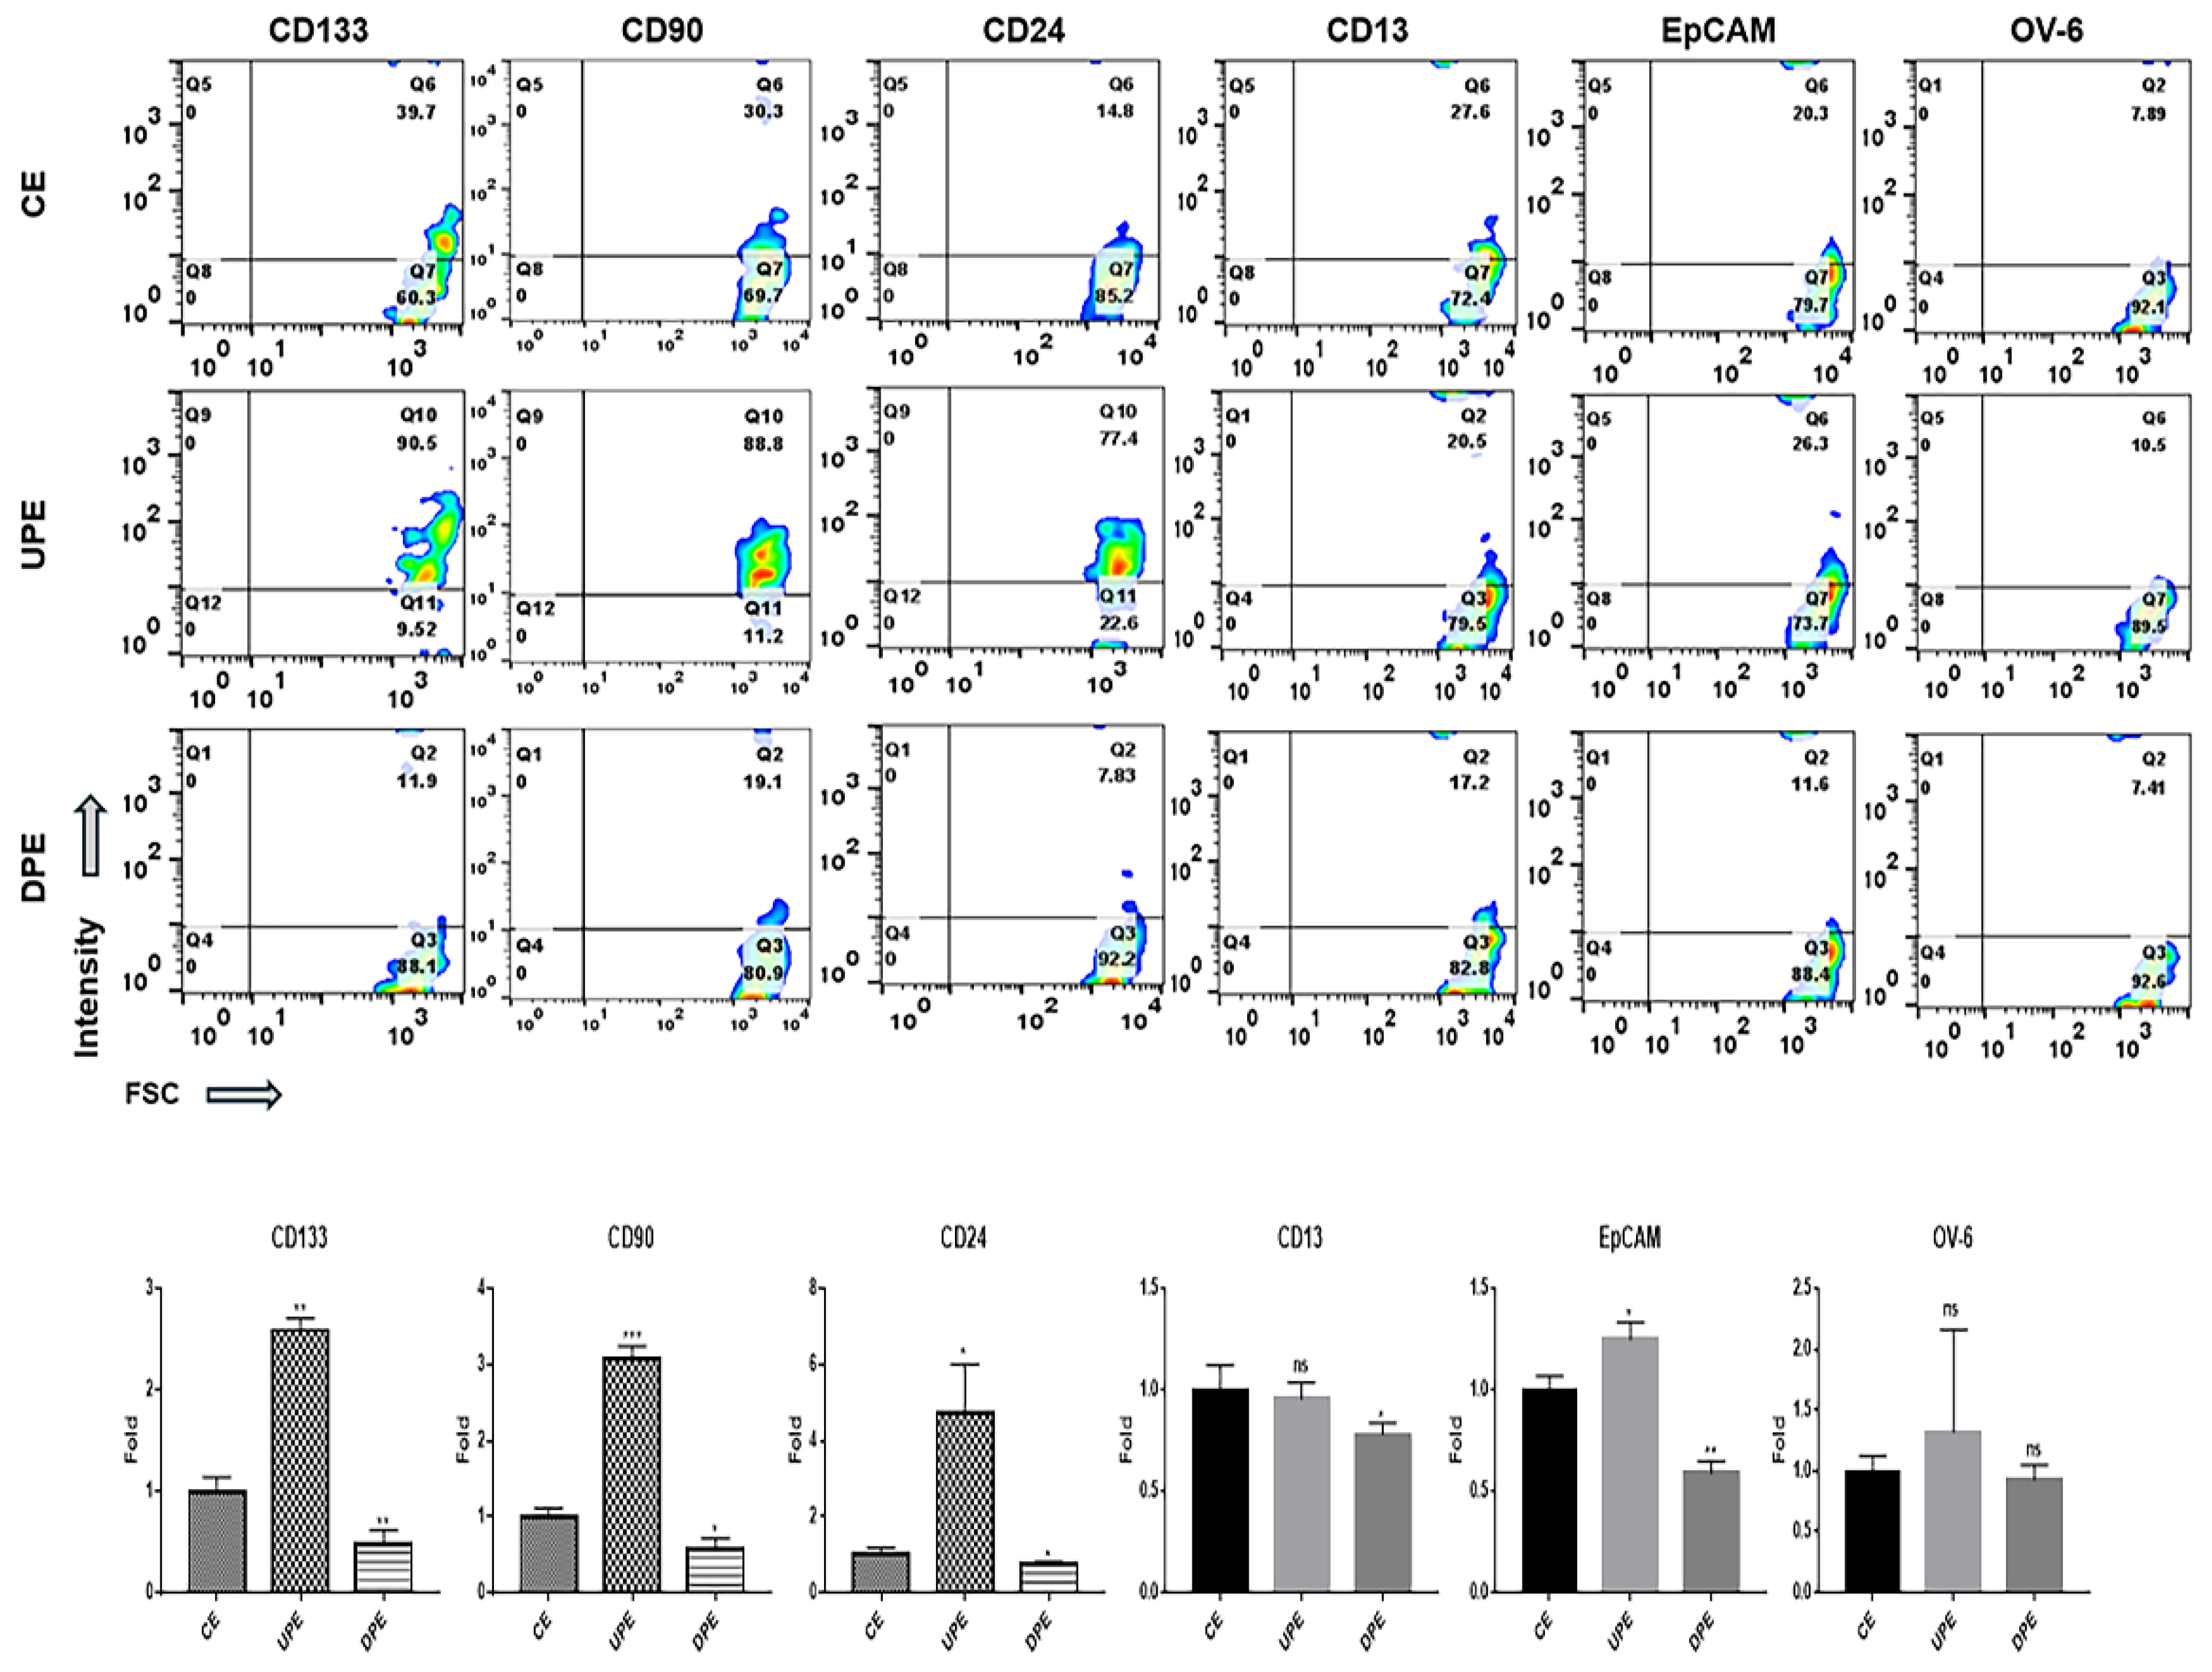
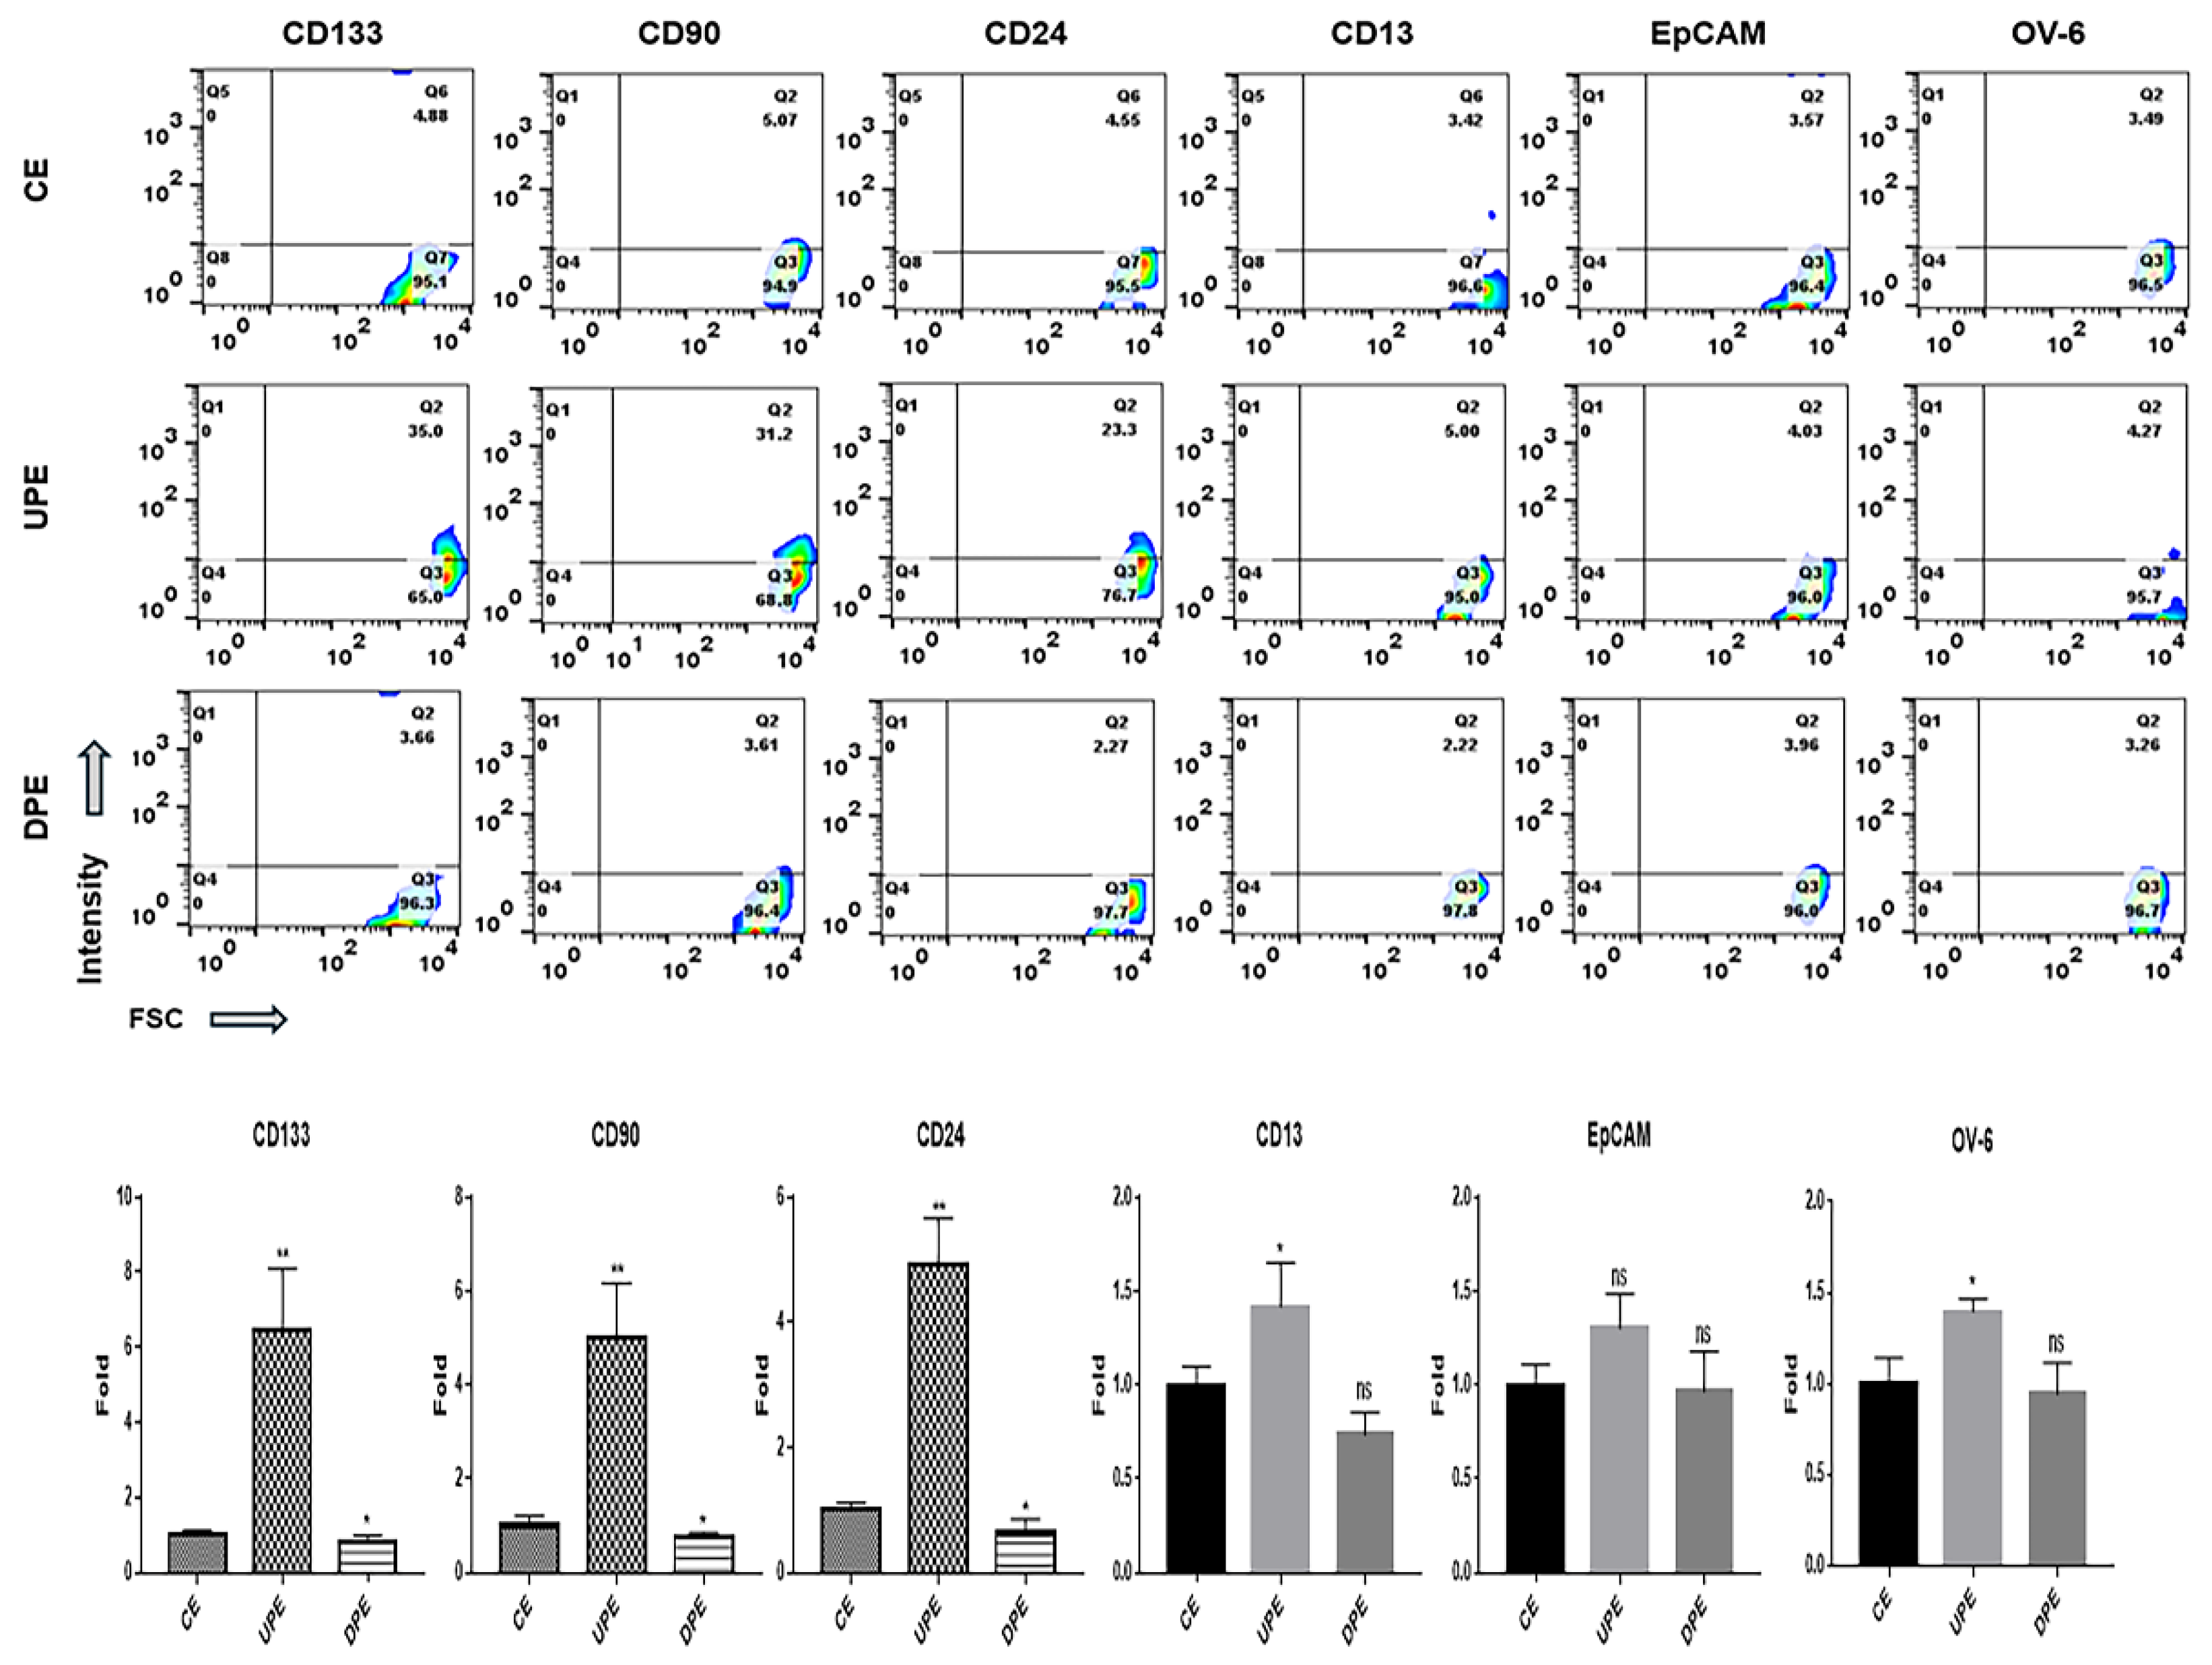
20]. Different from DPE, under UPE, LCSCs and NH showed the upregulation of CD24, CD90, and CD133 on their surfaces (
Figure 4 and 5). According to recent reports [
21,
22,
23], CD24 is involved in the regulation of stem cell properties, enhancing cell adhesion and migration as well as tumor growth. CD90 and CD133 are associated with tumorigenic potential and invasiveness, respectively [
21,
22,
23]. These findings suggest that UPE enhances the sensitivity of cells to external stimuli and promotes cancer activity by upregulating surface marker expression. Moreover, these effects of UPE facilitate the initiation of hepatocarcinogenesis from normal hepatocytes. Interestingly, DPE or anti-miRNAs targeting these miRNAs hold potential as therapeutic agents for liver cancers.
One of the key findings of this study is the identification of an additional signaling pathway related to the treatment of liver cancer. Although p53, Notch, and Hippo pathways have provided a basis for the development of various liver cancer drugs [
24,
25], liver cancer drugs (sorafenib) targeting these pathways often show significant side effects, including hand-foot syndrome, hypertension, diarrhea, and fatigue [
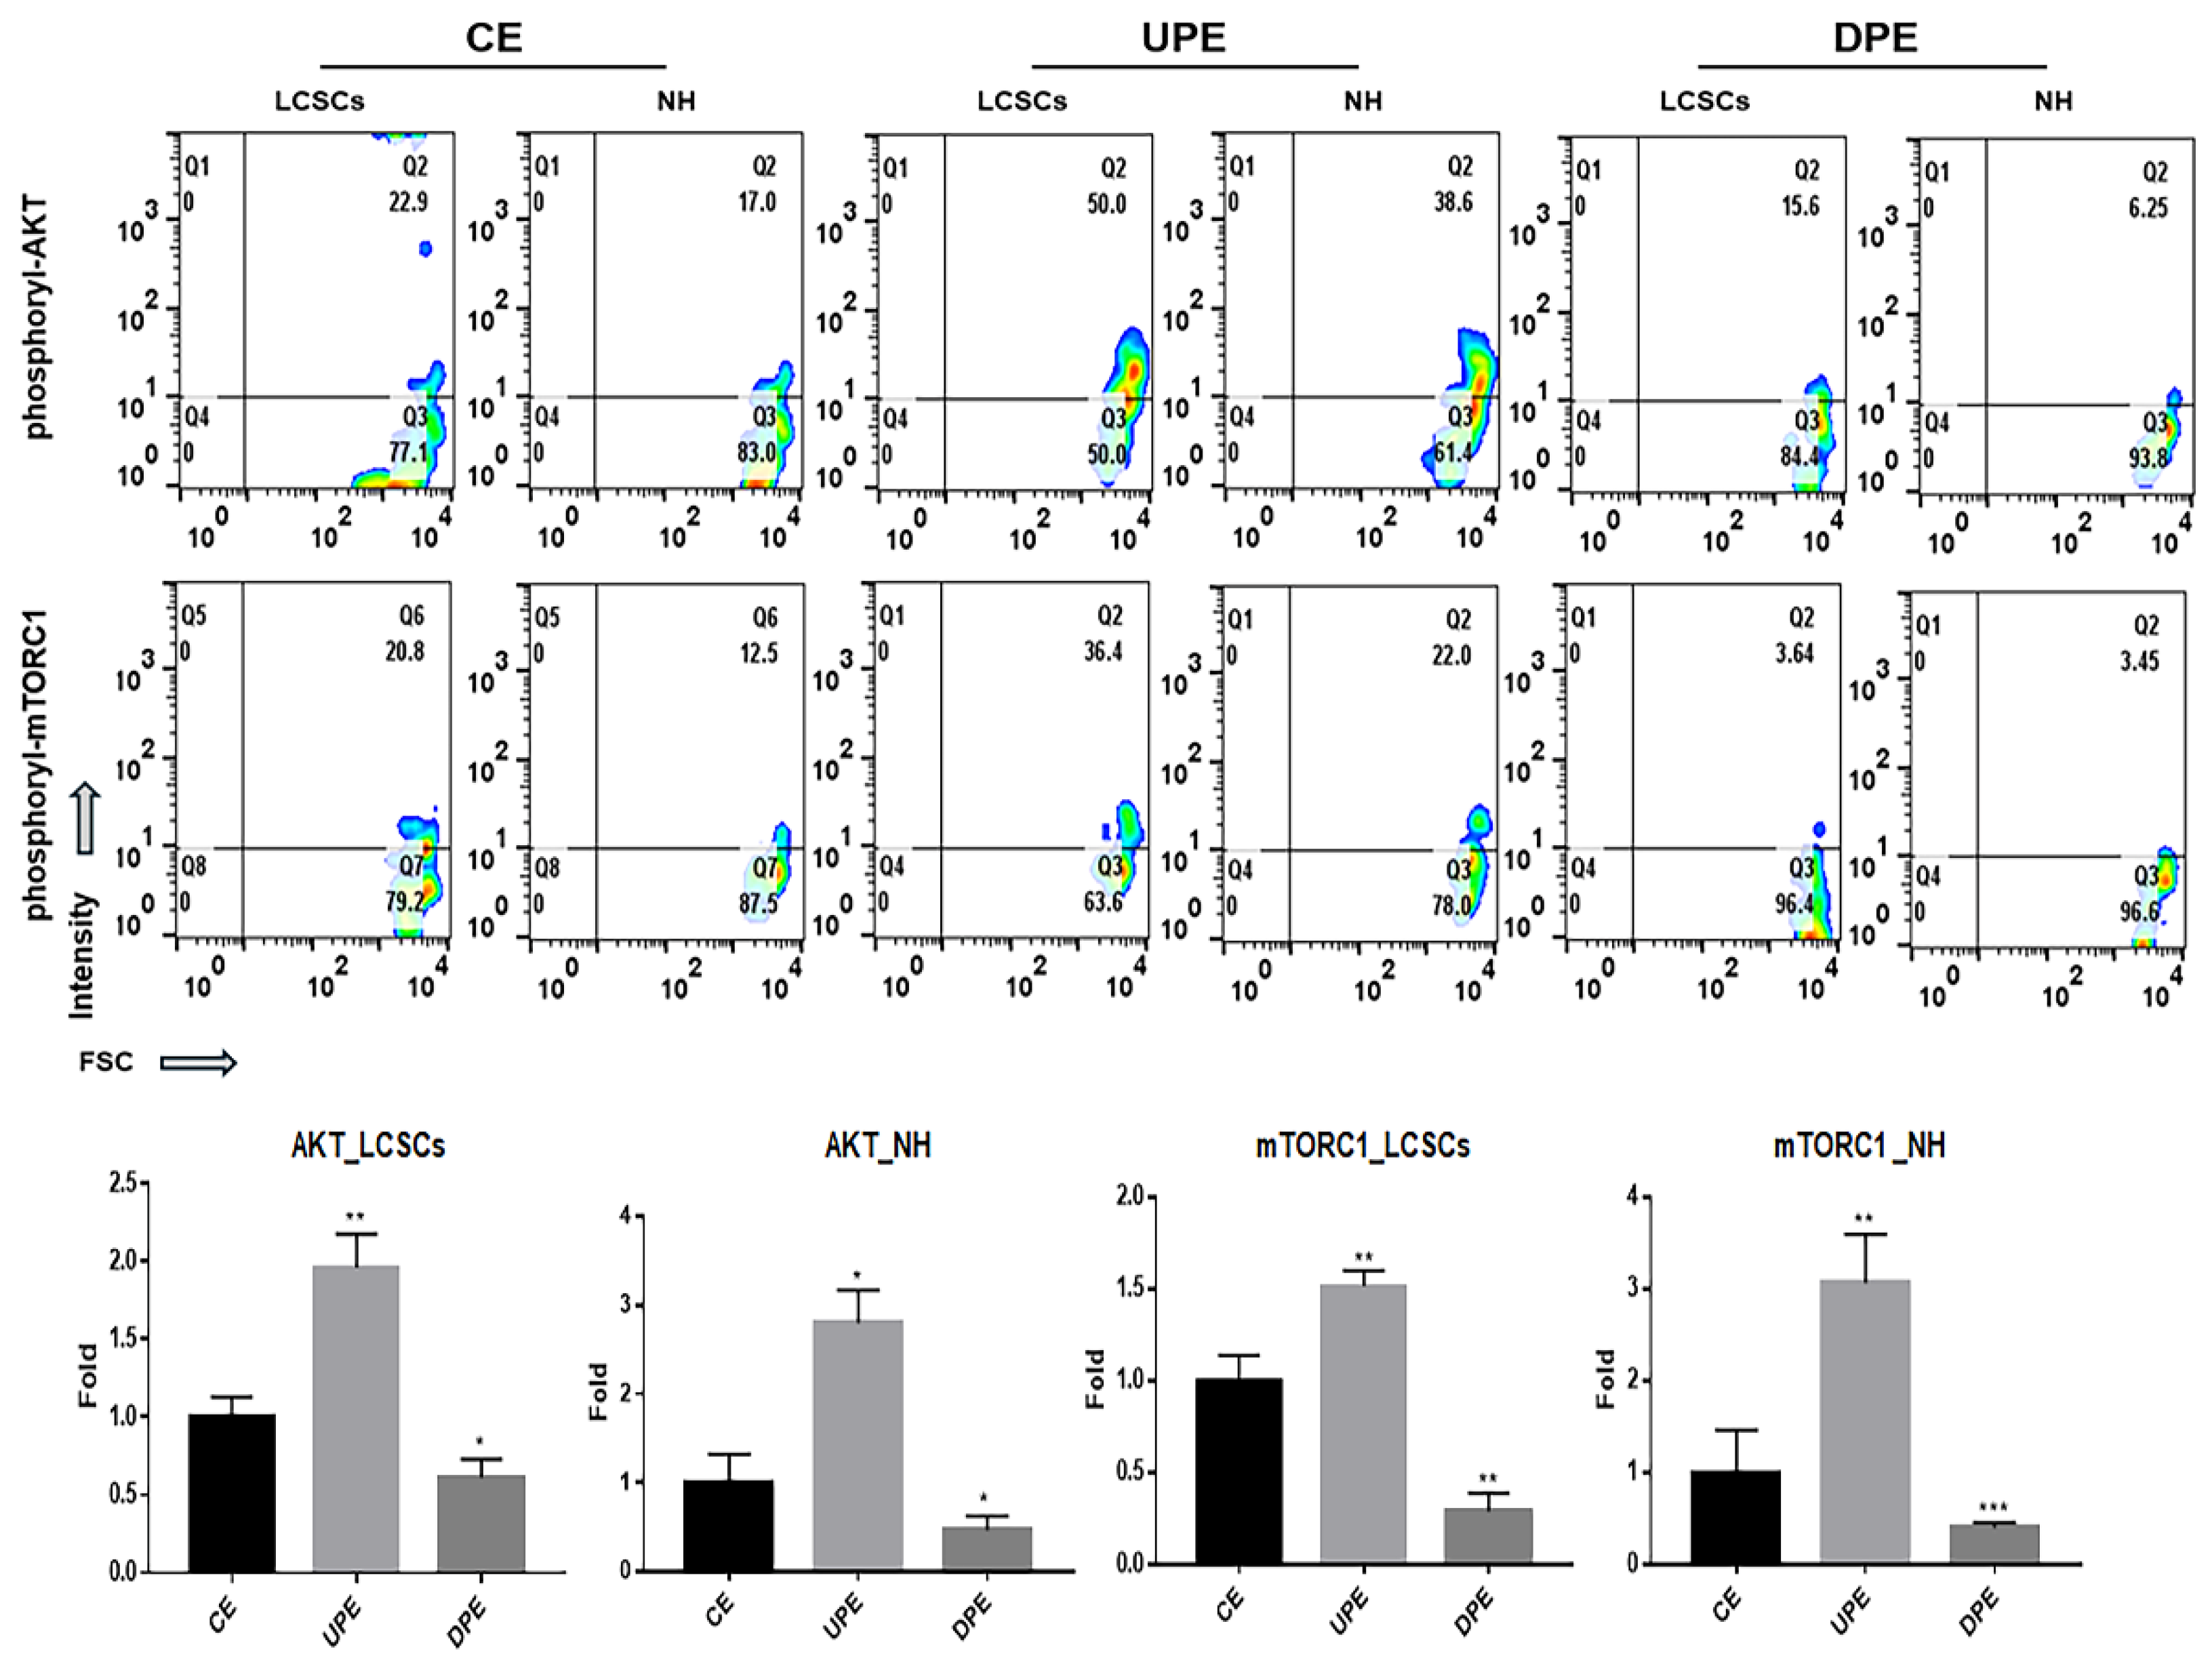
26]. Although DPE suppressed the AKT/mTORC1 signaling pathway in LCSCs and LH (
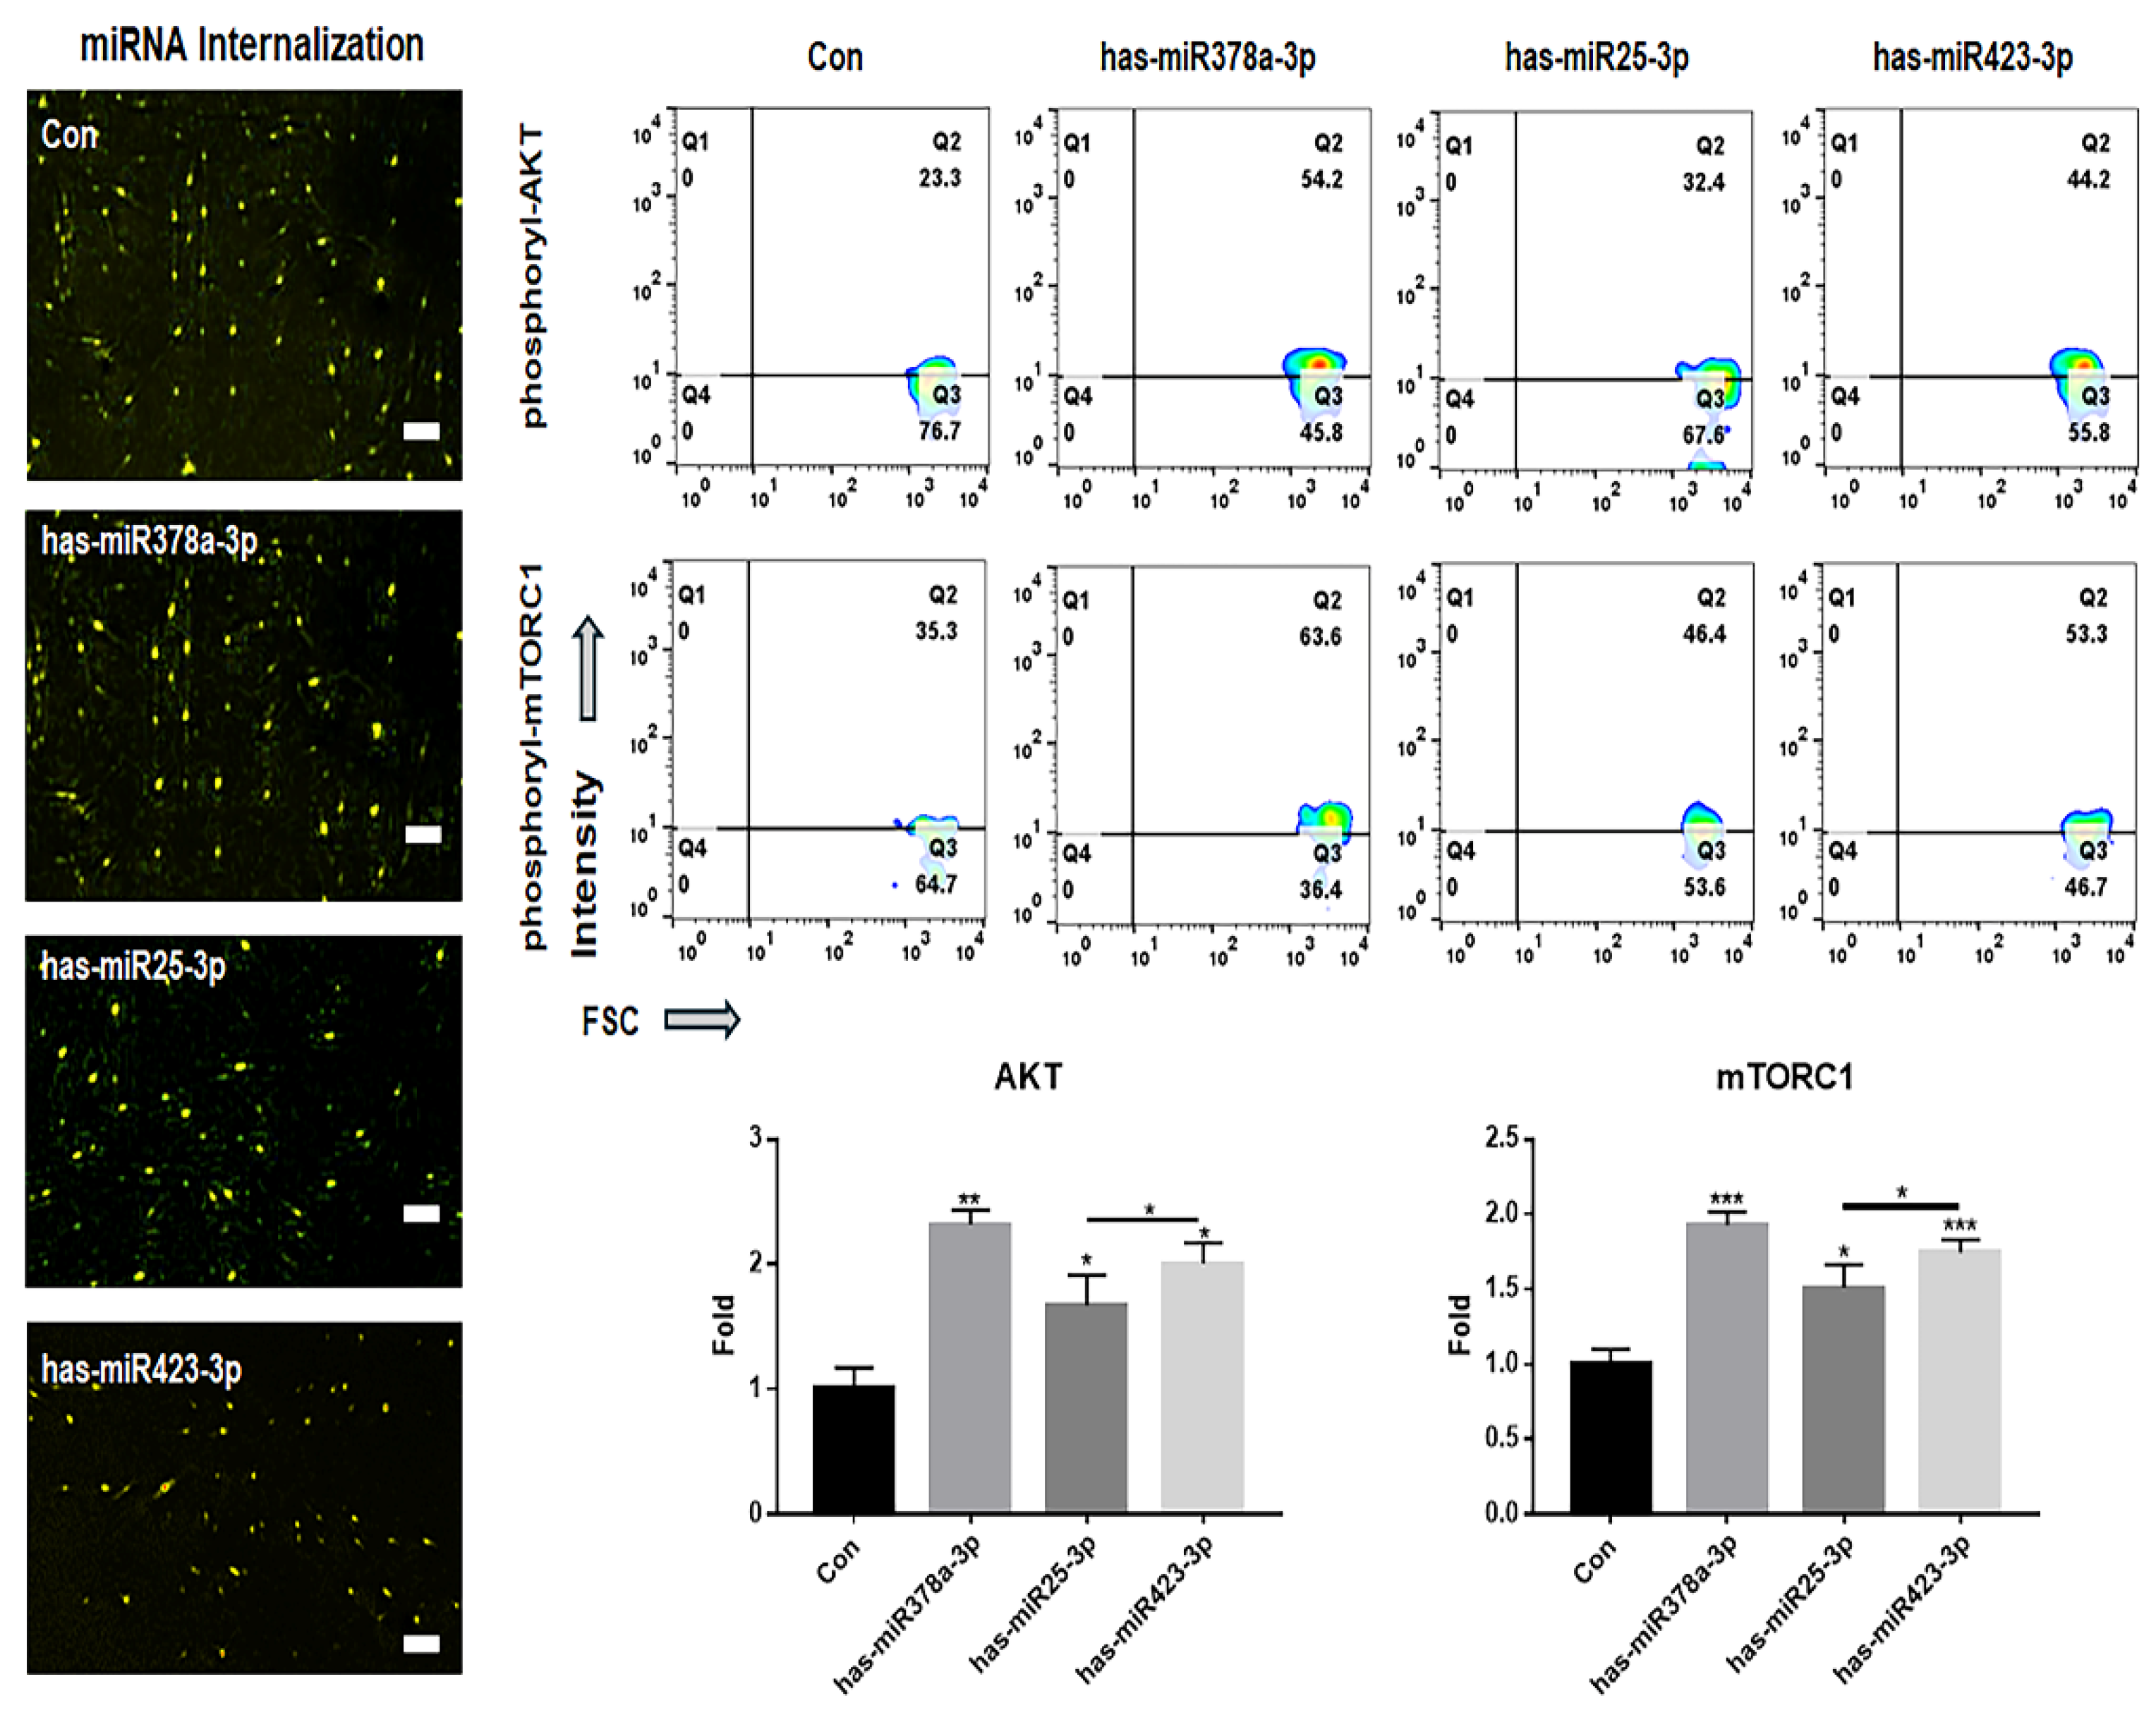
Figure 6), the transfection of the three miRNAs identified in this study in LCSCs activated the signaling pathway (
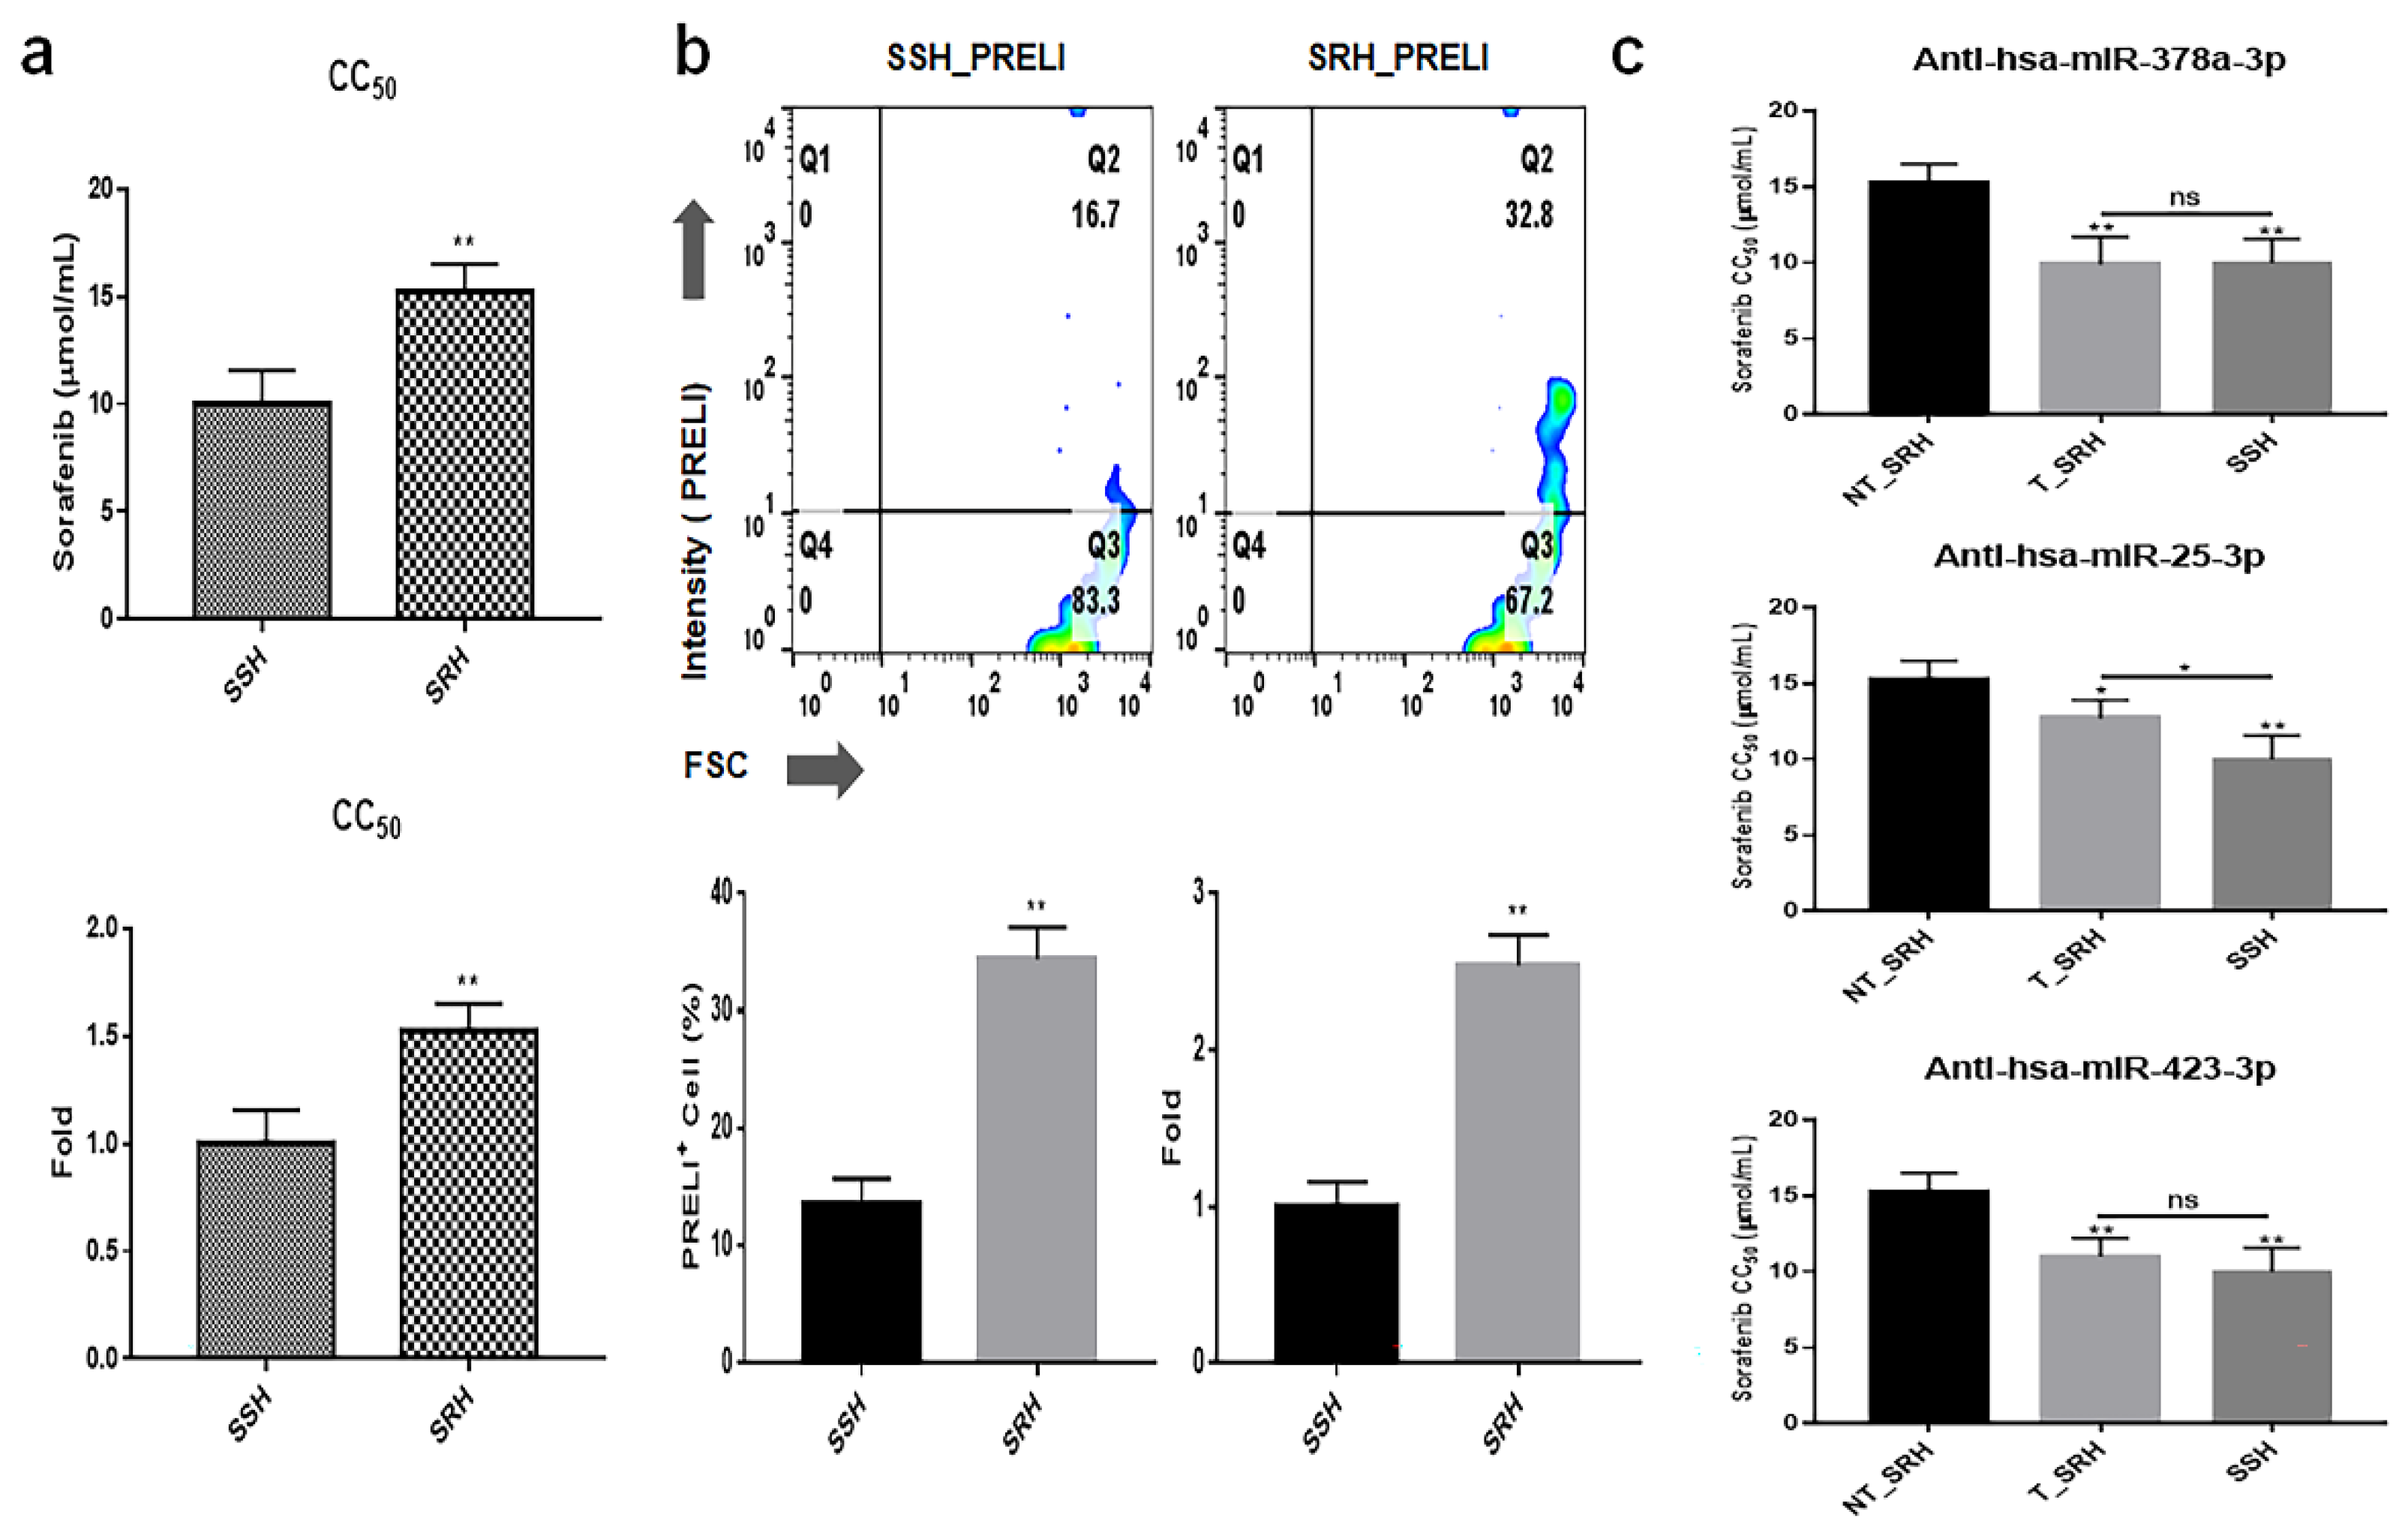
Figure 7). Interestingly, SRH cells transfected with the anti-miRNA siRNAs showed attenuated resistance to sorafenib, similar to the resistance levels observed in NH cells (
Figure 8). The AKT signaling pathway was found to modulate resistance to sorafenib [
27]. These results suggest that the three anti-miRNA siRNAs have potential as therapeutic agents to prevent drug resistance in liver cancer treatment.
Consequently, both DPE and UPE altered the expression of various miRNAs, influencing cancer-related processes in LCSCs, promoting tumorigenesis in NH, and modulating the AKT/mTORC1 signaling pathway. Notably, three specific miRNAs (hsa-miR-378a-3p, hsa-miR-25-3p, and hsa-miR-423-3p) played a pivotal role in regulating the AKT/mTORC1 signaling pathway in LCSCs. The combined action of DPE and these miRNAs represents a promising avenue for the development of new therapeutic strategies for liver cancers
5. Conclusions
This study provides significant insights into the biological roles of exosomes derived from LCSCs with the modulation of PRELI, highlighting the critical function of DPE and UPE in regulating miRNAs and signaling pathways involved in liver cancer progression. Three miRNAs, hsa-miR-378a-3p, hsa-miR-25-3p, and hsa-miR-423-3p, were identified as pivotal modulators of the AKT/mTORC1 signaling pathway in LCSCs, promoting tumorigenesis and enhancing cancer stem cell properties. Strategies based on a combination of DPE and these miRNAs are promising for liver cancer treatment and prevention. Despite the therapeutic value of the p53, Notch, and Hippo pathways, liver cancer drugs based on these pathways, like sorafenib, often lead to significant side effects, necessitating alternative strategies.
However, this study had several limitations. First, the mechanisms underlying the interaction between PRELI, exosomal miRNAs, and the AKT/mTORC1 pathway require further clarification, especially using in vivo models. The data in this study are largely based on in vitro experiments, which may not fully represent the complexity of liver cancer progression and treatment responses. Additionally, while the candidate miRNAs show potential for therapeutic applications, their specificity and potential off-target effects need to be thoroughly evaluated. Future research should also focus on optimizing the delivery mechanisms for these miRNAs to ensure their stability and efficacy in clinical settings. Addressing these limitations will be crucial for translating these findings into viable therapeutic strategies for liver cancer.
Figure 1.
Purification of exosomes isolated from PRELI-modulated LCSCs. (a) Marker detection (CD63) and expression levels of PRELI in purified exosomes, as evaluated using western blotting. (b and c) Evaluation of purified exosomes with FITC-CD63 antibodies using flow cytometry (b) and fluorescence microscopy (c). CE; control cellular exosomes, UPE; up-regulated PRELI cellular exosomes, DPE; down-regulated PRELI cellular exosomes, NC; unstained exosomes (**p < 0.01), scale bar = 20 µm.
Figure 2.
Profiling of exosomes from PRELI-modulated LCSCs. (a) Identification of significant miRNAs in the exosomes. (b) Comparison of miRNA levels among three types of exosomes. (c) Biochemical functions (1. Aging, 2. Angiogenesis, 3. Apoptosis, 4. Autophagy, 5. Cell cycle, 6. Cell differentiation, 7. Cell migration, 8. Cell proliferation, 9. DNA repair, 10. Immune response, 11. Inflammatory response, 12. Neurogeneration, 13. Secretion) associated with significant miRNAs in the induced exosomes and alterations of miRNA levels in each of the functional categories. Numbers above bar graphs indicate the number of differentially expressed miRNAs. CE; control cellular exosomes, UPE; up-regulated PRELI cellular exosomes, DPE; down-regulated PRELI cellular exosomes (p < 0.05).
Figure 3.
Alterations of miRNAs associated with six biochemical categories in three types of exosomes. (CE; control cellular exosomes, UPE; up-regulated PRELI cellular exosomes, DPE; down-regulated PRELI cellular exosomes) (p < 0.05).
Figure 3.
Alterations of miRNAs associated with six biochemical categories in three types of exosomes. (CE; control cellular exosomes, UPE; up-regulated PRELI cellular exosomes, DPE; down-regulated PRELI cellular exosomes) (p < 0.05).
Figure 4.
Expression of markers in LCSCs exposed to various exosomes. (CE; control cellular exosomes, UPE; up-regulated PRELI cellular exosomes, DPE; down-regulated PRELI cellular exosomes). Ns; not significant (*p < 0.05, **p < 0.01, ***p < 0.001).
Figure 4.
Expression of markers in LCSCs exposed to various exosomes. (CE; control cellular exosomes, UPE; up-regulated PRELI cellular exosomes, DPE; down-regulated PRELI cellular exosomes). Ns; not significant (*p < 0.05, **p < 0.01, ***p < 0.001).
Figure 5.
Expression of typical LCSC markers in normal hepatocytes exposed to various exosomes. (CE; control cellular exosomes, UPE; up-regulated PRELI cellular exosomes, DPE; down-regulated PRELI cellular exosomes). Ns; not significant (*p < 0.05, **p < 0.01). .
Figure 5.
Expression of typical LCSC markers in normal hepatocytes exposed to various exosomes. (CE; control cellular exosomes, UPE; up-regulated PRELI cellular exosomes, DPE; down-regulated PRELI cellular exosomes). Ns; not significant (*p < 0.05, **p < 0.01). .
Figure 6.
Levels of AKT signaling molecules (phosphorylated AKT and phosphorylated mTORC1) in normal hepatocytes and LCSCs under various exosomes. (CE; control cellular exosomes, UPE; up-regulated PRELI cellular exosomes, DPE; down-regulated PRELI cellular exosomes) (*p < 0.05, **p < 0.01).
Figure 6.
Levels of AKT signaling molecules (phosphorylated AKT and phosphorylated mTORC1) in normal hepatocytes and LCSCs under various exosomes. (CE; control cellular exosomes, UPE; up-regulated PRELI cellular exosomes, DPE; down-regulated PRELI cellular exosomes) (*p < 0.05, **p < 0.01).
Figure 7.
Expression of AKT signaling molecules in LCSCs under miRNA treatment. The merged images showed the internalized fluorescence-labeled GAPDH-siRNAs (GFP; green fluorescent proteins) and miRNA (Cy5; cyanine 5) in LCSCs. The expression levels of AKT signaling molecules (phosphorylated AKT and phosphorylated mTORC1) in LCSCs transfected with the fluorescence (Cy5)-labeled miRNAs including hsa-miR378a-3p, hsa-miR25-3p and hsa-miR423-3p and positive control siRNAs (GFP-GAPDH -siRNA) (*p < 0.05, **p < 0.01, ***p < 0.001) (scale bars = 20 μm).
Figure 8.
Attenuation of drug resistance and cellular viability in SRH upon inhibition of three miRNAs. (a) Results from modeling drug resistance. (b) Expression levels of PRELI in SSH (sorafenib-sensitive hepatocytes) and SRH (sorafenib-resistant hepatocytes). (c) Drug resistance in cells transfected with anti-miRNA siRNAs. CC50: Cytotoxic concentration 50; NT: Non-transfected; T: Transfected. (*p < 0.05, **p < 0.01). .

