Submitted:
01 October 2024
Posted:
01 October 2024
You are already at the latest version
Abstract
Keywords:
1. Introduction
2. Materials and Methods
2.1. Subjects
2.2. Definitions
2.3. Study Design
2.4. Statistical Analysis
3. Results
3.1. Patient Characteristics by Aneurysm Type
3.2. Pulmonary Diseases at AA Diagnosis
3.3. Pulmonary Diseases during Follow-Up Periods
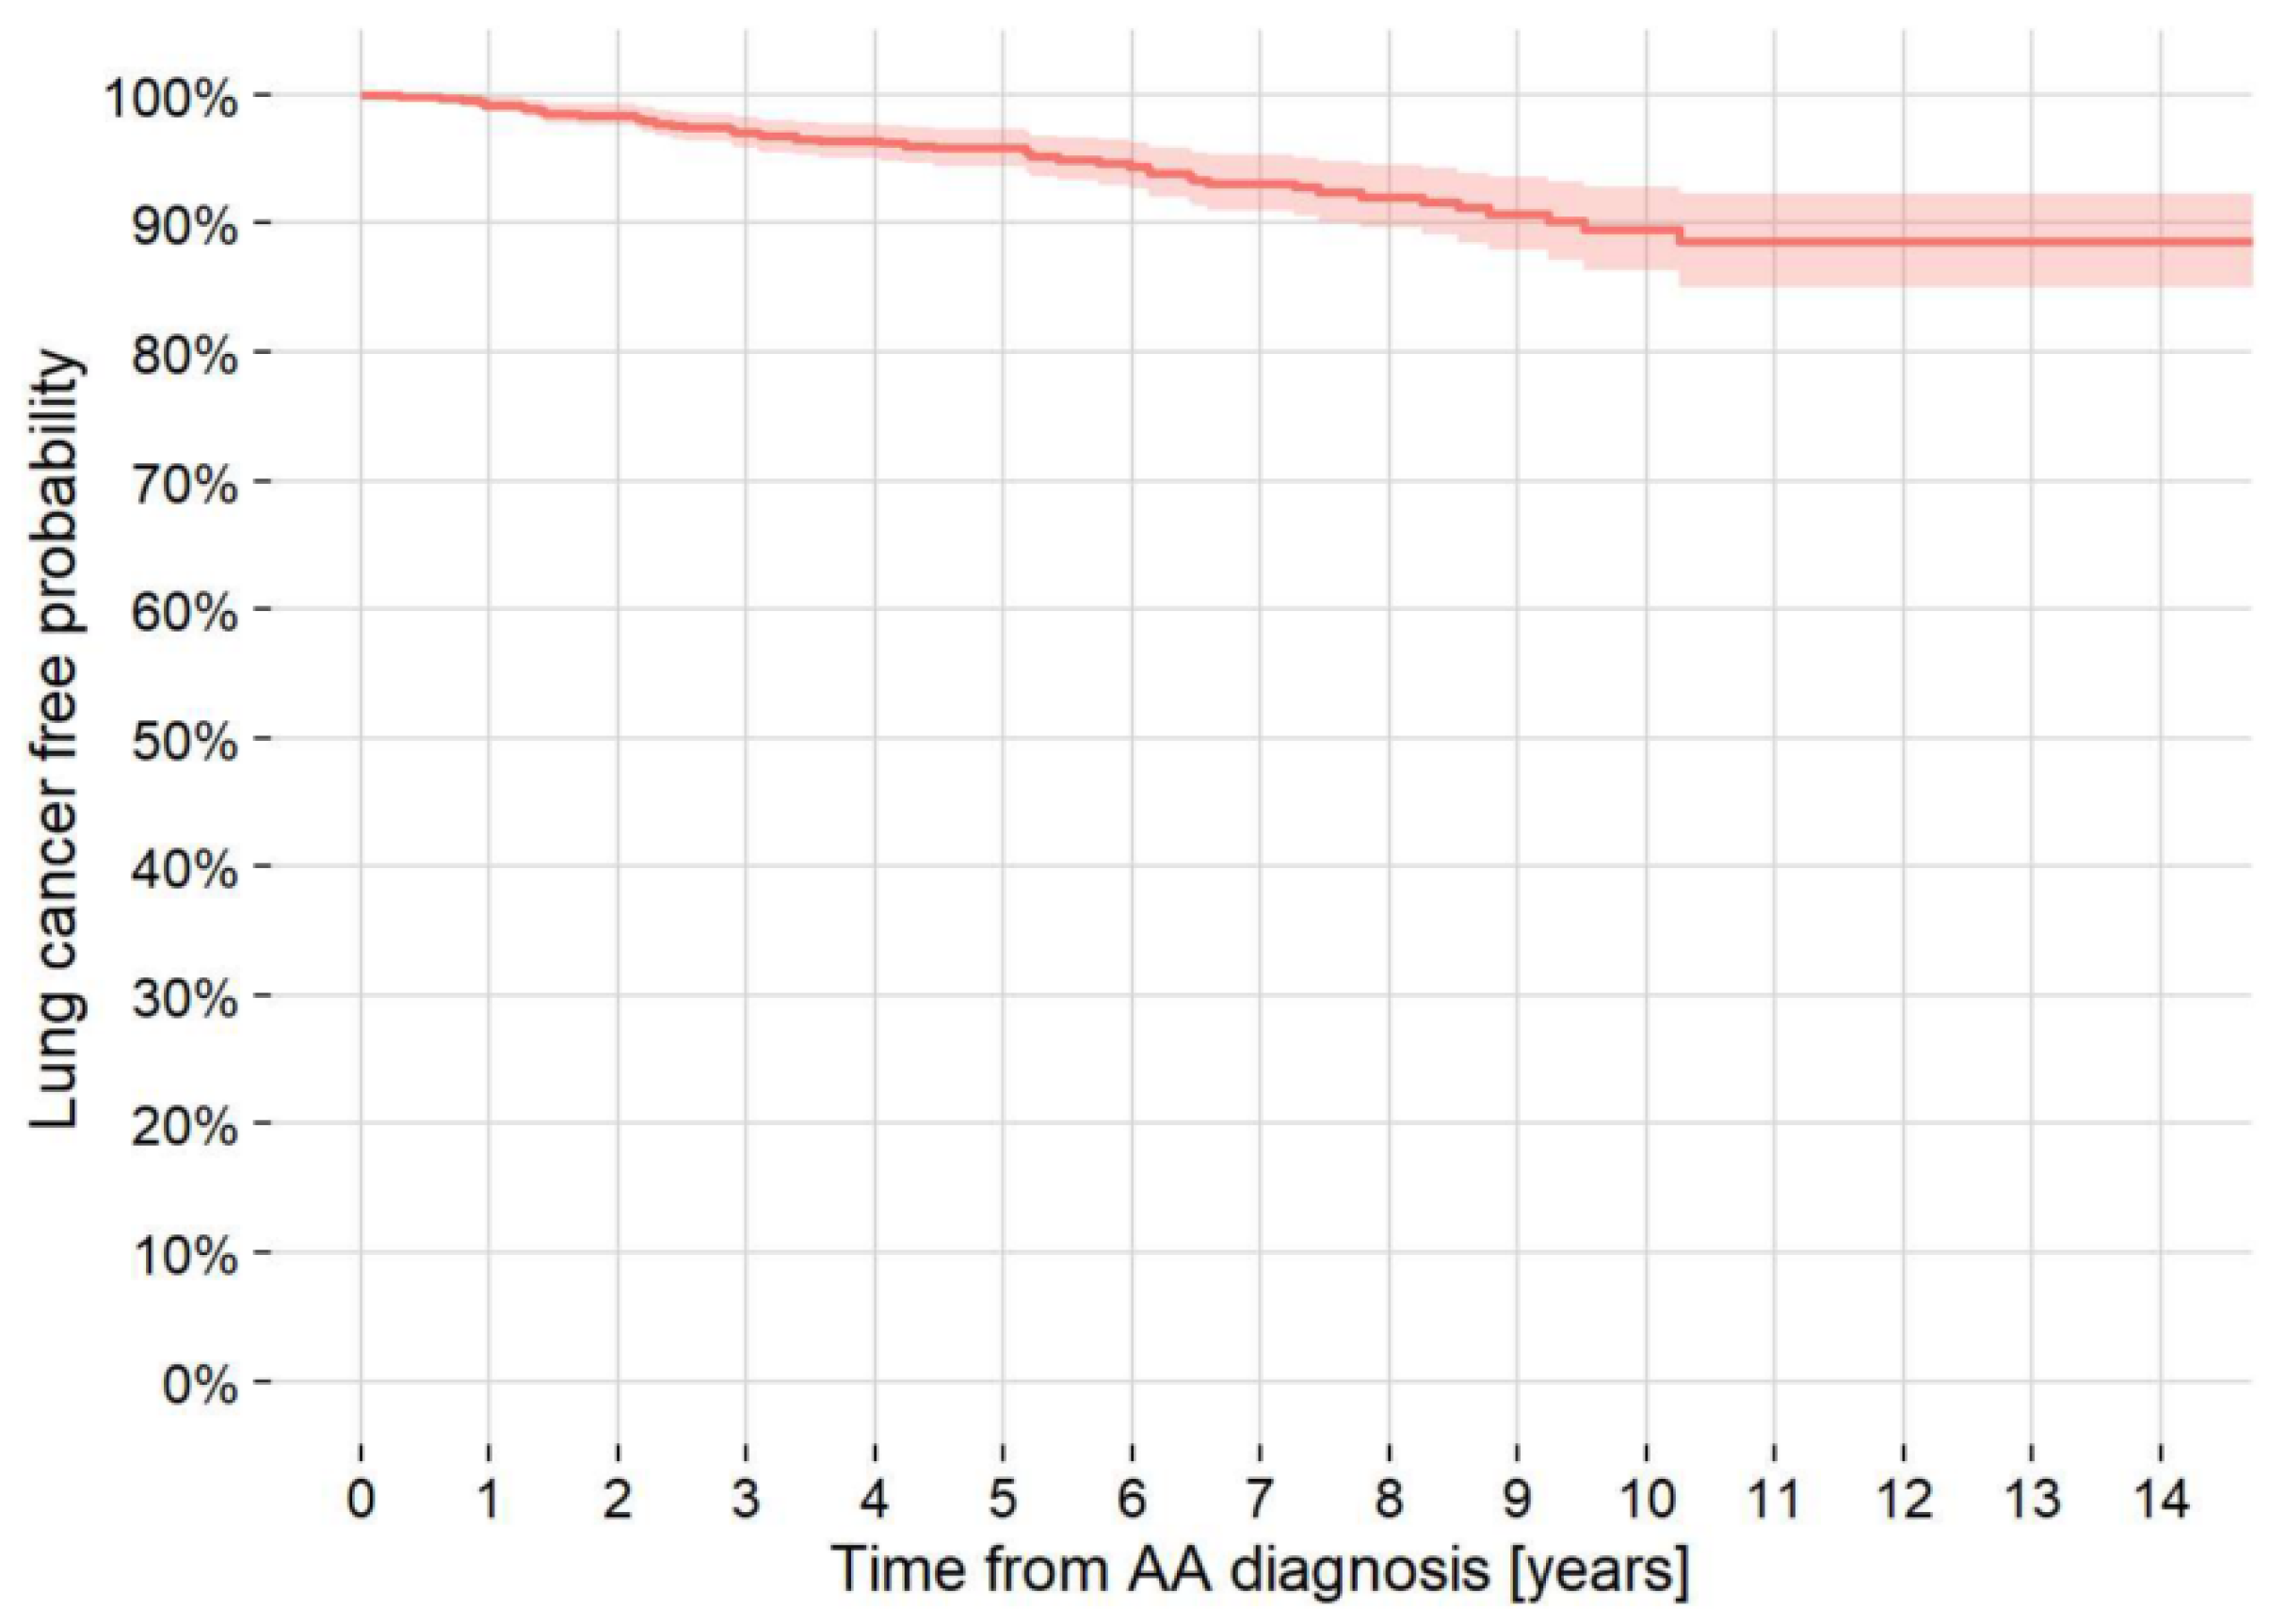
3.4. LC at AA Diagnosis/Follow-Up
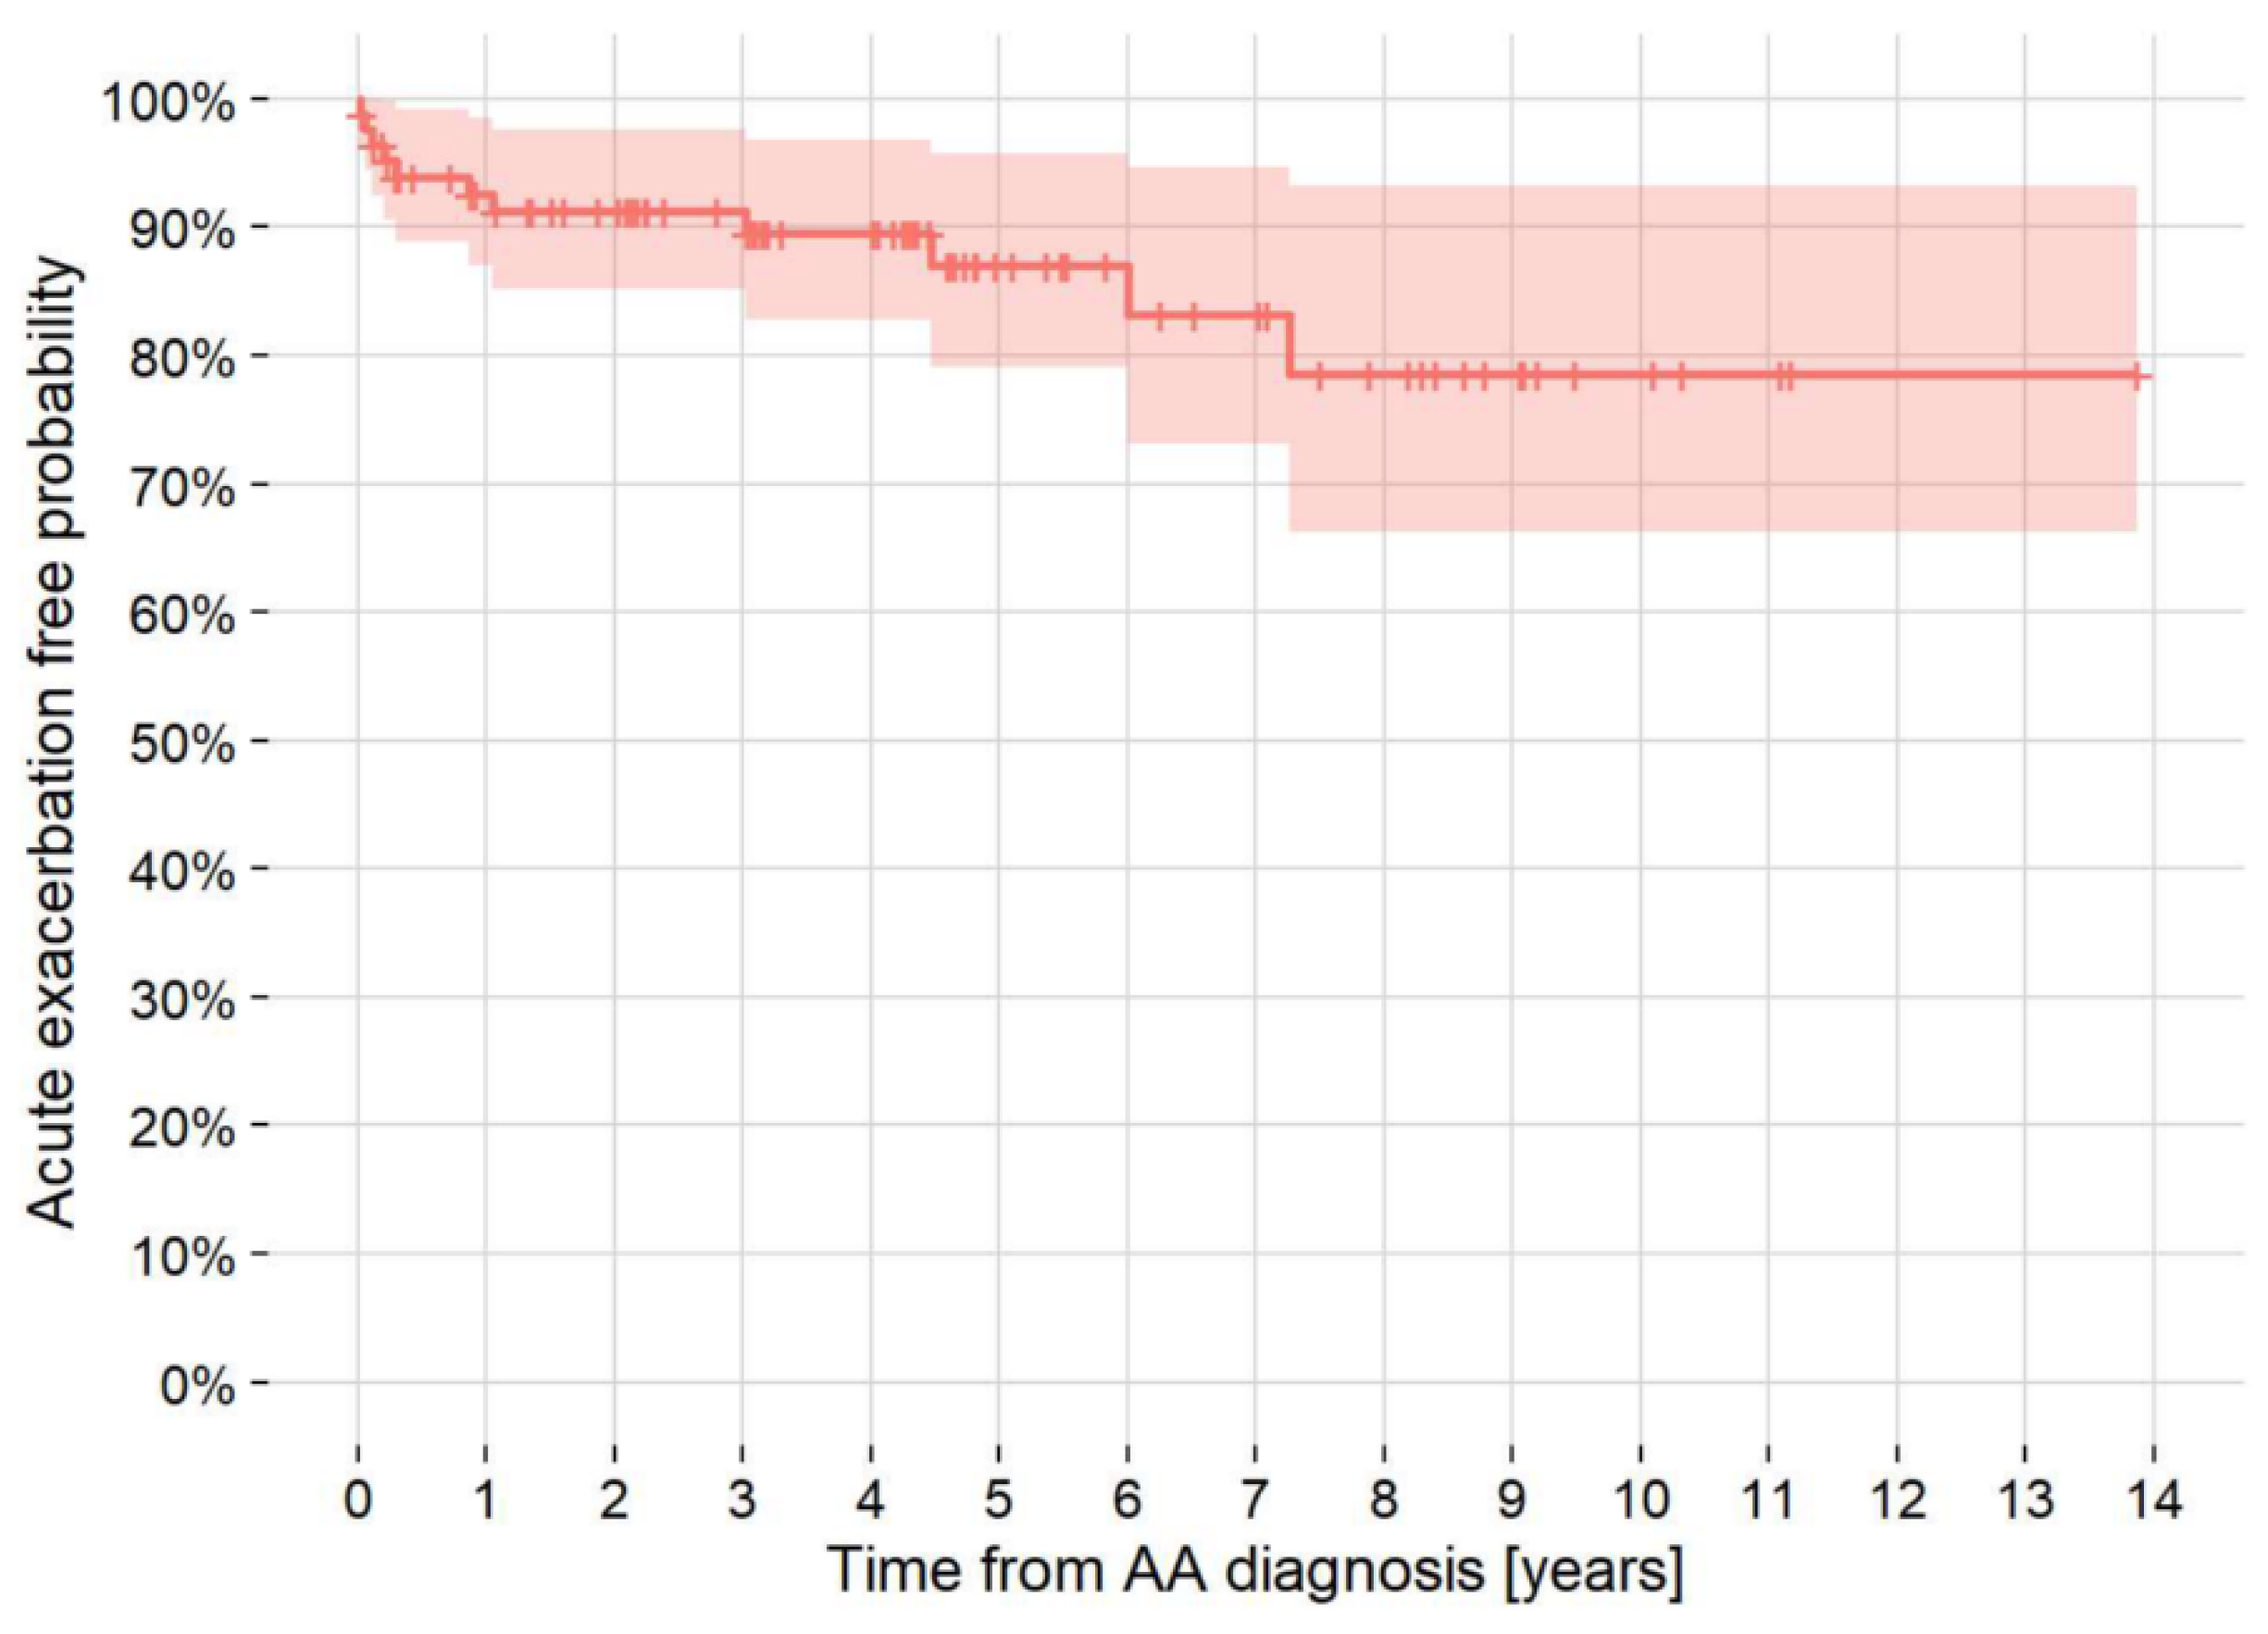
3.5. AE-IPF
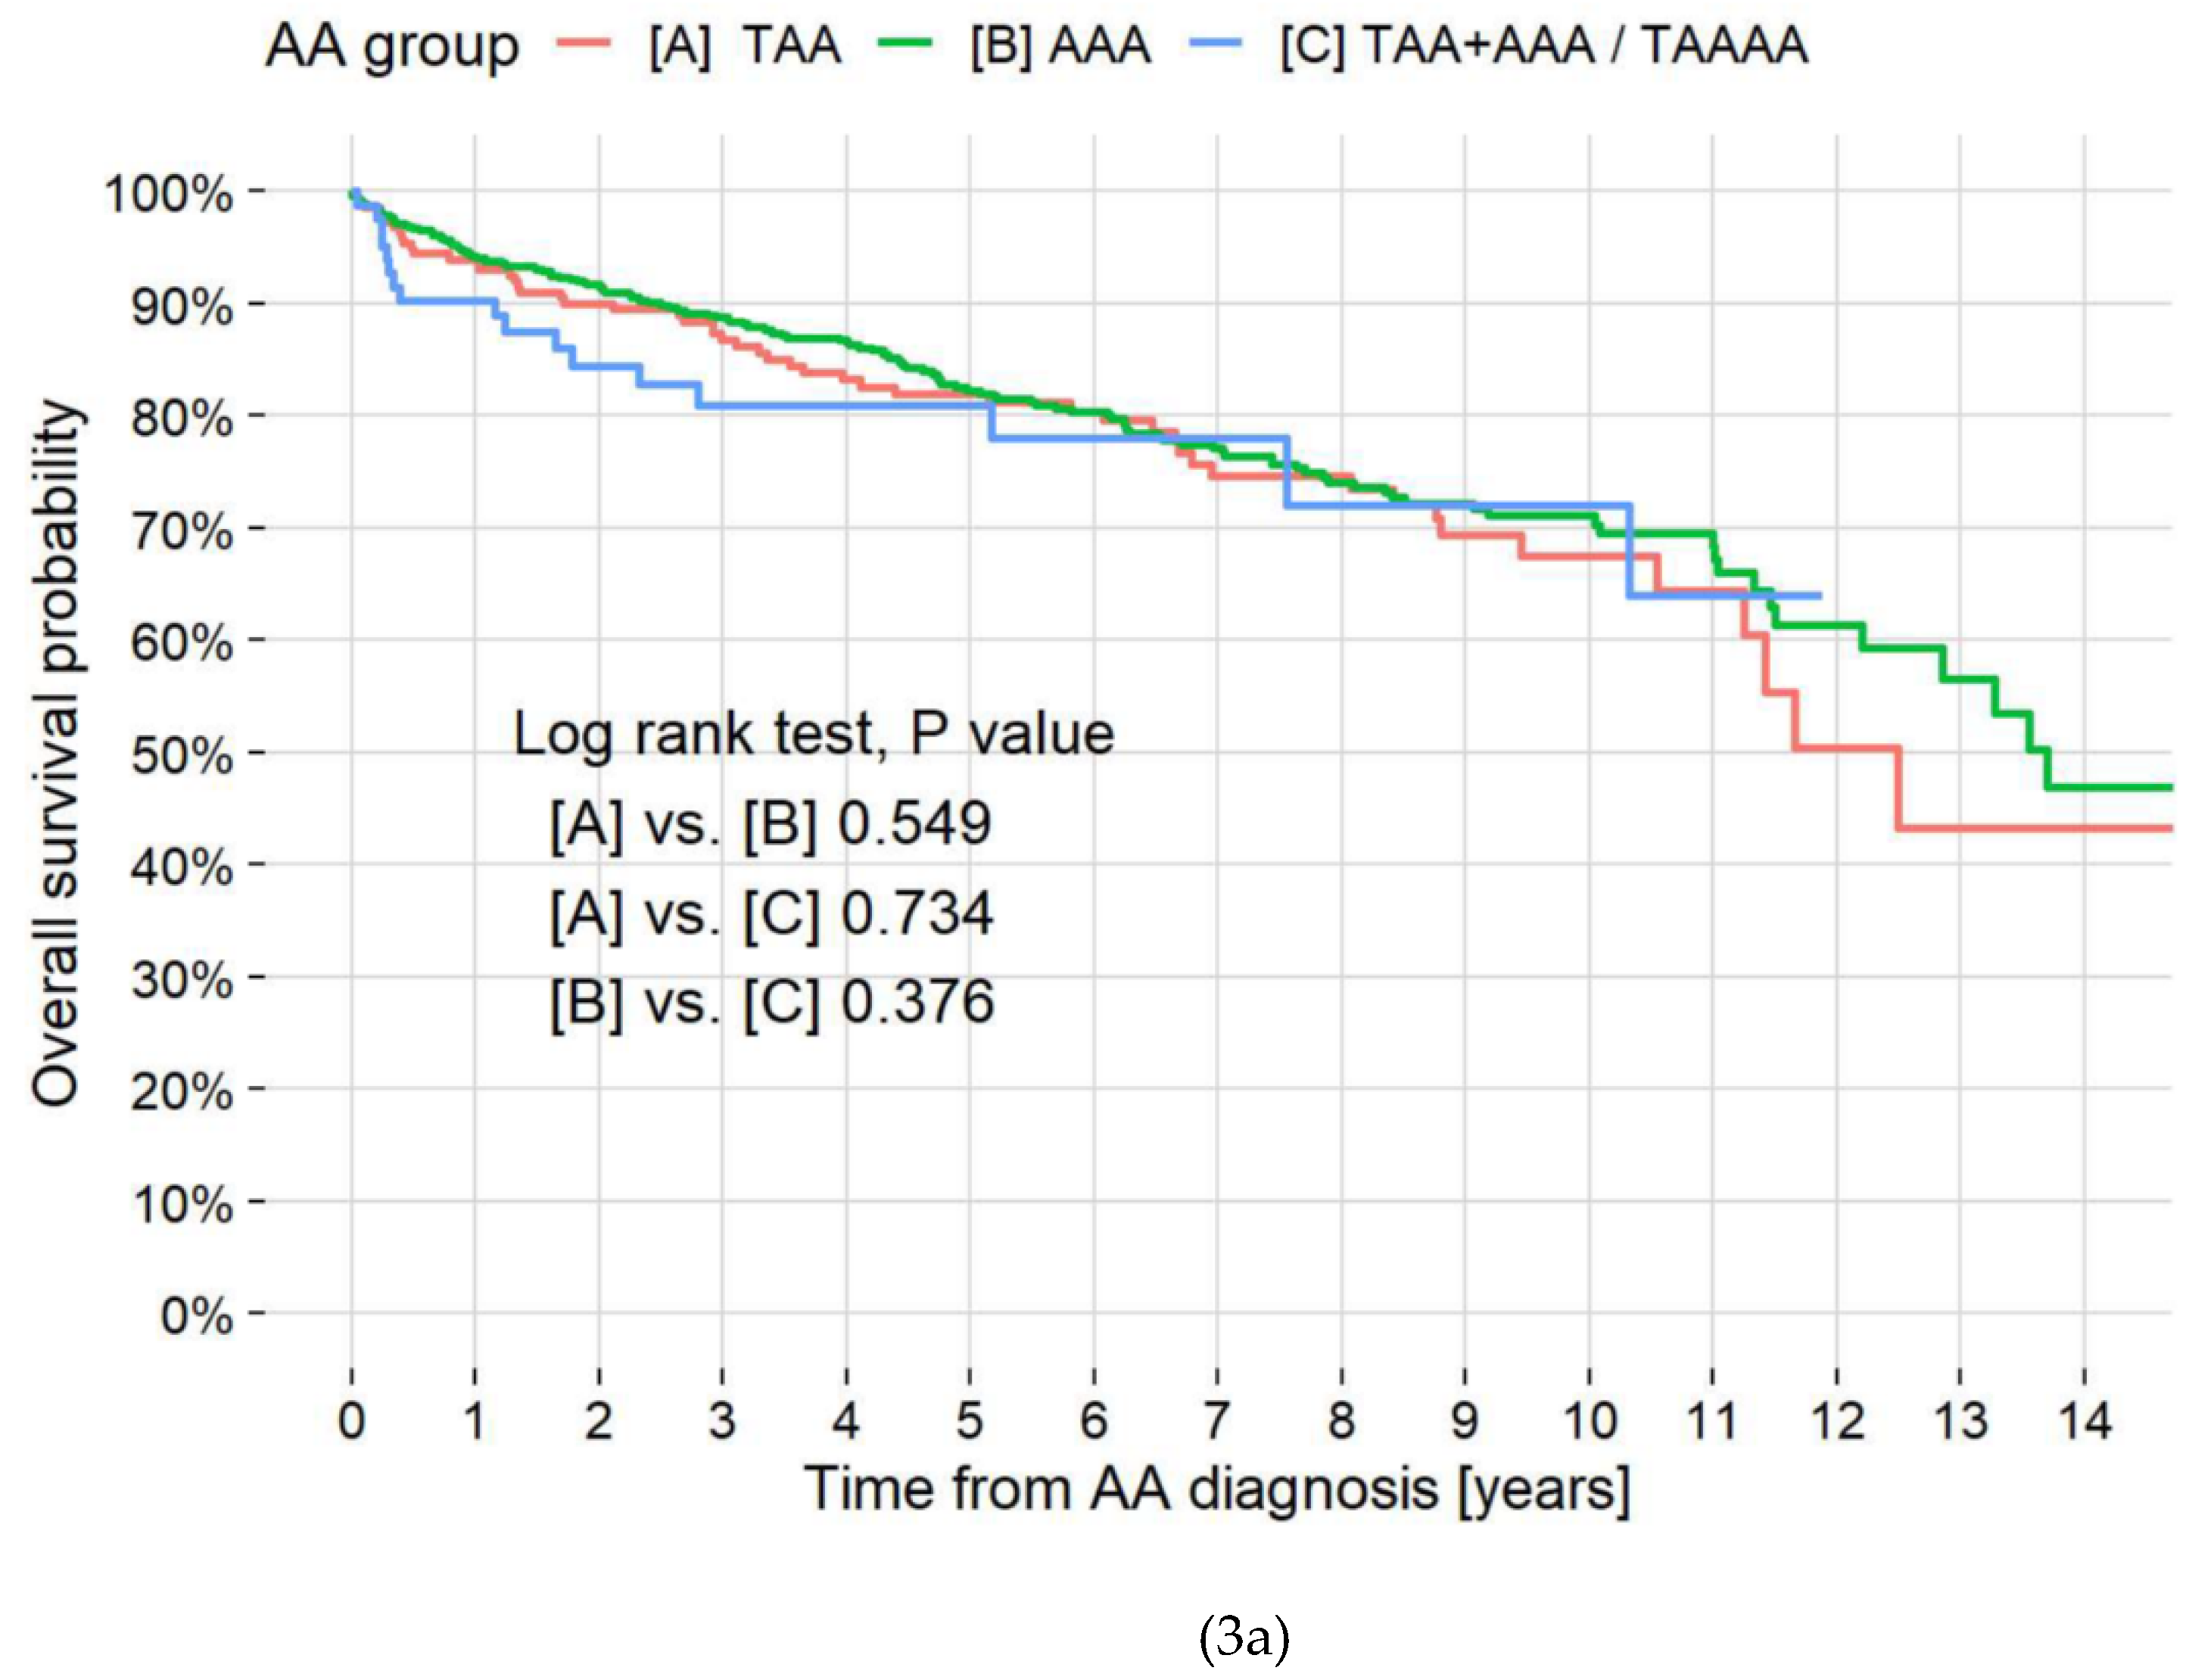
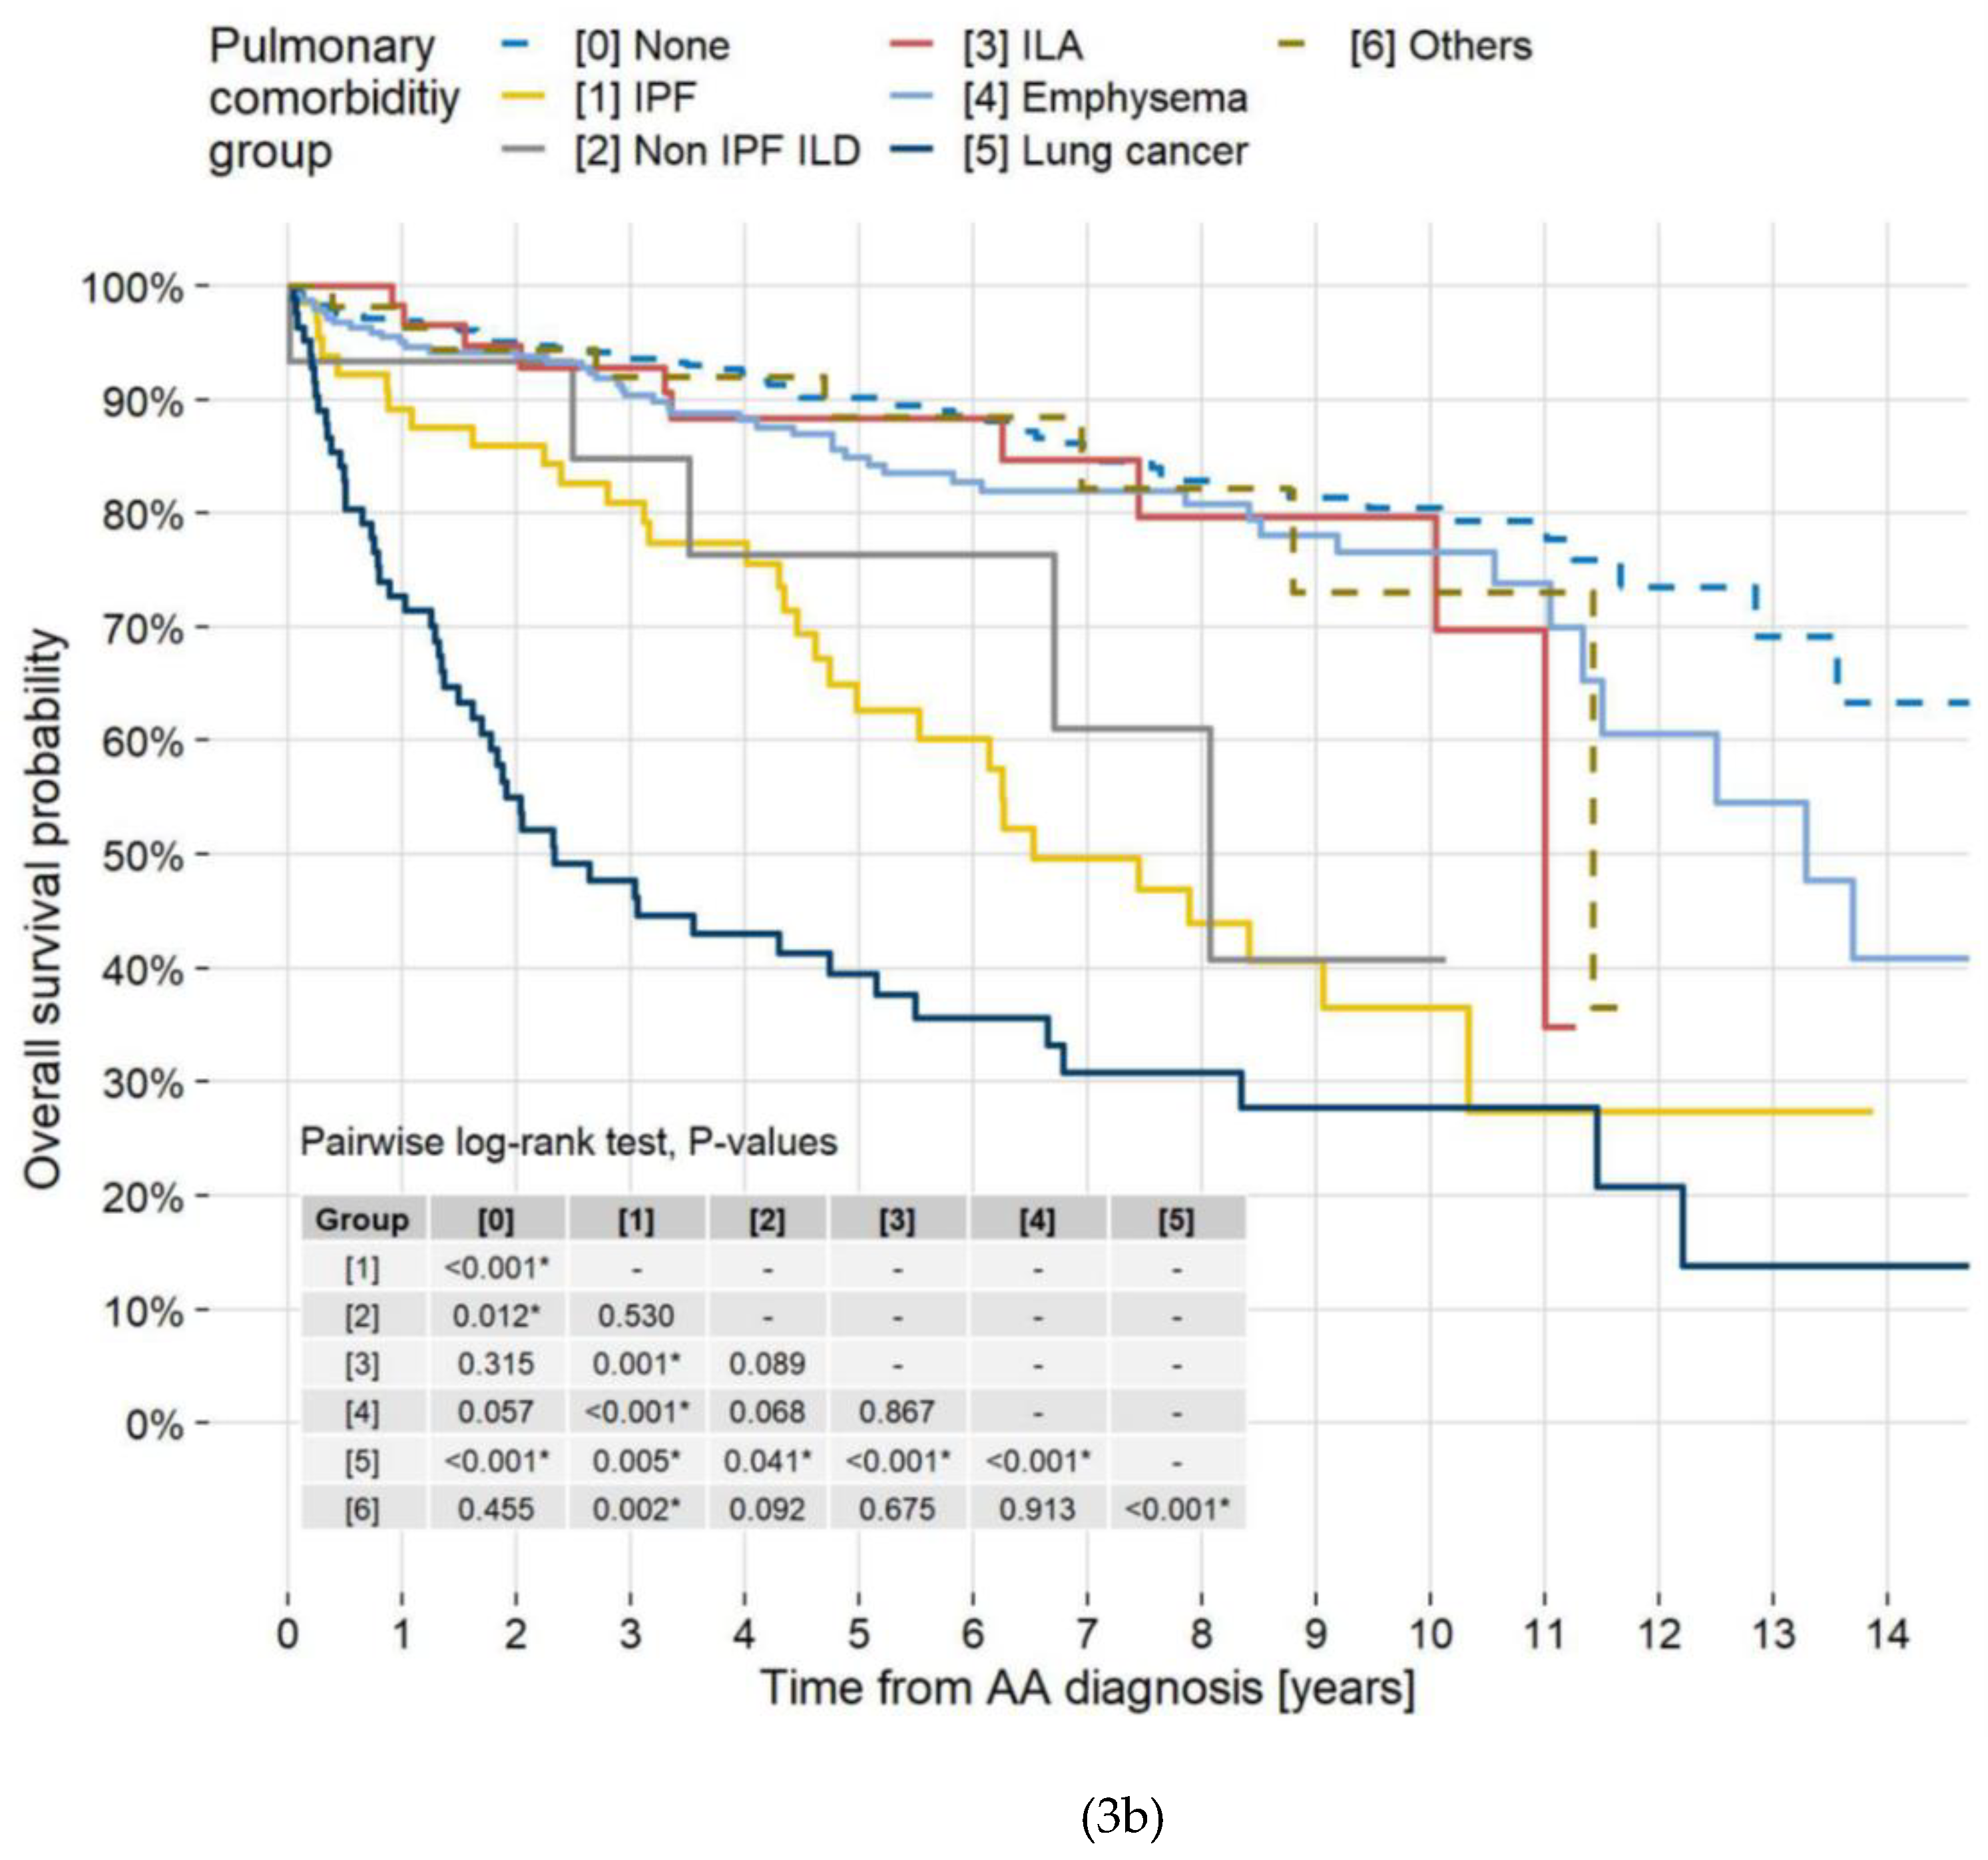
3.6. Mortality by Location and Disease
3.7. Causes of Death/Risk Factors
4. Discussion
5. Conclusions
Author Contributions
Funding
Institutional Review Board Statement
Informed Consent Statement
Data Availability Statement
Conflicts of Interest
References
- Chaikof, E.L.; Dalman, R.L.; Eskandari, M.K.; Jackson, B.M.; Lee, W.A.; Mansour, M.A.; et al. The Society for Vascular Surgery practice guidelines on the care of patients with an abdominal aortic aneurysm. J Vasc Surg. 2018, 67, 2–77. [Google Scholar] [CrossRef] [PubMed]
- Upchurch, G.R. Jr; Escobar, G.A.; Azizzadeh, A.; Beck, A.W.; Conrad, M.F.; Matsumura, J.S.; et al. Society for Vascular Surgery clinical practice guidelines of thoracic endovascular aortic repair for descending thoracic aortic aneurysms. J Vasc Surg. 2021, 73, 55S–83S. [Google Scholar] [CrossRef] [PubMed]
- Wanhainen, A.; Verzini, F.; Van Herzeele, I.; Allaire, E.; Bown, M.; Cohnert, T.; et al. Editor's Choice - European Society for Vascular Surgery (ESVS) 2019 Clinical Practice Guidelines on the Management of Abdominal Aorto-iliac Artery Aneurysms. Eur J Vasc Endovasc Surg. 2019, 57, 8–93. [Google Scholar] [CrossRef]
- Riambau, V.; Böckler, D.; Brunkwall, J.; Cao, P.; Chiesa, R.; Coppi, G.; et al. Editor's Choice - Management of Descending Thoracic Aorta Diseases: Clinical Practice Guidelines of the European Society for Vascular Surgery (ESVS). Eur J Vasc Endovasc Surg. 2017, 53, 4–52. [Google Scholar] [CrossRef]
- Czerny, M.; Schmidli, J.; Adler, S.; van den Berg, J.C.; Bertoglio, L.; Carrel, T.; et al. Editor's Choice - Current Options and Recommendations for the Treatment of Thoracic Aortic Pathologies Involving the Aortic Arch: An Expert Consensus Document of the European Association for Cardio-Thoracic Surgery (EACTS) & the European Society for Vascular Surgery (ESVS). Eur J Vasc Endovasc Surg. 2019, 57, 165–198. [Google Scholar] [CrossRef]
- Lederle, F.A.; Nelson, D.B.; Joseph, A.M. Smokers' relative risk for aortic aneurysm compared with other smoking-related diseases: a systematic review. J Vasc Surg. 2003, 38, 329–334. [Google Scholar] [CrossRef]
- Altobelli, E.; Rapacchietta, L.; Profeta, VF.; Fagnano, R. Risk factors for abdominal aortic aneurysm in population-based studies: a systematic review and meta-analysis. Int J Environ Res Public Health. 2018, 15, 2805. [Google Scholar] [CrossRef]
- Huber, T.S.; Wang, J.G.; Derrow, A.E.; Dame, D.A.; Ozaki, C.K.; Zelenock, G.B.; et al. Experience in the United States with intact abdominal aortic aneurysm repair. J Vasc Surg. 2001, 33, 304–310. [Google Scholar] [CrossRef]
- Hertzer, N.R.; Mascha, E.J.; Karafa, M.T.; O'Hara, P.J.; Krajewski, L.P.; Beven, E.G. Open infrarenal abdominal aortic aneurysm repair: the Cleveland Clinic experience from 1989 to 1998. J Vasc Surg. 2002, 35, 1145–1154. [Google Scholar] [CrossRef]
- Stone, D.H.; Goodney, P.P.; Kalish, J.; Schanzer, A.; Indes, J.; Walsh, D.B.; et al. Severity of chronic obstructive pulmonary disease is associated with adverse outcomes in patients undergoing elective abdominal aortic aneurysm repair. J Vasc Surg. 2013, 57, 1531–1536. [Google Scholar] [CrossRef]
- Hohneck, A.; Shchetynska-Marinova, T.; Ruemenapf, G.; Pancheva, M.; Hofheinz, R.; Boda-Heggemann, J.; et al. Coprevalence and incidence of lung cancer in patients screened for abdominal aortic aneurysm. Anticancer Res. 2020, 40, 4137–4145. [Google Scholar] [CrossRef]
- Kim, H.; Cho, S.I.; Won, S.; Han, Y.; Kwon, T.W.; Cho, Y.P.; et al. The prevalence of concomitant abdominal aortic aneurysm and cancer. J Clin Med. 2021, 10, 3847. [Google Scholar] [CrossRef] [PubMed]
- Shin, S.; King, C.S.; Puri, N.; Shlobin, O.A.; Brown, A.W.; Ahmad, S.; et al. Pulmonary artery size as a predictor of outcomes in idiopathic pulmonary fibrosis. Eur Respir J. 2016, 47, 1445–1451. [Google Scholar] [CrossRef] [PubMed]
- JCS Joint Working Group. Guidelines for diagnosis and treatment of aortic aneurysm and aortic dissection (JCS 2011): digest version. Circ J. 2013, 77, 789–828. [Google Scholar] [CrossRef]
- Raghu, G.; Remy-Jardin, M.; Richeldi, L.; Thomson, C.C.; Inoue, Y.; Johkoh, T.; et al. Idiopathic Pulmonary Fibrosis (an Update) and Progressive Pulmonary Fibrosis in Adults: An Official ATS/ERS/JRS/ALAT Clinical Practice Guideline. Am J Respir Crit Care Med. 2022, 205, e18–e47. [Google Scholar] [CrossRef] [PubMed]
- Collard, H.R.; Ryerson, C.J.; Corte, T.J.; Jenkins, G.; Kondoh, Y.; Lederer, D.J.; et al. Acute Exacerbation of Idiopathic Pulmonary Fibrosis. An International Working Group Report. Am J Respir Crit Care Med. 2016, 194, 265–275. [Google Scholar] [CrossRef]
- Hatabu, H.; Hunninghake, G.M.; Richeldi, L.; Brown, K.K.; Wells, A.U.; Remy-Jardin, M.; et al. Interstitial lung abnormalities detected incidentally on CT: a position paper from the Fleischner Society. Lancet Respir Med. 2020, 8, 726–737. [Google Scholar] [CrossRef] [PubMed]
- Becquemin, J.P.; Pillet, J.C.; Lescalie, F.; Sapoval, M.; Goueffic, Y.; Lermusiaux, P.; et al. A randomized controlled trial of endovascular aneurysm repair versus open surgery for abdominal aortic aneurysms in low- to moderate-risk patients. J Vasc Surg. 2011, 53, 1167–1173. [Google Scholar] [CrossRef]
- De Bruin, J.L.; Baas, A.F.; Buth, J.; Prinssen, M. Verhoeven, E.L.; Cuypers, P.W.; et al. Long-term outcome of open or endovascular repair of abdominal aortic aneurysm. N Engl J Med. 2010, 362, 1881–1889. [Google Scholar] [CrossRef]
- Lederle, F.A.; Kyriakides, T.C.; Stroupe, K.T.; Freischlag, J.A.; Padberg, F.T. Jr.; Matsumura, J.S.; et al. Open versus endovascular repair of abdominal aortic aneurysm. N Engl J Med. 2019, 380, 2126–2135. [Google Scholar] [CrossRef]
- Bavaria, J.E.; Appoo, J.J.; Makaroun, M.S.; Verter, J.; Yu, Z.F.; Mitchell, R.S.; et al. Endovascular stent grafting versus open surgical repair of descending thoracic aortic aneurysms in low-risk patients: a multicenter comparative trial. J Thorac Cardiovasc Surg. 2007, 133, 369–377. [Google Scholar] [CrossRef] [PubMed]
- Desai, N.D.; Burtch, K.; Moser, W.; Moeller, P.; Szeto, W.Y.; Pochettino, A.; et al. Long-term comparison of thoracic endovascular aortic repair (TEVAR) to open surgery for the treatment of thoracic aortic aneurysms. J Thorac Cardiovasc Surg. 2012, 144, 604–609. [Google Scholar] [CrossRef]
- Blochle, R.; Lall, P.; Cherr, G.S.; Harris, L.M.; Dryjski, M.L.; Hsu, H.K.; et al. Management of patients with concomitant lung cancer and abdominal aortic aneurysm. Am J Surg. 2008, 196, 697–702. [Google Scholar] [CrossRef]
- Alnahhal, K.I.; Urhiafe, V.; Narayanan, M.; Irshad, A.; Salehi, P. Prevalence of abdominal aortic aneurysms in patients with lung cancer. J Vasc Surg. 2022, 5, 1577–1582. [Google Scholar] [CrossRef] [PubMed]
- Takenaka, T.; Katsura, M.; Shikada, Y.; Tsukamoto, S.; Takeo, S. The impact of cardiovascular comorbidities on the outcome of surgery for non-small-cell lung cancer. Interact Cardiovasc Thorac Surg. 2013, 16, 270–274. [Google Scholar] [CrossRef]
- Wiles, B.; Comito, M.; Labropoulos, N.; Santore, L.A.; Bilfinger, T. High prevalence of abdominal aortic aneurysms in patients with lung cancer. J Vasc Surg. 2021, 73, 850–855. [Google Scholar] [CrossRef]
- Hori, M.; Matsuda, T.; Shibata, A.; Katanoda, K.; Sobue, T.; Nishimoto, H.; et al. Cancer incidence and incidence rates in Japan in 2009: a study of 32 population-based cancer registries for the Monitoring of Cancer Incidence in Japan (MCIJ) project. Jpn J Clin Oncol. 2015, 45, 884–891. [Google Scholar] [CrossRef]
- Kato, E.; Takayanagi, N.; Takaku, Y.; Kagiyama, N.; Kanauchi, T.; Ishiguro, T.; et al. Incidence and predictive factors of lung cancer in patients with idiopathic pulmonary fibrosis. ERJ Open Res. 2018, 4, 00111–2016. [Google Scholar] [CrossRef] [PubMed]
- Chubachi, S.; Takahashi, S.; Tsutsumi, A.; Kameyama, N.; Sasaki, M.; Naoki, K.; et al. Radiologic features of precancerous areas of the lungs in chronic obstructive pulmonary disease. Int J Chron Obstruct Pulmon Dis. 2017, 12, 1613–1624. [Google Scholar] [CrossRef]
- Patel, R.; Sweeting, M.J.; Powell, J.T.; Greenhalgh, R.M. Endovascular versus open repair of abdominal aortic aneurysm in 15-years' follow-up of the UK endovascular aneurysm repair trial 1 (EVAR trial 1): a randomised controlled trial. Lancet. 2016, 388, 2366–2374. [Google Scholar] [CrossRef]
- Sweeting, M.J.; Pate, l.R.; Powell, J.T.; Greenhalgh, R.M. Endovascular repair of abdominal aortic aneurysm in patients physically ineligible for open repair: Very long-term follow-up in the EVAR-2 randomized controlled trial. Ann Surg. 2017, 266, 713–719. [Google Scholar] [CrossRef] [PubMed]
- Khashram, M.; Williman, J.A.; Hider, P.N.; Jones, G.T.; Roake, J.A. Systematic review and meta-analysis of factors influencing survival following abdominal aortic aneurysm repair. Eur J Vasc Endovasc Surg. 2016, 51, 203–215. [Google Scholar] [CrossRef]
- Khashram, M.; Jenkins, J.S.; Jenkins, J.; Kruger, A.J.; Boyne, N.S.; Foster, W.J.; et al. Long-term outcomes and factors influencing late survival following elective abdominal aortic aneurysm repair: A 24-year experience. Vascular. 2016, 24, 115–125. [Google Scholar] [CrossRef] [PubMed]
- Chang, H.; Rockman, C.B.; Jacobowitz, G.R.; Ramkhelawon, B.; Cayne, N.S.; Veith, F.J.; et al. Contemporary outcomes of endovascular abdominal aortic aneurysm repair in patients deemed unfit for open surgical repair. J Vasc Surg. 2021, 73, 1583–1592. [Google Scholar] [CrossRef] [PubMed]
- Jovin, I.S.; Duggal, M.; Ebisu, K.; Paek, H.; Oprea, A.D.; Tranquilli, M.; et al. Comparison of the effect on long-term outcomes in patients with thoracic aortic aneurysms of taking versus not taking a statin drug. Am J Cardiol. 2012, 109, 1050–1054. [Google Scholar] [CrossRef]
- Twine, C.P.; Williams, I.M. Systematic review and meta-analysis of the effects of statin therapy on abdominal aortic aneurysms. Br J Surg. 2011, 98, 346–353. [Google Scholar] [CrossRef]
- Stein, L.H.; Berger, J.; Tranquilli, M.; Elefteraides, J.A. Effect of statin drugs on thoracic aortic aneurysms. Am J Cardiol. 2013, 112, 1240–1245. [Google Scholar] [CrossRef]
- Mousa, A.Y.; Bozzay, J.; Broce, M.; Yacoub, M.; Stone, P.A.; Najundappa, A.; et al. Novel risk score model for prediction of survival following elective endovascular abdominal aortic aneurysm repair. Vasc Endovascular Surg. 2016, 50, 261–269. [Google Scholar] [CrossRef]
- Boudreau, H.; Blakeslee-Carter, J.; Novak, Z.; Sutzko, D.C.; Spangler, E.L.; Passman, M.A.; et al. Association of statin and antiplatelet use with survival in patients with AAA with and without concomitant atherosclerotic occlusive disease. Ann Vasc Surg. 2022, 83, 70–79. [Google Scholar] [CrossRef] [PubMed]


| Characteristics | Total N=952 |
By AA group | |||
| [A] TAA N=218 |
[B] AAA N=650 |
[C] TAA+AAA/TAAA N=84 |
P-value | ||
| Male sex, N (%) | 781 (82.0%) | 169 (77.5%) | 544 (83.7%) | 68 (81.0%) | 0.117 |
| Age at AA diagnosis [years], mean (SD) | 72.4 (8.4) | 71.0 (9.2) | 72.5 (8.2) | 75.0 (7.6) | 0.004 |
| Never smoker, N (%) | 158 (16.6%) | 57 (26.1%) | 90 (13.8%) | 11 (13.1%) | <0.001 |
| Shape of TAA, N (%) | <0.001 | ||||
| [1] Fusiform | 168 (17.6%) | 126 (57.8%) | 0 (0.0%) | 42 (50.0%) | |
| [2] Saccular | 134 (14.1%) | 92 (42.2%) | 0 (0.0%) | 42 (50.0%) | |
| Shape of AAA, N (%) | <0.001 | ||||
| [1] Fusiform | 677 (71.1%) | 0 (0.0%) | 599 (92.2%) | 78 (92.9%) | |
| [2] Saccular | 57 (6.0%) | 0 (0.0%) | 51 (7.8%) | 6 (7.1%) | |
| Diameter of AA (TAA or AAA, the bigger) [mm], mean (SD) | 48.1 (12.9) | 51 (10) | 46 (13) | 57 (13) | <0.001 |
| Etiology of aneurysm, N (%) | 0.644 | ||||
| [1] Atherosclerotic (Degenerative) | 920 (96.6%) | 213 (97.7%) | 626 (96.3%) | 81 (96.4%) | |
| [2] Infectious and autoimmune (Inflammatory) | 30 (3.2%) | 4 (1.8%) | 23 (3.5%) | 3 (3.6%) | |
| [3] Genetic (Marfan and Ehlers-Danlos) | 2 (0.2%) | 1 (0.5%) | 1 (0.2%) | 0 (0.0%) | |
| Pulmonary disease, N (%) | 0.021 | ||||
| [1] No | 424 (44.5%) | 115 (52.8%) | 273 (42.0%) | 36 (42.9%) | |
| [2] Yes | 528 (55.5%) | 103 (47.2%) | 377 (58.0%) | 48 (57.1%) | |
| Pulmonary disease type, N | |||||
| [1] IPF with or without emphysema, without LC | 65 | 7 | 48 | 10 | |
| [2] Non-IPF ILD with or without emphysema, without LC | 15 | 3 | 11 | 1 | |
| [3] ILAs with or without emphysema, without LC | 58 | 11 | 43 | 4 | |
| [4] Emphysema without ILD, without LC | 250 | 40 | 187 | 23 | |
| [5] Lung cancer (concomitant) | 85 | 26 | 55 | 4 | |
| [6] Other lung diseases without above diseases | 55 | 16 | 33 | 6 | |
| IPF with or without LC, N (%) | 84 (8.8%) | 9 (4.1%) | 65 (10.0%) | 10 (11.9%) | 0.018 |
| ILD without LC, N (%) | 0.143 | ||||
| [0] None | 814 (85.5%) | 197 (90.4%) | 548 (84.3%) | 69 (82.1%) | |
| [1] IPF | 65 (6.8%) | 7 (3.2%) | 48 (7.4%) | 10 (11.9%) | |
| [2] Non-IPF ILD | 15 (1.6%) | 3 (1.4%) | 11 (1.7%) | 1 (1.2%) | |
| [3] ILA | 58 (6.1%) | 11 (5.0%) | 43 (6.6%) | 4 (4.8%) | |
| Emphysema without ILD or LC, N (%) | 250 (26.3%) | 40 (18.3%) | 187 (28.8%) | 23 (27.4%) | 0.010 |
| Lung cancer, N (%) | 85 (8.9%) | 26 (11.9%) | 55 (8.5%) | 4 (4.8%) | 0.112 |
| Hypertension, N (%) | 781 (82.0%) | 185 (84.9%) | 523 (80.5%) | 73 (86.9%) | 0.163 |
| Dyslipidemia, N (%) | 454 (47.7%) | 76 (34.9%) | 340 (52.3%) | 38 (45.2%) | <0.001 |
| Diabetes mellitus, N (%) | 183 (19.2%) | 38 (17.4%) | 136 (20.9%) | 9 (10.7%) | 0.062 |
| Coronary artery disease, N (%) | 293 (30.8%) | 37 (17.0%) | 230 (35.4%) | 26 (31.0%) | <0.001 |
| Valvular heart disease, N (%) | 111 (11.7%) | 58 (26.6%) | 44 (6.8%) | 9 (10.7%) | <0.001 |
| Congestive heart disease, N (%) | 72 (7.6%) | 20 (9.2%) | 44 (6.8%) | 8 (9.5%) | 0.395 |
| Chronic kidney disease, N (%) | 196 (20.6%) | 40 (18.3%) | 132 (20.3%) | 24 (28.6%) | 0.137 |
| Cerebrovascular disease, N (%) | 171 (18.0%) | 42 (19.3%) | 113 (17.4%) | 16 (19.0%) | 0.792 |
| Peripheral artery disease, N (%) | 34 (3.6%) | 5 (2.3%) | 26 (4.0%) | 3 (3.6%) | 0.501 |
| Chronic liver dysfunction, N (%) | 24 (2.5%) | 5 (2.3%) | 18 (2.8%) | 1 (1.2%) | 0.666 |
| History of cancer (except for LC), N (%) | 83 (8.7%) | 23 (10.6%) | 51 (7.8%) | 9 (10.7%) | 0.375 |
| Concomitant cancer (except for LC), N (%) | 57 (6.0%) | 8 (3.7%) | 43 (6.6%) | 6 (7.1%) | 0.255 |
| Outcome, Death, N (%) | 213 (22.4%) | 53 (24.3%) | 143 (22.0%) | 17 (20.2%) | 0.689 |
| AA = aortic aneurysm; AAA = abdominal aortic aneurysm; ILAs = interstitial lung abnormalities; ILD = interstitial lung disease; IPF = idiopathic pulmonary fibrosis; LC = lung cancer; TAA = thoracic aortic aneurysm; TAAA = thoracoabdominal aortic aneurysm. | |||||
| Pulmonary disease | Total N=126 |
| Interstitial lung disease, N (%) | 20 (2.1) |
| Acute exacerbation of idiopathic pulmonary fibrosis | 12 (1.3) |
| Interstitial lung abnormalities | 3 (0.3) |
| Nonspecific interstitial pneumonia | 1 (0.1) |
| Organizing pneumonia | 3 (0.3) |
| Others | 1 (0.1) |
| Emphysema, N (%) | 0 (0.0) |
| Infection, N (%) | 64 (6.7) |
| Acute pneumonia | 50 (5.3) |
| Non-tuberculous mycobacterial infection | 4 (0.4) |
| Tuberculosis | 3 (0.3) |
| Chronic pulmonary aspergillosis | 2 (0.2) |
| Pneumocystis pneumonia | 2 (0.2) |
| Cytomegalovirus pneumonia | 1 (0.1) |
| Others | 2 (0.2) |
| Lung cancer, N (%) | 50 (5.3) |
| Others, N (%) | 9 (0.9) |
| Characteristics | Total N= 135 |
At AA diagnosis N=85 |
During follow-up N=50 |
P-value |
| Histology, N (%) | 0.035 | |||
| Adenocarcinoma | 43 (31.9) | 27 (31.8) | 16 (32.0) | |
| Squamous cell carcinoma | 35 (25.9) | 28 (32.9) | 7 (14.0) | |
| Other non-small cell lung carcinoma | 17 (12.6) | 9 (10.6) | 8 (16.0) | |
| Small cell carcinoma | 14 (10.4) | 10 (11.8) | 4 (8.0) | |
| Only image | 26 (19.3) | 11 (12.9) | 15 (30.0) | |
| Stage, No (%) | 0.150 | |||
| I | 59 (43.7) | 31 (36.5) | 28 (56.0) | |
| II | 21 (15.6) | 16 (18.8) | 5 (10.0) | |
| III | 26 (19.3) | 17 (20.0) | 9 (18.0) | |
| IV | 29 (21.5) | 21 (24.7) | 8 (16.0) | |
| 1st therapy, n (%) | 0.431 | |||
| Operation | 58 (43.0) | 35 (41.2) | 23 (46.0) | |
| Radiation therapy | 8 (5.9) | 5 (5.9) | 3 (6.0) | |
| Chemo-Radiation Therapy | 3 (2.2) | 3 (3.5) | 0 (0.0) | |
| Chemotherapy | 33 (24.4) | 24 (28.2) | 9 (18.0) | |
| Best supportive care | 32 (23.7) | 17 (20.0) | 15 (30.0) | |
| Unknown | 1 (0.7) | 1 (1.2) | 0 (0.0) | |
| AA = aortic aneurysm. | ||||
| Cause of Death | N=213, N (%) |
| Aortic disease | 45 (21.1) |
| Aortic dissection | 6 (2.8) |
| AAA rupture | 17 (8.0) |
| TAA rupture | 20 (9.4) |
| Vascular graft infection | 2 (0.9) |
| Lung cancer | 59 (27.7) |
| Other malignancy | 18 (8.5) |
| Cardiovascular event | 20 (9.4) |
| Pneumonia | 12 (5.6) |
| Other infection | 8 (3.8) |
| Interstitial lung disease | 10 (4.7) |
| Interstitial lung disease | 4 (1.9) |
| AE-IPF | 6 (2.8) |
| COPD exacerbation | 1 (0.5) |
| Pneumothorax | 1 (0.5) |
| Others | 15 (7.0) |
| Unknown | 24 (11.3) |
| AAA = abdominal aortic aneurysm; AE = acute exacerbation; COPD = chronic obstructive pulmonary disease; IPF = idiopathic pulmonary fibrosis; TAA = thoracic aortic aneurysm. | |
| Characteristic | Univariate model | Multivariate model | ||||
| HR | 95% CI | P-value | HR | 95% CI | P-value | |
| AA group | 0.625 | |||||
| [A] TAA | 1.00 | — | ||||
| [B] AAA | 0.91 | 0.66, 1.24 | ||||
| [C] TAA+AAA/TAAA | 1.14 | 0.66, 1.97 | ||||
| Sex | 0.227 | |||||
| [1] Female | 1.00 | — | ||||
| [2] Male | 1.25 | 0.86, 1.83 | ||||
| Age group | <0.001 | <0.001 | ||||
| [1] 27-59 years | 1.00 | — | 1.00 | — | ||
| [2] 60-69 years | 2.69 | 0.97, 7.46 | 2.27 | 0.81, 6.33 | ||
| [3] 70-79 years | 5.50 | 2.02, 14.95 | 3.56 | 1.29, 9.82 | ||
| [4] 80-89 years | 10.36 | 3.72, 28.89 | 6.81 | 2.40, 19.38 | ||
| [5] 90-94 years | 24.11 | 6.42, 90.51 | 21.28 | 5.51, 82.25 | ||
| Smoking history | 0.009 | <0.001 | ||||
| [1] No | 1.00 | — | 1.00 | — | ||
| [2] Yes | 1.20 | 0.81, 1.77 | 1.09 | 0.72, 1.66 | ||
| [3] Unknown | 2.29 | 1.35, 3.90 | 3.11 | 1.78, 5.43 | ||
| Diameter of AA (TAA or AAA, the larger) | <0.001 | 0.003 | ||||
| [1] 27-<50 mm | 1.00 | — | 1.00 | — | ||
| [2] 50-<70 mm | 1.72 | 1.29, 2.31 | 1.38 | 1.02, 1.85 | ||
| [3] 70-124 mm | 3.20 | 2.04, 5.00 | 2.20 | 1.38, 3.51 | ||
| ILD without LC | <0.001 | <0.001 | ||||
| [0] None | 1.00 | — | 1.00 | — | ||
| [1] IPF | 2.61 | 1.78, 3.84 | 3.02 | 1.99, 4.57 | ||
| [2] Non-IPF ILD | 1.94 | 0.80, 4.73 | 1.94 | 0.76, 4.93 | ||
| [3] ILAs | 0.88 | 0.47, 1.67 | 0.93 | 0.48, 1.80 | ||
| Emphysema without ILD nor LC | 0.77 | 0.56, 1.06 | 0.103 | |||
| Lung cancer | 5.47 | 4.00, 7.49 | <0.001 | 5.85 | 4.11, 8.32 | <0.001 |
| Hypertension | 0.40 | 0.30, 0.53 | <0.001 | 0.51 | 0.38, 0.70 | <0.001 |
| Dyslipidemia | 0.44 | 0.33, 0.59 | <0.001 | 0.62 | 0.46, 0.84 | 0.002 |
| Diabetes mellitus | 0.95 | 0.68, 1.34 | 0.777 | |||
| Coronary artery disease | 0.70 | 0.52, 0.95 | 0.019 | |||
| Valvular heart disease | 0.65 | 0.40, 1.04 | 0.055 | 0.63 | 0.39, 1.03 | 0.049 |
| Congestive heart disease | 1.10 | 0.69, 1.74 | 0.696 | |||
| Chronic kidney disease | 0.99 | 0.71, 1.38 | 0.949 | |||
| Cerebrovascular disease | 0.73 | 0.50, 1.07 | 0.093 | 0.59 | 0.40, 0.89 | 0.007 |
| Peripheral artery disease | 0.50 | 0.19, 1.35 | 0.125 | |||
| Chronic liver dysfunction | 1.22 | 0.57, 2.59 | 0.619 | |||
| History of cancer (except for LC) | 1.58 | 1.01, 2.45 | 0.058 | |||
| Concomitant cancer (except for LC) | 2.11 | 1.33, 3.35 | 0.004 | 1.75 | 1.08, 2.84 | 0.033 |
| AAA = abdominal aortic aneurysm; CI = confidence Interval; HR = hazard ratio, LC = lung cancer; TAA = thoracic aortic aneurysm; TAAA = thoracoabdominal aortic aneurysm. | ||||||
Disclaimer/Publisher’s Note: The statements, opinions and data contained in all publications are solely those of the individual author(s) and contributor(s) and not of MDPI and/or the editor(s). MDPI and/or the editor(s) disclaim responsibility for any injury to people or property resulting from any ideas, methods, instructions or products referred to in the content. |
© 2024 by the authors. Licensee MDPI, Basel, Switzerland. This article is an open access article distributed under the terms and conditions of the Creative Commons Attribution (CC BY) license (http://creativecommons.org/licenses/by/4.0/).


