Preprint
Article

Cumulative and Yield-Scaled Greenhouse Gas Emissions Under Different Organic and Inorganic Soil Fertilization in Central Kenya

Altmetrics

Downloads

55

Views

37

Comments

0

Submitted:

01 October 2024

Posted:

01 October 2024

You are already at the latest version

Alerts
Abstract
Demand for livestock products in East Africa is anticipated to triple by 2050. Therefore, sustainable intensification of livestock production systems for increased productivity is necessary in line with minimal negative environmental consequences. An agronomic field experiment was set up at the International Livestock Research Institute in Nairobi, Kenya, and the effects of organic and inorganic soil amendments on greenhouse gas emissions (particularly N2O) from a Humic Nitisol planted with Brachiaria brizantha cv. xaraes were evaluated between October 2018 and August 2019. The treatments comprised mineral NPK fertilizer, Lablab intercrop, FYM, FYM-BC, Bioslurry, and control. Fertilizer treatments were applied at a rate of 45 kg N ha-1 following each harvest. GHG emissions were measured using the static vented chamber technique. Treatment and season significantly influenced daily N2O emissions. The lowest (4.51±3.30 µg N m-2 h-1) and highest (27.16±3.61 µg N m-2 h-1) mean N2O emissions were recorded under NPK and Control treatments during the short rains and dry seasons, respectively. Cumulative N2O emissions and the corresponding yield-scaled emissions were similar across all the treatments but varied significantly (p < 0.001) between the wet and dry seasons. Cumulative N2O emissions were 0.31±1.49, 0.33±1.47, 0.33±1.74, and 0.37±1.74, 0.38±2.3 and 0.42±1.81 Kg N ha-1 under FYM-BC, Lablab, NPK fertilizer, and FYM, Bioslurry and control treatments respectively. The corresponding yield-scaled emissions were also higher during the wet (0.23±1.16 g N kg-1 DM) than in the dry seasons (0.16±0.50 g N kg-1 DM). Higher (-21.86±4.47 mg CH4-Ch-1) CH4 uptake was recorded under the control treatment whereas the lowest (-2.69±17.97 mg CH4-Ch-1) uptake was recorded under Bioslurry (P < 0.01). Treatment and season exhibited individual effects on daily CO2 emissions (P < 0.001), with a significant interaction effect (P < 0.001). The highest (157.5±28.76 mg CO2-C m-2h-1) and lowest (44.33±8.37 mg CO2-C m-2h-1) CO2 emissions were recorded under Control and FYM treatments during the October 2018-January 2019 and January-March 2019 HD. Since the experiment was newly established via ploughing a field which had been used as a permanent pasture during previous years, did not expect considerable yield differences between treatments. Yet, it is interesting to see first effects of fertilizer amendments, pointing to their potential as climate-smart forage intensification strategies. The study established that Manure + biochar is a better strategy for forage soil amendments in mitigating soil N2O emissions.
Keywords: 
Subject: Environmental and Earth Sciences  -   Ecology

1. Introduction

1.1. Carbon Mineralization and CO2 Emissions

During decomposition, organic matter (plant and microbial biomass, soil organic matter) is broken down and biochemically changed, processes during which CO2 under aerobic conditions (heterotrophic respiration) and CH4 under anaerobic conditions (methanogenesis) are produced. The soil microbial community is crucial for the turnover of nutrients, such as the incorporation of carbon into microbial biomass (the primary pathway of SOM formation), or the mineralization and immobilization of N. Soil microorganisms are driving the so-called C and N “humification”, a term describing the production and decomposition of SOM. Humus affects soil parameters due to its slow decomposition rate, improving soil aggregate stability, and increasing cation exchange capacity (CEC) (Bot and Benites, 2005). Decomposition involves the physical breakdown and chemical amendment of organic fragments (e.g. cellulose, protein) from dead organic resources into shorter mineral and organic units (for example sugars, peptides and amino acids) (Janzen et al., 1998; Bot and Benites, 2005).
Organic material supplemented to the soil can increase microbial activity and accelerate turnover of C in the soil, a procedure in which inorganic and organic C compounds are continuously transformed by connections between various organic components, vegetation and atmosphere (Bengtsson et al., 2005; Bot and Benites, 2005). This process releases CO2, energy, water, nutrients and C compounds. In addition to soil microorganisms, soil properties and conditions are also affected by plant roots, for example via excretion of root exudates. Furthermore, microorganisms and plant roots compete for Oxygen (O2), with high O2 use creating anoxic conditions (Hynes and Knowles, 1984). In cases of insufficient O2, microorganisms have to use alternative respiration pathways, e.g. denitrifying bacteria that utilize NO3 instead of O2 as electron acceptor during respiration (Robertson and Groffman, 2007), or methanogenic archaea that use CO2 as electron acceptor and produce CH4.
Variations in temperatures, rainfall and organic matter composition influence decomposition rates, which can be more rapid in tropics compared to temperate regions if moisture is not limiting. An increase in the level of yearly rainfall usually increases the rate of decomposition. Increased rate of decomposition and bacterial activity occur at 60 percent water-filled pore space (WFPS) (Linn and Doran, 1984). Though, periods of saturation and poorly aerated soil slows downs the rate of decomposition (Bot and Benites, 2005).
Higher soil temperatures too are associated with higher soil respiration rates by accelerating the rates of Carbon cycling through autotrophic respiration and providing a powerful positive feedback to climatic warming through the heterotrophic respiration of the soil organic Carbon (Hamdi et al., 2013). Other factors that have been reported to influence the rate of soil respiration are soil moisture, the levels of nutrients content and Oxygen levels in the soil (Moyano et al., 2013). Ploughing and soil disturbance too increase the rate of soil respiration through opening of the soil air spaces that accelerate the rate of microbial activity in the soil (Yiqi and Zhou, 2010).
The quantity and quality of organic matter added also affects the rate of decomposition in numerous ways. CO2 emissions are stimulated whenever sources of C-based material hold easily decomposable C and N compounds. In tropical Africa, the use of organic substances possessing narrow C/N ratios such as manure and legume plant remnants, increases decomposition whereas the input of crop residues with high C/N ratios, like cereals and forage grasses, increases soil nutrient immobilization, the build-up of organic matter, and humus formation (Nicolardot et al., 2001; Bot and Benites, 2005). CO2 is formed when autotrophic and heterotrophic organisms respire. CO2 formation via heterotrophs occurs when O2 is available. CO2 is emitted from soils that are readily formed, more porous, leading to around 10 percent of CO2 collects in the atmosphere annually (Raich and Tufekciogul, 2000). The soil carbon element is reduced through the process of heterotrophs that uses O2 and emit CO2 as a by-product (Cambardella, 2005).

1.2. Methane Consumption and Emissions

Methane is a GHG with a global warming potential 28 times larger compared to CO2 calculated over a 100-year time horizon (Myhre et al., 2013). Globally, the level of CH4 in the atmosphere rose up from 750 ppb in the year 1800 up to 1,803 ppb by the year 2011 (Myhre et al., 2013). Segers (1998) reported that formation of CH4 and its consumption are changes supported by organic matter mineralization in the soil. Soil conditions such as temperature, pH and inhibitory materials influences CH4 production. High differences in absolute rise in microbial activity when temperature rises by 10 °c leads to values of CH4 emissions of 1.3–28 (Segers, 1998). The pH of the soil is a factor that influences CH4 formation. A lot of methanogenic microorganisms’ work at optimum pH of seven and raising the pH of anaerobically induced soils raises CH4 emissions. Methanogens are strictly anaerobic and can only survive under continuously O2-depleted conditions (for example wetlands, rice paddies). In anaerobic circumstances, the availability of organic materials is a limiting aspect for CH4 release. Many studies have reported that addition of straight methanogenesis materials such as acetate and hydrogen or others like leachate and glucose promotes CH4 emissions (Segers, 1998).
Methane consumption is a process whereby CH4 is disintegrated by methanotrophic microorganisms (Segers, 1998). Le Mer and Pierre (2001) reason that these microorganisms use CH4 as C and energy sources. They highlight that about 90 % of the CH4 produced in low O2 environments may be broken down by methanotrophs in adequate supply of O2, for example in different layers of the same soil (methanogenesis in water-logged deep soil layers, methanotrophy in well-aerated topsoil) (Segers, 1998). Aerobic upland soils are vital sinks for CH4, resulting to 15 % of the annual global CH4 oxidation (Van den Pol-van Dasselaar et al., 1998). CH4 usage is influenced by soil temperature, soil water levels, and soil N availability. When the temperature increases from 4 - 12 °C, the CH4 absorption is doubled; however, additional temperature rises to 20 ° Celsius displays a smaller CH4 usage. Van den Pol-van Dasselaar et al., (1998), outlined that the optimum temperature for CH4 usage is within 20 to 25 °Celsius, moderately low compared to its production.
Methane consumption increases whenever H2O levels rises from 22.5 % - 37.5 % w/w and decreases when water level is more than 45 % w/w. When H2O level is less than 5 % and more than 50 % w/w, CH4 absorption is stopped (Van den Pol-van Dasselaar et al., 1998), implying that wet or dry soil environments can stop CH4 oxidation. It is also reported that the use of N fertilizer prevents the breakdown of CH4 in soil because of competition between NH3 and CH4 for the CH4 monooxygenase enzyme.

1.3. Soil N Turnover

Soil N2O and NO are by-products of N-transformation processes (e.g. nitrification, denitrification, and many others) that are environmentally harmful (Figure 1) (Dhondt et al., 2004).
The process of nitrification requires enough O2 supply because it is an aerobic process. Subsequently, H2O level in soil is one of the processes controlling the speed of nitrification process since soil H2O stops air movement in the soil. The process of Nitrification ends when the levels of soil water hits the point of saturation due to lack of Oxygen. The high rates of the process are projected when the soil attains field capacity or 60% water filled pore spaces (WFPS) (Dhondt et al., 2004). The main complex bacteria to water stress are Nitrobacter species, therefore NH4+ and nitrite ions accumulate in drier soils. The process of Nitrification is slow when pH levels are low and increases when the pH goes up. However, in normal conditions, accumulation of nitrite happens as Nitrobacter species is thought to be immobile by NH4+, that build-up in alkaline conditions (Dhondt et al., 2004).

2. Materials and methods

2.1. Description of the Study Site

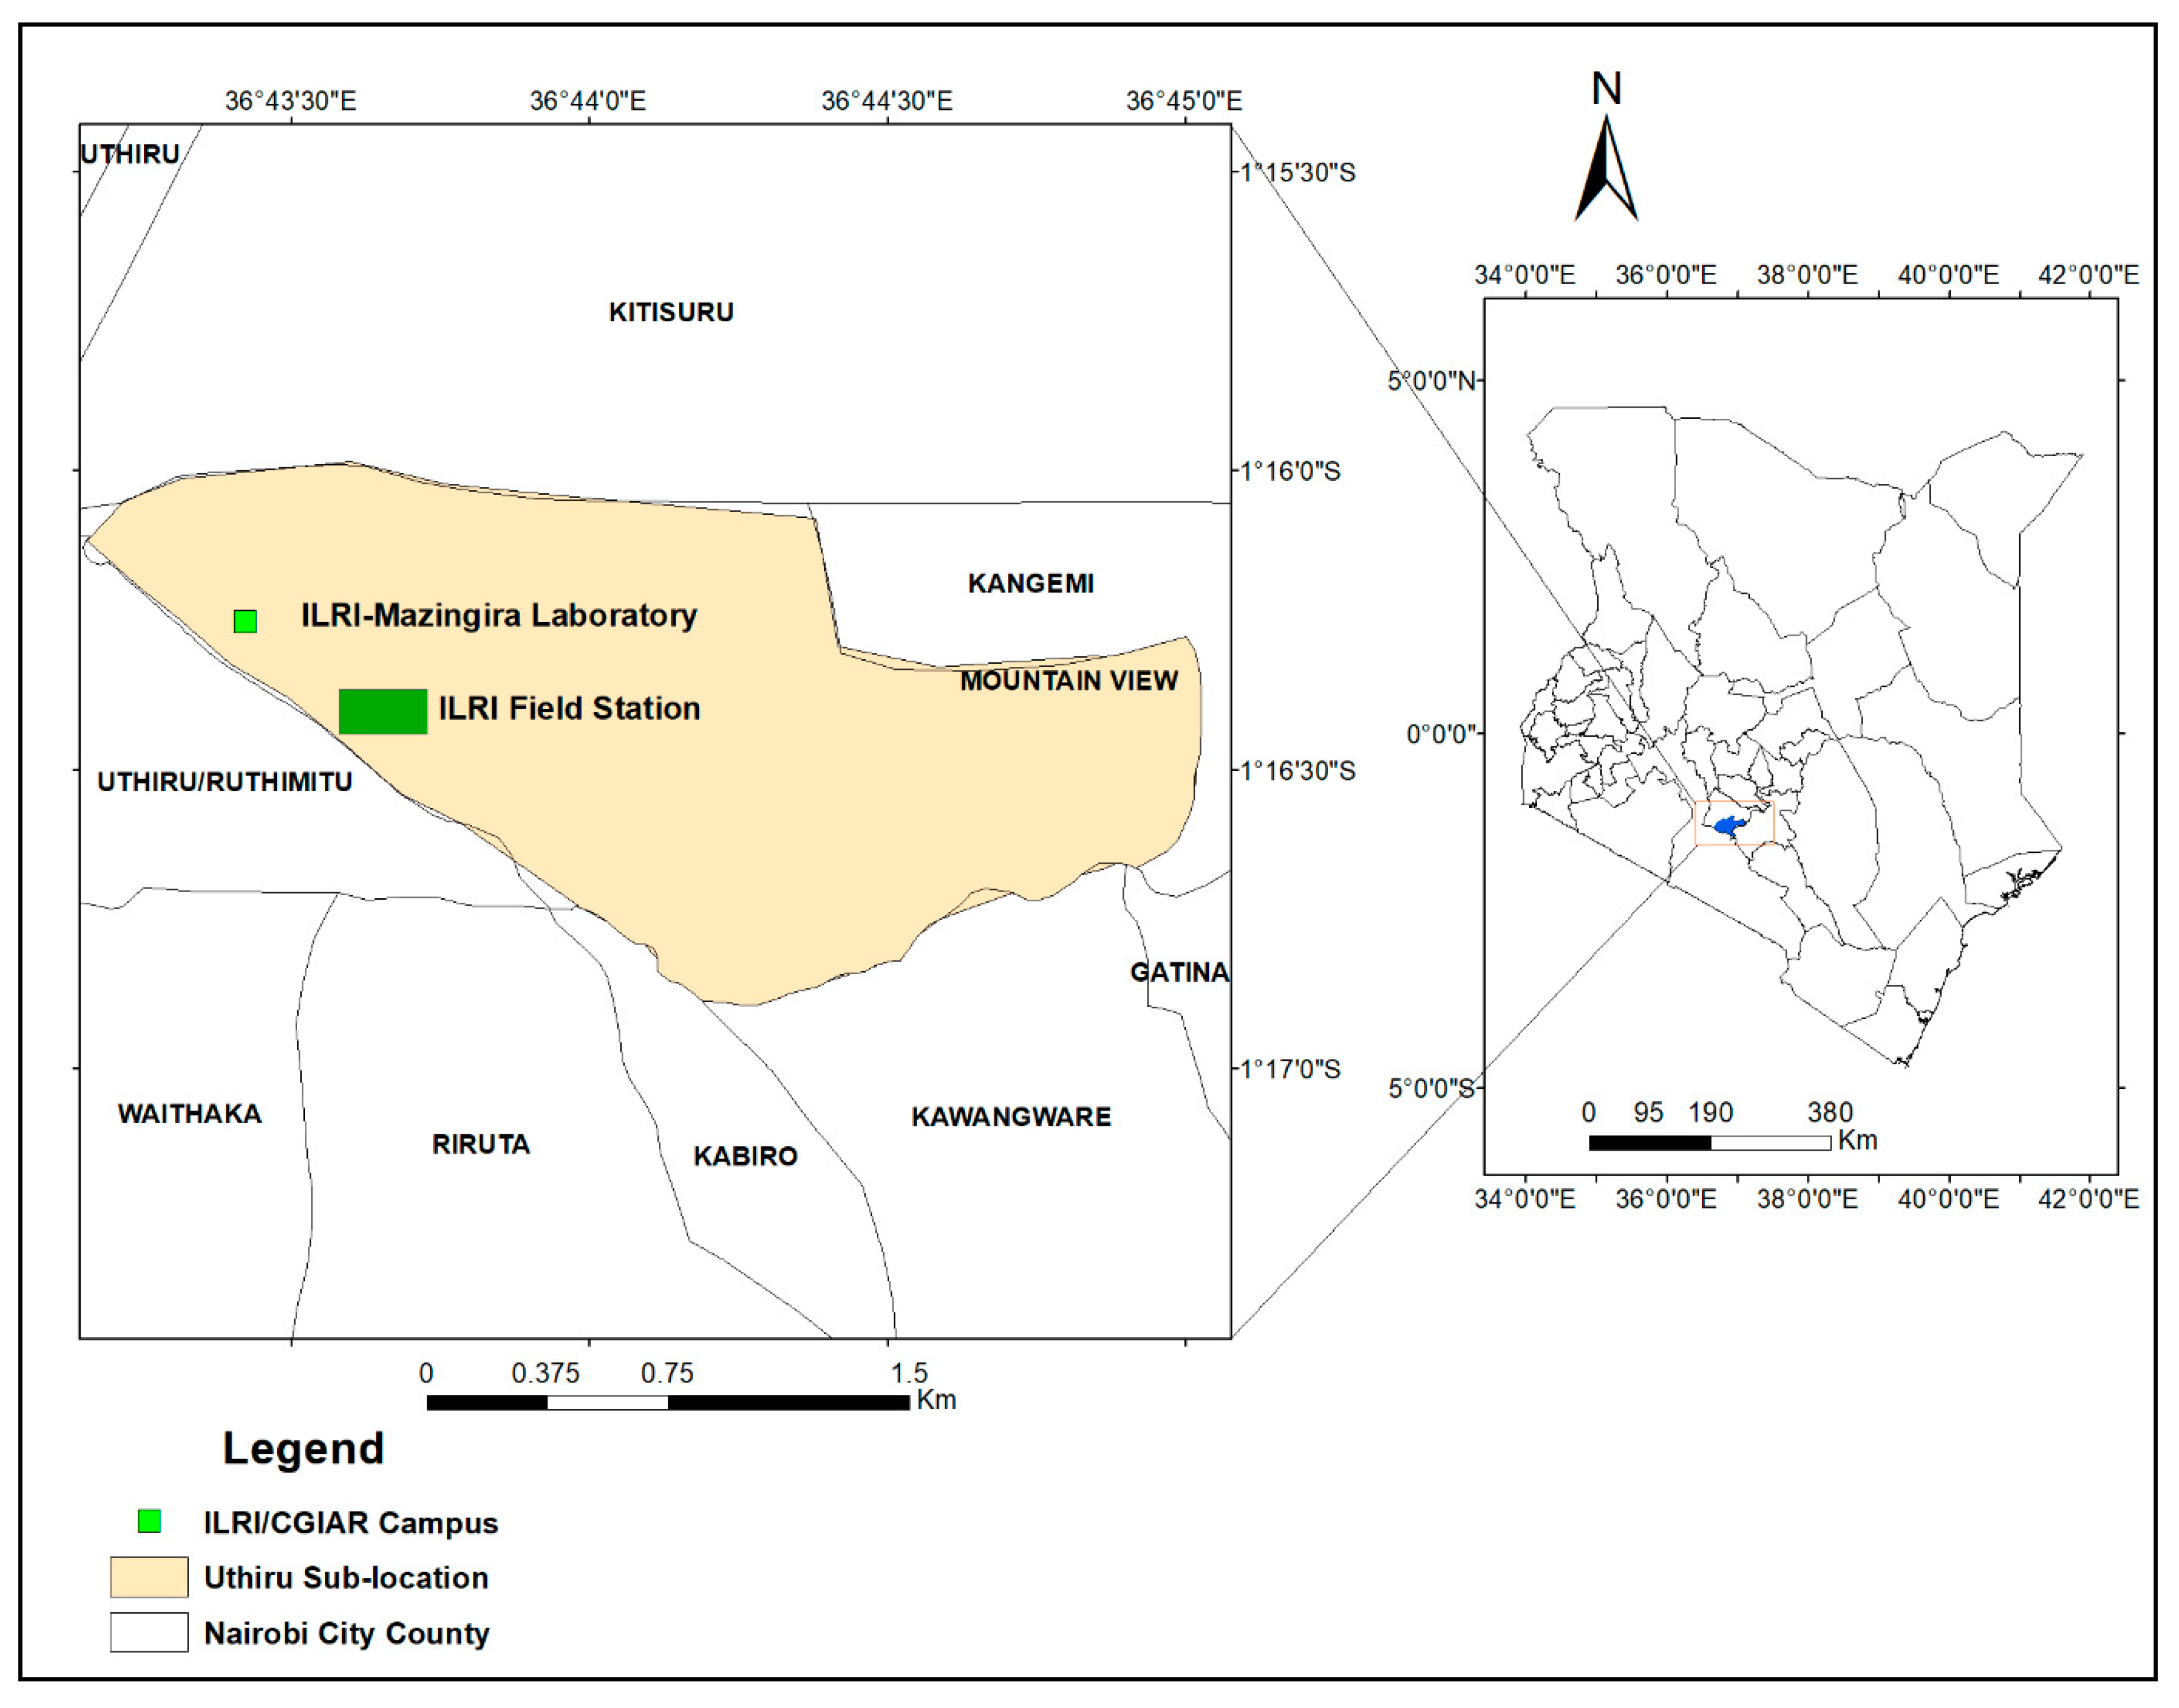
The study was conducted at the International Livestock Research Institute (ILRI)-Nairobi campus at elevation 900 m above sea level. It is a research Centre located in Nairobi County. It lies between latitude 1° 16' 11.73’ South and longitude 36° 43' 26.0472'' East (Figure 2). Mean annual temperature is 17 ºC and mean daily minimum and maximum temperatures are 12 ºC and 23 ºC. Mean annual rainfall is 875 mm and varies between 500-1500 mm. The total rainfall amount during the experimental period (eight months) was 802 mm. Soil temperature at the study site ranged between 16.6 º C in the wet season to 50.8 ºC in the dry season, with a mean of 34ºC.

2.2. Treatments and Experimental Design

The study was conducted between October 2018 and August, 2019 comprising of four harvest seasons of 10 weeks each: short rains (SR, October 2018 to January 2019), hot dry season (HD, January 2019 to March 2019), long rains (LR, March 2019 to June 2019), and cold dry season (CD, June 2019 to August 2019). The setup consisted of 3 replicate blocks with 18 plots each (3 forage grass species and 6 fertilizer types), giving a total of 54 plots (4 m x 2 m).

2.3. Greenhouse Gas Sampling and Analysis

The soil-atmosphere fluxes of CH4, CO2 and N2O were measured using the static chamber approach (Rosenstock et al., 2016). All sampling points followed the same scheme, between the plant rows at a specific distance from the borders, an opaque chamber was mounted for gas sampling (one chamber per plot). These chambers consisted of a plastic lid (0.27m×0.372m×0.125m) and a collar (0.27 m × 0.372 m × 0.1 m) (Figure 3). The collars were inserted up to 10 cm in the soil a week prior to the first GHG flux measurements and were left in place throughout the entire sampling period. The lids contained 50 cm long vent tubes with an inner diameter of 0.6 cm, thermometer ports to measure chamber headspace temperature during sampling, a fan to ensure headspace air mixing, and a sampling port with a rubber septum for collecting gas samples. When collecting the gases, the lid was put on the collar and tied with clamps with a seal between the lid and the collar for airtight closure. When collecting the gases, chamber closing was for 30 minutes, and four gas samples were drawn from each chamber at an interval of 10 minutes at 0, 10, 20, and 30 min for each plot. A 60 ml propylene syringe with Luerlocks was used to sample the gas and instantly put into pre-evacuated 10 ml gas chromatography glass vials fixed with crimp seals (Butterbach-bahl et al., 2011). The gas samples were analyzed within one week after every sampling campaign as described below in the Mazingira Centre.
Concentrations of CO2, N2O, and CH4 were analyzed by use of a gas chromatograph (GC, model 8610C, SRI, Germany) equipped with two detectors: a flame ionization detector (FID) comprising of a Platinum catalyzed methanizer for catalytic conversion of CO2 to CH4 and for subsequent detection of CH4 and CO2, and an electron capture detector (ECD) to detect N2O. A 5% CO2-in-N2 mixture was used as the ECD Make-up gas to improve on the detector sensitivity. The analytes were separated on chromatographic columns (Hayesep D, 3 m, and 1/8″) as the stationary phase at an isocratic oven temperature (70 °C). ECD and FID detector temperatures were set at 350 °C. High-purity N2 was used as carrier gas at flow rates of 25 ml min-1 on both FID and ECD. Gas concentrations of the samples were calculated as the peak areas measured by the GC comparative to the peak areas measured from standard gases of known concentrations run at four calibration levels. Calibration gases ranged from 2.03 to 49.8 ppm for CH4, 403 to 2420 ppm for CO2 and 329 to 2530 ppb for N2O. Concentrations in ppm or ppb were then changed to mass per volume by using the Ideal Gas Law (PV = nRT) using the chamber volume and area, internal chamber air temperature, and atmospheric pressure determined during sampling. GHG fluxes were calculated using linear regression of gas concentrations versus chamber closure time (that is change of concentration over time). The limit of detection (LOD) were as follows: CH4 (R-squared R2=0.7), CO2 (R2=0.9) and N2O (R2=0.7). Data quality checks and cleaning was performed whereby 5% of the data were discarded since they were below the LOD.

2.4. Yield Scaled Emissions

The yield-scaled GHG emissions were estimated using the cumulative fluxes over the 8 months sampling period divided by the yield data for the 4 harvests.
Equation 1: Yield-scaled GHG emissions.
Yield   scale   emissions   ( g   N   kg - 1 ) = N 2 O   e m i s s o n s   ( k g   h a 1 ) Y i e l d   ( t   h a 1 )

2.5. Brachiaria Brizantha Yields

Brachiaria brizantha cv. xaraes in individual plots was harvested after every 10 weeks down to a stubble height of 10 cm, and the entire aboveground biomass was collected and weighed. Maximum heights of Brachiaria (cm) was determined by use of a tape measure on separate plants per plot. All the biomass was weighed, and approximately a quarter of it was cut into 5 cm pieces using a machete. After cutting, 3 aliquots of about 300-500 g were selected from each plot and put into a pre-weighed and labelled bag. The samples were taken to the Mazingira Centre immediately after sampling and weighed (bag + fresh sample). The samples were then oven dried until constant weight (approximately. 96 hours) at 105 °C to determine dry matter content.

2.6. Statistical Analysis

A two-way ANOVA was conducted to determine if the GHG fluxes were significantly different among the fertilizer treatments. Significant differences for the analysis of variance were accepted at P ≤ 0.05. Tukey ‘s HSD post hoc test was used to separate means of the determined daily fluxes, cumulative fluxes and yield-scaled N2O emissions under the influence of various soil amendments. Backward elimination regression analysis was conducted using Stata to determine the soil properties that influence N2O and CO2 emissions.

3. Results

This section discusses the effects of various soil amendments on soil GHG fluxes, cumulative N2O, CO2 and yield-scaled N2O emissions.

3.1. Effects of Soil Fertilization on Hourly CH4 Uptake

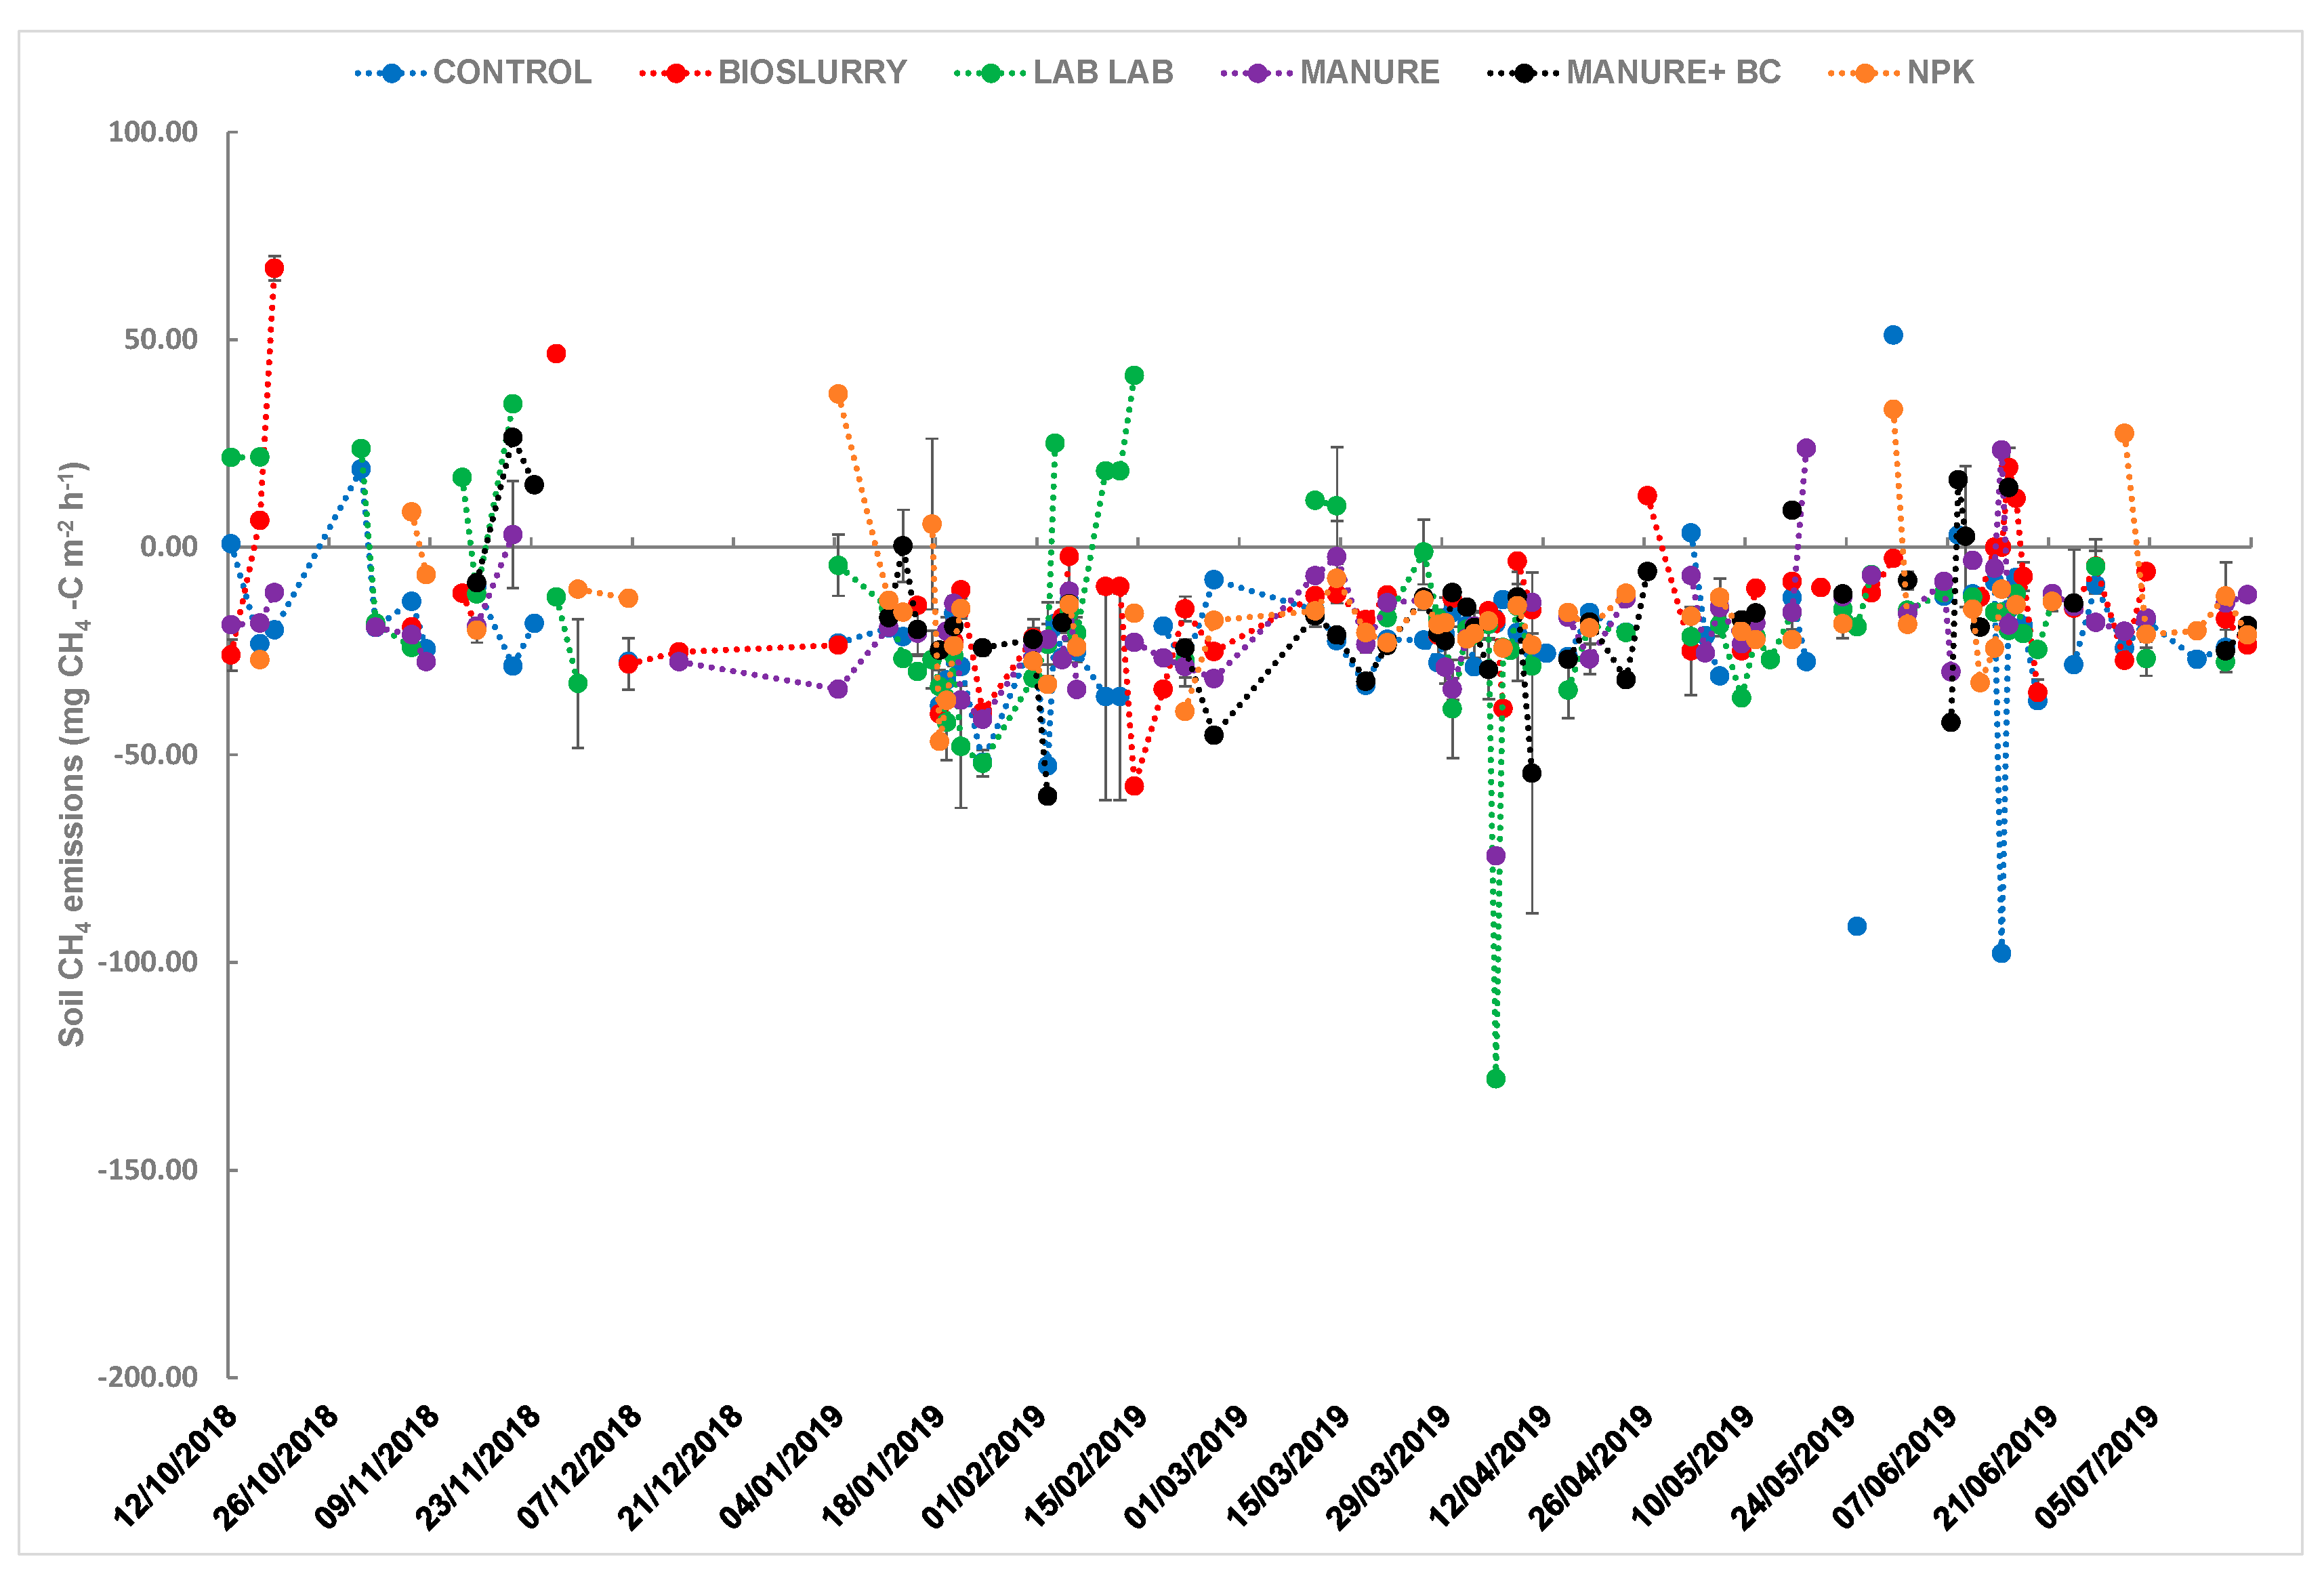
All the treatments acted as net sink for methane (Table 1, Figure 4), with treatment and season significantly influencing the uptake. Higher (-21.86±17.97mg CH4-C h-1) CH4 uptake was recorded in the Control treatment whereas the lowest (-2.69±4.47mg CH4-C h-1) uptake was recorded in Bioslurry (P < 0.01).
Values are means ± standard error (SE). Different lowercase letters within the same column indicate significant differences between the treatments.
Cumulative CH4 uptake was 3.56% higher under FYM relative to the control, but the difference was not significant (Table 2). Daily and cumulative CH4 uptake increased from season SR to HD and decreased in the subsequent seasons (Table 1).
Treatment and season significantly influenced daily CH4 uptakes (p <0.01 and p = 0.009 respectively) but did not show significant interaction (p = 0.093). Methane uptake was similar across all the treatments following the order of Control > Lablab > Manure > FYM-BC > NPK, except for Bioslurry which exhibited significantly lower (-2.69±4.47) CH4 uptake (p< 0.01). Within the seasons, significantly lower (-11.43±13.87) and higher (-21.23±5.39) CH4 uptakes were recorded during the cold dry seasons and hot dry respectively whereas short rains and Long rains had similar CH4 uptake.
Values are means ± standard error (SE). Different lowercase letters within the same column indicate significant differences between seasons.
Values are means ± standard error (SE). Different lowercase letters within the same column indicate significant differences between the treatments and seasons. Different lowercase letters within the same column indicate significant differences between the treatments.
Key: SR-Short rains season (October 2018 to January 2019)
HD- short season (January 2019 to March 2019)
LR- long rains season (March 2019 to June 2019)
CD- short (June 2019 to August 2019).

3.2. Effects of Soil Fertilization on Hourly and Cumulative CO2 Fluxes

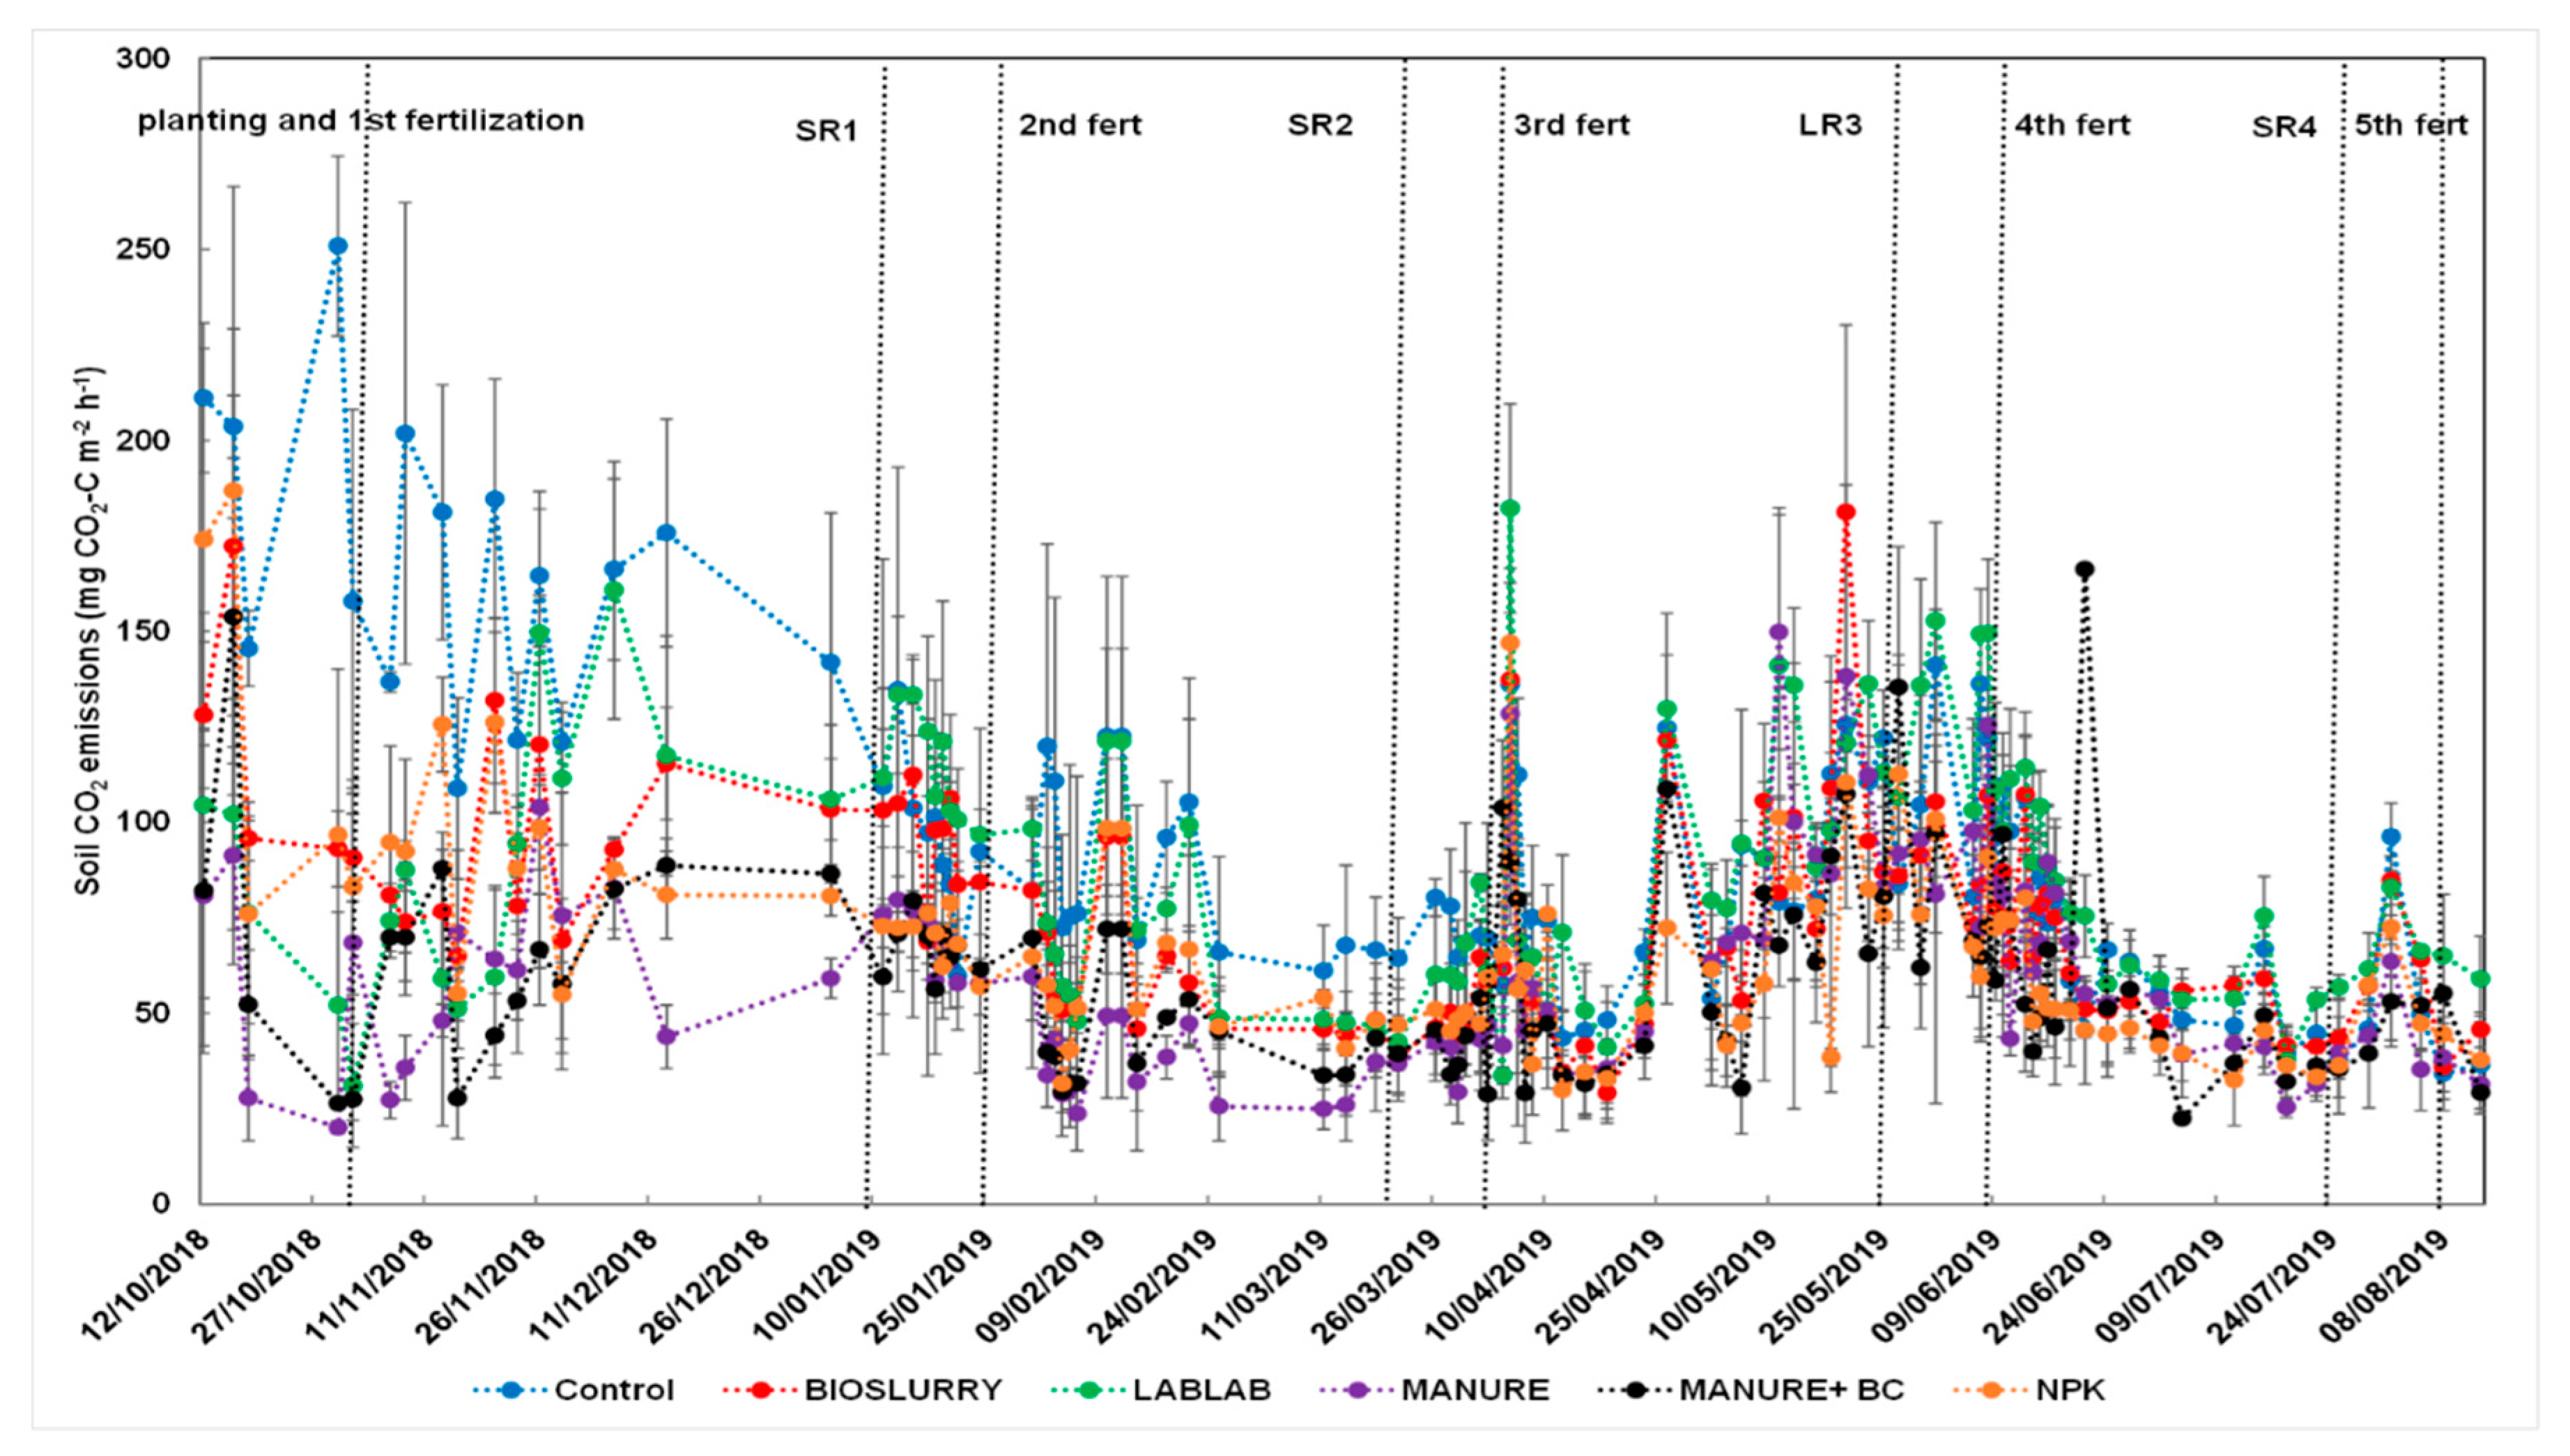
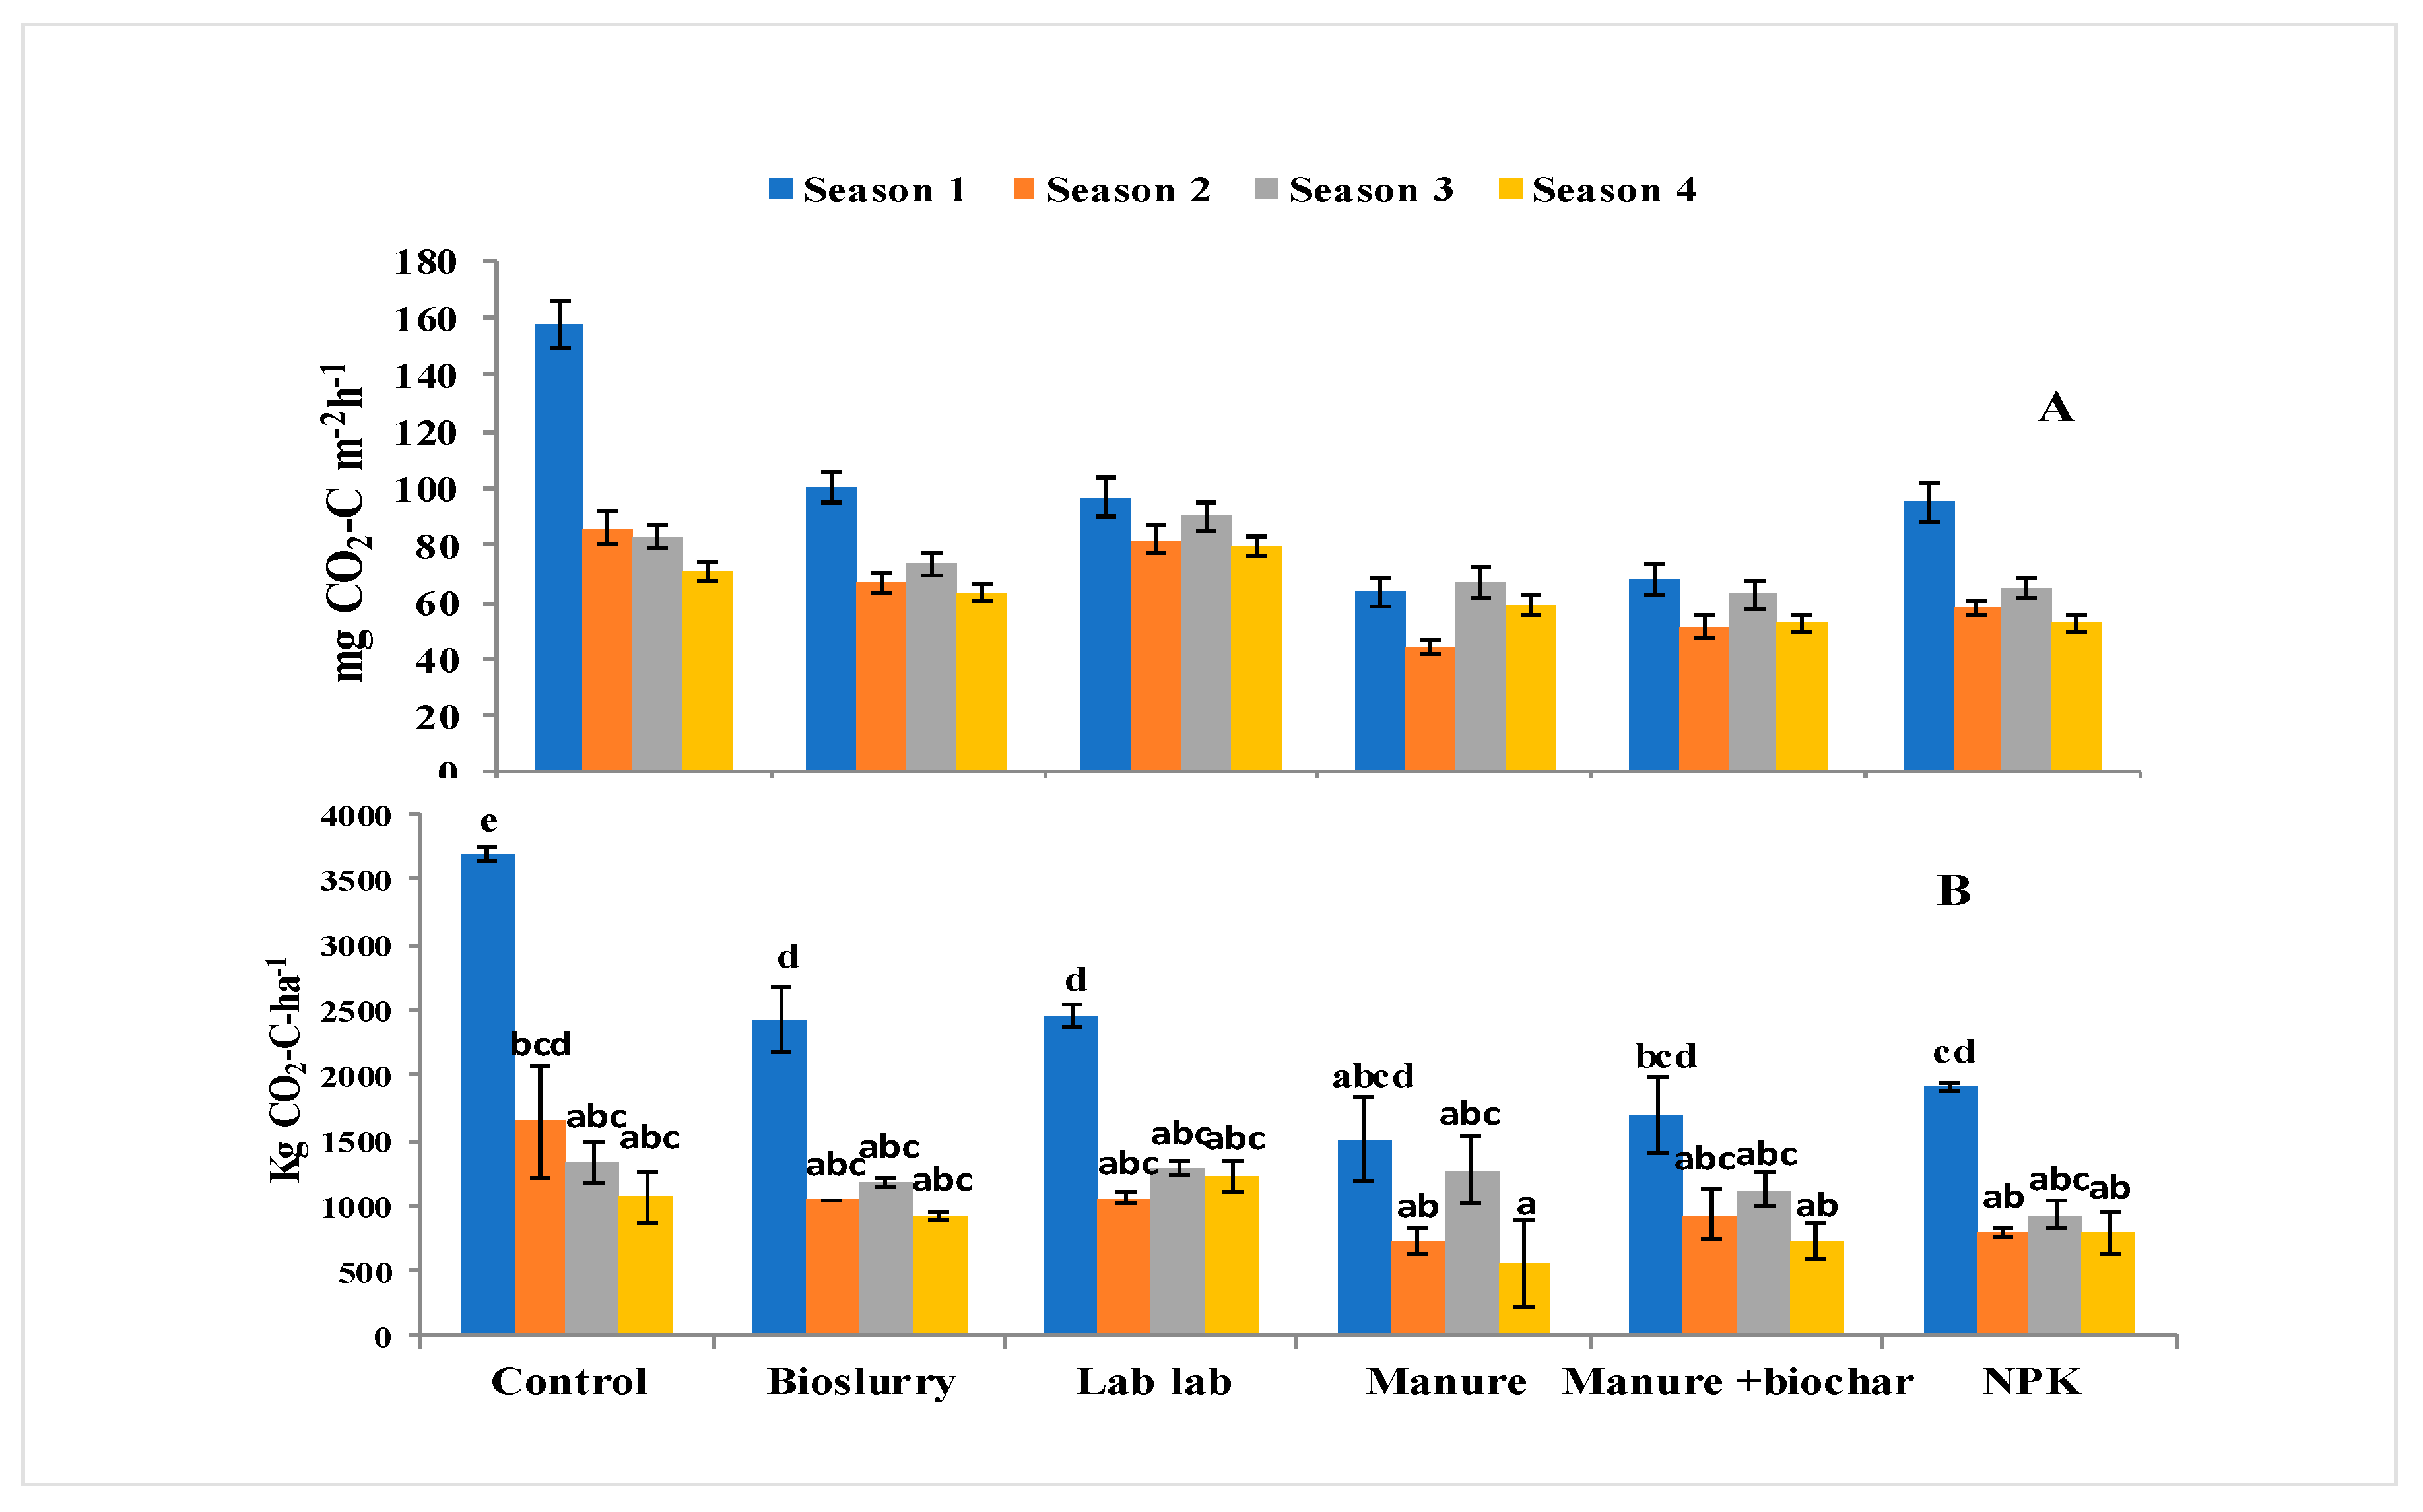
Treatment and season had significant (p < 0.01 respectively) effect on CO2 emissions. CO2 emissions in FYM-BC and FYM alone were on average lower by 61.6% compared to the CO2 emissions in control which had the highest CO2 emissions. Seasonal CO2 emissions followed the order of CD>HD>LR>LR. Treatment and season also interacted significantly (p<0.01) to influence CO2 emissions. Lower (44.33±8.37) emissions occurred under FYM alone during the HD season while the highest (157.54 ±17.90) CO2 emissions were recorded under the control treatment during the 1st season. Figure 5 shows daily temporal CO2 fluxes during the entire study period. Figure 6 presents hourly (A) and cumulative (B) CO2 emissions of the different treatments during the four seasons.
Key: Short rains season (October 2018 to January 2019) (SR), short rains season (January 2019 to March 2019) (HD), long rains season (March 2019 to June 2019) (LR), and short rains (June 2019 to August 2019) (CD).
Key: Season 1-SR: SR (October 2018-January 2019), Season 2-HD (January 2019- March 2019), Season 3-LR (March 2019-June 2019), CD (June 2019-August 2019).

3.3. Effects of Soil Fertilization on Daily and Cumulative N2O Fluxes

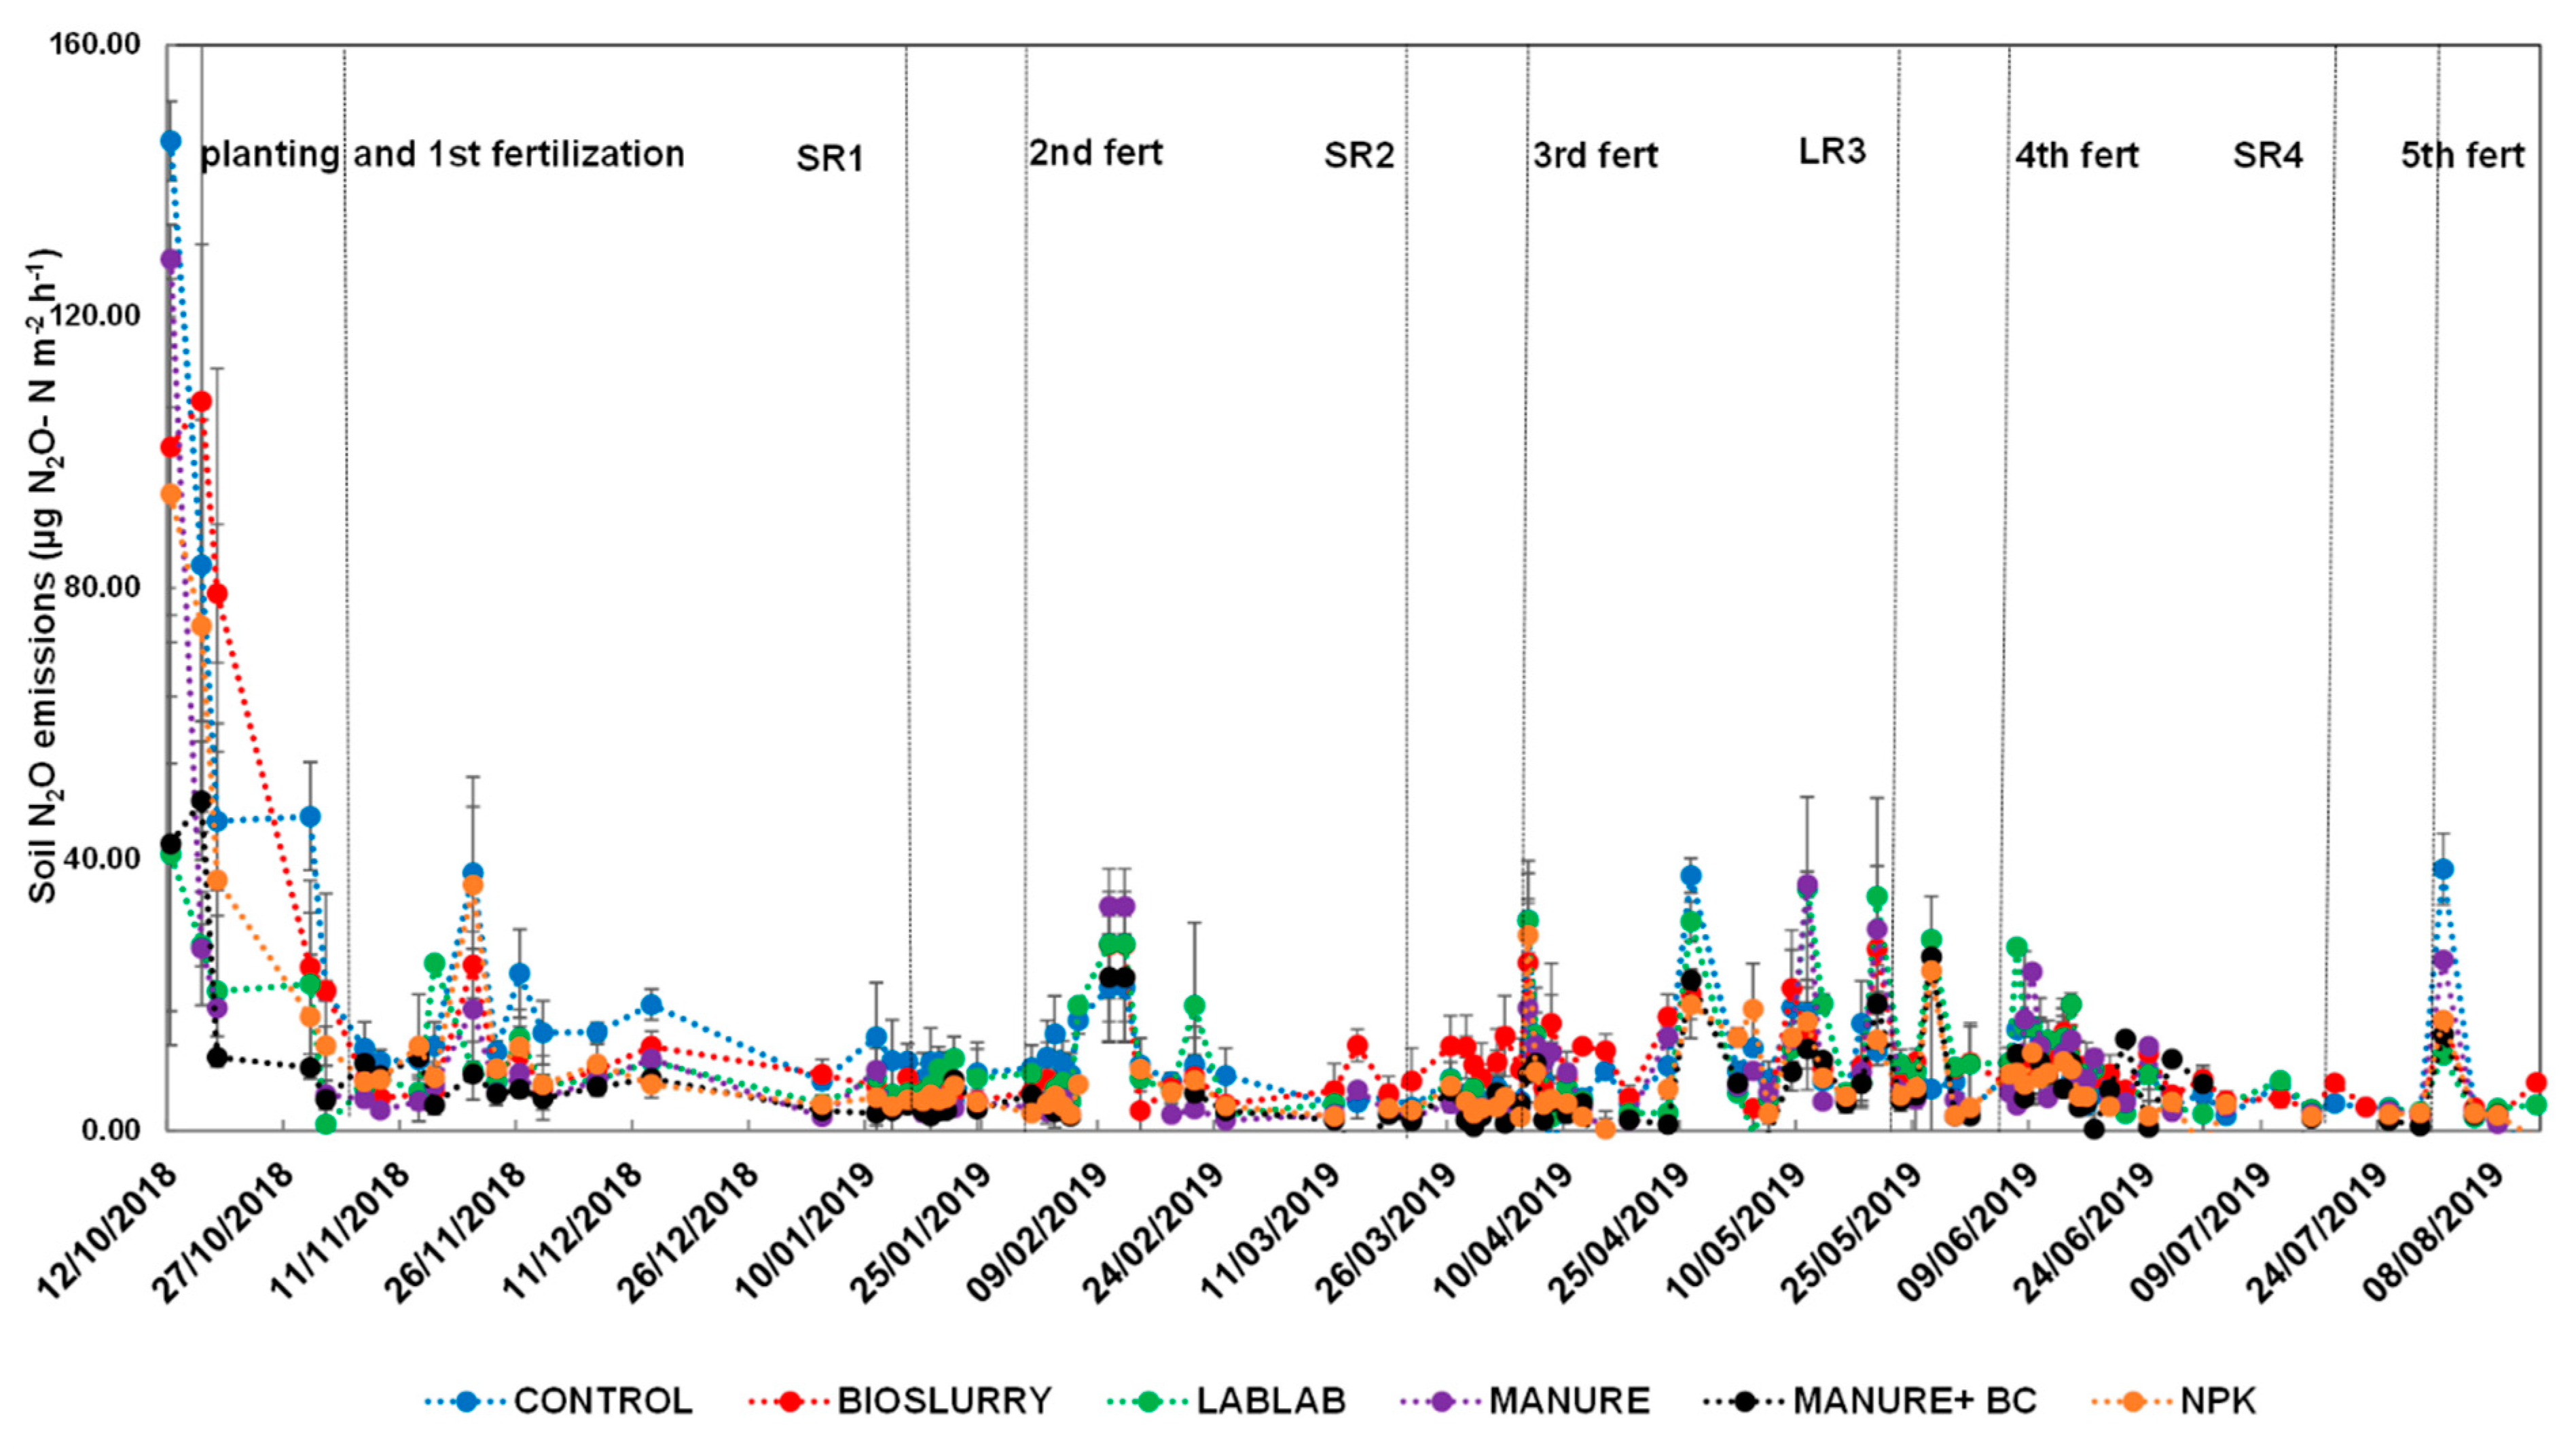
FYM-BC and FYM alone had significantly (p < 0.01) lower (6.70±2.44 and 8.20±2.34) N2O emissions compared to the control which had the highest (12.95±3.61) N2O emissions. Significant higher N2O emissions were recorded during the first season while seasons 2, 3 and 4 had similar emission rates. Significant (p < 0.01) interaction between treatment and season was also observed with NPK recording the lowest (4.51 ±0.96) emissions during the second season relative to control which had the highest (27.16 ±8.79) N2O emissions during the first season. However, cumulative N2O emissions were similar across all treatments (P = 0.235) and seasons (P = 0.736) (Table 4). Figure 7 shows daily temporal soil N2O fluxes during the entire period of study.
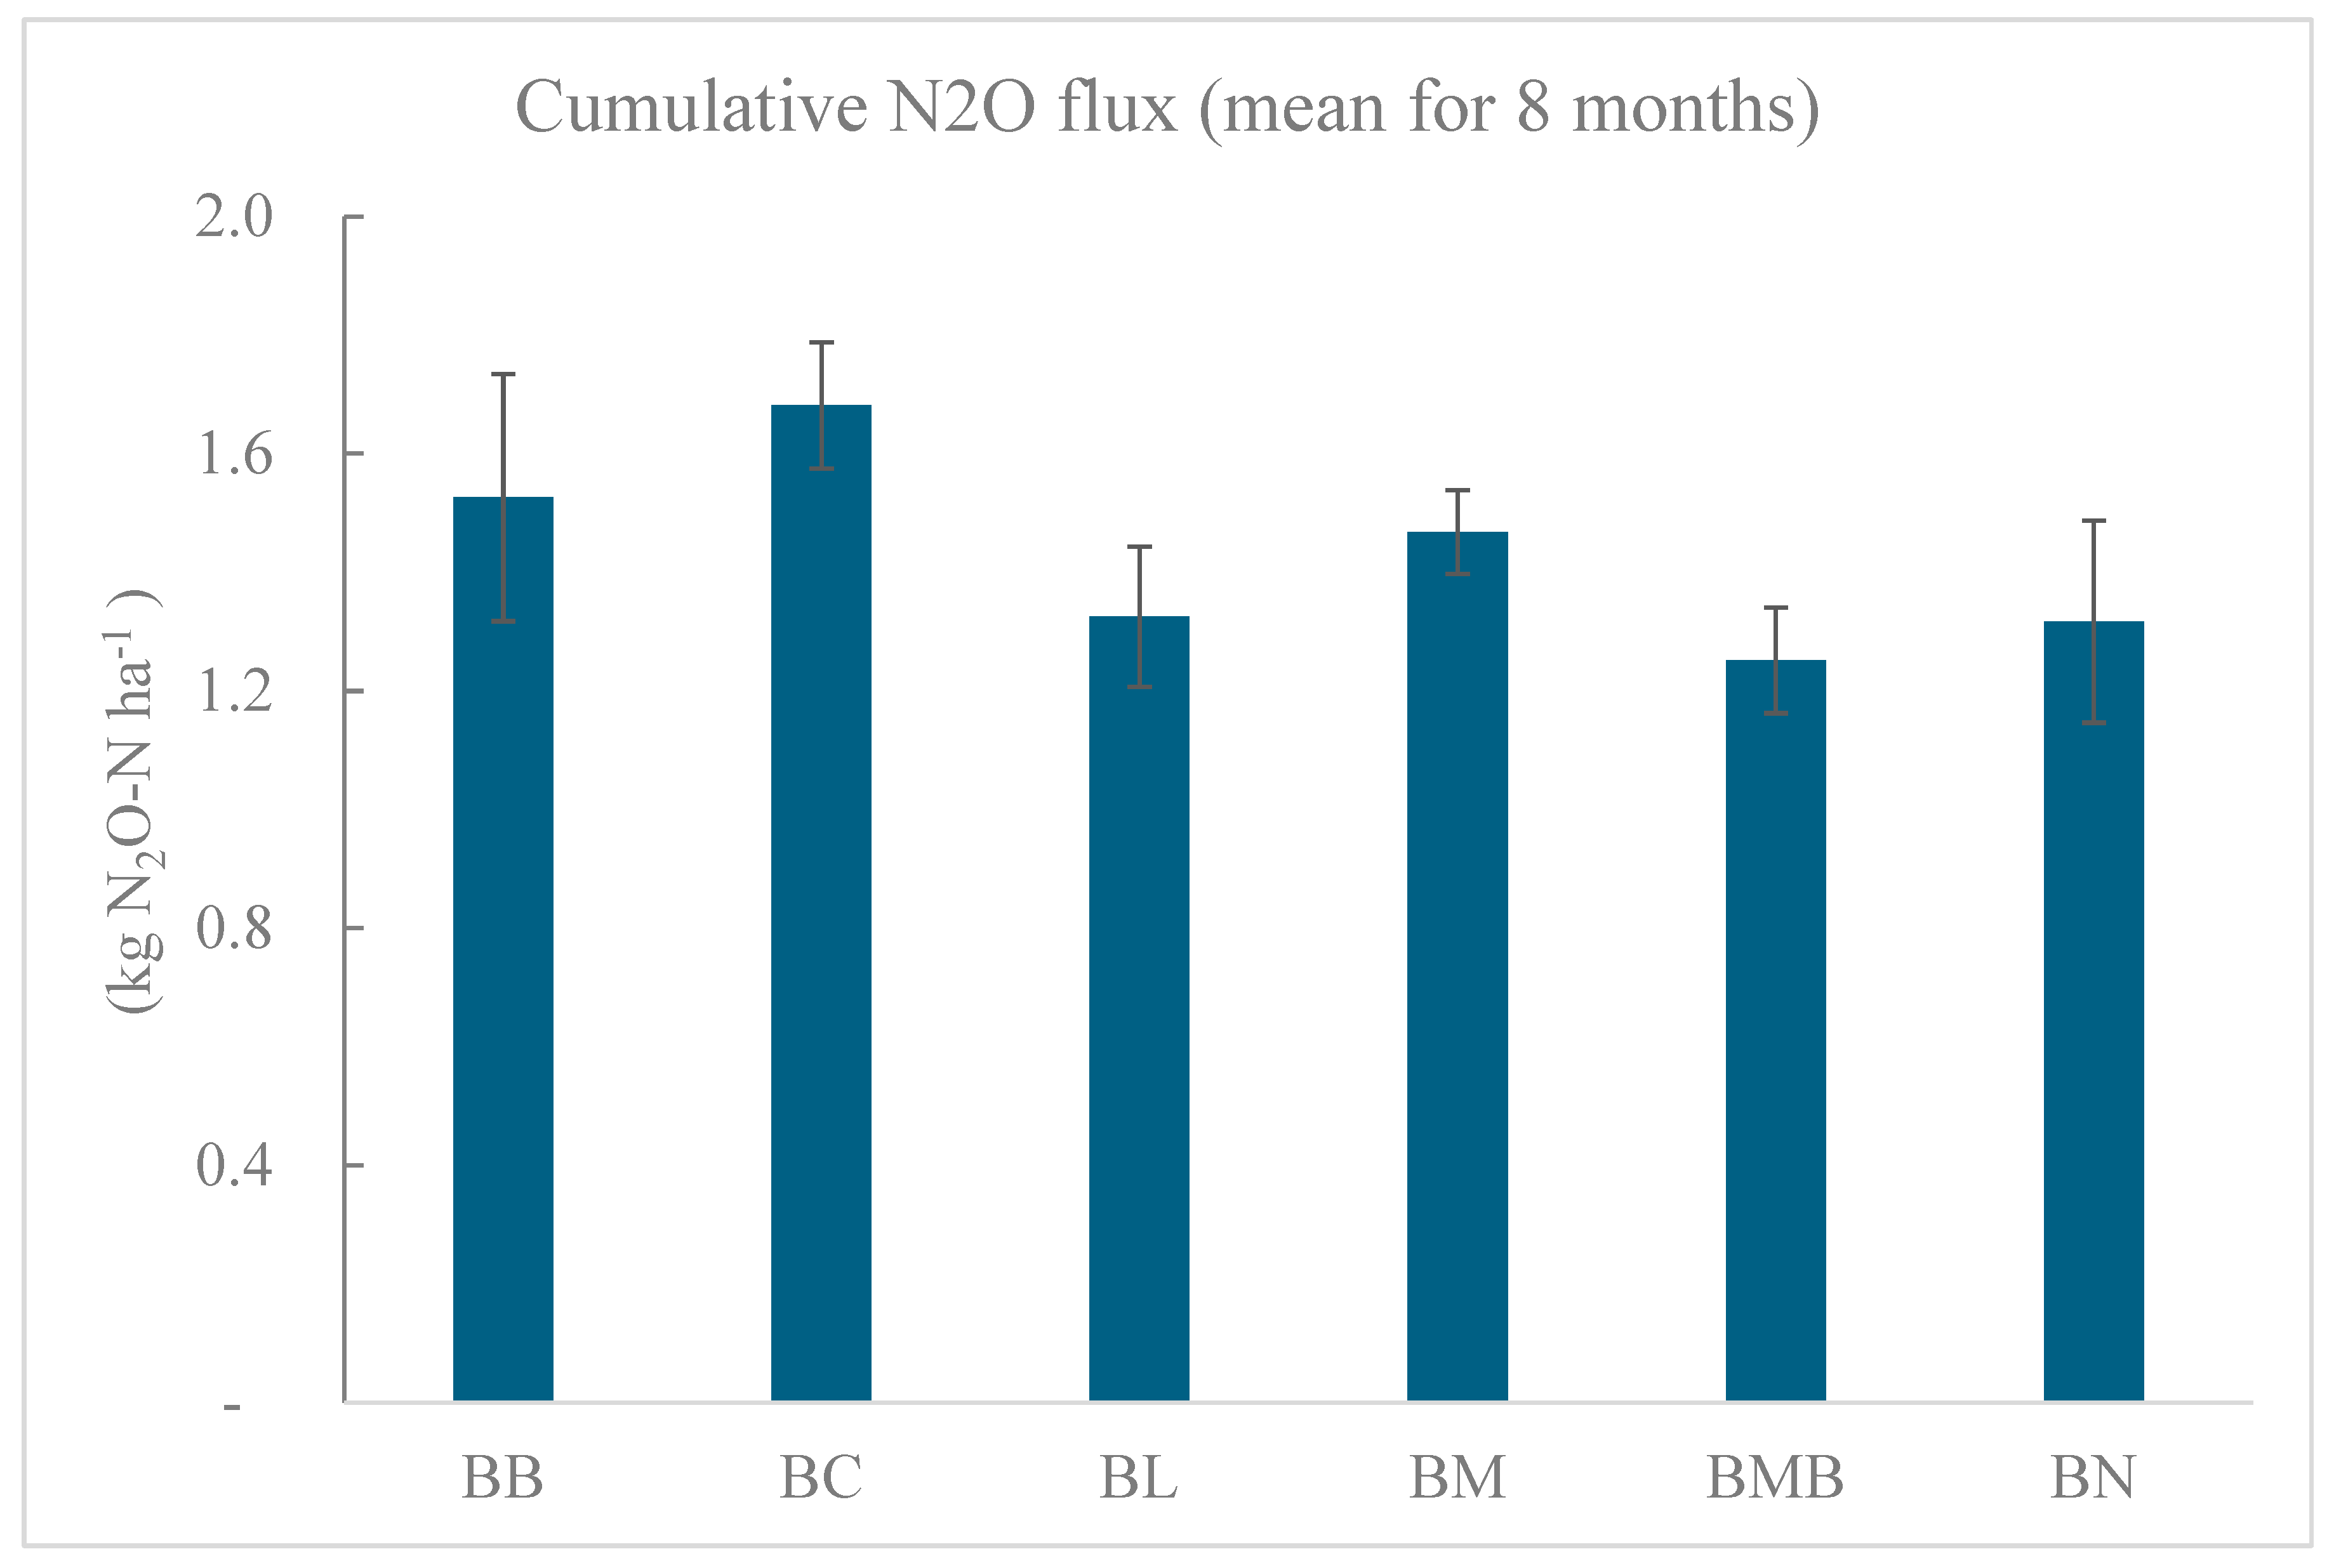
The total cumulative N2O fluxes for the entire study period (8 months) was 1.4 Kg ha-1±0.1. However, there was no significant differences recorded for the cumulative N2O fluxes across the treatments for the entire study period (Figure 8).

3.4. Effects of Soil Fertilization on Yield-Scaled N2O Emissions

The treatments did not show significant effect on yield scaled N2O emissions (P = 0.244) but interacted significantly with seasons to influence yield-scaled N2O emissions (P = 0.026). Compared to Control, FYM-BC recorded a net N2O uptake of 0.02±0.04 Kg N2O-N kg-1 DM in the SR3 season whereas the highest (21.35±0.04 Kg N2O-N kg-1 DM) N2O emission was under Lablab in the SR1 season. The Yield-scaled N2O emissions were generally higher in first season with the seasons 2, 3, and 4 exhibiting moderates to low yield-scaled N2O emissions (Table 5).
Key: SR-Short rains season (October 2018 to January 2019)
HD- short rains season (January 2019 to March 2019)
LR- long rains season (March 2019 to June 2019)
CD- short rains (June 2019 to August 2019).

3.5. Effect of Fertilization and Harvesting on N2O and CO2 Emissions

Soil ammonium concentration, soil moisture (Table 6), CN ratio and CO2 emissions were the main drivers of N2O emissions during the fertilization period (P < 0.01, Adjusted R2 = 0.83-Pearson correlations), while N20 emission was the only parameter that influenced CO2 emission (P < 0.01, Adjusted R2 = 0.65). At harvesting, the soil parameters did not exhibit any relationship with N2O (P = 0.62), while CO2 was significantly influenced by soil moisture content (P = 0.01, Adjusted R2 = 0.52).

4. Discussions

4.1. Effects of Soil Moisture and Temperature on Soil GHG Emissions

The primary drivers of biochemical processes including GHG emissions, are soil moisture and temperature (Zhang et al., 2012); (Butterbach-Bahl et al., 2013). The GHG fluxes temporal patterns followed rainfall trends (moisture fluctuations), which is consistent with Hickman et al., (2014), whose fluxes were high during rainfall seasons. This is similar to the findings of other studies (Ding et al., 2012); (Zhang et al., 2012). A study by Wei-xin et al., (2007) reported that the optimum temperature for N2O emissions ranges should be between 25 to 40 0C which was within our temperature range for GHG emissions.

4.2. Effects of Organic and Inorganic Fertilizers on Cumulative N2O Fluxes

The cumulative N2O fluxes observed in this research study were similar with those reported from some of the studies involving the use of organic and inorganic fertilizers (Baggs et al., 2003; Sarkodie-Addo et al., 2003; Millar, Ndufa, 2004). These cumulative N2O fluxes are slightly lower than 0.45 kg N2O-N ha−1 that was observed under fertilized agricultural soil in sub-Saharan Africa (Dick et al., 2008); (Wanyama et al., 2018). These figures suggest that yearly N2O fluxes from Kenyan agricultural soils is at the lower end of the global estimate at 1.0 kg N2O ha-1 year-1 (Bouwman, 1996).
However, manure recorded higher cumulative N2O emissions (3.801 Kg N2O -N ha-1) compared to NPK (2.265 Kg N2O -N ha-1) although not significantly different. This finding is contradictory to other studies where inorganic fertilizers recorded higher cumulative N2O emissions than the control and organic fertilizers (Ding et al., 2010; Frimpong and Baggs, 2010; Charles et al., 2017). Consequently, FYM + 10% BC recorded the least cumulative N2O emissions (1.252 Kg N2O -N ha-1) which propose that FYM + 10% BC can be a viable strategy in mitigating N2O emissions from agricultural soils. Nevertheless, N2O emissions recorded in NPK plots increased after 15 days of fertilizer application. This was similarly recorded by Maljanen et al, (2003) who asserted that N2O emissions from inorganic fertilizers is short-lived.

4.3. Yield-Scaled N2O Emissions

Reducing yield-scaled N2O emissions is vital in the realization of sustainable African agricultural systems rather than absolute N2O emissions values for a given area (Scheer et al., 2012). Generally, yield-scaled N2O emissions for this study showed a decline from harvest 1 to 4. FYM + 10% BC recorded the lowest values of N2O yield-scaled emissions in harvest 2, 3 and 4, suggesting that the use of FYM-BC can be a good strategy in reducing N2O yield scaled emissions. Other treatments recorded higher N2O yield-scaled emissions from control and organic fertilizers compared to the inorganic fertilizer (NPK) which was in agreement to the findings reported by Nyamadzawo et al. (2014).

5. Conclusions

In conclusion, these results suggest that the use of FYM-BC can be a good strategy in reducing N2O yield scaled emissions. From the study, the following recommendations can be made:
  • Having recorded low N2O emissions when Brachiaria brizantha cv. xaraes is grown at 45 kg N ha-1 harvest-1 (or 225 kg N ha-1 yr-1 for 5 annual harvests) of fertilizer implies that this fertilization rate can be a good GHG mitigation strategy in tropical forage production.
  • It is important to look at different rates of N fertilizer applications in evaluating the yields and emissions of GHG in forage crops. Further research can be conducted at varied fertilizer rates to evaluate the long-term effects of organic and mineral fertilizer on N2O fluxes.
  • Spatial variations in forage GHG emissions in tropical Africa need to be assessed further to understand how various ecological zones respond to varied organic and inorganic fertilizers in terms of yields and GHG emissions.

References

  1. Baggs, E.; Stevenson, M.; Pihlatie, M.; Regar, A.; Cook, H.; Cadisch, G. Nitrous oxide emissions following application of residues and fertiliser under zero and conventional tillage. Plant Soil 2003, 254, 361–370. [Google Scholar] [CrossRef]
  2. Bengtsson, J.; Ahnström, J.; Weibull, A. The effects of organic agriculture on biodiversity and abundance: a meta-analysis. J. Appl. Ecol. 2005, 42, 261–269. [Google Scholar] [CrossRef]
  3. Bot, A.; Benites, J. (2005). The importance of soil organic matter: Key to drought-resistant soil and sustained food production (No. 80). Food & Agriculture Org.
  4. Bouwman, A.F. Direct emission of nitrous oxide from agricultural soils. Nutr. Cycl. Agroecosystems 1996, 46, 53–70. [Google Scholar] [CrossRef]
  5. Butterbach-Bahl, K.; Dannenmann, M. Denitrification and associated soil N2O emissions due to agricultural activities in a changing climate. Curr. Opin. Environ. Sustain. 2011, 3, 389–395. [Google Scholar] [CrossRef]
  6. Butterbach-Bahl, K.; Baggs, E.M.; Dannenmann, M.; Kiese, R.; Zechmeister-Boltenstern, S. Nitrous oxide emissions from soils: How well do we understand the processes and their controls? Philos. Trans. R. Soc. B Biol. Sci. 2013, 368, 20130122. [Google Scholar] [CrossRef]
  7. Cambardella, C.A. (2005). Carbon cycle in soils formation and decomposition. Encycl Soils Environ, 1(9780123485304), 170-175.
  8. Dhondt, K.; Boeckx, P.; Hofman, G.; Van Cleemput, O. Temporal and spatial patterns of denitrification enzyme activity and nitrous oxide fluxes in three adjacent vegetated riparian buffer zones. Biol. Fertil. Soils 2004, 40, 243–251. [Google Scholar] [CrossRef]
  9. Dick, J.; Kaya, B.; Soutoura, M.; Skiba, U.; Smith, R.; Niang, A.; Tabo, R. The contribution of agricultural practices to nitrous oxide emissions in semi-arid Mali. Soil Use Manag. 2008, 24, 292–301. [Google Scholar] [CrossRef]
  10. Ding, W.; Yagi, K.; Cai, Z.; Han, F. Impact of Long-Term Application of Fertilizers on N2O and NO Production Potential in an Intensively Cultivated Sandy Loam Soil. Water, Air, Soil Pollut. 2010, 212, 141–153. [Google Scholar] [CrossRef]
  11. Frimpong, K.A.; Baggs. (2010). Do combined applications of crop residues and inorganic fertilizer lower emission of N 2 O from soil? August. [CrossRef]
  12. Hamdi, S.; Moyano, F.; Sall, S.; Bernoux, M.; Chevallier, T. Synthesis analysis of the temperature sensitivity of soil respiration from laboratory studies in relation to incubation methods and soil conditions. Soil Biol. Biochem. 2013, 58, 115–126. [Google Scholar] [CrossRef]
  13. Hynes, R.K.; Knowles, R. Production of nitrous oxide by Nitrosomonas europaea: effects of acetylene, pH, and oxygen. Can. J. Microbiol. 1984, 30, 1397–1404. [Google Scholar] [CrossRef]
  14. Janzen, H.; Campbell, C.; Izaurralde, R.; Ellert, B.; Juma, N.; McGill, W.; Zentner, R. Management effects on soil C storage on the Canadian prairies. Soil Tillage Res. 1998, 47, 181–195. [Google Scholar] [CrossRef]
  15. Kotsyurbenko, O.R.; Glagolev, M.V.; Nozhevnikova, A.N.; Conrad, R. Competition between homoacetogenic bacteria and methanogenic archaea for hydrogen at low temperature. FEMS Microbiol. Ecol. 2001, 38, 153–159. [Google Scholar] [CrossRef]
  16. Maljanen, M.; Liikanen, A.; Silvola, J.; Martikainen, P.J. Measuring N2O emissions from organic soils by closed chamber or soil/snow N2O gradient methods. Eur. J. Soil Sci. 2003, 54, 625–631. [Google Scholar] [CrossRef]
  17. Millar, N.; Ndufa, J.K.; Cadisch, G.; Baggs, E.M. Nitrous oxide emissions following incorporation of improved-fallow residues in the humid tropics. Glob. Biogeochem. Cycles 2004, 18. [Google Scholar] [CrossRef]
  18. Moyano, F.E.; Manzoni, S.; Chenu, C. Responses of soil heterotrophic respiration to moisture availability: An exploration of processes and models. Soil Biol. Biochem. 2013, 59, 72–85. [Google Scholar] [CrossRef]
  19. Myhre, G.; Samset, B.H.; Schulz, M.; Balkanski, Y.; Bauer, S.; Berntsen, T.K.; Bian, H.; Bellouin, N.; Chin, M.; Diehl, T.; et al. Radiative forcing of the direct aerosol effect from AeroCom Phase II simulations. Atmospheric Meas. Tech. 2013, 13, 1853–1877. [Google Scholar] [CrossRef]
  20. Nicolardot, B.; Recous, S.; Mary, B. Simulation of C and N mineralisation during crop residue decomposition: A simple dynamic model based on the C:N ratio of the residues. Plant Soil 2001, 228, 83–103. [Google Scholar] [CrossRef]
  21. Nyamadzawo, G.; Wuta, M.; Nyamangara, J.; Smith, J.L.; Rees, R.M. Nitrous oxide and methane emissions from cultivated seasonal wetland (dambo) soils with inorganic, organic and integrated nutrient management. Nutr. Cycl. Agroecosystems 2014, 100, 161–175. [Google Scholar] [CrossRef]
  22. Raich, J.W.; Tufekciogul, A. Vegetation and soil respiration: Correlations and controls. Biogeochemistry 2000, 48, 71–90. [Google Scholar] [CrossRef]
  23. Robertson, G.P.; Groffman, P. (2007). Nitrogen transformations. Soil microbiology, ecology and biochemistry. Elsevier, pp. 341-364.
  24. Sarkodie-Addo, J.; Lee, H.; Baggs, E. Nitrous oxide emissions after application of inorganic fertilizer and incorporation of green manure residues. Soil Use Manag. 2003, 19, 331–339. [Google Scholar] [CrossRef]
  25. Scheer, C.; Grace, P.R.; Rowlings, D.W.; Payero, J. Nitrous oxide emissions from irrigated wheat in Australia: impact of irrigation management. Plant Soil 2012, 359, 351–362. [Google Scholar] [CrossRef]
  26. Segers, R. Methane production and methane consumption: a review of processes underlying wetland methane fluxes. Biogeochemistry 1998, 41, 23–51. [Google Scholar] [CrossRef]
  27. Dasselaar, A.v.D.P.; Corré, W.J.; Priemé, A.; Klemedtsson, K.; Weslien, P.; Klemedtsson, L.; Stein, A.; Oenema, O. Spatial Variability of Methane, Nitrous Oxide, and Carbon Dioxide Emissions from Drained Grasslands. Soil Sci. Soc. Am. J. 1998, 62, 810–817. [Google Scholar] [CrossRef]
  28. Ding, W.-X.; Cai, Z.-C. Methane Emission from Natural Wetlands in China: Summary of Years 1995–2004 Studies. Pedosphere 2007, 17, 475–486. [Google Scholar] [CrossRef]
  29. Yiqi, L.; Zhou, X. (2010). Soil respiration and the environment. Elsevier.
  30. Zhang, Y.; Liu, J.; Mu, Y.; Xu, Z.; Pei, S.; Lun, X.; Zhang, Y. Nitrous oxide emissions from a maize field during two consecutive growing seasons in the North China Plain. J. Environ. Sci. 2012, 24, 160–168. [Google Scholar] [CrossRef]
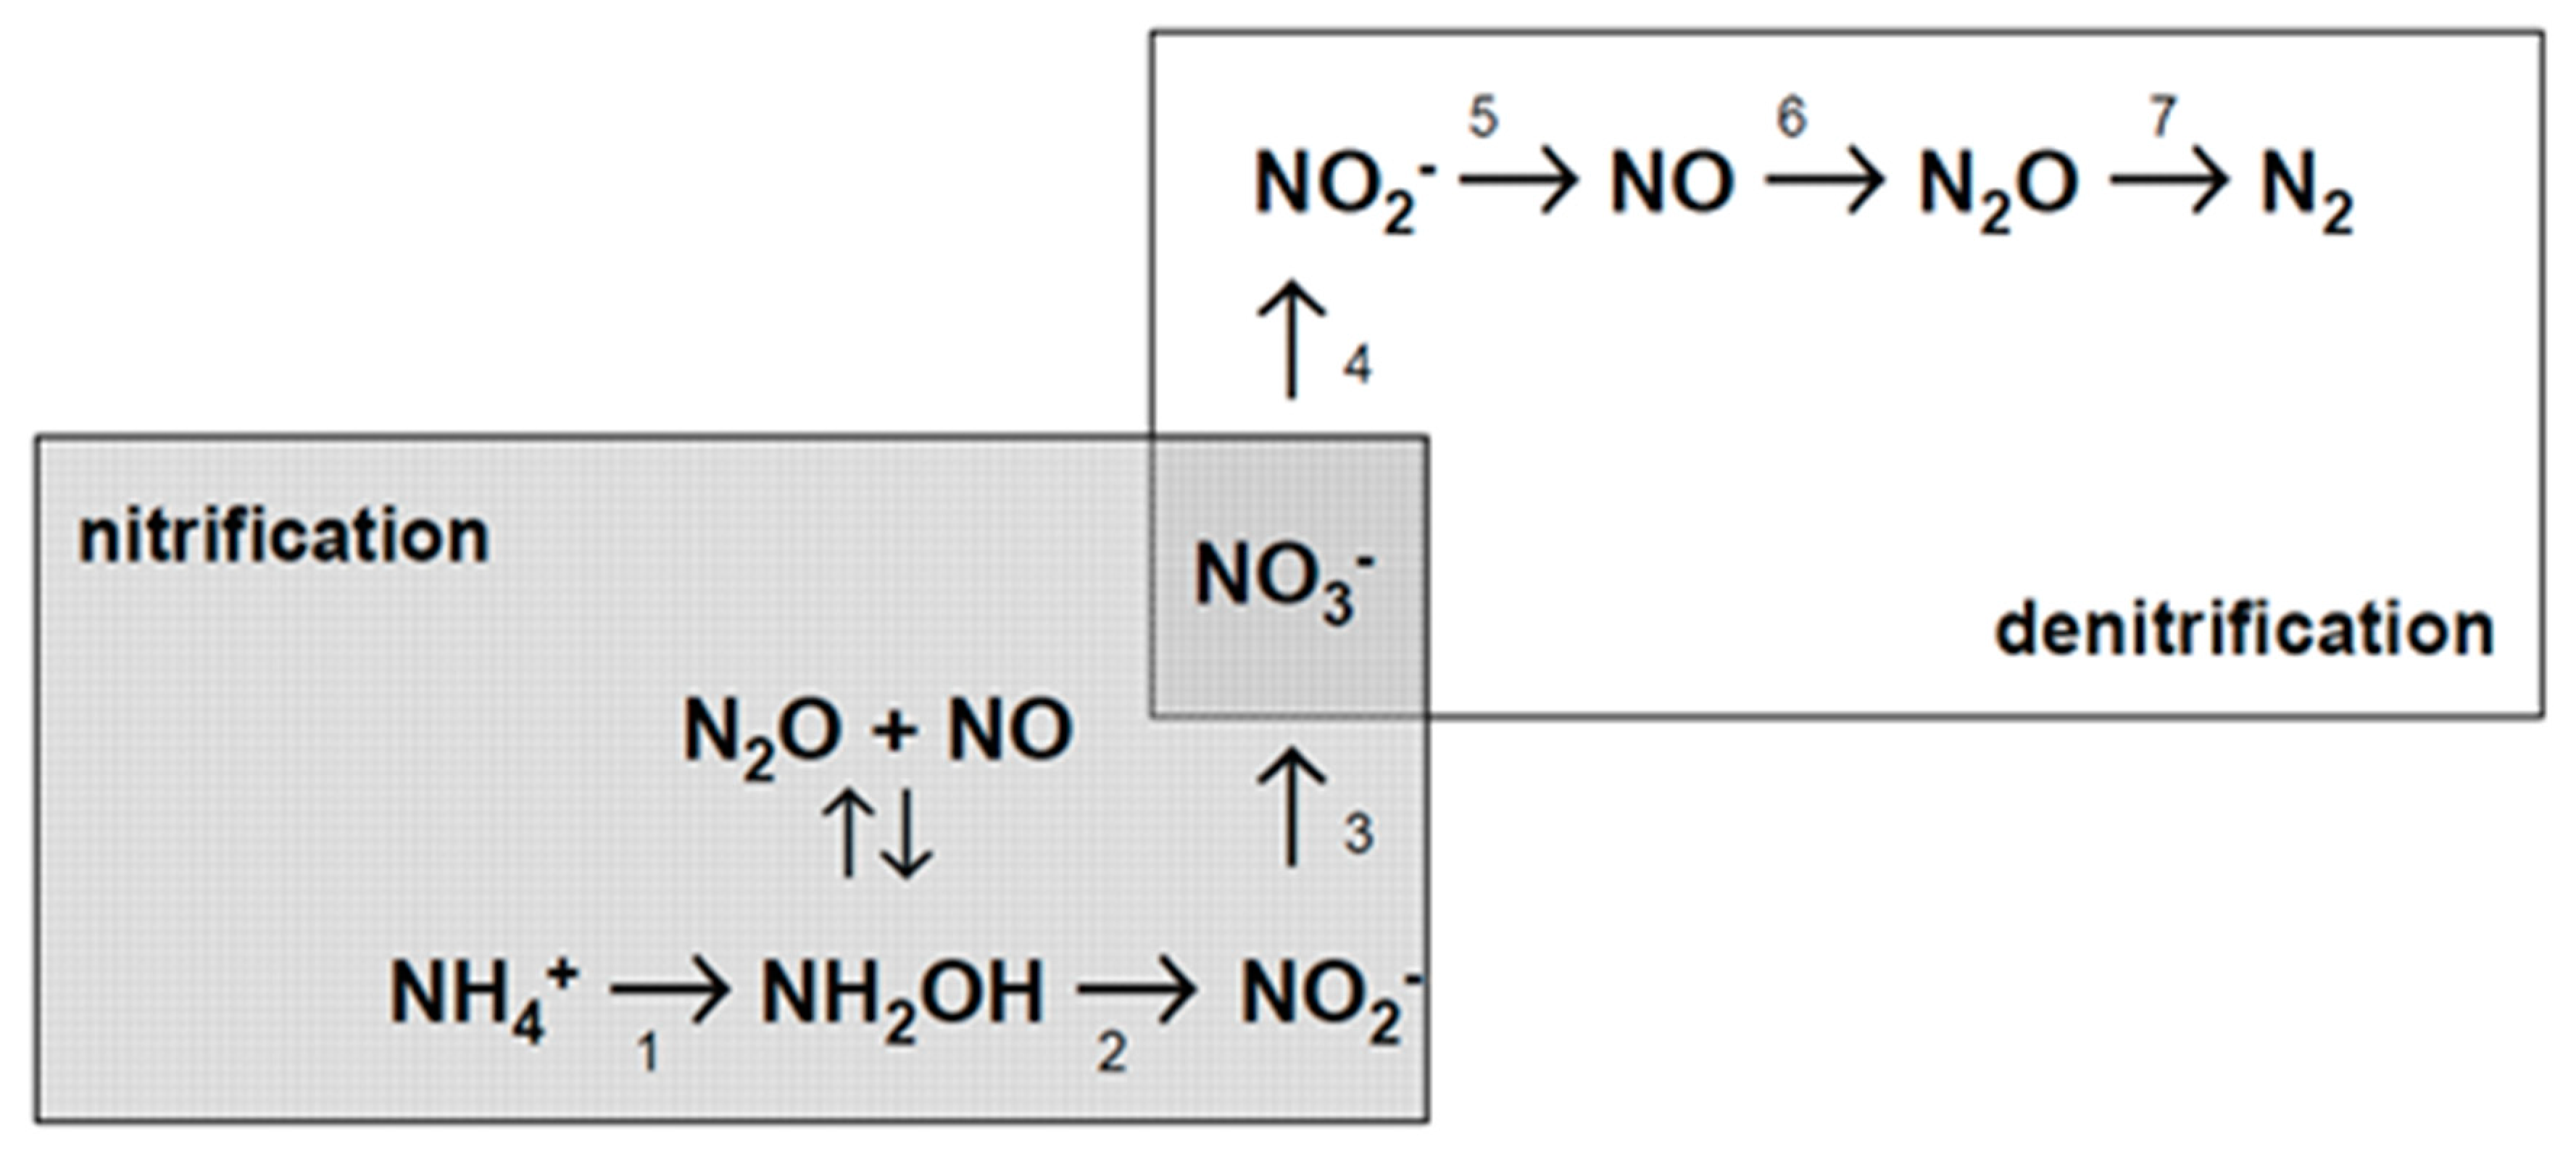
Figure 1. Processes of denitrification and nitrification (adapted from; (Kotsyurbenko et al., 2001; Dhondt et al., 2004).
Preprints 119927 g001
Figure 2. The study area (ILRI-Campus) Source: Author.
Preprints 119927 g002
Figure 3. The plots before planting. b) The complete set of static GHG sampling assemblage. c) The inter-row positioning of the static chamber in the field in newly planted Brachiaria plots (approx. two weeks old).
Preprints 119927 g003
Figure 4. Daily temporal CH4 uptake during the entire study periodKey: Short rains season (October 2018 to January 2019) (SR), hot dry season (January 2019 to March 2019) (HD), long rains season (March 2019 to June 2019) (LR), cold dry season (June 2019 to August 2019) (CD).
Preprints 119927 g004
Figure 5. Daily temporal CO2 fluxes during the entire study period.
Preprints 119927 g005
Figure 6. Hourly (A) and cumulative (B) CO2 emission of different treatments during the four seasons. Vertical error bars represent standard error of the mean. Different lowercase letters indicate significant differences between treatments and seasons.
Preprints 119927 g006
Figure 7. Daily temporal soil N2O fluxes during the entire period of studyKey: Short rains season (October 2018 to January 2019) (SR), short rains season (January 2019 to March 2019) (HD), long rains season (March 2019 to June 2019) (LR), and short rains (June 2019 to August 2019) (CD).
Preprints 119927 g007
Figure 8. The total cumulative N2O fluxes for the entire study period.
Preprints 119927 g008
Table 1. Average CO2, N2O emissions and CH4 uptake across the treatments during the experiment period.
Treatment CH4 (mg CH4-C m-2 h-1) CO2 (mg CO2-C m-2h-1) N2O (mgN2O-N m-2h-1)
Control -21.86±17.97b 94.76 ±19.32a 12.95±3.61a
Lablab -18.32 ±5.04b 86.71±15.89a 10.51±2.93ab
Bioslurry -2.69 ±4.47a 74.38 ±11.08b 12.87±4.29a
NPK -16.67±3.69b 66.06 ±12.88bc 10.00±3.30ab
FYM_BC -17.84 ±6.05b 58.43±14.48c 6.70±2.44b
FYM -18.30 ±2.91b 58.39 ±15.67c 8.20±2.34b
p-value <0.01 <0.01 <0.01
L.S.D. 8.85 6.37 3.13
Table 2. Average CO2 and N2O emissions and CH4 uptake across the four growing seasons.
Season CH4 (mg CH4-C m-2 h-1) CO2 (mg CO2-C m-2h-1) N2O (mgN2O-N m-2h-1)
SR -11.69 ±4.67ab 97.89 ±20.45a 18.40 ±5.41a
HD -21.23 ±5.39b 65.22 ±14.16c 7.26 ±2.03b
LR -19.07 ±6.42ab 73.78 ±16.17b 9.40 ±2.93b
CD -11.43 ±13.87a 63.21 ±13.32c 7.36 ±0.20b
p-value 0.01 <0.01 <0.01
L.S.D. 7.67 5.25 2.46
Table 3. Average CO2 and N2O emissions and CH4 uptake of the different treatments across the four growing seasons.
Treatment Season CH4 (mg CH4-C m-2 h-1) CO2 (mg CO2-C m-2h-1) N2O (mgN2O-N m-2h-1)
Control SR -357±2.60a 157.54 ±17.90a 27.16 ±8.79a
HD -506 ±12.60a 86.1 ±11.08bcde 9.20 ±2.96c
LR -282 ±13.55a 82.86 ±10.72 bcdef 9.60 ±3.12c
CD -302 ±58.22a 70.67 ± defghi 7.07 ±2.01c
Lablab SR -340 ±6.09a 96.70 ±23.55 bc 11.63 ±3.87bc
HD -252 ±6.20a 82.11 ±15.06bcdefg 9.76 ±2.33bc
LR -273 ±4.35a 90.16 ±15.75bcd 11.82 ±3.95bc
CD -302 ±2.82a 79.82 ±13.01bcdefgh 8.57 ±2.89c
Bioslurry SR -292 ±3.83a 100.10 ±28.76b 24.37 ±5.69a
HD -275 ±3.08a 67.07 ±25.75efghij 8.61 ±3.28c
LR -297 ±4.41a 73.62 ±14.75cdefghi 11.23 ±3.37bc
CD -105 ±6.36a 63.26 ±13.06fghij 8.90 ±2.86c
NPK SR -88 ±1.45a 95.23 ±19.81bc 20.97 ±7.86ab
HD -354 ±4.35a 57.91 ±9.45hij 4.51 ±0.96c
LR -179 ±3.26a 64.94 ±12.92efghij 8.37 ±1.93c
CD -81 ±5.63a
52.71 ±11.94ij 5.76 ±2.24c
FYM-BC SR -76 ±5.06a 67.81± 14.79defghij 10.45 ±3.88bc
HD -337 ±2.52a 51.26±15.27ij 5.29 ±1.88c
LR -150 ±10.99a 62.60 ±18.16fghij 5.60 ±2.00c
CD -234 ±9.60a
52.84 ±14.08ij 5.23 ±1.91c
FYM SR -540 ±8.99a 63.81 ±17.92efghij 11.24 ±2.36bc
HD -431 ±3.59a 44.33±8.37j 4.95 ±0.79c
LR -260 ±1.97a 66.68 ±24.72efghij 8.50 ±3.21c
CD -268 ±0.57a
58.87 ±18.49ghij 7.74 ±2.94c
p-value (Treatment * Season) 0.093 <0.01 <0.01
L.S.D. 13.112 6.36
Table 4. Cumulative CH4 uptake and CO2 and N2O emissions under different treatments and seasons.
CH4(g CH4-C ha-1) CO2 (kg CO2-C ha-1) N2O (Kg N2O -N ha-1)
Treatment Control -361.90±21.74ab 1929±208.89c 0.233±4.24a
Lablab -291.80±4.87ab 1504±73.82b 0.141±3.26a
FYM -374.80±3.78a 1015±250.61a 3.801±2.32a
FYM-BC -199.10±7.05ab 1117±185.33ab 1.252±2.42a
NPK -175.30±3.67b 1106±84.69a 2.265±3.25a
Bioslurry -242.20±4.42ab 1393±78.09ab 0.26±3.80a
P-value 0.013 <0.001 0.235
L.S.D. 130.5 263.0 5.193
Season SR1 -282.4±4.67ab
2279±169.72c 0.32±5.41a
SR2 -359.1±5.39a
1030±134.05ab 0.12±2.03a
LR3 -240.0±6.42ab
1184±120.37b 0.16±2.93a
SR4 -215.3±13.87b 883±163.45a 2.14±0.2a
P-value 0.048 <0.001 0.736
L.S.D. 106.6 214.7 2.109
(Values are mean ± SE).
Table 5. Yield-scaled N2O emissions under different treatments during the four seasons.
Treatment (Values are mean ± SE). Season
SR HD LR CD
(g N2O-N kg-1 DM yield)
Control 4.47±0.05ab 0.08±0.01a 0.03±0.01a 0.03±0.05a
Bioslurry 7.05±0.04ab 0.12±0.02a 0.03±0.003a 0.07±0.003a
Lablab 21.35±0.04b 0.10±0.02a 0.07±0.01a 0.07±0.03a
FYM 0.74±0.01a 0.19±0.01a 0.02±0.01a 10.23±0.26a
FYM-BC 3.17±0.04ab 0.04±0.01a 0.02±0.01a 0.02±0.04a
NPK 2.77±0.15ab 0.06±0.01a 0.02±0.01a 6.89±0.05ab
Table 6. Factors affecting N2O and CO2 emissions during fertilization.
(n = 36) Coefficients Standard Error t Stat P-value
N2O (Constant) -486.46 177.10 -2.75 0.01
Soil temperature 1.08 0.68 1.59 0.12
C/N ratio 39.77 17.29 2.30 0.03
Soil moisture 0.96 0.37 2.60 0.01
Ammonium 1.18 0.29 4.01 0.00
Nitrate -0.04 0.13 -0.35 0.73
CO2 flux 0.43 0.07 6.62 0.00
CO2 (Constant) 729.28 329.40 2.21 0.03
Soil temperature -1.28 1.24 -1.03 0.31
C/N ratio -59.07 31.84 -1.85 0.07
Soil moisture -0.95 0.72 -1.32 0.20
Ammonium -1.03 0.63 -1.64 0.11
Nitrate -0.04 0.23 -0.15 0.88
N2O flux 1.39 0.21 6.62 0.00
Disclaimer/Publisher’s Note: The statements, opinions and data contained in all publications are solely those of the individual author(s) and contributor(s) and not of MDPI and/or the editor(s). MDPI and/or the editor(s) disclaim responsibility for any injury to people or property resulting from any ideas, methods, instructions or products referred to in the content.
Copyright: This open access article is published under a Creative Commons CC BY 4.0 license, which permit the free download, distribution, and reuse, provided that the author and preprint are cited in any reuse.
Prerpints.org logo

Preprints.org is a free preprint server supported by MDPI in Basel, Switzerland.

Subscribe

© 2024 MDPI (Basel, Switzerland) unless otherwise stated