1. Introduction
Excessive nitrogen not only leads to eutrophication of water bodies but also causes harm to animals and human beings [
1]. In recent years, more and more attention has been paid to the effective deep treatment of tail water. Tailwater concentration in sewage treatment plants is low, but there are refractory organic compounds and NH
4+-N and NO
3--N [
2,
3]. Therefore, deep denitrification of the tailwater of sewage treatment plants is very important.
Biological denitrification technology is a economical and efficient denitrification technology and is the most widely used denitrification method in urban sewage treatment [
4]. Compared with heterotrophic systems, autotrophic denitrification systems have many advantages. Among them, sulfur autotrophic denitrifying bacteria take nitrate as electron acceptor to oxidize sulfur-containing compounds such as H
2S, S
2O
32-, S and other sulfur compounds to SO
42- [
5]. The system does not require an additional organic carbon source, thus minimizing sludge treatment and reducing N
2O emissions [
6].
A sulfur-limestone packed bed reactor is the most common form of the sulfur autotrophic denitrification process. Yingying Li et al. [
7] set a pilot-scale sulfur limestone autotrophic denitrification biological filter for municipal tailwater treatment and found that when HRT was 18 hour and temperature was ranging from 6.4 °C to 9.8 °C, TN and NO
3--N removal rate reached 81.1% and 85.3%, respectively. Ahmed et al. [
8] used a pilot-scale sulfur-limestone packed bed reactor to treat municipal domestic sewage. When the inflow nitrate nitrogen load was 360 mg/(L·d) and 180 mg/(L·d), the denitrification rate of the reactor was 89% and 79%, respectively, indicating that the system had a good denitrification effect. Limestone can provide alkalinity and an inorganic carbon source but cannot play the role of electron donor, and the presence of limestone will also increase the hardness of the water [
9], so it is necessary to develop a new buffer and inorganic carbon source.
As one of the most widely distributed minerals in nature, siderite is mainly composed of ferrous carbonate (FeCO
3). Under anoxic conditions, autotrophic denitrifying microorganisms can use Fe
2+ as an electron donor to reduce NO
3--N to N
2 [
10,
11] studied the simultaneous removal of nitrate and phosphate from water by autotrophic denitrification based on siderite, and the experimental results confirmed that siderite was a very effective electron donor for nitrate removal. Zhu et al. [
12] coupled sulfur and siderite autotrophic denitrification to improve the removal effect of nitrate. Experimental results showed that the sulfur-siderite system had a higher denitrification effect than the sulfur-limestone system, and the denitrification rate reached 720.35mg/(L·d). FeCO
3 can not only provide alkalinity and inorganic carbon sources but also participate in the denitrification process as an electron donor, improving the performance of denitrification in the reactor [
13].
Sodium thiosulfate is a common chemical raw material that is easily soluble in water. Capua et al. [
14] found that thiosulfates could achieve a relatively high denitrification rate (52.5 mg/(L/d) NO
3--N) with an S/N ratio of 1.8, which is 10 times that of S0. Cardoso [
15] also found that compared with S
0 and S
2-, the removal rate of nitrate increased by 4.58 times and 9.45 times, respectively. In addition, even when thiosulfate is as high as 2200mg/L, It can be seen that using sodium thiosulfate as a autotrophic denitrification sulfur source has significant advantages.
To sum up, this study takes the tail water of an actual sewage treatment plant as the research object, along with the tailwater of the sewage treatment plant, to investigate the tailwater depth denitrification demand. The goal was to explore a kind of microbial carrier consisting of ceramsite and siderite, plus sodium thiosulfate as the electron donor, in a low-cost, high-efficiency autotrophic denitrification biological filter denitrification process. Microbial community analysis was carried out to determine the dominant bacteria. At the same time, the technical and economic feasibility of the process is analyzed to provide a technical reference for deep denitrification of tail water in low C/N ratio sewage treatment plants.
2. Materials and Methods
2.1. Reactor Setup
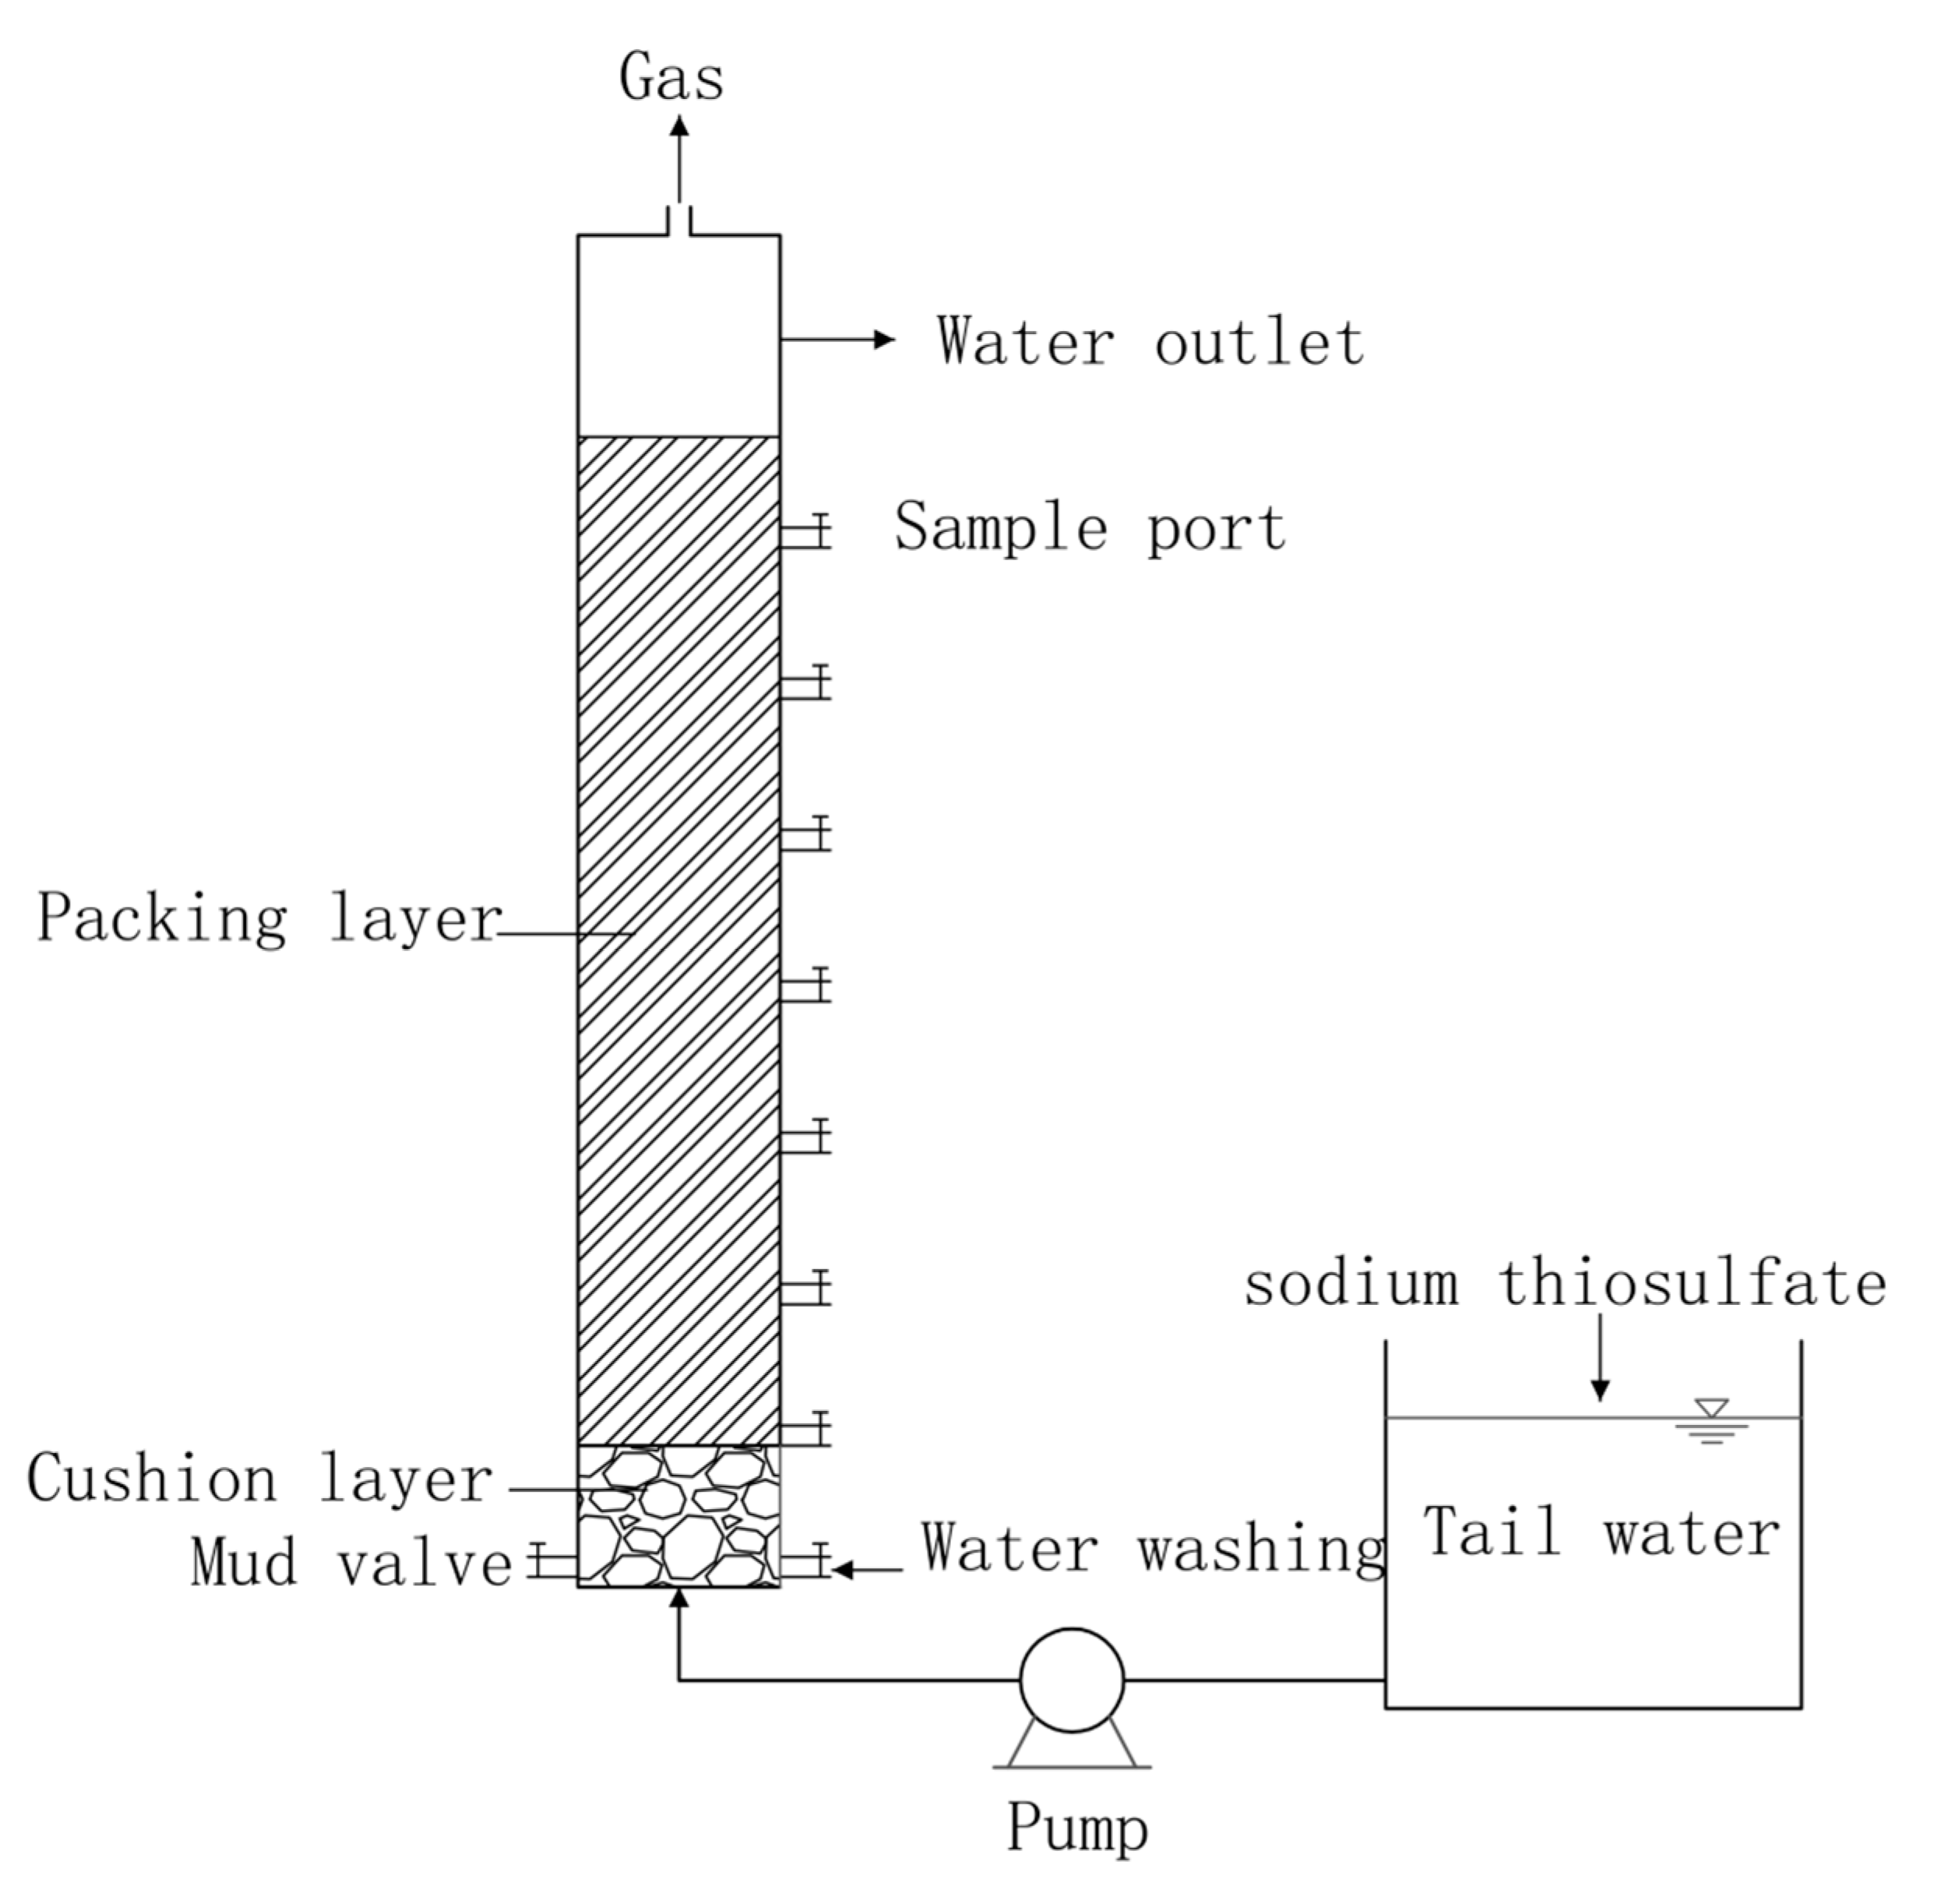
This experimental setup adopts the reactor unit diagram shown in
Figure 1. The reactor unit was self-processed, and the material was plexiglass. The reactor radius was 50 mm, the height was 1000 mm, the effective volume was 1.9 L, the cushion layer height was 100 mm, the packing height was 700 mm, and the path included a sampling mouth every 100 mm for a total of seven sampling mouths.
The packing layer in the reactor were ceramsite and siderite (diameter 3-5 mm), and the Volume ratio of the two was 1:1. At the bottom of the column was an inlet, a sludge valve and a water flushing device, and at the top was a gas outlet and a water outlet. Among them, a liquid flowmeter is used to control the flow rate of backwash water, and the backwash cycle is initiated based on the increase in resistance caused by the interception of pollutants during operation. The inlet water is pumped into the reactor by a peristaltic pump, using an upper inlet and lower outlet method.
There were two fillers in this experimental reactor: ceramsite (a) and siderite (b). The particle size of ceramsite was 3-5 mm. The raw material was natural rock and shale. It was purchased from Wanyuan Water Purification Material Co., LTD, Henan Province, China. The siderite particle size was 3-5 mm, of which the main component was FeCO
3, and it was purchased from Gongyi Bauhinia Longteng Filter Material Distribution Department, Henan Province, China. X-ray fluorescence analysis (XRF) of the siderite samples showed that Fe, Si, Mn, Al, Zn, Mg, Ca and other elements were the main substances that constituted natural siderite.The main components of the siderite sample are listed in
Table 1.
The water required for the test was taken from the Wulongkou sewage treatment plant, Zhengzhou City, Henan Province, China, fetch water at a regular time every day,and the water quality of the tailwater was relatively stable,. The characteristics of the inlet water quality are shown in
Table 2.
With the increasing environmental protection requirements, the demand for total nitrogen is becoming higher and higher. In some areas, sewage treatment plants are required to discharge wastewater into the watershed according to surface water environmental quality standards, Total nitrogen is required to be further reduced.
In the experiment, the sludge used during the start-up phase of the reactor was taken from the anaerobic tank of the Wulongkou Wastewater Treatment Plant in Zhengzhou. The total suspended concentration of sludge is about 13000mg/L. Each reactor was inoculated with 500mL of anaerobic sludge for domestication.
2.2. Experimental Scheme
First, an autotrophic denitrification reactor was constructed, anaerobic tank sludge was added for domestication culture, and a continuous water inlet was used to gradually complete the start-up of the reactor. The main water quality parameters of the water inlet in the reactor are shown in
Table 2. In order to optimize the operating conditions of the reactor, the chemical equation(2-1) was used to calculate the dosage of 1.0 times the influent nitrate concentration before the experiment. The effects of sodium thiosulfate dosage (1.0 times, 1.5 times, 2.0 times, 2.5 times), different HRTs (6 hours, 4 hours, 2 hours, 1 hour), different water pH values (5, 6, 7, 8, 9), and different influent temperatures on denitrification were set. During the test, TN, NO
3--N, NO
2--N and SO
42- indexes of the reactor effluent were measured once a day, and each gradient condition was run for 15 d in this process.The reaction chemical equation is as follows:
During the stable operation of the reactor, use tweezers to take out the fillers in the top, middle and bottom three positions of the reactor one by one, which are denoted as samples 1, 2 and 3. Use 80kHz ultrasonic cleaning vibration instrument to make the sludge fall off the surface of the fillers, and pour out the supernatant in the beaker after a two hours of precipitation. Then the sludge precipitated in the beaker was collected for subsequent treatment, followed by 16S rRNA high-throughput sequencing.
2.3. Analytical Methods
2.3.1. Conventional Index Analysis
The conventional indicators detected in this project test mainly include COD, TN, NO
3--N, NO
2--N, NH
4+-N, and SO
42-. The specific analysis methods are shown in
Table 3.
2.3.2. X Ray Fluorescence (XRF)
In this experiment, Axios-X-ray fluorescence spectrometer of Suzhou Purui Analytical Instrument Co., LTD was used to detect the filler and analyze the proportion of the elements contained in the filler.
2.3.3. Scanning Electron Microscopy (SEM)
This test uses German Zeiss company Auriga FIB SEM focused ion beam scanning electron microscope observation and analysis of denitrification filter packing surface morphology and growth of biofilm.
2.3.4. Microbial Community Analysis
To obtain the V3-V4 highly variable region of the 16S rRNA gene whose amplification primers were 338F (5'-ACTCCTACGGGAGGCAGCA-3') and 806R (5′-GGACTACHVGGGTWTCTAAT-3′) for bacterial community structure analysis, extracted genomic DNA was first amplified, the remaining steps high throughput sequencing and data analysis are the same as Zhou et al’ study [
20].
3. Results and Discussion
3.1. Effects of Operating Parameters on Nitrogen Removal in the Reactor
3.1.1. Effect of Sodium Thiosulfate Dosage
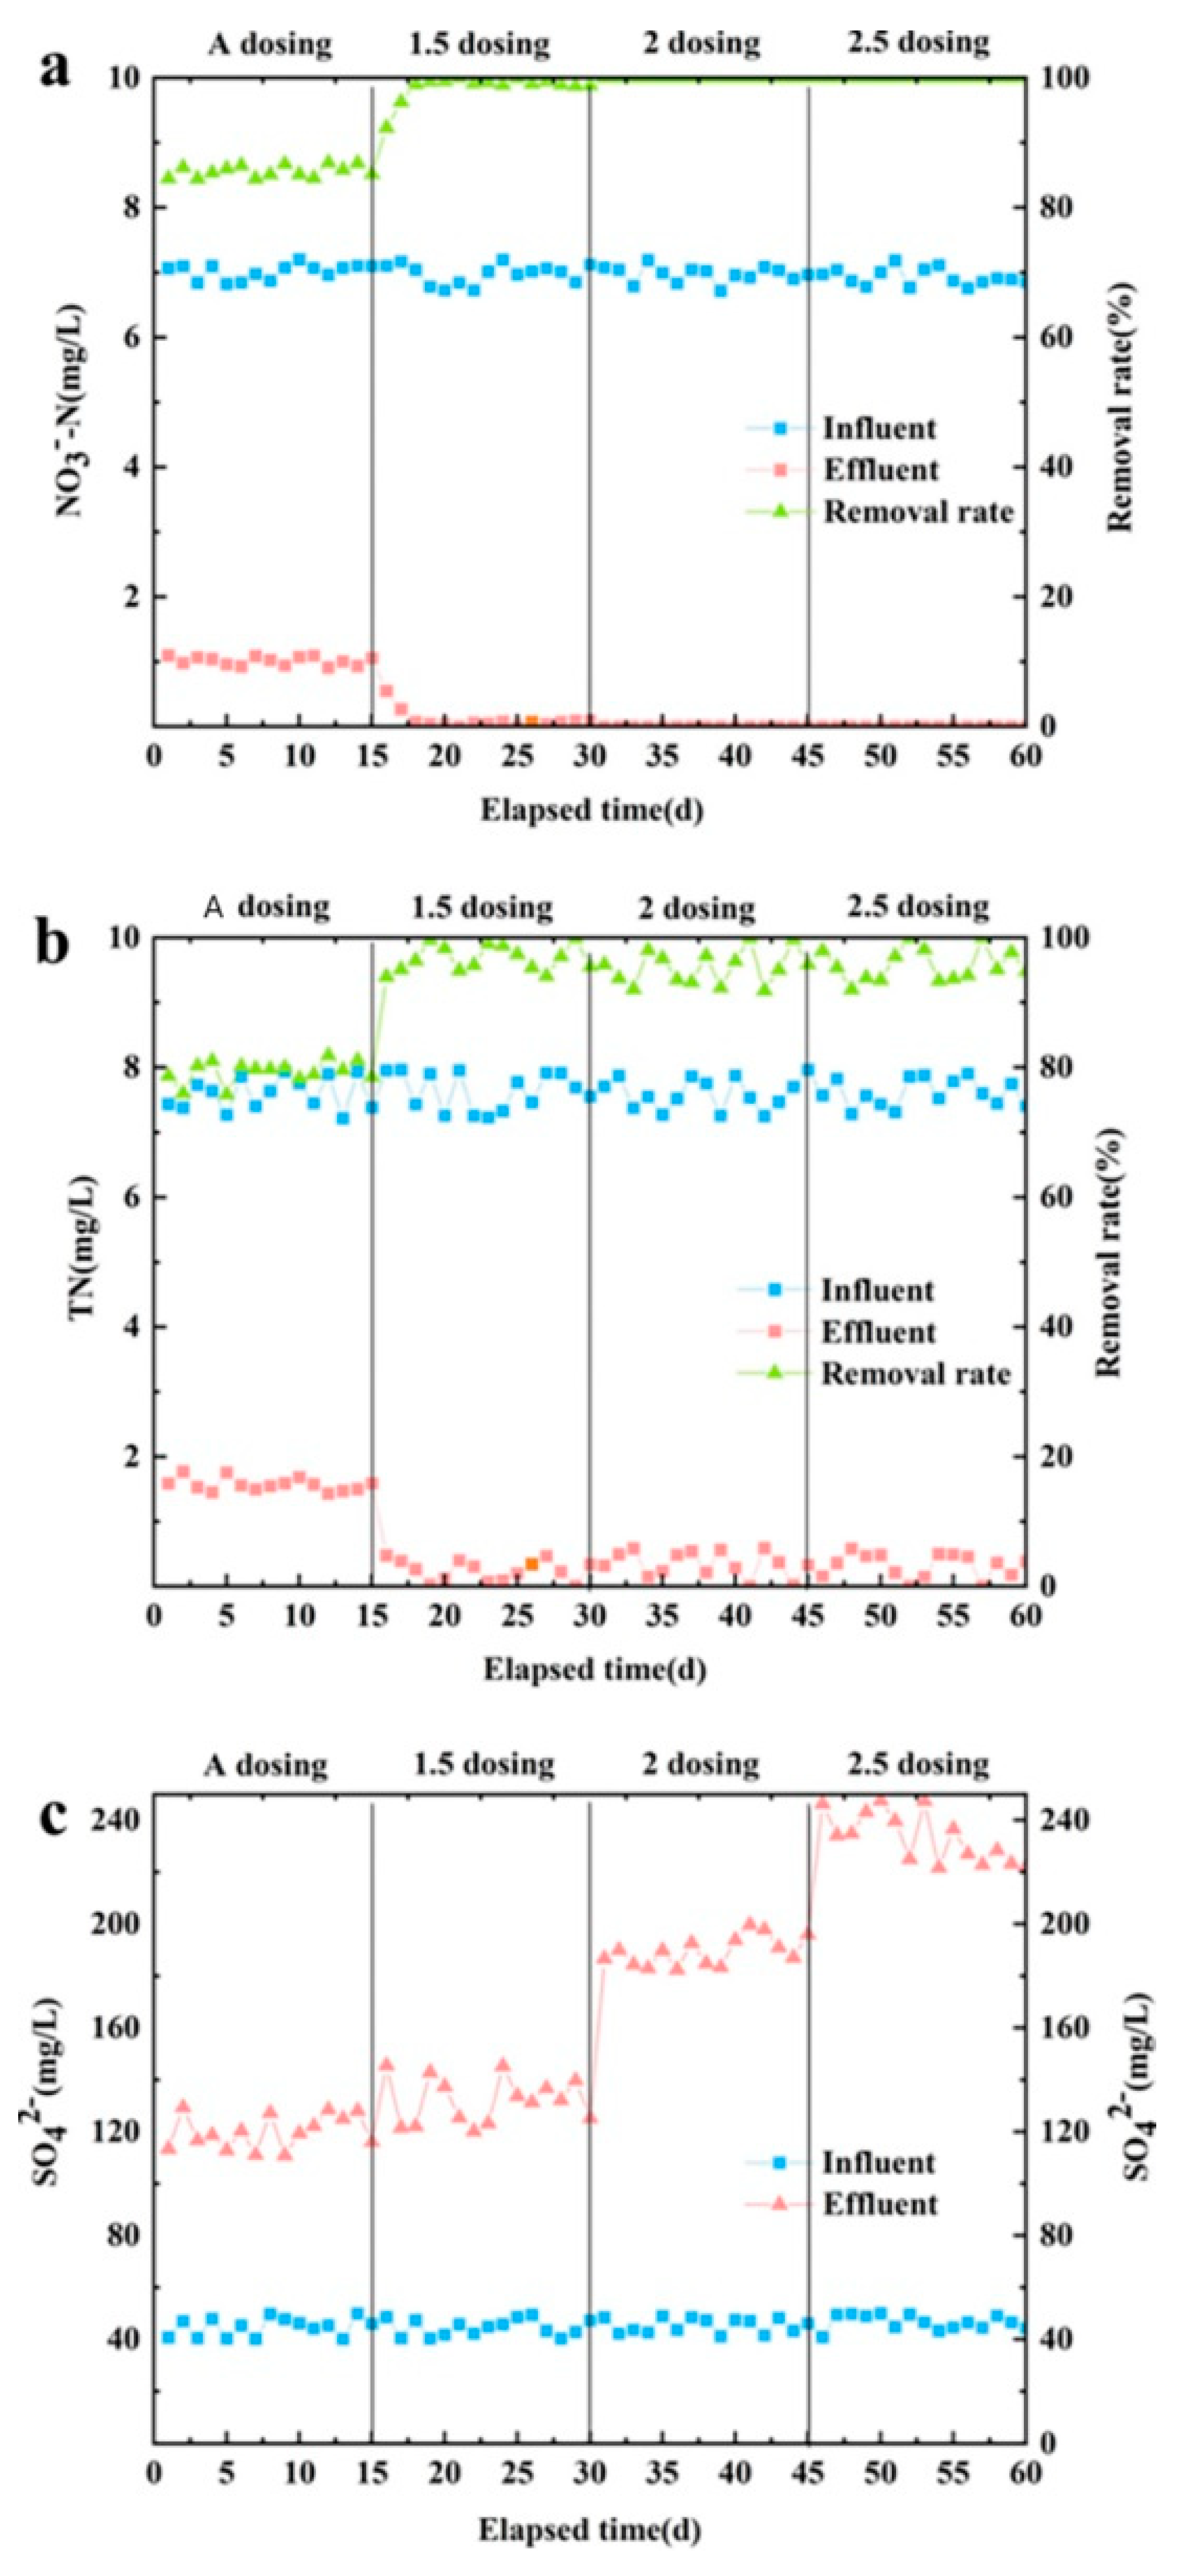
The removal effects of NO
3--N, TN and SO
42- with different sodium thiosulfate dosages in the reactor are shown in
Figure 2. The optimal dosage of sodium thiosulfate was obtained by analyzing the denitrification effects of different dosages of sodium thiosulfate. During the experimental study, the concentration of NO
3--N, TN and SO
42- was approximately 7.0 mg/L, 7.5 mg/L and 40 mg/L, respectively. Adopting continuous water inlet method,the HRT was 2 h. Each sodium thiosulfate dosing quantity gradient running time was 15 d, for a total operating time of 60 d.
Different effects of the additive amount of sodium thiosulfate on NO
3--Nremoval are shown in
Figure 2a. With increased dosage, the removal rate of effluent NO
3--N also increased. When the addition amount was more than 1.5 times, NO3--Nwas completely removed from the water because enough sulfur sources were ensured to participate in the denitrification as electron donors [
14,
17].
The removal effect of TN with different dosages of sodium thiosulfate is shown in
Figure 2b. NO
3--N and TN removal with different dosing quantities is similar, which is because NO
3--N is the main form of tailwater TN in the sewage treatment plant, and NO
3--N is involved in the process of denitrification by removing naturally reduced TN content at the same time. When the dosage was ≥1.5 times, most TN in the water was removed, and the concentration of TN in the effluent was below 0.5 mg/L.
Figure 2c shows the effluent SO
42- concentration with different sodium thiosulfate dosages. As can be seen in this figure, the SO
42- concentration in the water with increasing additive also appeared to rise. According to the autotrophic denitrification equation involving sodium thiosulfate, the removal of 1 mg of NO
3--Nyields 11.538 mg of SO
42- [
18].The added value of SO
42- in water is higher than the theoretical added value, which may be due to the fact that thiobacillus and sulfur bacteria use oxygen as electron acceptor to promote the oxidation of S
2O
32- in the reactor [
19], resulting in more and more concentration of SO
42-in water.
In summary, when the dosage of 1.5 times or equal to sodium thosulfate is theoretically increased, the removal rate of NO
3--N is 99.9%, the removal rate of TN is 95%, and the effluent SO
42- concentration is no more than 250 mg/L, meeting the upper limit of SO
42- concentration standard for drinking water [
20]. Under the principles of considering cost and ensuring the denitrification effect [
21], the optimal dosage of sodium thiosulfate in the reactor inlet was 1.5 times the theoretical value.
3.1.2. Effect of HRT
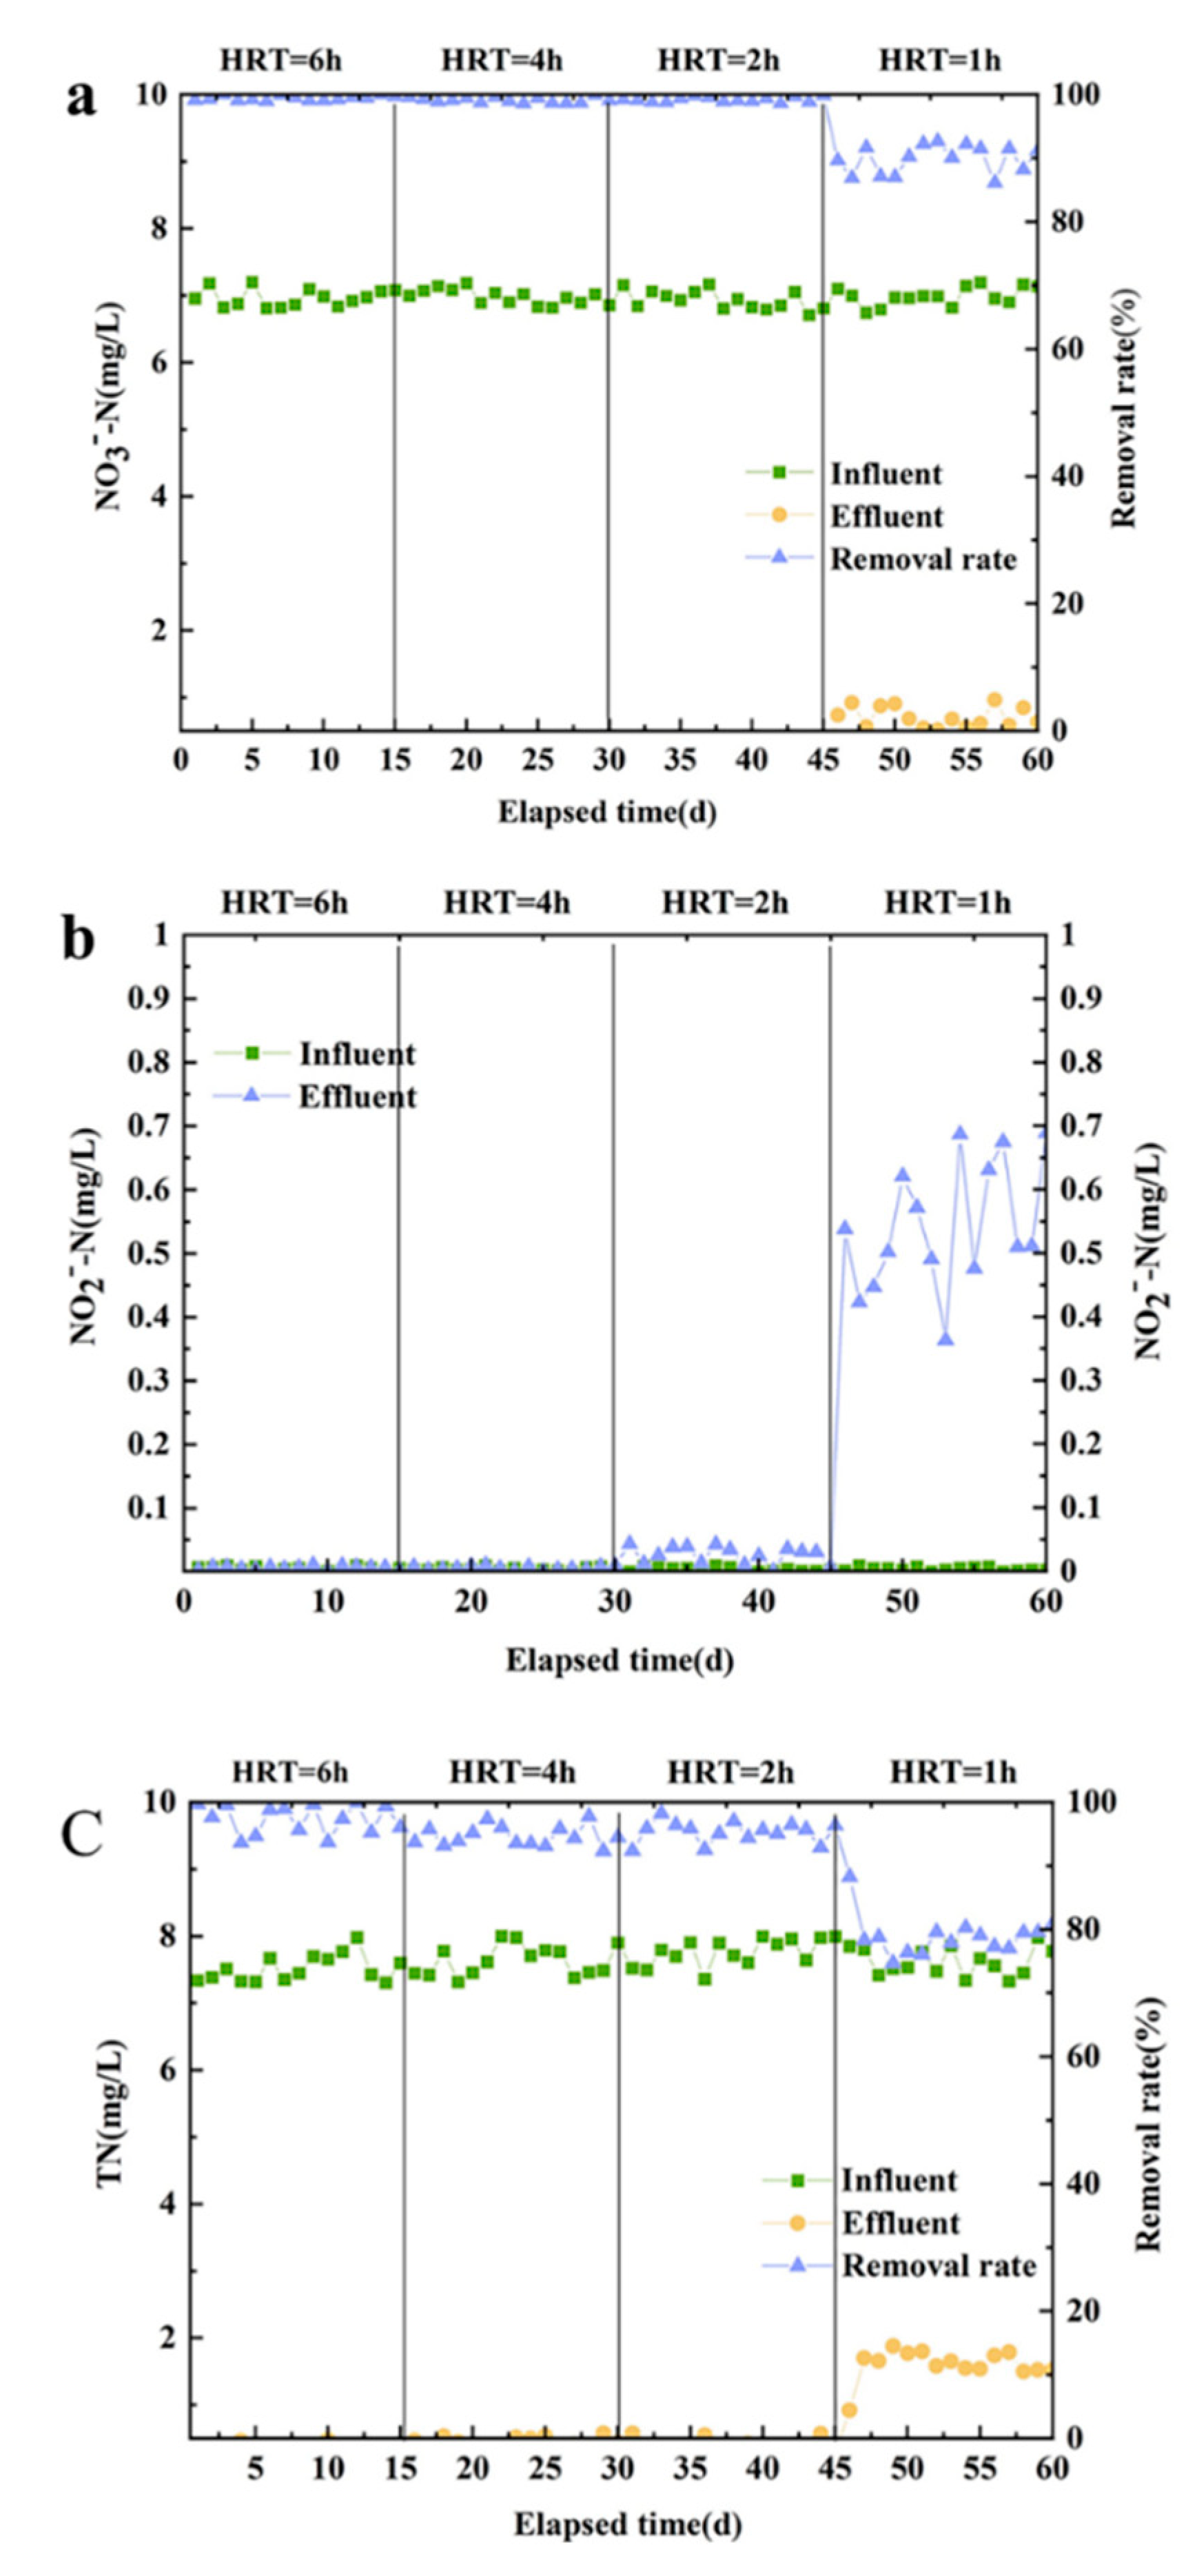
In this experiment, the denitrification effect of the reactor was studied under the HRT of 6, 4, 2 and 1 h, respectively. During the experimental study, the concentroation of NO3--N was approximately 7.0 mg/L, and the concentration of TN was approximately 7.5 mg/L. An amount of 1.5 times the theoretical dosage of sodium thiosulfate was added to the inlet. The HRT was adjusted according to the inlet flow. The optimization phase of each HRT run was 15 d, for a total of 60 d of operation.
Shortening HRT affects the denitrification rate of the reactor. In
Figure 3a, when HRT was 2 to 6 h, NO
3--N removal rate was stable at about 99.9%. When HRT was 1 h, NO
3--N removal rate was stable at about 90.0%. Possible reasons are that the time is sufficiently long enough to fill the reactor, the NO
3--N in the water has good contact with microorganisms on the surface of the packing, and the denitrification reaction components can all be converted into N
2 [
22].
Figure 3b shows the removal effect of TN was best when HRT was 2~6. On the one hand, low HRT produces a high hydraulic load, and the load on the packing of the microbial impact is larger, affecting the biomass in the reactor and resulting in a decline in the denitrification rate; on the other hand, with a short HRT, the reactor system in the denitrification process of nitrogen transformation is not sufficient, resulting in the accumulation of some other nitrogen and leading to an increased concentration of effluent TN [
23].
The removal effect of NO
2--N under different HRT conditions in the reactor is shown in
Figure 3c. When HRT was 1h, the concentration of NO
2--N in effluent increased significantly, that is, the transformation of NO
3--N followed the general process of biological denitrification, that is, NO
3--N → NO
2--N → NO → N
2O → N
2 [
23]. According to Figure3, 90% of NO
3--N in water is first converted to NO
2--N, and NO
3--N and NO
2--N can coexist in the denitrification system and maintain a certain competitive relationship. In addition, for autotrophic denitrifying microorganisms, NO
3--N is easier to utilize than NO
2--N and is preferentially involved in denitrification. When the nitrate concentration in the system exceeds 70 mg/L can also inhibit the synthesis of nitrite reductase and activity, an effect of the NO
2--N reduction process in the system. Combined with the above analysis, when HRT was 1 h, the water stays in the reactor for too short a time. In full consideration of the reactor operation energy consumption and the denitrification performance based on [
24], the best HRT reactor time was determined to be 2 h.
3.1.3. Effect of pH
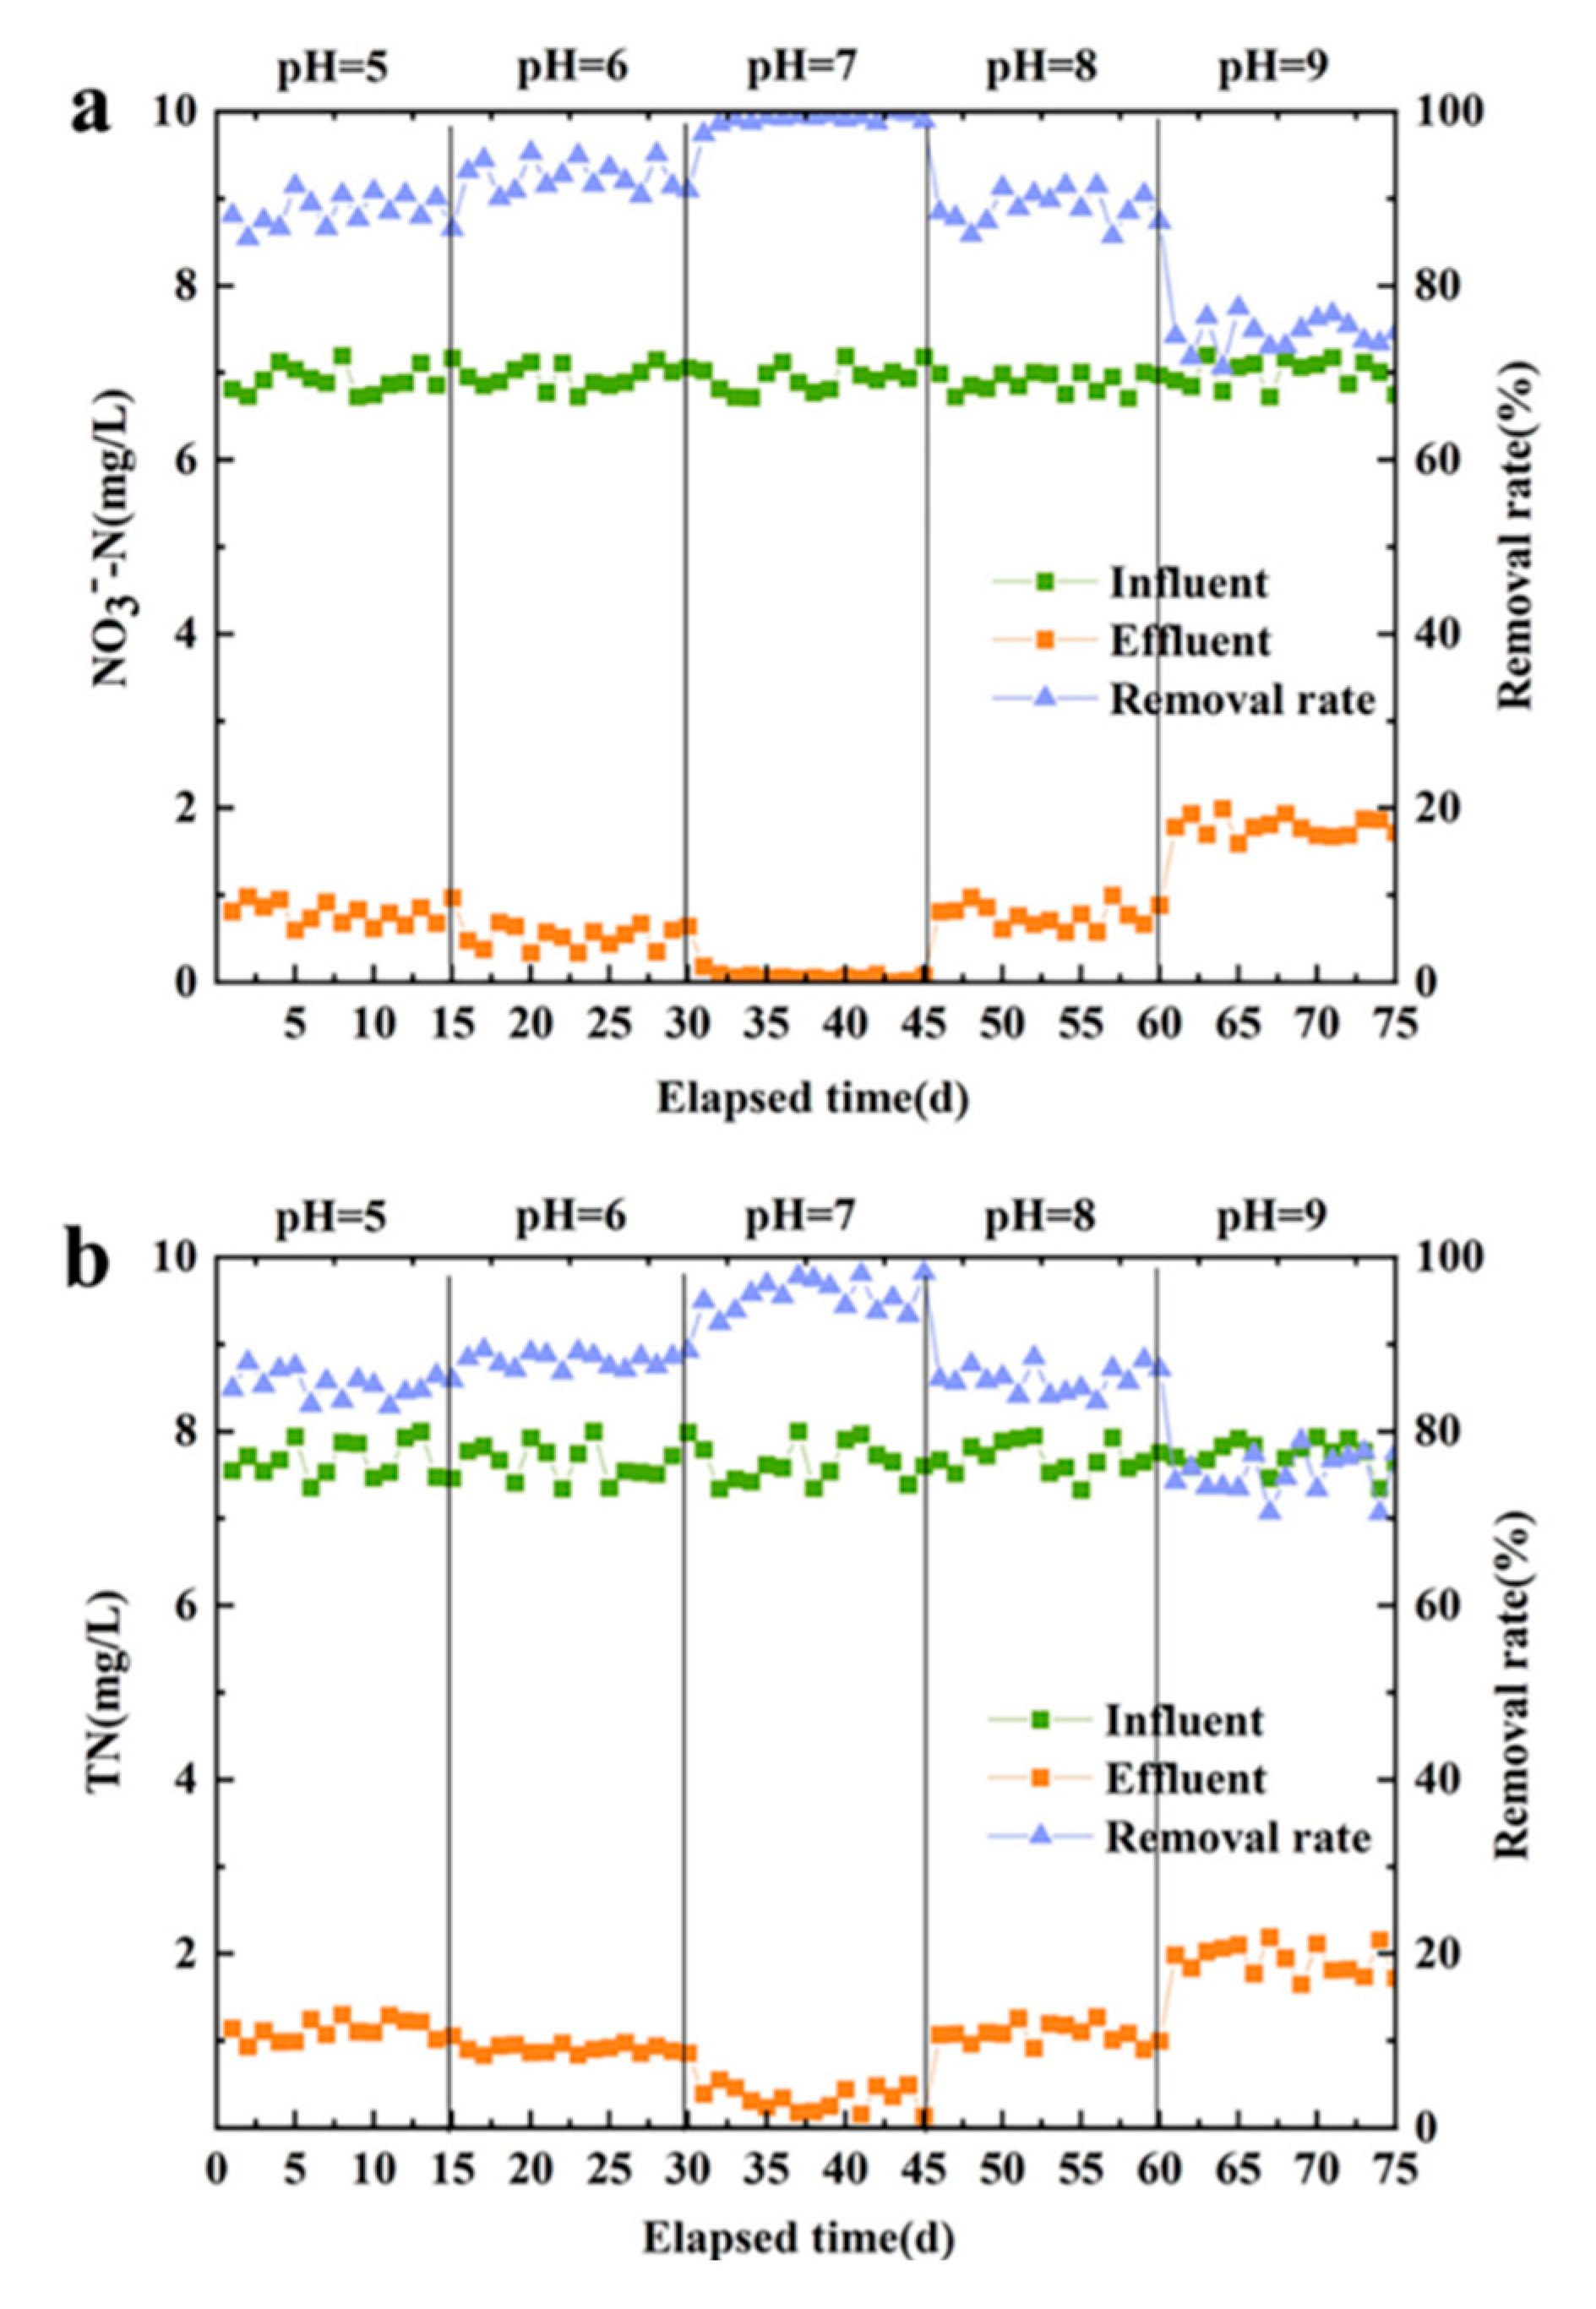
In this experiment, HRT is 2 h, other conditions are the same as above. During this optimization phase, the running time for each pH condition was 15 d, and the total running time was 75 d.
The NO
3--N removal effects of the reactor under different pH conditions is shown in
Figure 4a. When the reactor water pH was 7, the reactor effluent NO
3--N concentration was the lowest, the denitrification effect was best, and the optimum pH of autotrophic denitrifying microorganisms was neutral, conforming to the denitrification of
Thiobacillus in the living environment at this pH. When the reactor water pH was less than 7, the reactor in the system of siderite packing of acidic water can not only play a buffer role but also counteract H
+ autotrophic denitrification, so when the pH were 5 and 6, the NO
3--N removal rate still reached more than 88%. When the water pH was 8, the NO
3--N removal rate was 88.9%, indicating that autotrophic denitrifying microorganisms in a slightly alkaline water environment to alkalinityhave a certain degree of tolerance. However, when the pH value of the influent reached 9, the NO
3--N removal rate fell to 74.4%; In the reactor, low or high pH values have a significant impact on denitrification efficiency [
16].
NO
3--N and TN removal with different pH running conditions was basically similar, as shown in
Figure 4b. When the water pH is maintained at 5-9, the TN removal rate is guaranteed above 70%, and denitrifying microorganisms under pH of 5-9 can maintain a certain level of activity, indicating that the removal rate of the denitrification system within this water pH range has increased. To fully consider the denitrification effect of the system, the optimum pH value of the water inlet in the reactor was determined to be 7.
3.1.4. Effect of Temperature on Denitrification of the Reactor
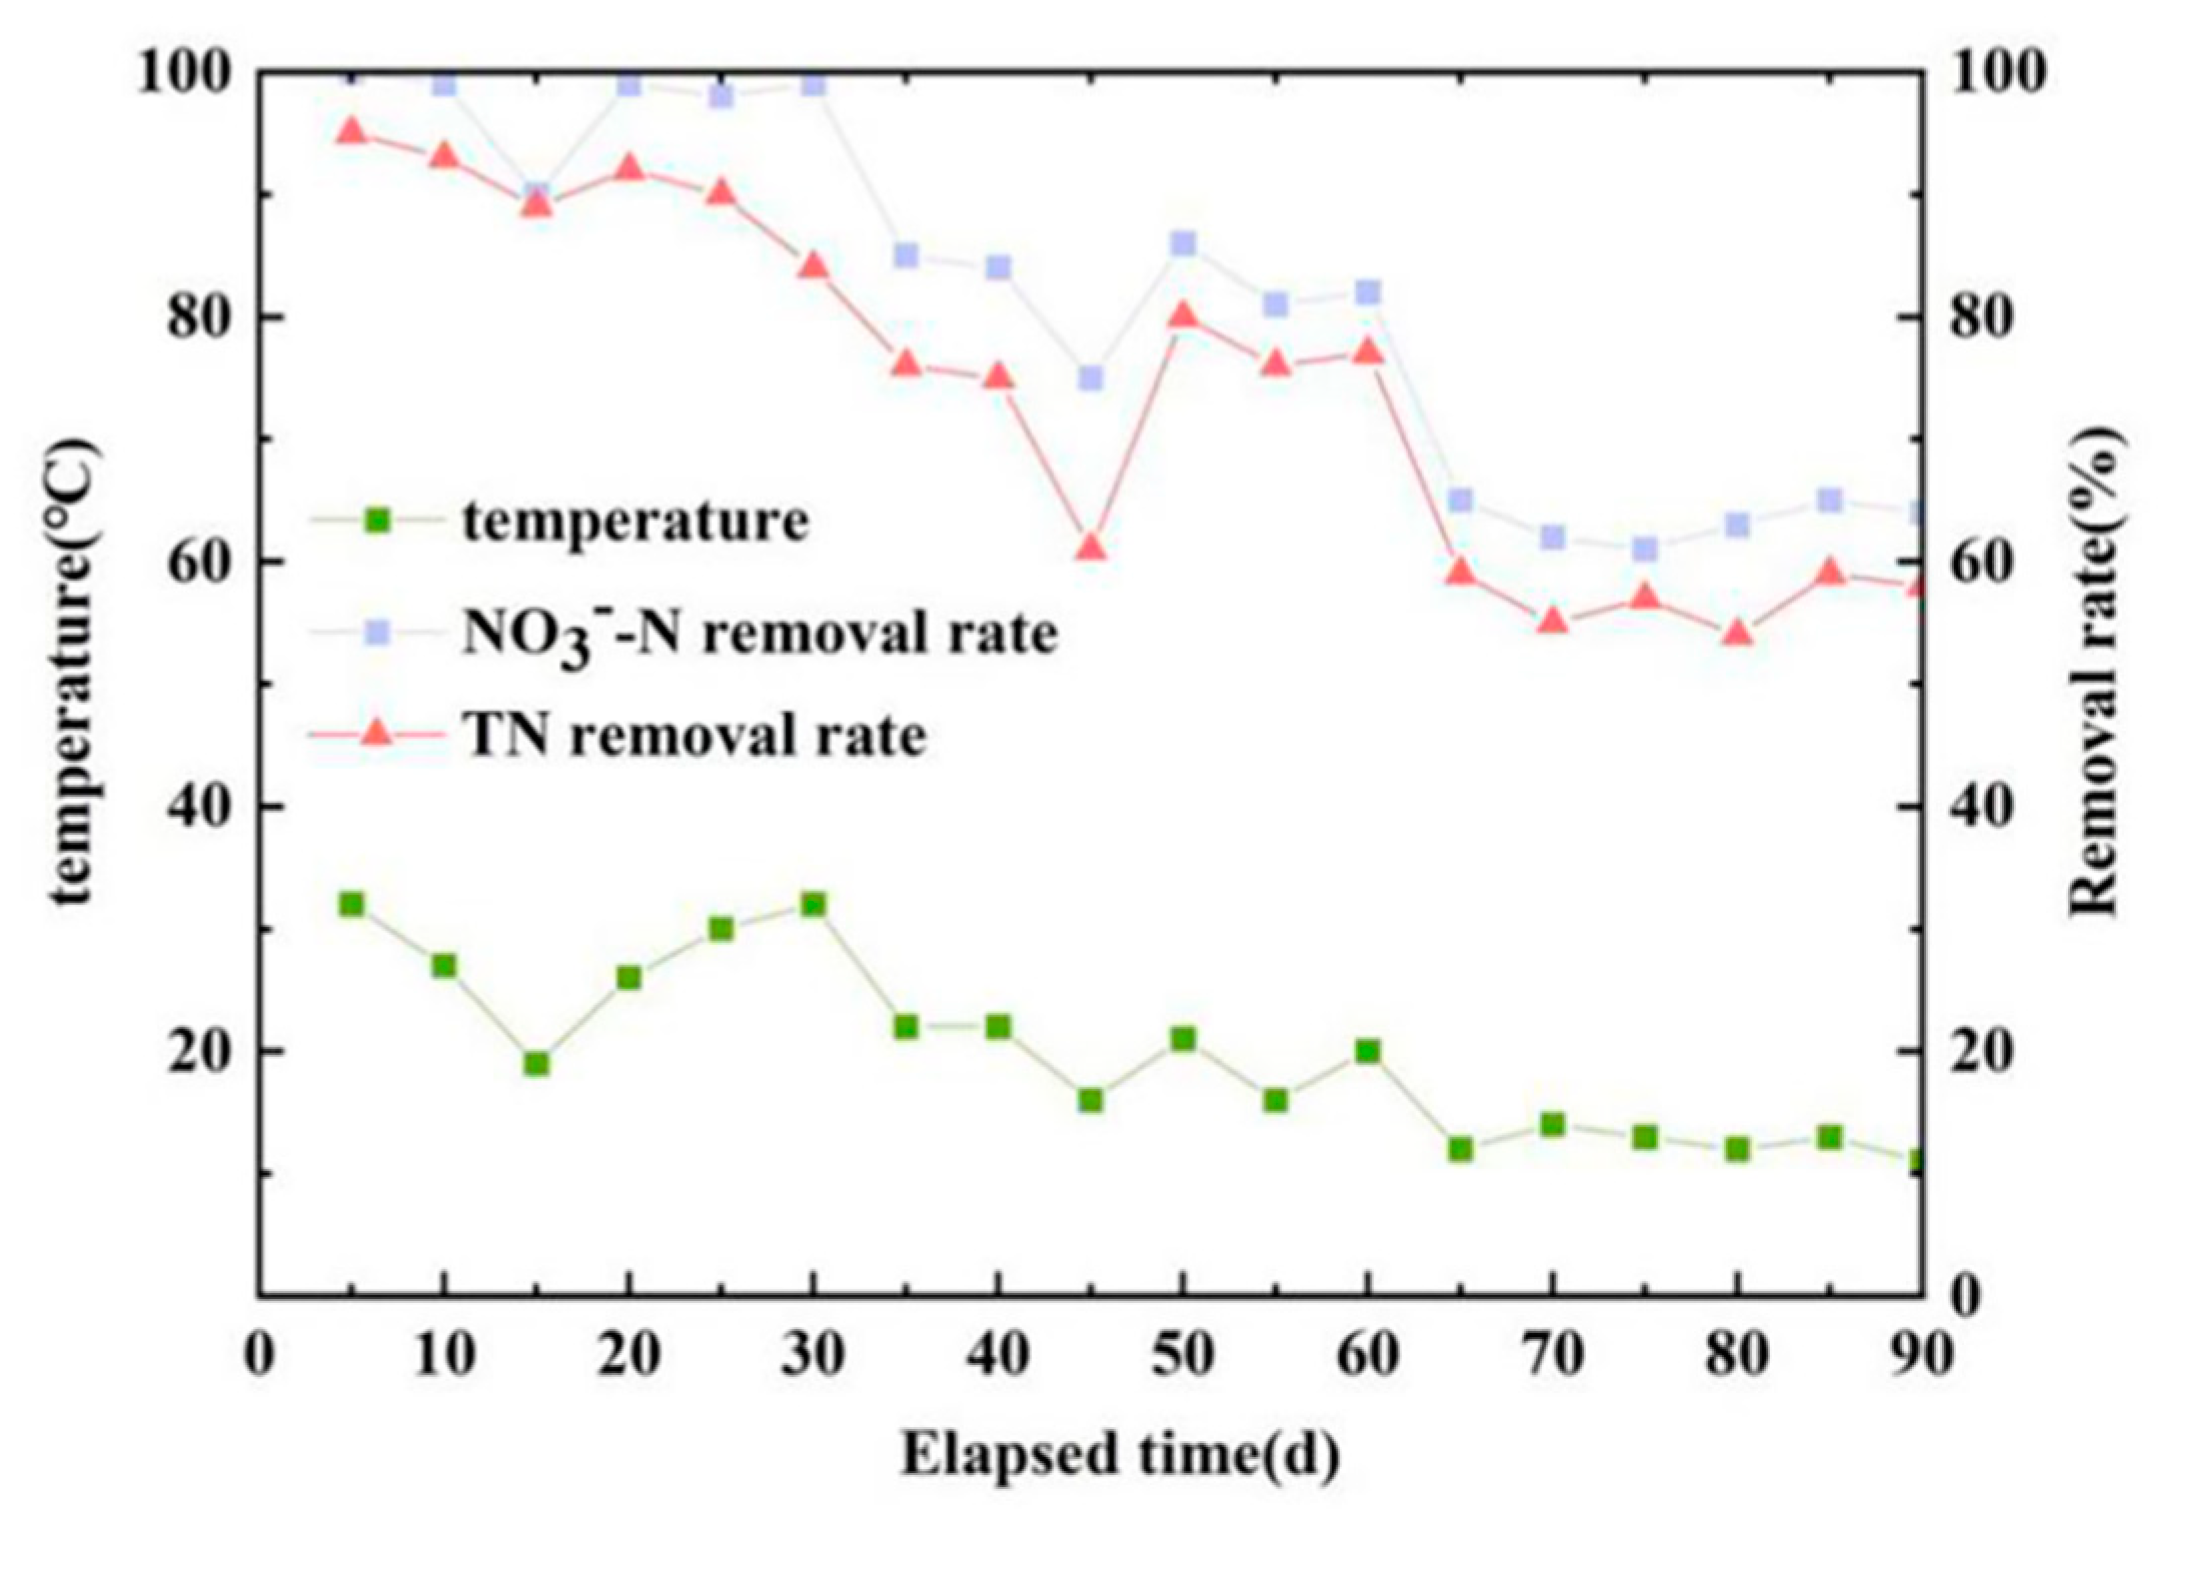
This section is a study on the denitrification effect of the reactor at different inlet temperatures. The test phase was run for a total of 90 d, and water temperature and effluent NO
3--N and TN concentrations were monitored every 5 d,Reactor temperature varies with seasons. As shown in
Figure 5, as the temperature reduced, the NO
3--N and TN removal rate significantly reduced. However, relative to the NO
3--N removal rate, the fluctuation of the TN removal rate was larger, and the effect of the temperature was more obvious.
When the reactor inlet temperature was near 30 ℃, the reactor denitrification effect was the best, and the NO
3--N removal rate reached 100%, in accordance with the optimal survival temperature of autotrophic denitrifying microorganisms. In terms of the effect of temperature on TN, a possible reason is the low temperature required for denitrifying microorganism metabolism and reproduction rate [
25]. Relevant studies have shown that when the water temperature is lower than 20℃, the enzyme activity of microorganisms in the reactor will be inhibited, and the species of microorganisms will be reduced accordingly, which has a certain influence on the denitrification process [
26]. In fully considering the system effects on microbial activity in the denitrification reactor, the optimum temperature of the reactor inlet was determined to be 30 ℃.
3.2. Surface Morphology Characterization of the Filler
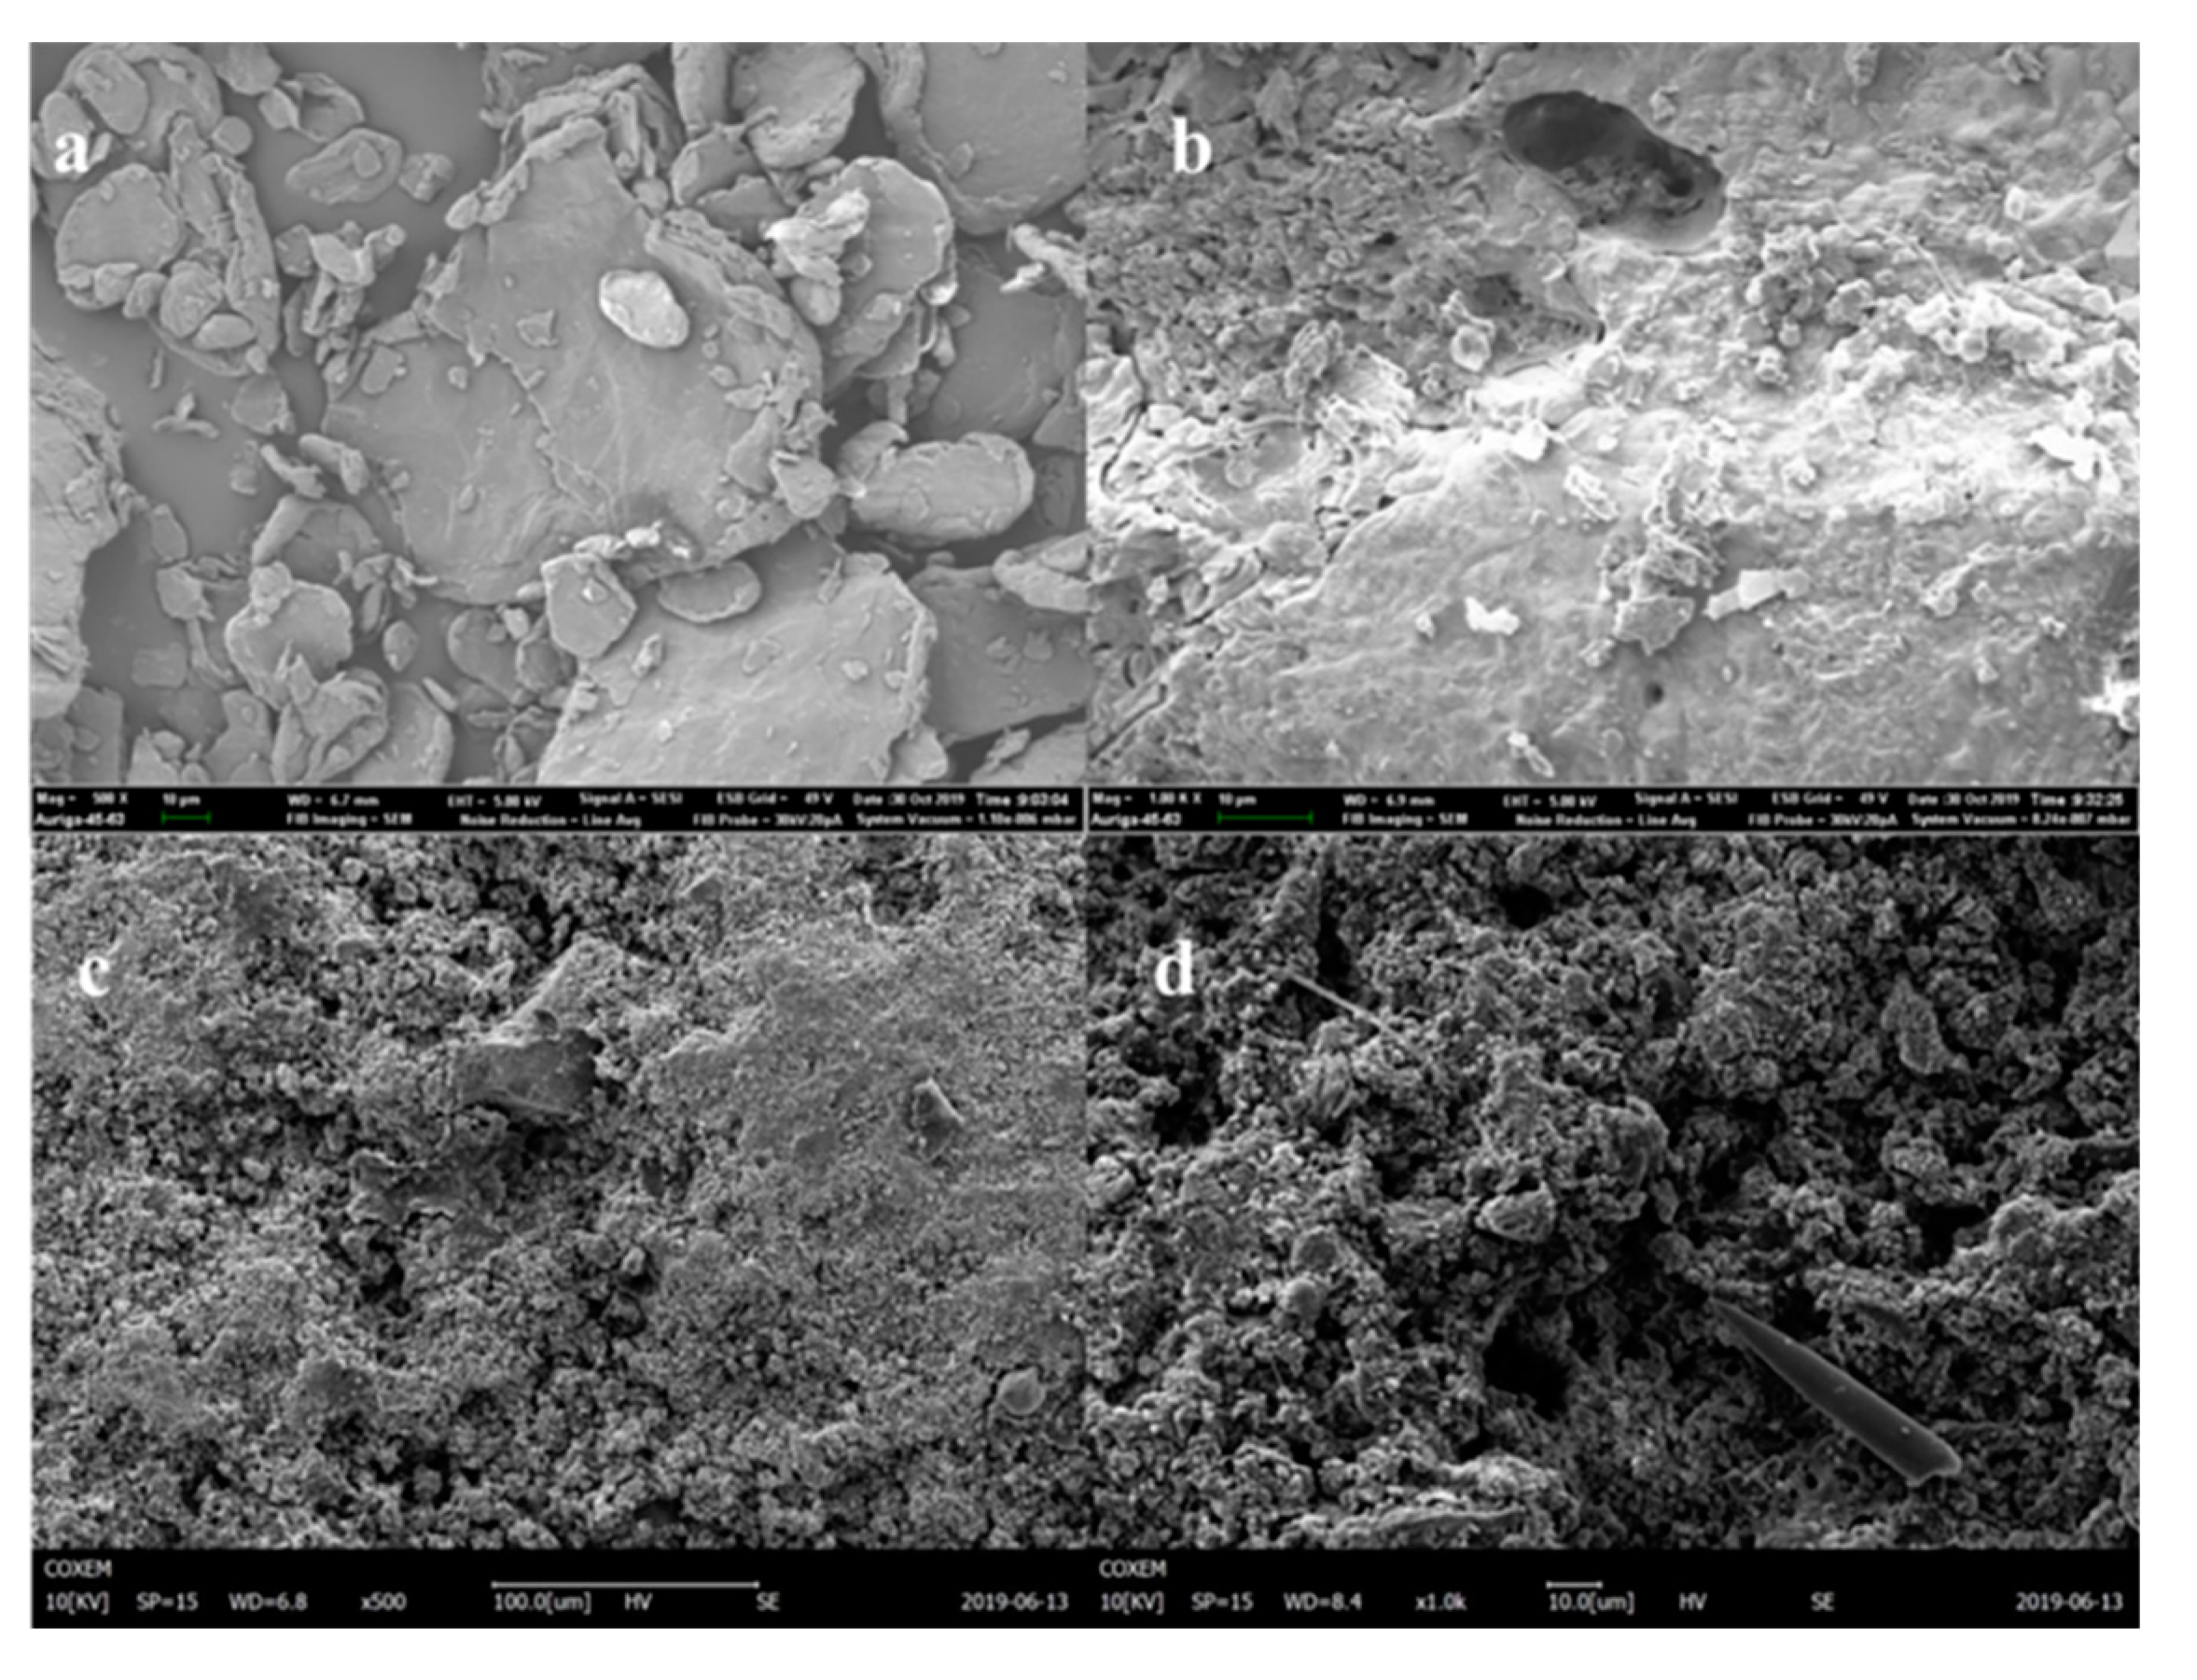
To further analyze the surface morphology and microbial morphology of the filler in the reactor system, a SEM was used to scan and observe the filler. Through the characterization of the surface morphology of the filler in different periods, the changes in the reactor filler and microbial morphology were identified.
The SEM diagram of the original packing is shown in
Figure 6a,b. When the packing surface was observed at a magnification of 500 times, the packing surface structure was compact and had good integrity. When magnified 1000 times, observation of the filler surface, rough packing surface, distribution, and large gap indicated advantages for the microbial load and growth, and at the same time, these factors protected the biological membrane under higher back-flushing intensity to prevent it from easily falling off.
As shown in
Figure 6c,d, at 500 times magnification, a large number of uneven folds and cavity structures existed on the packing surface. The reason may be that, on the one hand, the carbonate in the packing participated in neutralization in the process of denitrification acid production, and on the other hand, the ferrous ions in the packing participated in the denitrification process, resulting in a certain amount of loss of the packing. Siderite packing can not only act as a buffer pH adjustment system but also be used as an electron donor to directly promote denitrification. Magnified 1000 times, the packing surface supported a large number of microorganisms, which were connected together by a viscous material and tightly attached to the packing surface.
3.3. Microbial Community Analysis
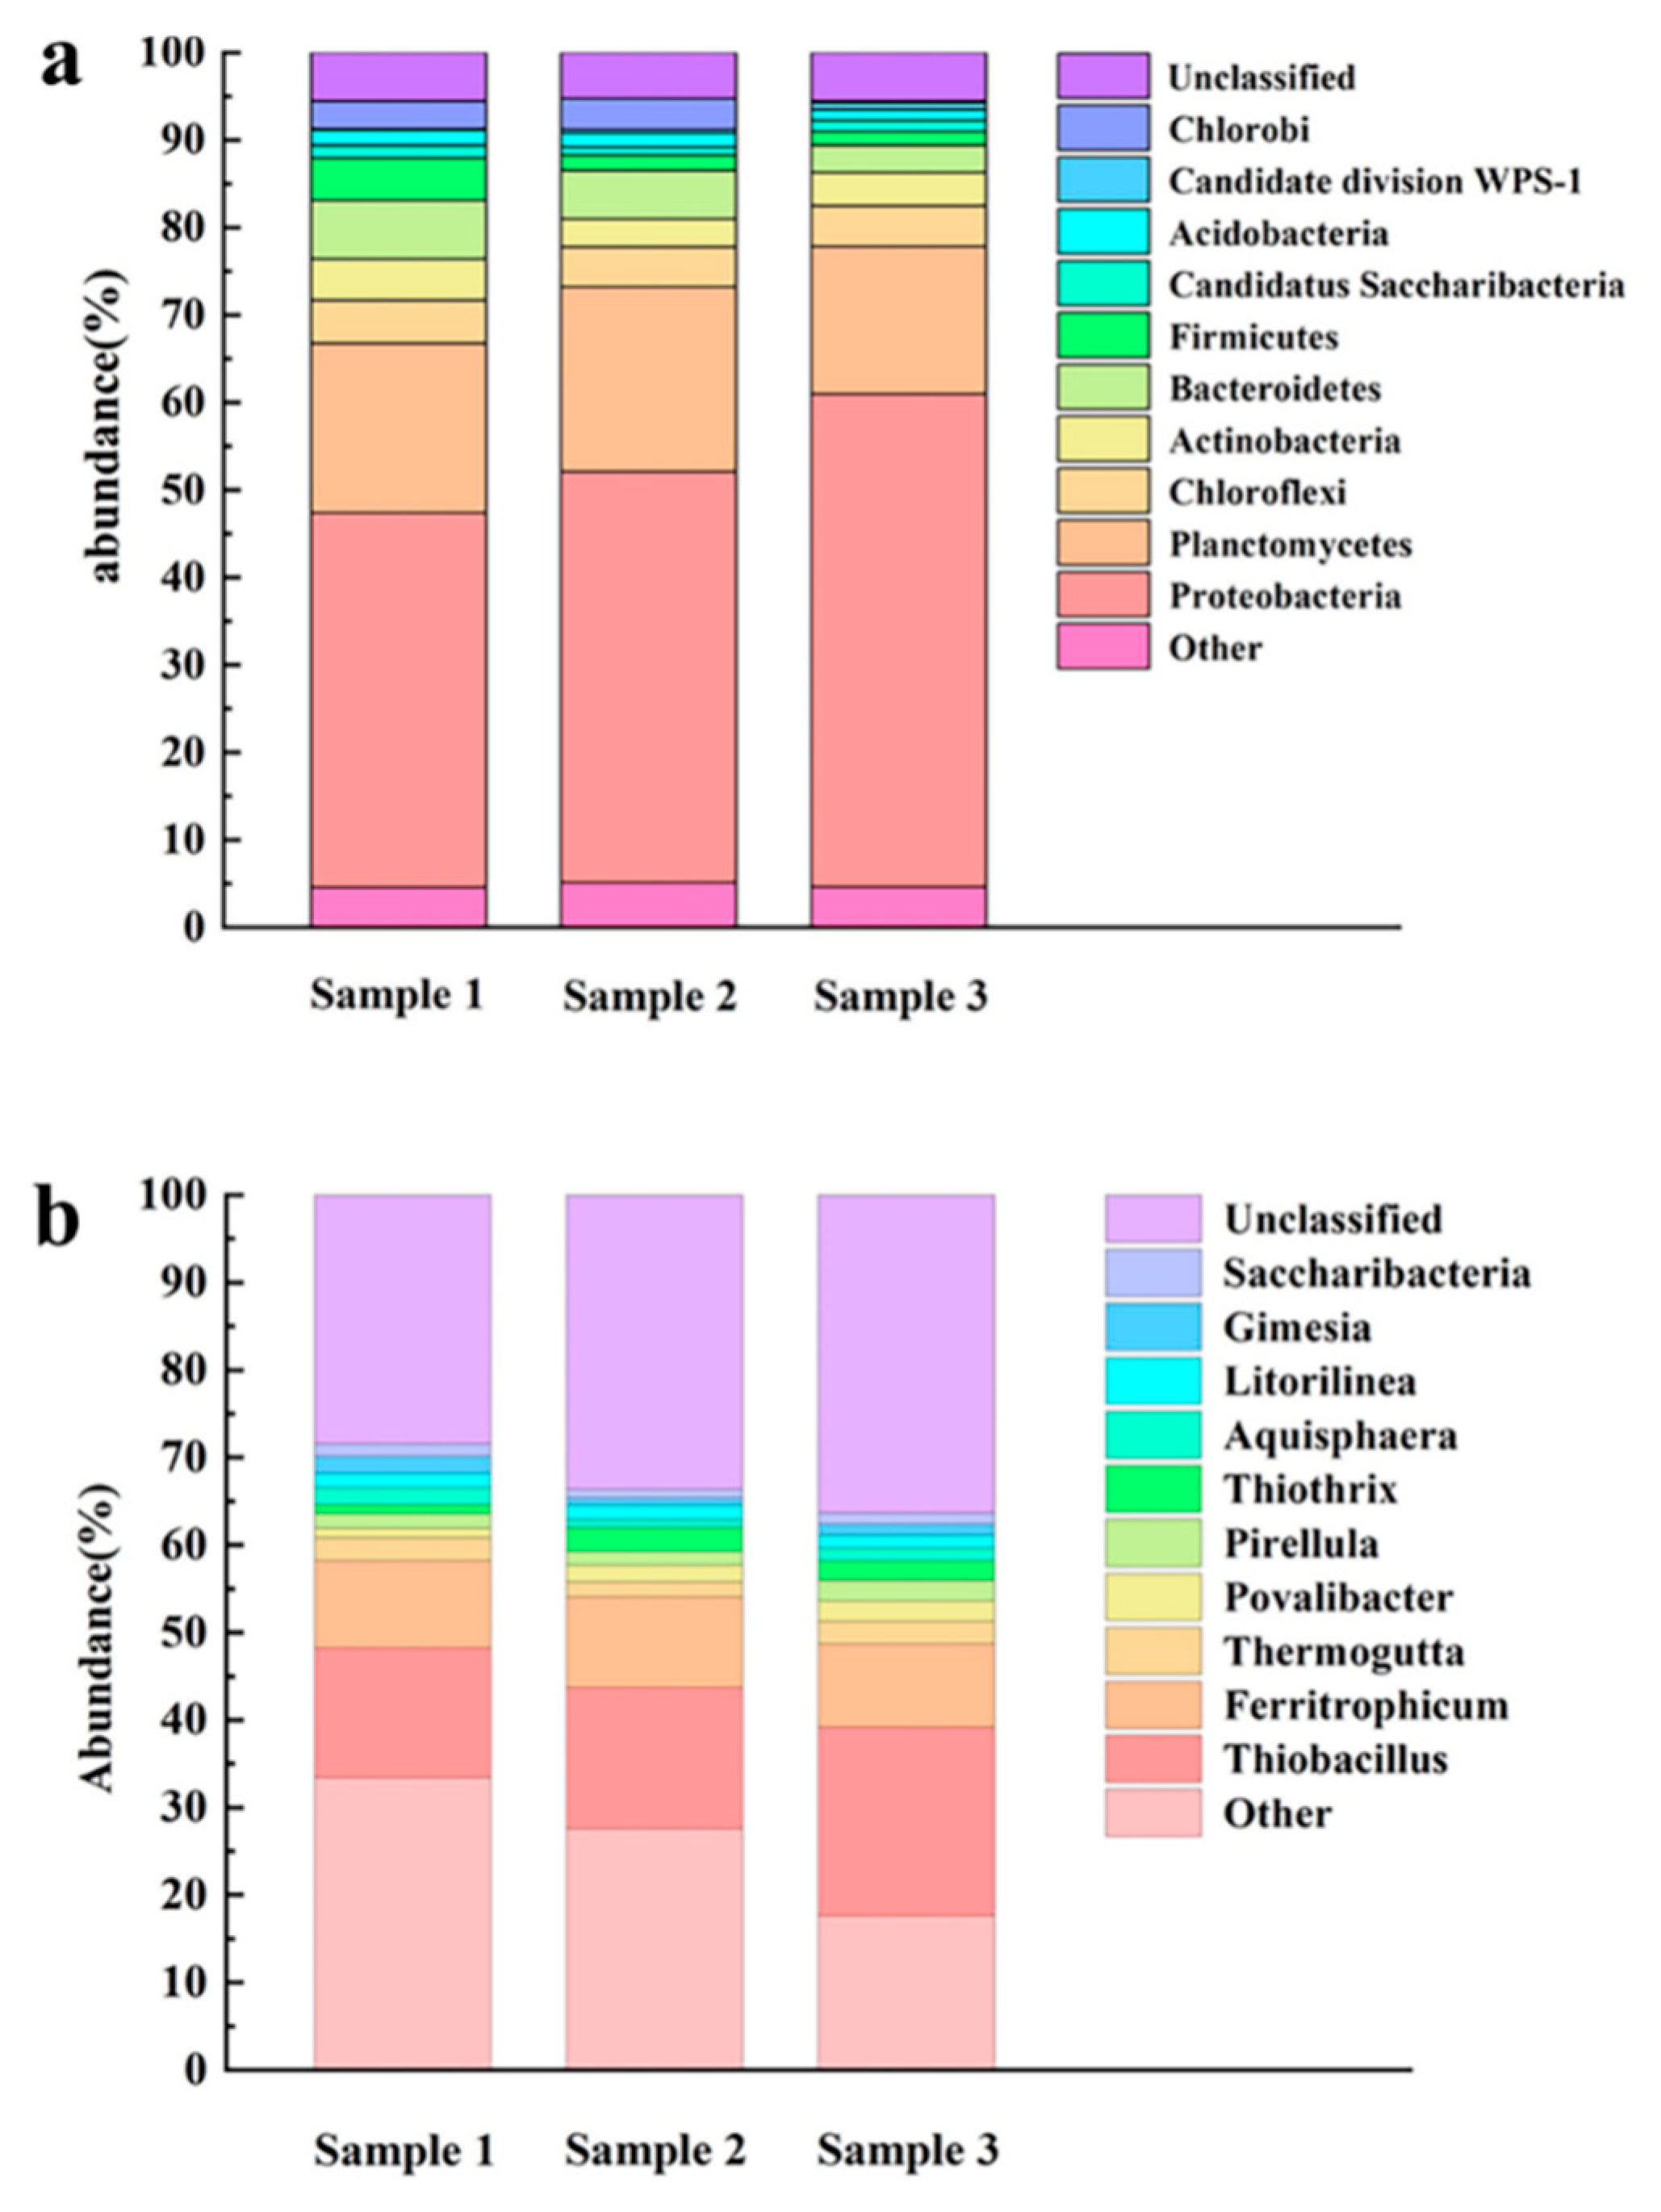
Take 3 biological samples from the bottom to equidistant on the surface of the packing inside the reactor,The types and abundances of the microbial communities of samples 1, 2, and 3 at different species classification levels (phylum, genus) were analyzed. This section mainly presents the species with the highest abundance in each sample, and the remaining species belong to other classifications. As shown in
Figure 7a, in the community structure of samples 1, 2 and 3,
Proteobacteria was the most abundant phylum, with an abundance of 42.78%, 46.95% and 56.36%, respectively. This is consistent with the microbial community structure in the reactor obtained by Zhang et al [
27].
Inside the reactor, the abundance of the dominant
Proteobacteria decreases from bottom to top, a possible reason is that most autotrophic denitrifying bacteria in the reactor system are
Proteobacteria, and as autotrophic denitrification electron acceptors decrease during the process with NO
3--N concentrations along the reactor, there is lower
Proteobacteria abundance [
28].
Chloroflexi is a facultative anaerobic bacterium that uses 3-hydroxypropionic acid to fix carbon dioxide. Some bacteria under the can transform nitric nitrogen into nitrous nitrogen [
29].
Bacteroidetes is mainly found in anoxic environments and can participate in autotrophic denitrification reactions [
30]. Therefore, the presence of such microorganisms in the reactor to some extent promotes the removal of nitrogen pollutants in the influent [
31].
The genus community structure analysis of each sample is shown in
Figure 7b. In the community structure of samples 1, 2 and 3, the dominant bacteria genera are
Thiobacillus and
Ferritrophicum, both of which belong to
Betaproteobacteria, and their abundances were 14.83%, 16.15%, 21.50%, 9.96%, 10.32% and 9.58%, respectively. The most abundant species,
Thiobacillus, showed abundance decreases from bottom to top. A possible reason is that
Thiobacillus species include all kinds of obligate autotrophic microbes, and intermediate product sulfide in the reaction can be oxidized to elemental sulfur or sulfates, or undergo thiosulfate oxidation for sulfate, including in
Thiobacillus denitrificans, which contains a complete sulfur autotrophic denitrification process and uses elemental sulfur and sulfide and thiosulfate electron donors to reduce nitrate nitrogen [
14]. The path results in the decrease of nitrate nitrogen in water, and nitrate is an available electron acceptor for
Thiobacillus, whose abundance also decreases.
Ferritrophicum has high abundance inside the reactor and shows little change along the path, possibly because siderite in the packing can provide stable ferrous ions for denitrification as electron donors. Fabisch et al. [
32] found
Ferritrophicum in stream sediments and identified it as neutral FeOB(Iron-oxidizing bacteria), able to oxidize Fe
2+ to Fe
3+ with nitrate nitrogen as an electron acceptor under anaerobic conditions. Such microbes can play a role in producing iron oxide under aerobic and anaerobic conditions, and at the same time, the energy required to achieve growth can produce a large surface area with larger amounts of amorphous iron oxide, therefore resulting in effective adsorption of organic matter, phosphorus and water with sufficient variety of heavy metal elements to achieve a certain level of removal. This indicates that
Ferritrophicum can not only participate in the reduction reaction of nitrate in water and promote the denitrification effect of the reactor but also have a good removal effect on other pollutants in the water [
32] .
3.4. Economic and Technical Analysis
3.4.1. Technical Feasibility Analysis
This article analyzes the technical feasibility of the process from two aspects: microorganisms and electron donors. The autotrophic denitrifying microorganisms required for this process are widely present in nature, and the sulfur autotrophic denitrification process can be initiated by inoculating microorganisms in lake water, sediment, anaerobic sludge, and soil. There are significant differences in the denitrification performance and start-up time of reactors with different start-up methods. The start-up time and denitrification performance of reactors under different start-up methods are shown in
Table 4.
The reactor initiated by denitrifying sulfur bacteria in anaerobic sludge has a high denitrification rate and good denitrification effect due to its high content of functional microorganisms. However, it took a long time for the reactor to reach the living environment required by Thiobacillus denitrificans. The start-up time of the reactor was 22 d, and the denitrification rate was 84 mg·L-1·d-1.
The sulfur autotrophic denitrification process can use sulfur (S
0) or sulfide (S
2O
32-, FeS, S
2-) as an electron donor for deep nitrogen removal. The denitrification performance of different electron donors is different, as shown in
Table 5.
Different electron donors had better denitrification effects, among which S2O32- was used as an electron donor, and the nitrate nitrogen removal rate could reach 100%. In this study, sodium thiosulfate was selected as the electron donor in the denitrification process to ensure that the reactor achieved good denitrification performance.
In conclusion, the autotrophic denitrification process using anaerobic pond sludge to start the reactor, sodium thiosulfate to provide the electron donor is feasible for the deep denitrification of the tailwater of the sewage treatment plant.
3.4.2. Economic Feasibility Analysis
In the water treatment process, the economic cost of operation is mainly reflected in raw material consumption, power consumption of equipment operation and sludge treatment and disposal. For autotrophic denitrification and heterotrophic denitrification processes, under the same operating conditions, the required equipment operating power consumption and sludge treatment and disposal costs are basically the same. Therefore, this section will conduct a feasibility analysis on the raw material consumption of the two processes to provide a more economical process for the deep denitrification of the tailwater of a sewage treatment plant.
The economic pairs of different denitrification processes are shown in
Table 6.
It can be seen from the table that the raw material consumption of sodium thiosulfate. autotrophic denitrification is less than that of heterotrophic denitrification. In the face of strict water quality standards, heterotrophic denitrification, on the one hand, has high operating costs, and on the other hand, it will increase the COD of effluent. Therefore, compared with heterotrophic denitrification, sulfur autotrophic denitrification process is more suitable for the deep denitrification of tail water of sewage treatment plants.
4. Conclusions
Nitrogen in tailwater of a STSAD(sodium thiosulphate siderite autotrophic denitrifying) biofilter reactor was studied. Under the optimal. conditions, the removal rate of NO3-- N is 100%, the removal rate of TN is more than 95%, and the effluent SO42- and nitrate nitrogen concentrations are not more than 250 mg/L and 0.03 mg/L, respectively. This process is technically and economically feasible for denitrification in the tail water of sewage treatment plant, making the TN and COD of effluent meet the water quality standard requirements, and the cost is only 0.042 CNY/t(water). Furthermore, testing STSAD reactor system in the presence of siderite to phosphorus may also have a certain removal effect and can be used for simultaneous denitrification and phosphorus removal.
Acknowledgments
The majority of this work was supported by the Major Special Science and Technology. Henan Department of Science and Technology (222102320089).
Declaration of Interest Statement
We declare that we have no financial and personal relationships with other people or. organizations that can inappropriately influence our work, there is no professional or other personal interest of any nature or kind in any product, service and/or company that could be construed as influencing the position presented in, or the review of, the manuscript entitled.
References
- X. Li, J.Y. Zou, D.Y. Zhang, L.Y. Xie and Y. Yuan, A new method for in-situ treatment of waste gas scrubbing liquid containing both NH3 and H2S based on sulfur autotrophic denitrification and partial nitrification-Anammox coupling system, Bioresource Technoogy., 329 (2021). [CrossRef]
- J.F. Chen, S.N. Liu, J. Yan, J.J. Wen, Y.Y. Hu and W.W Zhang, Intensive removal efficiency and mechanisms of carbon and ammonium in municipal wastewater treatment plant tail water byozone oyster shells fix-bed bioreactor-membrane bioreactor combined system, Ecological Engineering., 101 (2017) 75-83.
- Y.P. Sun, P.C. Zhou, N. Zhang, Z. Zhang, Q.W. Guo, C.Y. Chen and L.H. Cui, Effects of matrix modification and bacteria amendment on the treatment efficiency of municipal tailwater pollutants by modified vertical flow constructed wetland, Journal of Environmental Management., 281 (2021). [CrossRef]
- S.G. Lehman, M. Badruzzaman, S. Adham, D.J. Roberts and D.A. Clifford, Perchlorate and nitrate treatment by ion exchange integrated with biological brine treatment, Water Research., 42 (2008) 969-976. [CrossRef]
- E. Sahinkaya, N. Dursun, A. Kilic, S. Demirel, S. Uyanik and O. Cinar, Simultaneous heterotrophic and sulfur-oxidizing autotrophic denitrification process for drinking water treatment: Control of sulfate production, Water Research., 45 (2011) 6661-6667. [CrossRef]
- Q. Wang, Y.L. Gao, H. Huang, L.C. Wang, K. Jin and Y.G. Chen, Does electrolysis facilitate simultaneous nitrogen removal and toxicity reduction of low C/N dyeing wastewater by sulfur-based denitrification biofilter? Science of the Total Environment., 722 (2020).
- Y. Li, Y.L. Wang, D.J. Wan, B. Li, P.Y. Zhang and H.J. Wang, Pilot-scale application of sulfur-limestone autotrophic denitrification biofilter for municipal tailwater treatment: Performance and microbial community structure, Bioresource Technology., 300 (2020). [CrossRef]
- Z. Ahmed, S.M. Kim, I.S. Kim, M.S. Bum, K.J. Chae, J.H. Joo, Y.S. Ok and S.E. Oh, Nitrification and denitrification using biofilters packed with sulfur and limestone at a pilot-scale municipal wastewater treatment plant, Environ Technol., 33 (2012) 1271-1278. [CrossRef]
- E. Sahinkaya and N. Dursun, Sulfur-oxidizing autotrophic and mixotrophic denitrification processes for dr&inking water treatment: Elimination of excess sulfate production and alkalinity requirement, Chemosphere., 89 (2012) 144-149. [CrossRef]
- A.K. Weber, L.A. Achenbach and J.D. Coates, Microorganisms pumping iron: anaerobic microbial iron oxidation and reduction, Nature Reviews Microbiology., 4 (2006) 752-764. [CrossRef]
- Y.H. Yang, T. Chen, X. Zhang, C.S. Qing, J. Wang, Z. Yue, H.B. Liu and Z. Yang, Simultaneous removal of nitrate and phosphate from wastewater by siderite based autotrophic denitrification, Chemosphere., 199 (2018) 130-137. [CrossRef]
- T.T. Zhu, H.Y. Cheng, L.H. Yang, S.G. Su, H.G. Wang, S.S. Wang and A.J. Wang, Coupled Sulfur and Iron(II) Carbonate-Driven Autotrophic Denitrification for Significantly Enhanced Nitrate Removal, Environmental Science & Technology., 53 (2018) 1545-1554. [CrossRef]
- W. Wang, D.Y. Wei, F.C. Li, Y.W. Zhang and R.H. Li, Sulfur-siderite autotrophic denitrification system for simultaneous nitrate and phosphate removal: From feasibility to pilot experiments, Water Research., 160 (2019) 52-59. [CrossRef]
- F.D. Capua, S.H. Ahoranta, S. Papirio, P.N.L. Lens and G. Esposito, Impacts of sulfur source and temperature on sulfur-driven denitrification by pure and mixed cultures of Thiobacillus, Process Biochemistry., 51 (2016) 1576-1584. [CrossRef]
- T.C. Zhang and H. Zeng, Development of a Response Surface for Prediction of Nitrate Removal in Sulfur–Limestone Autotrophic Denitrification Fixed-Bed Reactors, Journal of Environmental Engineering., 132 (2006) 1068-1072. [CrossRef]
- D.P. Kelly and A.P. Wood, Confirmation of Thiobacillus denitrificans as a species of the genus Thiobacillus, in the beta-subclass of the Proteobacteria, with strain NCIMB 9548 as the type strain, International Journal of Systematic & Evolutionary Microbiology., 50 (2000) 547-550. [CrossRef]
- C.Z. Fan, W.L. Zhou, S.B. He and J.C. Huang, Sulfur transformation in sulfur autotrophic denitrification using thiosulfate as electron donor, Environmental Pollution., 268 (2021). [CrossRef]
- G.M. Nisola, M. Redillas, E. Cho, M. Han, N. Yoo and W. Chung, Comparison of reactive porous media for sulfur-oxidizing denitrification of high nitrate strength wastewater, Biochemical Engineering Journal., 58 (2011) 79-86. [CrossRef]
- R. Khanongnuch, F.D. Capua, A. Lakaniemi, E.R. Rene and P. Lens, Effect of N/S ratio on anoxic thiosulfate oxidation in a fluidized bed reactor: Experimental and artificial neural network model analysis, Process Biochemistry., 68 (2018) 171-181. [CrossRef]
- W.L. Zhou, Y.J. Sun, B.T. Wu, Y. Zhang, M. Huang, T. Miyanaga, and Z.J. Zhang, Autotrophic denitrification for nitrate and nitrite removal using sulfur-limestone, Journal of Environmental Sciences., 23 (2011) 1761-1769. [CrossRef]
- J. Chung, K. Amin, S. Kim, S. Yoon, K. Kwon and W. Bae, Autotrophic denitrification of nitrate and nitrite using thiosulfate as an electron donor, Water Research., 58 (2014) 169-178. [CrossRef]
- T.W. Hao, L. Wei, H. Lu, H. Chui, H.R. Mackey, M.C.M.V. Loosdrecht and G. Chen, Characterization of sulfate-reducing granular sludge in the SANI process, Water Research., 47 (2013) 7042-7052. [CrossRef]
- C. Torrentó, J. Cama, J. Urmeneta, N. Otero and A. Soler, Denitrification of groundwater with pyrite and Thiobacillus denitrificans, Chemical Geology., 278 (2010) 80-91. [CrossRef]
- A. Koenig and L.H. Li, Use of limestone for pH control in autotrophic denitrification: continuous flow experiments in pilot-scale packed bed reactors, Journal of Biotechnol., 99 (2002) 161-71. [CrossRef]
- W. Xing, Z.L. He, Y. Wang, W.W. Cai, F.X. Jia and H. Yao, Using cold-adapted river-bottom sediment as seed sludge for sulfur-based autotrophic denitrification operated at mesophilic and psychrophilic temperatures, Science of The Total Environment, 735 (2020). [CrossRef]
- M. Sposob, A. Cydzik-Kwiatkowska, R. Bakke and C. Dinamarca, Temperature-induced changes in a microbial community under autotrophic denitrification with sulfide, Process Biochemistry., 69 (2018) 161-168. [CrossRef]
- L.L. Zhang, C. Zhang, C.Z. Hu, H.J. Liu and J.H. Qu, Denitrification of groundwater using a sulfur-oxidizing autotrophic denitrifying anaerobic fluidized-bed MBR: performance and bacterial community structure, Applied Microbiology and Biotechnology., 99 (2015) 2815-2827. [CrossRef]
- Y.P. Zhu, M Wu, N.Y. Gao, W.H. Chu and S.F. Wang, Impacts of nitrate and electron donor on perchlorate reduction and microbial community composition in a biologically activated carbon reactor, Chemosphere., 165 (2016) 134-143. [CrossRef]
- L. Ye, M.F. Shao, T. Zhang, A. Tong and S. Lok, Analysis of the bacterial community in a laboratory-scale nitrification reactor and a wastewater treatment plant by 454-pyrosequencing, Water Research., 45 (2011) 4390-4398. [CrossRef]
- T. Yamada, Y. Sekiguchi, S. Hanada, H. Imachi, A. Ohashi, H. Harada and Y. Kamagata, Anaerolinea thermolimosa sp. nov., Levilinea saccharolytica gen. nov., sp. nov. and Leptolinea tardivitalis gen. nov., sp. nov., novel filamentous anaerobes, and description of the new classes Anaerolineae classis nov. and Caldilineae classis nov. in the bacterial phylum Chloroflexi, International Journal of Systematic and Evolutionary Microbiology., 56 (2006) 1331-1340.
- Q.H. Wang, C.P. Feng, Y.X. Zhao and C.B. Hao, Denitrification of nitrate contaminated groundwater with a fiber-based biofilm reactor, Bioresource Technology., 100 (2009) 2223-2227. [CrossRef]
- M. Fabisch, F. Beulig, D.M. Akob and K. Küsel, Surprising abundance of Gallionella-related iron oxidizers in creek sediments at pH 4.4 or at high heavy metal concentrations, Frontiers in Microbiology., 4 (2013) 390. [CrossRef]
- G. Zou, S. Papirio, A. Lakaniemi, S.H. Ahoranta, J.A. Puhakka, High rate autotrophic denitrification in fluidized-bed biofilm reactors, Chemical engineering journal (Lausanne, Switzerland : 1996)., 284 (2016) 1287-1294. [CrossRef]
- C.X. Zhang, Y.K. Guo, H.F. Du, C. Zhang, S.H. Wang, J. Lian and J.B. Guo, Denitrification characteristics of a sulfur autotrophic denitrification reactor, Journal of Hebei University of Science and Technology (in Chinese)., 37 (2016) 96-101.
- M. Zhang, P. Zheng, W. Li, R. Wang, S. Ding and G. Abbas, Performance of nitrate-dependent anaerobic ferrous oxidizing (NAFO) process: a novel prospective technology for autotrophic denitrification, Bioresource Technology., 179 (2015) 543-548. [CrossRef]
- J.H. Park, H.S. Shin, I.S. Lee and J.H. Bae, Denitrification of high NO3--N containing wastewater using elemental sulfur; nitrogen loading rate and N2O production, Environmental Technology., 23 (2002) 53-65.
- B. Huang, G.Y. Chi, X. Chen and Y. Shi, Removal of highly elevated nitrate from drinking water by pH-heterogenized heterotrophic denitrification facilitated with ferrous sulfide-based autotrophic denitrification, Bioresource Technology., 102 (2011).
|
Disclaimer/Publisher’s Note: The statements, opinions and data contained in all publications are solely those of the individual author(s) and contributor(s) and not of MDPI and/or the editor(s). MDPI and/or the editor(s) disclaim responsibility for any injury to people or property resulting from any ideas, methods, instructions or products referred to in the content. |
© 2024 by the authors. Licensee MDPI, Basel, Switzerland. This article is an open access article distributed under the terms and conditions of the Creative Commons Attribution (CC BY) license (http://creativecommons.org/licenses/by/4.0/).
