1. Introduction
Soybean (Glycine max) has worldwide importance as a source of high-quality plant oil, with a production of over 100 million tons in south and north America [
1]. Asian Soybean Rust (ASR) is a disease with the potential to cause up to 90% yield loss in soybean production, leading to massive economic damages when left untreated [
2]. Due to the short lifecycle of the causative agent
Phakopsora pachyrhizi and the high damage potential, timely treatment with fungicides is difficult and the availability of resistant soybean cultivars is limited [
3,
4].
P. pachyrhizi is a an obligate biotrophic pathogen. While little is known about the sexual reproduction of the fungus, the asexual reproduction on soybean is well understood [
4]. Urediospores are dispersed by wind and germinate under suitable conditions on soybean leaves. Unlike most other rust fungi, which – in the Urediospore phase - infect their respective host plants through stomates [
5],
P. pachyrhizi forms an appressorium, which directly penetrates an epidermal cell [
4]. The fungal mycelium grows in the intercellular space of the mesophyll with developing haustoria providing nutrients derived from the plant cells [
4]. Finally, the fungal mycelium forms uredosori, which break through the epidermis and release new Urediospores 5-8 days after the initial infection [
4,
5,
6]. The rapid lifecycle of the pathogen, combined with the high potential yield loss, make it one of the potentially most dangerous causative agents in soybean production in areas with suitable weather for infestation of soybean monocultures with potential for further geographic spread due to climate change.
Optical sensors have shown to be an effective tool for the detection of plant diseases in previous studies [
7,
8]. Among the different optical sensors, hyperspectral sensors have the distinct advantage to produce a detailed profile of the plant’s reflectance signature, allowing for precise measuring of metabolic and structural changes within the plant, which can be linked to specific plant – pathogen interactions [
9,
10]. Nevertheless, the application of hyperspectral imaging technologies for plant disease detection in early stages is challenging due to the large amount of data generated by the sensor, which leads to the requirement of advanced data analysis methods in order to efficiently extract the relevant data for disease detection [
11]. ASR is currently being detected via visual assessment in agricultural practice and fungicide treatments are initiated at field scale. The implementation of precision farming based on disease mapping from hyperspectral field data could lead to a reduction in fungicide use and increased cost efficiency for agricultural businesses.
Classical machine learning approaches, like Support Vector Machines (SVMs) [
12] or k-Nearest-Neighbor (k-NN) [
13], are capable of handling this amount of data and achieved reliable results in hyperspectral classification applications [
14,
15]. In recent years, deep learning-based models outperformed other machine learning methods at the cost of increasing model complexity [
16]. Convolution layers allow the usage of trainable filters for neural networks, which simplifies the consideration of spatial information [
17]. The spatial information boosted the performance of neural networks even further. However, the training procedure of all presented methods is supervised. Therefore, annotated training samples are required.
This study focusses on the potential of hyperspectral imaging sensors to detect an ASR infection in early stages, before symptoms become visible. In order to achieve this the resulting datasets of two experiments, in which time-series measurements on inoculated soybean plants have been performed, were analyzed with classical machine learning methods and deep learning. The applied support vector machine, k-NN and neural network analysis were individually tested for their capability of early detection of disease as well as their detection accuracy, and compared with each other. A limited set of training data, focusing on the last three days of the time-series measurement, was generated via an expert and split into three distinct classes with high variability in each class due to multiple factors – such as different plant parts or symptom progression – being included in the respective classes. This allowed an estimation of the capabilities of the supervised classification methods to overcome in-class data variance and performance in accurately detecting early-stage disease symptoms based on a limited set of training data.
2. Materials and Methods
2.1. Plant Cultivation, Pathogen Material and Inoculation Procedure
Glycine max (soybean) cultivar Sultana plants were grown from commercially available seeds (RAGT Saaten Deutschland GmbH, Hiddenhausen, Germany) under greenhouse conditions with two seeds planted per pot. Greenhouse conditions consisted of long light (16 / 8 h) with an average temperature of 22°C and 40% – 50% relative humidity. Once plants reached BBCH stage 11, plants were separated to guarantee one soybean plant of similar growth per pot.
P. pachyrhizi spores from the laboratory collection of the University of Hohenheim, stored at -80°C, were suspended in 0.01% tween solution with a concentration of 1 mg / 1 mL directly after thawing.
Soybean plants were inoculated with the spore suspension at BBCH stages 61 and 70 for experiment 1 and 2, respectively. The spore suspension was uniformly applied through a nebulizer. Tween solution without spores was applied to the control plants in order to exclude possible effects of the solution on early measurements. After inoculation, both inoculated and control plants were placed for 24 h in a high humidity environment (>90% humidity) without light at 21 °C.
2.2. Hyperspectral Imaging Measurement
All measurements were performed via the Corning microHSITM 410 Vis-NIR pushbroom hyperspectral imaging sensor (Corning Inc, New York, USA), which was fixed to a BiSlide Positioning Stage linear actuator (Velmex Inc., Bloomfield, USA) in order to permit precise movement of the sensor. Additionally, 4 Illuminator 70W 3100K halogen lamps (ASD Inc., Fallschurch, USA) were fixed to the linear actuator to guarantee constant and even illumination of the measurement area during the scanning of the samples. The equipment was controlled remotely via the software FluxTrainer (version 3.4.0.5; Luxflux GmbH, Reutlingen, Germany). Both control and inoculated plants were framed over the entire duration of the time-series measurements to ensure minimal leaf movement and a high compatibility of leaf placement over the course of the time-series.
During each measurement the light sources were activated 30 minutes prior to measurement start in order to prevent changes in illumination values of the halogen lamp due to temperature changes. The framed plants were placed in the measurement area with a fixed distance of 30 cm from the leaf surfaces to the sensor and covered to avoid heat stress while white and dark references for reflectance calculation were acquired at the same distance from the hyperspectral sensor as the measured plant samples. A zenith polymer stripe (polytetrafluorethylene-based material, SG 3151; SphereOptics GmbH, Uhldingen, Germany) was used as white reference. The dark reference was acquired through closing the shutter of the camera. Each reference value was averaged over 100 frames.
Two experiments (experiment 1 and 2) were performed as time-series measurements via hyperspectral imaging. Each experiment consisted of eight soybean plants of which two were used as control while six were inoculated with P. pachyrhizi spores. An average of nine soybean leaves per plant were measured over the respective experiments (minimum three leaves, maximum 15 leaves), with each individual leaf consisting of 80,000 to 130,000 pixels, respectively. The time-series measurement started 1 day after inoculation (dai) with a measurement every 24 h until 10 dai for both experiments.
2.3. Data Analysis
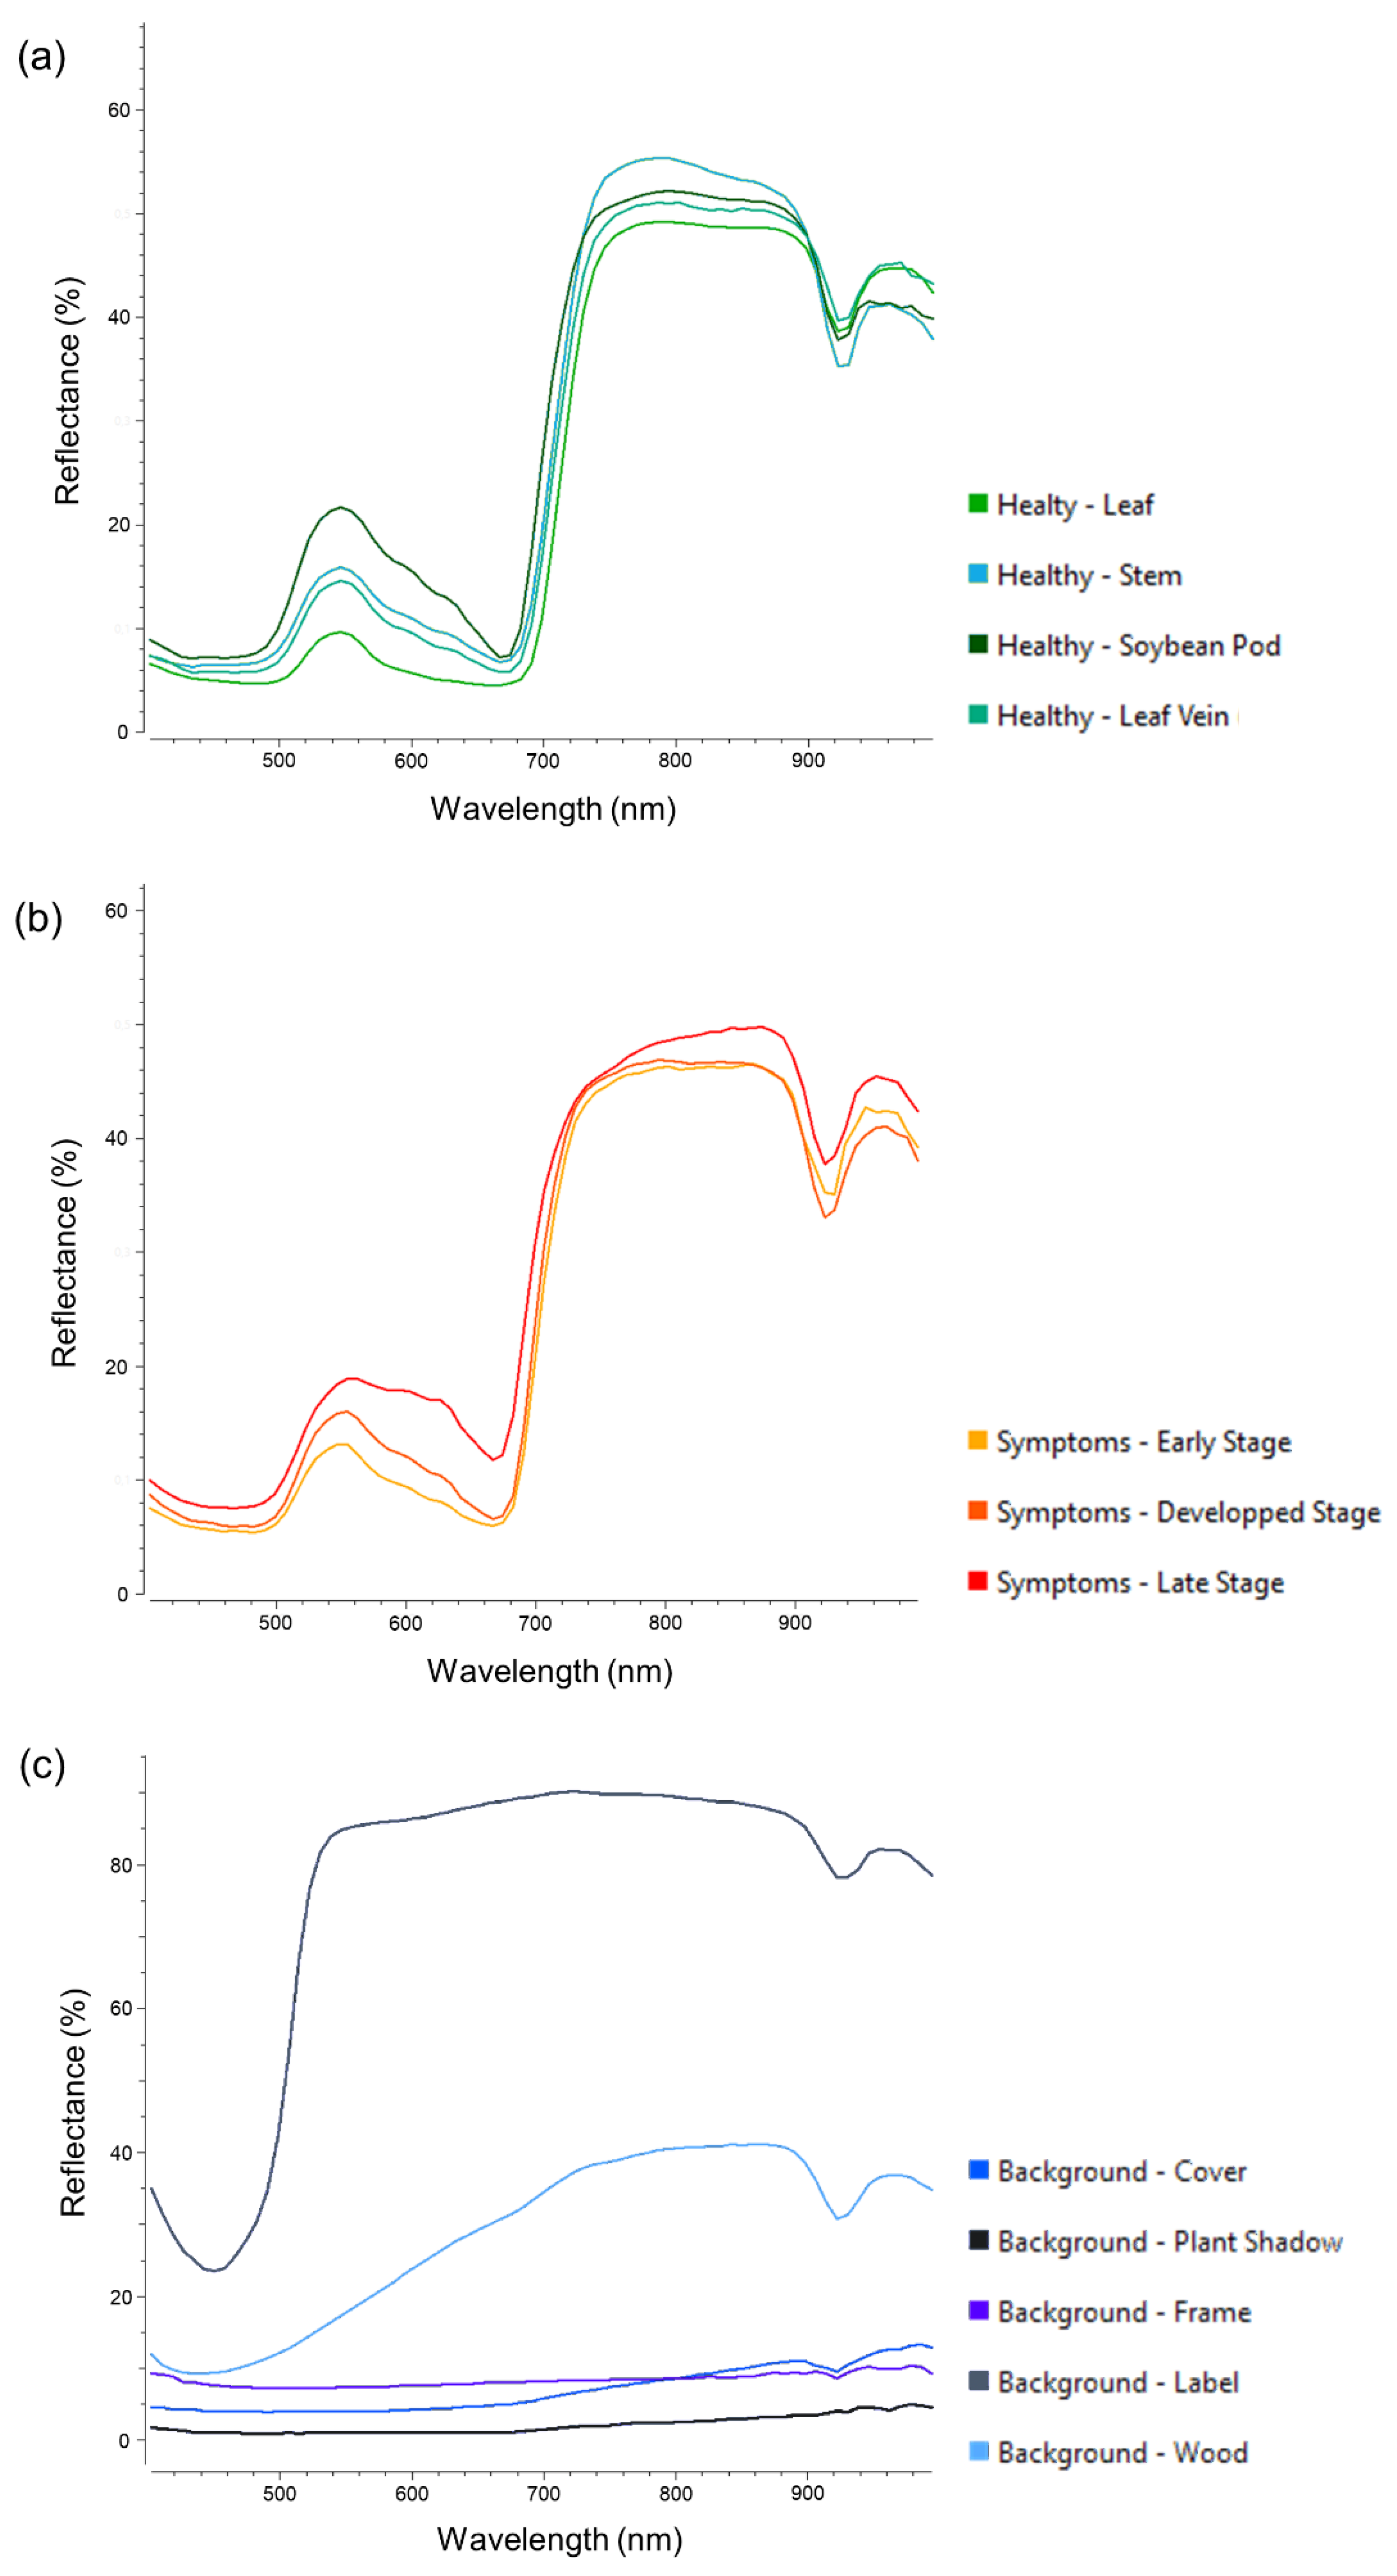
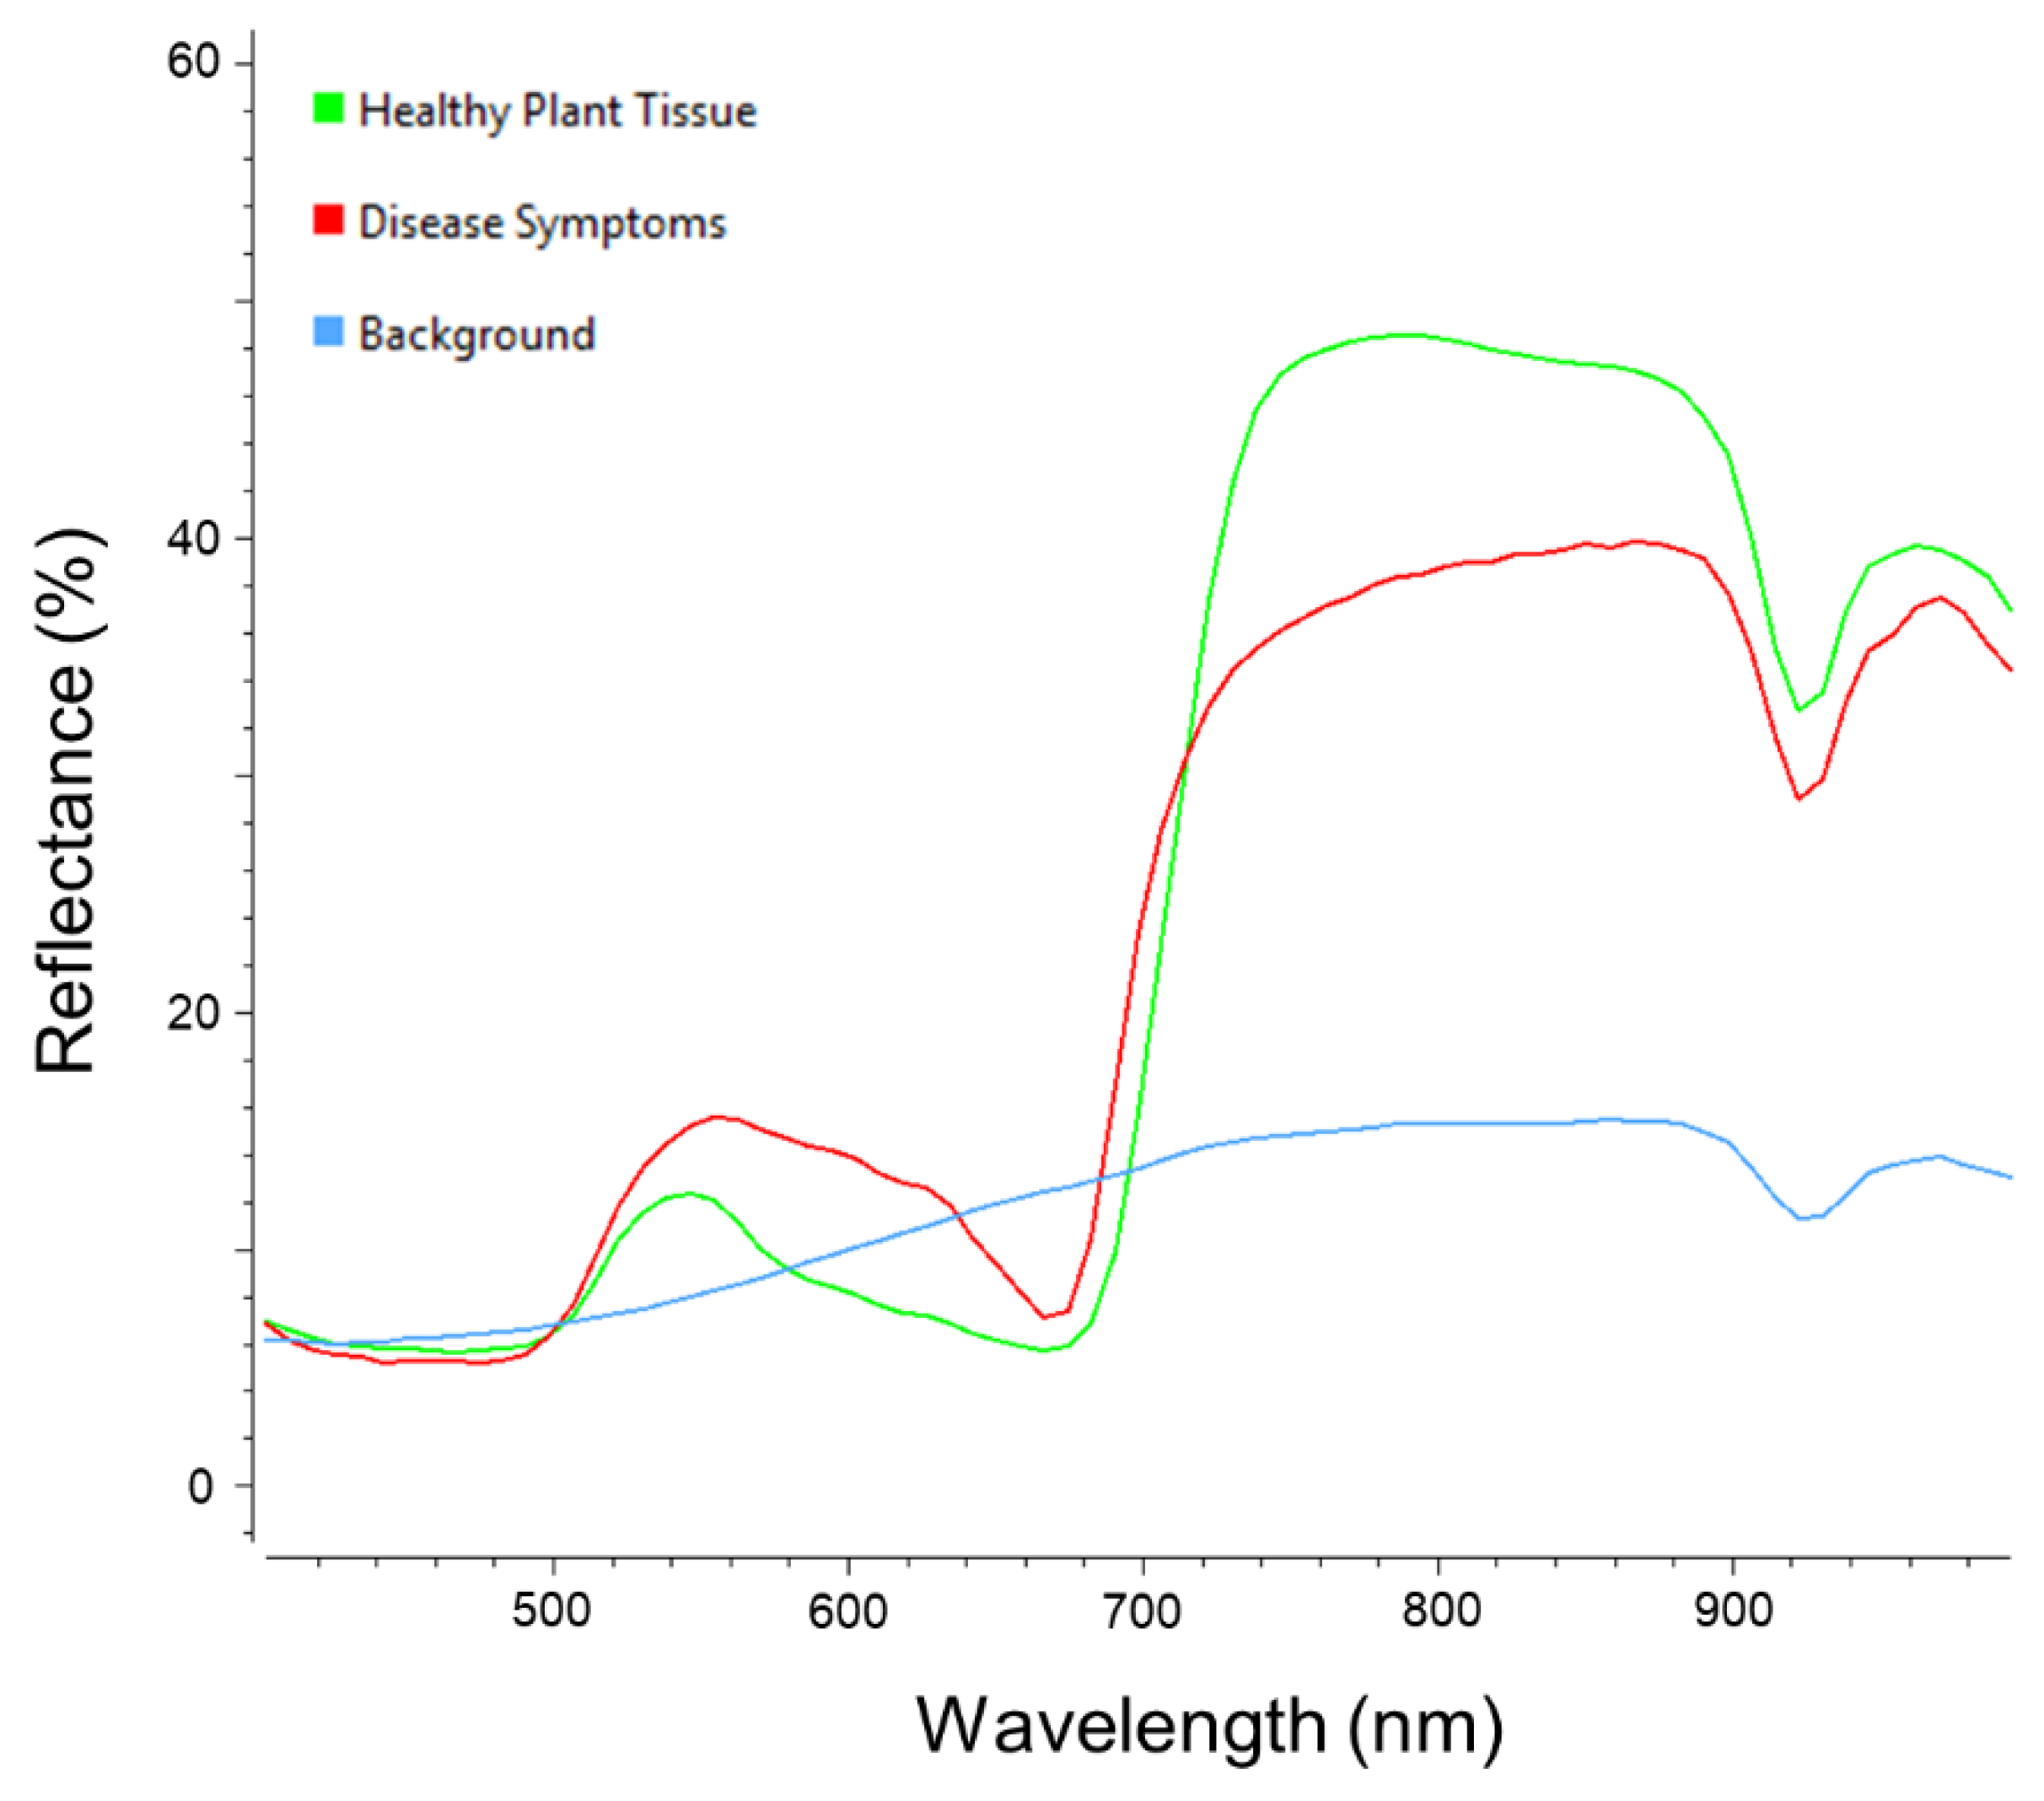
The Fluxtrainer software was used for visual assessment and spectral information extraction of the hyperspectral datasets through an expert. Furthermore, the training data for the data analysis methods was selected via this software. The training data was divided into three distinct classes – healthy plant tissue, disease symptoms and background. Each of the respective classes consists of over 250,000 annotated pixels (in total over 1,000,000 labeled pixels), including samples for all features within the respective class (
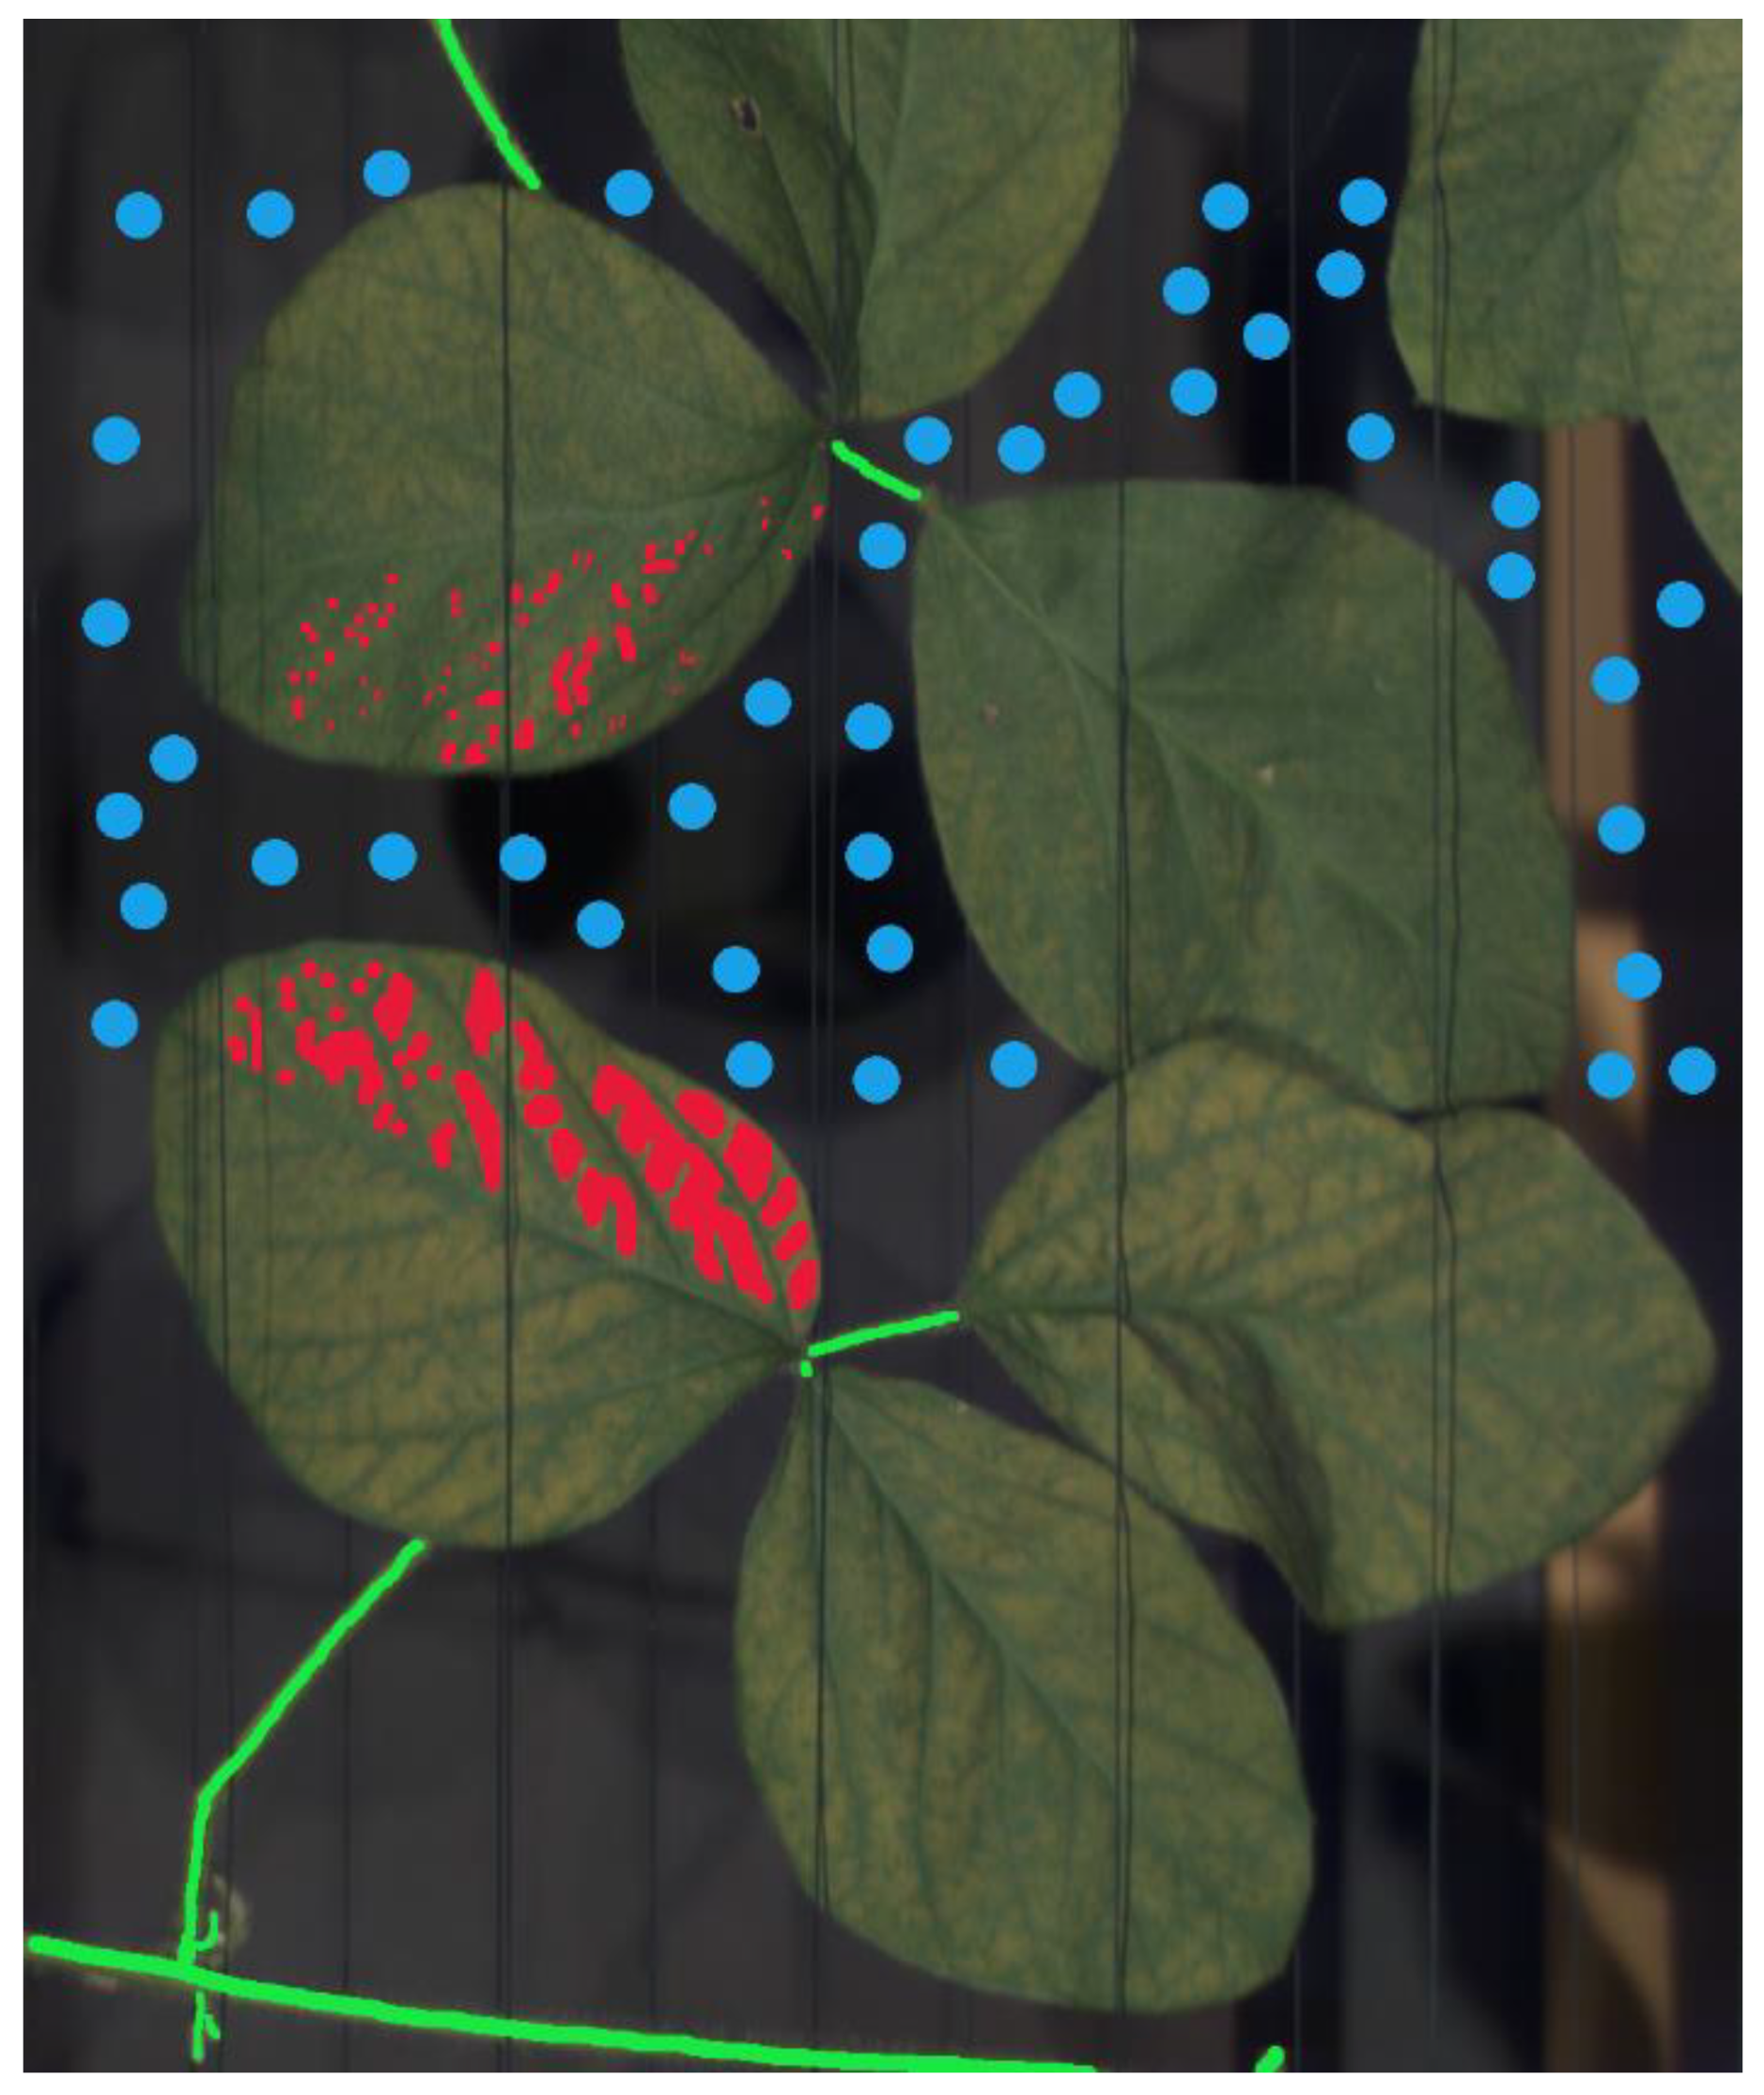
Figure 1). The pixels were annotated from the images at 10 dai at experiment 1 and 8, 9 and 10 dai from experiment 2, respectively, when developed and late-stage symptoms were clearly visible in order to ensure high quality training data (
Figure 2). Late-stage symptoms from both experiments were exclusively used with the purpose to investigate the adaptability of the different data analysis methods presented within the manuscript when it comes to the classification of early-stage symptoms without available training data due to the difficulty of accurate early-stage symptom assessment under field conditions.
2.4. Supervised Machine Learning Methods
The classification was handled as a supervised pixel-based classification task. Each pixel of the input recording should be classified into one of the three classes (healthy, diseased, or background). Five models were selected to compare classical machine learning models and the more recent deep learning approaches.
SVM and k-NN represented the classical machine learning approaches. For the SVMs, a one-vs-rest approach allowed the classification within three classes. For k-NNs, the hyperparameter k defines the number of considered neighbors and is crucial for the algorithm’s performance. For a fair comparison, the hyperparameter k was tuned with cross-validation on the training set. The Euclidean distances of the input pixels were used as distance measurements for the k-NN approach.
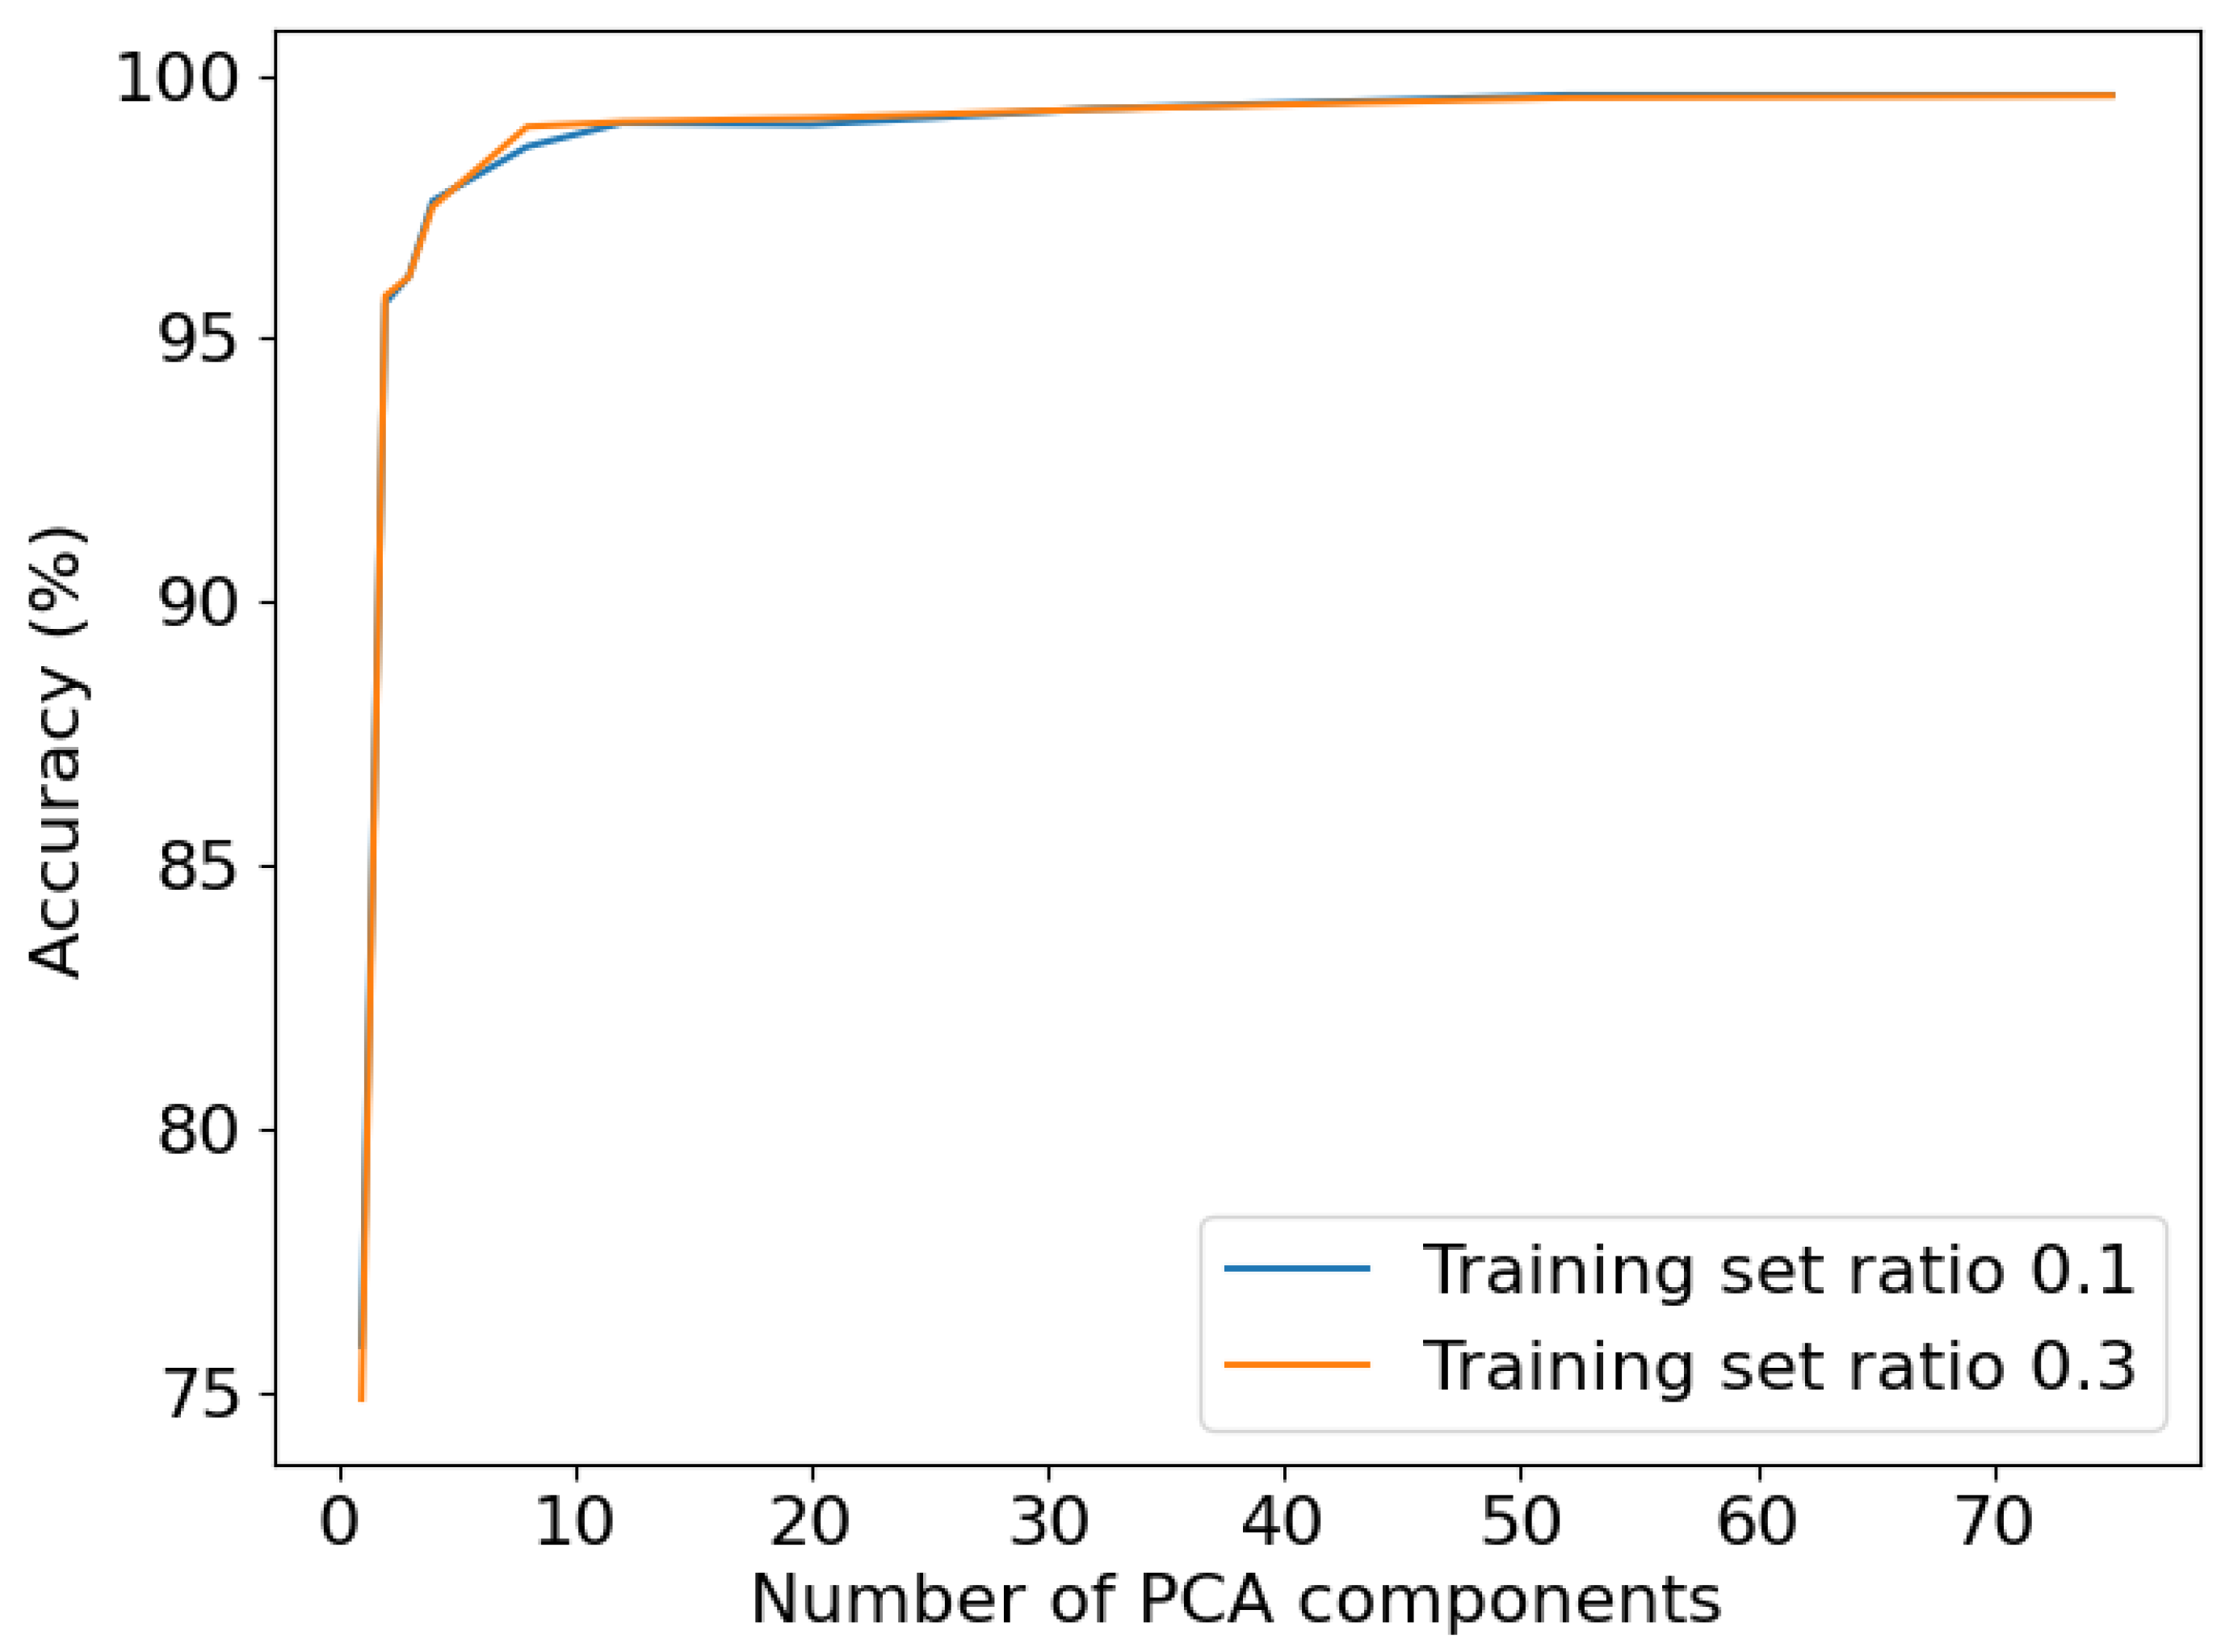
Two configurations of SVM and k-NN were assessed in this study. The initial set of experiments employed the methods’ default configurations. In the subsequent set of experiments, the configurations of the methods were specifically optimized for the given task. This involved the inclusion of an additional preprocessing step, namely normalization. Additionally, the effectiveness of dimension reduction techniques, commonly employed in hyperspectral recordings, was evaluated. Principle Component Analysis (PCA) [
18], a widely-used approach for dimension reduction, was applied, but it did not yield further improvement in SVM performance, as depicted in
Figure 3. The influence of the numbers of components, determining the output dimension of PCA, were examined. The original recordings, without employing PCA, exhibited the best performance. Hence, no dimension reduction was employed. For subsequent analysis, both default and fine-tuned configurations were tested.
Three candidates represented deep learning approaches. The first neural network was a fully connected neural network with four layers. The fully connected layers were separated by ReLU activation functions [
19] and Batch Normalization layers [
20].
DeepHS_net, the second neural network, is a convolutional neural network and achieved satisfying results for other hyperspectral classification tasks [
21]. It consists of three 2D convolution layers and a fully connected head. By using convolution layers, it was able to incorporate spatial information. Therefore, it could utilize the neighboring pixels for the prediction.
DeepHS_net + HyveConv++ is an extension of DeepHS_net. It replaces the first convolution layer with a HyveConv++ layer [
22]. This extension reduces model complexity by introducing a suitable model bias and adds explanation capabilities to the model.
The neural networks were trained with the Adam optimizer [
23]. Varga et al. proposed a learning rate of 1x10⁻² and a batch size of 64 for DeepHS_net [
21]. The learning rate was divided by ten after every 30 epochs.
SVM, k-NN, and the fully connected neural network classified each pixel separately. Both DeepHS_net variants utilized 63x63 pixel patches to classify the center pixel. A class bias was avoided by oversampling all classes to the same number of samples.
3. Results
3.1. Visual Assessment of the Hyperspectral Datasets
The control plants did not show any signs of disease symptoms over the course of the experiments. Despite the framing of the leaves to minimize leaf movement over the course of the time-series measurements it was not entirely possible to prevent leaf movement in all cases. Nevertheless, it was possible to clearly discern and track each individual leaf over the course of the measurement series as leaf positions stayed relatively stable and plant orientation was kept constant during the measurements.
Plants inoculated with
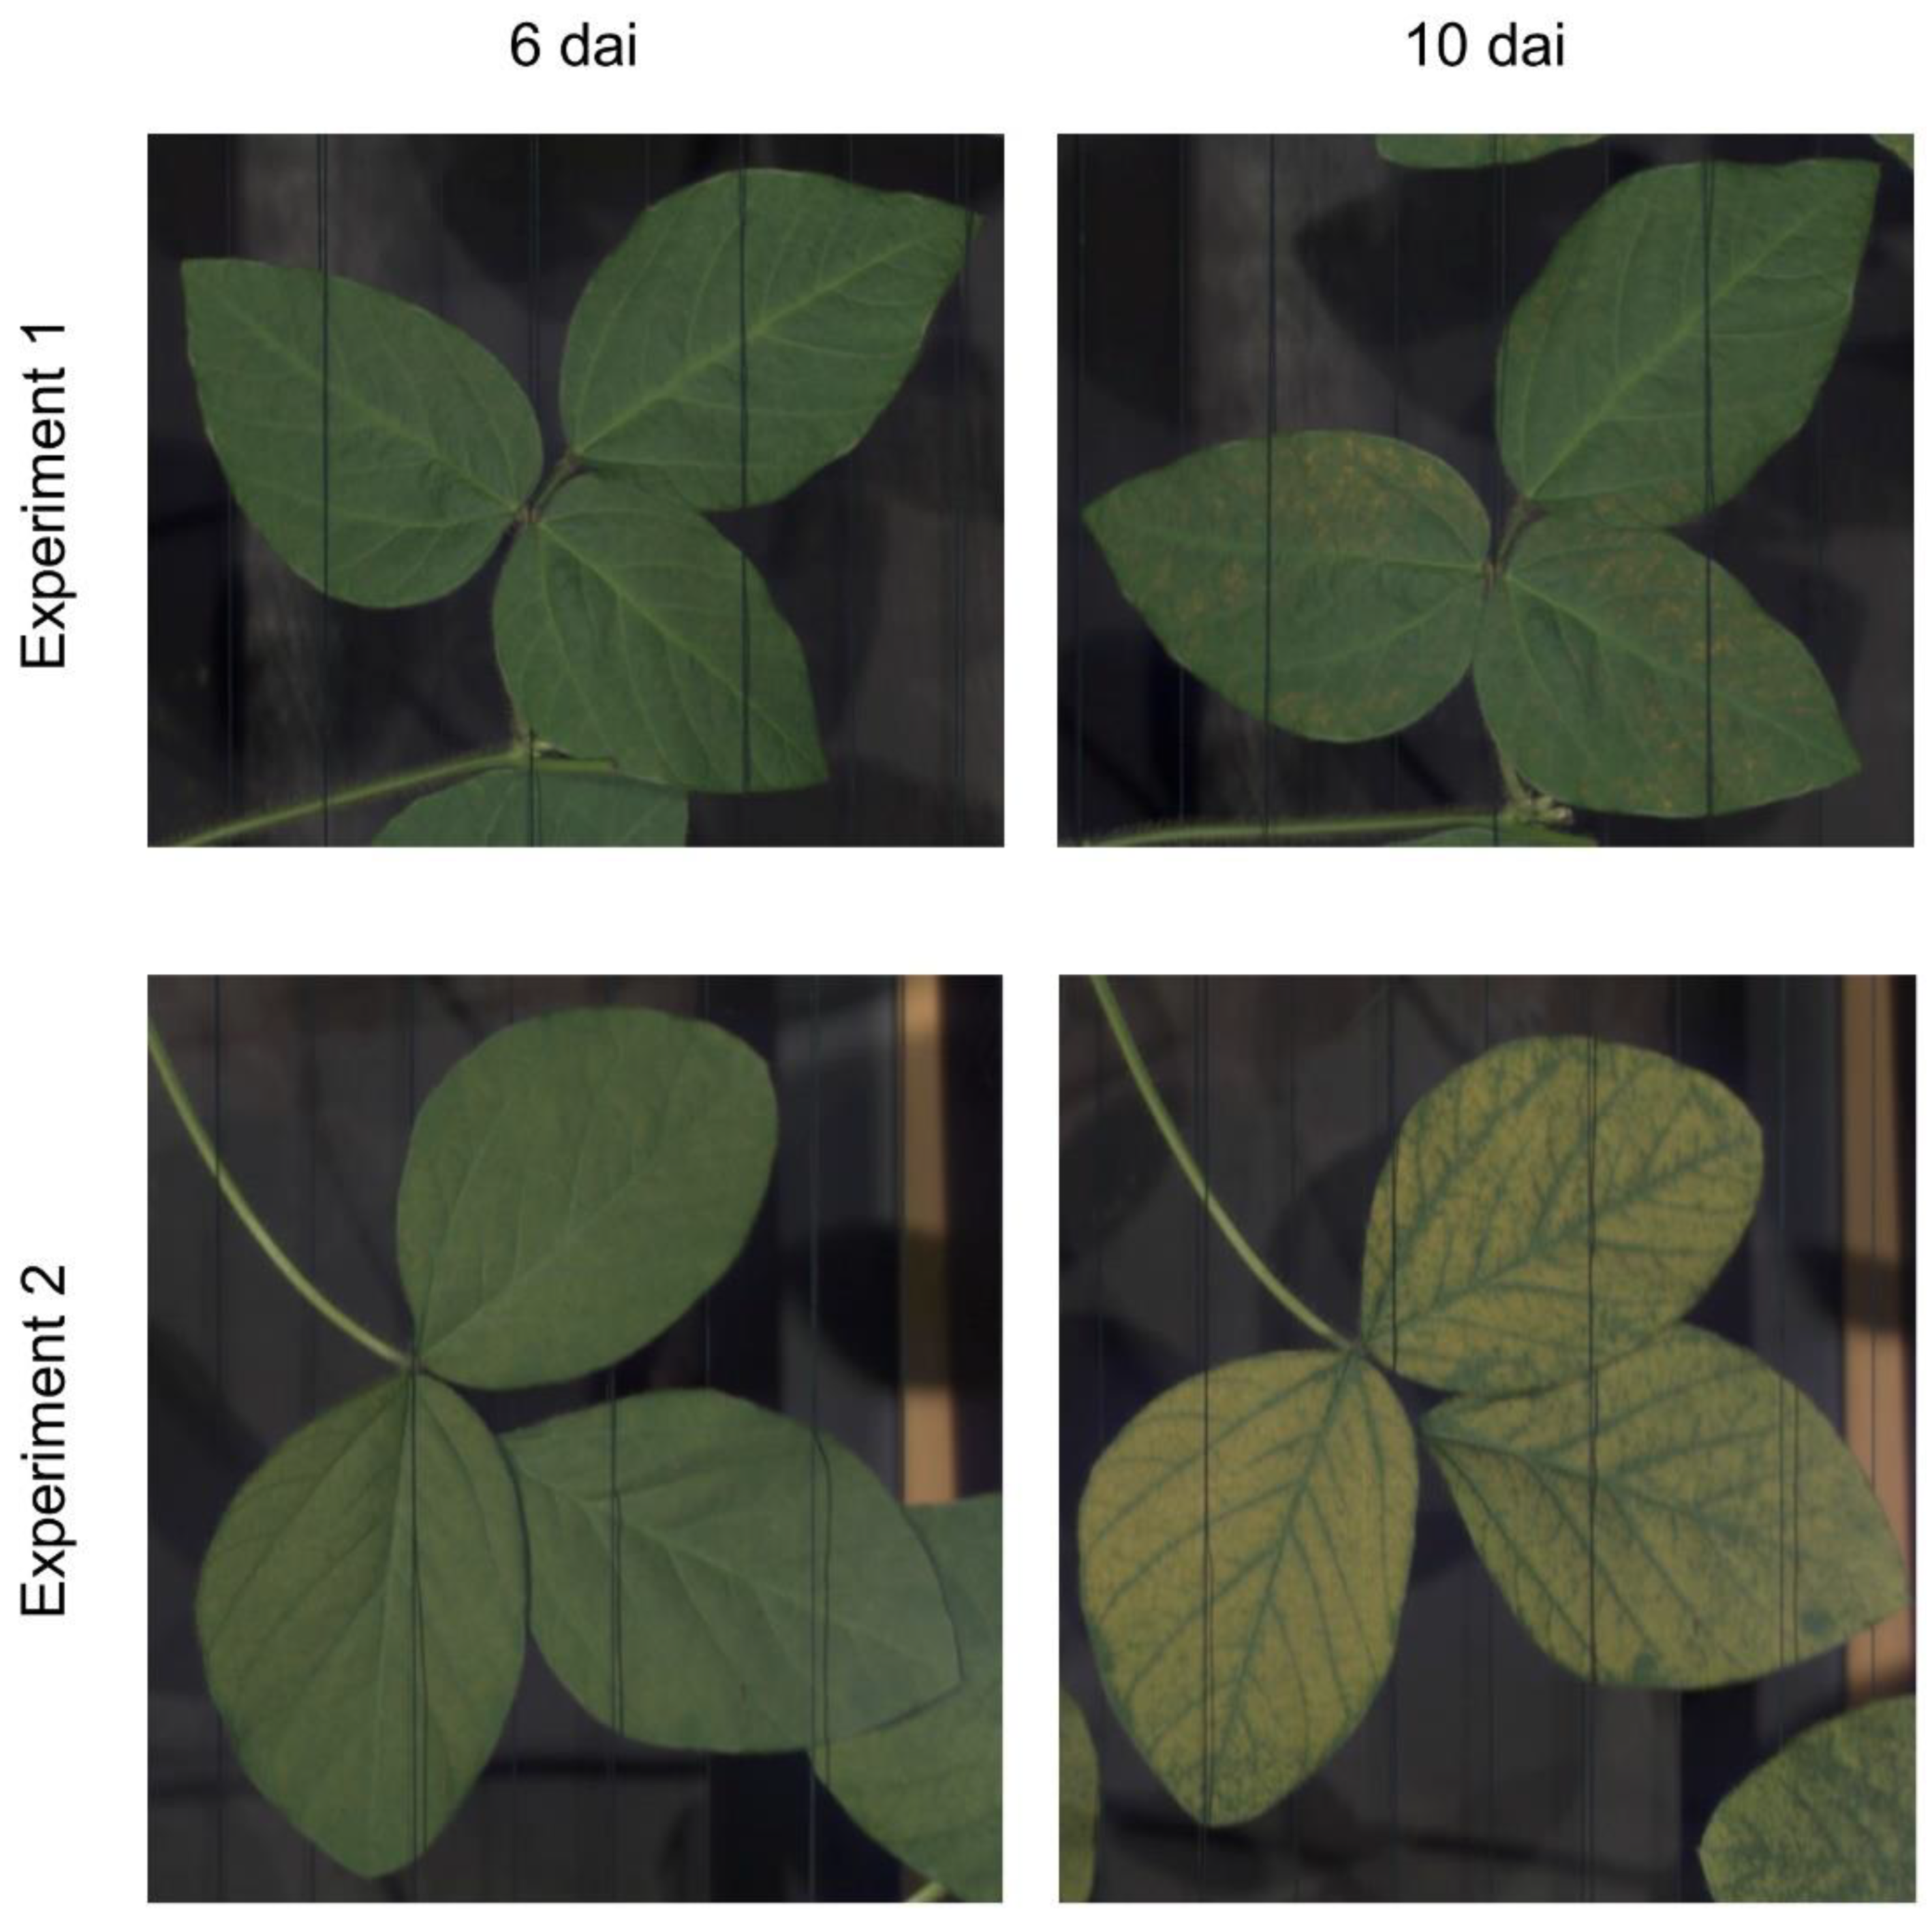
P. pachyrhizi Urediospores showed steadily progressing disease symptoms over the measured time period in both experiments. In experiment 1 disease symptoms could initially be visually assessed at 6 days after inoculation (dai) and slowly progressed until the end of the measurement period. In experiment 2 disease symptoms were detected visually at 5 dai and progressed quickly over the course of the experiment to the point where entire leaves were symptomatic. While disease progression in both experiments was similar, disease severity in experiment 2 was significantly higher than in experiment 1 (
Figure 4). As shown in
Figure 4, it was not possible to completely prevent leaf movement of the inoculated plants as well. However, the change in leaf position in the images is insignificant for a leaf comparison between different images in the time-series measurement.
After manual assessment of the visual and spectral data within the image, three main classes – healthy plant tissue, disease symptoms and background – were identified within the image as training data for use with the supervised data analysis methods employed (
Figure 5). Each of the individual classes showed considerable variability within the images due to factors such as plant geometry, leaf placement, shadows, and symptom development – e.g. the different features included in the class healthy plant tissue consist of leaf, stem, soybean pod and leaf vein (
Figure 1).
3.2. Analysis of the Hyperspectral Datasets through Supervised Machine Learning and Neural Networks
The datasets of both experiments were analyzed with multiple supervised data analysis methods. k-NN and SVM were selected as classic machine learning methods, which have been successfully used in the past. These methods were tested in a default configuration and a fine-tuned configuration. The classical machine learning methods were compared with three neural networks, a fully-connected neural network, DeepHS_net, and DeepHS_net + HyveConv++.
Both machine learning methods performed adequately in their default configuration with an accuracy of 86.8% and 87.21% for k-NN with 10% and 30% of the annotated data used as training data, respectively. SVM achieved an accuracy of 61.94% and 78.73% (
Table 1). By fine-tuning the configurations of the methods for the specific task, the performance of both methods was improved significantly. k-NN achieved 99.58% accuracy with 30% of the annotated data used as training data, and the accuracy of SVM was improved to 99.69% (
Table 1). However, the neural networks outperformed the machine learning methods with an accuracy of 99.94% (fully connected) and 99.99% (DeepHS_net and DeepHS_net + HyveConv++) with only 10% of the annotated data as training data (
Table 1).
DeepHS_net and SVM were chosen as candidates for machine learning and deep learning methodology to test for early disease symptom detection due to the excellent accuracy within the given data.
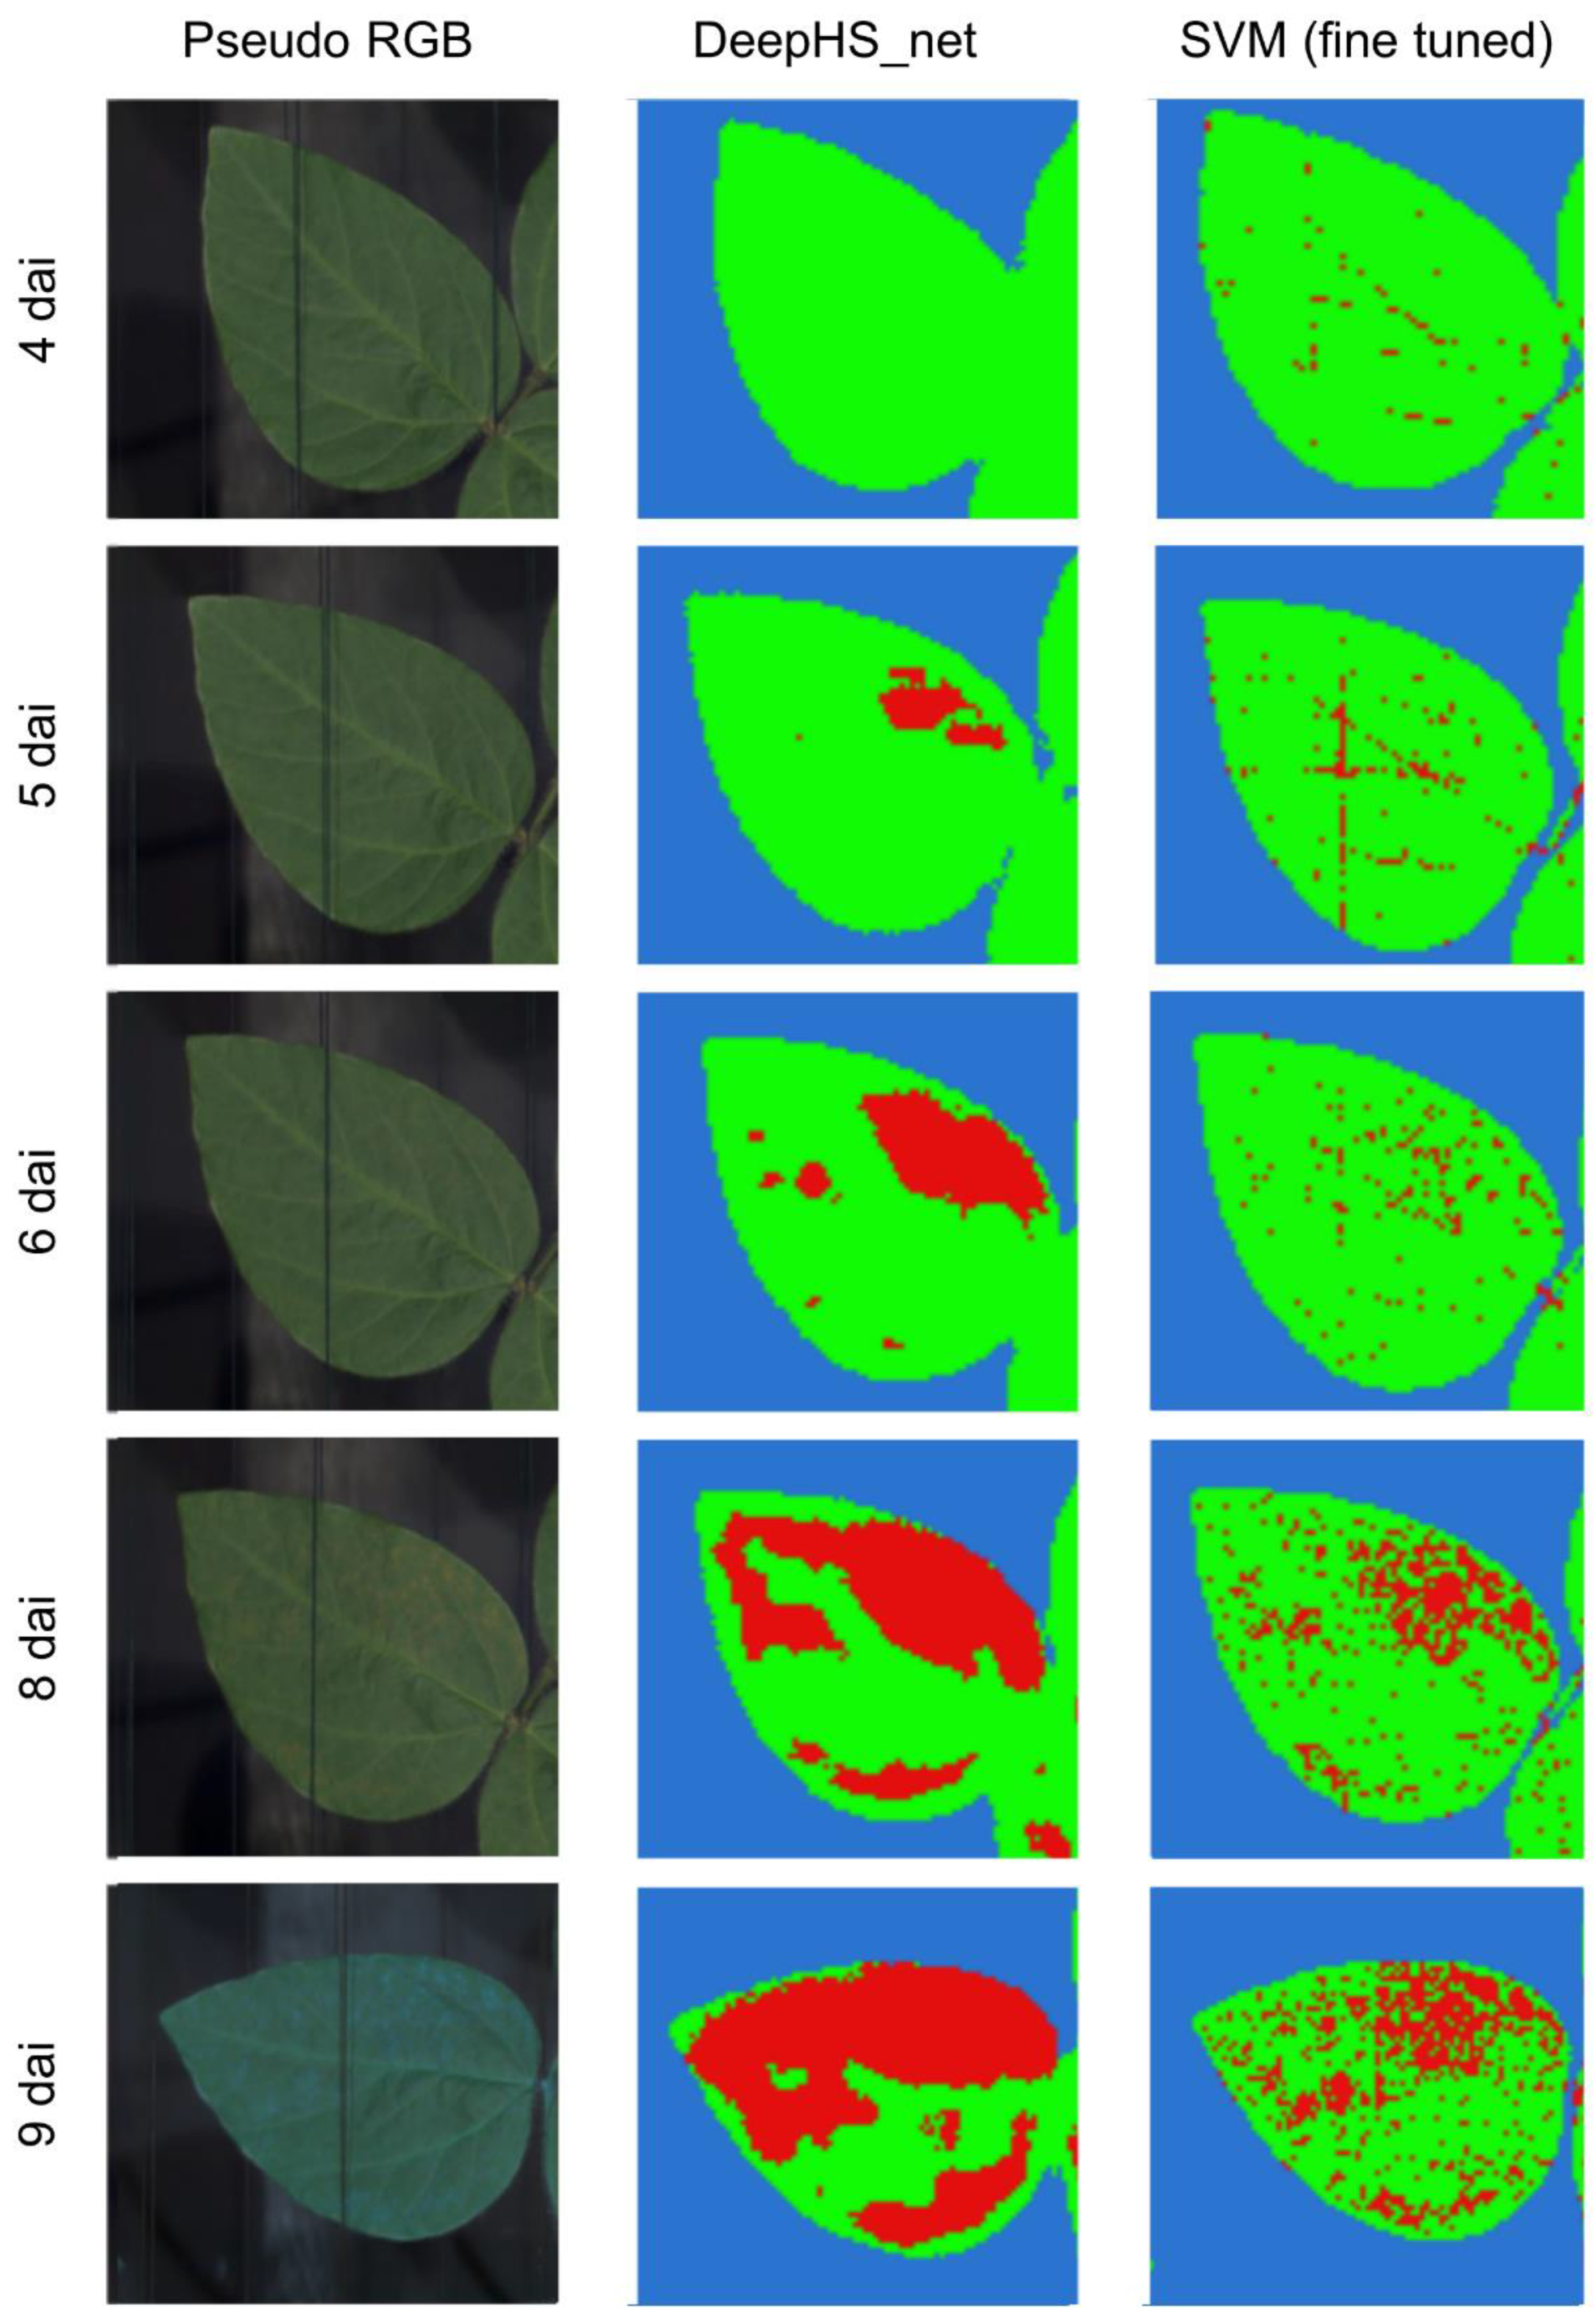
In experiment 1 first disease symptoms were detected via DeepHS_net at 5 dai, one day before symptoms became visible with the human eye, at locations of the leaf which showed visible symptoms on the following day (
Figure 6). Over the course of the time-series measurement, the DeepHS_net classification results correlated with visible symptoms on the inoculated leaves of the experiment (
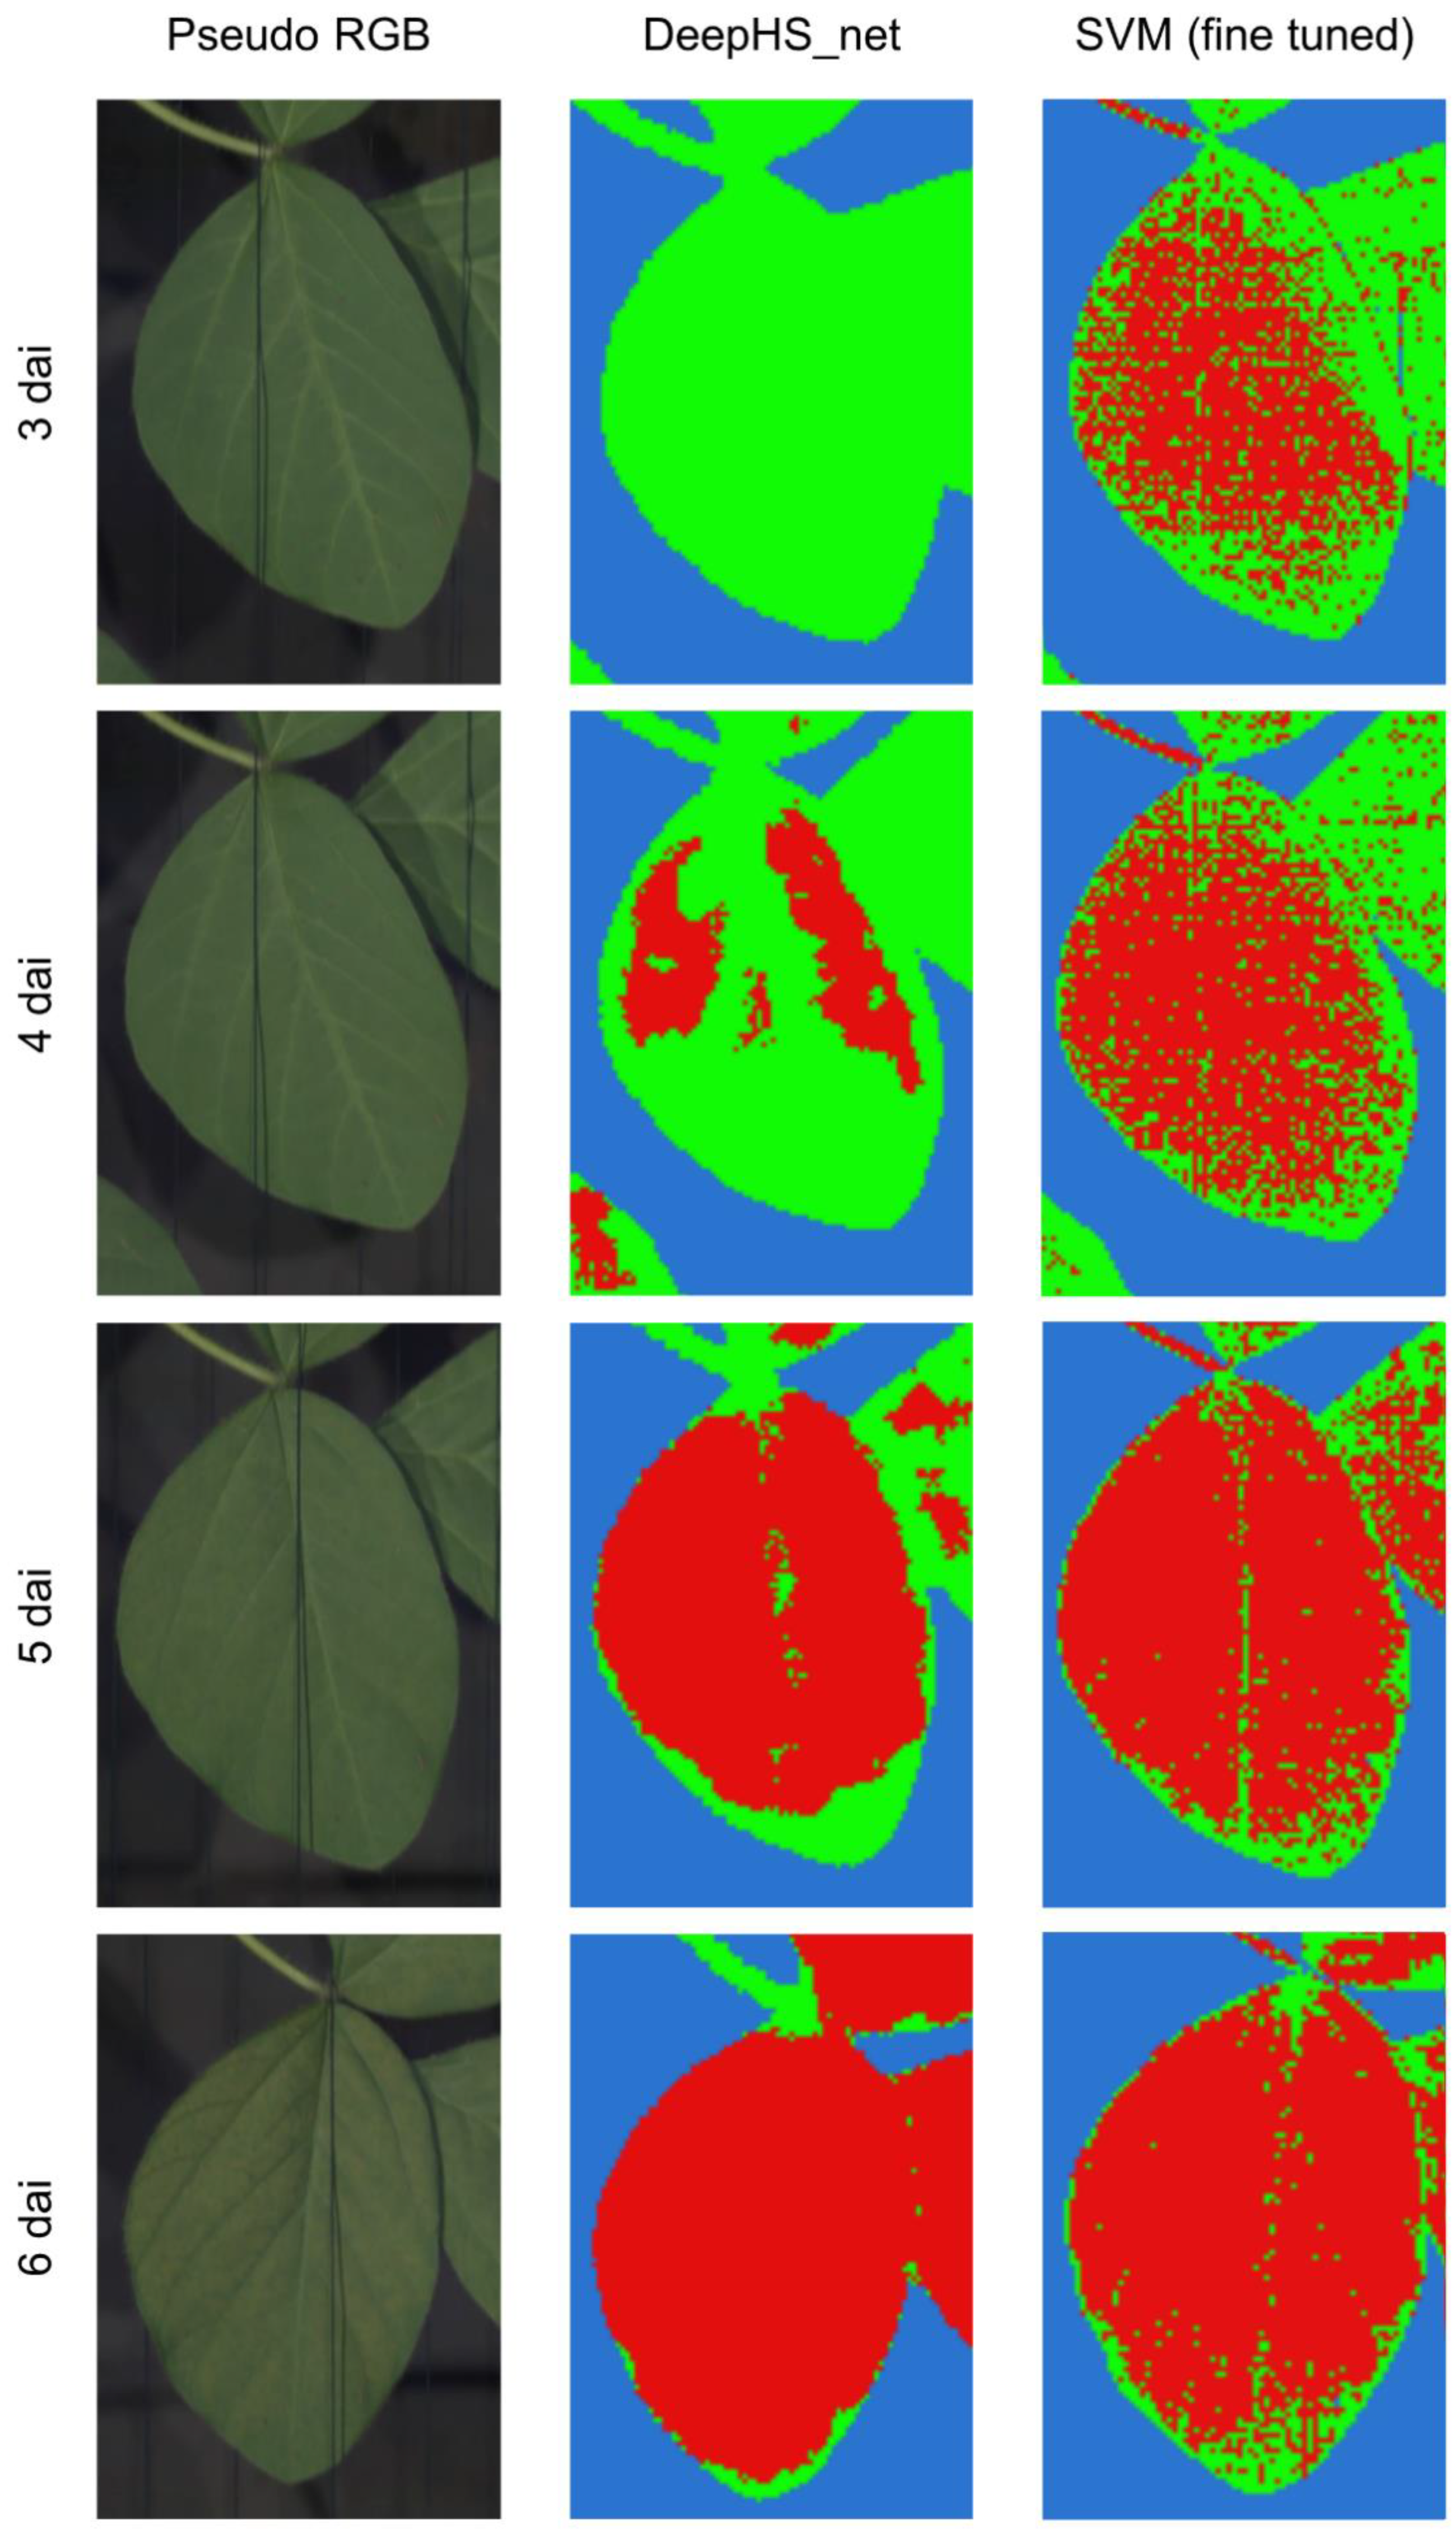
Figure 6). In experiment 2 the classification showed first results at 4 dai before visible symptoms could be observed at 5 dai and had overall comparable performance to the results in experiment 1 (
Figure 7). However, through the higher disease severity the classification results showed entire leaves as symptomatic in the later stages of the time-series measurement (
Figure 7). After manual inspection of the symptomatic leaves it was concluded, that the classification result is correct in these cases.
First disease symptoms were detected via SVM at 4 dai and 3 dai for experiments 1 and 2, respectively, one day prior to the detection via DeepHS_net (
Figure 6,
Figure 7). However, as shown in
Figure 6, pixels classified as symptomatic at 4 dai and 5 dai via SVM did not correlate with observable symptomatic areas at later stages within the time-series measurement. Only at 6 dai and thereafter, when symptoms were visible with the human eye, did the classification results start to match with the symptomatic areas of the leaves (
Figure 6). Additionally, the SVM based prediction could not reliably differentiate between symptomatic areas and leaf areas partially covered by the frame, as shown in
Figure 6 at 4 dai and 8 dai. In experiment 2 the majority of the leaves was classified as symptomatic from 3 dai on. As the entire leaves became symptomatic eventually due to the high disease severity within the second experiment the classification result does match with the observed symptomatic areas (
Figure 7). However, due to the nature of disease development, manual symptom assessment cannot be used as a proper assessment of accuracy for experiment 2. Furthermore, the SVM based classification was prone to misclassify the soybean stems as symptomatic areas (
Figure 7).
4. Discussion
In this study the potential of hyperspectral imaging in combination with data analysis methods for early detection of ASR symptoms on soybean leaves has been investigated. Furthermore, supervised machine learning and neural networks have been compared for detection accuracy of P. pachyrhizi infection when based on a limited set of annotated training data. Both machine learning and neural networks showed a comparable and high (over 99%) disease detection accuracy near the end of the time-series measurements, which served as basis for the selection of the training dataset. However, neural networks did show an improved correlation with observable symptom development in the early stages of disease progression when compared with machine learning methods despite the deliberate lack of training data for this timeframe.
The two experiments, which were performed within the study showed a typical and similar progression of ASR symptoms on soybean leaves, with first symptoms being visible to the human eye at 6 dai and 5 dai for experiment 1 and experiment 2, respectively. A notable difference is, however, the disease severity in the two experiments. While plants in experiment 1 had a relatively low disease severity at the end of the time-series measurement (10 dai), soybean leaves in experiment 2 were nearly completely covered with symptoms (
Figure 4). As both experiments used the same methodology and spore material for inoculation there is no obvious explanation for this divergence between the experiments. One possible explanation could be that experiment 1 was performed in March while experiment 2 was performed in June, which might have influenced the spore germination rate despite the plants being kept under controlled conditions in the greenhouse.
Among the applied data analysis methods, the neural networks generally outperformed the machine learning methods. The classical machine learning methods achieved satisfying results after task-specific fine-tuning of the configuration. All methods were able to reach an accuracy well over 99%. The neural networks still achieved slightly better results without the need of task-specific fine-tuning and less training data.
SVM, which is widely used in multiple studies as a supervised data analysis method for plant disease detection [
24,
25,
26], is often the first choice for this kind of classification task and also performed well in our experiments with fine-tuned configuration. As shown by the study of Thomas et al., SVM is a suitable tool for the detection of brown rust symptoms on wheat leaves for hyperspectral images [
27]. This work has shown that SVM produces comparable results for ASR symptoms on soybean. Still, DeepHS_net and DeepHS_net + HyveConv++ predicted symptoms more accurately. After manual investigation of the classification results, the authors present the hypothesis that in the case of soybean leaves, a differentiation of ASR symptoms and the plant’s leaf veins is the probable cause for the performance difference, as the respective spectral signatures of these features share high similarities (
Figure 1).
A further explanation for the difference especially in the detection accuracy of early disease symptoms is the selection of training data. While Thomas et al. selected training data specifically for optimized disease detection via machine learning methods, the current study focused on a limited set of training data from images with late disease stage and did not split the resulting training data up as described in the previous study to optimize disease detection for the specific algorithms [
27]. The high variability of spectral signatures within each of the selected classes might be more challenging for machine learning methods when compared to neural networks (
Figure 1). Each of the three relevant classes (
Figure 5) for a classification approach with results which are applicable for use in agricultural practice consists of a diverse set of plant features, disease symptom progression states and background (
Figure 1). While it would have been possible to further separate these features into distinct classes such an approach would not be well suited for practical application in phenotyping experiments or field environments. One of the biggest hurdles for the application of hyperspectral imaging in agricultural practice at the time this study is conducted is the increased data variance through environmental factors in field and greenhouse applications compared to laboratory experiments [
28,
29].
From the results of this study, it can be hypnotized, that neural networks are better suited for complex classes with high spectral data variance in plant disease detection than classical machine learning approaches. Surprisingly the neural networks, especially DeepHS_net and DeepHS_net + HyveConv++, were able to accurately classify the image data over the entire time-series of both experiments, despite a limited amount of annotated training data, which were specifically selected from late dates in the time-series measurement with a focus on experiment 2. It is acknowledged in the scientific community, that the requirement of large amounts of annotated data is one of the downsides of neural networks, which is based on the larger search space and model complexity of the neural networks. Nevertheless, in the current study neural networks were able to accurately classify the presented data over both experiments and even achieved a detection of disease symptoms before they became visible with the human eye.
The quality of the prediction results for SVM and DeepHS_net (
Figure 6 and
Figure 7) differs significantly, especially for the early stages of infection. The symptomatic areas predicted by DeepHS_net match better with the areas identified via manual rating by expert. The authors assume two components responsible for the better performance of DeepHS_net. The spatial information, which DeepHS_net utilizes, seems necessary for this task. It adds the pixel context into consideration. The second component is the higher model complexity. DeepHS_net can mimic more complex class boundaries in contrast to SVM. Current thesis is that the second component is more important than spatial information, due to the quantitative results in (
Table 1). The fully connected network has a higher model complexity than SVM but it cannot use spatial information in the pixelwise approach. Still, it outperforms SVM. Further, the performance boost between SVM and the fully connected network is more significant than the performance boost between the fully connected network and DeepHS_net. DeepHS_net, with both components, outperformed the other models within the qualitative (
Figure 6 and
Figure 7) and the quantitate evaluation (
Table 1).
The DeepHS_net based classification results showed symptomatic areas in both experiments one day before they became visible to the human eye (
Figure 6 and
Figure 7). While symptom detection prior to manual assessment is a key feature in hyperspectral imaging disease detection, which has been observed in multiple studies [
30,
31,
32], it has been shown in previous studies, that these results are difficult to achieve with supervised data analysis methodology [
28]. The main problem when applying supervised methods is that – especially under greenhouse and field conditions – it is challenging for experts to label symptomatic areas of the leaves, which do not yet show visible symptoms. As symptoms cannot be observed directly it is necessary to precisely measure the leaf in order to convey the area of the leaf to be labeled from images at later points in the time-series [
33]. Alternatively, it is possible to use unsupervised methods to detect such areas under controlled conditions and use the resulting data as annotated training data for the application of supervised methods under more complex circumstances.
Considering these facts the early detection of P. pachyrhizi symptoms through the DeepHS_net classification with annotated data from visible symptoms in a training dataset with high class variability is a promising step for the application under field conditions in agricultural practice, where a multitude of environmental factors increase the complexity of the data set.
5. Conclusions
The results of this study show that symptoms of ASR on soybean leaves can be detected accurately via analysis of hyperspectral imaging data. Despite specifically limited training data selection in late-stage disease development with high in class data variability both machine learning and deep learning methods were able to detect and identify disease symptoms with over 99% accuracy. However, the deep learning methods outperformed the machine learning methods for early disease detection applications while being able to accurately detect disease symptoms about one day before they became visible with the human eye, despite the limited set of training data which was provided. This shows the potential of hyperspectral imaging in combination with deep learning approaches for practical application in agriculture on field level, where a high data variability is imposed on the measurements due to environmental factors.
Author Contributions
Conceptualization, Stefan Thomas, Leon Varga and Nico Harter; Methodology, Nico Harter, Stefan Thomas and Leon Varga; Software, Leon Varga; Validation, Stefan Thomas, Leon Varga Ralf Voegele and Andreas Zell; Formal analysis, Ralf Voegele; investigation, Stefan Thomas; Resources, Ralf Voegele and Andreas Zell; Data curation, Stefan Thomas and Leon Varga; Writing—original draft preparation, Stefan Thomas and Leon Varga; Writing—review and editing, Ralf Voegele, Andreas Zell and Nico Harter; Visualization, Stefan Thomas and Leon Varga; Supervision, Ralf Voegele and Andreas Zell; Project administration, Ralf Voegele and Andreas Zell; Funding acquisition, Ralf Voegele and Andreas Zell. All authors have read and agreed to the published version of the manuscript.”
Funding
This research was funded by Bundesministerium für Bildung und Forschung, grant number 03VNE2051D.
Data Availability Statement
The respective datasets which have been used within the study are available on request via the corresponding author due to the large amount of data.
Acknowledgments
The authors would like to thank Heike Popovitch and Bianka Maiwald for their help in organizing materials and supervising the greenhouse conditions during the trials.
Conflicts of Interest
The authors declare no conflict of interest.
References
- United States Department of Agriculture, Foreign Agricultural Service. Oilseeds: World Market and Trade. Available online: https://apps.fas.usda.gov/psdonline/circulars/oilseeds.pdf (accessed on 14 October 2022).
- Barro, J. P.; Alves, K. S.; Godoy, C. V.; Dias, A. R.; Forcelini, C. A.; Utiamada, C. M.; de Andrade Junior, E. R.; Juliatti, F. C.; Grigolli, F. J.; Feksa, H. R.; Campos, H. D.; Chaves, I. C.; Júnior, I. P. A.; Roy, J. M. T.; Nunes, J.; de R. Belufi, L. M.; Carneiro, L. C.; da Silva, L. H. C. P.; Canteri, M. G.; Júnior, M. M. G.; Senger, M.; Meyer, M. C.; Dias, M. D.; Müller, M. A.; Martins, M. C.; Debortoli, M. P.; Tormen, N. R.; Furlan, S. H.; Konageski, T. F.; Carlin, V. J.; Venâncio, W. S.; Del Ponte, E. M. Temporal and regional performance of dual and triple premixes for soybean rust management in Brazil: A meta-analysis update. Available online: https://osf.io/g94yn (accessed on 14 October 2022).
- Childs, S.P.; Buck, J. W.; Li, Z. Breeding soybeans with resistance to soybean rust (Phakopsora pachyrhizi). Plant Breed. 2018, 137, 250–261. [Google Scholar] [CrossRef]
- Goellner, K.; Loehrer, M.; Langenbach, C.; Conrath, U.; Koch, E.; Schaffrath, U. Phakopsora pachyrhizi, the causal agent of Asian soybean rust. Mol. Plant Path. 2010, 11, 169–177. [Google Scholar] [CrossRef]
- Ralf T., V. Uromyces fabae: development, metabolism, and interactions with its host Vicia faba. FEMS Microbiology Letters 2006, 259, 165–173. [Google Scholar] [CrossRef]
- Koch, E.; Ebrahim-Nesbat, F.; Hoppe, H. H. Light and Electron Microscopic Studies on the Development of Soybean Rust (Phakopsora pachyrhizi Syd.) in Susceptible Soybean Leaves. Journal of Phytopathology 1983, 106, 302–320. [Google Scholar] [CrossRef]
- Mahlein, A.-K. Plant Disease Detection by Imaging Sensors – Parallels and Specific Demands for Precision Agriculture and Plant Phenotyping. Plant Disease 2016, 100, 241–251. [Google Scholar] [CrossRef]
- Roitsch, T.; Cabrera-Bosquet, L.; Fournier, A.; Ghamkhar, K.; Jiménez-Berni, J.; Pinto, F.; Ober, E. S. Review: New sensors and data-driven approaches—A path to next generation phenomics. Plant Science 2019, 282, 2–10. [Google Scholar] [CrossRef]
- Alisaac, E.; Behmann, J.; Kuska, M. T.; Dehne, H.-W.; Mahlein, A.-K. Hyperspectral quantification of wheat resistance to Fusarium head blight: comparison of two Fusarium species. Eur J Plant Pathol 2018, 152, 869–884. [Google Scholar] [CrossRef]
- Thomas, S.; Kuska, M. T.; Bohnenkamp, D.; Brugger, A.; Alisaac, E.; Wahabzada, M.; Behmann, J.; Mahlein, A.-K. Benefits of hyperspectral imaging for plant disease detection and plant protection: a technical perspective. J Plant Dis Prot 2018, 125, 5–20. [Google Scholar] [CrossRef]
- Mahlein, A.-K.; Kuska, M. T.; Thomas, S.; Wahabzada, M.; Behmann, J.; Rascher, U.; Kersting, K. Quantitative and qualitative phenotyping of disease resistance of crops by hyperspectral sensors: seamless interlocking of phytopathology, sensors, and machine learning is needed! Current Opinion in Plant Biology 2019, 50, 156–162. [Google Scholar] [CrossRef]
- Cristianini, N.; Shawe-Taylor, J. An Introduction to Support Vector Machines and Other Kernel-Based Learning Methods. Cambridge: Cambridge University Press, England, 2000, 93-124. [CrossRef]
- Fix, E.; Hodges, J. L. Discriminatory Analysis. Nonparametric Discrimination: Consistency Properties. International Statistical Review / Revue Internationale de Statistique 1989, 57, 238–247. [Google Scholar] [CrossRef]
- Kuo, B.-C.; Ho, H.-H.; Li, C.-H.; Hung, C.-C.; Taur, J.-S. A Kernel-Based Feature Selection Method for SVM With RBF Kernel for Hyperspectral Image Classification. IEEE Journal of Selected Topics in Applied Earth Observations and Remote Sensing 2014, 7, 317–326. [Google Scholar] [CrossRef]
- Guo, Y.; Han, S.; Li, Y.; Zhang, C.; Bai, Y. K-Nearest Neighbor combined with guided filter for hyperspectral image classification. Procedia Computer Science 2018, 129, 159–165. [Google Scholar] [CrossRef]
- Li, S.; Song, W.; Fang, L.; Chen, Y.; Ghamisi, P.; Benediktsson, J. A. Deep Learning for Hyperspectral Image Classification: An Overview. IEEE Transactions on Geoscience and Remote Sensing 2019, 57, 6690–6709. [Google Scholar] [CrossRef]
- Matsugu, M.; Mori, K.; Mitari, Y.; Kaneda, Y. Subject independent facial expression recognition with robust face detection using a convolutional neural network. Neural Networks 2003, 16, 555–559. [Google Scholar] [CrossRef]
- Pearson, K. On lines and planes of closest fit to systems of points in space. The London, Edinburgh, and Dublin Philosophical Magazine and Journal of Science 1901, 2, 559–572. [Google Scholar] [CrossRef]
- Nair, V.; Hinton, G. E. Rectified Linear Units Improve Restricted Boltzmann Machines. In Proceedings of the 27th International Conference on Machine Learning (ICML-10), Haifa, Israel, 21-24 June 2010; Available online: https://icml.cc/Conferences/2010/papers/432.pdf.
- Ioffe, S.; Szegedy, C. Batch Normalization: Accelerating Deep Network Training by Reducing Internal Covariate Shift. In Proceedings of the 32nd International Conference on Machine Learning {ICML}, Lille, France, 6-11 July 2015; Available online: http://proceedings.mlr.press/v37/ioffe15.html.
- Varga, L. A.; Makowski, J.; Zell, A. Measuring the Ripeness of Fruit with Hyperspectral Imaging and Deep Learning. 2021 International Joint Conference on Neural Networks (IJCNN) 2021, 1–8. [Google Scholar] [CrossRef]
- Varga, L. A.; Messmer, M.; Benbarka, N.; Zell, A. Wavelength-aware 2D Convolutions for Hyperspectral Imaging. arXiv preprint 2022, accepted. arXiv:2209.03136. [Google Scholar]
- Kingma, D. P.; Ba, J. Adam: {A} Method for Stochastic Optimization. In Proceedings of the 3rd International Conference on Learning Representations {ICLR}, San Diego, CA, USA, 7-9 May 2015. [Google Scholar]
- Huang, L.; Ding, W.; Liu, W.; Zhao, J.; Huang, W.; Xu, C.; Zhang, D.; Liang, D. Identification of wheat powdery mildew using in-situ hyperspectral data and linear regression and support vector machines. J Plant Pathol 2019, 101, 1035–1045. [Google Scholar] [CrossRef]
- Nagasubramanian, K.; Jones, S.; Sarkar, S.; Singh, A. K.; Singh, A.; Ganapathysubramanian, B. Hyperspectral band selection using genetic algorithm and support vector machines for early identification of charcoal rot disease in soybean stems. Plant Methods 2018, 14, 86. [Google Scholar] [CrossRef]
- Rumpf, T.; Mahlein, A.-K.; Steiner, U.; Oerke, E.-C.; Dehne, H.-W.; Plümer, L. Early detection and classification of plant diseases with Support Vector Machines based on hyperspectral reflectance. Computers and Electronics in Agriculture 2010, 74, 91–99. [Google Scholar] [CrossRef]
- Thomas, S.; Behmann, J.; Rascher, U.; Mahlein, A.-K. Evaluation of the benefits of combined reflection and transmission hyperspectral imaging data through disease detection and quantification in plant–pathogen interactions. J Plant Dis Prot 2022, 129, 505–520. [Google Scholar] [CrossRef]
- Thomas, S.; Behmann, J.; Steier, A.; Kraksa, T.; Muller, O.; Rascher, U.; Mahlein, A.-K. Quantitative assessment of disease severity and rating of barley cultivars based on hyperspectral imaging in a non-invasive, automated phenotyping platform. Plant Methods 2018, 14, 45. [Google Scholar] [CrossRef]
- Lowe, A.; Harrison, N.; French, A. P. Hyperspectral image analysis techniques for the detection and classification of the early onset of plant disease and stress. Plant Methods 2017, 13, 80. [Google Scholar] [CrossRef]
- Bauriegel, E.; Herppich, W. B. Hyperspectral and Chlorophyll Fluorescence Imaging for Early Detection of Plant Diseases, with Special Reference to Fusarium spec. Infections on Wheat. Agriculture 2014, 4, 32–57. [Google Scholar] [CrossRef]
- Khan, I. H.; Liu, H.; Li, W.; Cao, A.; Wang, X.; Liu, H.; Cheng, T.; Tian, Y.; Zhu, Y.; Cao, W.; Yao, X. Early Detection of Powdery Mildew Disease and Accurate Quantification of Its Severity Using Hyperspectral Images in Wheat. Remote Sens. 2021, 13, 3612. [Google Scholar] [CrossRef]
- Wang, D.; Vinson, R.; Holmes, M.; Seibel, G.; Bechar, A.; Nof, S.; Tao, Y. Early Detection of Tomato Spotted Wilt Virus by Hyperspectral Imaging and Outlier Removal Auxiliary Classifier Generative Adversarial Nets (OR-AC-GAN). Sci Rep 2019, 9, 4377. [Google Scholar] [CrossRef]
- Bohnenkamp, D.; Kuska, M.T.; Mahlein, A.-K.; Behmann, J. Hyperspectral signal decomposition and symptom detection of wheat rust disease at the leaf scale using pure fungal spore spectra as reference. Plant Pathol 2019, 68, 1188–1195. [Google Scholar] [CrossRef]
|
Disclaimer/Publisher’s Note: The statements, opinions and data contained in all publications are solely those of the individual author(s) and contributor(s) and not of MDPI and/or the editor(s). MDPI and/or the editor(s) disclaim responsibility for any injury to people or property resulting from any ideas, methods, instructions or products referred to in the content. |
© 2024 by the authors. Licensee MDPI, Basel, Switzerland. This article is an open access article distributed under the terms and conditions of the Creative Commons Attribution (CC BY) license (http://creativecommons.org/licenses/by/4.0/).
