1. Introduction
Several studies have been conducted on environmental disasters around the world. The growing concern about climate change is present in the daily lives of citizens. For Parker et al. (2023) there is an escalating demand for more research, information, and action to address the complications around drought assessment presented by a changing climate. A study by Burke et al. (2015) simulates the effects of climate change on different continents. Considering the non-linear effect of historical temperature, they found that rich and poor countries behave similarly, indicating that it cannot be assumed that if a country becomes richer it will suffer less. According to the authors, projections using linear and non-linear approaches diverge and unmitigated warming could reshape the global economy, due to the strong negative correlation between income and temperature. Hot and poor countries will likely suffer greater reductions in growth, increasing global inequality.
Rio Grande do Sul (RS) is a state that has been suffering from several natural disasters, from severe droughts to floods. According to the Governo do Estado do Rio Grande do Sul (2024), droughts accounted for most natural disasters in RS. Floods came in second place. Droughts generate the greatest private losses and impose losses on the state's revenue. The State Government prioritized in its medium-term planning for 2024-2027 the "overcome drought" action to mitigate the effects of this natural disaster. It aims to expand access to water, improve rural infrastructure and the management of available resources, highlighting the initiative to protect and restore watersheds.
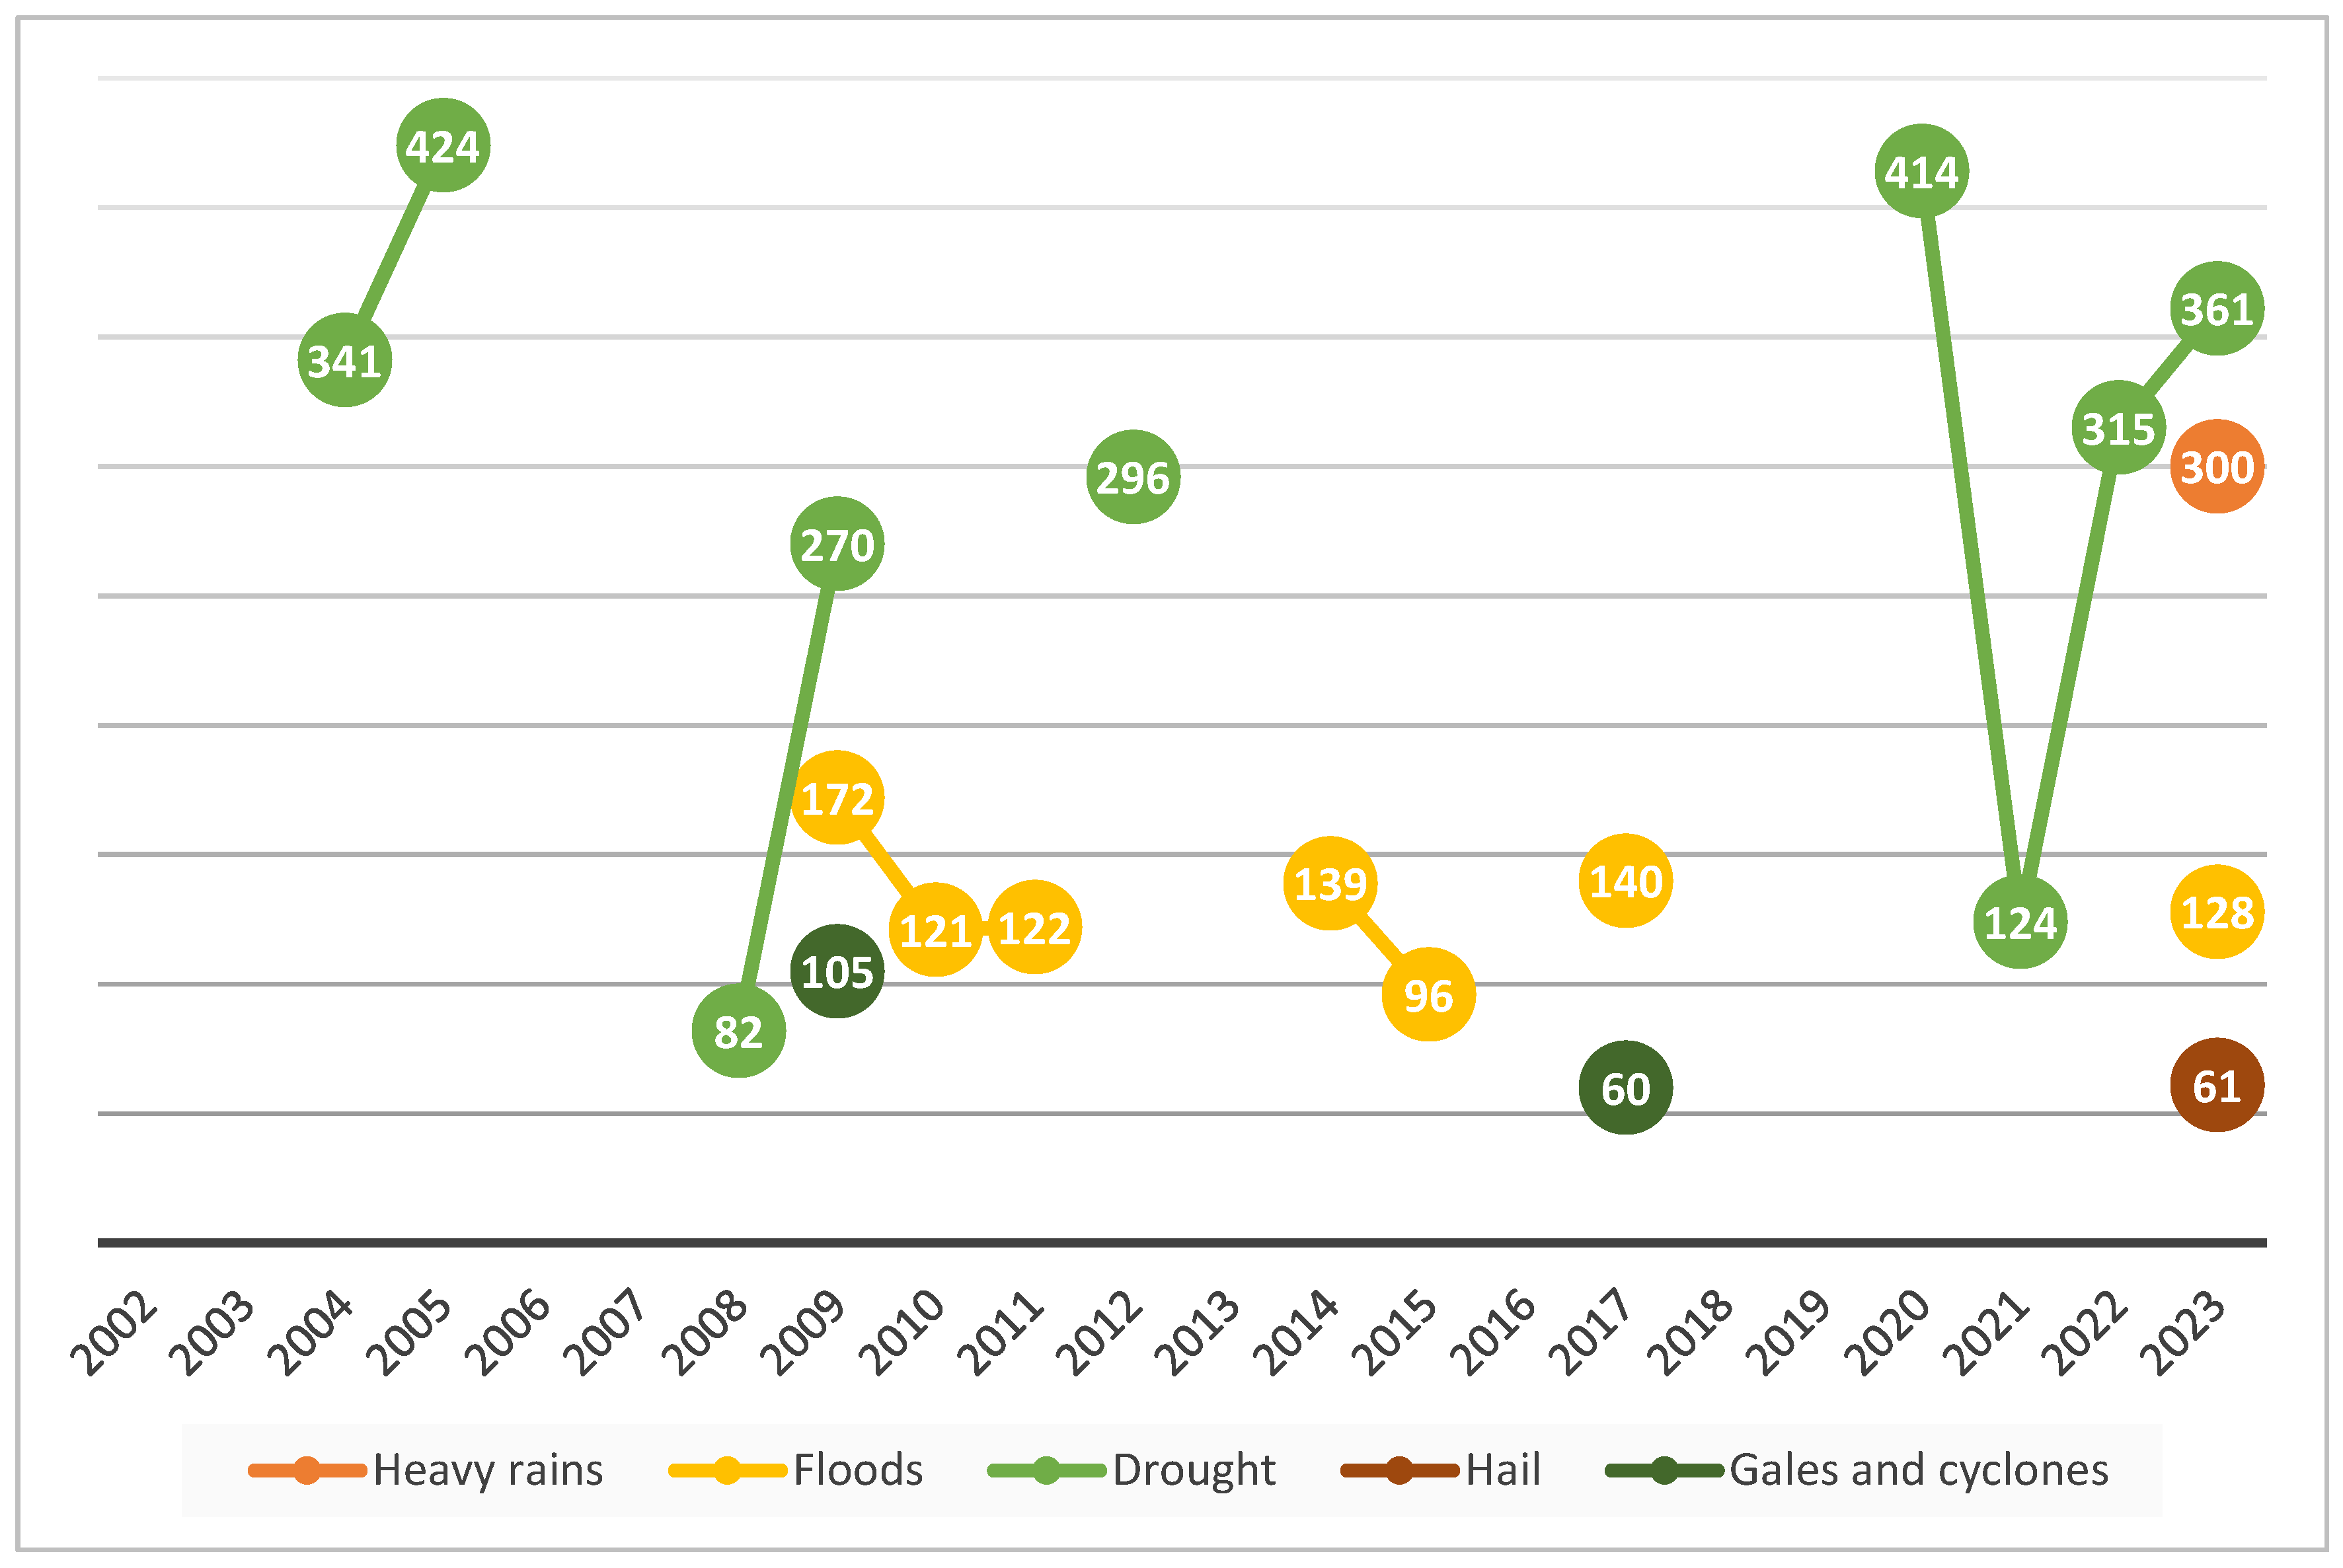
Figure 1 illustrates types of climate events from 2002 to 2023 in RS. We can see a prevalence of drought events, with the years 2004, 2005, 2009. 2012, 2020, 2022 and 2023 affecting more than half of the state's municipalities. Floods and heavy rains are the second most relevant type of event. The consequences of the types of disasters are diverse.
The following table shows that agriculture is the sector that presents the greatest losses from 2010 to 2023 (78%), equivalent to BRL 75.2 billion. Livestock is the second sector with the greatest losses. Regarding the type of events, droughts are the ones that generate the greatest losses, around 80%. And the majority of losses are private losses (97%), with only a small part being public losses (3%). The droughts that occur in RS are characterized by not causing loss of human lives.
In addition to the immediate effects, Skidmore and Toya (2002) analyze the long-term effects of natural disasters. According to the authors, the risk of natural disasters reduces the expected return on physical capital, but also serves to increase the return on human capital, which may be replaced by investment in human capital. Disasters can also stimulate the updating of the capital stock and the adoption of new technologies, generating an improvement in the total productivity factor. Skidmore and Toya (2013) also studied whether the government's fiscal structure is important in preventing disaster-induced fatalities. Their analyses provide evidence that more decentralized countries, measured by the proportion of subnational spending in relation to total government spending, experience fewer deaths in events. For the authors, the benefits are accumulated through pre- and post-disaster management activities, highlighting the importance of zoning, police and fire services, transportation, and health services, which can play a role in reducing loss of life. Studies show that decentralization in the absence of sufficient levels of human capital may be ineffective. According to Ter-Minassian (1997), there is a tendency to decentralize public spending to subnational levels (state and local), and this is expressed beyond federated countries. Second the World Bank (2014), a series of mechanisms are available to deal with losses due to natural disasters, from the use of budgetary resources, the use of disaster funds, or the issuance of catastrophe bonds, which function as insurance.
In 2023, the Brazilian federal government issued its first sovereign bond aimed at sustainability, in the amount of US$ 2.0 billion. The objective of this fundraising is to provide resources for public expenditures that promote sustainability, mitigate climate change, conserve natural resources and contribute to social development (Ministry of Finance, 2024).
Noting that among the natural disasters that generate the most losses in RS are severe droughts, which occur at a frequency of 2 to 3 times per decade. A state, such as RS, which has agriculture as one of its greatest economic potentials, feels the weight of these events equally in relevant magnitude. A study by Fochezatto and Grando (2011) evaluated the effects of the 2007/2008 droughts on the economy of RS, using an input-output model, based on the premise that the lack of rainfall impacts the agricultural sector, which is relevant in itself and also due to its capillarity in the economic matrix. The results indicated that, in the absence of drought, the GDP of the state of RS could have increased by 2.1 percentage points in the growth rate beyond what was observed, with more than half of the impacts resulting from indirect effects on the industry and services sectors. Analyzing the 2008 crisis in Brazil, de Cezaro Eberhardt and Fochezatto (2024) using the statistical method of survival analysis suggest that the presence of workers with a higher level of education and location in a metropolitan region are two characteristics that contribute to a rapid economic recovery. Tonetto et al. (2024) apply the survival analysis to study the small business in RS from 2017 to 2023, period of Covid-19 pandemic, and the results show the worst survival rate in the metropolitan region and in commerce.
Seeking to better understand this phenomenon, which is so important in the economy of the state of RS and very common in other regions and countries, this article aims to analyze the duration of droughts in the municipalities in their last three events, in the years 2020, 2022 and 2023, measuring their return time to normality. In these three years, the losses reported in the private sector exceeded 18.5 billion reais each year (USD 3.8 billion (Exchange rate 1 USD = BRL 4.85, 01/01/2024.)). These values are equivalent to 2.9% of the 2023 GDP, estimated at BRL 640 billion. In this sense, we use survival analysis as a method, using the Kaplan Meyer procedure, complemented by the Cox procedure. Data from invoices issued by companies in each municipality are used, computing their total monthly value for monitoring purposes. In addition to this introduction which describes the natural disasters in RS this article consists of section 2 that presents a review of the literature about drought.
Section 3 describes the methodological procedures used in the study.
Section 4 presents and analyzes the results obtained. The final section presents the study's conclusions.
2. Drought Literature Overview
According to Crausbay et al. (2017), integrating the human and natural dimensions of drought is a fundamental step to analyze the increasing risk of drought. For the authors, existing definitions of drought describe the impacts of meteorological drought (agricultural, hydrological and socioeconomic) viewing drought through a human-centered lens, partly forgetting the ecological dimensions of drought. Crausbay et al. (2017) define the term ecological drought as an episodic deficit in water availability that pushes ecosystems beyond vulnerability thresholds, impacting ecosystem services, and natural and human systems. Vicente-Serrano et al. (2020) analyze the effects of drought on environmental systems, highlighting that drought has complex environmental effects and affects different systems (e.g. soils, air, vegetation and forests, and wildlife). They find that most environmental systems show strong resistance and resilience to drought events, and that the effects of drought are generally temporary.
Although climate change is a global phenomenon, poor countries experience its effects more severely due to their greater dependence on natural resources and their limited coping capacity. Silva and Kawasaki (2018) analyze the relationship between disaster risk, poverty and vulnerability. The findings show that households that depend heavily on natural resources for their livelihoods and those with low incomes suffer greater losses from floods and droughts. They suggest encouraging poorer households to seek at least some portion of their income from non-agricultural enterprises. According to Motha (2011), the United States has experienced more than 90 climate-related disasters in the past 30 years, with total damages exceeding $1 billion. This calls for mitigation measures and adaptation strategies to develop long-term risk management plans. Preparedness strategies should include alternatives to current agricultural management schemes in certain regions. Among the measures the author cites: a database of climate extremes and their impacts, including damages and costs, to help our understanding of these events, as well as preparedness plans with comprehensive, long-term financial and insurance strategies; crop insurance, emergency relief safety net.
For Parker et al. (2023), in terms of drought assessment and diagnosis, the words observation and monitoring are sometimes used interchangeably. Observation often describes the action or process of measuring or recording something to collect data about it, such as a rainfall observation. Monitoring often describes the observation of the progress or impacts of drought over time. The use of satellite and radar observations can support modeling analyses that assimilate the data to produce soil moisture analyses, and even measure environmental changes, supporting inferences about drought impacts. Despite these tools, major gaps remain. Impact reporting relies on the volunteers willing to submit their reports, and many socioeconomic impacts go unreported.
According to Ding et al. (2010), drought is the most common natural disaster in the United States, and analyses of its impacts generally focus on short-term loss of income and production. The author emphasizes the importance of other impact studies, including interdisciplinary ones. Wittwer and Griffith (2011) using dynamic computable general equilibrium model analyze the prolonged drought from 2006 to 2008 in south-eastern Australia. the drought reduced real GDP in some small regions by up to 20 per cent. Irrigation water trading and farm factor movements alleviate losses. The drought results in an estimated 6000 jobs being lost across the southern basin. Ten years later job numbers remain 1500 below forecast. Edwards et al. (2019) measure the extent to which drought affects a range of economic, health and social outcomes, based survey of 8,000 adults living in agricultural areas of Australia. Drought is found to have a substantial negative economic and health impact on farmers and others employed in the agricultural sector, especially on mental health. The authors found some evidence that groups not employed in agriculture are also adversely affected.
Seeking a broader scope of analysis, Pérez y Pérez and Barreiro-Hurlé (2009) estimated the direct and indirect economic impacts of a drought episode in the Ebro River Basin, one of the largest rivers in Spain. An input-output framework was used, the direct impacts were assessed for agriculture and energy production, and the indirect impacts on broader economic activity are derived for the entire river basin. The results show that this climatic episode resulted in a direct loss of gross value added of over €482 million in the two direct sectors, with an additional induced loss of output of €377 million, which also resulted in a reduction of over 11,000 jobs.
According to De Nys et al. (2016), governments and donors generally adopt a reactive approach, that is, after the drought event, and includes impact assessment, response actions, recovery and reconstruction to restore the affected region to its pre-disaster state. Little attention is given to risk management, which includes proactive actions that aim to avoid or reduce future impacts, from early warning, monitoring, planning, mitigation and the development of risk-based drought management policies. For De Nys et al. (2016), future droughts will exert greater pressure on water resources, as they are accentuated by climate change and collide with the increased demand for water resulting from population growth and economic development.
A study about natural disasters in RS, divide by types of events and analyzed by the 9 Regional Civil Defense and Protection Coordinations (CREPDEC). Droughts are divided into two types: short (estiagens) which is the result of the lack, reduction or delay of rainfall expected for a given period, or longer (secas) which causes hydrological imbalance. In RS were recorded in almost every year. The El Niño and La Niña phenomena cause several changes in climate dynamics, and in RS, out of every five years with the highest occurrence of drought, three were under the influence of La Niña (2009, 2012 and 2020). Between 2017 and 2021, the highest number of occurrences occurred in the first six months of the year. The highest was in the month April, with 118 occurrences, followed by March (Secretaria de Planejamento, Governança e Gestão, 2022).
Many studies use mesoregions as a framework for analysis. These are defined in seven mesoregions in RS by the Brazilian Institute of Geography and Statistics. For Olalde and Haas (2017), the agrarian structure played an important historical role in the socioeconomic formation of the regions, but due to urbanization, social programs and policies, and the macroeconomic situation, a homogenization of the indicators began. The authors reach this conclusion by comparing two RS mesoregions with distinct initial characteristics: the southwest where the Pampa biome prevails, characterized by grasses, creeping plants, shrub-tree forests, rugged topography with shallow and infertile soils, and extensive rural development; and the northwest, which is composed of small and medium-sized properties, with a diversified development dynamic, yet remains largely dependent on the Primary Sector. Hoffman (2007), analyzing the land structure, finds a strong relationship between the inequality of the land structure and the health indicators of the microregions, on the infant mortality rate and life expectancy at birth, and not specifically to people directly dependent on agriculture or living in rural areas.
Coase's (1960) reflection illustrates well the effects of choices on production and the understanding that the right to do something that has a harmful effect (such as the creation of smoke, noise, smells, etc.) is also a factor of productivity. The cost of exercising a right (of using a factor of production) is always the loss suffered elsewhere as a result of exercising that right, which may be the possibility of breathing clean air. According to the author, it would be desirable for actions to be taken only when what is gained is worth more than what is lost. For Bresser Prereira (2006) economic development or growth is a historical phenomenon that depends on a national development strategy.
Freire-González et al. (2017) highlights the importance of properly assessing all factors that contribute to the economic impacts of droughts, such as: the importance of the level and composition of hydraulic capital; the dispersion of economic impacts across different activities and economic agents; the temporality of drought events; among others. For the authors, the effects of droughts in industrialized countries do not affect human capital, but this is not the case in less developed countries, where droughts can be associated with malnutrition and loss of life. Droughts have a specific temporality, and this factor is usually more important than in other natural hazards when assessing economic impacts. Jenkins et al. (2021) simulate water scarcity using a dynamic model of national water systems to assess the overall risk of drought to the economy. The study focuses on England and Wales, where the water supply system is considered to be under stress. In this study indirect losses are shown to be almost 3x greater than direct losses.
Given the possibility of more persistent and recurrent droughts, some crops may expand. According to Burns et al. (2010), cassava is the sixth most important crop in terms of annual global production and an important staple food for over 800 million people, mainly in Africa, Asia, the Pacific, and South America. It benefits both smallholders and large-scale plantations due to its ability to tolerate dry conditions and easy and low-cost propagation. They conclude that its cultivation has the potential to help many countries achieve food security in the face of climate change. Shiru et al. (2018) assessed the impacts of drought in Nigeria and the results showed that recent climate changes were responsible for the increase in drought occurrences with smaller areal extents. Investigating long-term drought trends and spatial variability of drought in China, Ding and Peng (2020) found that, compared with the past (1901–2017), the climate in the future (2018–2100) will tend toward significant droughts, although both periods showed a high spatial heterogeneity across China.
3. Methodology
One of the most applied statistical techniques is the Survival Analysis (SA), especially the Kaplan-Meier estimator (Kaplan and Meier, 1958) and the Cox model (Cox, 1972). The response variable for this type of analysis is the time elapsed until the occurrence of an event of interest, which is called the failure time. It is large used in medicine to evaluate different treatments in a group of patients under observation. In this study the event being studied is the way out of the economic crisis of drought by municipalities of Rio Grande do Sul. Therefore, in this study, the occurrence of the event, or failure, is considered a positive factor, essentially a recover. In general, SA aims to determine the probability of survival and the risk of event of a group of individuals, having as determinants time itself and variables called covariates (Colosimo and Giollo, 2021). According to Carvalho et al. (2011), SA allows dealing with problems in which the occurrence of the event is not constant over time. The main characteristic of the database is the presence of censorship, in this special case, it is the companies that survived. The Kaplan-Meier method may be limited when there is a small sample, when there is competitive censorship or when looking at the long term. The method also does not use covariates, which is why the COX procedure is additionally applied. The Cox regression will allow us to identify which covariables increase and which decrease the chance of the event occurring. According to Govindarajulu and D’Agostino (2020), the assumption that censorship must be independent of the real time of the event has been significantly underestimated in survival analyses. The author highlights the evolution that the Cox model brought with semiparametric analysis.
In this study, our interest is to verify the duration of the economic crisis in the municipalities affect by the drought. We use the limit of 8 months to censure variables because only few municipalities are above this number, and the average plus two standards deviations is 7,2 (2023). The number of variables censured were 3, 9 and 16, in the years of 2020, 2022, and 2023 respectively. To determine the number of months in which each municipality remained in crisis, we consider that the month of beginning would be when the total value of invoices issued in the municipality, both directly to companies and to consumers, measured as a 12-month monthly moving average, with the month evaluated as the last month of the series, showed a drop. The threshold point adopted was a 15% drop in the month under analysis, which would be equivalent to a drop in the moving average of 1.25%, and this is the criterion applied to all months. After that, the maximum time that each municipality remained in crisis is verified.
The data used in this study are from the Revenue Agency of RS, covering the period from 2019 to 2023. We focus in the last three droughts that occurred recently and that have great impact in terms of municipalities hit, i.e. in the years of 2020, 2022 and 2023. The years are analyzed separately. The
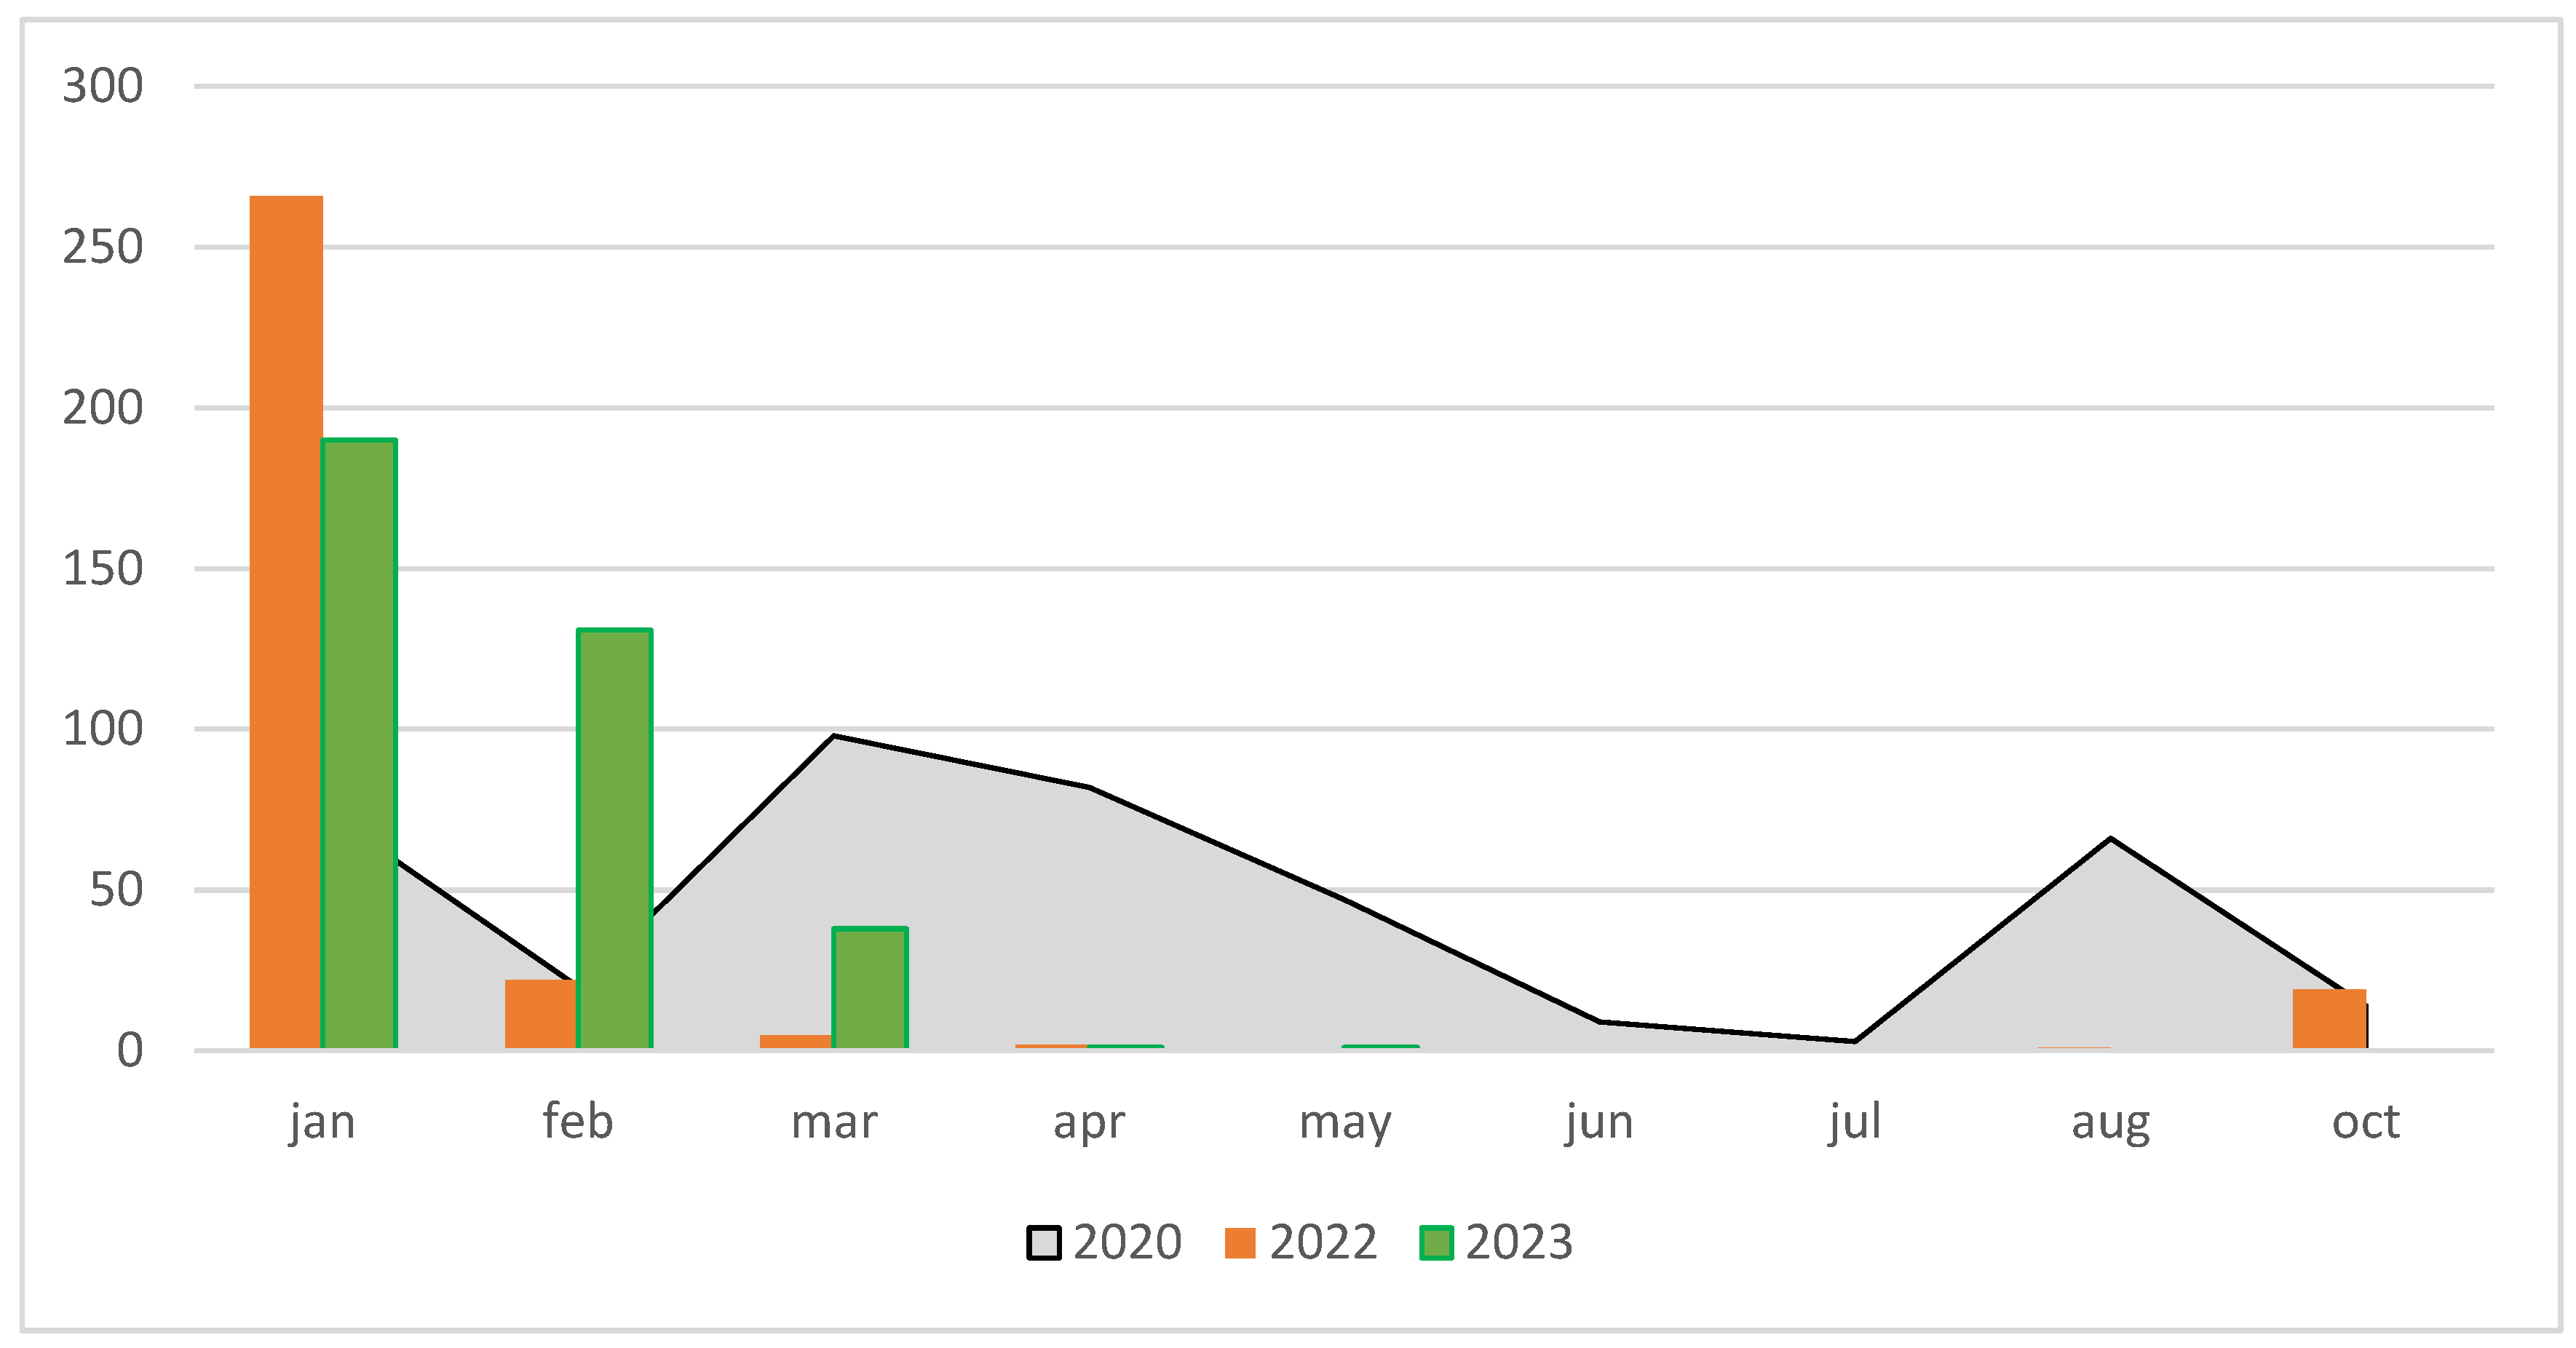
Figure 2 below shows that a standard pattern in 2022 and 2023, that is a drought in the summer. The 2020 is an unusual drought that occurs along the year. Yet, the 2020 is the year that a COVID-19 emerge, and this can have the effect of hindering recovery.
In the first analysis there are three size ranges of municipalities that are based in number of habitants. The first bracket comprises the municipalities with less or equal than 10,000 habitants, and the second is composed by municipalities from 10,001 to 99,999 habitants, and the third band are made up of those with 100,000 habitants or more. The second form of analysis is based on economic activity which are condensed into four main sectors (Agriculture, Livestock, Industry and service. The classification is based in the main sector of each municipality. The last analysis focuses on geographic location, composed by seven Meso-Regions. In the Cox's semiparametric technique, the effect of the size, mesoregion, and other covariates are tested.
The survival function is defined as the probability of an observation not failing until a certain time t, that is, the probability of an observation surviving time t. This is written as:
where: S(t) is the survival function; t is the non-negative random variable; T is the maximum time that t can reach. The cumulative distribution function is defined as the probability of an observation not surviving time t, i.e.
The survival function is equal to 1 at the beginning of the period, and as time passes it tends to decrease or remain constant. The failure rate function λ(t) is useful for describing the lifetime distribution of companies, as it describes the way in which the instantaneous failure rate changes over time.
Survival analysis refers to the probability of a municipality economy recover after a certain time, if formulated by risk analysis, it refers to the risk of a municipality economy emerge from the drought disaster and recover. The function can be represented according to strata originating from the classification of covariates, thus being able to evaluate the survival of subgroups, which may present important variations. The Log-rank hypothesis test is used to evaluate these subgroups. The null hypothesis is that the risk is the same for each extract.
To estimate the effects of covariates, COX modeling is used. This model adopts proportional risks. It was tested by graphical approach and the Shoenfeld Residuals Test (Shoenfeld, 1982). The variables used in this model are described in
Table 2.
The
Table 3 shows that in large cities the service sector predominates, while in small cities agriculture is the main economic activity. As for the Mesoregions, the Nordeste and Centro Oriental regions are balanced. The Centro Ocidental, Noroeste and Sudoeste regions are based on agriculture. The Sudeste is based on agriculture and services, and the Metropolitana region is dominated by the service sector, followed by industry. Livestock farming is concentrated in only 3 regions: Central Oriental, Nordeste and Noroeste.
4. Results and Discussion
The descriptive analysis of municipalities in crisis during the three recent droughts reveals that at least ¼ of the municipalities are not affected, and that at least 30% of those that enter into crisis return to normal within 1 month. Rapid recovery, that is, within 3 months, is observed in 75% of the municipalities. The maximum time of permanence with low economic activity can reach 10 to 15 months, but it affects very few municipalities. It is important to highlight that the number of municipalities in crisis according to the method used in the study was very close to the number of officially recognized municipalities, which validates the criterion used.
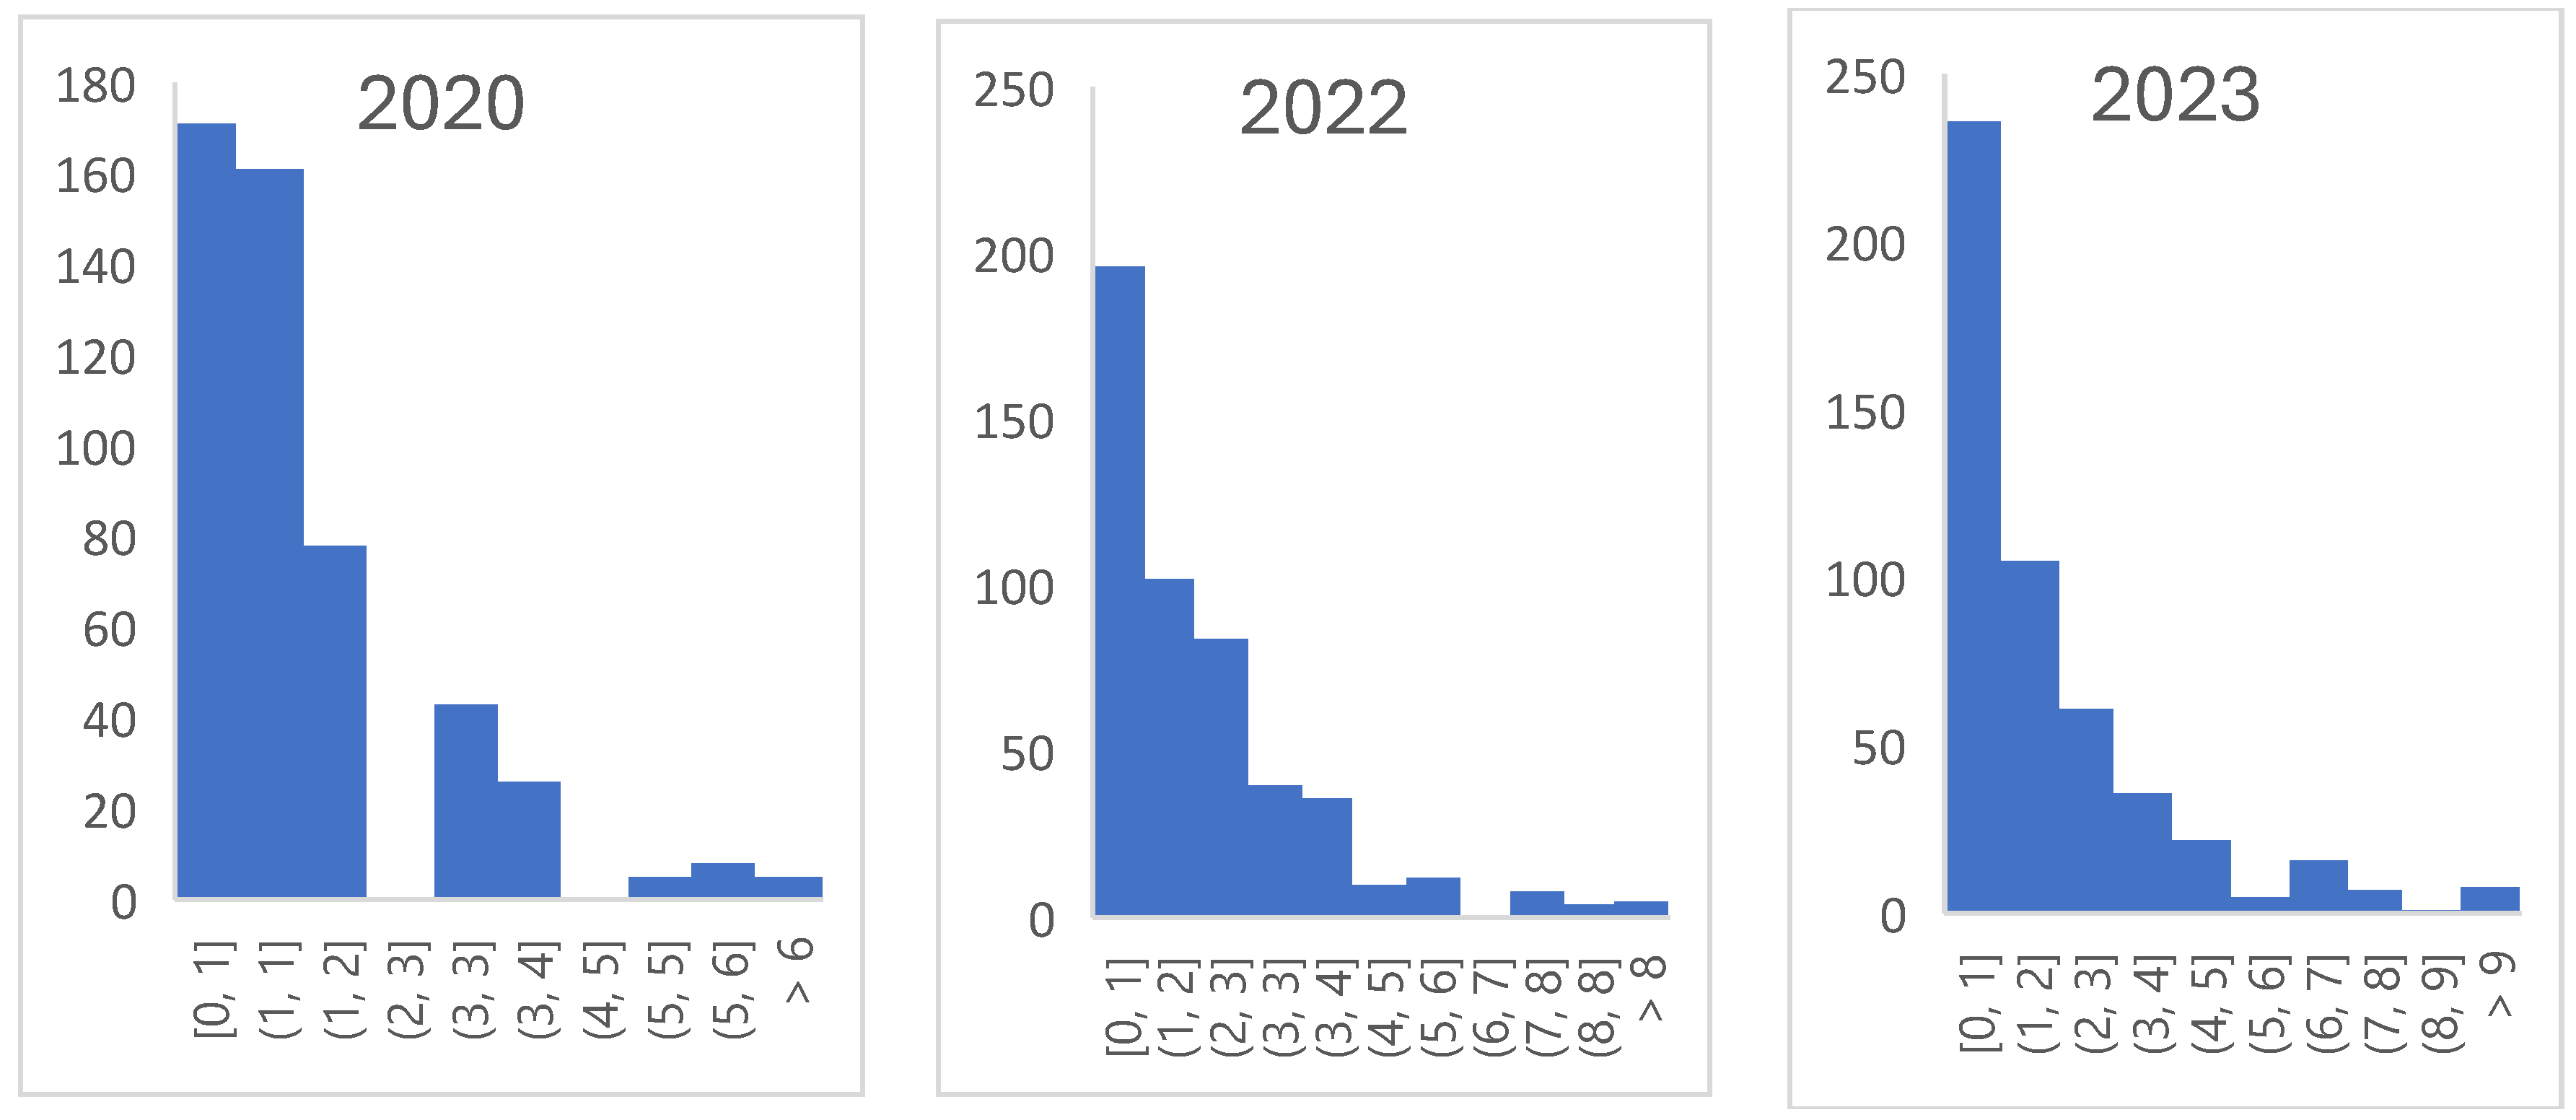
Figure 3 shows the histograms for each year, which confirms the data in
Table 4, in which case censorship has not yet occurred in both years. The histograms allow us to visualize the rapid recovery of economic activity in months measured by the total value issued in invoices for products and services subject to ICMS tax.
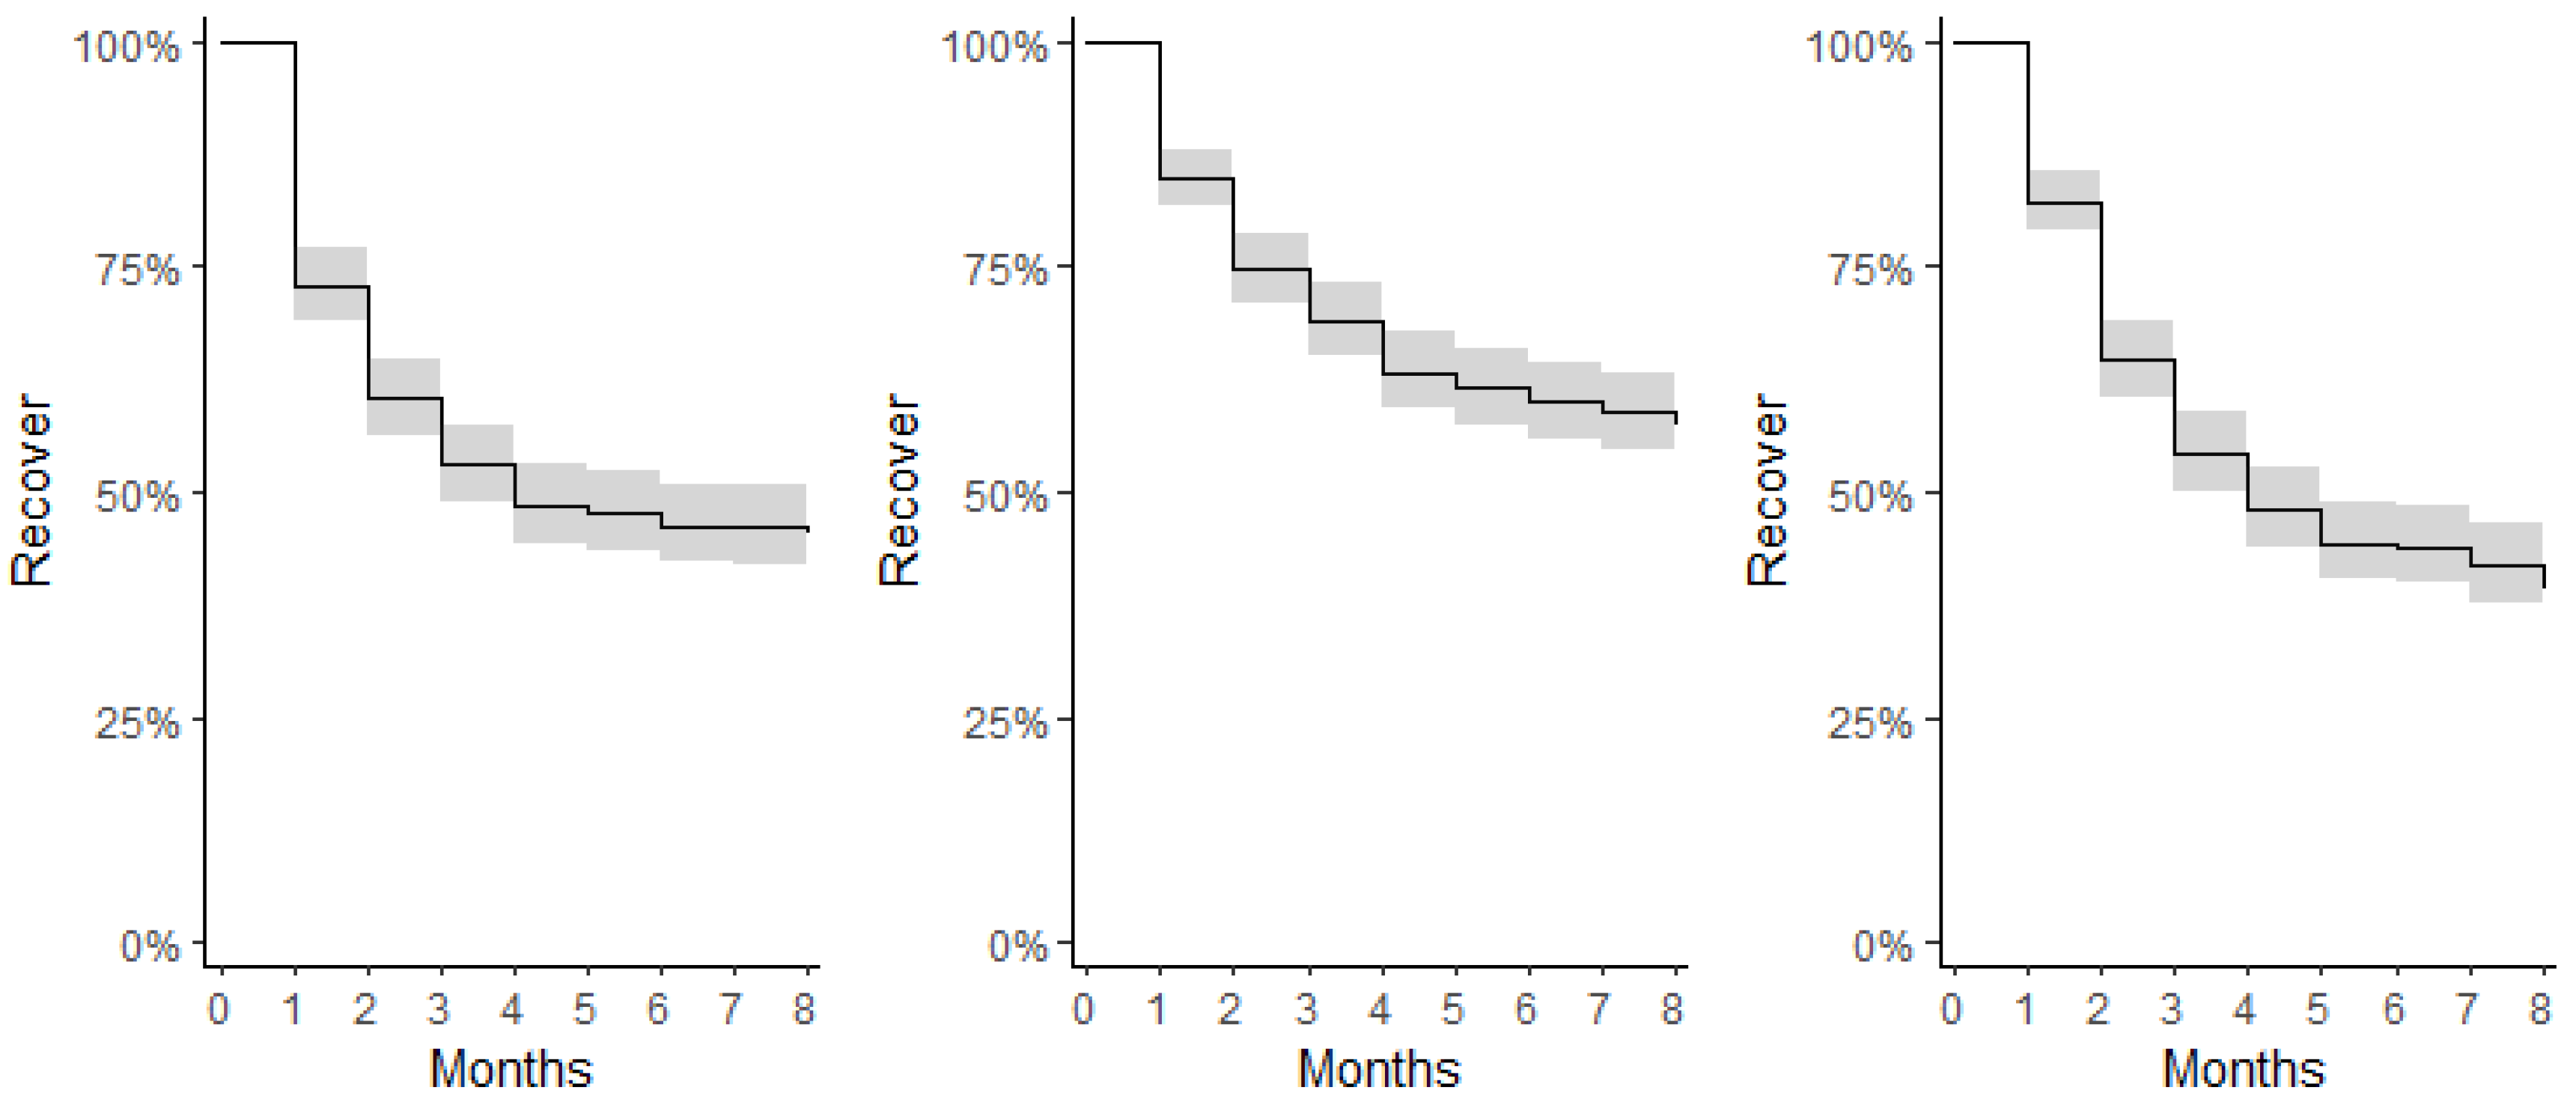
The global analysis by year using the Kaplan-Meier method shows that around 50% of municipalities are not experiencing a crisis, even validating that less municipalities entered a crisis in 2022. In 2020, we had a large percentage of recovery in the first month, while in 2023 we have two important stages of recovery in months 1 and 2. The graphs in this analysis need to be read in combination, with the lower part representing the municipalities that did not experience a crisis or were censored, and the upper part representing the first months will show whether the recovery was faster.
Figure 4
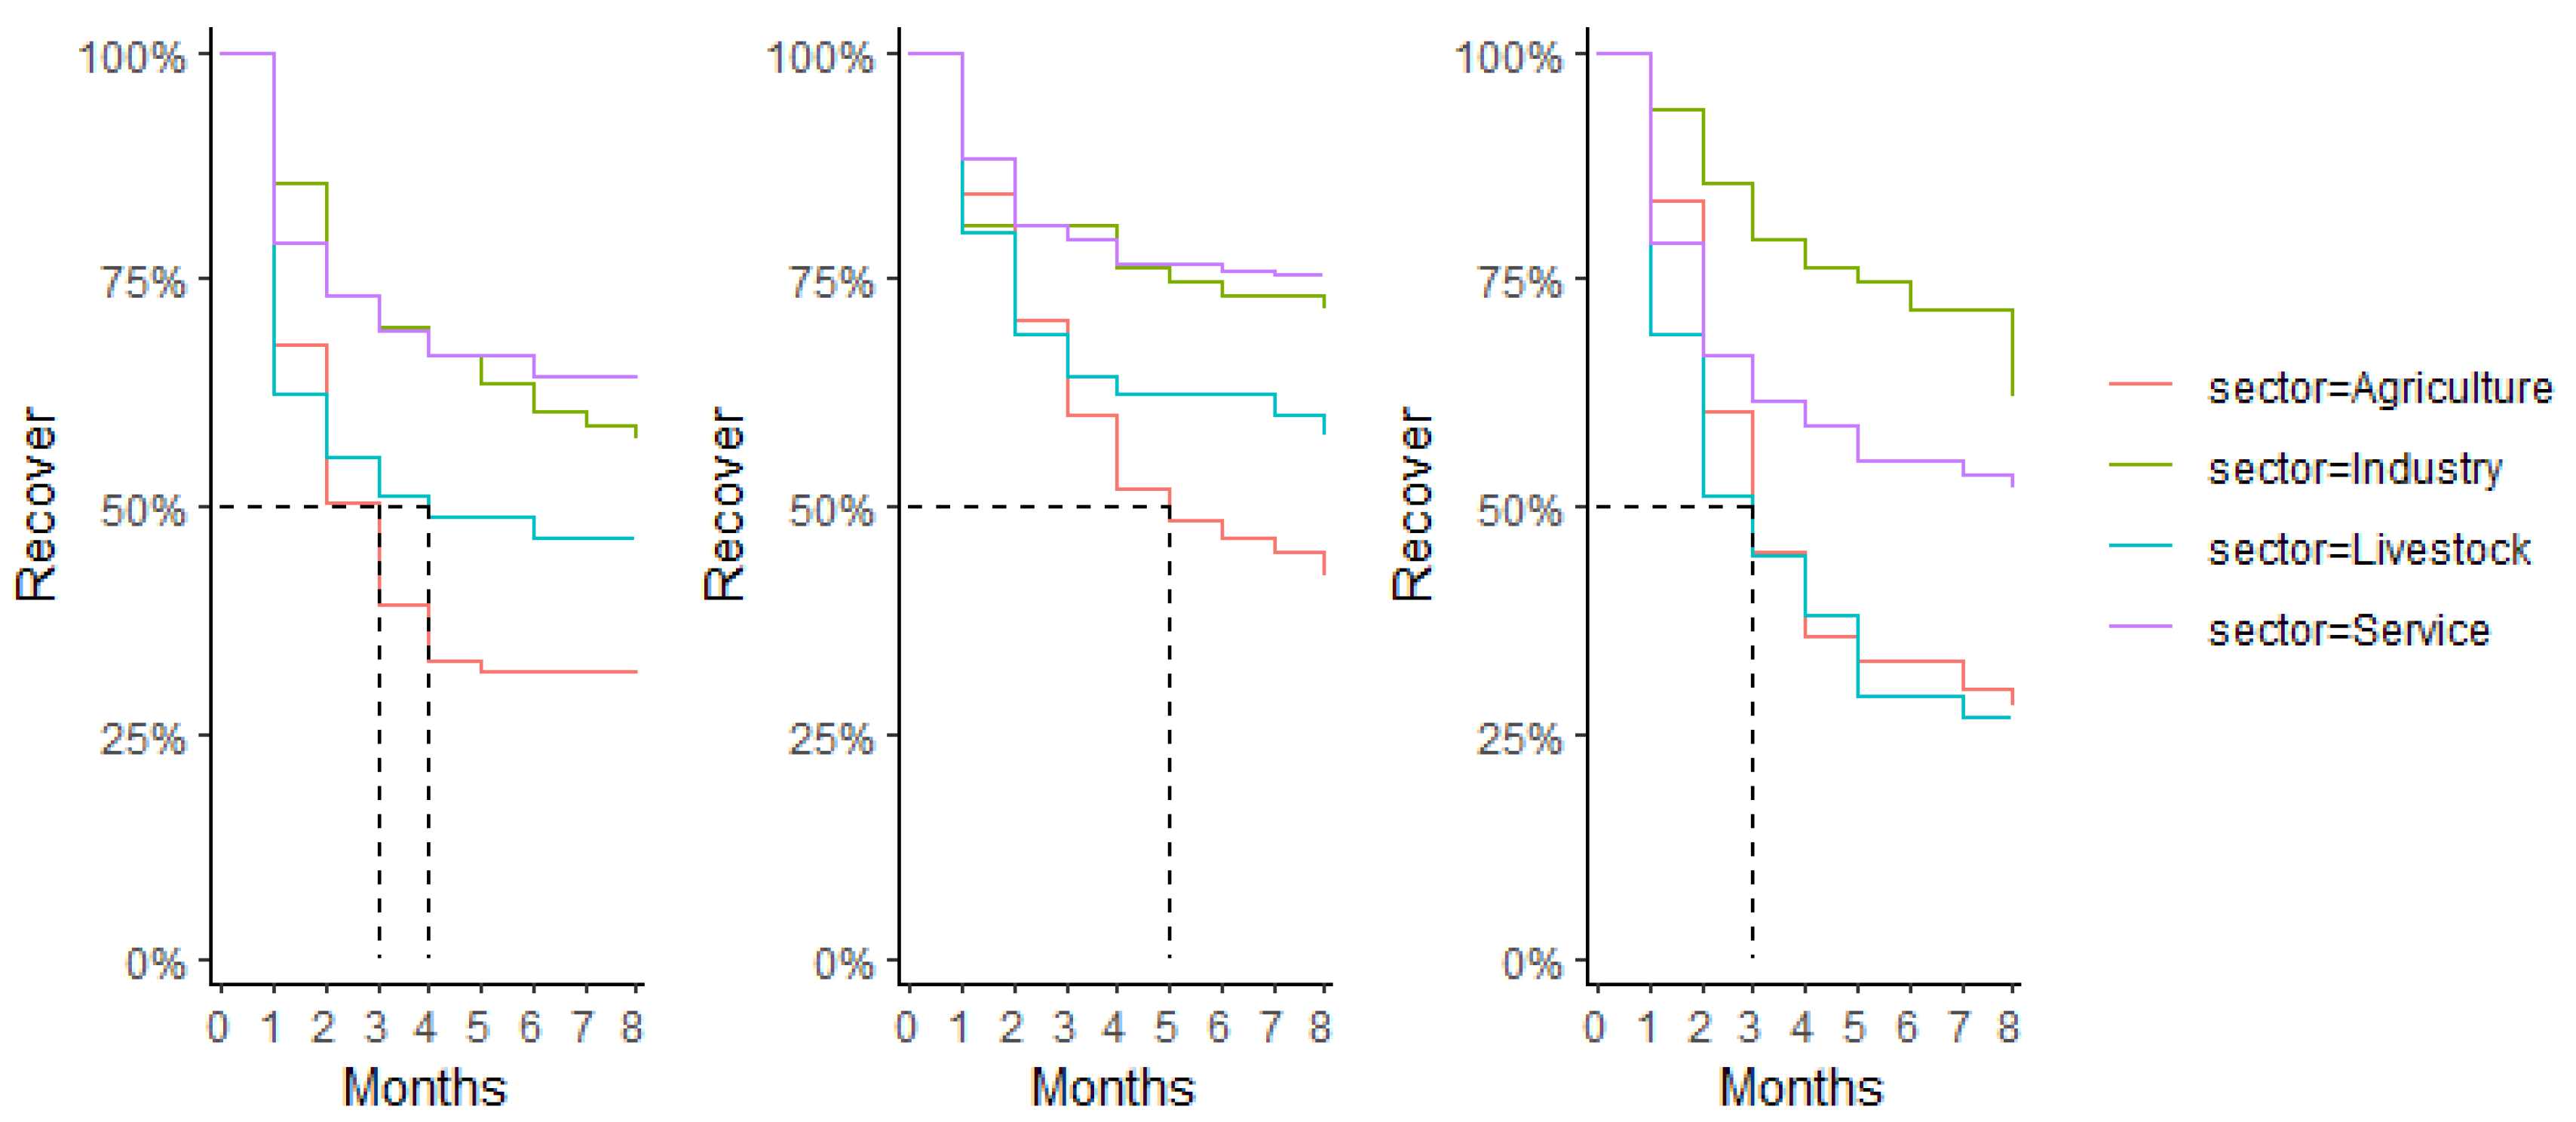
The analysis of municipality recover by main sectors of economic activity shows a recover in four sectors in each year (
Figure 5). In all years the impact of the has been greater on agriculture and livestock in terms of time to recover. In the year of 2023 the livestock is the sector that has the worst time to recover. Generally, the municipalities where the service sector or industry are the main activities tend to be more resilient. In 2023, the service sector was more affected than industry. It is important to emphasize that the effects of droughts may be felt with some delay since they tend to affect agriculture and livestock farming more. Agriculture is characterized by the harvest period, which in the case of Rio Grande do Sul, where the main product is soybeans, occurs between March and May. The databases indicate the month of April as the main month in which the effects begin with the highest occurrence of time = 1.
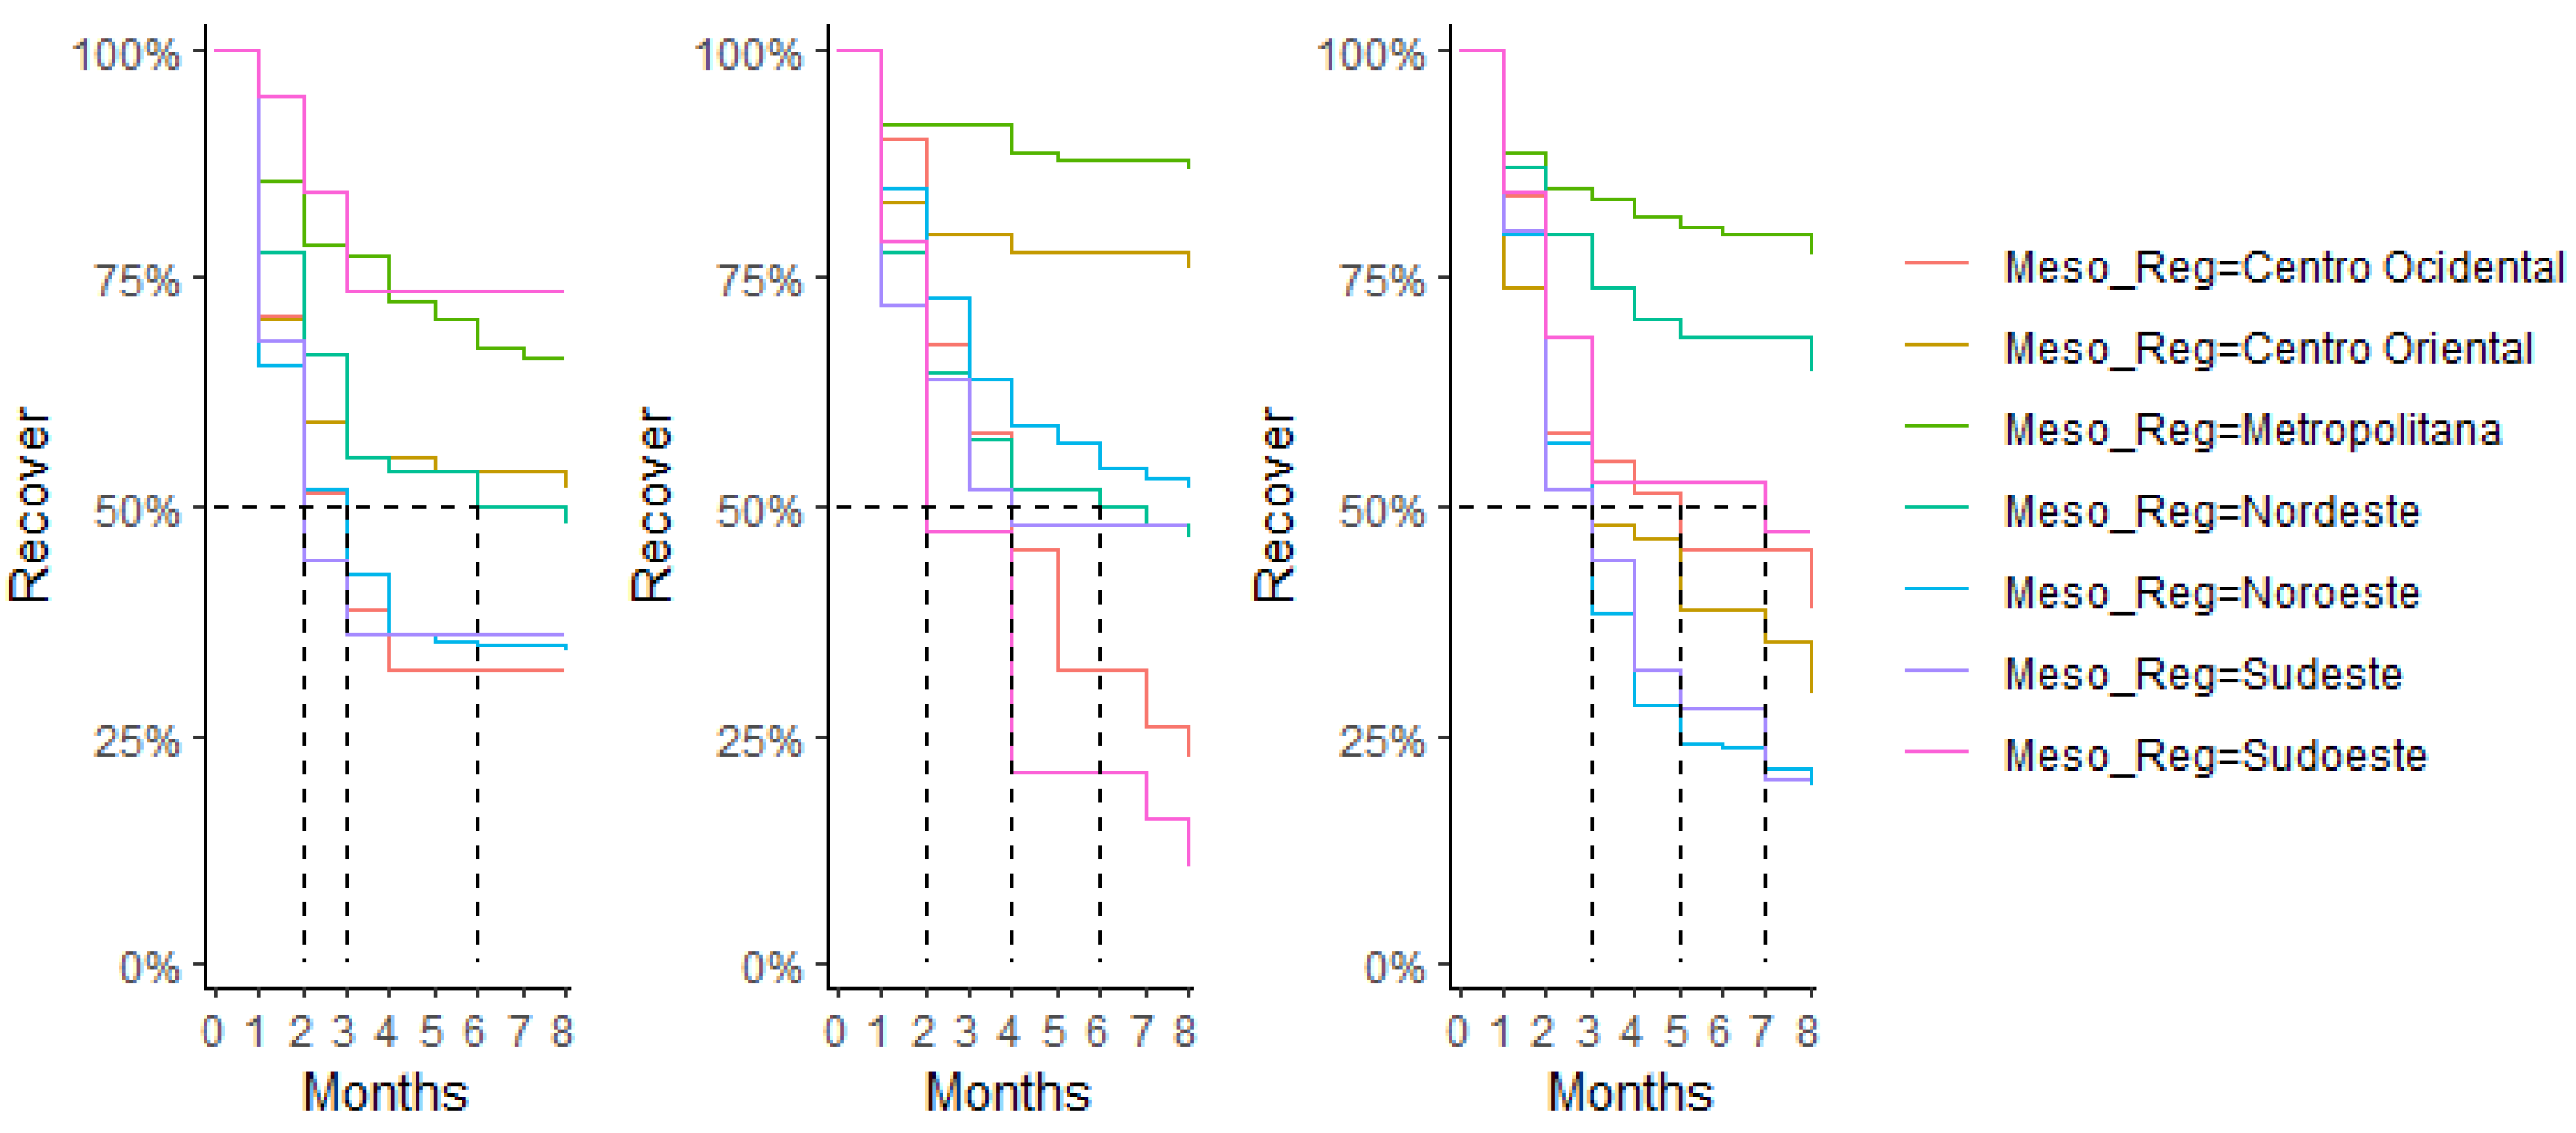
Geographical analysis by mesoregions shows how and where economic recoveries from droughts occur. Overall, the most resilient region is the metropolitan region, where the service sector predominates, with strong industry, followed by the central-eastern and northeastern regions, which are regions where economic activities are more balanced between industry, services, agriculture, and livestock. The other regions are the most affected and are those where the agricultural sector is predominant (central-western, northwest, southeast, and southwest). In 2020, the region most affected was the central-western region, closely followed by the northwest and southeast regions. In 2022, the most affected region was the southwest, followed by the central-western region. In 2023, the most affected regions were the northwest and southeast.
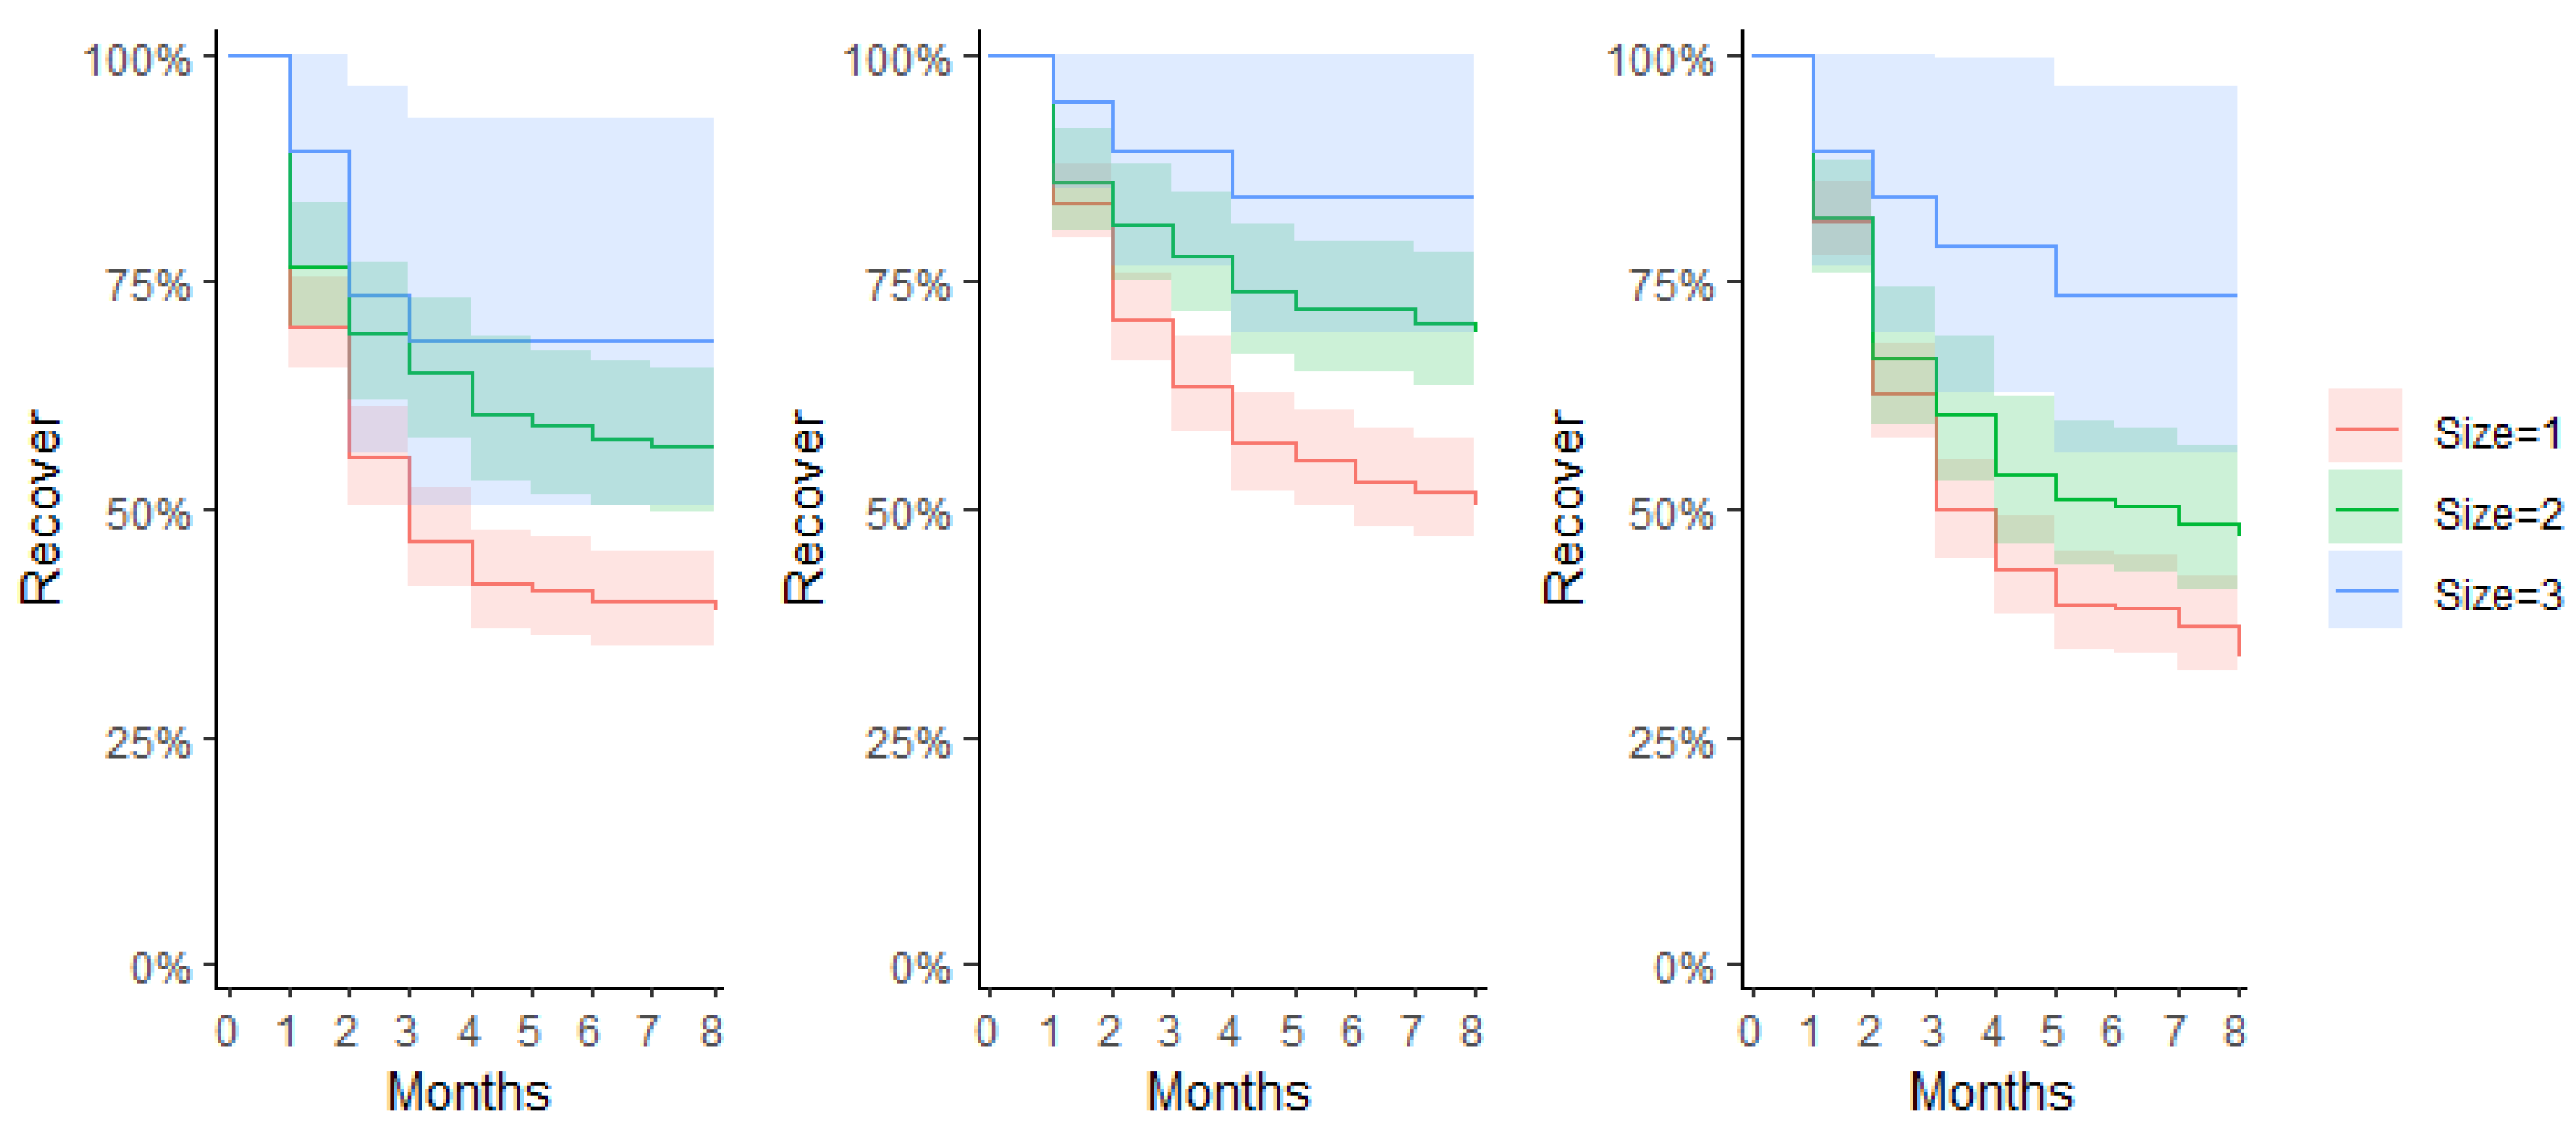
Regarding the size of cities,
Figure 7 shows a positive relationship between size and resilience. Larger municipalities are less likely to experience crises, although there is a large dispersion. Municipalities with fewer than 10,000 inhabitants are those that need more time to recover economically. In the 2023 drought, a very similar effect can be seen between small and medium-sized municipalities (Sizes 1 and 2).
The global median per year was 4 months. This calculation only considers municipalities that entered into crisis. All the Logrank tests validate the results presented. Unlike the Kaplan-Meier procedure, in which the time variable is determining the recovery of municipality economy, in the Cox model the risk of recovery is the result of the effect of one or more explanatory variables, in this case the size of municipalities (population), its regional location, the value added of agrobusiness sector, and the log of municipality GDP. The choice of the variables are based on literature, similar empirical studies, tests validations and depending on the availability of information. It was decided to adopt a model that best covered the periods in their similarities, seeking to confirm repeated effects.
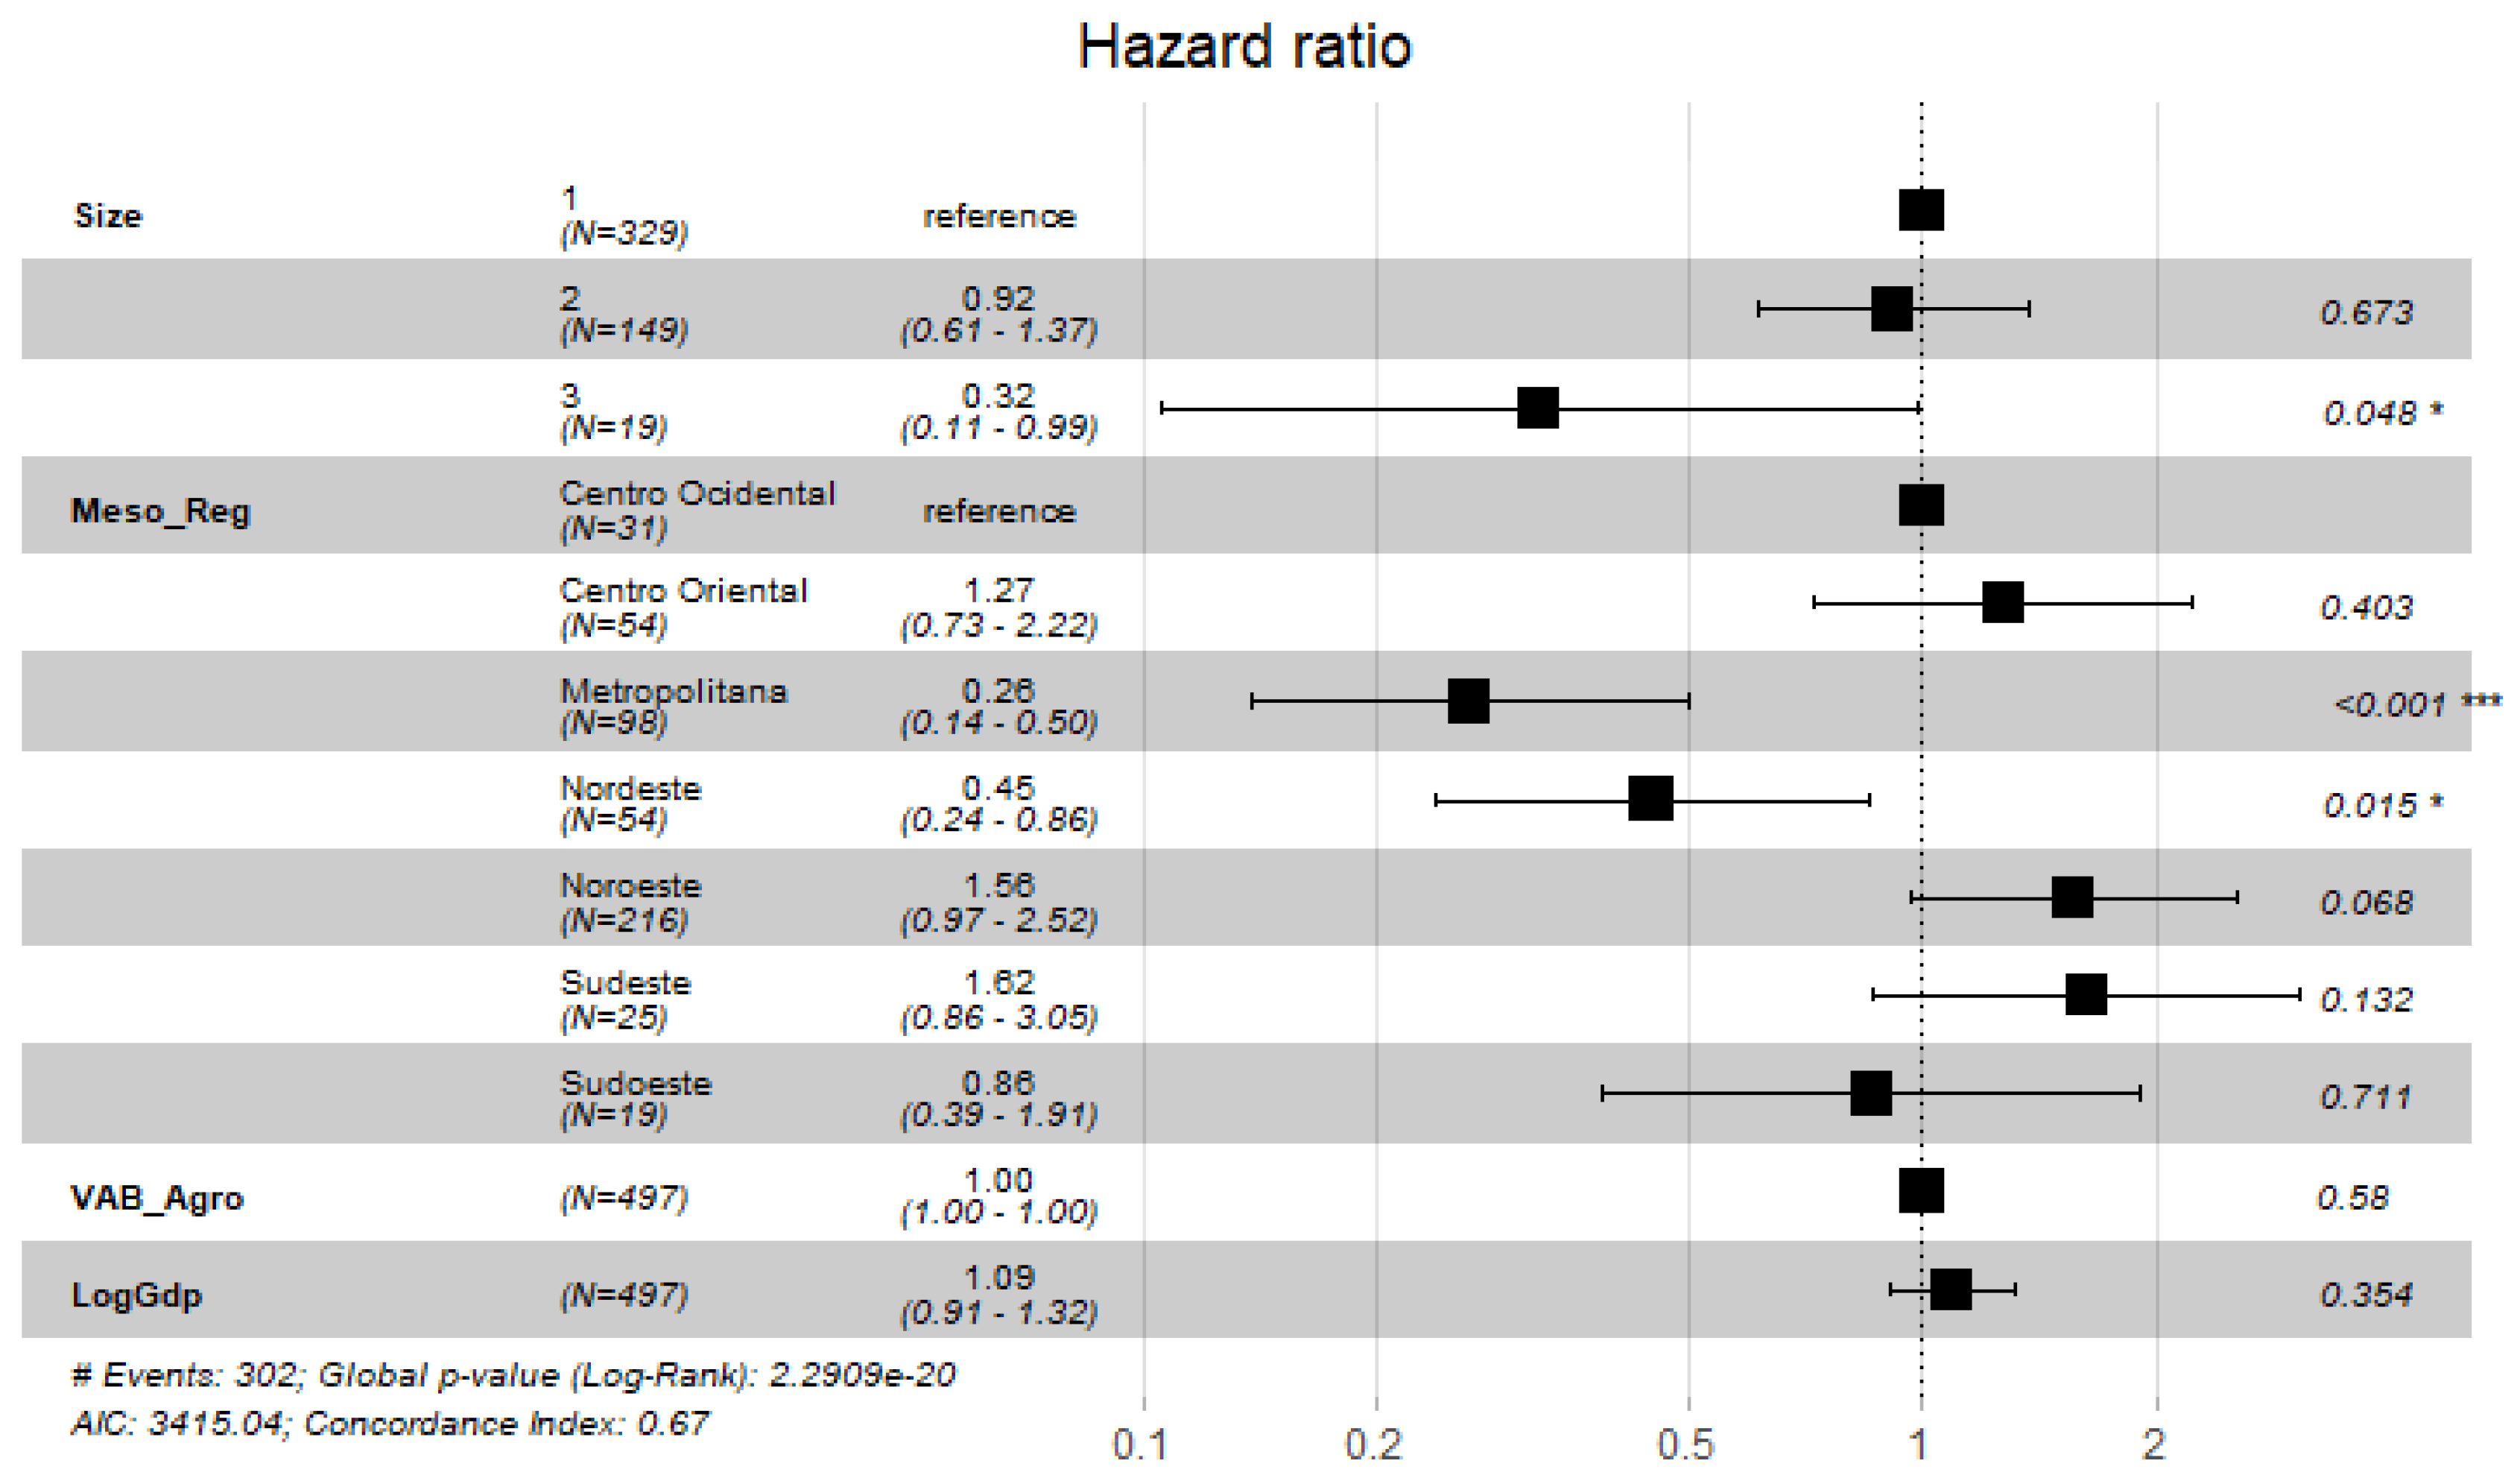
The analysis according to the COX model shows that the size of the municipality appears to be significant, with size 2 in 2022 and size 3 in 2023, both improving the recovery time, respectively 38% and 68%. As for the analysis of the mesoregions, the metropolitan region stands out in all droughts as the one with the greatest resilience, with the best chance of recovery, ranging from 54% to 80%. Other regions that have a better chance of recovery depending on the specific drought are the central-eastern, northeast, and southwest regions. The northwest region sometimes has a positive and sometimes a negative impact. The variable representing the gross added value of the agricultural sector has no influence. The logarithm of GDP variable shows an improvement in recovery, but at a significance of 0.1.
Figure 7 initially highlights hazard ratio for 2023, the last drought, in relation to municipality size 1 (less than 10,000 habitants), and central-western mesoregion. When the position is in the left there is a better chance of recovery, and if it is in the right the variable contribute to a later recovery.
Table 6 presents the risk proportionality test, whose null hypothesis admits the proportionality of risks between establishments as time increases. The global analysis confirm for the 2020 and 2023. Of the four variables tested, size and Log GDP are consistent in all years and confirm the proportional risk.
Krugman (1991) shows how a country can endogenously become differentiated into an industrialized "core" and an agricultural "periphery”. Johnston and Mellor (1961) analyze the nature of agriculture's role in the process of economic growth, which is highly relevant to determining the appropriate balance between agriculture and other sectors with regard to direct government investment or investment aid, budget allocations for research programs, and the burden of taxation levied on different sectors.
According to Fochezatto and Grando (2011), in the absence of drought, the GDP of the state of RS could have increased by 2.1 percentage points in the growth. Our study also point out the importance of a high level of attention to recurrent droughts that occurs in RS, and its impact in small cities, four mesoregions and agriculture dependent economies, despite of the fast recovery founded.
5. Conclusions
The study aims to evaluate the duration of the last three droughts in Rio Grande do Sul state. The natural disaster are today one of the biggest concerns worldwide. The drought is the most typical recurrent phenomena in the state of RS, with serious damage in most of municipalities. The Kaplan-Meier estimator and Cox regression model were used to analyze the economic recovery in the municipalities in the years of 2020, 2022, and 2023. The variables used were municipality size (population), main sector of activity, and geographic location. Data used to monitor the crisis and economic recover was collected from the State Revenue Agency of Rio Grande do Sul, consisting in the sum of total value in invoices issued in the municipality each month.
The key findings are that the recovery is fast in the largest cities, in metropolitan region. The worst ability to recover is concentrate in small cities, in the cities that have the agriculture and livestock as main economic activity. The regions that usually suffer most are central-western, northwest, southeast, and southwest. The study suggest that despite of the fast recover of 75% or more of municipalities in crisis, a stronger policy should be in practice for those municipalities that have more difficulties to manage the event and suffer a longest period. The study highlights the importance of continued research across different regions and countries to validate these findings and improve drought prevention policies. Futures lines of research should explore the effects of the drought in the growth rate of the state, and inequality. This research provides valuable insights into the relationship between drought, regions, economic activity and size of cities, offering a robust foundation for future studies and regional policy development.
References
- Audretsch, D.B.; Mahmood, T. New Firm Survival: New Results Using a Hazard Function. Rev. Econ. Stat. 1995, 77, 97–103. [Google Scholar] [CrossRef]
- Banco Mundial. Lidando com perdas: Opções de proteção financeira contra desastres no Brasil. Washington DC, 2014. Available in: https://documents1.worldbank.org/curated/en/473501484214212075/pdf/111953-WP-OpesdeProtecaoFinanceiradeRiscosdeDesastresnoBrasilPORTFINALWEB-PUBLIC-ABSTRACT-SENT-PORTUGUESE.pdf. Accessed in 13/08/2024.
- Bresser-Pereira, L. C. O conceito histórico de desenvolvimento econômico. Textos para Discussão 157. Dezembro de 2006. Avalilable in: https://hdl.handle.net/10438/1973. Accessed in: 23/08/2024.
- Burke, M.; Hsiang, S.M.; Miguel, E. Global non-linear effect of temperature on economic production. Nature 2015, 527, 235–239. [Google Scholar] [CrossRef] [PubMed]
- Burns, A.; Gleadow, R.; Cliff, J.; Zacarias, A.; Cavagnaro, T. Cassava: The Drought, War and Famine Crop in a Changing World. Sustainability 2010, 2, 3572–3607. [Google Scholar] [CrossRef]
- Carvalho, M.; Andreozzi, V.; Codeço, C.; Campos, D.; Barbosa, M.T.; Shimakura, S. Análise de sobrevivência. Teoria e aplicações em saúde. Editora Fiocruz. Rio de Janeiro. 2011.
- Coase, R. H. The Problem of Social Cost. Journal of Law and Economics. 1960, Vol. 3, pp. 1-44. The University of Chicago Press. Avalilable in: http://www.jstor.org/stable/724810. Accessed in: 23/08/2024.
- Colosimo, E.A.; Giolo, S.R. Análise de Sobrevivência Aplicada. Editora Blucher. 2021.
- Cox, D. R. Regression Models and Life-Tables. Journal of the Royal Statistical Society. 1972 Series B (Methodological) 34, no. 2: 187–220. http://www.jstor.org/stable/2985181.
- Crausbay, S.D.; Ramirez, A.R.; Carter, S.L.; Cross, M.S.; Hall, K.R.; Bathke, D.J.; Betancourt, J.L.; Colt, S.; Cravens, A.E.; Dalton, M.S.; et al. Defining Ecological Drought for the Twenty-First Century. Bull. Am. Meteorol. Soc. 2017, 98, 2543–2550. [Google Scholar] [CrossRef]
- Eberhardt, P.H.d.C.; Fochezatto, A. Regional Resilience and the Asymmetric Effects of the 2008 Crisis in Brazil: A Survival Model Analysis. Networks Spat. Econ. 2024, 24, 743–762. [Google Scholar] [CrossRef]
- De Nys, E.; Engle, N.L.; Magalhães, A.R. Secas no Brasil: política e gestão proativas. Brasília, DF: Centro de Gestão e Estudos Estratégicos- CGEE; Banco Mundial, 2016. 292 p. Available in: https://documents1.worldbank.org/curated/en/326291481707684634/pdf/WP-secabrasilweb-PUBLIC-ABSTRACT-SENT.pdf. Accessed in : 17/09/2024.
- De Silva, M.; Kawasaki, A. Socioeconomic Vulnerability to Disaster Risk: A Case Study of Flood and Drought Impact in a Rural Sri Lankan Community. Ecol. Econ. 2018, 152, 131–140. [Google Scholar] [CrossRef]
- Ding, Y.; Peng, S. Spatiotemporal Trends and Attribution of Drought across China from 1901–2100. Sustainability 2020, 12, 477. [Google Scholar] [CrossRef]
- Ding, Y.; Hayes, M.J.; Widhalm, M. Measuring economic impacts of drought: a review and discussion. Disaster Prev. Manag. Int. J. 2011, 20, 434–446. [Google Scholar] [CrossRef]
- Edwards, B.; Gray, M.; Hunter, B. The social and economic impacts of drought. Aust. J. Soc. Issues 2018, 54, 22–31. [Google Scholar] [CrossRef]
- Fochezatto, A.; Grando, M. Z. Efeitos da estiagem de 2008 na economia do Rio Grande do Sul: uma abordagem multissetorial. Ensaios FEE. 2011, v. 32, n. 1, p. 137-160, Porto Alegre. Avalilable in : https://arquivofee.rs.gov.br/wp-content/uploads/2014/03/20140324062.pdf. Accessed in 12/09/2024.
- Freire-González, J.; Decker, C.; Hall, J.W. The Economic Impacts of Droughts: A Framework for Analysis. Ecol. Econ. 2017, 132, 196–204. [Google Scholar] [CrossRef]
- Governo do Estado do Rio Grande do Sul. Mensagem do Governador à Assembleia Legislativa. 2024. Available in: https://planejamento.rs.gov.br/upload/arquivos/202402/26173419-mensagem-2024-atualizada-26-02-2024.pdf. Accessed in : 16/09/2024.
- Govindarajulu, U.S.; D'Agostino, R.B. Review of current advances in survival analysis and frailty models. WIREs Comput. Stat. 2020, 12. [Google Scholar] [CrossRef]
- Hoffmann, R. Distribuição de renda e da posse de terra no Brasil. In: Ramos, P. et al. Dimensões do agronegócio brasileiro: políticas, instituições e perspectivas. Brasília, DF: Ministério do Desenvolvimento Agrário, 2007. p. 172-225. Available in:https://governancadeterras.com.br/wpcontent/uploads/2017/10/dimensoes_do_agronegocio_brasileiro.pdf. Accessed in: 10/09/2024.
- Jenkins, K.; Dobson, B.; Decker, C.; Hall, J. W. An integrated framework for risk-based analysis of economic impacts of drought and water scarcity in England and Wales. Water Resources Research. 2021, 57, e2020WR027715. [Google Scholar] [CrossRef]
- Johnston, B. F.; Mellor, J. W. The Role of Agriculture in Economic Development. The American Economic Review, Sep., 1961, Vol. 51, No. 4 (Sep., 1961), pp. 566- 593. American Economic Association. Avalilable in: https://www.jstor.org/stable/1812786. Accessed in: 23/08/2024.
- Kaplan, E.L.; Meier, P. Nonparametric Estimation from Incomplete Observations. Journal of the American Statistical Association. 1958, V. 53, N. 282, p. 457-481.
- Krugman, P. Increasing Returns and Economic Geography. Journal of Political Economy. 1991, 99, no. 3: 483–99 http://wwwjstororg/stable/2937739. [Google Scholar] [CrossRef]
- Ministério da Fazenda. Dívida Pública Federal: Relatório Anual 2023. Brasília: Secretaria do Tesouro Nacional, janeiro, Nº 21. 2024.
- Motha, Raymond P. Chapter 30: The Impact of Extreme Weather Events on Agriculture in the United States. 2011. Publications from USD A-ARS / UNL Faculty. 1311. https://digitalcommons.unl.edu/usdaarsfacpub/1311.
- Olalde, A.R.; Haas, J.M. Estrutura agrária e desenvolvimento humano: uma análise comparativa das mesorregiões Sudoeste e Noroeste do Rio Grande do Sul. Ensaios FEE. 2017, Porto Alegre, v. 37, n. 4, p. 975-1004. Available in: https://revistas.planejamento.rs.gov.br/index.php/ensaios/article/viewFile/3437/3837. Accessed in: 16/09/2024.
- Parker, B.A.; Lisonbee, J.; Ossowski, E.; Prendeville, H. R.; Todey, D. Drought Assessment in a Changing Climate: Priority Actions and Research Needs. 2023. U.S. Department of Commerce, National Oceanic and Atmospheric Administration, Office of Oceanic and Atmospheric Research, National Integrated Drought Information System. NOAA Technical Report OAR CPO-002. [CrossRef]
- Pérez, L.P.Y.; Barreiro-Hurlé, J. Assessing the socio-economic impacts of drought in the Ebro River Basin. Span. J. Agric. Res. 2009, 7, 269–280. [Google Scholar] [CrossRef]
- Schoenfeld, D. Partial Residuals for The Proportional Hazards Regression Model. Biometrika 1982, 69, 239–241. [Google Scholar] [CrossRef]
- Shiru, M.S.; Shahid, S.; Alias, N.; Chung, E.-S. Trend Analysis of Droughts during Crop Growing Seasons of Nigeria. Sustainability 2018, 10, 871. [Google Scholar] [CrossRef]
- Secretaria de Planejamento, Governança e Gestão. Desastres naturais no Rio Grande do Sul: estudo sobre as ocorrências no período 2003-2021. Porto Alegre, 2022. 110p. Available in : https://planejamento.rs.gov.br/upload/arquivos/202211/22111507-desastres-naturais-2003-2021.pdf. Accessed in 16/09/2024.
- Skidmore, M.; Toya, H. Do natural disasters promote the long run growth? Economic Inquire, 2002; 40, 664–687. [Google Scholar] [CrossRef]
- Skidmore, M.; Toya, H. Natural Disaster Impacts and Fiscal Decentralization. Land Econ. 2012, 89, 101–117. [Google Scholar] [CrossRef]
- Ter-Minassian, T. Intergovernmental fiscal relations in a macroeconomic perspective: an overview. In: ______. Fiscal federalism in Theory and Practice. Washington: International Monetary Fund, 1997. p. 3-24. [CrossRef]
- Tonetto, J.L.; Pique, J.M.; Fochezatto, A.; Rapetti, C. Survival Analysis of Small Business during COVID-19 Pandemic, a Brazilian Case Study. Economies 2024, 12, 184. [Google Scholar] [CrossRef]
- Varian, H. R. Intermediate Microeconomics. A modern approach. 8ºth edition. W. W. Norton and Company, Inc. New York. 2010.
- Vicente-Serrano, S.M.; Quiring, S.M.; Peña-Gallardo, M.; Yuan, S.; Domínguez-Castro, F. A review of environmental droughts: Increased risk under global warming? Earth-Science Rev. 2020, 201, 102953. [Google Scholar] [CrossRef]
- Wittwer, G.; Griffith, M. Modelling drought and recovery in the southern Murray-Darling basin*. Aust. J. Agric. Resour. Econ. 2011, 55, 342–359. [Google Scholar] [CrossRef]
Figure 1.
Events that affected more than 50 municipalities in RS. Source: Compiled by the authors. National Secretariat for Civil Defense and Protection – Sedec/MIDR and Ceped/UFSC. Only more than 50 municipalities hit.
Figure 1.
Events that affected more than 50 municipalities in RS. Source: Compiled by the authors. National Secretariat for Civil Defense and Protection – Sedec/MIDR and Ceped/UFSC. Only more than 50 municipalities hit.
Figure 2.
Severe drought in 2020, 2022, 2023, by month in quantity of municipality hit. Source: Compiled by the authors. National Secretariat for Civil Defense and Protection – Sedec/MIDR and Ceped/UFSC.
Figure 2.
Severe drought in 2020, 2022, 2023, by month in quantity of municipality hit. Source: Compiled by the authors. National Secretariat for Civil Defense and Protection – Sedec/MIDR and Ceped/UFSC.
Figure 3.
Histogram with the frequency of the municipalities and their number maximum of months in crisis by year. Source: Estimate by the authors Note: Not censured, raw data.
Figure 3.
Histogram with the frequency of the municipalities and their number maximum of months in crisis by year. Source: Estimate by the authors Note: Not censured, raw data.
Figure 4.
Kaplan-Meier recover curve, by year in RS, 2020, 2022, 2023.
Figure 4.
Kaplan-Meier recover curve, by year in RS, 2020, 2022, 2023.
Figure 5.
Kaplan-Meier recover curve, by main sector of municipality, years of 2020, 2022 and 2023.
Figure 5.
Kaplan-Meier recover curve, by main sector of municipality, years of 2020, 2022 and 2023.
Figure 6.
Kaplan-Meier recover curve, by mesoregion. Note: Mesoregions: Centro Ocidental = central-western; Centro Oriental = central-eastern; Metropolitana = metroplolitan; Nordeste = northeastern; Noroeste = northwest; Sudeste = southeast; Sudoeste = southwest.
Figure 6.
Kaplan-Meier recover curve, by mesoregion. Note: Mesoregions: Centro Ocidental = central-western; Centro Oriental = central-eastern; Metropolitana = metroplolitan; Nordeste = northeastern; Noroeste = northwest; Sudeste = southeast; Sudoeste = southwest.
Figure 7.
Kaplan-Meier recover curve, by municipality size. Note: Size based on population in 2020. Size 1 < of 10,000 habitants; Size 2 >= 10,000 and < =100,000 habitants; Size 3 > 100,000 habitants.
Figure 7.
Kaplan-Meier recover curve, by municipality size. Note: Size based on population in 2020. Size 1 < of 10,000 habitants; Size 2 >= 10,000 and < =100,000 habitants; Size 3 > 100,000 habitants.
Figure 8.
Forest graph by all variables 2023. Source: Compiled by the authors.
Figure 8.
Forest graph by all variables 2023. Source: Compiled by the authors.
Table 1.
Losses by sector and type of climate event, from 2010 to 2023, in BRL millions.
Table 1.
Losses by sector and type of climate event, from 2010 to 2023, in BRL millions.
| Sector/Disaster |
Heavy rains |
Floods |
Drought |
Hail |
Gales and cyclones |
Total sector |
Sector lost |
| Agriculture (BRL) |
5,934 |
3,795 |
62,503 |
1,555 |
1,412 |
75,200 |
78% |
| Livestock (BRL) |
731 |
750 |
13,391 |
104 |
134 |
15,109 |
16% |
| Industry (BRL) |
951 |
267 |
81 |
20 |
63 |
1,382 |
1% |
| Commerce (BRL) |
602 |
191 |
6 |
27 |
197 |
1,023 |
1% |
| Services (BRL) |
89 |
192 |
278 |
12 |
125 |
697 |
1% |
| Private |
8,308 |
5,195 |
76,259 |
1,719 |
1,930 |
93,411 |
97% |
| Public |
781 |
1,328 |
153 |
43 |
175 |
2,481 |
3% |
| Total lost |
9,089 |
6,523 |
76,412 |
1,762 |
2,106 |
95,892 |
100% |
| Lost by event |
9% |
7% |
80% |
2% |
2% |
100% |
|
| % Agriculture |
65% |
58% |
82% |
88% |
67% |
78% |
|
Table 2.
Variables used in the study.
Table 2.
Variables used in the study.
| Acronyms |
Description |
Minimum |
Maximum |
Source |
| Code |
Municipality code |
1 |
497 |
IBGE |
| Time |
Time to event |
1 |
8 |
Estimate. SEFAZ/RS |
| Status |
0 = censured, 1 = event |
0 |
1 |
MDIR |
| Region |
Mesoregion ( seven ) |
|
|
SPGG/RS |
| Size |
Size based on population in 2020 |
1 |
3 |
SEFAZ/RS |
| Sector |
Main economic sector (four) |
|
|
IBGE |
| Vab_Agro |
Added value in the agricultural |
976 |
1,129,605 |
IBGE |
| LogGdp |
logarithm of GDP |
10.72 |
18.22 |
IBGE |
| Year |
Year |
2019 |
2023 |
SEFAZ/RS |
| Month |
Month of the year |
1 |
12 |
SEFAZ/RS |
| Value_Mun |
The total value of invoices NFE and NFCe issued in the municipality |
295,200 |
9,137,000,000 |
SEFAZ/RS |
| Value_Up |
Value _Mun updated by IPCA to dec 2023 |
390,700 |
9,260,000,000 |
Estimate. SEFAZ/RS |
| Av_12Month |
Average of 12 month |
573,100 |
8,347,000,000 |
Estimate. SEFAZ/RS |
| Pop_2020 |
Population in the year of 2020 |
982 |
1,488,252 |
IBGE |
| Date_Event |
Date registered as beginning of the drought in MIDR |
03/01/2020 |
04/05/2023 |
MDIR |
| PEPR |
Private Lost in BRL |
0 |
778,636,000 |
MDIR |
Table 3.
Distribution of main sector of municipalities by size and Mesoregion.
Table 3.
Distribution of main sector of municipalities by size and Mesoregion.
| Size/Sector |
Agriculture |
Industry |
Livestock |
Service |
| 1 |
60.49% |
8.51% |
13.37% |
17.63% |
| 2 |
29.53% |
22.82% |
0.67% |
46.98% |
| 3 |
0.00% |
5.26% |
0.00% |
94.74% |
| Mesoregion |
|
|
|
|
| Centro Ocidental |
77.42% |
0.00% |
0.00% |
22.58% |
| Centro Oriental |
31.48% |
18.52% |
24.07% |
25.93% |
| Metropolitana |
16.33% |
30.61% |
2.04% |
51.02% |
| Nordeste |
29.63% |
25.93% |
14.81% |
29.63% |
| Noroeste |
65.28% |
3.70% |
10.19% |
20.83% |
| Sudeste |
56.00% |
4.00% |
0.00% |
40.00% |
| Sudoeste |
78.95% |
0.00% |
0.00% |
21.05% |
Table 4.
Municipalities in crisis by year.
Table 4.
Municipalities in crisis by year.
| Municipality situation/year |
% |
2020 |
% |
2022 |
% |
2023 |
| No crisis |
34% |
171 |
39% |
196 |
24% |
117 |
| Crisis |
66% |
326 |
61% |
301 |
76% |
380 |
| Back in 1 month |
49% |
161 |
34% |
102 |
31% |
119 |
| Back in 2 months |
24% |
78 |
28% |
84 |
28% |
105 |
| Back in 3 months |
13% |
43 |
13% |
40 |
16% |
61 |
| Slow recovery |
13% |
44 |
25% |
75 |
25% |
95 |
| Fast recovery until 3 months |
87% |
282 |
75% |
226 |
75% |
285 |
| Time max in months |
|
10 |
|
11 |
|
15 |
| Crisis official recognition |
|
414 |
|
315 |
|
361 |
Table 5.
Cox regression and the hazard ratio for the covariates (dependent variable: months in crisis).
Table 5.
Cox regression and the hazard ratio for the covariates (dependent variable: months in crisis).
| Covariates |
Year 2020 |
Year 2022 |
Year 2023 |
| Size2 |
0.9185 |
0.6172. |
0.9173 |
| |
(0.2187) |
(0.2496) |
(0.2049) |
| Size3 |
1.1310 |
0.4203 |
0.323* |
| |
(0.5621) |
(0.6986) |
(0.5698) |
| Meso_RegCentro Oriental |
0.6570 |
0.3084*** |
1.2700 |
| |
(0.2986) |
(0.3545) |
(0.2853) |
| Meso_RegMetropolitana |
0.4568** |
0.2016*** |
0.2630*** |
| |
(0.2943) |
(0.3615) |
(0.3316) |
| Meso_RegNordeste |
0.6900 |
0.8146 |
0.4501* |
| |
(0.2910) |
(0.2829) |
(0.3286) |
| Meso_RegNoroeste |
0.9910 |
0.5982* |
1.5610. |
| |
(0.2357) |
(0.2318) |
(0.2443) |
| Meso_RegSudeste |
1.0520 |
0.7701 |
1.6240 |
| |
(0.3365) |
(0.3456) |
0.3217 |
| Meso_RegSudoeste |
0.2668* |
1.2500 |
0.8601 |
| |
(0.5192) |
(0.3318) |
(0.4062) |
| VAB_Agro |
1.0000 |
1.0000*** |
1.0000 |
| |
(0.0000) |
(0.0000) |
(0.0000) |
| LogGdp |
0.8222. |
0.8336 |
1.0920 |
| |
(0.1040) |
(0.1208) |
(0.0950) |
| Observations: |
497 |
497 |
497 |
| Risk |
271 |
213 |
302 |
| Wald test |
42.59 |
60.69 |
85.22 |
| Score (logrank) test |
45.60 |
91.96 |
101.9 |
Table 6.
Proportionality Risk Test in Cox regression.
Table 6.
Proportionality Risk Test in Cox regression.
| Covariates\Year |
2023 |
2022 |
2020 |
| |
df |
chisq |
p |
chisq |
p |
chisq |
p |
| Size |
2 |
2.5396 |
0.281 |
0.68 |
0.712 |
1.03 |
0.597 |
| Meso_Reg |
6 |
15.2324 |
0.019 |
27.37 |
0.000 |
4.4 |
0.623 |
| VAB_Agro |
1 |
0.0531 |
0.818 |
15.2 |
0.000 |
2.87 |
0.09 |
| LogGdp |
1 |
0.2549 |
0.614 |
2.85 |
0.091 |
2.48 |
0.116 |
| GLOBAL |
10 |
17.746 |
0.059 |
41.11 |
0.000 |
18.5 |
0.047 |
|
Disclaimer/Publisher’s Note: The statements, opinions and data contained in all publications are solely those of the individual author(s) and contributor(s) and not of MDPI and/or the editor(s). MDPI and/or the editor(s) disclaim responsibility for any injury to people or property resulting from any ideas, methods, instructions or products referred to in the content. |
© 2024 by the authors. Licensee MDPI, Basel, Switzerland. This article is an open access article distributed under the terms and conditions of the Creative Commons Attribution (CC BY) license (http://creativecommons.org/licenses/by/4.0/).
