Submitted:
02 September 2024
Posted:
02 October 2024
You are already at the latest version
Abstract
Keywords:
1. Introduction
2. Materials and Methods
2.1. Chemicals
2.2. Synthesis of Imprinted Polymers with a Molecular Zinc Imprint
2.3. Characterization Studies
2.4. Adsorption of Zn2+ Ions
3. Results and Discussion
3.1. Characterisation Analysis
3.2. Adsorption Study
4. Conclusions
Author Contributions
Funding
Institutional Review Board Statement
Conflicts of Interest
References
- Okutucu, B. Waste in Textile and Leather Sectors. IntechOpen; A. Körlü: Izmir, Turkey, 2020; pp. 1-12. [CrossRef]
- Stevens, M.G.F. Batlokwa, B.S. Multi-templated Pb-Zn-Hg Ion Imprinted Polymer for the Selective and Simultaneous Removal of Toxic Metallic Ions from Wastewater. International Journal of Chemistry. 2017, 9. https://dx.doi.org/10.5539/ijc.v9n2p10.
- Kuras, M.J.; Perz, K.; Kołodziejski, W.L. Synthesis, characterization and application of a novel zinc(II) ion-imprinted polymer. Polym. Bull. 2017, 74:5029-5048. [CrossRef]
- Wirawan, T.; Supriyanto, G.; Soegianto, A. Adsorption of Zinc(II) onto Zn(II)-Ionic Imprinted Polymer. 2019, IOP Conf. Ser.: Mater. Sci. Eng. 546, 022036 . [CrossRef]
- Lazar, M.M.; Ghiorghita, C.-A.; Dragan, E.S.; Humelnicu, D.; Dinu, M.V. Ion-Imprinted Polymeric Materials for Selective Adsorption of Heavy Metal Ions from Aqueous Solution. Molecules. 2023, 28, 2798. [CrossRef]
- Su, S.; Huang, Y.; Han, G.; Guo, Z.; Liu, F. Study of the Adsorption of Humic Acid with Zn2+ by Molecular Dynamic Simulation and Adsorption Experiments. In: Li, B., et al. Characterization of Minerals, Metals, and Materials 2019. The Minerals, Metals & Materials Series. Springer, Cham., 31-41. [CrossRef]
- Putri, T.; Zulfikar, M.A.; Wahyuningrum, D.; Saputra I.S. Synthesis and Characterization of Molecularly Imprinted Polymers (MIPs) Using Humic Acid. J. Pure App. Chem. Res. 2022, 11, 175-181. http://dx.doi.org/10.21776/ub.jpacr.2022.011.03.656.
- Bakhshi, A.; Daryasari, A.P.; Soleimani, M. A Molecularly Imprinted Polymer as the Adsorbent for the Selective Determination of Oxazepam in Urine and Plasma Samples by High-Performance Liquid Chromatography with Diode Array Detection. J. Anal. Chem. 2021, 76, 1414-1421. [CrossRef]
- Bivián-Castro, E.Y.; Zepeda-Navarro, A.; Guzmán-Mar, J.L.; Flores-Alamo, M.; Mata-Ortega, B. Ion-Imprinted Polymer Structurally Preorganized Using a Phenanthroline-Divinylbenzoate Complex with the Cu(II) Ion as Template and Some Adsorption Results. Polymers. 2023, 15, 1186. [CrossRef]
- Özgecan, E.; Yeşeren, S.; Müge, A.; Adil, D. Molecularly Imprinted Polymers for Removal of Metal Ions: An Alternative Treatment Method. Biomimetics. 2018, 3, 38. [CrossRef]
- Hasanah, A.N.; Safitri, N.; Zulfa, A.; Neli, N.; Rahayu, D. Factors Affecting Preparation of Molecularly Imprinted Polymer and Methods on Finding Template-Monomer Interaction as the Key of Selective Properties of the Materials. Molecules. 2021, 26, 5612. [CrossRef]
- Abdou, M.M.; Soliman, A.-G.A.; Kobisy, A.S.; Abu-Rayyan, A.; Al-Omari, M.; Alshwyeh, H.A.; Ragab, A.H.; Al Shareef, H.F.; Ammar, N.S. Preparation and Evaluation of Phenol Formaldehyde-Montmorillonite and Its Utilization in the Adsorption of Lead Ions from Aqueous Solution. ACS Omega. 2024, 9, 12015-12026. [CrossRef]
- Meza López, F.d.L.; Hernández, C.J.; Vega-Chacón, J.; Tuesta, J.C.; Picasso, G.; Khan, S.; Sotomayor, M.D.P.T.; López, R. Smartphone-Based Rapid Quantitative Detection Platform with Imprinted Polymer for Pb (II) Detection in Real Samples. Polymers. 2024, 16, 1523. [CrossRef]
- Elsayed, N.H.; Monier, M.; Alatawi, R.A.S.; Albalawi, M.A.; Alhawiti, A.S. Preparation of Chromium (III) Ion-Imprinted Polymer Based on Azo Dye Functionalized Chitosan. Carbohydr Polym. 2022, 284:119139. [CrossRef]
- Vargas-Berrones, K.; Ocampo-Perez, R.; Rodríguez-Torres, I.; Medellín-Castillo, N.A.; Flores-Ramírez, R. Molecularly Imprinted Polymers (MIPs) as Efficient Catalytic Tools for the Oxidative Degradation of 4-nonylphenol and its by-products. Environ. Sci. Pollut. Res. 2023, 30, 90741–90756. [CrossRef]
- Singhal, A.; Singh, A.; Shrivastava, A.; Khan, R. Epitope Imprinted Polymeric Materials: Application in Electrochemical Detection of Disease Biomarkers. J. Mat. Chem. B. 2023, 11, 936-954. [CrossRef]
- Dietl, S.; Sobek, H.; Mizaikoff, B. Epitope-imprinted polymers for biomacromolecules: Recent Strategies, Future Challenges and Selected Applications. TrAC Trends in Analytical Chem. 2021, 143, 116414. [CrossRef]
- Cruz, A.G.; Haq, I.; Cowen, T.; Di Masi, S.; Trivedi, S.; Alanazi, K.; Piletska, E.; Mujahid, A.; Piletsky, S.A. Design and Fabrication of a Smart Sensor Using in Silico Epitope Mapping and Electro-Responsive Imprinted Polymer Nanoparticles for Determination Of Insulin Levels in Human Plasma. Biosensors and Bioelectronics. 2020, 169, 112536. [CrossRef]
- Rapacz, D.; Smolinska-Kempisty, K.; Wolska, J. Molecularly imprinted polymers toward herbicides – Progress in Development and the Current State of the Art Depending on the Polymerization Environment – Short review. Journal of Environmental Chemical Engineering. 2024, 12, 112159. [CrossRef]
- Piletska, E.; Magumba, K.; Joseph, L.; Cruz, A.G.; Norman, R.; Singh, R.; Tabasso, A.F.S.; Jones, D. J.L.; Macip, S.; Piletsky, S. Molecular Imprinting as a Tool for Determining Molecular Markers: a Lung Cancer Case. RSC Advances. 2022, 12, 17747-17754. [CrossRef]
- Piletsky, S.S.; Piletska, E.; Poblocka, M.; Macip, S.; Jonese, D.J.L.; Braga, M.; Cao,T.H.; Singh, R.; Spivey, A.C.; Aboagye, E.O.; Piletsky, S.A. Snapshot Imprinting: Rapid Identification of Cancer Cell Surface Proteins and Epitopes Using Molecularly Imprinted Polymers. Nano Today. 2021, 41, 101304. [CrossRef]
- Piletska, E.; P.Veron, B. Bertin, F. Mingozzi, D. Jones, Norman, R. L., J. Earley MSc, Karim, K.; Garcia-Cruz, A.; Piletsky, S.A. Analysis of Adeno-Associated Virus Serotype 8 (AAV8)-Antibody Complexes Using Epitope Mapping by Molecular Imprinting Leads to the Identification of Fab Peptides That Potentially Evade AAV8 Neutralisation. Nanomedicine: Nanotechnology, Biology and Medicine. 2023, 52, 102691. [CrossRef]
- 23. Yin, Z-Z.; Cheng, S-W.; Xu, L-B.; Liu, H-Y.; Huang, K.; Li, L.; Zhai, Y-Y.; Zeng, Y-B.; Liu, H-Q.; Shao, Y.; Zhang, Z-L.; Lu, Y-X. Highly Sensitive And Selective Sensor for Sunset Yellow Based on Molecularly Imprinted Polydopamine-Coated Multi-Walled Carbon Nanotubes. Biosensors and Bioelectronics. 2018, 100, 565-570. [CrossRef]
- Choi, D.Y.; Yang, J.C.; Hong, S.W.; Park, J. Molecularly Imprinted Polymer-Based Electrochemical Impedimetric Sensors on Screen-Printed Carbon Electrodes for the Detection of Trace Cytokine IL-1β. Biosensors and Bioelectronics. 2022, 204, 114073. [CrossRef]
- Erdem, Ö.; Eş, I.; Saylan, Y.; Atabay, M.; Gungen, M.A.; Ölmez, K.; Denizli, A.; Inci, F. In situ Synthesis and Dynamic Simulation of Molecularly Imprinted Polymeric Nanoparticles on a Micro-Reactor System. Nat. Commun. 2023, 14, 4840. [CrossRef]
- Brueckl, H.; Shoshi, A.; Schrittwieser, S.; Schmid, B.; Schneeweiss, P.; Mitteramskogler, T.; Haslinger, M.J.; Muehlberger, M.; Schotter, J. Nanoimprinted Multifunctional Nanoprobes for a Homogeneous Immunoassay in a Top-Down Fabrication Approach. Sci. Rep. 2021, 11, 6039. [CrossRef]
- Gaurav, S.; Balasubramanian, K. Molecularly Imprinted Polymers for Selective Recognition and Extraction of Heavy Metal Ions and Toxic Dyes. J. Chem. Eng. 2020, 65, 396–418. [CrossRef]
- Kuras, M.J.; Perz, K.; Kołodziejski, W.L. Synthesis, Characterization and Application of a Novel Zinc(II) Ion-Imprinted Polymer. Polym. Bull. 2017, 74, 5029–5048. [CrossRef]
- Klučáková, M.; Pavlíková, M. Lignitic Humic Acids as Environmentally Friendly Adsorbent for Heavy Metals. Journal of Chemistry. 2017, 1-5. [CrossRef]
- Linnik, R.P.; Zaporozhets, O.; Mariychuk, A.R.; Lisnyak, V.V. Zinc Removal from Waters by Hybrid Sorbent with Humic Acid. 2019. https://10.1109/ICTEP48662.2019.8968971.
- Masoud, M.S.; Zidan, A.A.; El Zokm, G.M.; Elsamra, R.M. I.; Okbah, M.A. Humic acid and Nano-Zeolite NaX as low cost and Eco-Friendly Adsorbents for removal of Pb (II) and Cd (II) From Water: Characterization, Kinetics, Isotherms and Thermodynamic Studies. Biomass Conv. Bioref. 2024, 14, 3615-3632. [CrossRef]
- Menad, K.; Feddag, A.; Juhna, T. Copper (II)–Humic Acid Adsorption Process Using Microporous-Zeolite Na-X. J Inorg Organomet Polym. 2019, 29, 1-16. [CrossRef]
- Faisal, A.A.H.; Abdul-Kareem, M.B.; Mohammed, A. K.; Naushad, M.; Ghfar, A.A.; Ahamad, T. Humic Acid Coated Sand as a Novel Sorbent in Permeable Reactive Barrier for Environmental Remediation of Groundwater Polluted With Copper And Cadmium Ions. Journal of Water Process Engineering. 2020, 36, 101373. [CrossRef]
- Zhakina, A.Kh.; Rakhimova, B.B.; Vassilets, Ye.P.; Arnt, O.V.; Muldakhmetov, Z. Synthesis and Modification of a Natural Polymer with the Participation of Metal Nanoparticles, Study of Their Composition and Properties. Polymers. 2024, 16, 264. [CrossRef]
- Muldakhmetov, Z.M.; Gazaliev, A.M.; Zhakina, A.Kh.; Vassilets, Ye.P.; Arnt, O.V. Synthesis of a Composite Based on Humic Acid Tuned to Sorbed Copper Ion. Bull. Univ. Karaganda Chem. Ser. 2022, 108, 182-189. [CrossRef]
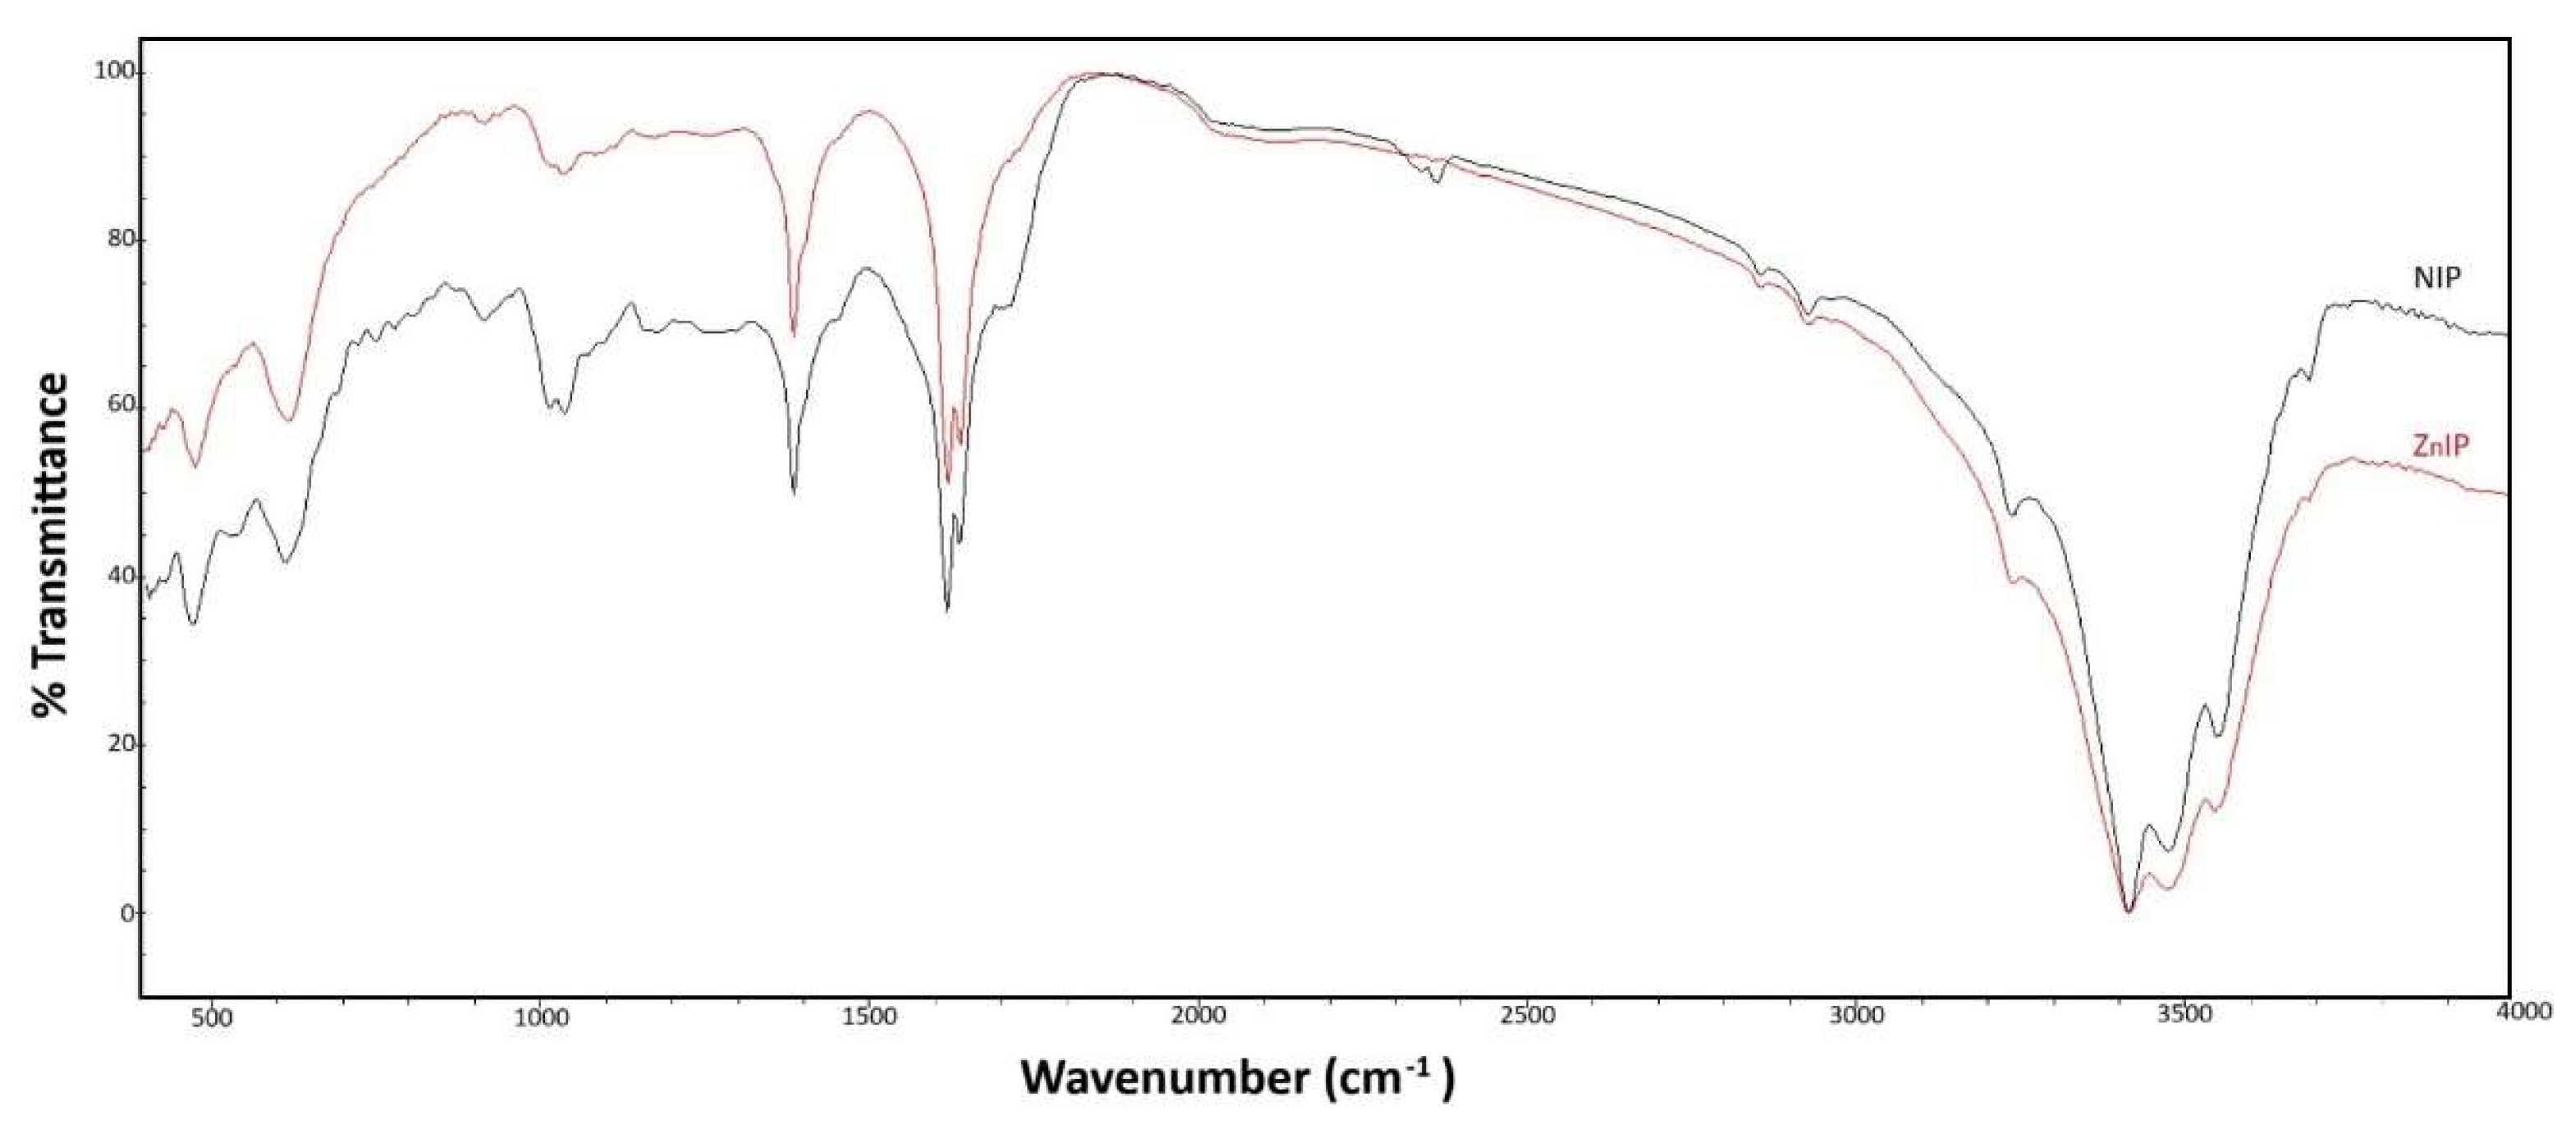
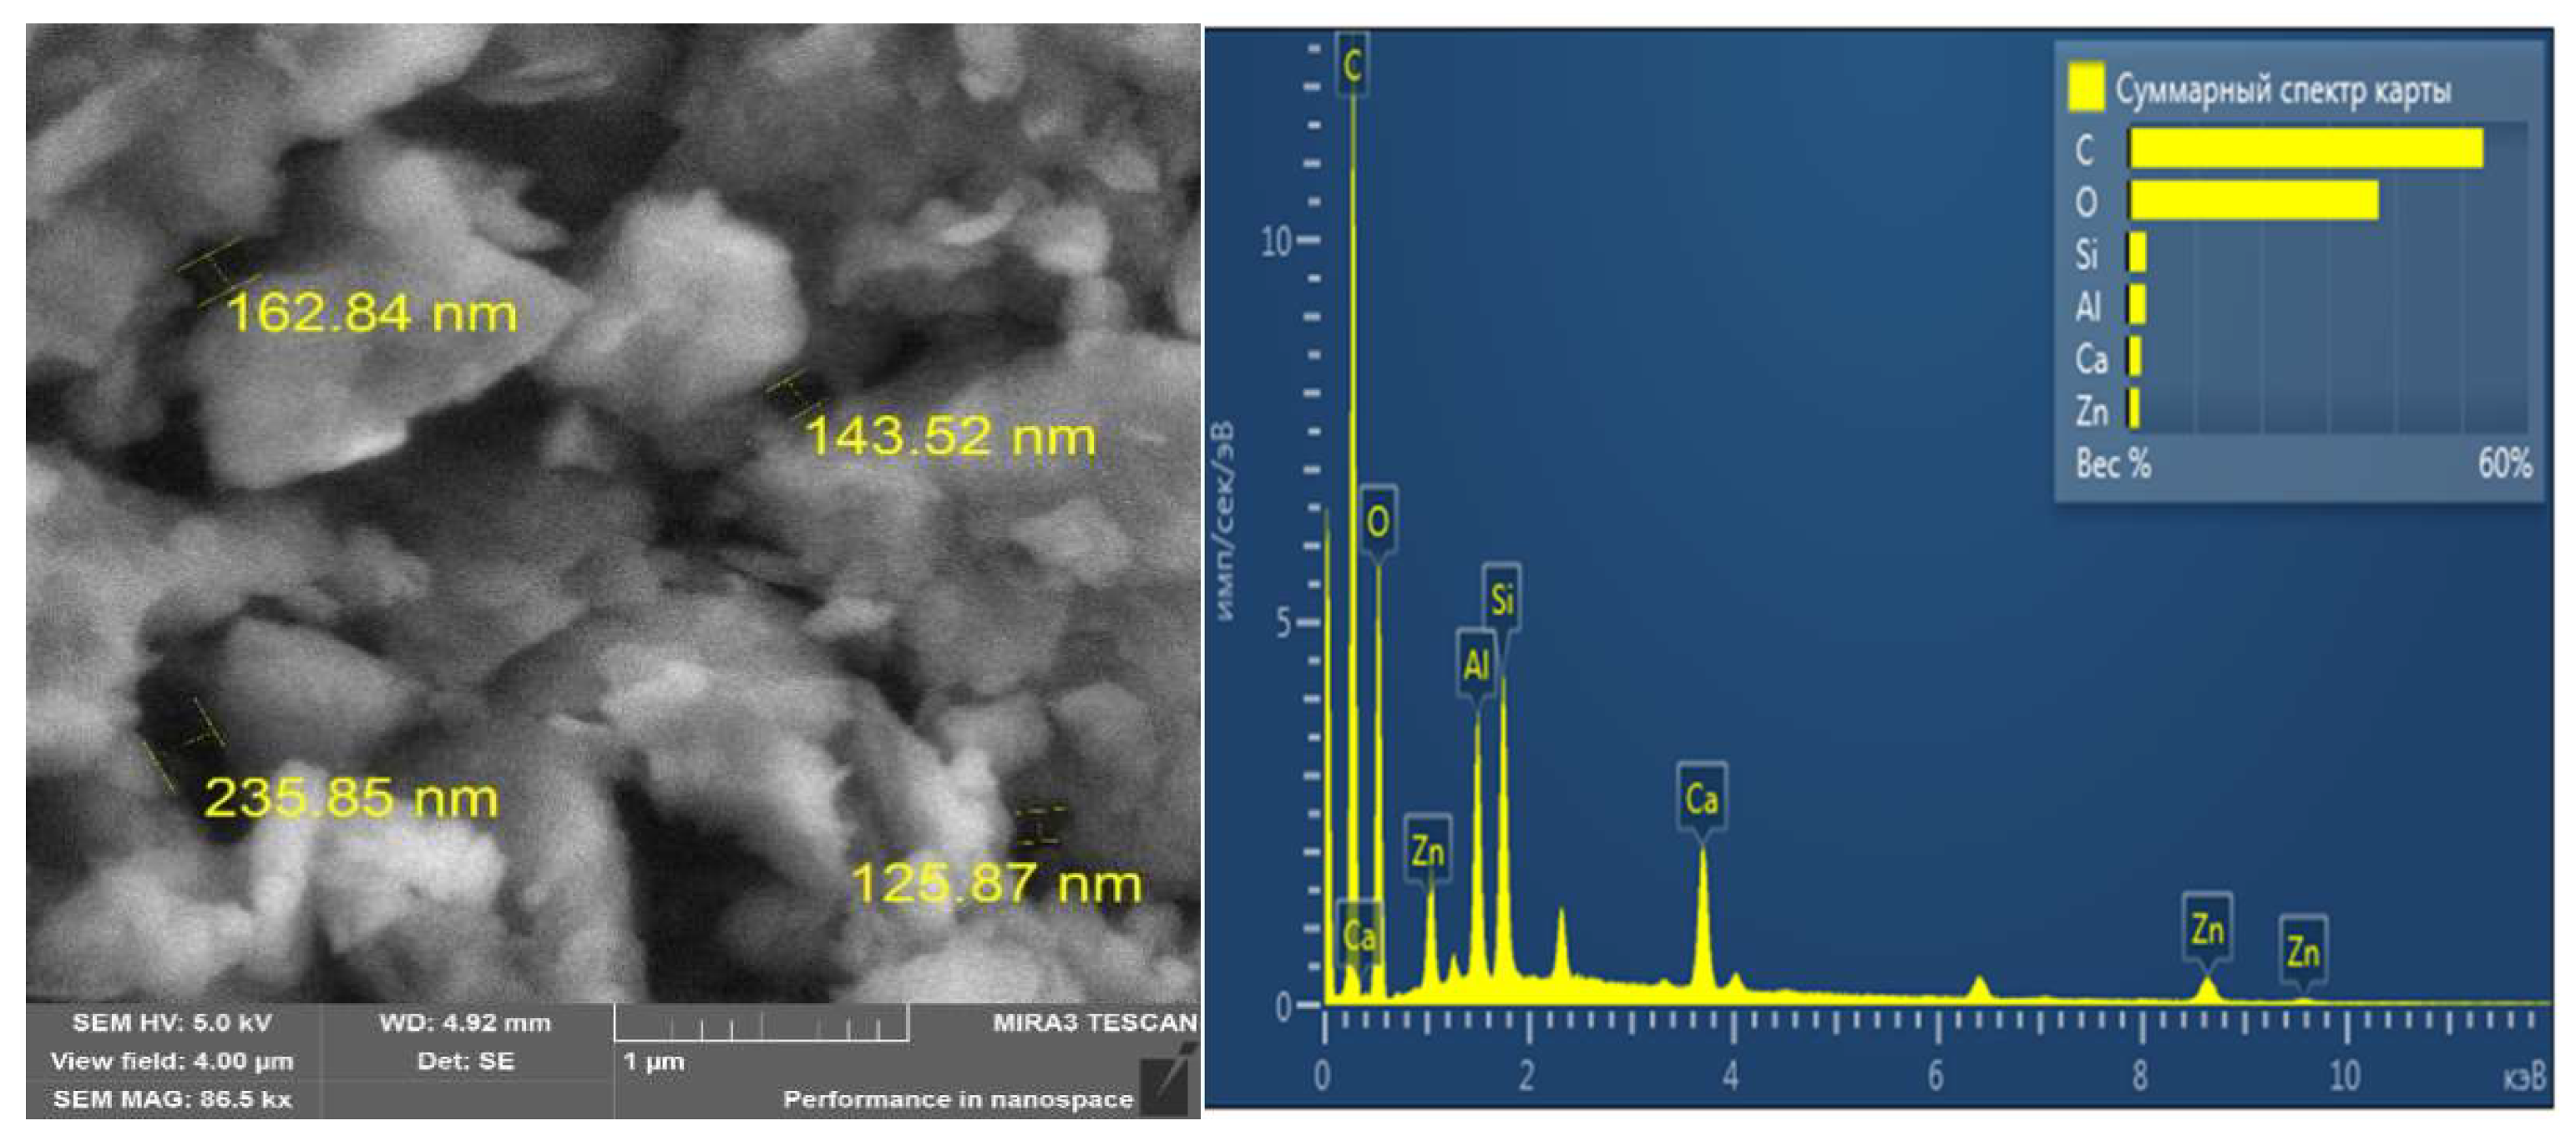
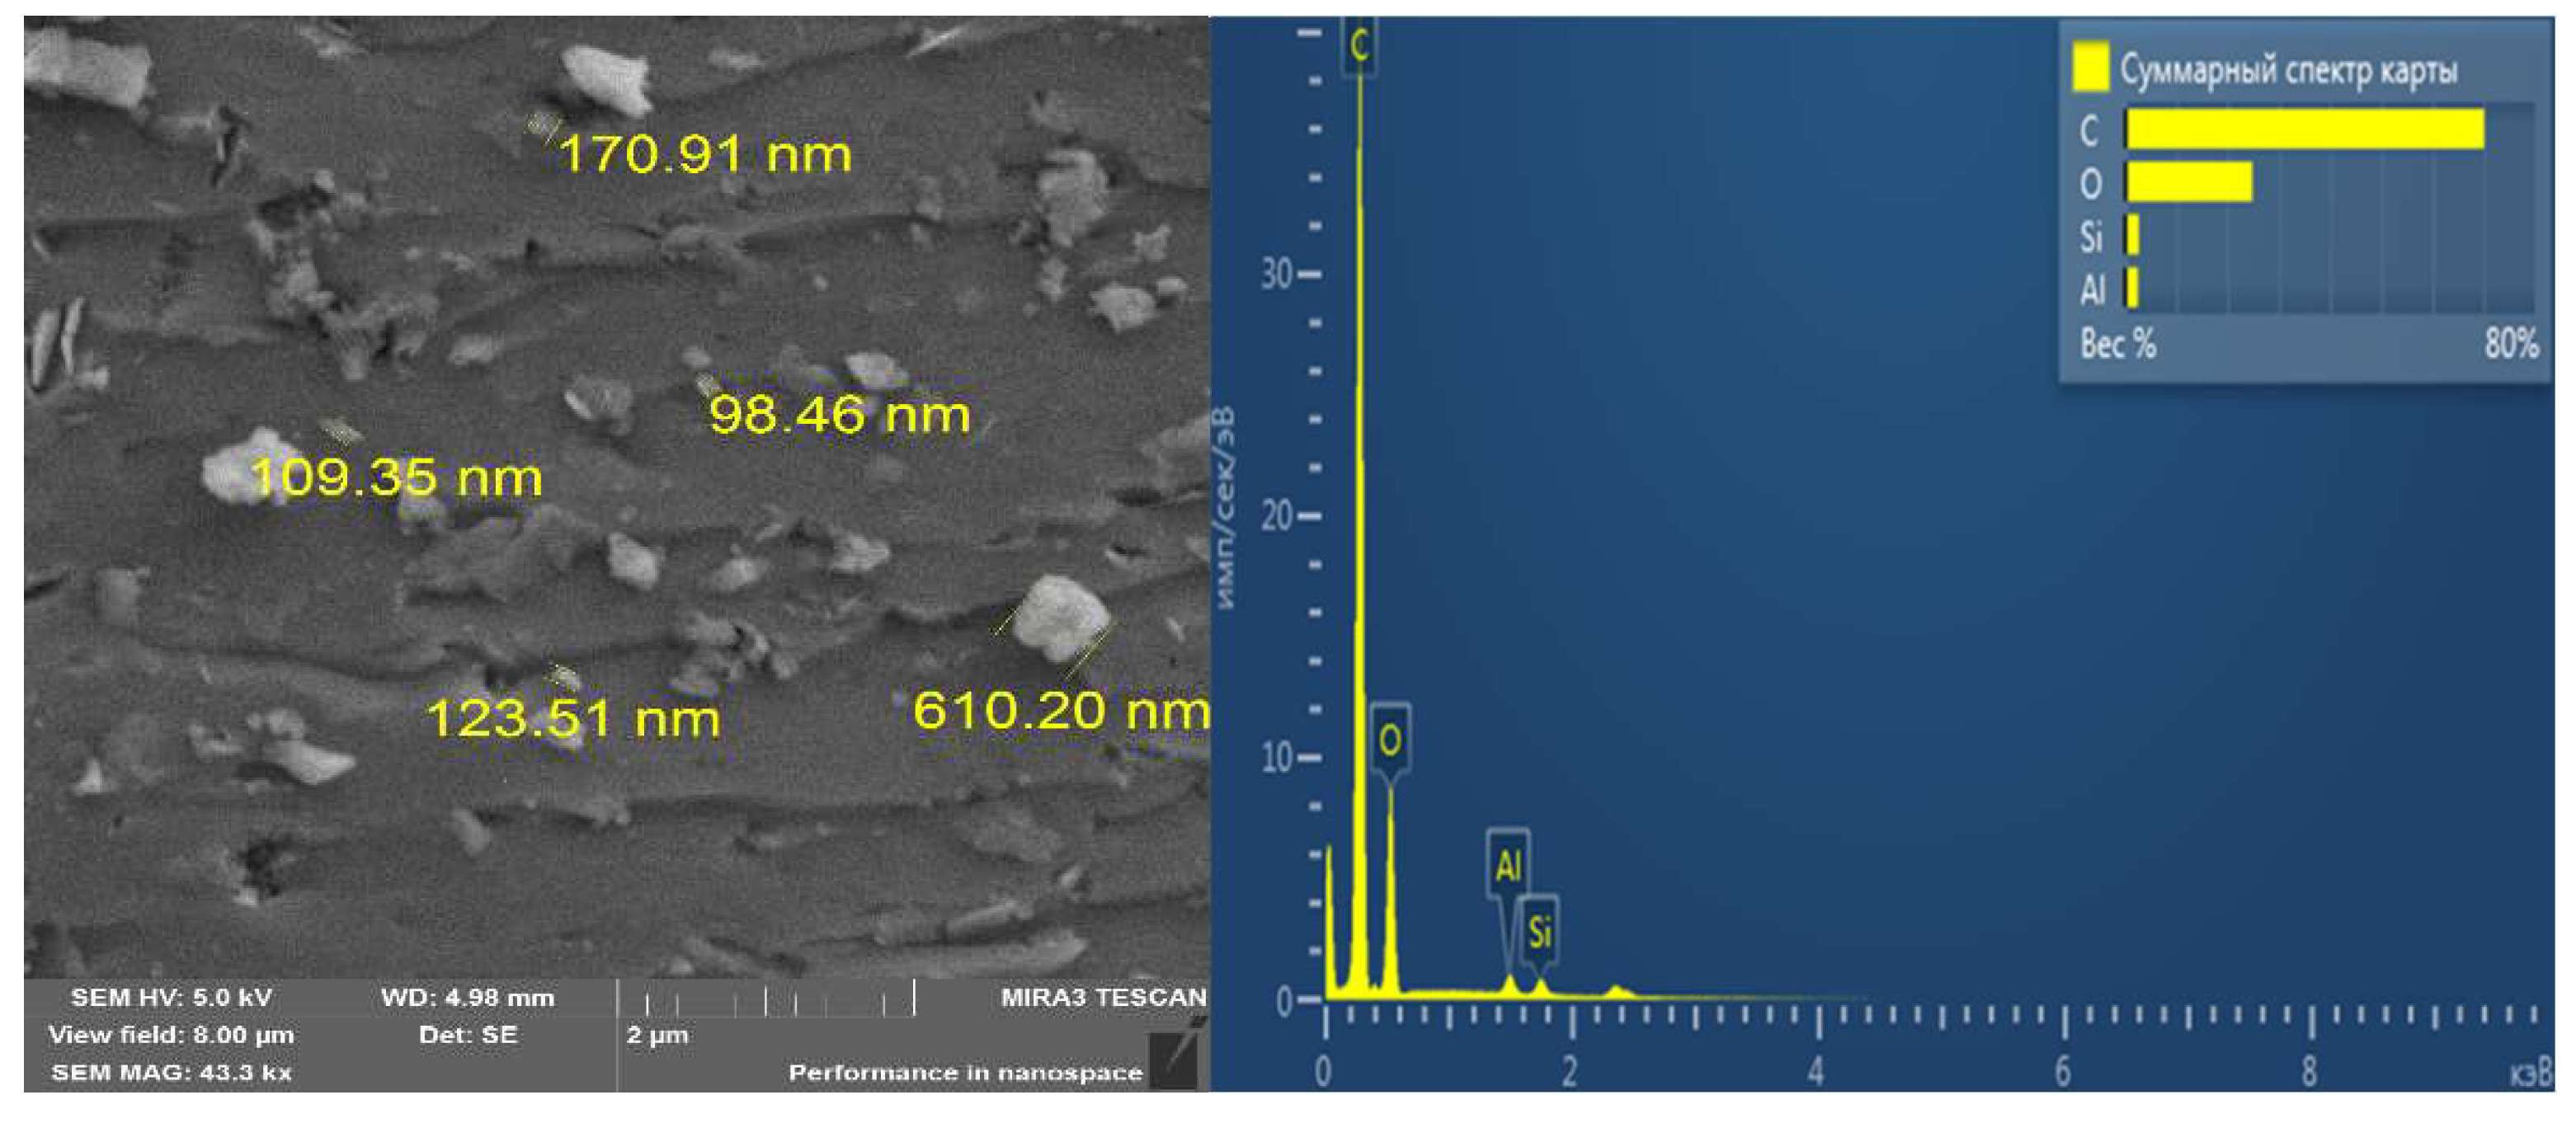
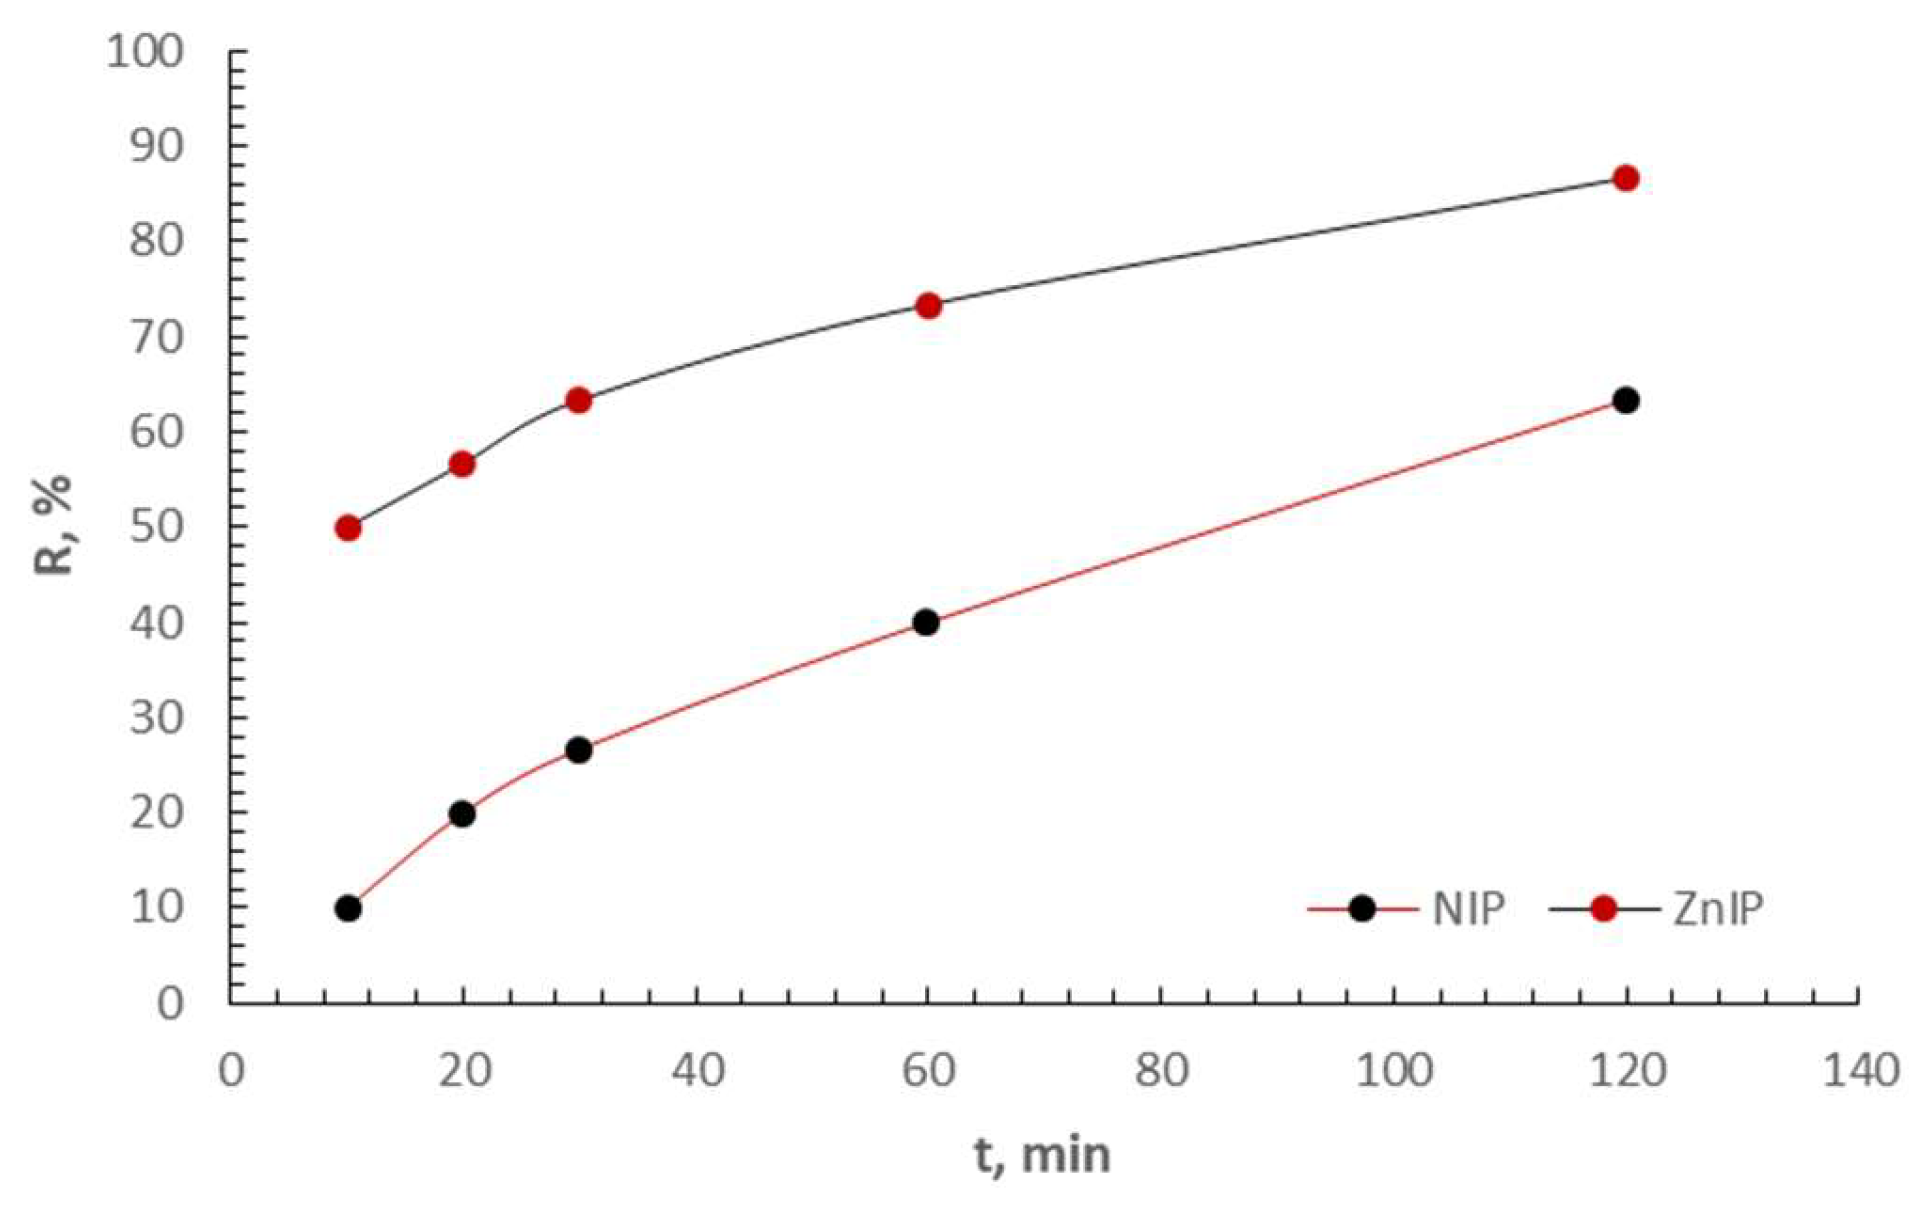
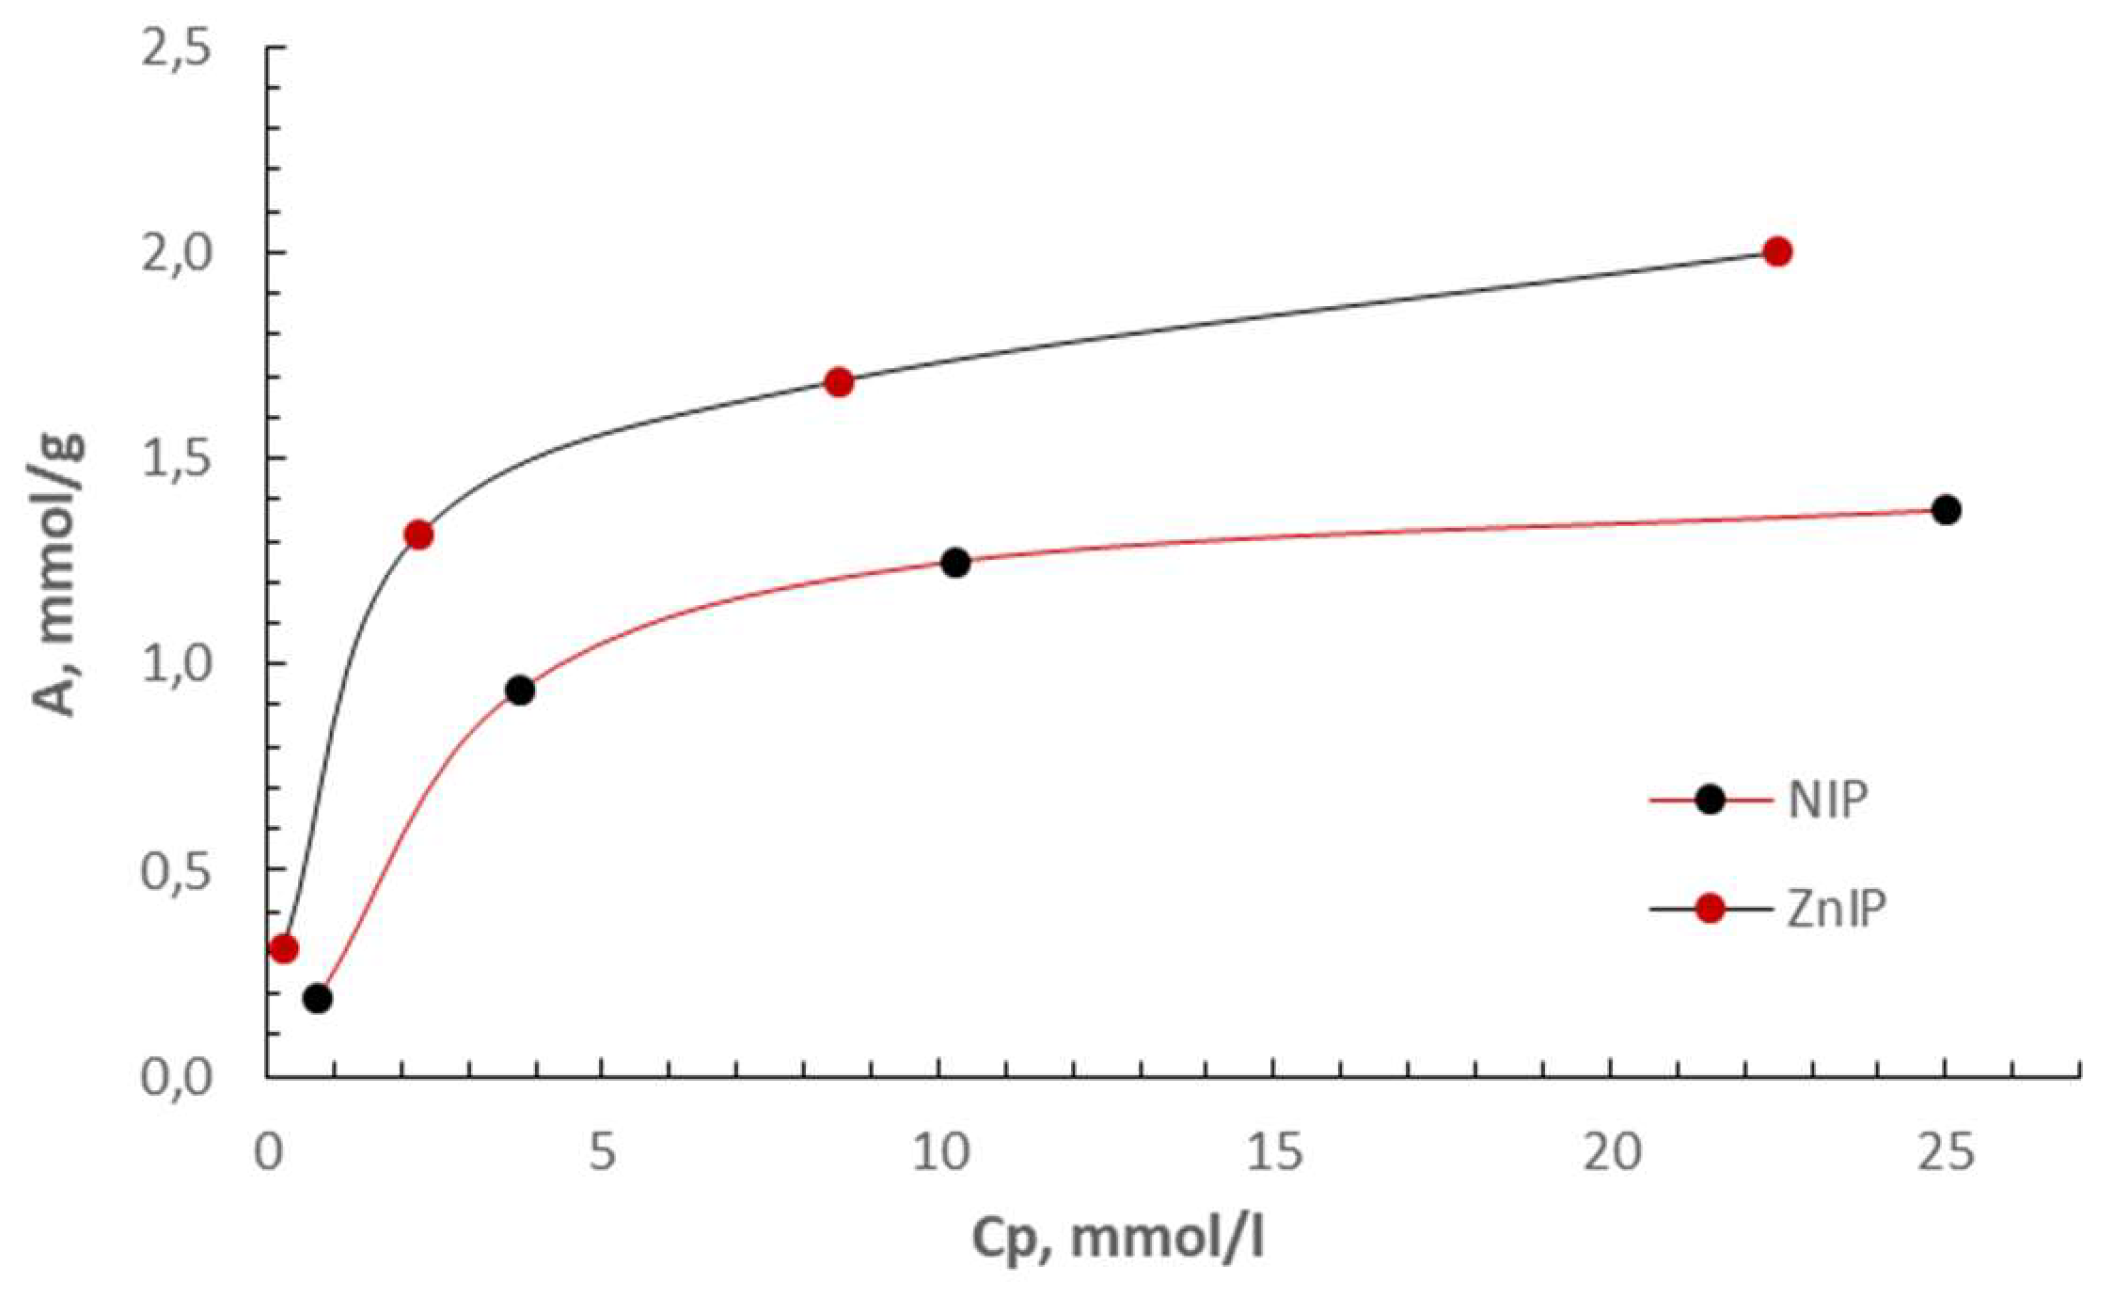
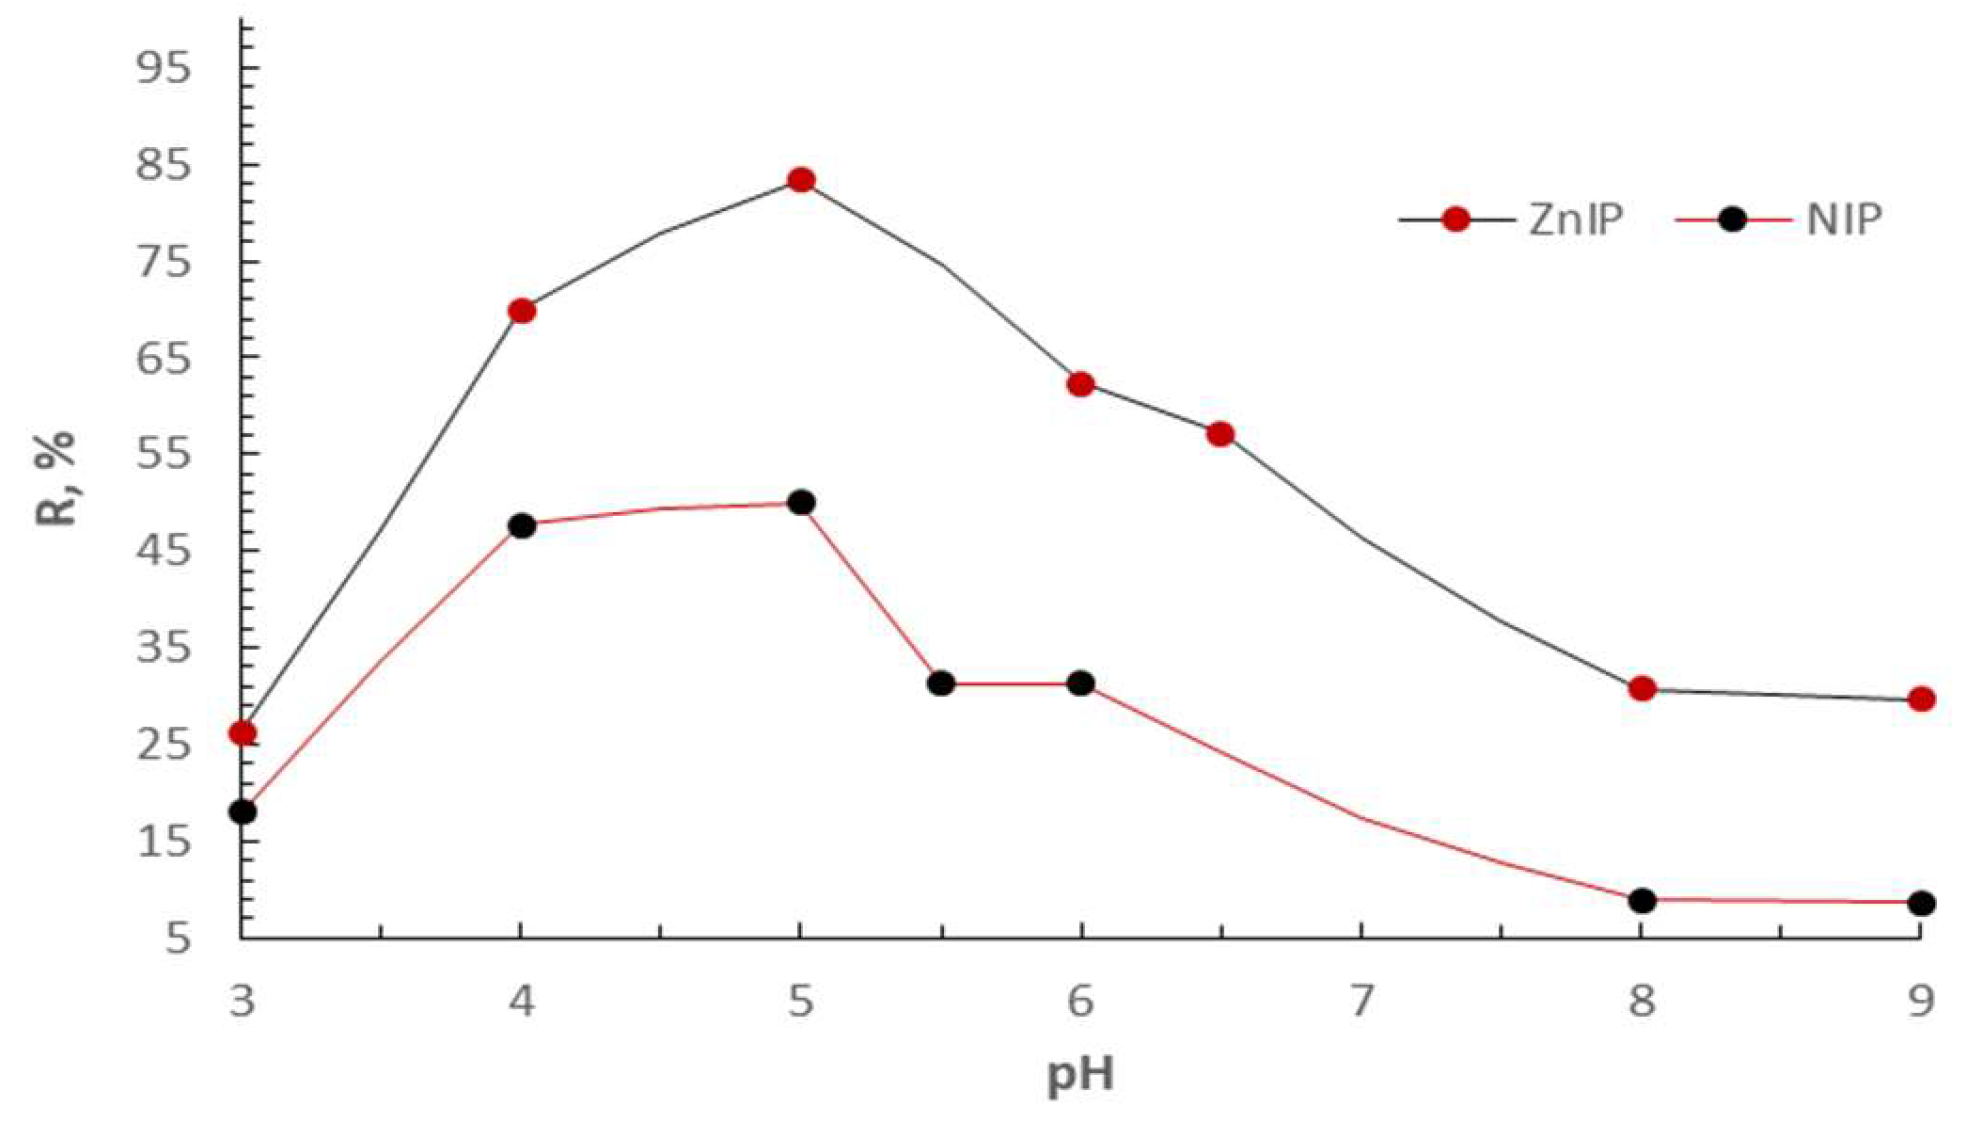
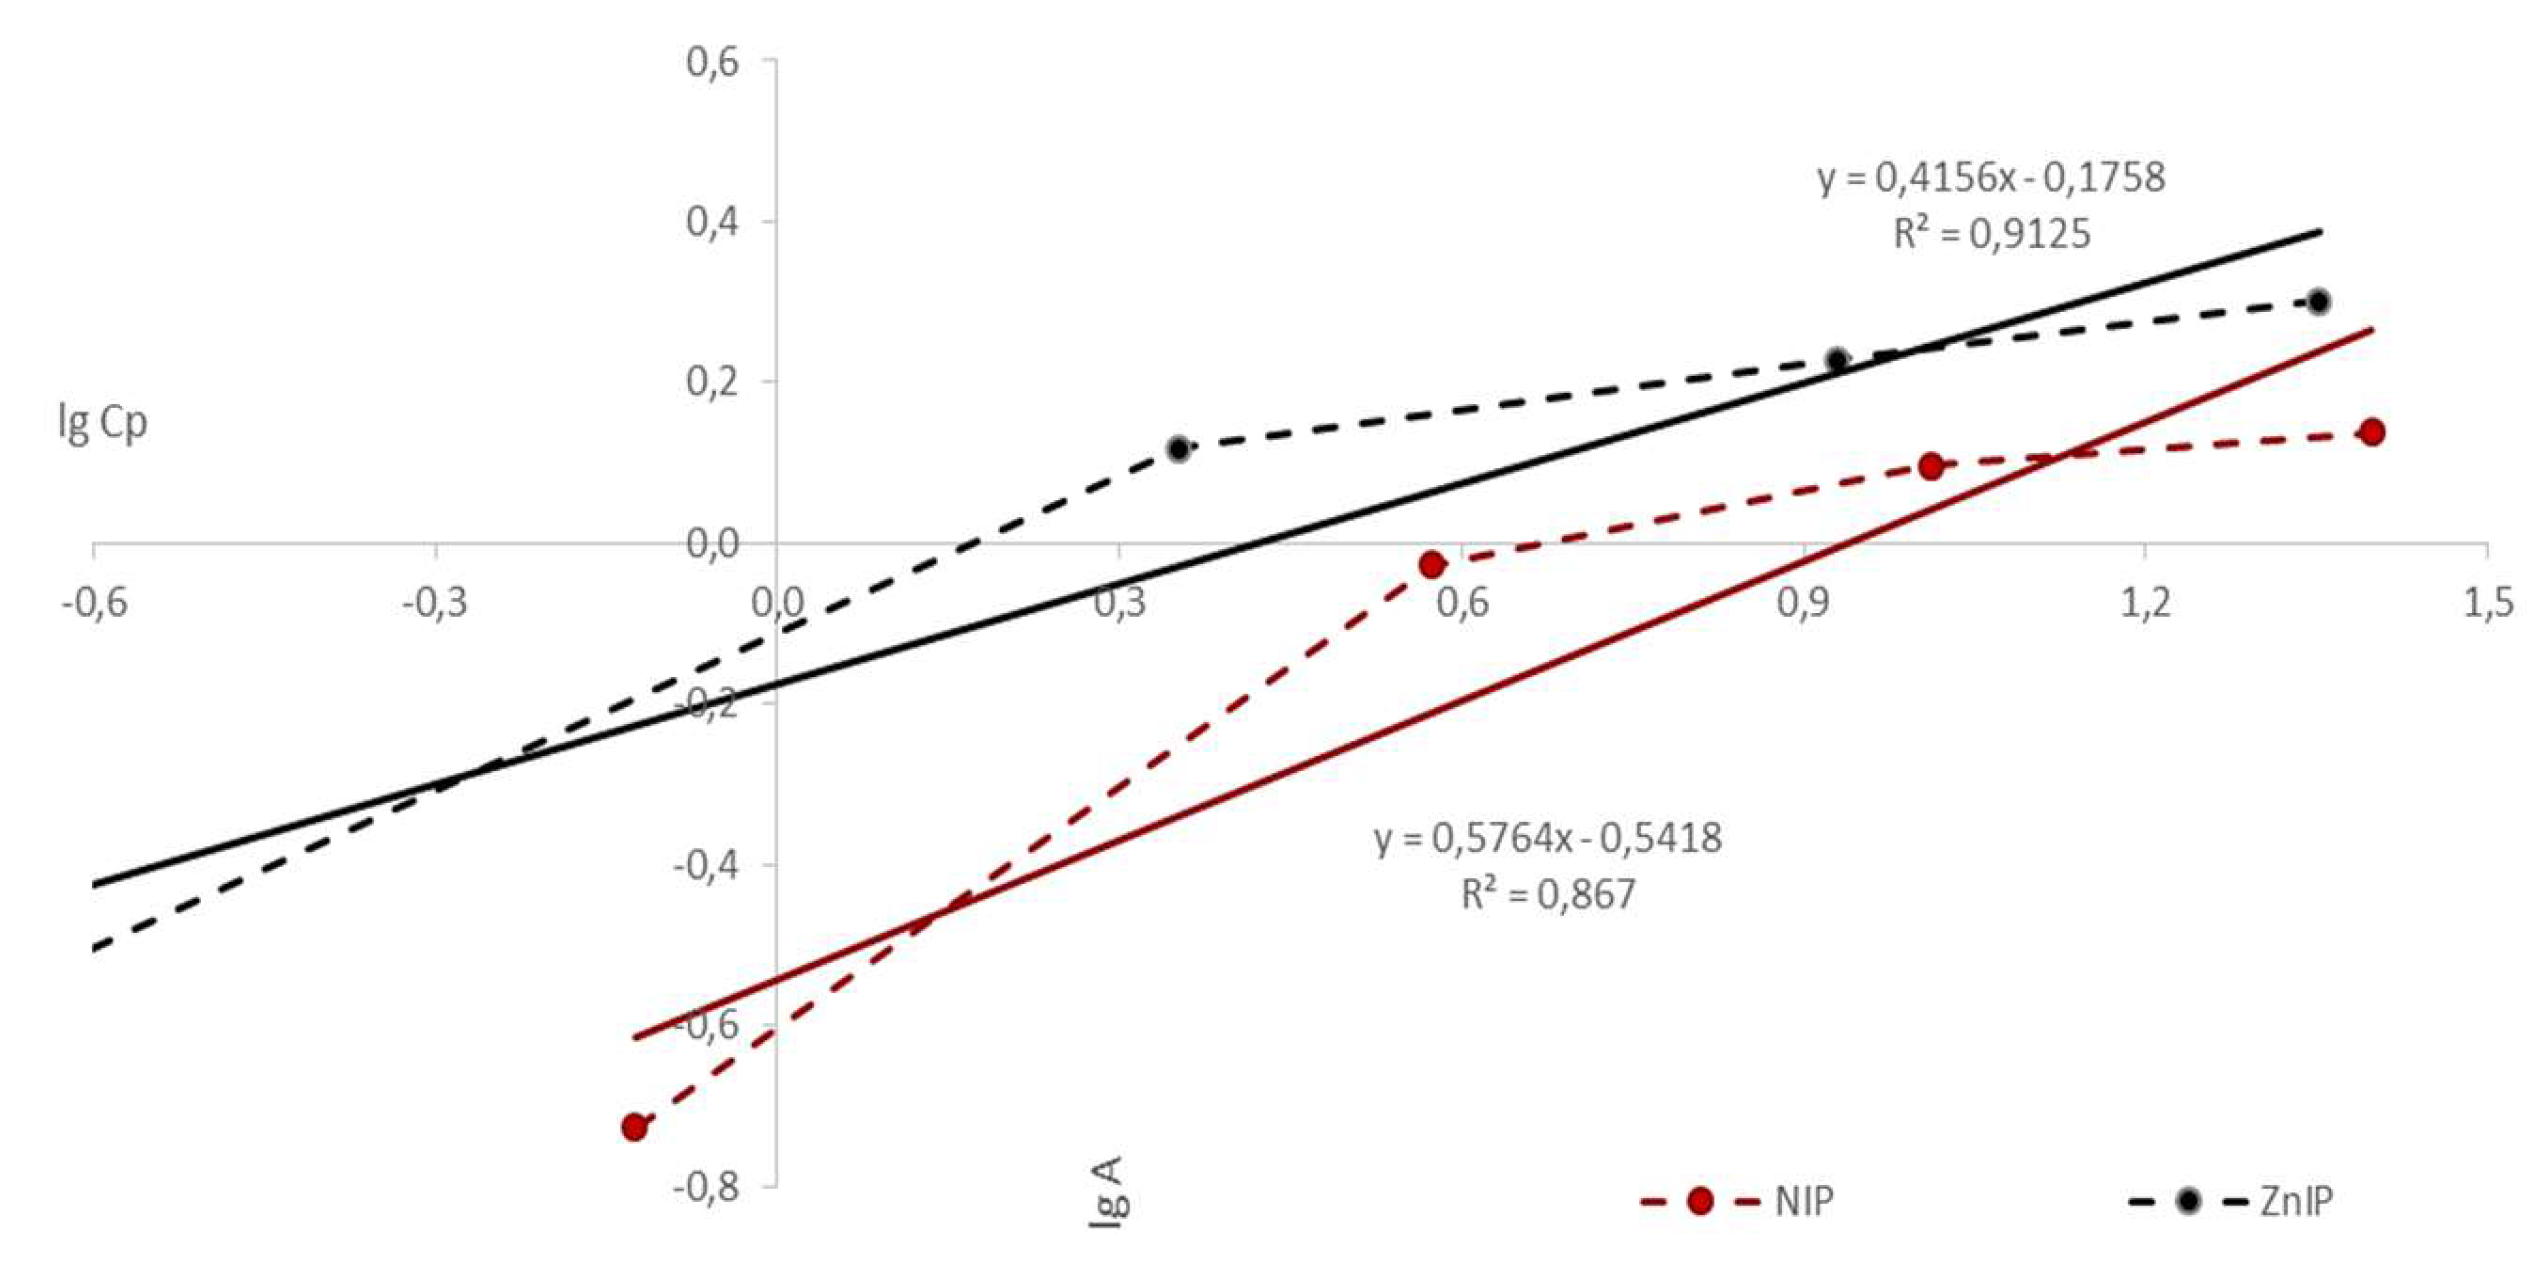
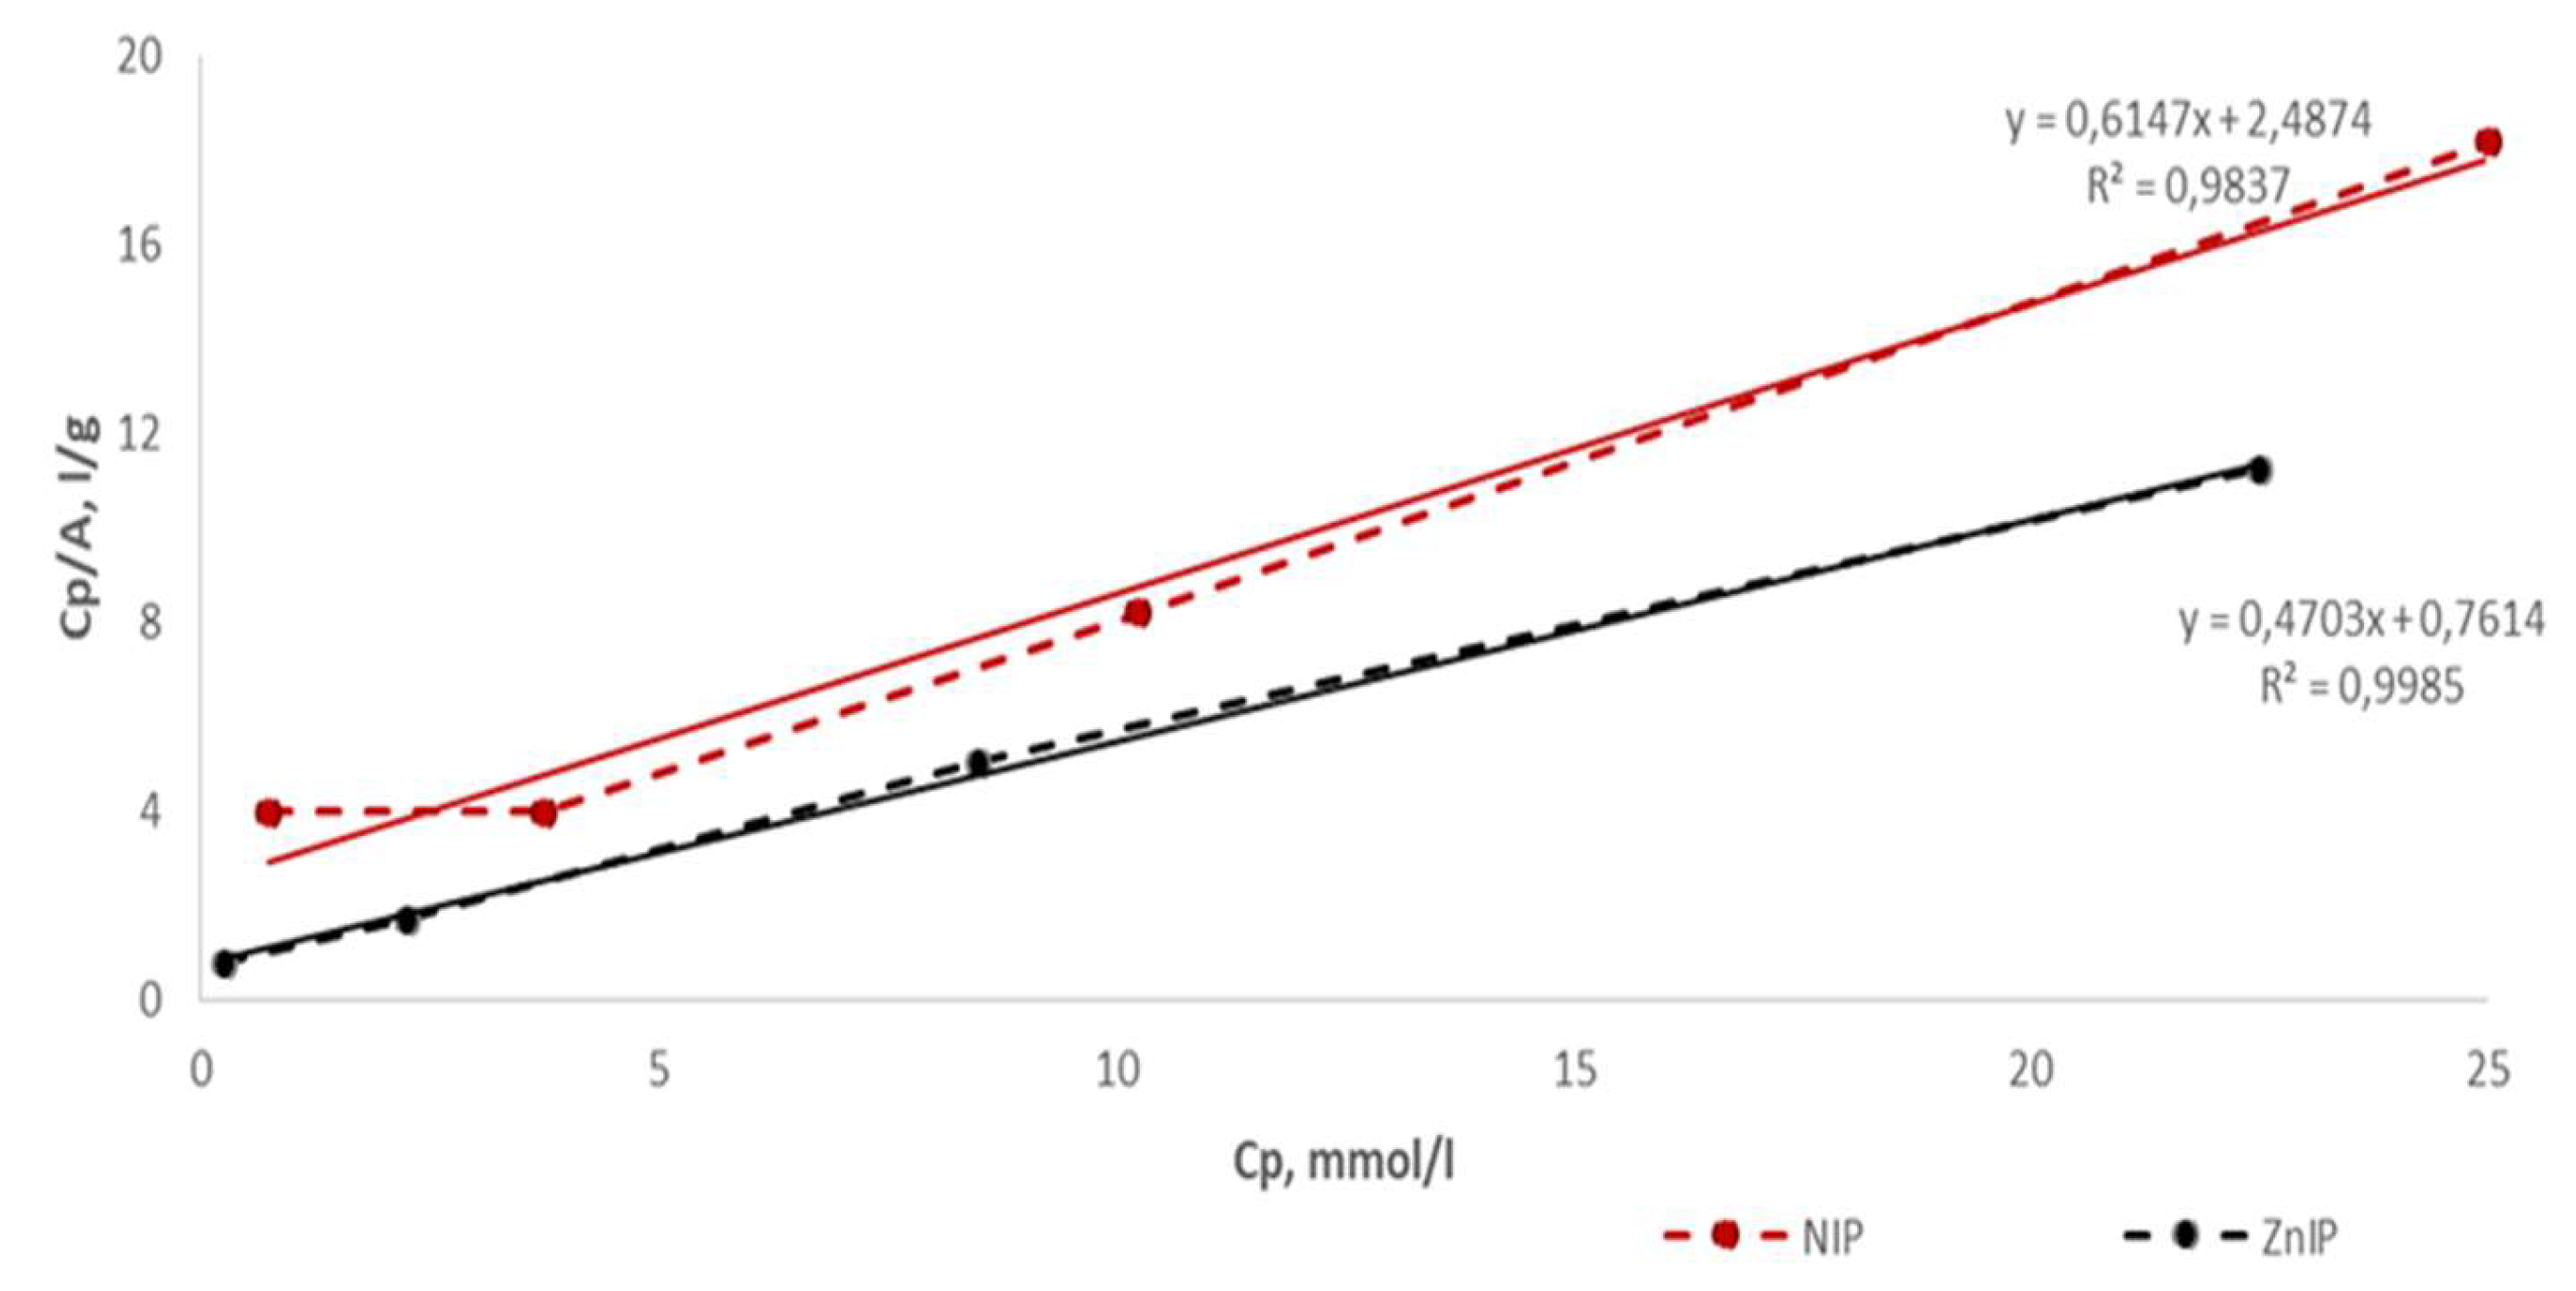
| № | Polymer | HA (mmol) | MAA (mmol) | Zn(CH3COO)2 (mmol) | Crosslinking agent (EGDMA, mmol) | Initiator (BP, mmol) |
| 1 | ZnIP | 1 | 1 | 1.00 | 10 | 0.1 |
| 2 | NIP | 1 | 1 | – | 10 | 0.1 |
| № | Polymer | Cg, % | Hg, % | Ng, % | Og, % | Σ(COOH+OH) mg-eq/g | Yield, % |
| 1 | ZnIP | 61.32±0.2 | 3.97±0.1 | 0.67±0.1 | 34.04±0.3 | 4,43±0.2 | 76.54 |
| 2 | NIP | 57.32±0.2 | 3.85±0.1 | 0.67±0.1 | 38.16±0.3 | 4.95±0.2 | 77.98 |
| The pseudo-order of the reaction | Sorbed ion Zn2+ zinc-imprinted polymer | ||
| First | lnC=1.4083-0.0118t | r=0.9973 | k1=0.0118 |
| Second | 1/C=0.1665+0.0067t | r=0.9813 | k2=0.0067 |
| Third | 1/C2=0.1001+0.0085t | r=0,9341 | k3=0.0085 |
| The pseudo-order of the reaction | Sorbed ion Zn2+ by a non-imprinted polymer | ||
| First | lnC=1.9653-0.0079t | r=0.9970 | k1=0.0079 |
| Second | 1/C=0.1234+0,0019t | r=0,9863 | k2=0.0019 |
| Third | 1/C2=0.0047+0.001t | r=0.9571 | k3=0.0010 |
| R, % | D·10-2 | IF | ||
| ZnIP | NIP | ZnIP | NIP | ZnIP |
| 83.33 | 50.00 | 12.50 | 2.50 | 5.00 |
| 70.00 | 50.00 | 5.83 | 2.50 | 2.33 |
| 44.26 | 32.79 | 1.99 | 1.22 | 1.63 |
| 26.23 | 18.03 | 0.89 | 0.55 | 1.62 |
| Polymer | k | b | KFr | n | r |
| ZnIP | 0.4156 | -0.1758 | 1.1832 | 2.4060 | 0.9125 |
| NIP | 0.5764 | -0.5418 | 2.0526 | 1.7348 | 0.8670 |
| Polymer | k | b | Maximum specific adsorption, A∞, mmol/g | Adsorption equilibrium constant, KL, l/mmol | r |
| ZnIP | 0.4703 | 0.7614 | 2.1262 | 0.6177 | 0.9985 |
| NIP | 0.6147 | 2.4874 | 1.6269 | 0.2471 | 0.9837 |
Disclaimer/Publisher’s Note: The statements, opinions and data contained in all publications are solely those of the individual author(s) and contributor(s) and not of MDPI and/or the editor(s). MDPI and/or the editor(s) disclaim responsibility for any injury to people or property resulting from any ideas, methods, instructions or products referred to in the content. |
© 2024 by the authors. Licensee MDPI, Basel, Switzerland. This article is an open access article distributed under the terms and conditions of the Creative Commons Attribution (CC BY) license (http://creativecommons.org/licenses/by/4.0/).


