Preprint
Article

Study of Thermal Fields Inside Pipes in Solar Collectors Working with Ionanofluids by Means of the Heatt® Platform

Altmetrics

Downloads

59

Views

26

Comments

0

A peer-reviewed article of this preprint also exists.

Submitted:

02 October 2024

Posted:

02 October 2024

You are already at the latest version

Alerts
Abstract
Solar electric and solar thermal energies are often considered as part of the solution to the current energy emergency. In the present work, a study of the characteristic length of tubes in flat photovoltaic-thermal (PVT) hybrid solar devices has been carried out using three heat transfer fluids: water, Emim-Ac ionic liquid and ionanofluid of graphene nanoparticles suspended in the above ionic liquid. Experimental measurements and numerical simulations have been performed using the HEATT® platform. Slower fluid velocities are recommended if high fluid outlet temperatures are the goal of the application, but this penalizes the overall thermal energy production. The characteristic process length, or most efficient distance at which heat transfer occurs, is not typically achieved in parallel tube PVT collectors; coil-type panels can improve the thermal and temperature performance of INFs in PVT solar collectors depending on the application.
Keywords: 
Subject: Engineering  -   Energy and Fuel Technology

1. Introduction

A consensus is emerging that renewable energies, and in particular energy from the sun, will play a central role in the context of the energy transition to a more sustainable model. This is evidenced by a growing body of literature on the subject, including references [1,2,3,4]. Solar energy is arguably the most pervasive, plentiful, and cost-free energy resource accessible to humanity [5,6,7,8]. Despite the fact that solar energy, encompassing both thermal and photovoltaic technologies, can be regarded as mature fields, it is evident that there is still considerable scope for enhancement in efficiency, particularly as new applications and demands emerge. Consequently, it is imperative to persist in research and integration of novel technologies to facilitate more effective utilisation of the solar resource [9].
As is well known, there are different ways of using solar energy. Low-temperature solar thermal energy obtained through flat plate collectors (FPSC) for the production of domestic hot water and other low-temperature applications was the most developed during the second half of the 20th century. [10]. In the last 10 years, however, it is photovoltaic solar energy that has seen spectacular development, becoming one of the main sources of electricity generation in many countries. [11].
One type of solar collector that is receiving increasing attention is the so-called hybrid photovoltaic-thermal (PVT or PV/T) collector [12], whose main attraction is that they simultaneously provide thermal and electrical energy, both of which are needed in multiple applications, both in the residential and service sectors and in industry. [13]. It can be called a two-in-one panel. PVT collectors are receiving increasing interest, sometimes as a replacement for PV panels in domestic installations [14], as shown by the fact that this market is growing rapidly, with a growth rate of around 13% in 2021 [12]; hybrid collectors from different manufacturers and models can be found on the market. [15].
In their most classic configuration, these panels are composed of a first layer of photovoltaic cells, under which there is a solar thermal collector very similar to the conventional FPSC, capable of collecting a good part of the solar radiation that the photovoltaic cells are not able to take advantage of [12,15]. The photovoltaic cells, capable of converting around 20% of the solar radiation into electrical energy, benefit from the cooling effect that the heat transfer fluid of the thermal part exerts on them, thus reducing their efficiency loss at high external temperatures, while the thermal part is adversely affected because it receives less solar radiation than it would if it did not have to pass through the layer of photovoltaic cells. However, this reduction in thermal efficiency is not very important, because the temperatures reached in the absorber plate of the PVT collector, and consequently the heat losses, are lower than in the case of FPSC collectors. Consequently, the combined thermal-electrical efficiency of the PVT panel per unit area exceeds that of a photovoltaic or thermal panel, reaching up to 80% in certain applications [15]. Compared to photovoltaic collectors, the additional thermal output of hybrid systems makes them more cost-effective than stand-alone photovoltaic and thermal units with the same total aperture area. [12].
There are currently many publications on PVT collectors, most of which use water as the heat transfer fluid [14,16,17]. Recently, several researchers have optimized the electrical and thermal production of hybrid collectors by modeling their operating conditions [18,19], including through artificial intelligence and machine learning [20].
Another line of research is that which explores new heat transfer fluids that improve the performance of PVT collectors, both in their function of cooling the photovoltaic cells and in their thermal production, in both cases to improve the efficiency of the whole, which is largely derived from the thermophysical properties of the fluid. As in FPSC, in PVT collectors, in addition to water, other fluids such as glycol solutions, brines or, more recently, nanofluids are used [21,22,23].
The addition of suitable nanoparticles to a base fluid, such as water, can significantly improve its thermophysical properties [24]. For solar thermal or thermal-photovoltaic applications, usually the most significant property on which the performance of the collectors depends is the thermal conductivity of the heat transfer fluid [10]. In solar energy, nanoparticles of metals, metal oxides, graphene or other materials with high thermal conductivity have been used, which significantly increase, depending on their concentration and particle size, the thermal conductivity of the heat transfer fluid, so their effect is always beneficial [25,26].
Emmanuel et al. concluded that nanofluids of different types show better performance in PVT modules compared to other collector components due to their enhanced thermal conductivity that improves heat transfer as well as the cooling process of PV panels [15]. Said et al. found that the use of nanofluids typically improves the efficiency of the hybrid collector by more than 5% [27]. Abdelrazik et al. analytically evaluated the optical, stability and energy performance of water-based MXene nanofluids in a hybrid PVT collector, proving the suitability of this type of nanofluid for improving collector performance [28]. Aslfattahi et al. evaluated the performance enhancement of concentrated photovoltaic thermal collector using also MXene nanofluids employing silicone oil as the base fluid for applications up to 150°C [29].
Water is a heat transfer fluid with thermal properties that are hard to overcome, although it has certain limitations such as high vapor pressure, relatively low boiling point and high melting point, corrosion, etc. FPSCs normally operate below 100 ºC, but can reach this temperature or higher in severe weather conditions or failures, with steam production, which can lead to plant shutdown and overheating [10]. Therefore, it is very interesting to use low vapor pressure fluids as working fluid for medium-high temperature applications.
Ionic liquids (IL) are organic salts that have a melting point below 100ºC, can remain in the liquid phase up to approximately 400ºC and in many cases, their freezing points are below 0ºC. In addition, they have a very low vapor pressure, high thermal and chemical stability and, very important in practical applications, no corrosion problems. On the other hand, their thermal conductivity and specific heat are significantly lower than those of water, their viscosity is much higher and their price is currently very high. On the other hand, ILs are also capable of suspending nanoparticles that improve their heat transfer properties so that they can approach those of water or other fluids, without losing their thermochemical advantages [30]. These properties make ILs, alone or as a base fluid for nanofluids, interesting candidates for use in solar energy in medium and even high temperature applications.
Nieto de Castro et al. [31] introduced the term ionanofluids (INFs) for a new generation of nanofluids where the ILs play the role of a base fluid. ILs have proven their suitability for producing very stable suspensions with many nanoparticles of different nature, which can significantly improve the thermophysical properties of the base fluid. Compared to ILs, INFs offer better thermal properties, specific heat and thermal conductivity, among others, at low cost. Nanofluids can be made more stable by using ionic liquids, whose anions and cations provide an electrostatic layer around the nanoparticles that prevents them from accumulating [32]. Jóźwiak et al. [33] reported substantial increases in thermal conductivity of up to 70% with high aspect ratio carbon nanotubes (CNTs). In the case of graphene nanoplatelets (GNPs), remarkable increases in thermal conductivity of about 30% were observed [34]. Hasečić et al. numerically modeled and analyzed the heat transfer performances of ionic liquids [C4mpyrr][NTf2] and ionanofluids with Al2O3 nanoparticles under a laminar flow regime [35].
The use of ionanofluids in solar energy has not been widely cited to date. Das et al. numerically evaluated the behavior of a binary ionanofluid based ionic liquid (IL) + water binary solution with two-dimensional MXene (Ti3C2) nanoadditives at different concentrations in a PV/T hybrid solar system, finding that the optimum concentration was 0.20 wt % [36]. Shaik et al. [32] modeled an artificial neural network and optimized the thermophysical behavior of MXene ionanofluids for solar photovoltaic-thermal hybrid systems by analyzing nanoparticle concentration and temperature. Moulefera et al. have recently published the synthesis and characterization of different ionanofluids (INFs) based on 1-ethyl-3-methylimidazolium acetate ([Emim] Ac) ionic liquid (IL) or [Emim] Ac/water mixtures as base fluid and graphene oxide (GO) as nanoparticles, as well as their performance evaluation in an experimental flat plate solar thermal collector (FPSC) [9]. These works are an example of the interest in the use of INFs in solar energy.
One circumstance to take into account is that in solar collectors, either FPSC or PVT, the flow that typically occurs is of the forced laminar type, given the low velocity and diameter of the tubes through which the fluid circulates. This produces a temperature field in the fluid section that is far from uniform, as shown by Seco-Nicolás et al. [37]. This field depends on the thermofluidic properties of the fluid and the flow conditions and is related to the concept of characteristic length [38], which marks the length of pipe required for the thermal process to be considered complete and, therefore, the length of pipe required for an efficient use of the pipe, which has undoubted consequences for the design of equipment. This characteristic length can be obtained from the evaluation of the thermal field inside the pipe through the free access platform HEATT® (HEATT (um.es)) [39,40]. Given that commercial solar collectors are currently designed assuming that the working fluid is water or another fluid with properties of the same numerical order [12], the use of fluids with thermofluidic properties that may be very different requires a specific evaluation of their thermal field and characteristic length.
From ionanofluids (INFs) produced by addition of graphene nanoparticles (GNP) to 1-ethyl-3-methylimidazolium acetate [Emim]Ac ionic liquid (IL) characterized by measuring their physicochemical and thermophysical properties [9], the objectives of this work have been:
  • Test the base ionic liquid and the INF produced as heat carrier fluid in a commercial solar thermal-photovoltaic hybrid (PVT) collector to compare its performance with that of water and determine the suitability of current PVT collectors for the use of INFs.
  • Study by numerical simulation by means of the HEATT application the thermal field inside the PVT collector tubes in order to optimize the tube length and the operating conditions of the collector based on the concept of characteristic length.

2. Materials and Methods

2.1. Materials

Water, IL 1-ethyl-3-methylimidazolium acetate (≥ 95% purity), [Emim] Ac supplied by IoLiTec (Heilbronn, Germany) and ionanofluid (INF) 1% by mass of graphene nanoparticles in the above ionic liquid (Gr-INF) were used as working fluids.
Physical methods such as agitation, sonication, homogenization, microwave, plasma or laser ablation, as well as chemical methods such as covalent or non-covalent functionalization have been used to prepare the ionanofluid [41]. The main physicochemical properties measured for the characterization of INF are thermal and electrical conductivities, viscosity, density, specific heat capacity, among others. The INF produced showed high stability [9]. Table 1 shows the average value of the properties in the temperature range used in this work. For more details, see [9]. Values of IL [Emim]Ac have been obtained from Ionic Liquids Database - ILThermo (nist.gov).

2.2. Solar collector tests

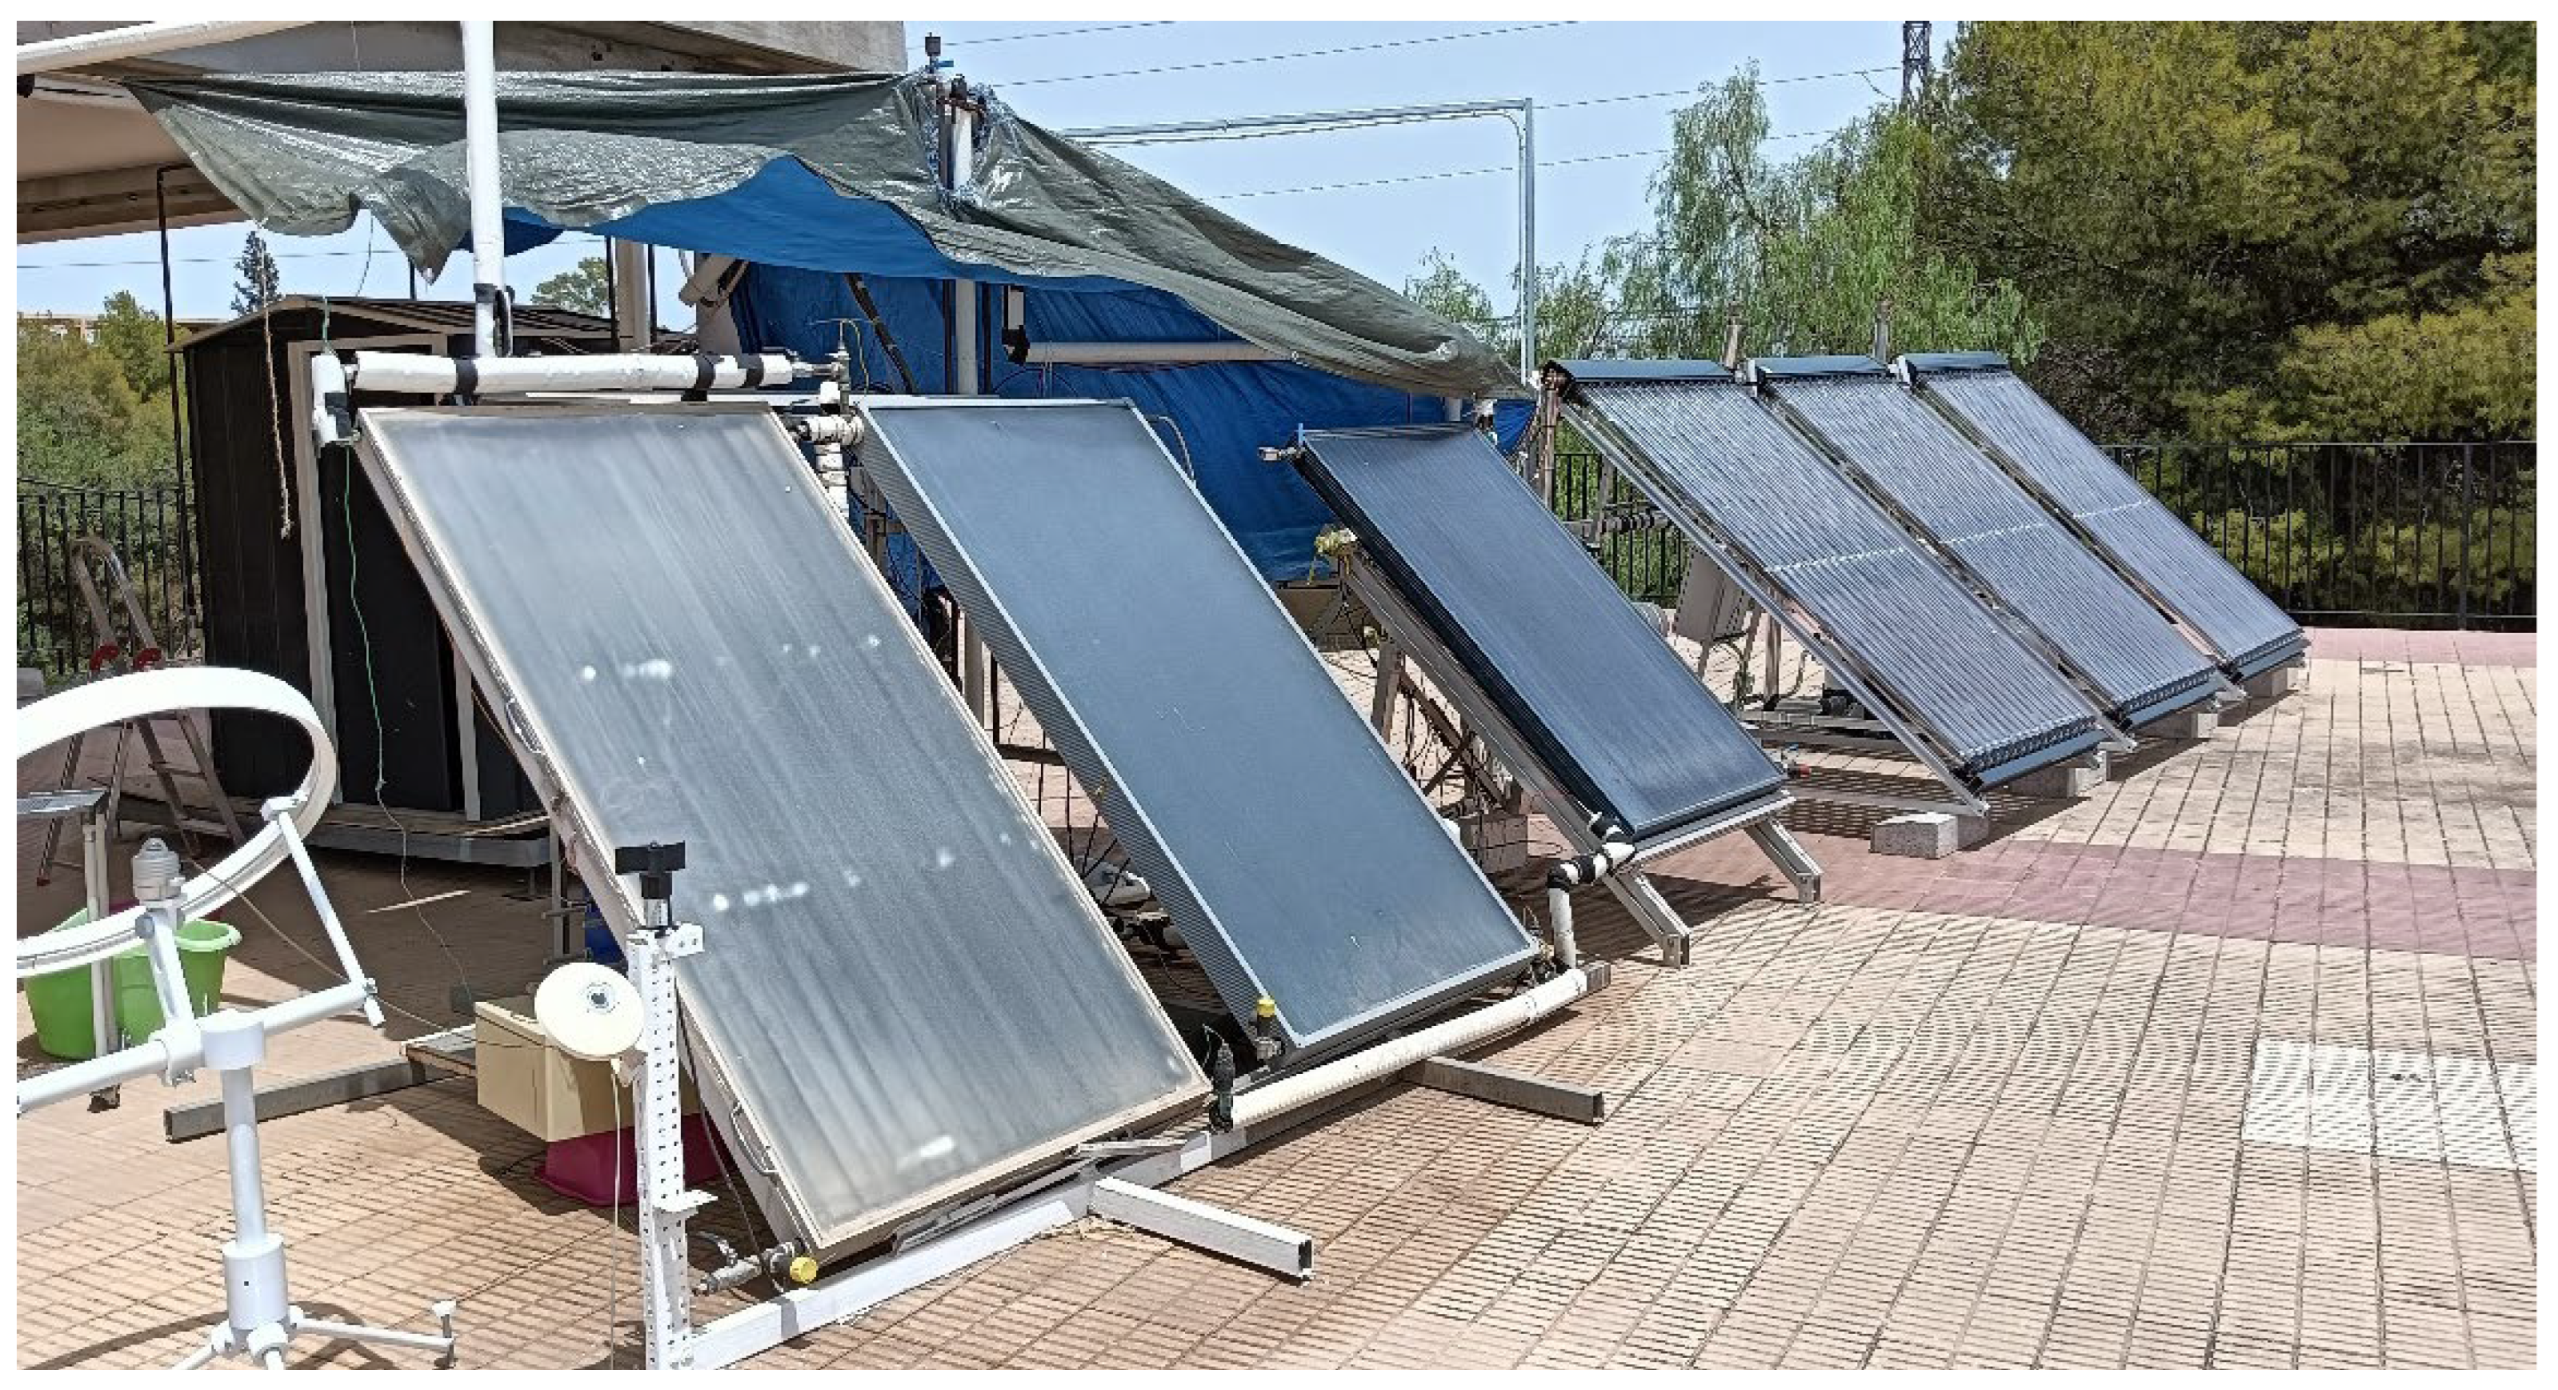
Experimental tests were carried out at the Solar Laboratory of the University of Murcia. (Spain). The laboratory is equipped with different types of commercial solar collectors, as well as experimental ones, including a hybrid solar thermal-photovoltaic (PVT) collector of the Endef brand (Hybrid solar panel - Endef), in addition to appropriate measuring instrumentation. Figure 1 shows a current image of the plant, showing conventional solar thermal collectors (left), PVT hybrid collector (in the center, inside the circle) and vacuum tubes (right). The Endef collector is of the riser header configuration [12] or parallel-riser type, in which the inlet (bottom) and outlet (top) of the collector are connected by a set of parallel tubes (risers) through which the heat transfer fluid flows [42].
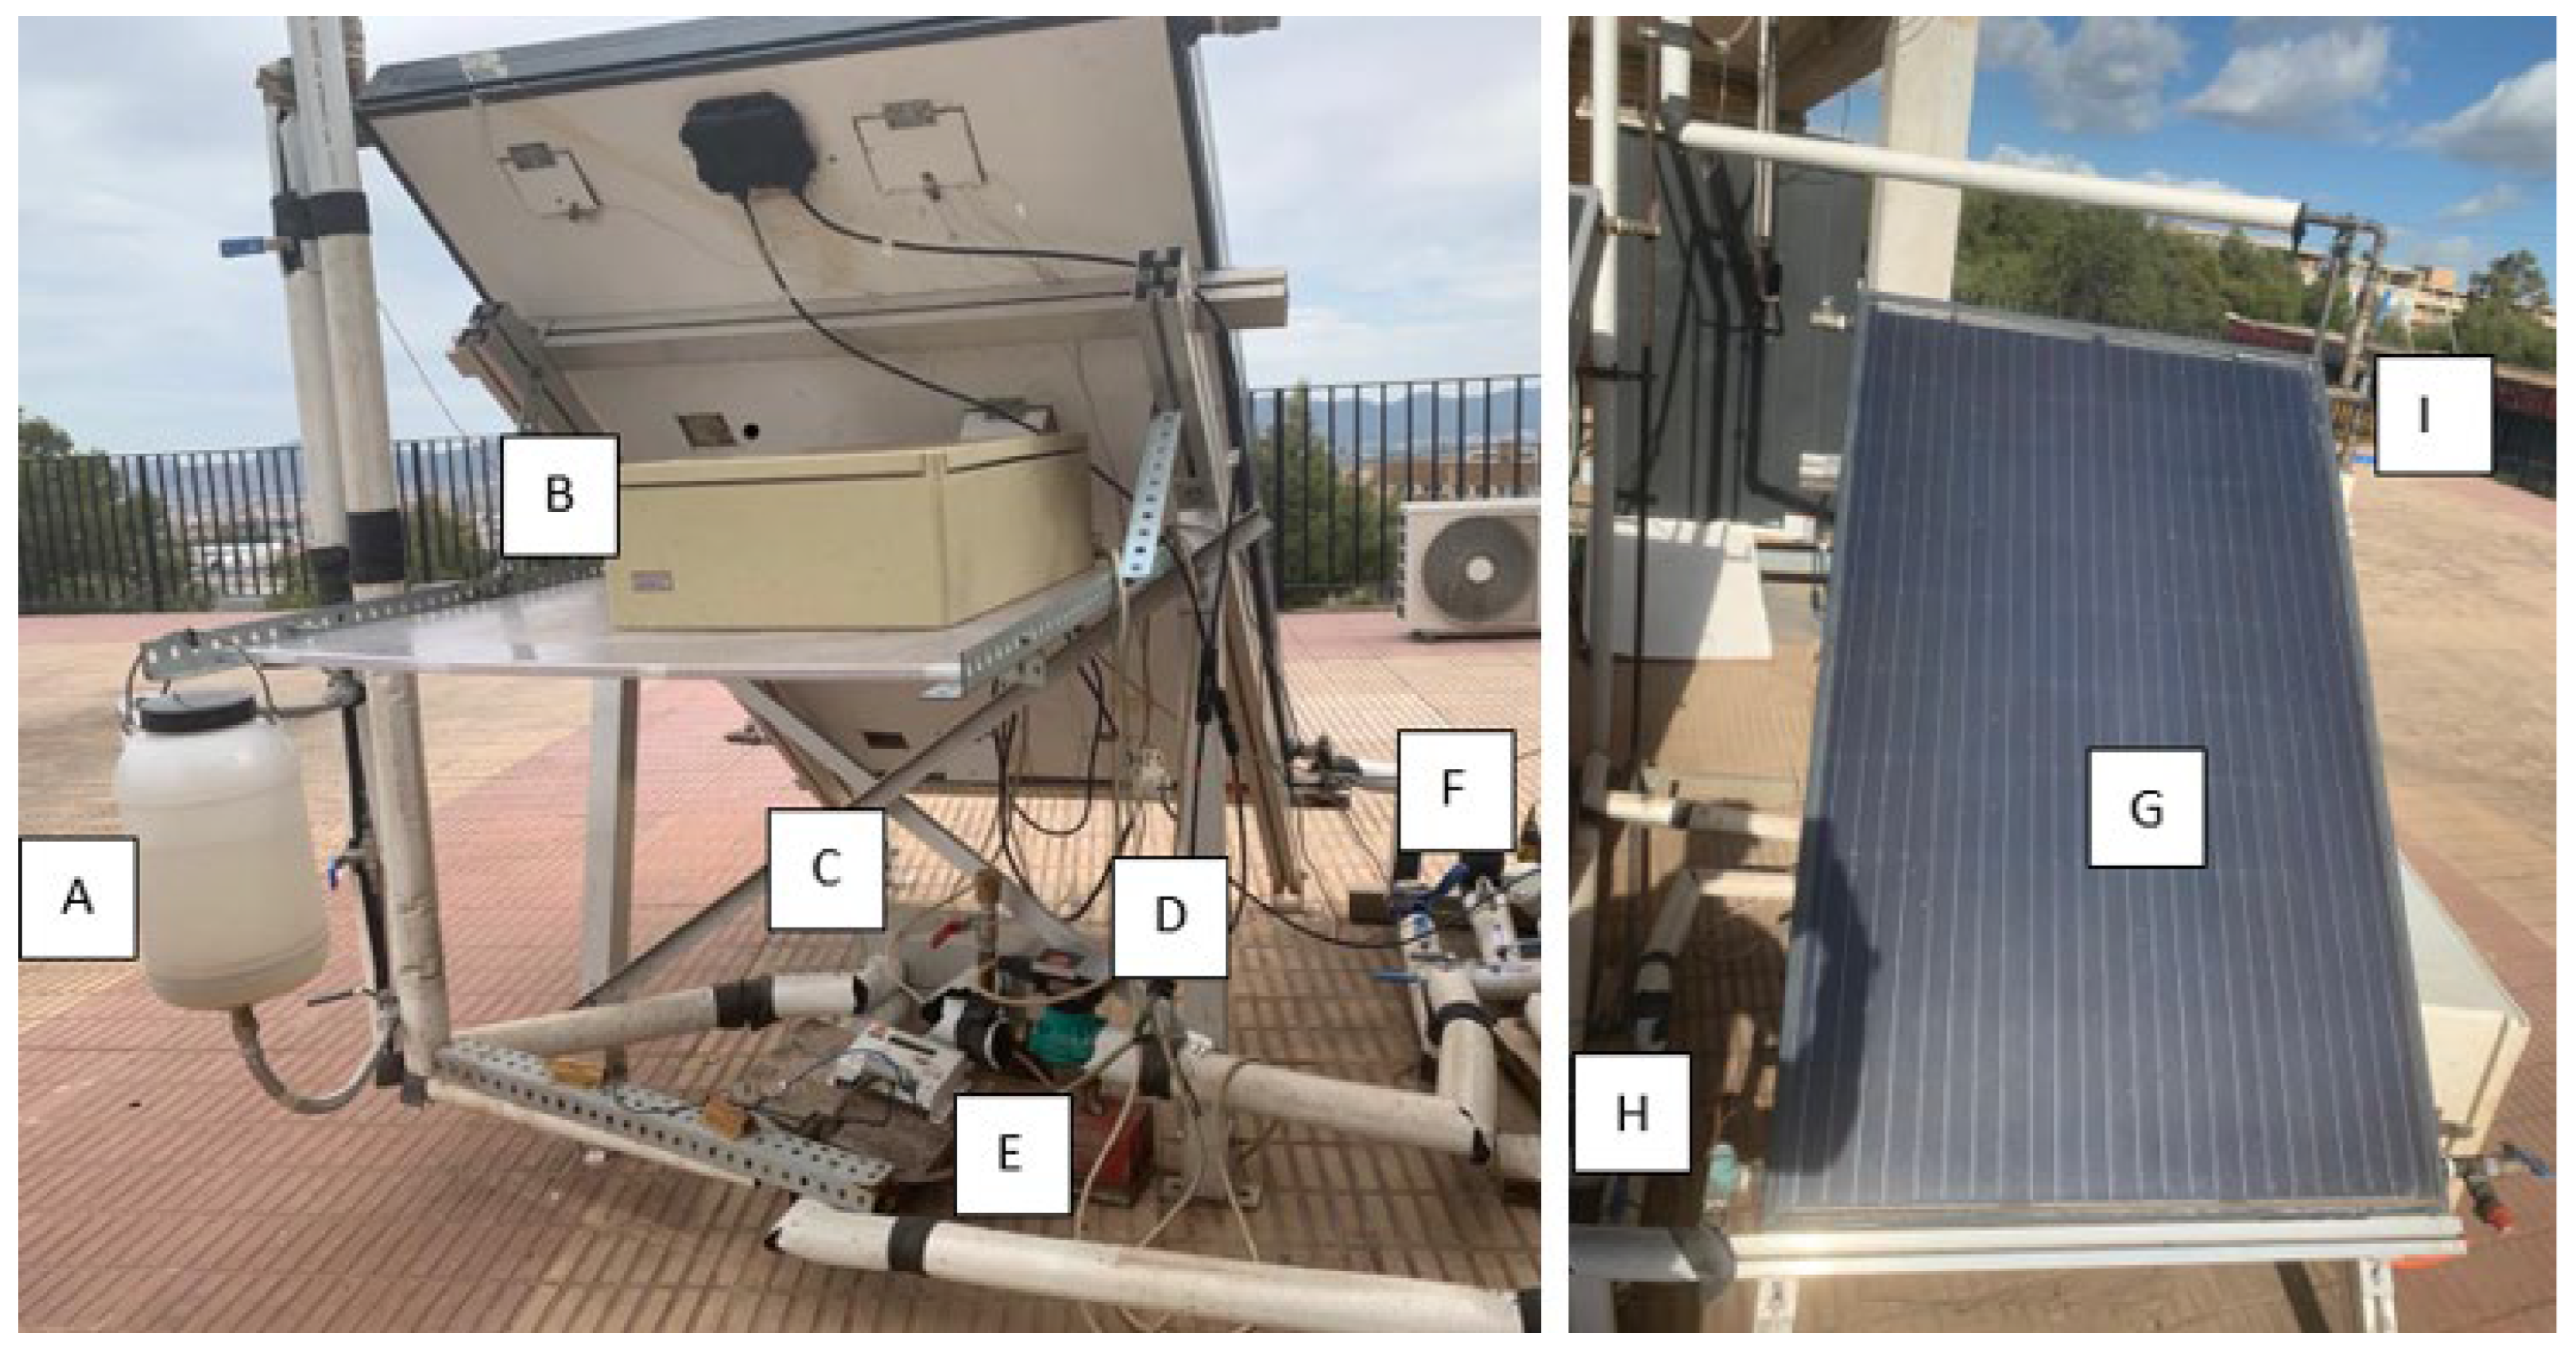
Figure 2 shows details of the PVT collector installation and instrumentation. Table 2 shows the main dimensions of the PVT collector. The measuring instrumentation is periodically checked and calibrated and the tests were carried out following the basic indications of the current solar collector testing standards. [43].
Figure 1. Solar collectors at the Solar Laboratory of the UMU. Conventional solar thermal collectors (left), PVT hybrid collector (centre) and vacuum tubes (right).
Preprints 120064 g001
The useful heat produced in the solar collector, Qcol (W), is accounted by Eq. (1), being m ˙ (kg s-1), the mass flow rate and cp (J kg-1K-1) specific heat of the fluid.
Q c o l = m ˙ · c p T o u t T i n = m ˙ · c p · T ,
The electrical energy produced, Pel, is simply the product of the voltage V (V) and the intensity I (A) generated in the collector, Eq. (2).
P e l = I · V ,
The thermal efficiency of the collector and the temperature rise of the fluid were analysed in order to show the performance of the PVT collector. The thermal efficiency, denoted as ɳth, is determined using the stationary efficiency method outlined in the UNE-EN 12975-2:2006 standard [44], as well as in earlier literature [10,25,27,45], Eq (3), being G the solar irradiance (W m-2).
η t h = m ˙ c p ( T o u t T i n ) S c o l G ,
The overal collector efficiency can be calculated using Eq (4):
η o v = Q c o l + P e l S c o l G ,
Figure 2. Experimental set of solar PVT panel. A) Tank, B) Data logger, C) Heat exchanger, D) Pump, E) Photovoltaic regulator, F) Flowmeter, G) Solar panel, H) Inlet temperature probe and I) Outlet temperature probe.
Preprints 120064 g002

2.3. Numerical simulation: the HEATT® Platform

The numerical simulations have been carried out by means of the HEATT® Platform [46]. This platform can solve the thermal temperature distribution of homogeneous fluids flowing inside round tubes in a forced laminar regime [39], that usually occurs in solar collectors. The platform is free and easy to use (HEATT (um.es)). It is currently in version 1.0, and a more advanced version is under development.
Figure 1. Home page and logo of HEATT.
Preprints 120064 g007
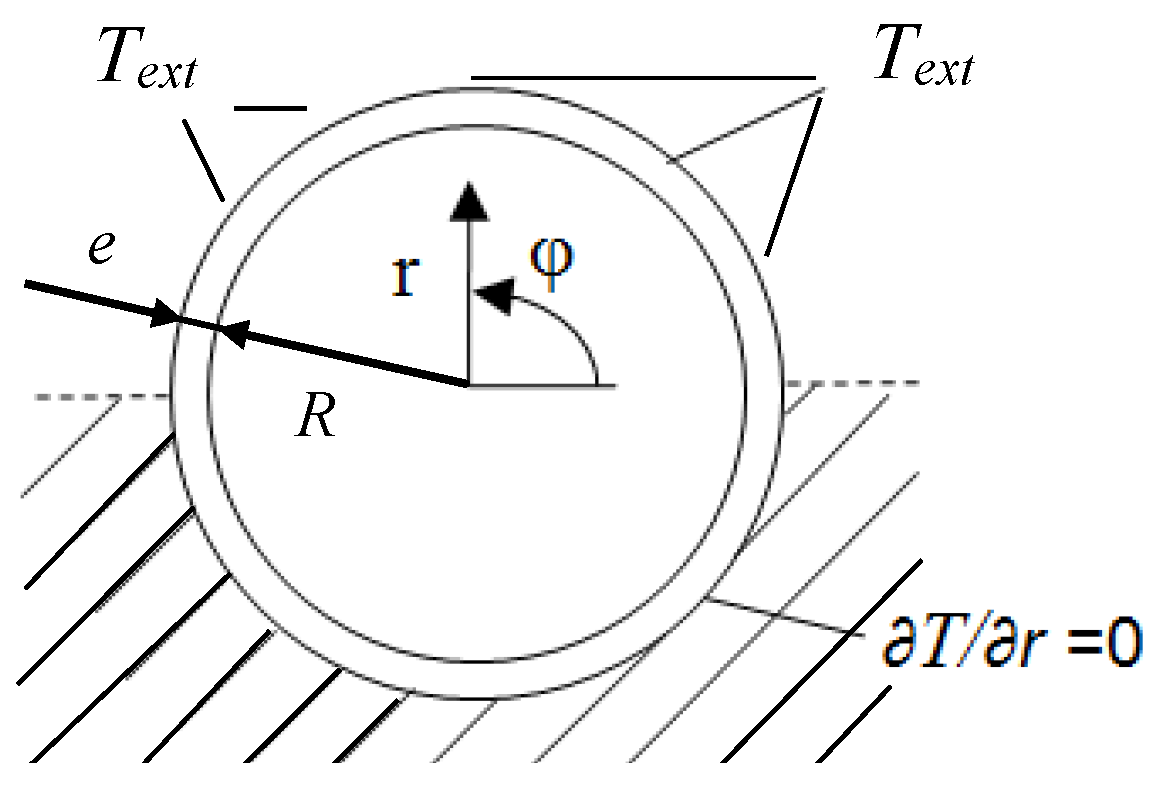
The platform is based on a program that solves the problem known as Conjugate Extended Graetz Problem [47] but subjected to radially asymmetric boundary conditions which makes a 3D model necessary. Essentially, the behavior of a fully developed flow of a Newtonian fluid under forced-laminar convection conditions circulating inside a circular duct in Tin is studied. At a certain point (in this case when the fluid enters the solar collector) the upper part of the external surface of the tube is subjected to the temperature Text (Figure 4), the lower part of the tube surface being thermally insulated. Consequently, the fluid begins to heat up, ideally, if the tube is long enough, until it reaches the external surface Text.
The model considers heat transfer by conduction through the tube and the fluid itself, both in radial and axial directions. On the other hand, laminar flow avoids mixing of the different fluid layers, while buoyancy is not relevant as there is no natural convection [48]. The conditions required to consider forced laminar flow were established by Suryanarayana [49], and are summarized in the compliance with the dimensionless values in Table 3, where ρ is the density, v the fluid velocity, μ the dynamic viscosity, g the gravity accelation, β the thermal expansion coefficient and ΔT the temperature gradient in the tube surface.
This process is very similar to that occurring in solar collectors. For further details on the physical and numerical model, including boundary conditions, see [37,38,39].
Figure 2. HEATT Physical modell.
Preprints 120064 g008
Applications of the programme include solar thermal collectors, where its results have been verified [37], and other equipment where the forced laminar flow conditions [49] and the boundary conditions of the problem are satisfied. Although the boundary condition of a solar collector is more similar to that of a constant external heat flow over the surface of the tube, the results of the temperature evolution with the boundary condition used by HEATT (constant external temperature) have been validated in [37] to predict the radially asymmetric temperature field inside the tubes of solar collectors, and under these conditions it is used in the present work.

2.4. Characteristic length

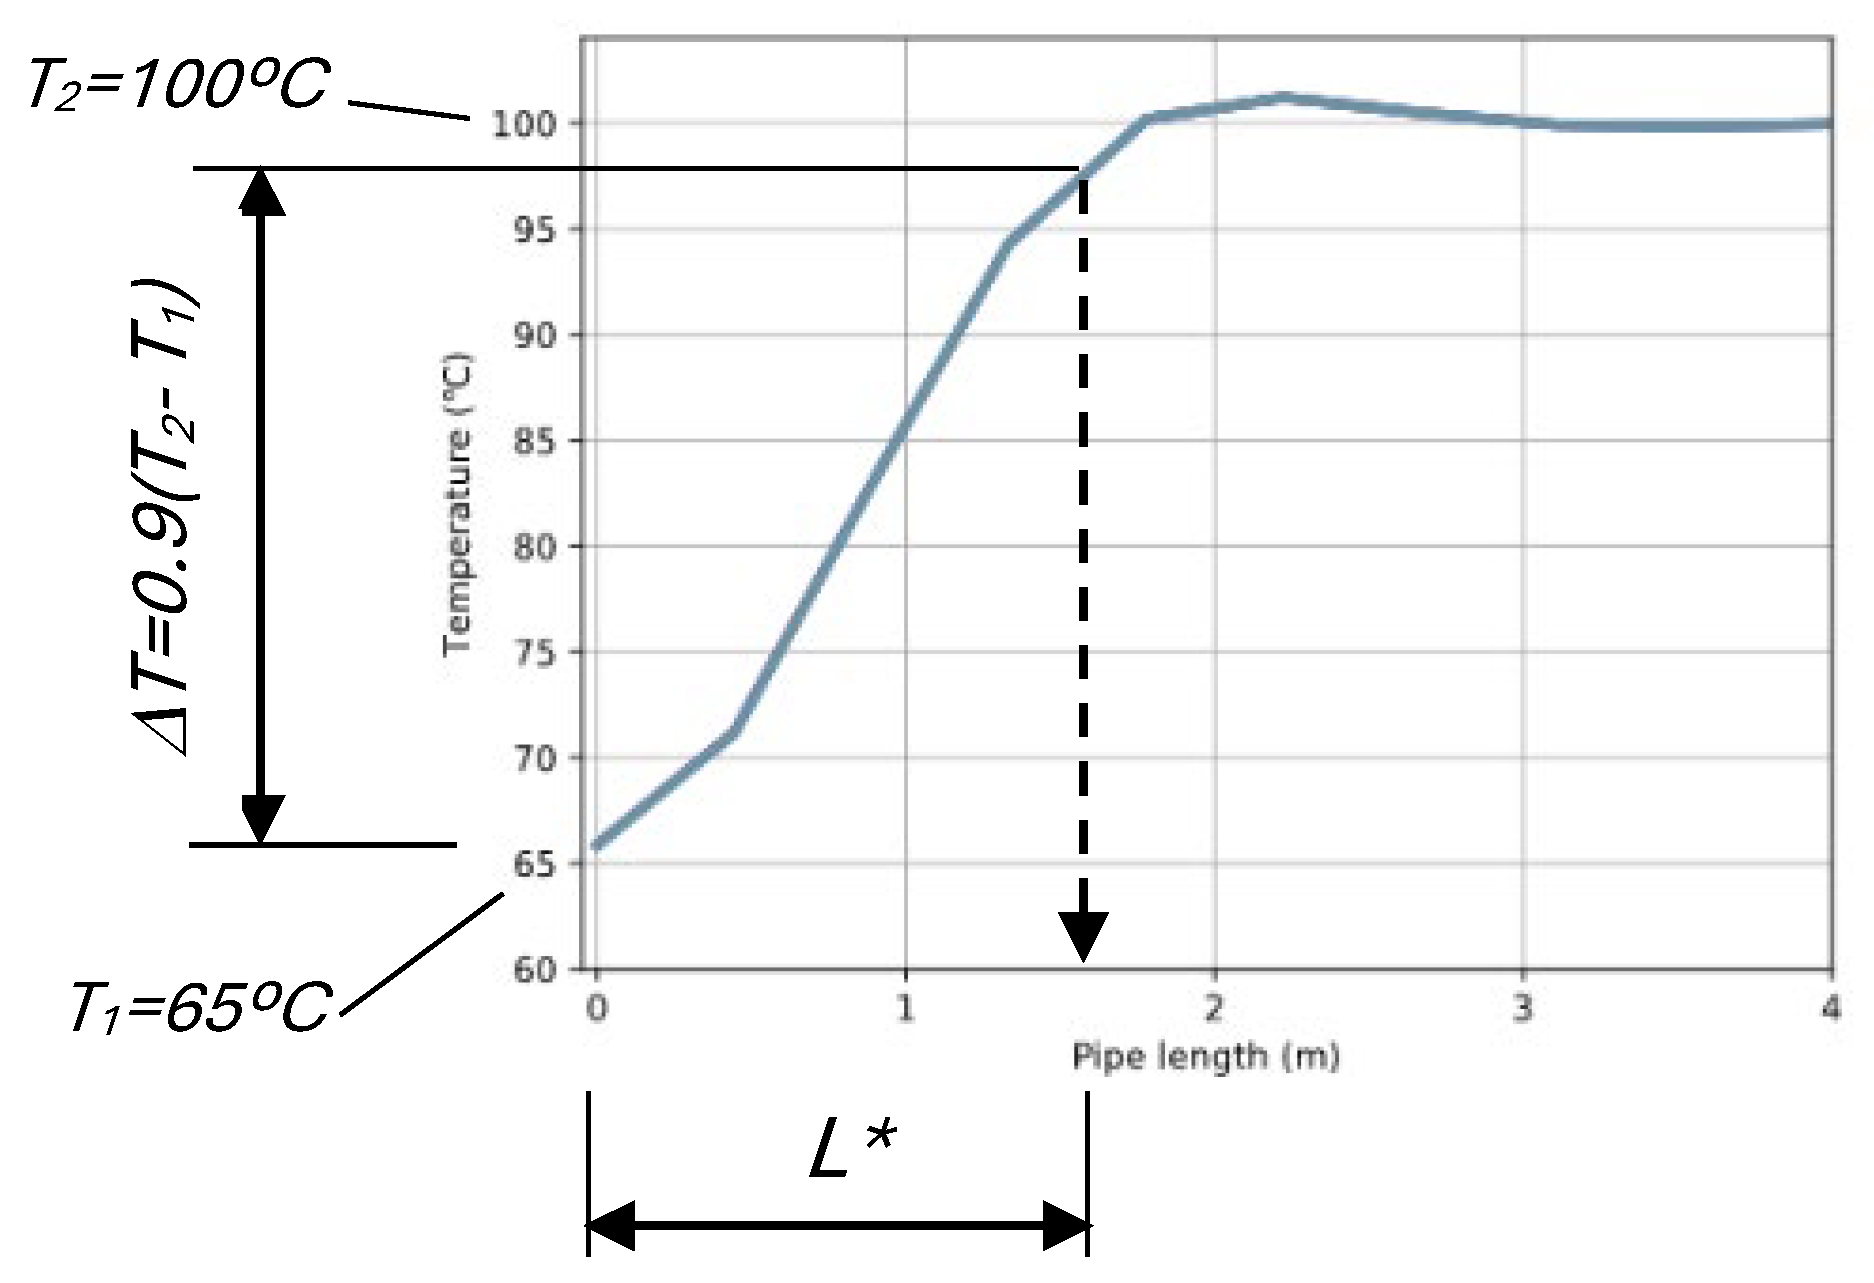
The so-called characteristic length, L*, is a hidden quantity, which means that it cannot be measured with standard meters, with different meanings depending on the process. To the one considered in this work the characteristic length reveals the length needed for the potential heat transfer process to be completed [38,50,51,52], i.e., when the entire fluid reaches, or at least aproaches, the external temperature. In this case, it has been measured as the length needed for the center of the fluid to reach 90% of the external surface temperature.
It is assumed that the characteristic length is an important design criterion: if the tube length is lower than L* the thermal potential of the device is not profited. Conversely, if the tube length is greater than L*, this excess is thermally useless. Figure 5 shows the assessment of the characteristic length in a particular case.
Figure 3. Characteristic length (L*) assessment in a particular case, where T1 is the fluid inlet temperature and T2 the external tube temperature.
Preprints 120064 g003

3. Results

This section may be divided by subheadings. It should provide a concise and precise description of the experimental results, their interpretation, as well as the experimental conclusions that can be drawn.

3.1. Experimental fluid temperatures

Although the study of the performance of the hybrid collector is not the main purpose of this work, Table 3 shows representative experimental results for the three fluids flowing through the PVT collector obtained in two test campaigns on the PTV collector carried out for organizational needs of the laboratory in different seasons. For this reason, the flow rates, irradiances and inlet temperatures, Tin, are of the same order, but not exactly the same, having been maintained within the range recommended by the standards. Thus, the volumetric flow rates inside the collector Vcol are around 1.2-2 L s-1/100 m2 of collector, the data were obtained in the four central hours of the day and the irradiances are above 700 Wm-2. These differences in test conditions do not prevent their results from being considered comparable for the purposes of this work. In this sense, the different outlet temperatures, Tout, and temperature jump, ΔTcol, have their origin more in the characteristics of the fluids than in the test conditions.
As can be seen in Table 1, the specific heat of water is more than twice that of ionic liquid (IL) and ionanofluid (Gr-INF), resulting in higher temperature jumps, ΔTcol, in Gr-INF with respect to water despite a lower irradiance G, as can be observed in Table 4. On the other hand, the useful heat, Qcol, and thermal and overall efficiencies, ηth, and ηov, respectively, show different rates, resulting in Gr-INF obtaining the highest temperature jump and efficiency of the three fluids. Also very striking is the poor thermal performance when using the ionic liquid, which contrasts sharply with that offered by the same substance when forming the ionanofluid with graphene particles.
In the case of electric power, there is not such a wide variation depending on the fluid and its operating conditions. Electricity production, Pel, is higher in the case of water, probably due to the lower average temperature of the heat transfer fluid, although the differences are not very pronounced since the temperatures and irradiances are in similar ranges. The best overall performance is obtained when using the Gr-INF.
m ˙

3.2. HEATT simulations

The external asymmetry of thermal conditions that occurs in solar thermal devices results in asymmetric temperature fields in the fluid, despite the small diameter of the tube. This is because, as mentioned above, laminar forced convection typically occurs in these devices due to low fluid velocities (v < 0.1 m s-1), as can be seen in Table 3. In addition, the other conditions for laminar forced convection established by Surianarayana [49] are met. Consequently, the HEATT platform can be used to study the temperature field inside the tubes.
Figure 6 shows the fluid temperatures along the cross section at different distances (L/10 to L) from the tube inlet for the [Emim]Ac conditions in Table 4. As can be seen, the fluid temperature is far from homogeneous along the cross section, due to laminar flow and the absence of buoyancy. In the vicinity of the tube inlet (L/10) almost all the fluid is at the inlet temperature, which practically does not vary at the end of the tube. Consequently, it can be said that the potential heat transfer process, which would have taken place if all the fluid had ended up at the temperature outside the tube, has not taken place in the tube or, in other words, that the characteristic length has not been reached for which a longer tube would have been necessary.
Figure 4. Cross-sectional temperatures at different lengths (L/10 to L) from inlet.
Preprints 120064 g004
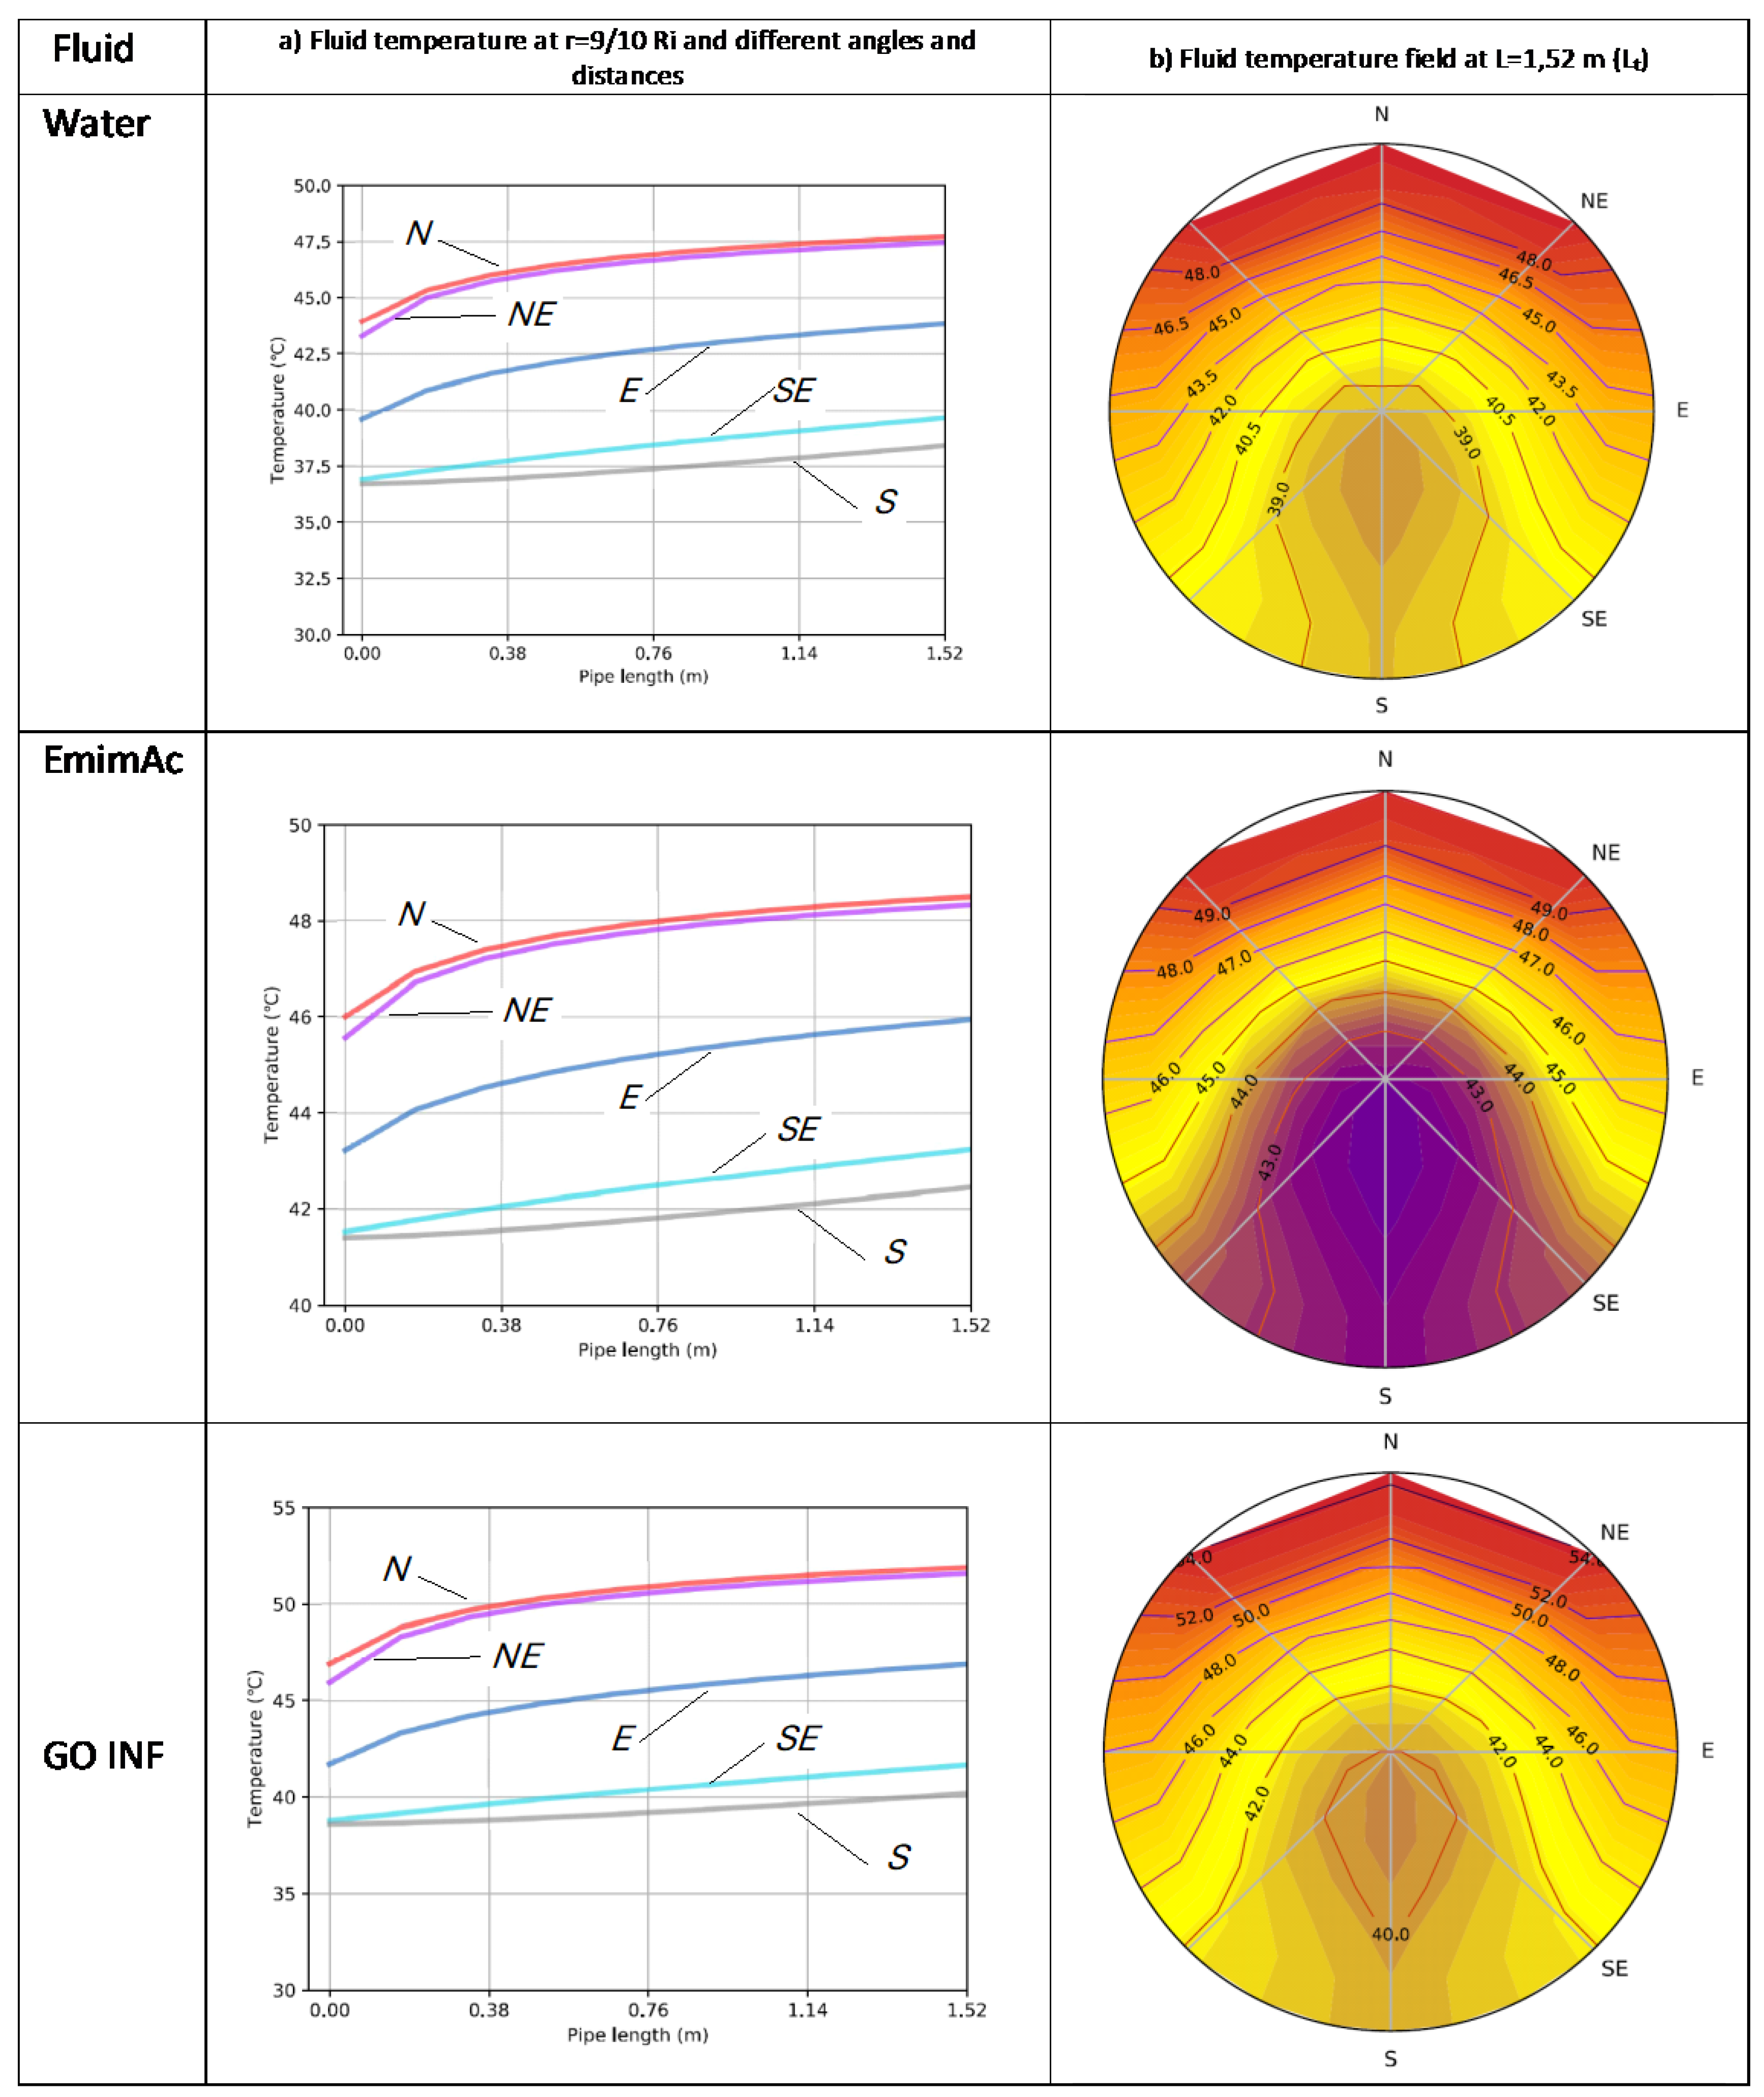
Figure 7 shows the results of the simulations of the three fluids of Table 4 inside the PVT manifold. The second column shows the evolution of the fluid temperature along the tube for r = 9/10 Ri, Ri being the inner radius of the tube, and different azimuthal angles, named with the acronym of the geographical orientation, i.e., N (north) is the highest point of the fluid and its plane is the vertical top (ϕ = -90°); NE (north-east) corresponds to ϕ = -45°; E (east) is the horizontal plane (ϕ = 0°); SE (sureste) corresponde a ϕ = 45° and, finally, S (south) marks the lower vertical plane and the coldest points of the fluid. Remember that the tube is subjected to a temperature higher than that of the fluid at the inlet in its upper half, while it is thermally insulated in its lower half (Fig. 4), being symmetrical with respect to the N-S axis. These planes are also shown in the figures in the third column of Fig. 7. For the simulations, the actual inlet temperature of the fluids in Table 4 has been taken, and the external temperature of the tube has been taken as a constant temperature higher than the fluid outlet temperature in each case, being 45ºC, 50ºC and 55ºC for water, IL and INF, respectively.
As can be seen in Fig. 7, the behavior pattern is quite similar in the three cases. In the N and NE planes the fluid temperature at 9/10 Ri is very close to that of the outer surface of the tube, while in the S plane, and to a lesser extent in SE, the temperature increases slowly without even approaching the outer temperature, leaving the S-SE sector well below the rest of the fluid tube. As mentioned above, this indicates that in the PVT collector we are far from reaching the characteristic length of the process. Since we are considering a collector of non-modifiable dimensions, the solution to reach the characteristic length would be to reduce the velocity of the fluid so that it would have time to reach this hidden magnitude when passing through the collector.
Figure 5. Simulation results of three fluids within PVT collector.
Preprints 120064 g005
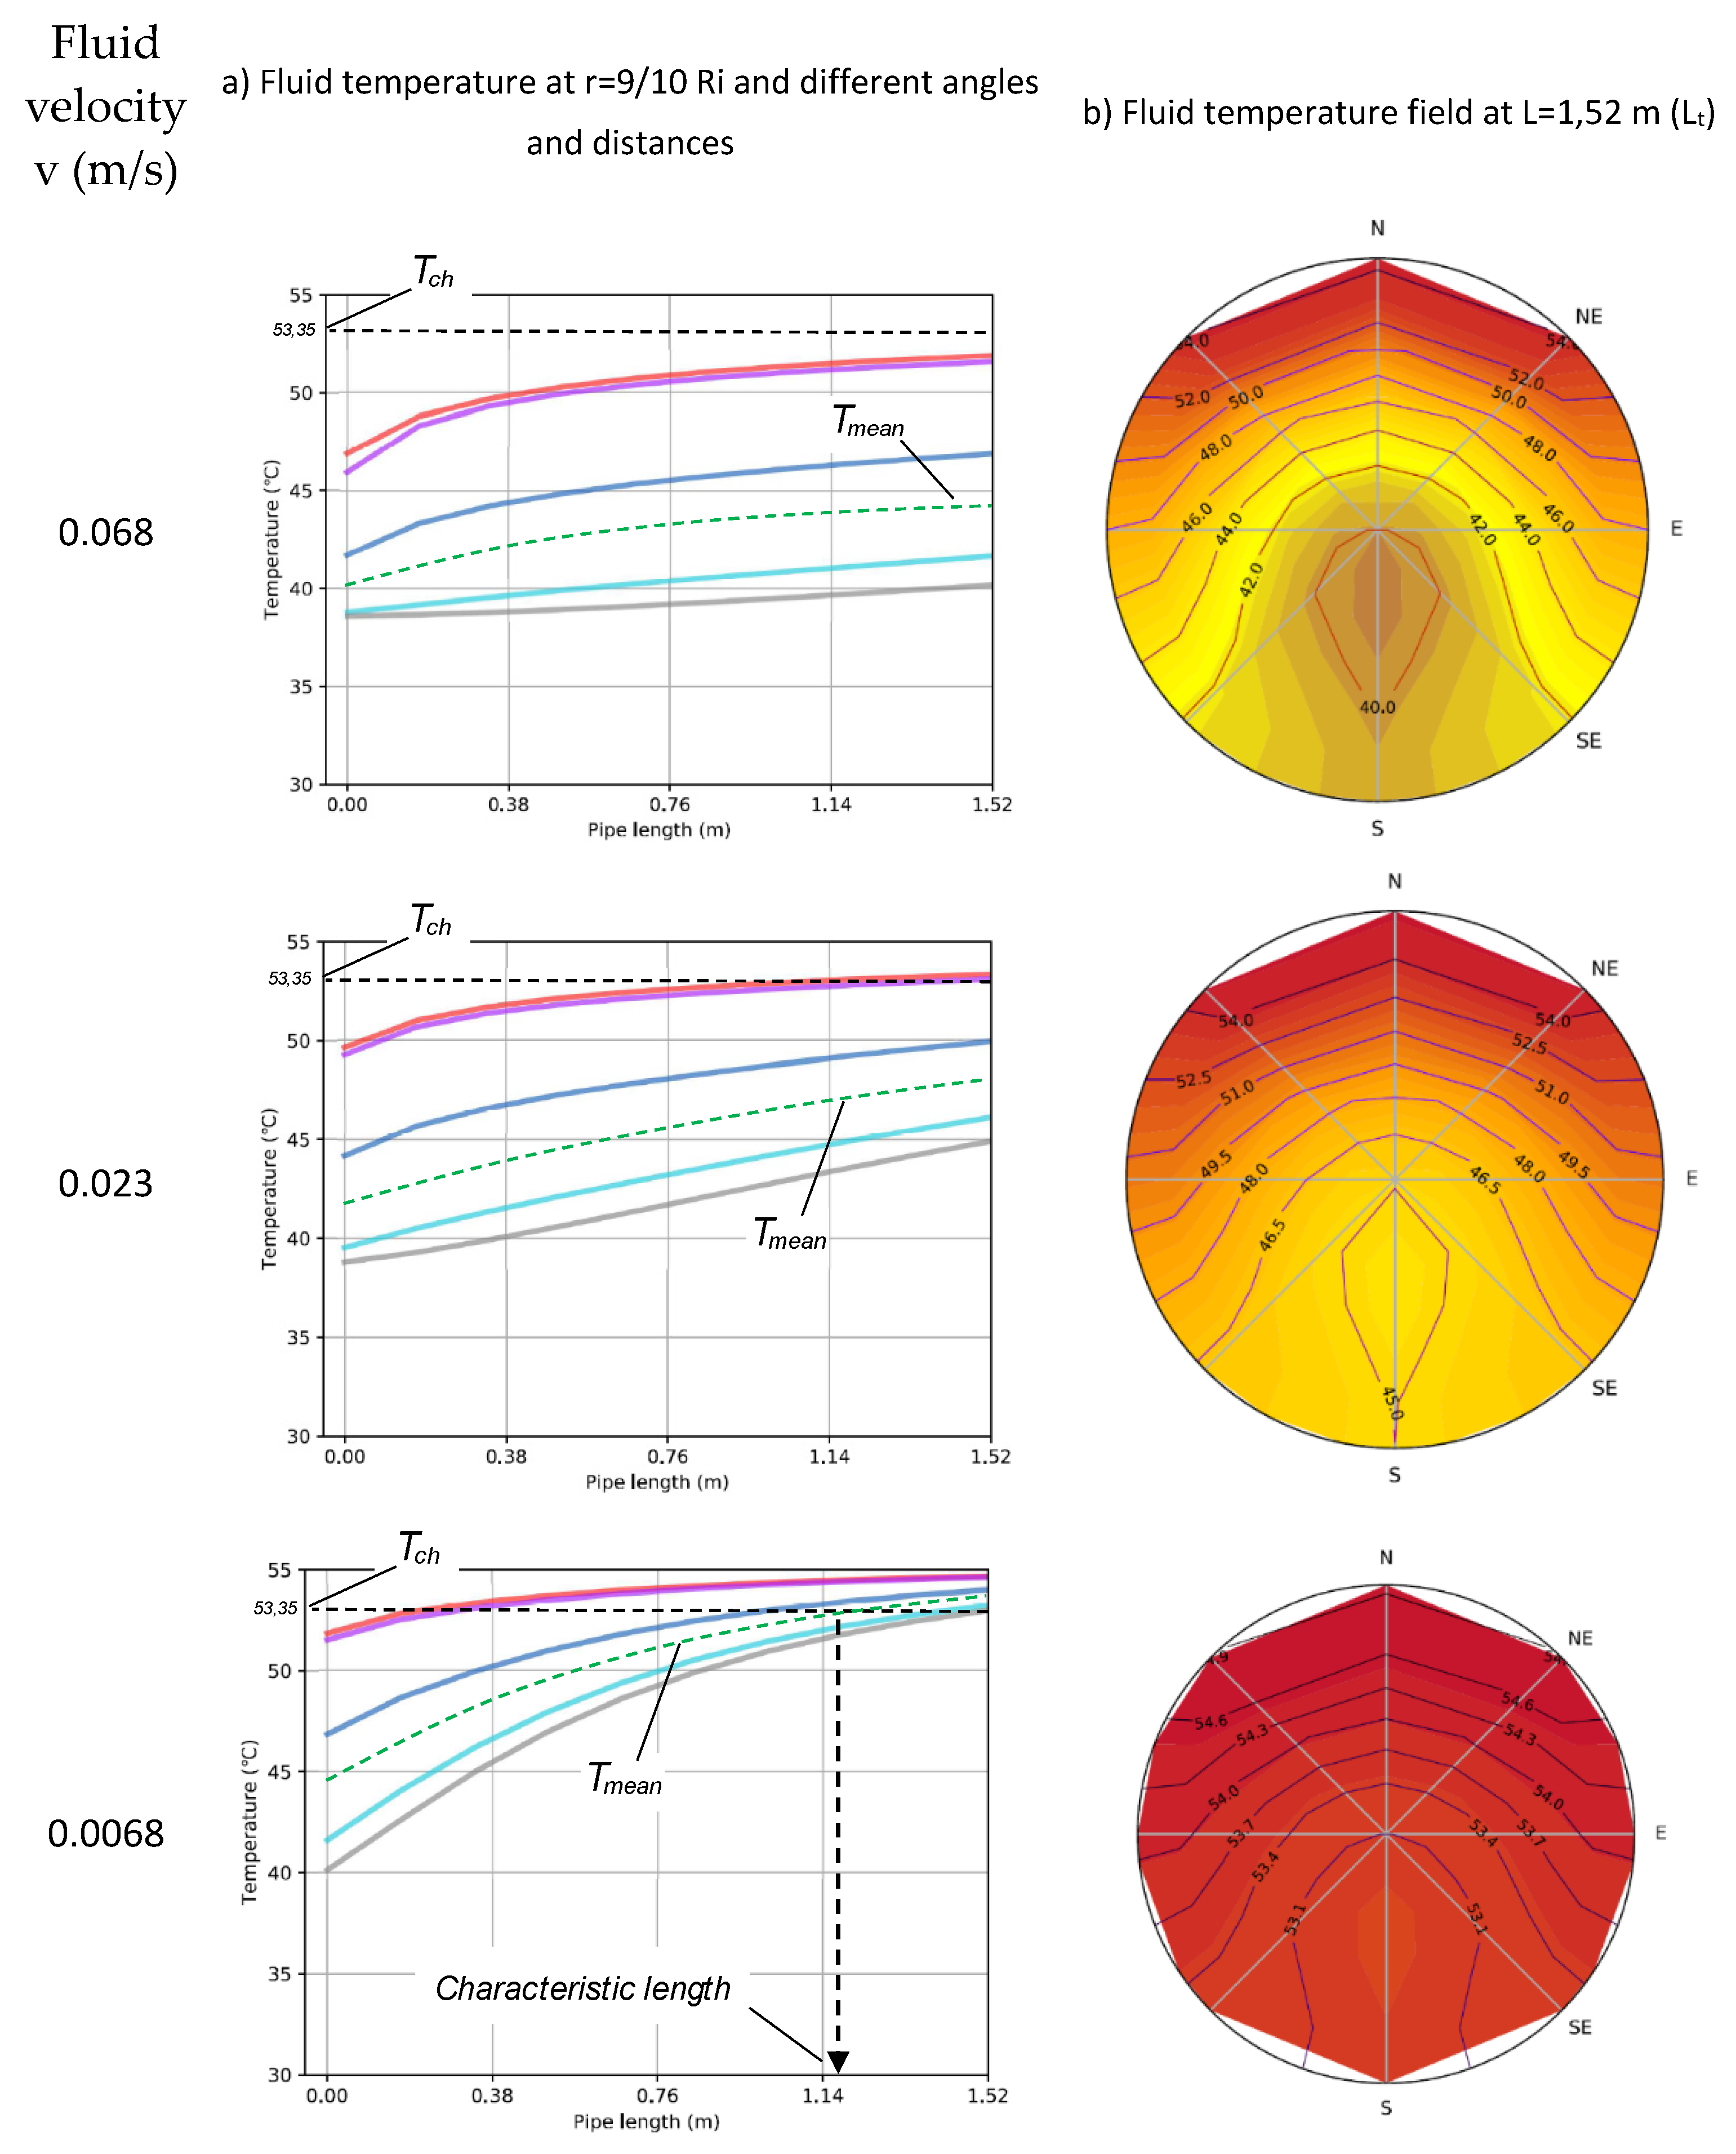
Figure 8 shows the simulations of the INF at three different velocities, the one that follows the flow criterion typically established for solar thermal collectors (v = 0.068 m s-1) and two slower velocities, v = 0.023 m s-1 and 0.0068 m s-1. The criterion commonly used for the determination of the characteristic length is that it can be considered reached when the average fluid temperature reaches 90% of the thermal gradient jump between the inlet temperature and that of the external condition [52]. In this case (Tin = 38.6ºC and Text = - 55ºC) this value is 53.35ºC. As can be seen, only in the case of v=0.0062 m/s the characteristic length, L*, is below that of the collector. Lcol (L=1.2 m vs. at 1.52 m).
Figure 6. Numerical simulation for GO INF at different fluid velocities.
Preprints 120064 g006

4. Discussion

As Fig. 7 shows fluids working inside commercial PVT solar collectors at current operating fluid velocity values do not reach the process characteristic length. Only when the fluid velocity is strongly reduced the characteristic length shorten and lays beyond the collector length, as it shows Fig. 8 for the case of Gr-INF. In this case (v = 0.00682 m s-1) the output temperature is maximum (54ºC), much higher than in the case of the common flow rate criterium (v = 0.0682 m s-1), where it only attained 44ºC. This is because very slow fluid velocities allow the maximum external temperatures to be reached for the entire fluid.
Table 5 contains the fluid outlet temperatures, heat generated and thermal efficiency of the PVT collector working with Gr-INF at different flow rates and fluid velocities. The data for case 1 correspond to experimental results (Table 4), while those for cases 2 and 3 are obtained from HEATT results. Consistent with Figure 7 and due to reaching the characteristic length, the temperatures of 3 are the highest, practically reaching those of the outer surface of the tube. As can be seen, for a given equipment the variation of the fluid velocity is the easiest means for the variation of the characteristic length of a process.
The fluid outlet temperature is an important performance of the collector depending on the application (higher temperatures of a heat carrier fluid have a higher value). In the case of the PVT collector, where the heat carrier has a cooling function, in general, increasing the collector temperature is not interesting as it penalizes electricity production, but in other solar applications it can be. The HEATT application is not able to predict the electrical production of the solar collector.
Moreover, as can be seen in Table 5, there is another important consequence of reducing the speed of the fluid, and that is that the useful heat, Qcol, produced in the solar collector and the collector thermal efficiency, ηth, also decrease significantly. In this sense, for the collector under study, if what is of interest is high energy production, the optimal fluid speed would be that which marks the flow recommended by the regulations (Case 1).

5. Conclusions

Experimental tests and numerical simulations of three liquids, water, ionic liquid and graphene ionanofluid of the former ionic liquid, functioning as heat carriers in a commercial PVT solar collector have been performed.
Experimental results show that the best overall performance is obtained when Gr-INF is used, while the poorest results are obtained using the ionic liquid as the thermal carrier. Electricity generation is not greatly affected by the fluid used.
The 3D analysis performed using the HEATT® open computing platform reveals that the characteristic length, where the entire heat transfer process occurs, is usually not reached in the parallel-riser PVT collectors used in this research due to the thermal and flow conditions of these devices. In the case of parallel-riser collectors, slower fluid velocities, which allow reaching the characteristic length of the process, are recommended if high outlet temperatures of the fluid are the target of the application, being aware that this strongly penalizes the thermal and overall energy production. This means that slow fluid velocities are recommended only if high outlet temperatures are desired but bearing in mind that this strongly penalizes thermal energy production.
Longer pipes (i.e., coil type) can improve both performances in PVT solar collectors depending on the application.

Author Contributions

Conceptualization, Mariano Alarcón; methodology, Mariano Alarcón and Gloria Víllora; software, Mariano Alarcón, Manuel Seco-Nicolás and Juan Pedro Luna-Abad; validation, Mariano Alarcón, Manuel Seco-Nicolás and Imane Moulfera; formal analysis, Mariano Alarcón and Juan Pedro Luna-Abad; investigation, Mariano Alarcón and Imane Moulfera; resources, Mariano Alarcón; data curation, Mariano Alarcón; writing—original draft preparation, Mariano Alarcón; writing—review and editing, Gloria Víllora, Manuel Seco-Nicolás and Juan Pedro Luna-Abad; visualization, X.X.; supervision, Gloria Víllora; project administration, Imane Moulfera; funding acquisition, Gloria Víllora Mariano Alarcón and Imane Moulfera. All authors have read and agreed to the published version of the manuscript.

Funding

This research was partially supported by grants ref. TED2021-130389B-C21 funded by MCIN/AEI/10.13039/501100011033 project and “NextGenerationEU”/PRTR”, PID2020-113081RB-I00 funded by MCIN/AEI/10.13039/501100011033 and part of the grant ref. 22129-PI-22 funded by the research support program of the Seneca Foundation of Science and Technology of Murcia, Spain. I. Moulefera acknowledges support from Spanish Ministry of Universities under “Margarita Salas program”, financed by Next Generation EU. HEATT® platform was created through the Proof of concept project Launch of a software for calculating flow in pipes for engineering and architecture, of the Seneca Foundation of Science and Technology of Murcia, Spain.

Data Availability Statement

All data used in this work are available on request. The HEATT® platform, where the numerical simulations have performed done is freely available at HEATT (um.es), and the data necessary to carry out the simulation can be found in the tables of the work.

Conflicts of Interest

The authors declare no conflicts of interest. The funders had no role in the design of the study; in the collection, analyses, or interpretation of data; in the writing of the manuscript; or in the decision to publish the results.

References

  1. Council of the European Uunion and the European Council, “European Green Deal. Fit for 55.” [Online]. Available: https://www.consilium.europa.eu/en/policies/green-deal/fit-for-55-the-eu-plan-for-a-green-transition/. (Accessed on 01 09 2024).
  2. D. Bogdanov, A. Gulagi, M. Fasihi, and C. Breyer, “Full energy sector transition towards 100% renewable energy supply: Integrating power, heat, transport and industry sectors including desalination,” Appl Energy, vol. 283, 2021. [CrossRef]
  3. E. Gul et al., “Transition toward net zero emissions - Integration and optimization of renewable energy sources: Solar, hydro, and biomass with the local grid station in central Italy,” Renew Energy, vol. 207, 2023. [CrossRef]
  4. H. Wehbi, “Powering the Future: An Integrated Framework for Clean Renewable Energy Transition,” Sustainability, vol. 16, no. 13, p. 5594, Jun. 2024. [CrossRef]
  5. D. Xu, X. Gu, and Y. Dai, “Concentrating solar assisted biomass-to-fuel conversion through gasification: A review,” 2023. [CrossRef]
  6. Dr. Sharad Kadam, Komal Dhole, Abhay Kumar, Nikhil Gupta, and Saurav Mishra, “Impact of International Solar Alliance on World,” International Journal of Advanced Research in Science, Communication and Technology, 2023. [CrossRef]
  7. P. G. Loutzenhiser and A. P. Muroyama, “A review of the state-of-the-art in solar-driven gasification processes with carbonaceous materials,” Solar Energy, vol. 156, pp. 93–100, Nov. 2017. [CrossRef]
  8. B. Tan, X. Ke, D. Tang, and S. Yin, “Improved perturb and observation method based on support vector regression,” Energies (Basel), vol. 12, no. 6, 2019. [CrossRef]
  9. I. Moulefera et al., “Novel application for graphene oxide-based ionanofluids in flat plate solar thermal collectors,” Sci Rep, vol. 14, no. 1, p. 17610, Jul. 2024. [CrossRef]
  10. J. A. Duffie and W. A. Beckman, Solar Engineering of Thermal Processes: Fourth Edition. 2013. [CrossRef]
  11. IEA (2022), “Renewables 2022,” https://www.iea.org/reports/renewables-2022. (Accessed on 01 09 2024).
  12. S. A. Kalogirou, Solar Energy Engineering: Processes and Systems. 2023. [CrossRef]
  13. A. Ramos et al., “Solar-Thermal and Hybrid Photovoltaic-Thermal Systems for Renewable Heating,” Grantham Institute, Briefing paper No 22. Imperial College London, no. 22, 2017. [CrossRef]
  14. J. Lee and J. Shin, “The Economic Value of New Sustainable Products: The Case of Photovoltaic Thermal (PVT) Hybrid Solar Collectors,” Energies (Basel), vol. 16, no. 14, 2023. [CrossRef]
  15. B. Emmanuel, Y. Yuan, B. maxime, N. Gaudence, and J. Zhou, “A review on the influence of the components on the performance of PVT modules,” Solar Energy, vol. 226, pp. 365–388, Sep. 2021. [CrossRef]
  16. A. Khelifa, K. Touafek, H. Ben Moussa, I. Tabet, H. B. C. El Hocine, and H. Haloui, “Analysis of a Hybrid Solar Collector Photovoltaic Thermal (PVT),” Energy Procedia, vol. 74, pp. 835–843, Aug. 2015. [CrossRef]
  17. S. Dubey and G. N. Tiwari, “Analysis of PV/T flat plate water collectors connected in series,” Solar Energy, vol. 83, no. 9, 2009. [CrossRef]
  18. M. T. Ahmed, M. R. Rashel, M. Abdullah-Al-Wadud, T. T. Hoque, F. M. Janeiro, and M. Tlemcani, “Mathematical Modeling, Parameters Effect, and Sensitivity Analysis of a Hybrid PVT System,” Energies (Basel), vol. 17, no. 12, p. 2887, Jun. 2024. [CrossRef]
  19. Z. Wang, G. Hou, H. Taherian, and Y. Song, “Numerical Investigation of Innovative Photovoltaic–Thermal (PVT) Collector Designs for Electrical and Thermal Enhancement,” Energies (Basel), vol. 17, no. 10, p. 2429, May 2024. [CrossRef]
  20. S. Margoum, B. Hajji, S. Aneli, G. M. Tina, and A. Gagliano, “Optimizing Nanofluid Hybrid Solar Collectors through Artificial Intelligence Models,” Energies (Basel), vol. 17, no. 10, p. 2307, May 2024. [CrossRef]
  21. P. K. Nagarajan, J. Subramani, S. Suyambazhahan, and R. Sathyamurthy, “Nanofluids for solar collector applications: A review,” in Energy Procedia, 2014, pp. 2416–2434. [CrossRef]
  22. P. Jha, B. Das, R. Gupta, J. D. Mondol, and M. A. Ehyaei, “Review of recent research on photovoltaic thermal solar collectors,” Solar Energy, vol. 257, pp. 164–195, Jun. 2023. [CrossRef]
  23. Z. Said, R. Saidur, and N. A. Rahim, “Energy and exergy analysis of a flat plate solar collector using different sizes of aluminium oxide based nanofluid,” J Clean Prod, vol. 133, 2016. [CrossRef]
  24. R. Ganvir, P. Walke, and V. Kriplani, “Heat transfer characteristics in nanofluid—A review,” Renewable and Sustainable Energy Reviews, vol. 75, 2017.
  25. M. E. Zayed, J. Zhao, Y. Du, A. E. Kabeel, and S. M. Shalaby, “Factors affecting the thermal performance of the flat plate solar collector using nanofluids: A review,” Apr. 01, 2019, Elsevier Ltd. [CrossRef]
  26. W. Wang, Z. Wu, B. Li, and B. Sundén, “A review on molten-salt-based and ionic-liquid-based nanofluids for medium-to-high temperature heat transfer,” 2019. [CrossRef]
  27. Z. Said, A. A. Hachicha, S. Aberoumand, B. A. A. Yousef, E. T. Sayed, and E. Bellos, “Recent advances on nanofluids for low to medium temperature solar collectors: energy, exergy, economic analysis and environmental impact,” Prog Energy Combust Sci, vol. 84, p. 100898, May 2021. [CrossRef]
  28. A. S. Abdelrazik, K. H. Tan, N. Aslfattahi, A. Arifutzzaman, R. Saidur, and F. A. Al-Sulaiman, “Optical, stability and energy performance of water-based MXene nanofluids in hybrid PV/thermal solar systems,” Solar Energy, vol. 204, pp. 32–47, Jul. 2020. [CrossRef]
  29. N. Aslfattahi, L. Samylingam, A. S. Abdelrazik, A. Arifutzzaman, and R. Saidur, “MXene based new class of silicone oil nanofluids for the performance improvement of concentrated photovoltaic thermal collector,” Solar Energy Materials and Solar Cells, vol. 211, Jul. 2020. [CrossRef]
  30. J. Liu, F. Wang, L. Zhang, X. Fang, and Z. Zhang, “Thermodynamic properties and thermal stability of ionic liquid-based nanofluids containing graphene as advanced heat transfer fluids for medium-to-high-temperature applications,” Renew Energy, vol. 63, pp. 519–523, 2014. [CrossRef]
  31. C. A. Nieto de Castro et al., “Thermal Properties of Ionic Liquids and IoNanofluids of Imidazolium and Pyrrolidinium Liquids,” J Chem Eng Data, vol. 55, no. 2, pp. 653–661, Feb. 2010. [CrossRef]
  32. N. B. Shaik et al., “Artificial neural network modeling and optimization of thermophysical behavior of MXene Ionanofluids for hybrid solar photovoltaic and thermal systems,” Thermal Science and Engineering Progress, vol. 33, p. 101391, Aug. 2022. [CrossRef]
  33. B. Jozwiak et al., “Remarkable Thermal Conductivity Enhancement in Carbon-Based Ionanofluids: Effect of Nanoparticle Morphology,” ACS Appl Mater Interfaces, vol. 12, no. 34, pp. 38113–38123, 2020. [CrossRef]
  34. F.-F. Zhang, F.-F. Zheng, X.-H. Wu, Y.-L. Yin, and G. Chen, “Variations of thermophysical properties and heat transfer performance of nanoparticle-enhanced ionic liquids,” R Soc Open Sci, vol. 6, no. 4, p. 182040, Apr. 2019. [CrossRef]
  35. A. Hasečić, J. H. Almutairi, S. Bikić, and E. Džaferović, “Numerical analysis of heat transfer performances of ionic liquid and ionanofluids with temperature-dependent thermophysical properties,” Energies (Basel), vol. 14, no. 24, 2021. [CrossRef]
  36. L. Das, K. Habib, R. Saidur, N. Aslfattahi, S. M. Yahya, and F. Rubbi, “Improved Thermophysical Properties and Energy Efficiency of Aqueous Ionic Liquid/MXene Nanofluid in a Hybrid PV/T Solar System,” Nanomaterials, vol. 10, no. 7, p. 1372, Jul. 2020. [CrossRef]
  37. M. Seco-Nicolás, M. Alarcón, and J. P. Luna-Abad, “3D numerical simulation of laminar forced-convection flow subjected to asymmetric thermal conditions. An application to solar thermal collectors,” Solar Energy, vol. 220, pp. 230–245, 2021. [CrossRef]
  38. M. Seco-Nicolás, M. Alarcón, and F. Alhama, “Thermal behavior of fluid within pipes based on discriminated dimensional analysis. An improved approach to universal curves,” Appl Therm Eng, vol. 131, 2018. [CrossRef]
  39. M. Seco-Nicolás, M. Alarcón, A. P. Ramallo González, and J. P. Luna-Abad, “HEATT©. A free software for thermal design of liquid flows inside pipes,” Results in Engineering, p. 100983, Feb. 2023. [CrossRef]
  40. M. Alarcón, M. Seco Nicolás, J. P. Luna-Abad, and A. P. Ramallo-González, “Forced Laminar Flow in Pipes Subjected to Asymmetric External Conditions: The HEATT© Platform for Online Simulations.,” in Pipeline Engineering - Design, Failure, and Management, S. Rushd, M. Ismail, and K. F. Adane, Eds., London (UK): IntechOpen, 2022, p. 20. [CrossRef]
  41. L. Bo et al., “An overview of the applications of ionic fluids and deep eutectic solvents enhanced by nanoparticles,” J Therm Anal Calorim, vol. 147, no. 14, pp. 7589–7601, Jul. 2022. [CrossRef]
  42. ABORA ENERGY S.L., “SHE: Solar Heat & Electricity,” https://abora-solar.com/en/she-project/.
  43. International Organization for Standardization (ISO), “ISO 9806:2017. Solar energy. Solar thermal collectors. Test methods.,” 2017, International Organization for Standardization (ISO), Geneva (Switzerland).
  44. E. C. for S. (CEN), EN 12975-2:2006. Thermal solar systems and components – Solar collectors –Part 2 Test methods. AENOR, 2006.
  45. A. Gagliano, G. M. Tina, S. Aneli, and S. Nižetić, “Comparative assessments of the performances of PV/T and conventional solar plants,” J Clean Prod, vol. 219, pp. 304–315, May 2019. [CrossRef]
  46. M. Alarcón, M. Seco-Nicolás, J. P. Luna-Abad, and A. P. Ramallo-González, “HEATT.” [Online]. Available: https://heatt.inf.um.es/en/.
  47. Ş. Bilir, “NUMERICAL SOLUTION OF GRAETZ PROBLEM WITH AXIAL CONDUCTION,” Numeri Heat Transf A Appl, vol. 21, no. 4, pp. 493–500, Jun. 1992. [CrossRef]
  48. F. P. Incropera, D. P. DeWitt, T. L. Bergman, and A. S. Lavine, Fundamentals of Heat and Mass Transfer, vol. 6th. 2007. [CrossRef]
  49. N. V. Suryanarayana, “Forced Convection - Internal Flows,” in The CRC Handbook of Thermal Engineering, F. Kreith, Ed., Boca Ratón, London, New York, Washington, D.C.: CRC Press LLC, 2000, ch. 3. Heat an, pp. 3-47 3-55.
  50. C. N. Madrid and F. Alhama, “Discrimination: A fundamental and necessary extension of classical dimensional analysis theory,” International Communications in Heat and Mass Transfer, vol. 33, no. 3, pp. 287–294, Mar. 2006. [CrossRef]
  51. M. Cánovas, I. Alhama, and F. Alhama, “Mathematical Characterization of Bénard-Type Geothermal Scenarios Using Discriminated Non-dimensionalization of the Governing Equations,” International Journal of Nonlinear Sciences and Numerical Simulation, vol. 16, no. 1, pp. 23–34, Feb. 2015. [CrossRef]
  52. C. N. Madrid and F. Alhama, “Discriminated dimensional analysis of the energy equation: Application to laminar forced convection along a flat plate,” International Journal of Thermal Sciences, vol. 44, no. 4, pp. 333–341, Apr. 2005. [CrossRef]
Table 1. Thermophysical properties of Water, [Emim]Ac and Gr-INF wt 1% at 40ºC.
Water [Emim]Ac Gr-INF 1%
Density, ρ (kg m-3) 990 1088.7 1100
Specific heat, cp (J kg-1 K-1) 4210 1939.95 2025
Thermal conductivity, k (W m-1K-1) 0.66 0.19915 0.24
Dynamic viscosity, μ (Pa s) 4.27E-04 0.034 0.01
Table 2. Dimensional characteristics of Endef PVT collector.
External tube diameter, De (m) 0.008
Tube thickness, e (m) 0.0004
Tube length, L (m) 1.52
Table 3. Dimensionless numbers for laminar forced-convection flow.
Dimensionless number Equation Condition Title 1 Title 2 Title 3
Reynods Nr, Re Preprints 120064 i001 1E2<Re<2E3 entry 1 data data
Prandtl Nr., Pr*D/L Preprints 120064 i002 0,01<Pr*D/L<1 entry 2 data data 1
Rayleigh Nr, Ra Preprints 120064 i003 <1E3
Table 3. Experimental results in PVT collector of water, [Emim] Ac ionic liquid (IL) and Graphene oxide ionanofluid (Gr-INF).
m ˙ (kg s-1) v (m s-1) G (Wm-2) Tin (ºC) Tout (ºC) ΔTcol (K) Qcol (W) Pel (W) ηth (%) ηov (%)
Water 0.0380 0.086 955.7 38.9 44.3 5.4 862.8 80.0 58.2 63.6
EmimAc 0.0287 0.059 900.0 41.7 46.2 4.5 250.3 72.9 17.9 23.2
Gr-INF 0.0334 0.068 845.8 38.6 50.3 11.7 790.9 74.7 60.3 66.0
Table 4. Simulation results for different fluid velocities of Gr-INF- in PVT collector on the basis of 845,8 W/m2 of solar irradiance.
Case Mass flow rate (kg s-1) v (m s-1) Tin (ºC) Tout (ºC) ΔTcol (K) Qcol (W) ηth (%)
1 0.0334 0.0682 38.6 50.3 11.7 790.9 60.3
2 0.0113 0.0230 38.6 52.1 13.5 301.5 23.0
3 0.0033 0.0068 38.6 54.6 16.0 105.6 8.1
Disclaimer/Publisher’s Note: The statements, opinions and data contained in all publications are solely those of the individual author(s) and contributor(s) and not of MDPI and/or the editor(s). MDPI and/or the editor(s) disclaim responsibility for any injury to people or property resulting from any ideas, methods, instructions or products referred to in the content.
Copyright: This open access article is published under a Creative Commons CC BY 4.0 license, which permit the free download, distribution, and reuse, provided that the author and preprint are cited in any reuse.
Prerpints.org logo

Preprints.org is a free preprint server supported by MDPI in Basel, Switzerland.

Subscribe

© 2024 MDPI (Basel, Switzerland) unless otherwise stated