1. Introduction
Pancreatic ductal adenocarcinoma (PDAC) cells show significant expression of the novel secreted protein, PAUF, contributes to the progression of PC by modulating the TME through paracrine signaling.[
1] For instance, it amplifies the immune-suppressive capabilities of immune cells via TLR-mediated pathways (TLR2 and TLR4) [
1]. Cancer progression and metastasis are positively associated with the ongoing interaction between cancer cells and stromal cells in the TME [
2]. Loss of epithelial cell function and abnormal regulation of the functions of stromal cells surrounding cancer cells are important processes for tumorigenesis [
3,
4,
5]. The epithelial cells induce fibrosis in the extracellular matrix and recruitment of stromal cells [
6,
7,
8]. Therefore, it is necessary to understand the molecular pathology underlying the relationship between stromal cell recruitment into the TME and tumor progression. More specifically, the TME in PC is made up of diverse stromal cells like TAMs, myeloid derived suppressor cells (MDSCs), cancer associated fibroblasts (CAFs), and Tie2 expressing monocytes (TEMs), which contribute to the aggressive nature of the TME [
9].
Macrophages, derived from the bone marrow, are crucial innate immune cells [
9]. Upon encountering molecules from infected cells or foreign substances, immature monocytes leave the bone marrow through the bloodstream and undergo activation, ultimately developing into mature macrophages [
10]. Two types of mature macrophages exist depending on the stimulatory signal: M1 macrophages, or classically activated macrophages, and M2 macrophages, or alternatively activated macrophages [
11,
12]. TAMs are a specific type of macrophages that are found in the TME, express cytokines and chemokines like M2 macrophages, and promote cancer growth and survival [
13]. TAMs promote the proliferation of T-helper 2 (Th2) and not Th1 cells by producing pro-inflammatory cytokines and activate regulatory T cells to induce immune tolerance [
14,
15]. TAMs promote angiogenesis by producing anti-inflammatory cytokines and support the invasive and metastatic abilities of tumor cells [
13]. TAMs promote tumor growth by inhibiting apoptosis induced by anti-cancer drugs [
14]. These results suggest that the complex interaction between immune and tumor cells in the TME intricately regulates tumor progression. Recent clinical studies have reported that TAMs in the TME are associated with poor prognosis in several cancers, such as PC [
16], bladder cancer [
17], gastric cancer [
18], and breast cancer [
19]. Inhibiting monocyte differentiation into M2 macrophages is an active area of research for developing therapies that can effectively impede tumor growth [
20].
PAUF is involved in the functional regulation of immune and cancer cells in the TME. PAUF induces monocyte activation through TLRs to promote tumor growth and escape from immune surveillance [
21]. Koh et al. [
22] found that PAUF enhances the immunosuppressive ability of MDSCs, leading to increased production of arginase, nitric oxide (NO), and reactive oxygen species (ROS) via the TLR4-mediated MAPK/ERK pathway. A PAUF-neutralizing antibody was used to further confirm these findings in a mouse model of PC and MDSCs from patients with PC. To explore their clinical relevance, monocytes derived from human peripheral blood mononuclear cells (PBMCs) were utilized. This study focused on examining how PAUF influences monocyte chemotaxis and their subsequent differentiation into macrophages. This was evaluated by analyzing surface markers and cytokine expressions. Additionally, it examined how PAUF interacts with immune cells, as it is believed to function as a modulator in the TME.
2. Materials and Methods
2.1. Human Blood Samples
Blood was obtained from excess specimens remaining after the examination was completed at the department of Laboratory Medicine of Dong-A University Hospital; and the Dong-A Institutional Review Board (IRB: BR-003-02) approved the study.
2.2. Cell Culture
The human blood-derived cells, including monocyte and T cell were cultured in RPMI- 1640 media with 10% FBS and 1% penicillin/streptomycin. All cells were incubated at 37℃ in a humidified atmosphere of 5% carbon dioxide (CO2).
2.3. Isolation of PBMCs
PBMCs were isolated from human blood within 24 h after obtaining the blood specimens. The human blood was diluted 1:1 in PBS -with 2% FBS, and the PBMCs were isolated using density-gradient centrifugation on a Ficoll Paque Plus (1.077g/mL; GE Healthcare, Chicago, Illinois, USA) and SepMate-50 tubes (Stemcell Technologies). Centrifugation was performed at room temperature, 1,200 g, for 10 min. Following isolation, cells underwent three washes in PBS containing 2% FBS. Cells were counted and then used for analysis.
2.4. Isolation of Monocytes
Monocytes were isolated by cluster of differentiation 14 (CD14) negative selection with Classical Monocyte Isolation Kit, human (#130-117-337, Miltenyi Biotec, Bergisch Gladbach, Germany) using the manual method or the automated machine, an auto magnetic cell separations (autoMACs) Pro instrument (Miltenyi Biotec) as described below. For purity analysis, monocytes were stained with CD3-APC (#17-0038-42, Invitrogen, Waltham, MA, USA), CD11c-PE (#555392, BD Biosciences, Franklin Lakes, NJ, USA) and CD14-FITC (#555397, BD Biosciences) and analyzed using a flow cytometer. The purity was >95%.
2.5. Using the MACS Separator
Following PBMC isolation, cells were suspended in PBS buffer (pH 7.2) with 0.5% BSA and 2 mM EDTA. Next, the sample was incubated with Anti-Biotin MicroBeads (20 μL per 107 cells) for 5 min at room temperature. The cell suspension was loaded onto an LS magnetic column from Miltenyi Biotec, which was positioned in the magnetic field of a MACS Separator (MIDIMACS). At this stage, the unlabeled cells containing the enriched CD14+ monocytes were collected.
2.6. Using the autoMACS Pro Separator
CD14+ monocyte isolation performed by autoMACS Pro Separator. The isolation process followed the instructions provided by the manufacturer. Briefly, placed the PBMCs and collection tubes into the Chill Rack and selected the Deplete2 program to start the separation. After separation, the negative fraction (CD14+ monocytes) was collected from row B of the tube rack.
2.7. Isolation of T Cells
T cells were isolated from PBMCs by negative selection using a CD4+ T Cell Isolation Kit, human (#130-091-155, Miltenyi Biotec) and a CD8+ T Cell Isolation Kit, human (#130-096-495, Miltenyi Biotec). Isolation of T cells was performed by autoMACS Pro Separator. Both cells were used by collecting the negative fraction using the Deplete program.
2.8. Differentiation of Monocytes into Macrophages
For macrophage differentiation, freshly isolated monocytes were seeded in a 60x15 mm cell culture dish (SPL Life Sciences, Gyeonggi-do, Korea) at an appropriate concentration, such as 4.375x10⁵ monocytes/well, in 3 mL RPMI-1640 supplemented with 10% FBS and 1% penicillin/streptomycin. Human CD14+ monocytes were cultured with recombinant human GM-CSF (granulocyte-macrophage colony-stimulating factor) (GM-CSF; 50 ng/mL, #300-03, PeproTech, Cranbury, NJ, USA) or recombinant human M-CSF (macrophage colony-stimulating factor) (50 ng/mL, #300-23, PeproTech) for M1 and M2 macrophage polarization respectively, added to 3 mL of RPMI complete medium. To observe the differentiation of macrophages by PAUF, PAUF (1.0 μg/mL) was treated, and PBS was treated as a negative control. The cells were cultured in a 5% CO2 incubator at 37℃ for 7 days.
2.9. Chemotactic Migration Assay
Chemotactic migration was analyzed in transwell (Corning Costar, Cambridge, MA, USA) membrane. The upper chambers were filled with cell suspensions (3×10⁵ cells/well) in serum-free RPMI-1640 medium, while the lower chambers contained RPMI-1640 with either PBS or PAUF. After 20.5 h, migrated cells were stained with Giemsa stain solution (Sigma-Aldrich, St. Louis, MO, USA) and counted.
To evaluate the association between PAUF and TLR on monocyte chemotaxis, the cell suspension was treated with TLR2 inhibitor (TLR2-IN-C29, BioVision, Milpitas, CA, USA) and then loaded into the upper chambers. RPMI-1640 containing PBS or PAUF was loaded into the lower chambers. RPMI medium containing PAUF was added to the lower chambers, and Pam3Cys (Calbiochem, San Diego, CA, USA) and were used as a positive control. After 22.5 hours, the cells that were moved were stained and captured using a microscope with 100× magnification.
2.10. Cytokine Measurement
The cytokine production was quantified by the ELISA (enzyme-linked immunosorbent assay) method. Human TNF-α (#DY210-05, R&D systems, Minneapolis, MN, USA) and IL-10 (#ab46034, Abcam, Cambridge, UK) ELISA kits were used according to manufacturer’s instructions. The microplate reader (Versamax, Molecular Devices, San Jose, CA, USA) measured absorbance at 450 nm, and the cytokine concentration was determined using specific standard curves.
2.11. Arginase Activity Assay
The Arginase Activity Assay Kit (#ab180877, Abcam) was used to determine arginase activity in differentiated macrophages, following the manufacturer's instructions. Briefly, cells were lysed in lysis buffer followed by the addition of arginase substrate mix and incubated at 37℃ for 20 min. After incubation, the reaction mixture was added and incubated at 37℃ for 30 min, and then optical density was measured by multimode plate reader, VICTOR Nivo 3F (PerkinElmer, Waltham, MA, USA) at 570 nm. Arginase activity was compared with an arginine standard curve.
2.12. Reactive Oxygen Species (ROS) Measurement
Carboxy-H2DCFDA (#C400, Invitrogen) was used to stain macrophages at a concentration of 10 μM for 1 hour at 37℃, 5% CO2. After incubation, cells were washed in PBS. Cells were suspended in phenol red-free RPMI 1640 (#11835030, Gibco) at 37℃ for 15 min and then washed with cold PBS. The NovoCyte flow cytometer (Agilent Technologies, Santa Clara, CA, USA) analyzed fluorescence signals at an excitation/emission of 490/520 nm.
2.13. Immunofluorescence Analysis
Prior to monocyte seeding, cover slides were treated with a 0.1% gelatin coating (Sigma-Aldrich) in PBS. Adherent cells were incubated at 37℃ for 7 days, followed by washing with PBS and fixation in pre-cooled 4% paraformaldehyde at room temperature for 10 min. Next, the slides were rinsed two times with 10% FBS in PBS and then treated with 1% BSA in PBS for 1 hour. Staining for CD86 and CD206 was done using CD86-PE (#557344, BD Biosciences) or CD206-APC (#550889, BD Biosciences) for 1 h at 4℃. After incubation, slides were washed twice with PBST (0.05% Tween20, Sigma-Aldrich). For visualization, slides were stained with DAPI (Sigma-Aldrich) at 37℃ for 30 min. The slides were prepared with antifade mounting medium (#H-1000, Vector Laboratories, Burlingame, CA, USA) and fluorescence images were captured using a Nikon fluorescence microscope (Ni Eclipse, Melville, NY, USA).
2.14. Western Blot Analysis
To measure the inducible nitric oxide synthase (iNOS) expression in the culture medium, differentiate macrophage culture medium was harvested. The culture medium was prepared in radioimmunoprecipitation assay (RIPA) buffer (50 mM Tris-Cl, 150 mM NaCl, 1% sodium deoxycholate, 5 mM EDTA, 30 mM Na2HPO4, 50 mM NaF, 1 mM Na3VO4). The BCA protein assay kit (Thermo Fisher Scientific, Waltham, MA, USA) was used to determine protein concentrations. The samples underwent SDS-PAGE and were then transferred to a nitrocellulose membrane (GE Healthcare). The membranes were probed with anti-human iNOS-HRP (#ab3523, 1:1000, Abcam). The Azure C300 gel imaging system (Azure Biosystems, Dublin, CA, USA) detected the band's intensity.
2.15. T Cell Proliferation Assay
T cells were stained with CFSE (5(6)-Carboxyfluorescein diacetate N-succinimidyl ester) at a concentration of 5 μM, following the manufacturer's instructions from Invitrogen (#C34554). Cells were washed three times before use. 2×10⁴ or 4×10⁴ or 8×10⁴ CFSE-labeled T cells were cultured with either 4×10⁴ differentiated macrophage in round-bottom 96-well tissue culture plates for 4 days. T cells were activated by combining them with anti-CD3/CD28 microbeads (Dynabeads™ Human T-Activator CD3/CD28 for T Cell Expansion and Activation, #11161D, Gibco) in a 1:1 ratio in RPMI complete medium. T cells and macrophages were co-cultured in direct contact. After then, suspension cells were collected and stained for CD4-PerCP (#317432, Biolegend, San Diego, CA, USA) and CD8-FITC (#555366, BD Biosciences) and analyzed by a flow cytometer (Novocte, Agilent Technologies). Before flow cytometry, dynabeads and bead-bound cells were removed using pipetting and magnets.
2.16. Phagocytosis Analysis
Phagocytosis assays were performed using a Phagocytosis Assay Kit (#ab234053, Abcam). The macrophages were stained with Green Zymosan for 2 h at 37℃, 5% CO2. After incubation, cells were rinsed twice in phagocytosis assay buffer. To visualize phagocytosis, the samples were stained with DAPI for 30 minutes at 37℃. Mounting medium was used to mount the slides, and fluorescence images were captured with a Nikon fluorescence microscope (Ni Eclipse).
2.17. Flow Cytometry
Cell surface markers from the cell suspensions were stained with various combinations of fluorescent-labeled antibodies. Extracellular markers were suspended in flow cytometry staining buffer (5% FBS, 0.02% sodium azide in PBS) and stained with a fluorescent antibody. Following cell fixation and permeabilization, intracellular markers were labeled using a fluorescent antibody. Cells were fixed with 4% formaldehyde for 15 min at room temperature and permeabilized with 0.3% Triton X-100 for 15 min at room temperature. The NovoCyte flow cytometer was used to analyze the percentage of positive cells, which determined the marker expression. NovoExpress software (Agilent Technologies) was used to analyze the data.
2.18. Statistical Analysis
Experiments were repeated at least three times for statistical analysis. The assays were conducted on triplicate samples. Statistical differences were assessed using either a two-tailed paired Student's t-test or a one-way analysis of variance (ANOVA) test for multiple comparisons. The data were expressed as mean ± standard deviation (SD). Statistically significant results were defined as P values < 0.05. GraphPad Prism version 8.0 (GraphPad Software, San Diego, CA, USA) was used to analyze the experimental data.
Figure 1.
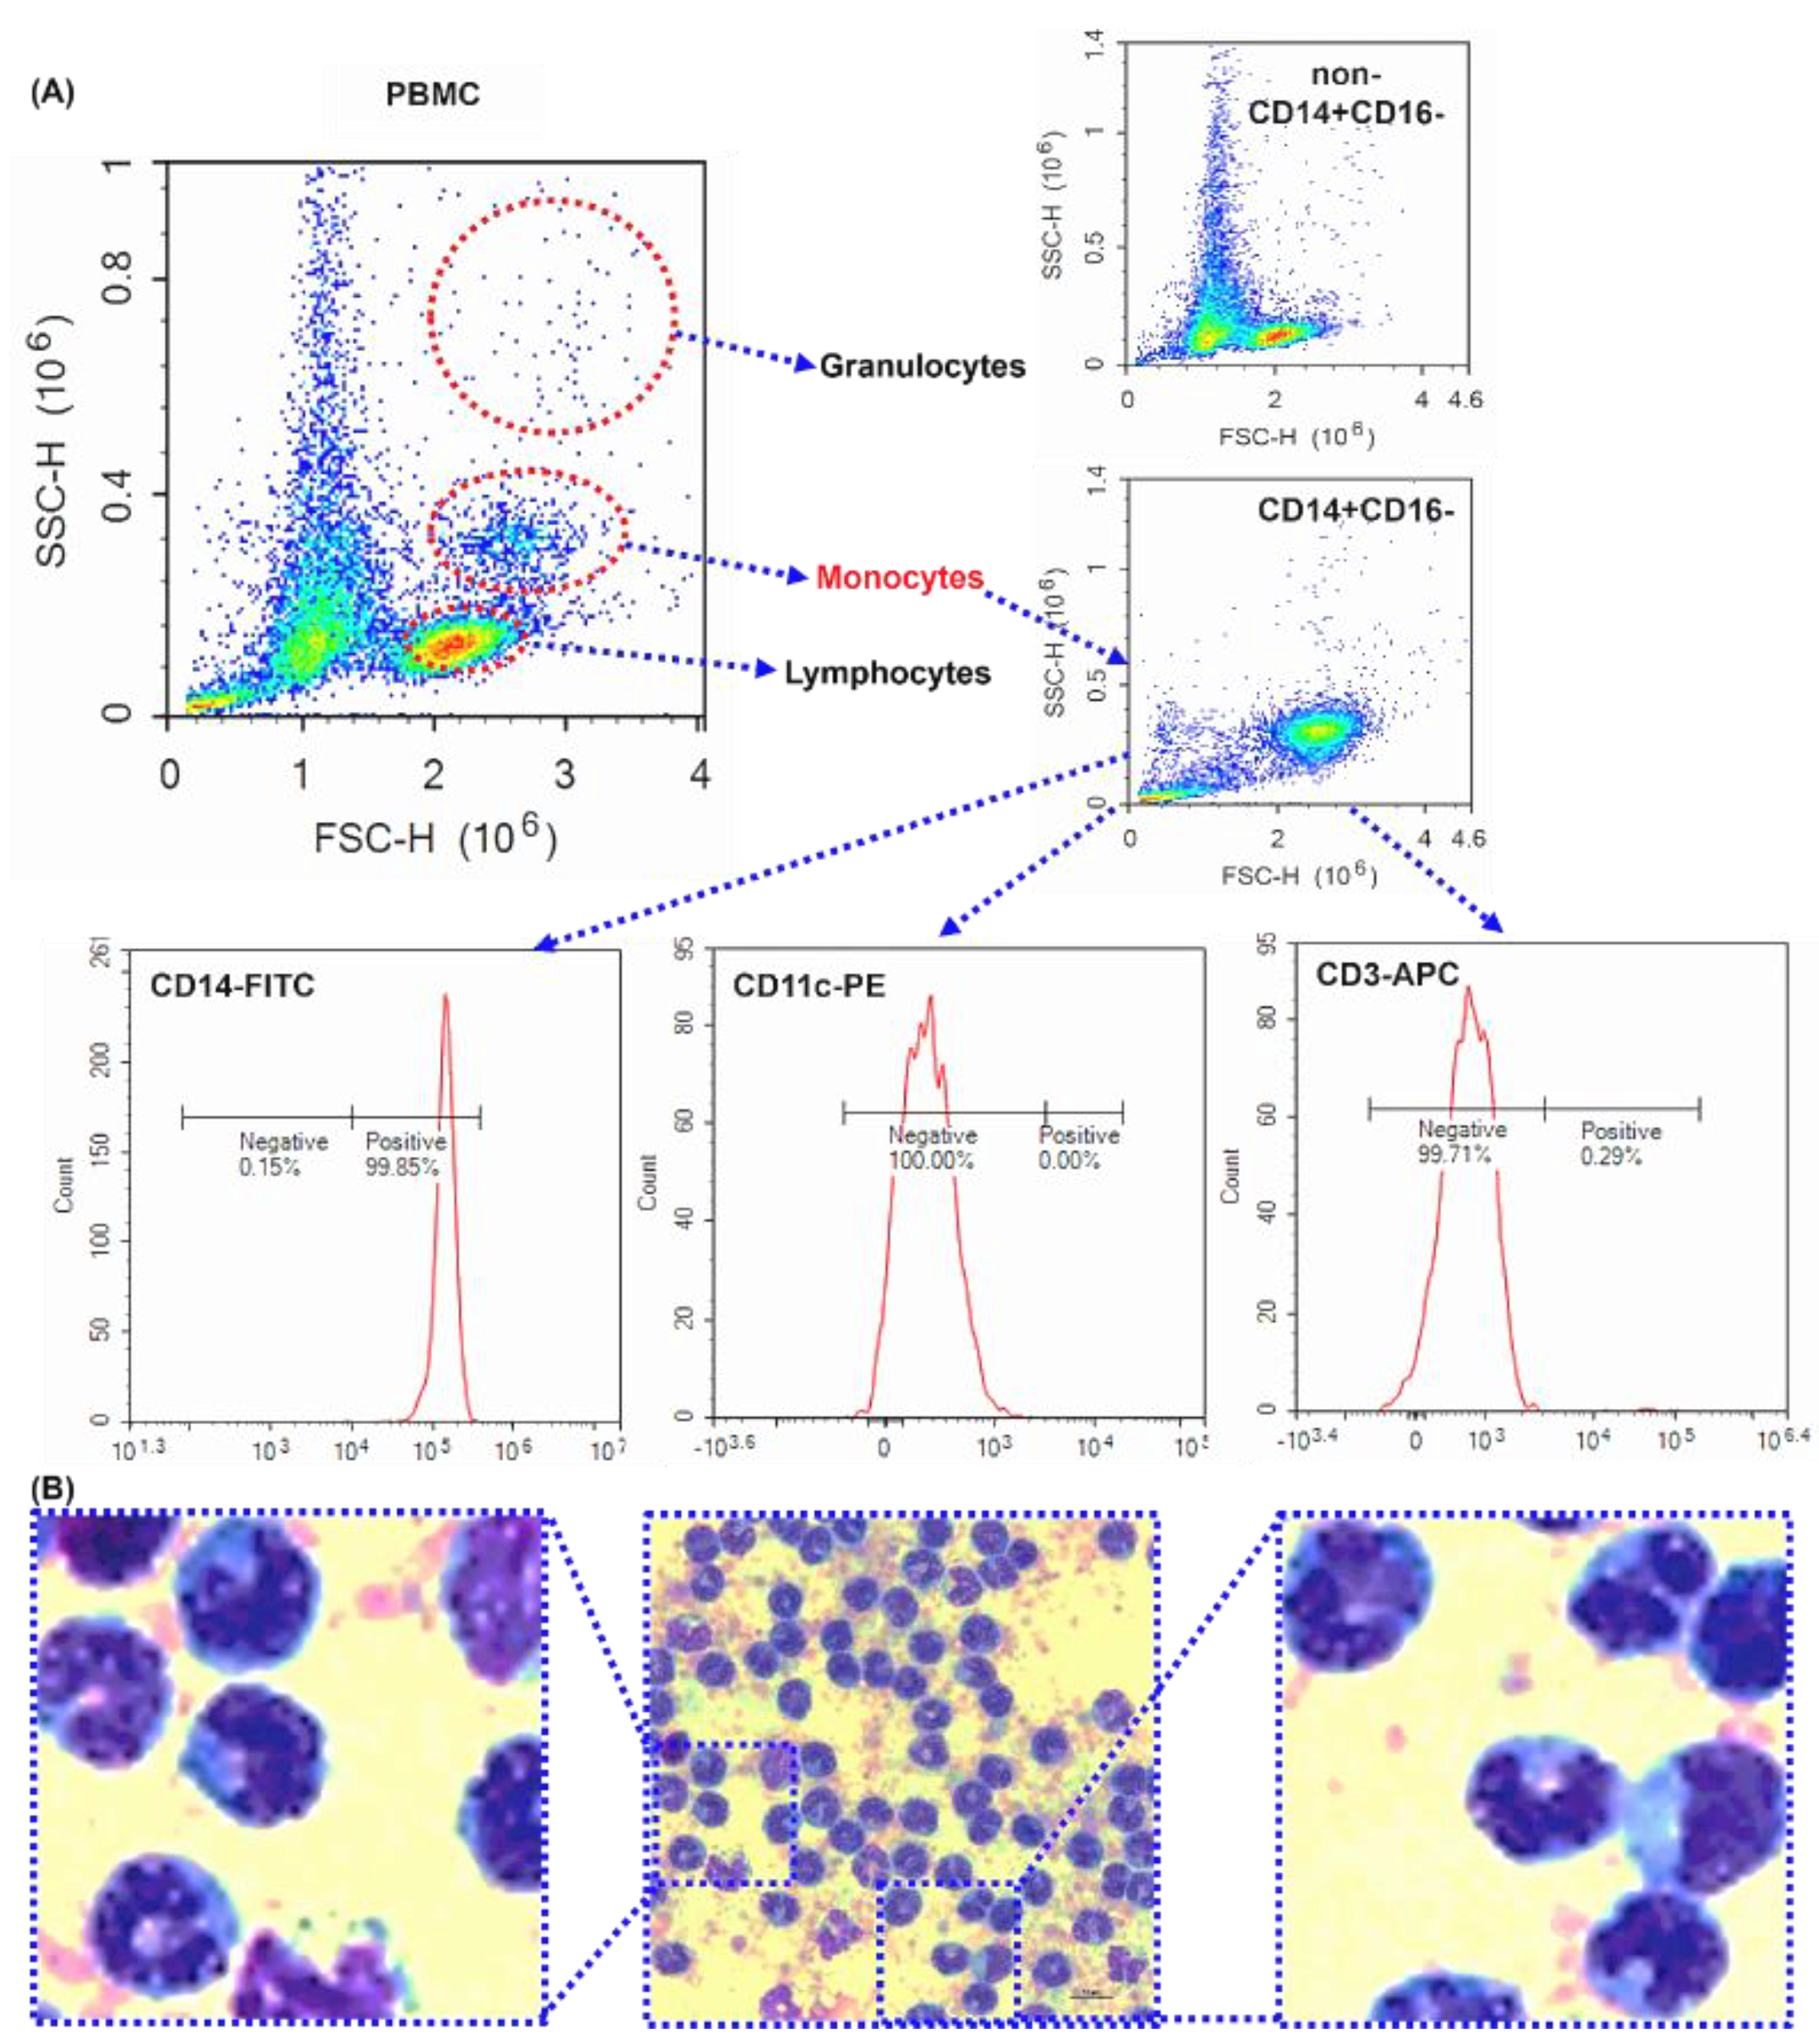
The purity of isolated human peripheral blood CD14+CD16- monocytes - Purity investigation of magnetically isolated CD14+ monocytes by flow cytometry and microscope. (A) The dot plots of forward scatter against side scatter. Representative dot plot of human PBMCs, CD14-, and CD14+ cells. CD14+ cells were surface labeled with CD14-FITC, CD11c-PE, CD3-APC antibodies. (C) Images representative of the subject were taken using a microscope. Scale bar is 10 μm. 1000× magnification.
Figure 2.
PAUF induces the chemotactic migration of monocytes - Chemotaxis of monocytes by transwell migration assay. (A) Schematic of the transwell chemotaxis model. Monocytes were seeded in the upper chamber at 3×10⁵ cells/200 μL. The chemoattractant PAUF (0.1 μg/mL or 0.5 μg/mL) was added to the lower chamber. PBS served as a control. (B) After 20.5 hours of incubation, the migrating monocytes were stained with Giemsa stain, and the cells in the fields were counted. (B`) The bar chart displayed the percentage of migrated cells compared to the PBS group. (C) Human CD14+ monocytes were seeded in the upper chamber at 1.5×10⁵ cells/200 μL with or without TLR2 inhibitor (125 μM). The lower chamber was supplemented with the chemoattractant PAUF (0.5 μg/mL), Pam 3Cys (100 ng/mL). After 22.5 hours of incubation, Giemsa stain was used to stain the migrated monocytes and the cells were counted in captured fields. Representative images of PBS and PAUF treated groups. Bar chart showing the number of migrated cells, represented as a relative percentage to PBS group. All scale bars are 200 μm. 100× magnification. The data were presented as the mean ± standard deviation from a minimum of three independent experiments. *, P < 0.05; ***, P < 0.001.
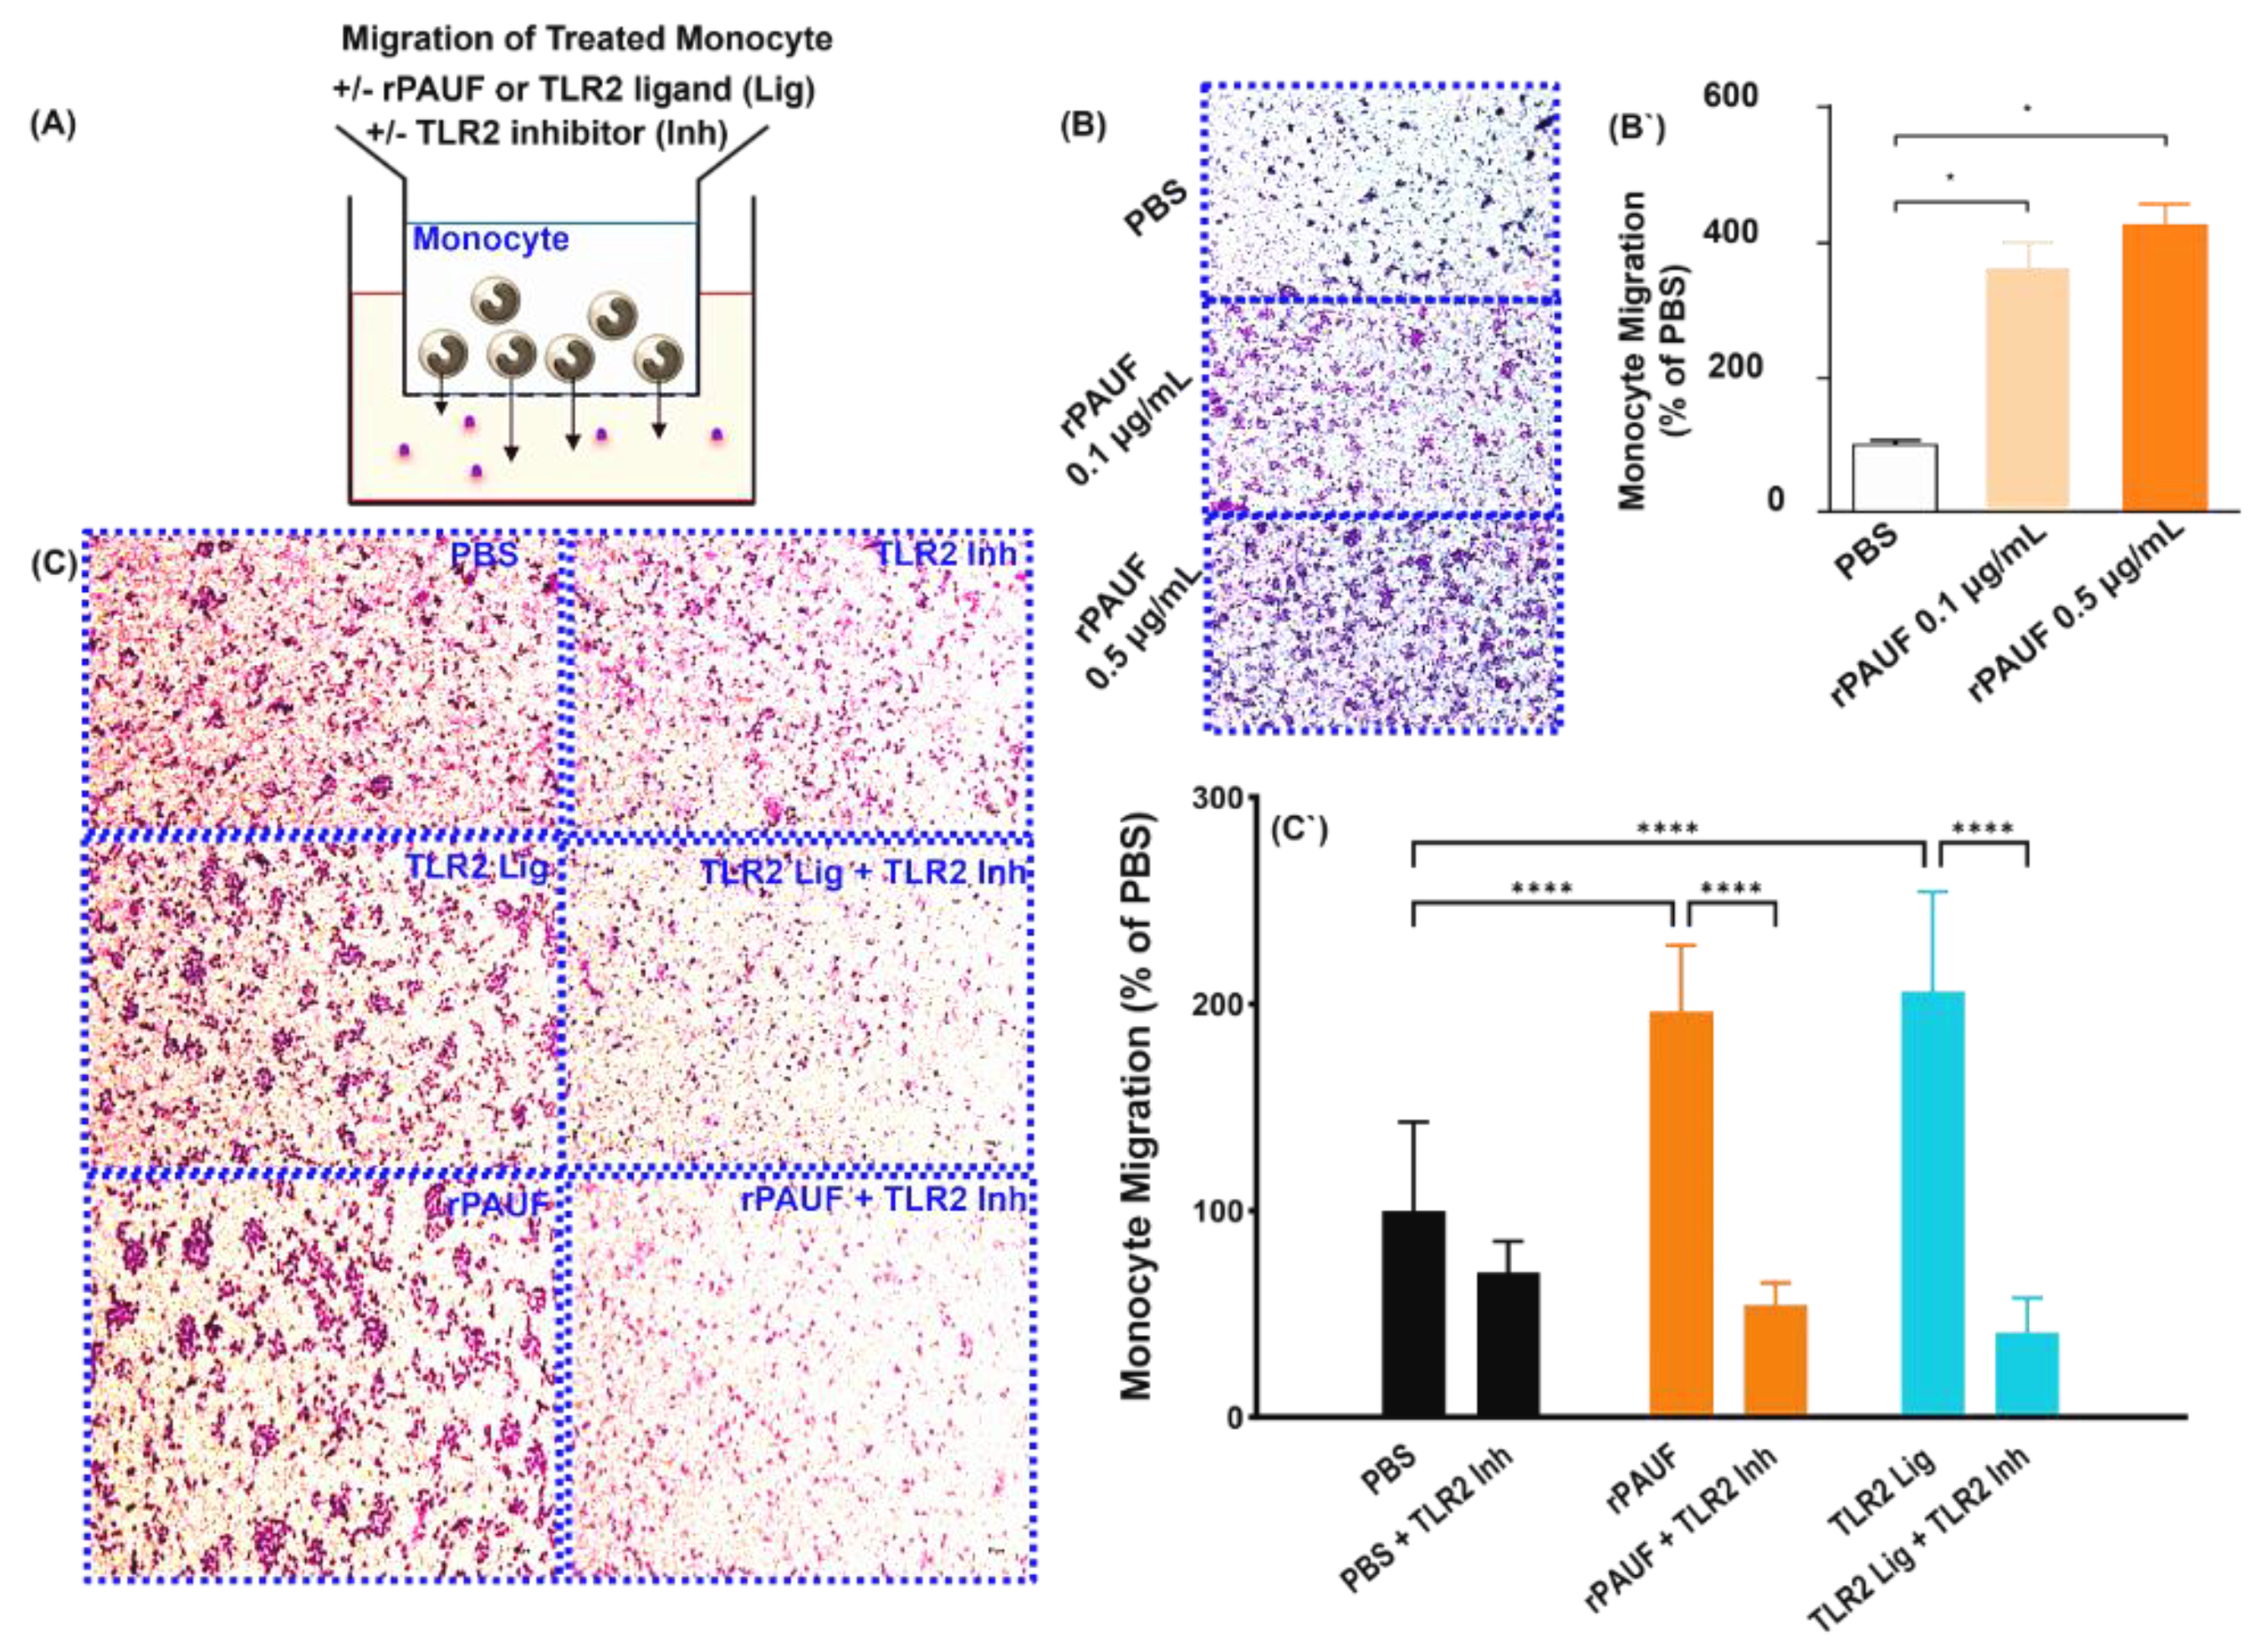
Figure 3.
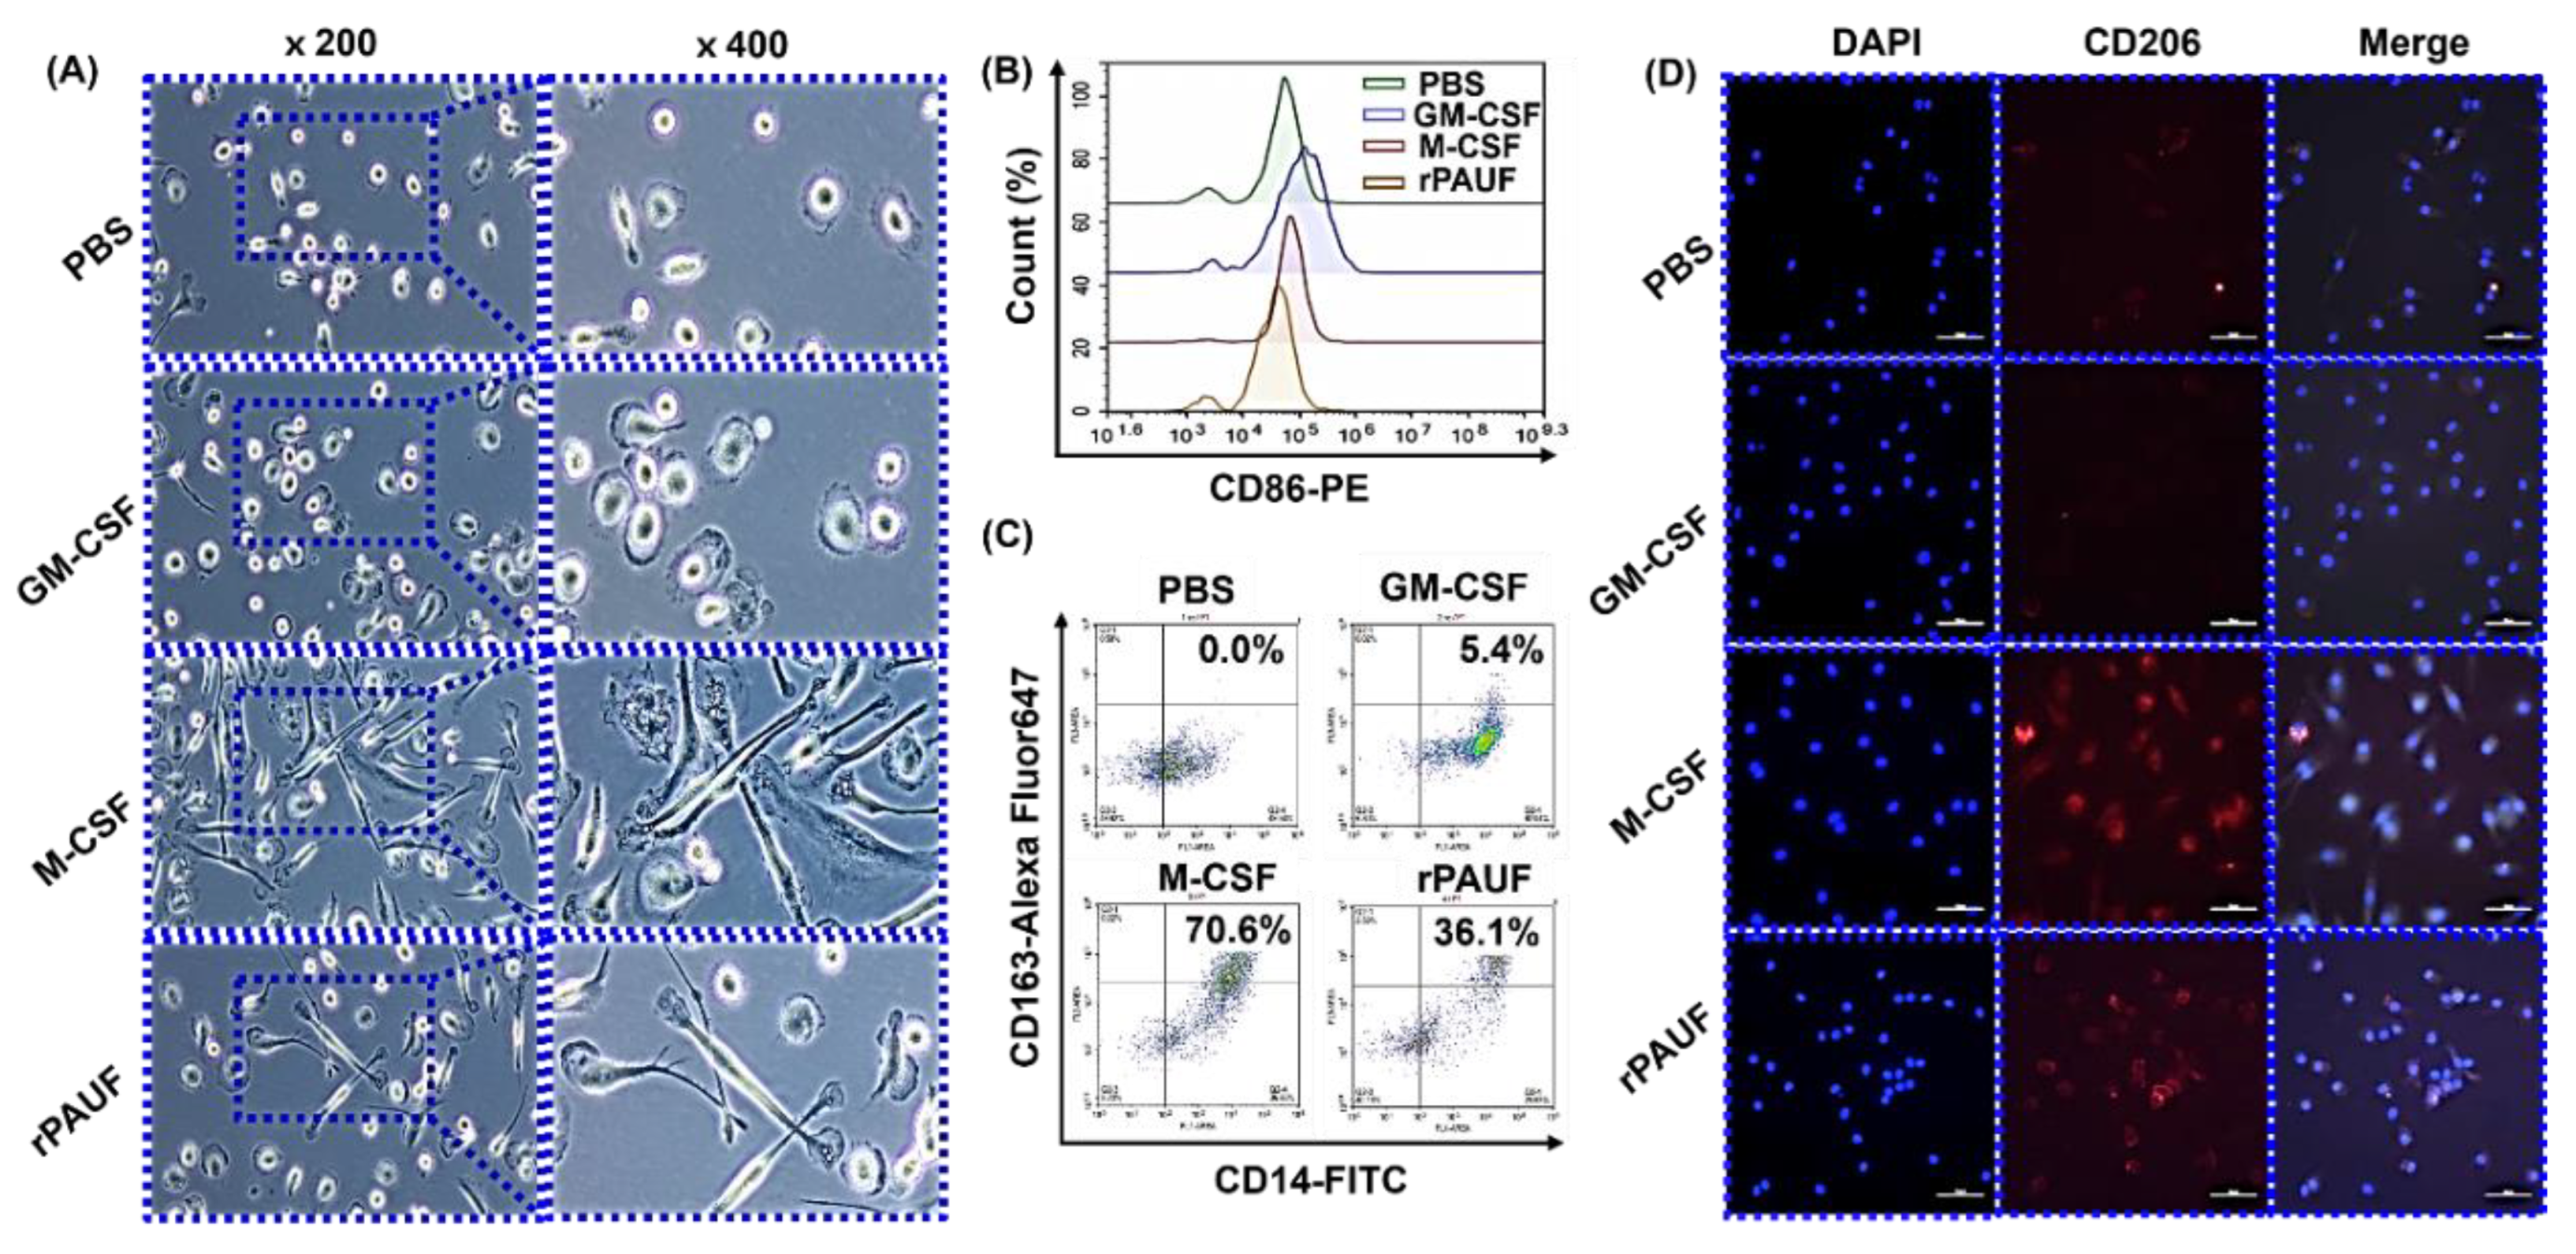
PAUF-MDMs exhibit morphological similarities to M2 macrophages - Healthy donor monocytes were isolated and differentiated into macrophages using GM-CSF (50 ng/mL), M-CSF (50 ng/mL), or PAUF (1 μg/mL) for 7 days in RPMI-1640 with 10% FBS. The resulting macrophages were categorized as M1 (GM-MDM), M2 (M-MDM), or PAUF-MDM. (A) Macrophage morphology was confirmed by a microscope. Scale bars are 50 μm. 200×, 400× magnification. MDMs were stained with (B) CD86-PE or (C) CD163-Alexa Fluor 647 antibody and analyzed using flow cytometry at day 7. (D) Fluorescence analysis of M2 marker CD206-APC (red) and nucleus (blue, DAPI) in differentiated macrophages. Scale bars are 50 μm. 400× magnification.
Figure 4.
PAUF increases the phagocytosis ability of macrophages – (A) Fluorescence microscopy images of macrophages exposed to Zymosan for 2 hours and stained with DAPI (nuclear stain). Cells were seeded on 0.1% gelatin-coated cover slides and differentiated for 7 days, followed by Zymosan reaction, and then fluorescence images were confirmed. Scale bars are 50 μm. 400× magnification. Blue, DAPI-stained nuclei; Green, fluorescent Zymosan. (A`) Images were taken in the presence of rPAUF (0.1 µg/mL, 0.5 µg/mL and 1 μg/mL). (B) Assessment of macrophage polarization was determined by comparison of the marker expression of M1 (TNF-α) and M2 (IL-10 and Arginase). On day 7, the levels of TNF-α and IL-10 were analyzed using ELISA in cell culture supernatants. Arginase activity was measured by a colorimetric assay. (C) Western blot analysis was used to determine the expression levels of iNOS. (D) The intracellular ROS production was analyzed by flow cytometry using Carboxy-H2DCFDA. (D`) The bar chart represented a relative percentage of the PBS group. The data were presented as the mean ± SD from a minimum of three independent experiments. *, P < 0.05; **, P < 0.01; ***, P < 0.001.
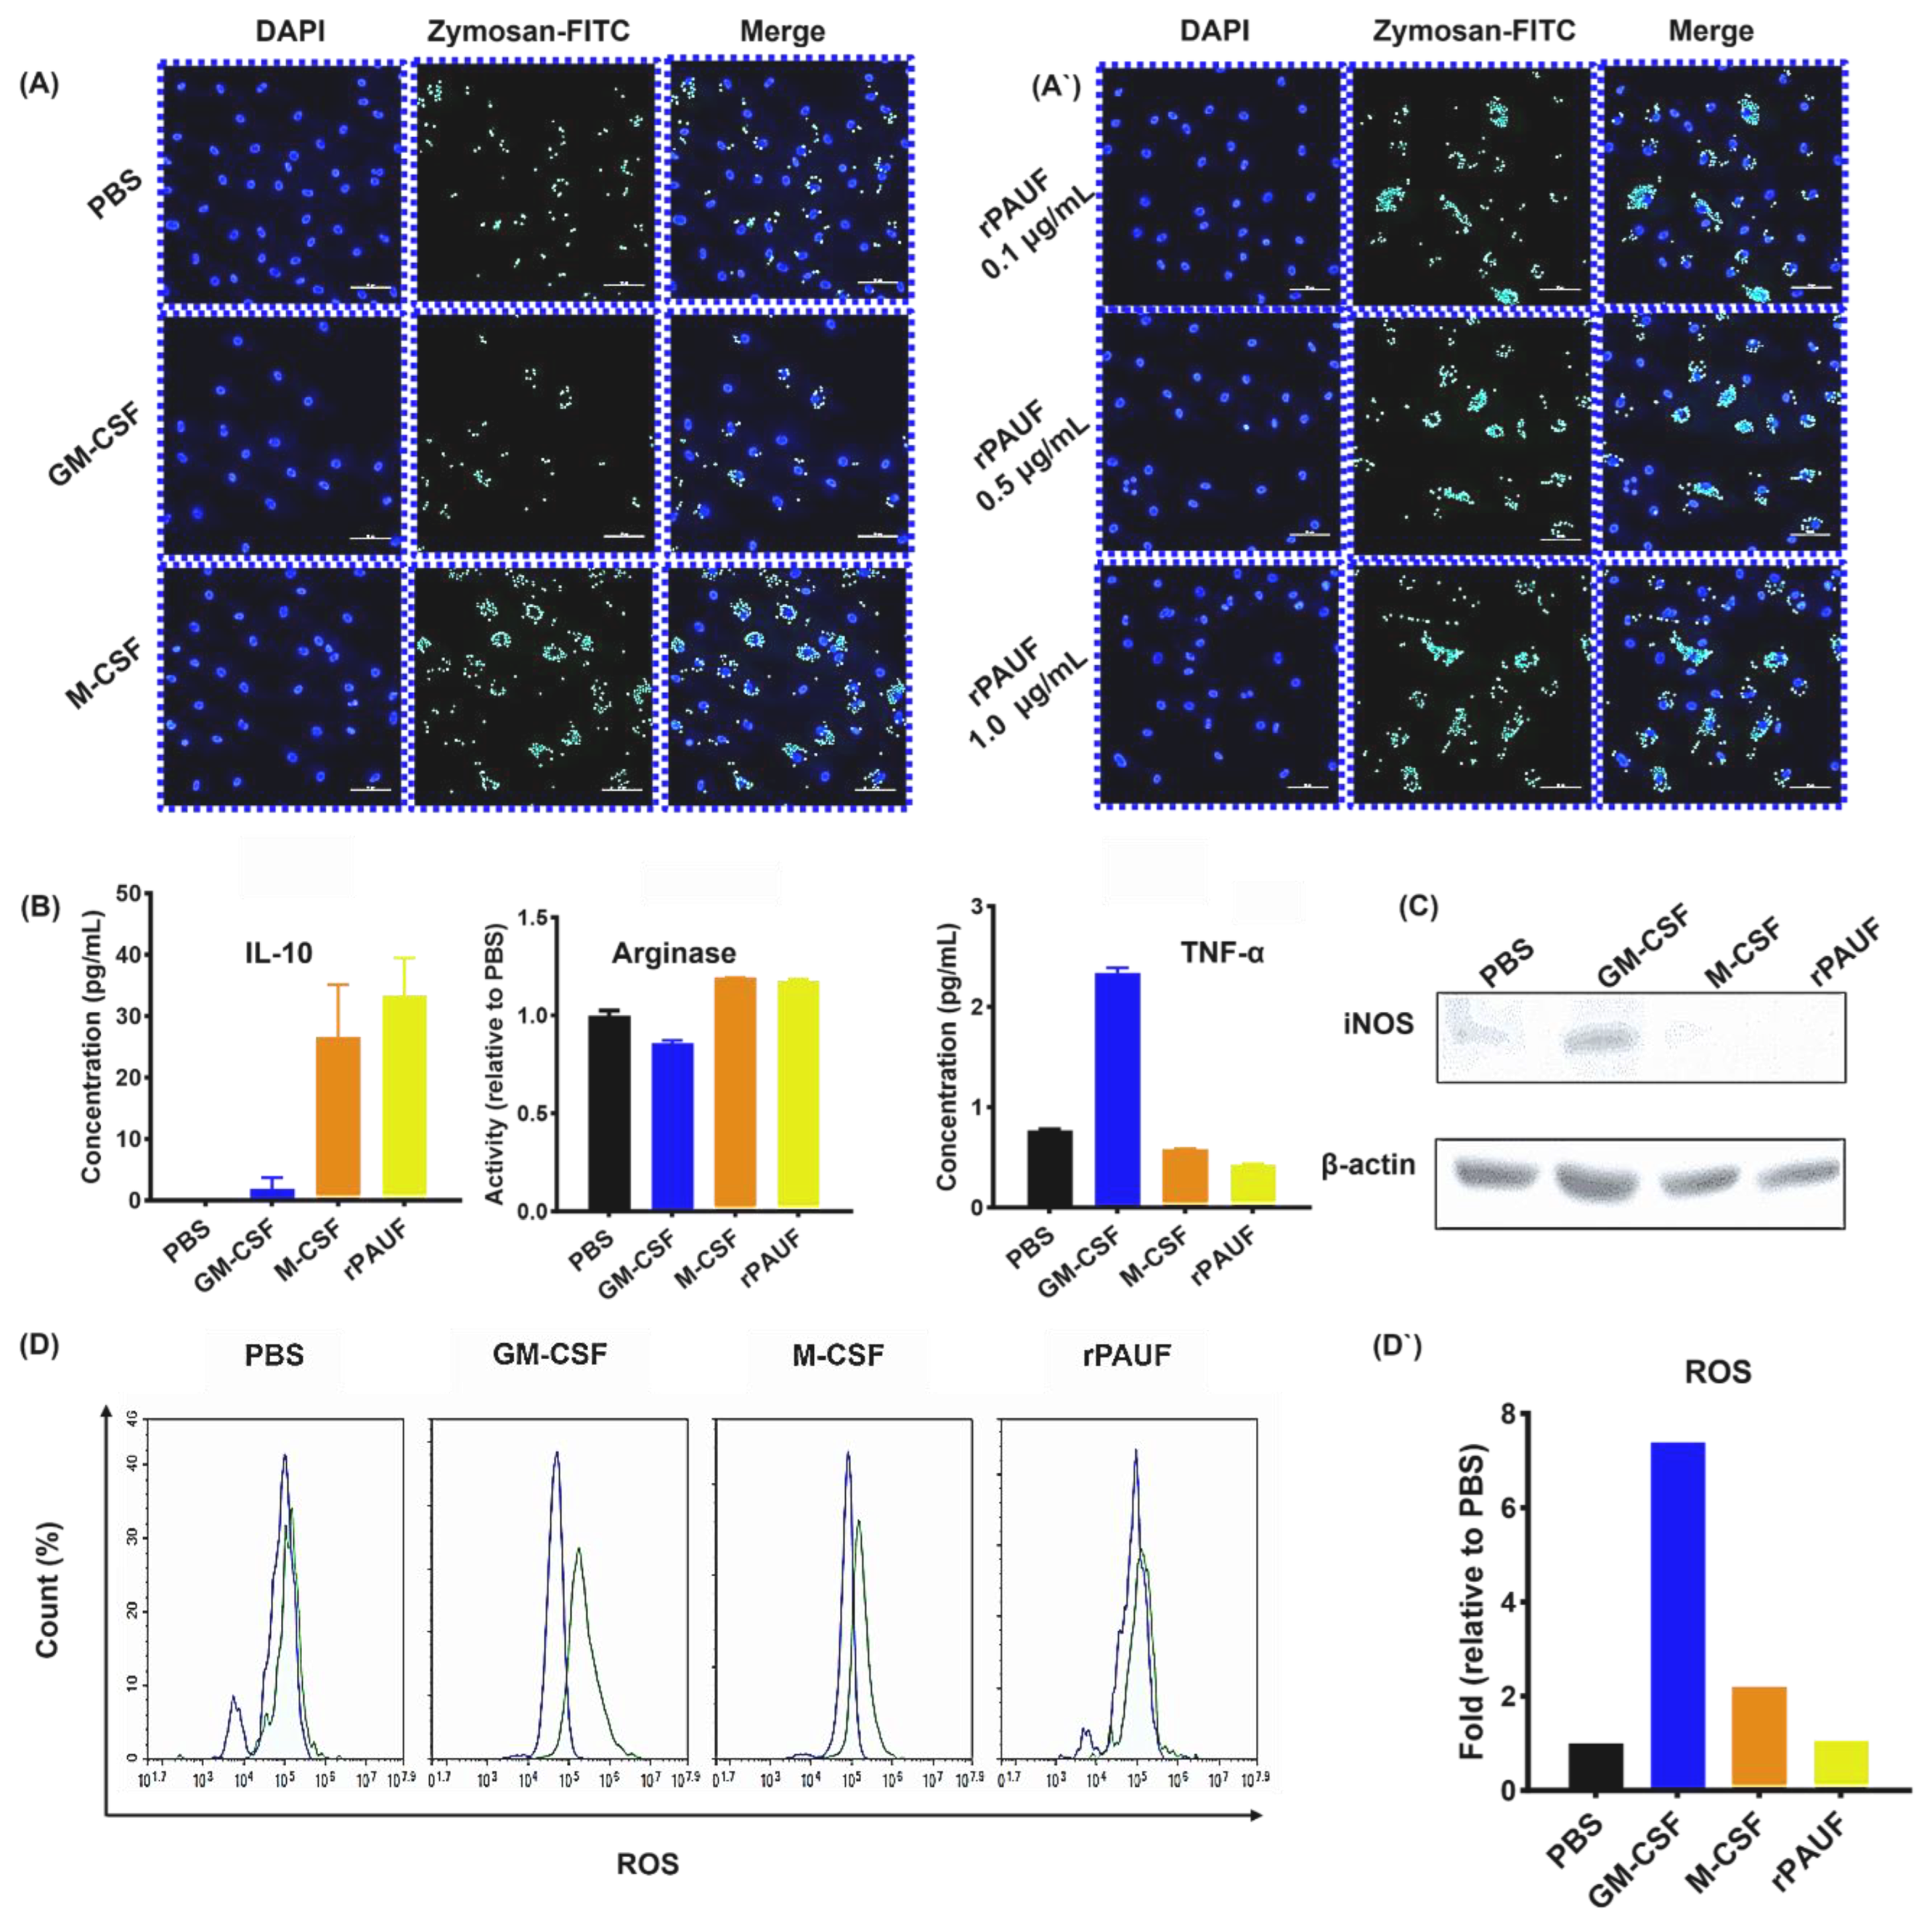
Figure 5.
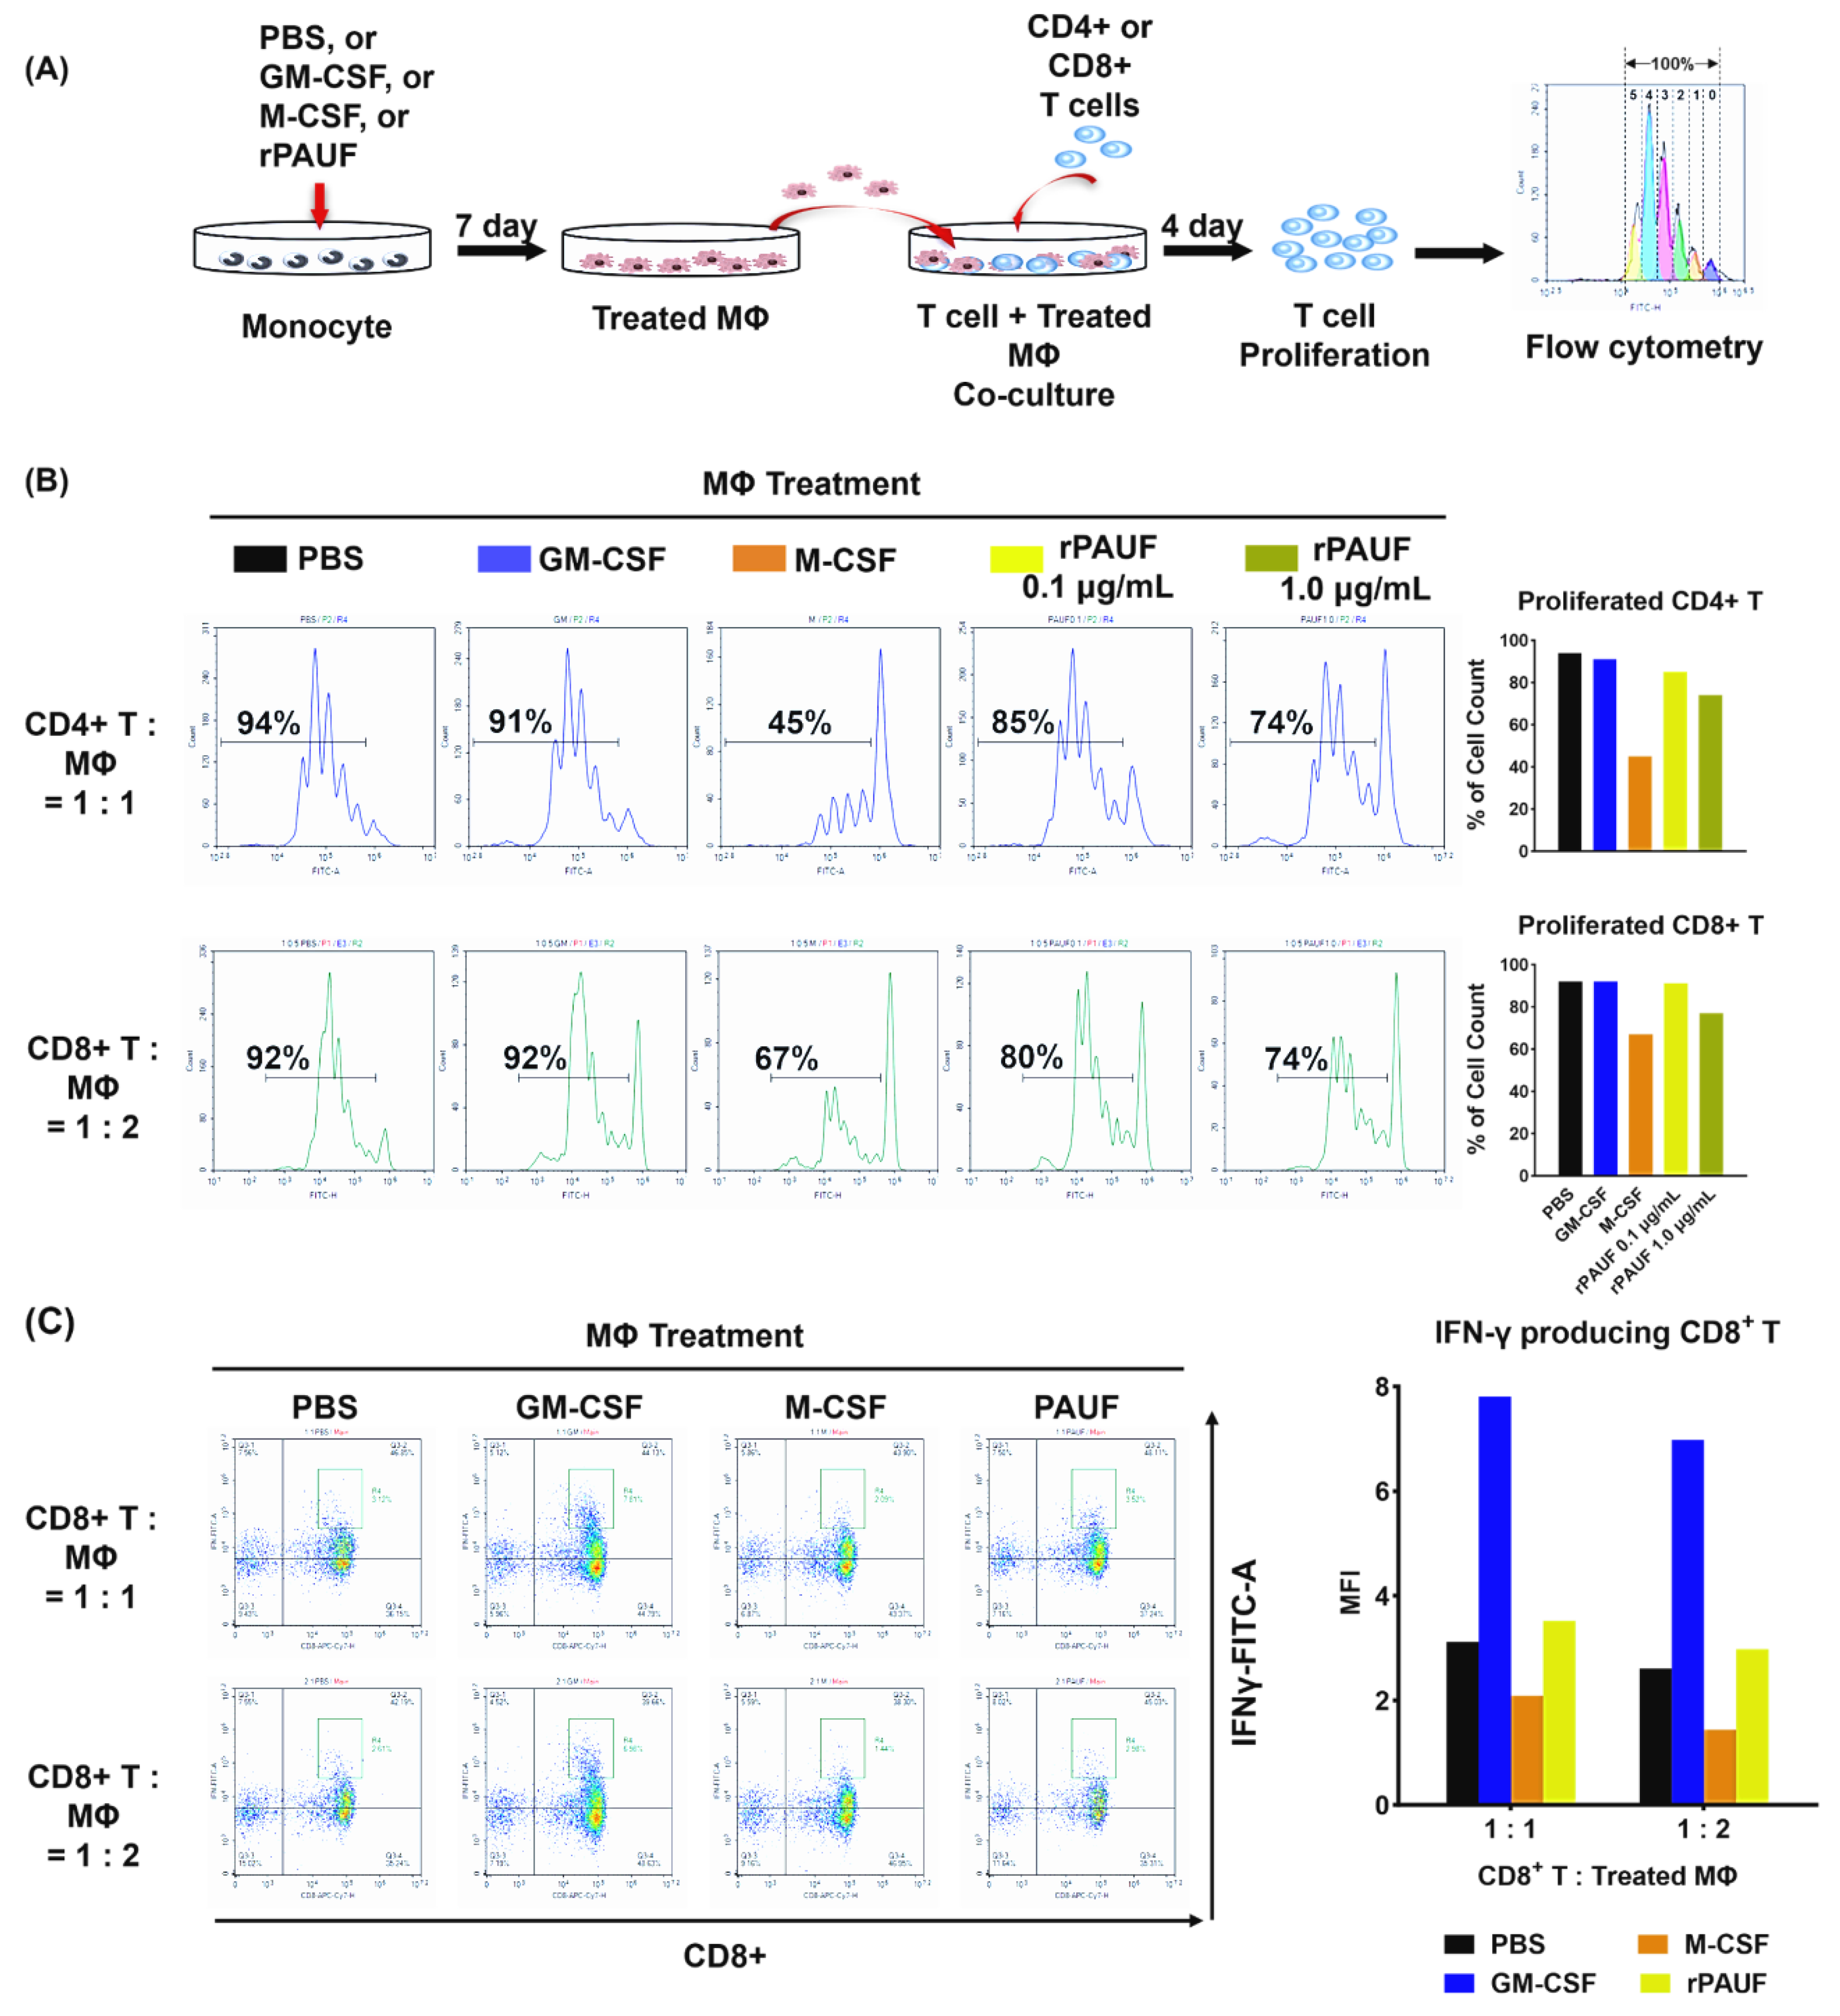
PAUF promotes the transformation of monocytes into M2 macrophages by inhibiting T cell proliferation. (A) Schematic description of the experiments. Monocytes differentiated into macrophages by incubating with PBS, GM-CSF, M-CSF, or PAUF for 7 days. To perform the suppression assay, isolated (B) CD4+ T cells or (C) CFSE-labeled CD8+ T cells were stimulated with anti-CD3/CD28 microbeads and co-cultured with macrophages in 1:1 or 1:2, or 1:0.5 ratio, respectively. After 4 days of co-culture, T cells were gathered and marked with anti-CD4-PerCP or CD8-PE/Cyanine7 to assess T cell growth utilizing flow cytometry. Data were analyzed using NovoExpress software. The histograms represent the CFSE fluorescent peaks of proliferating T cell populations.
