Submitted:
02 October 2024
Posted:
03 October 2024
You are already at the latest version
Abstract
Keywords:
1. Introduction
2. Materials and Methods
3. Results
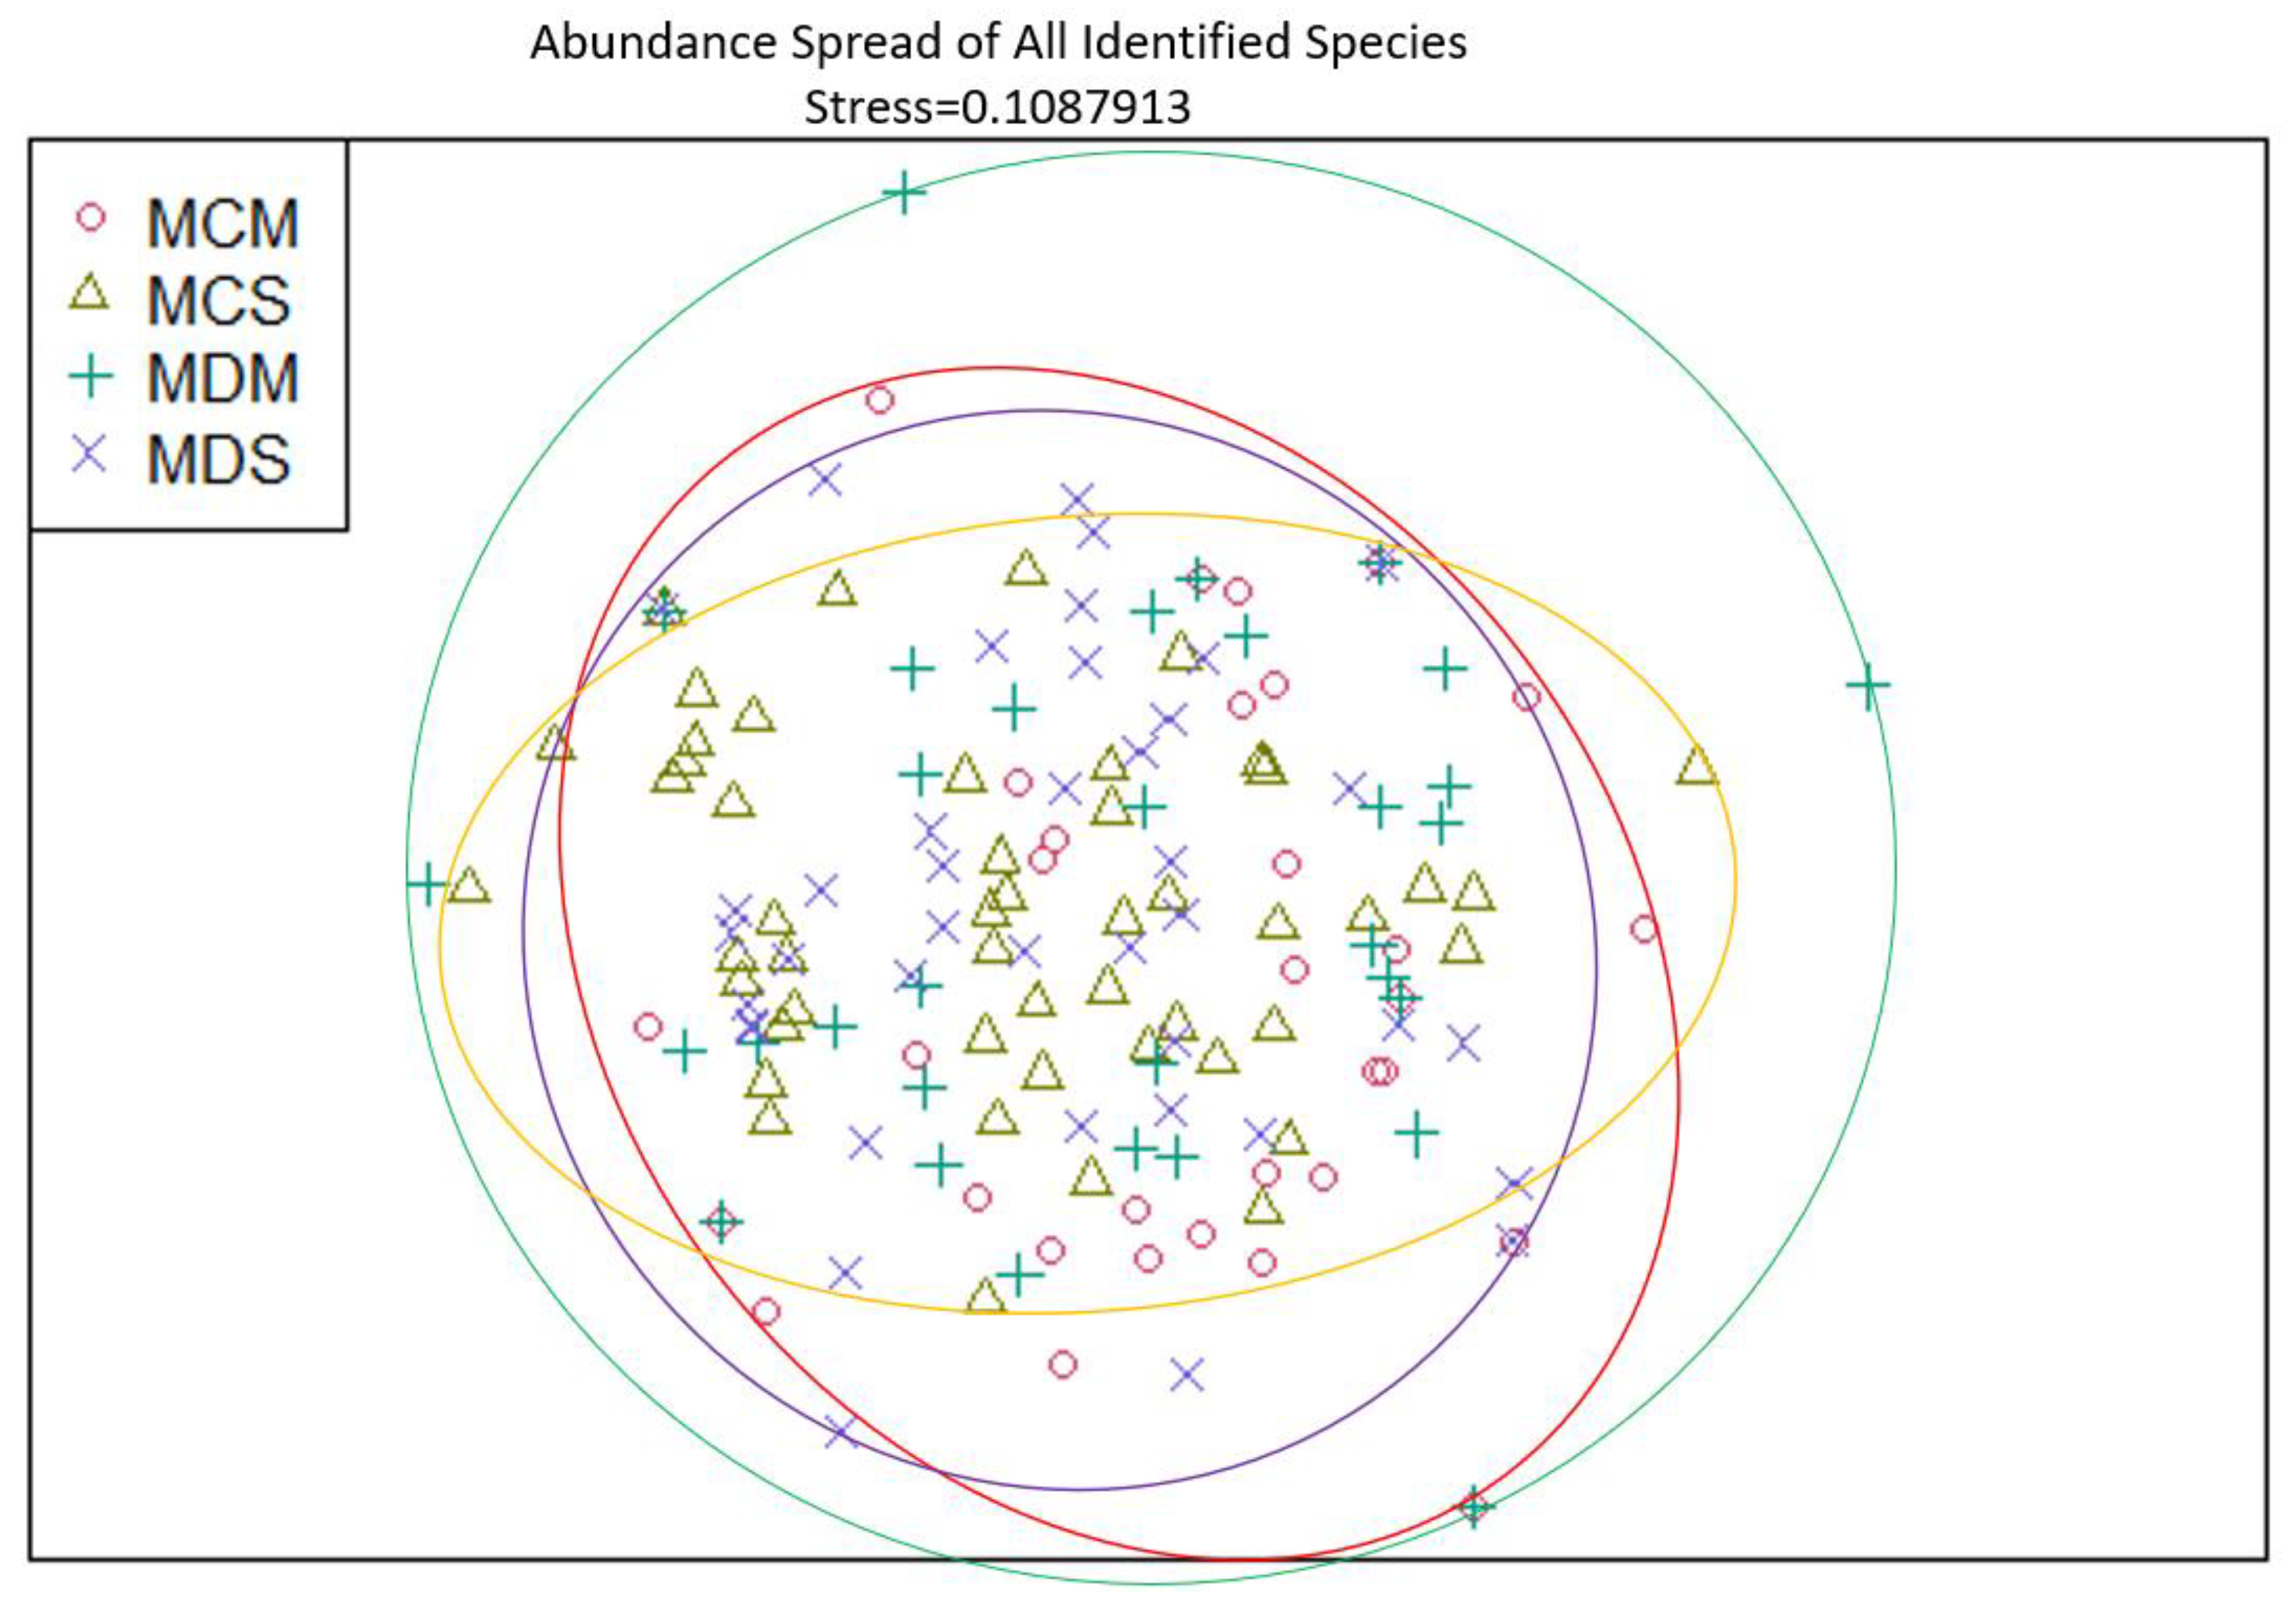
3.1. Presence and Absence of Species
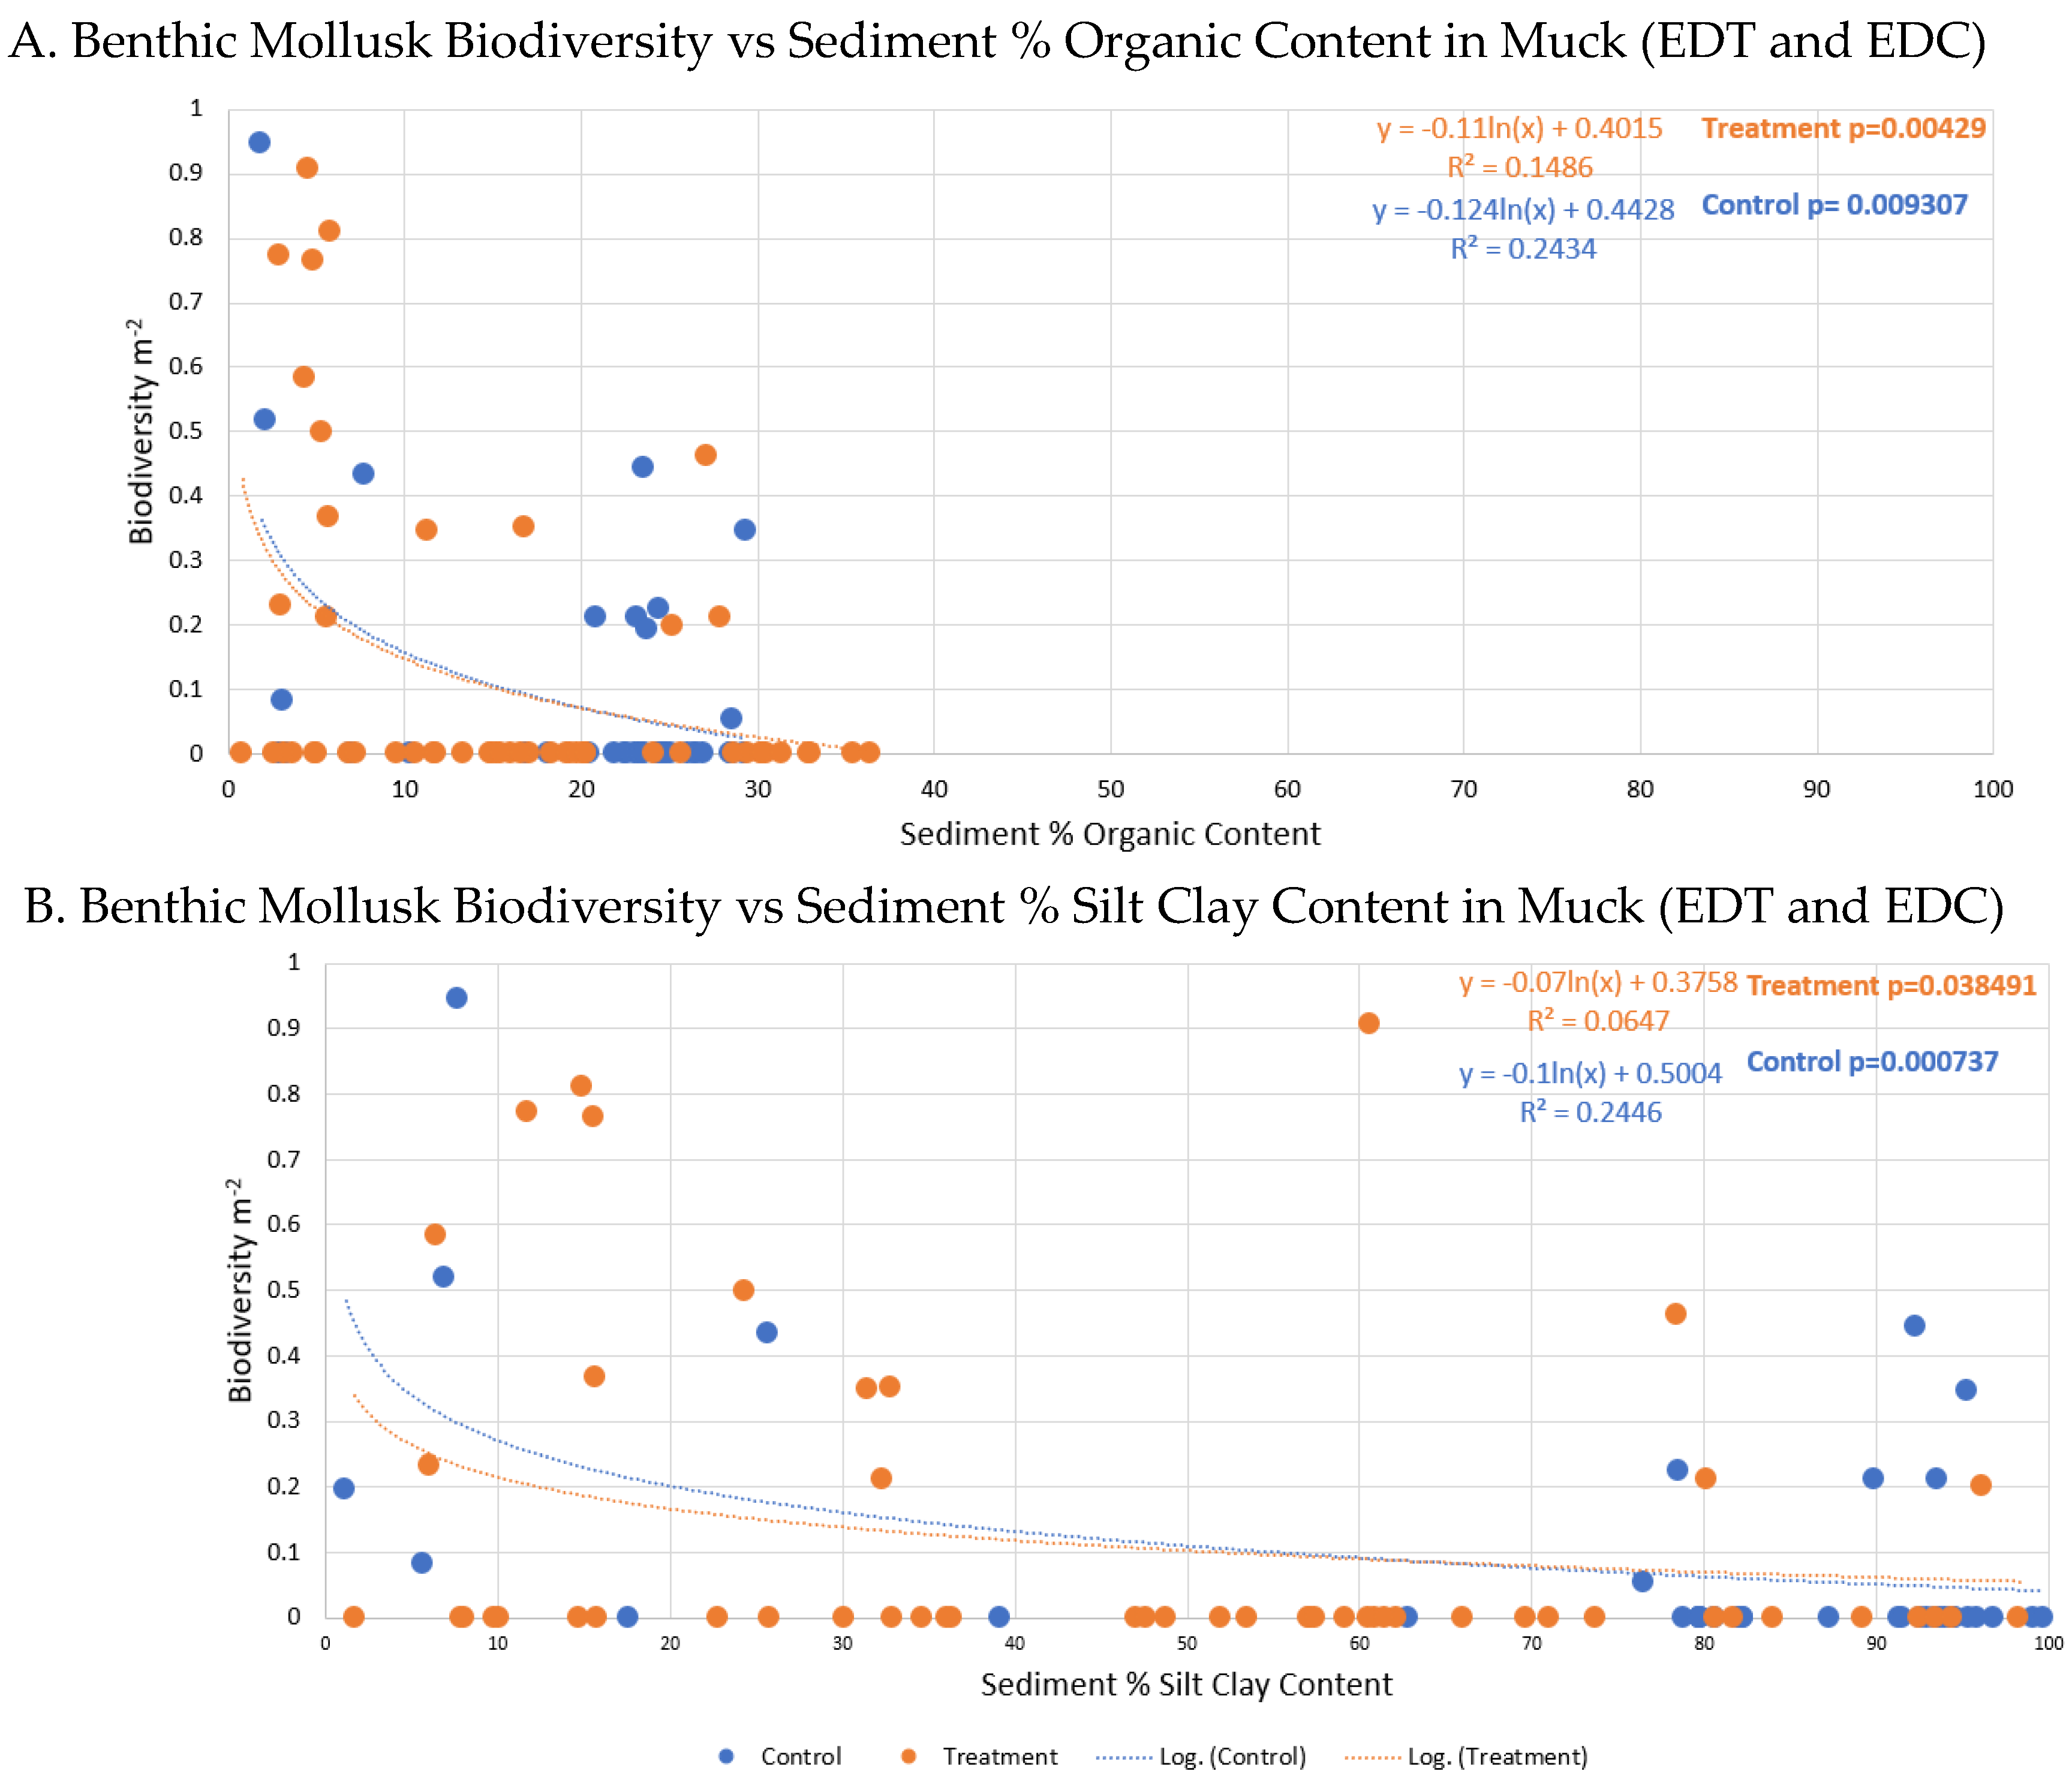
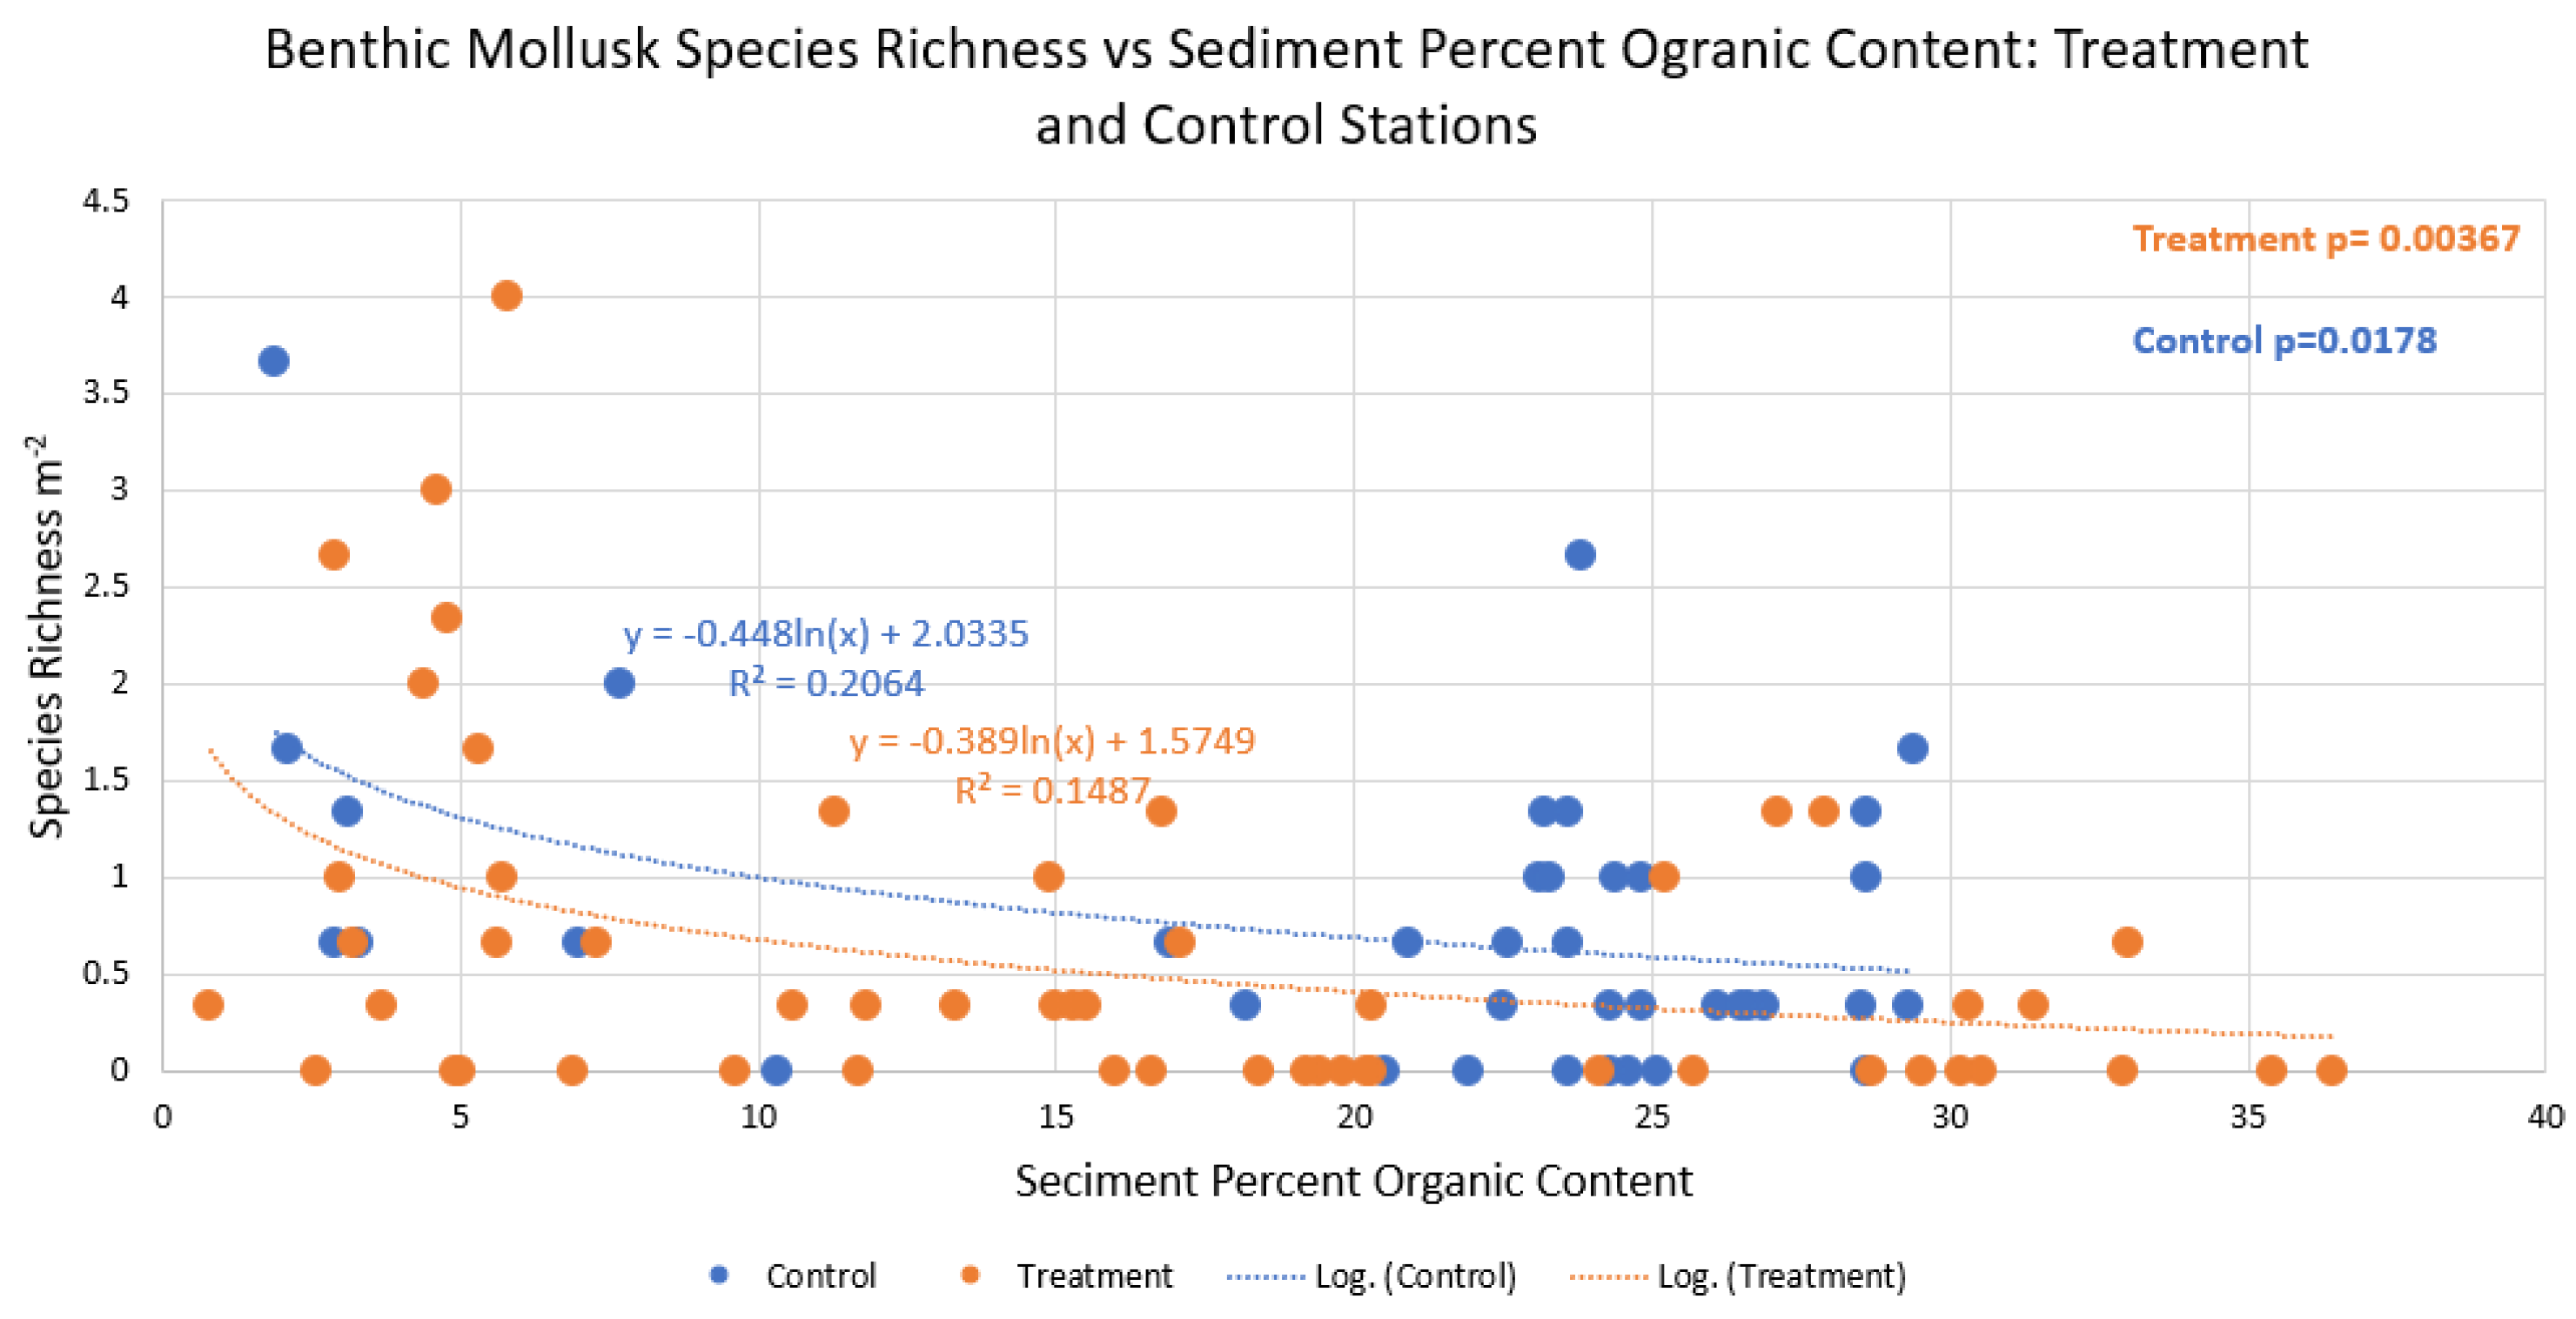

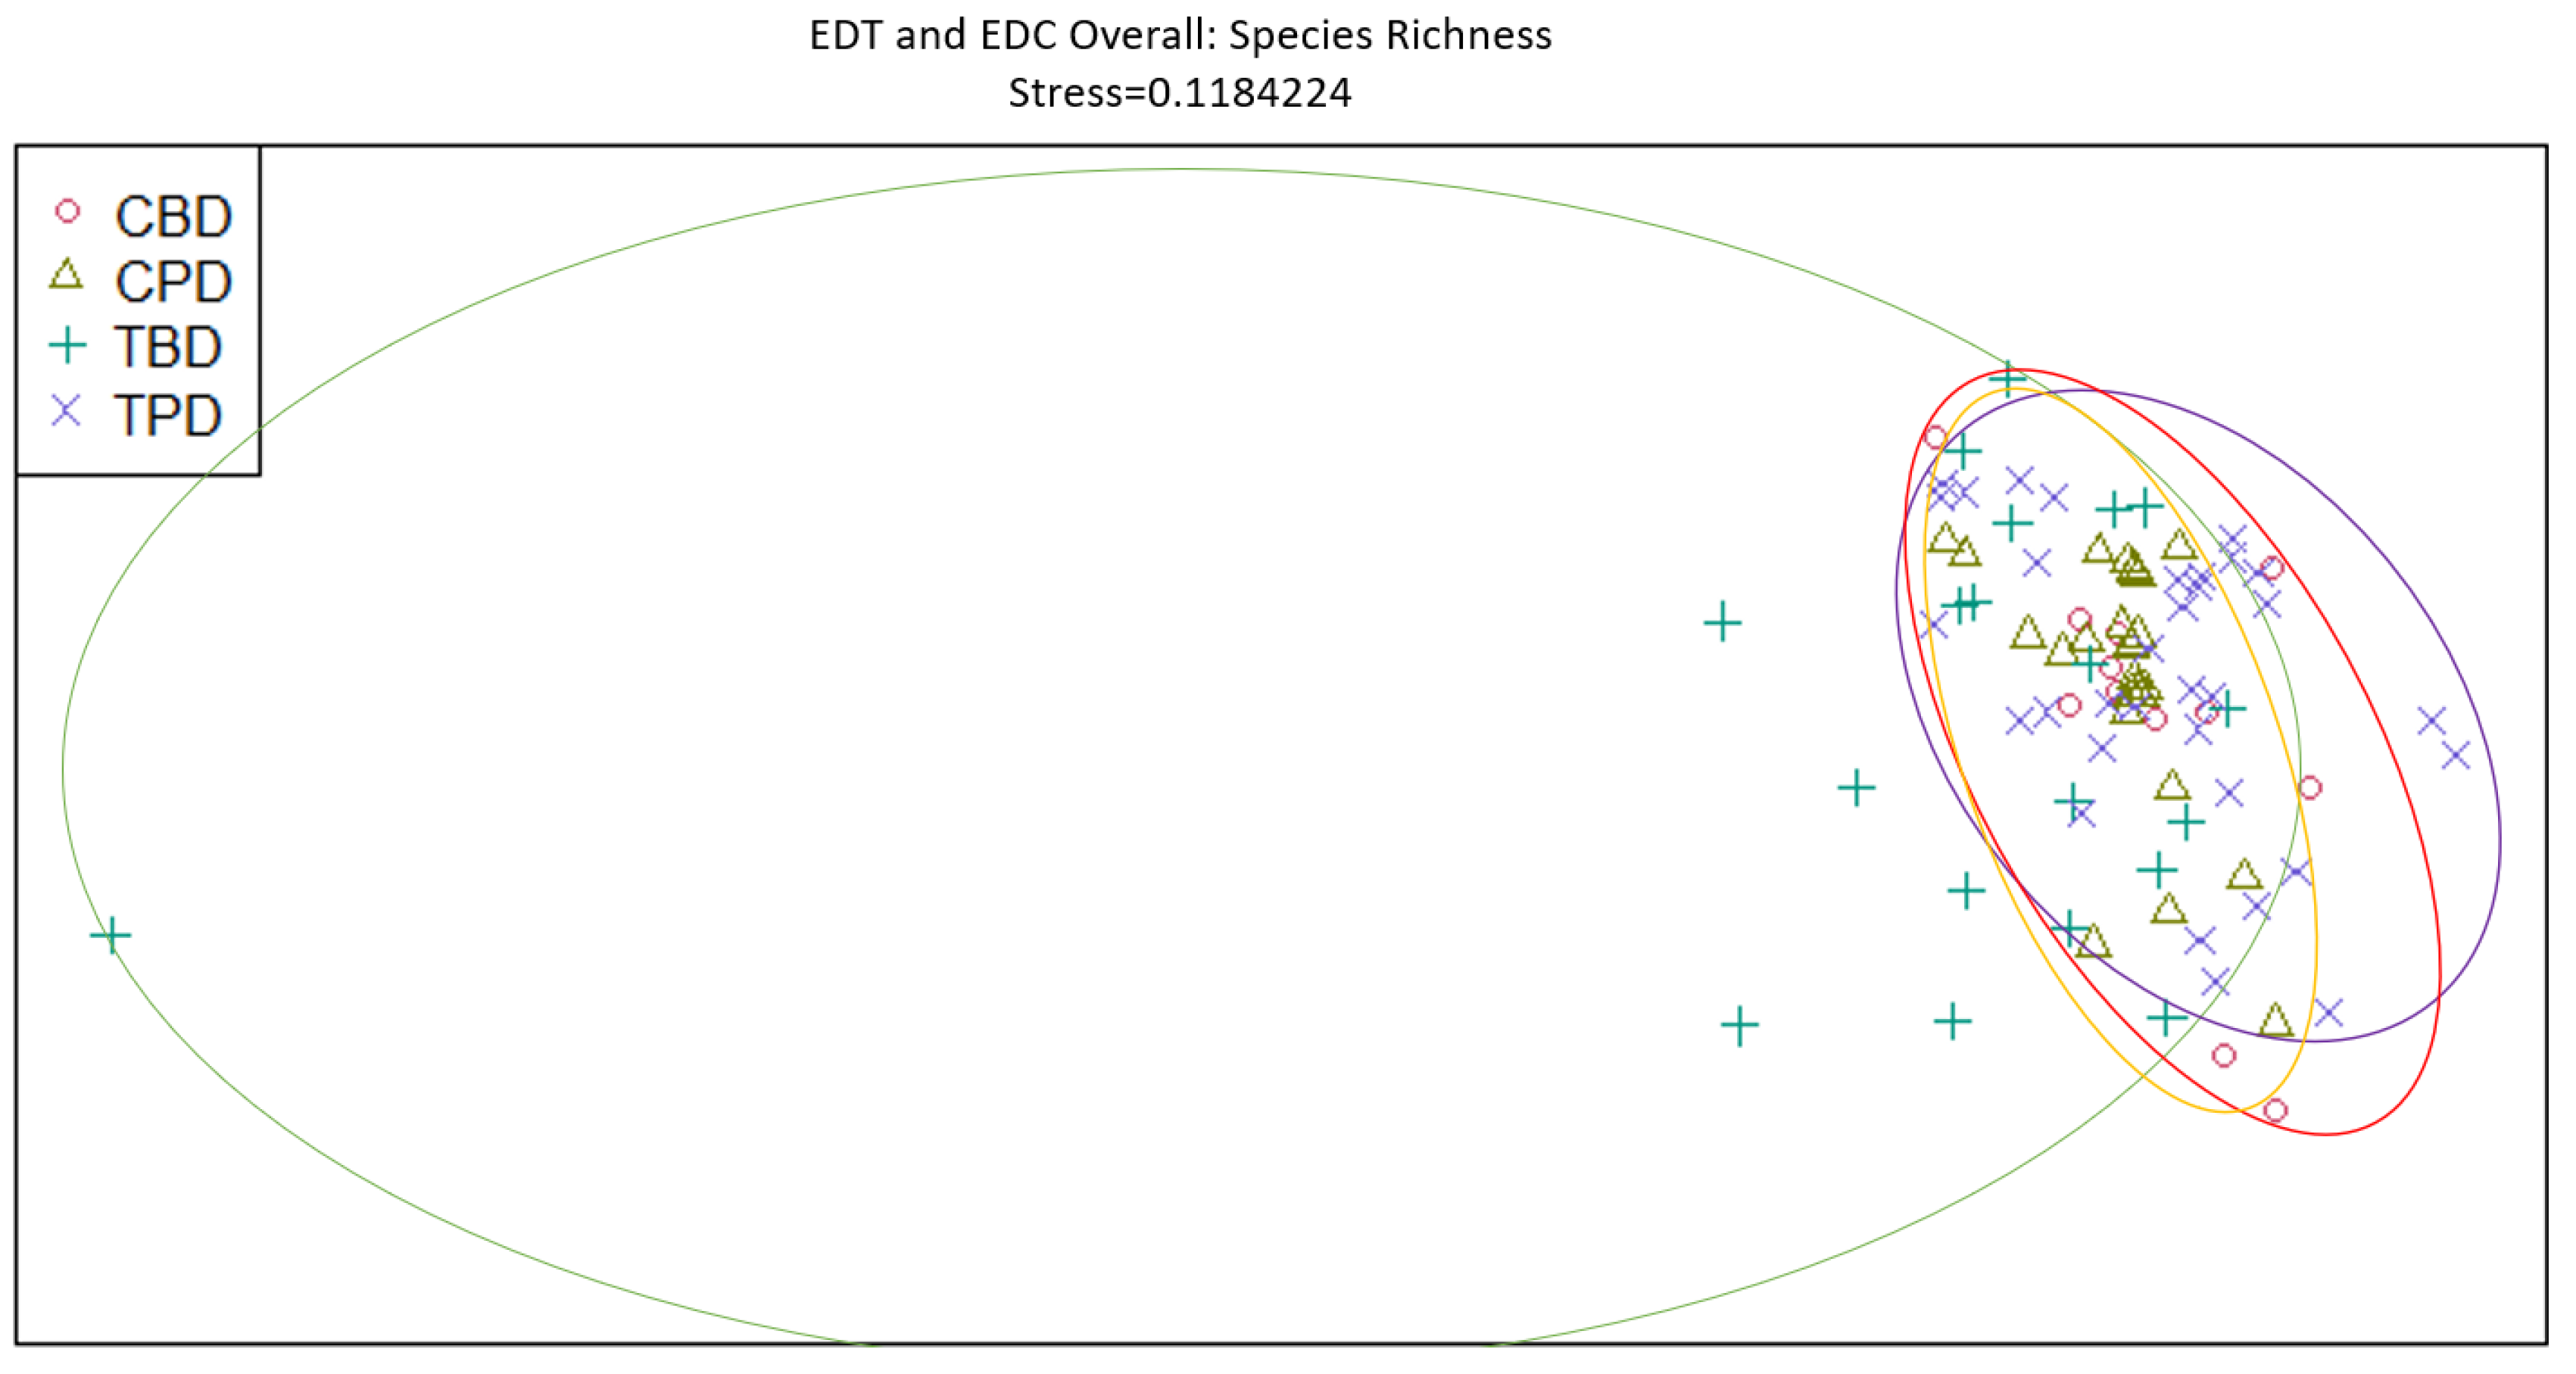
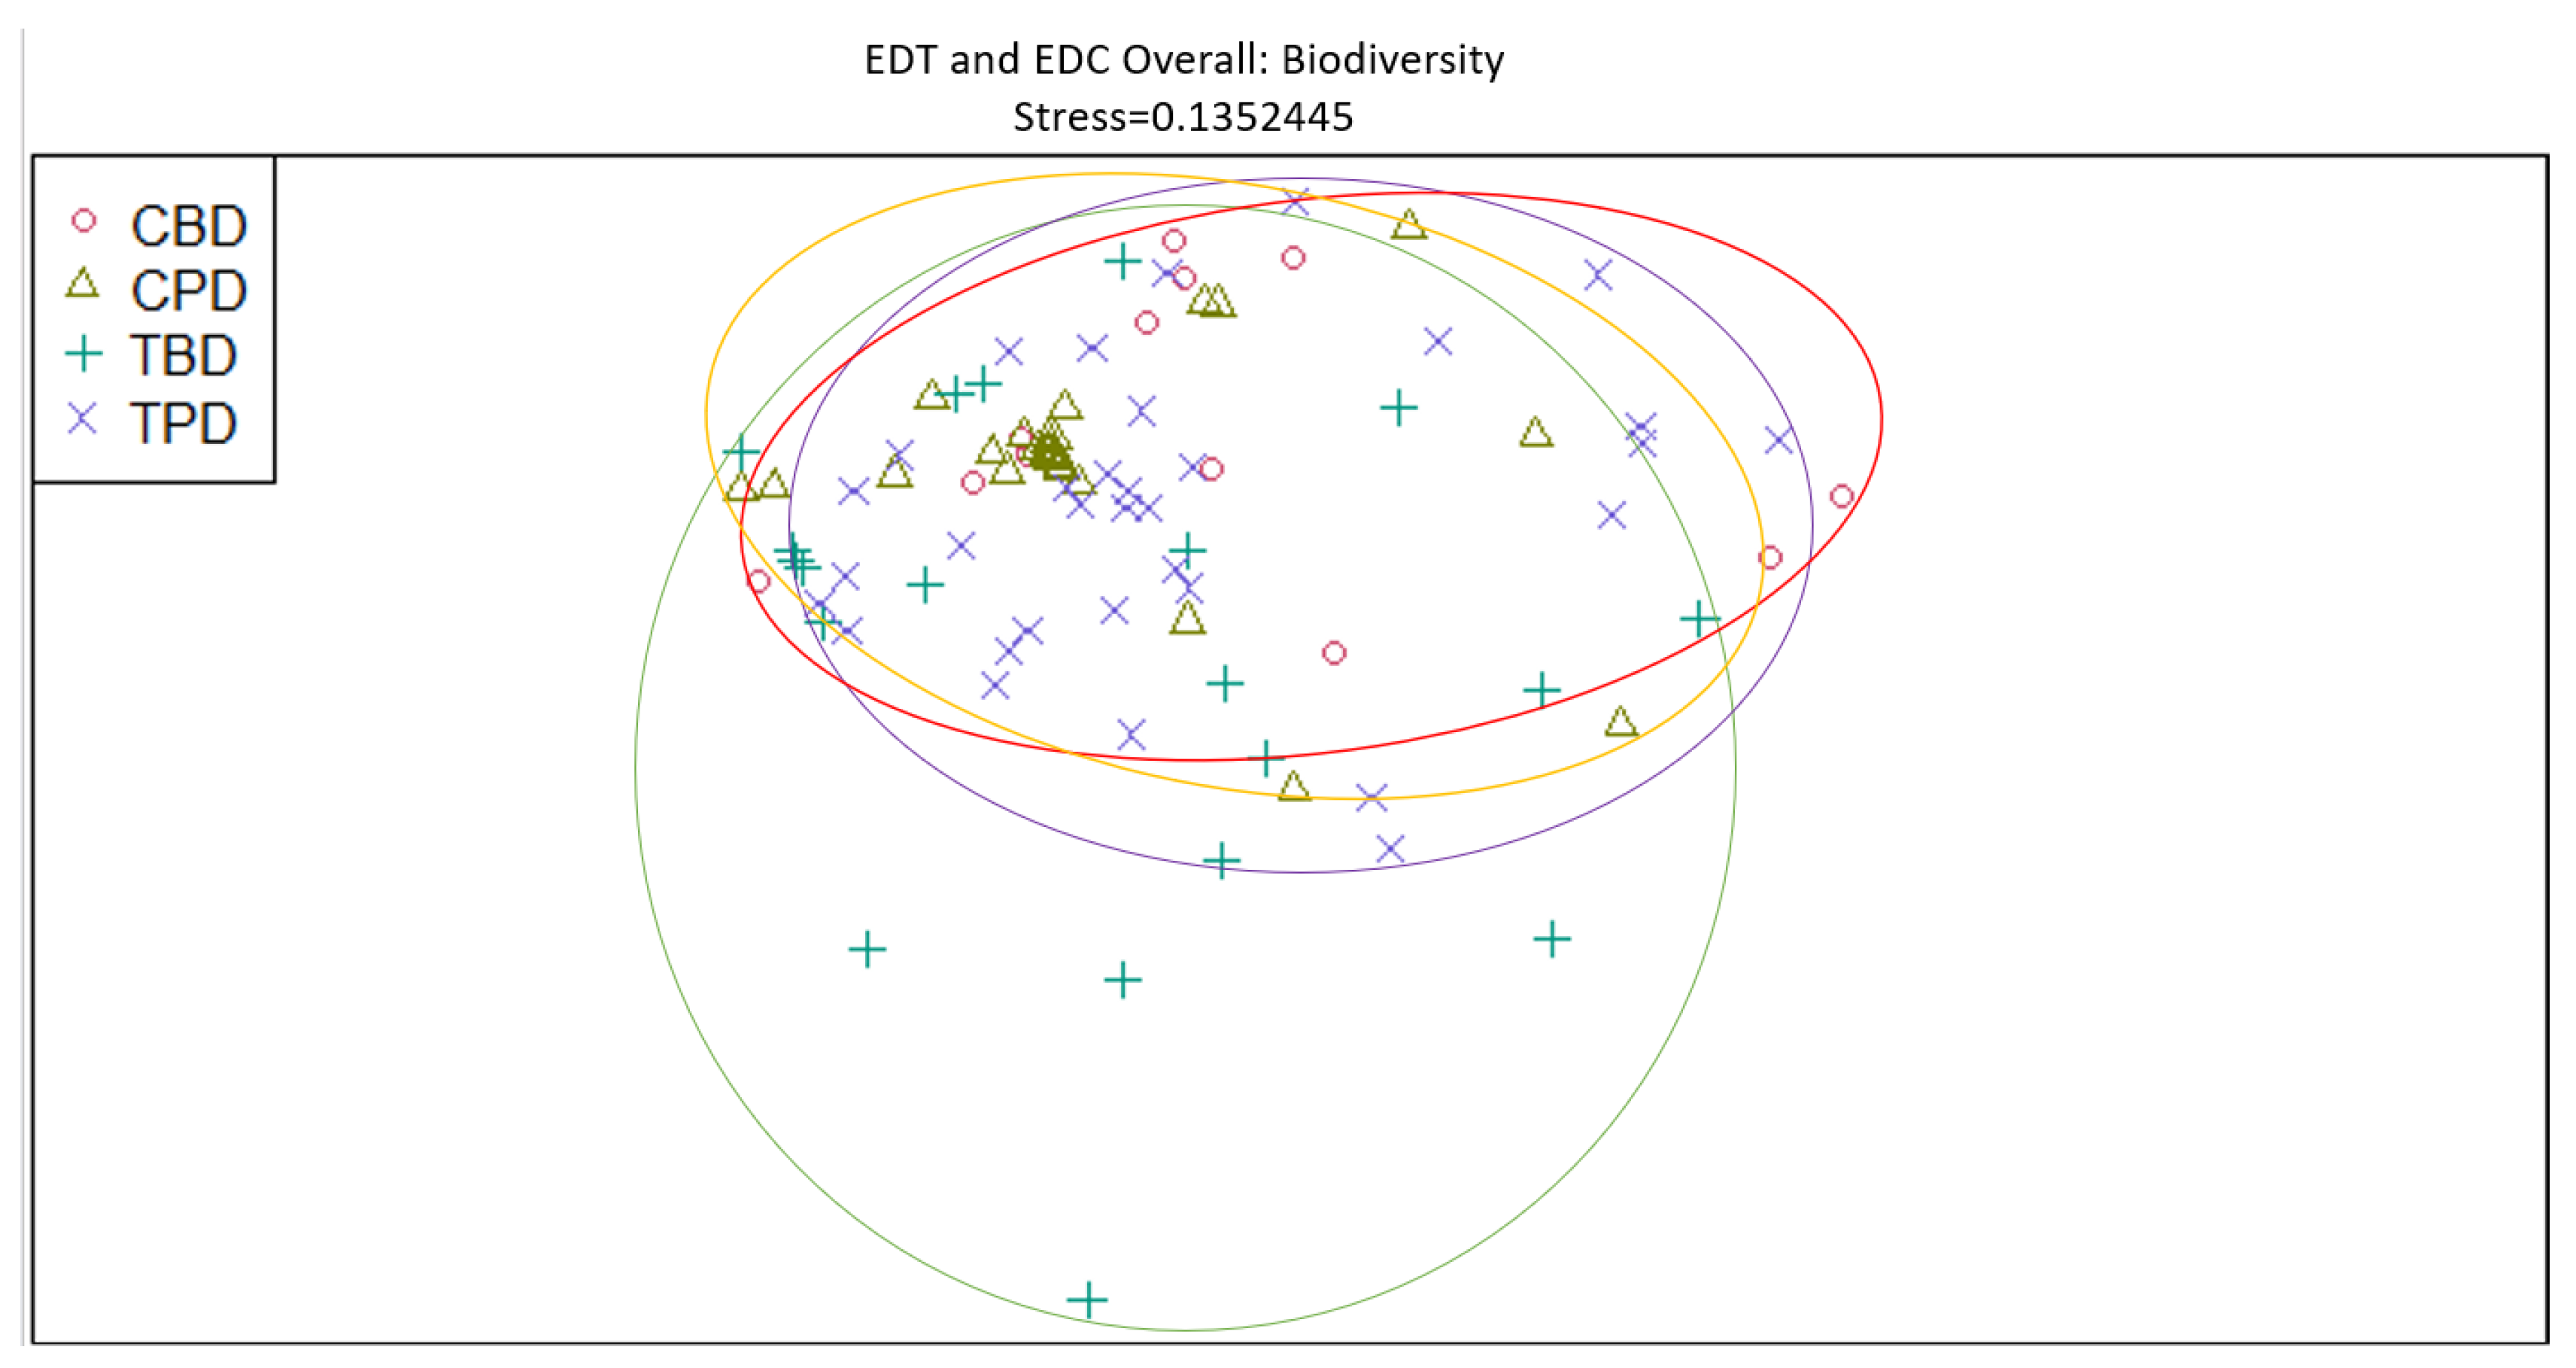
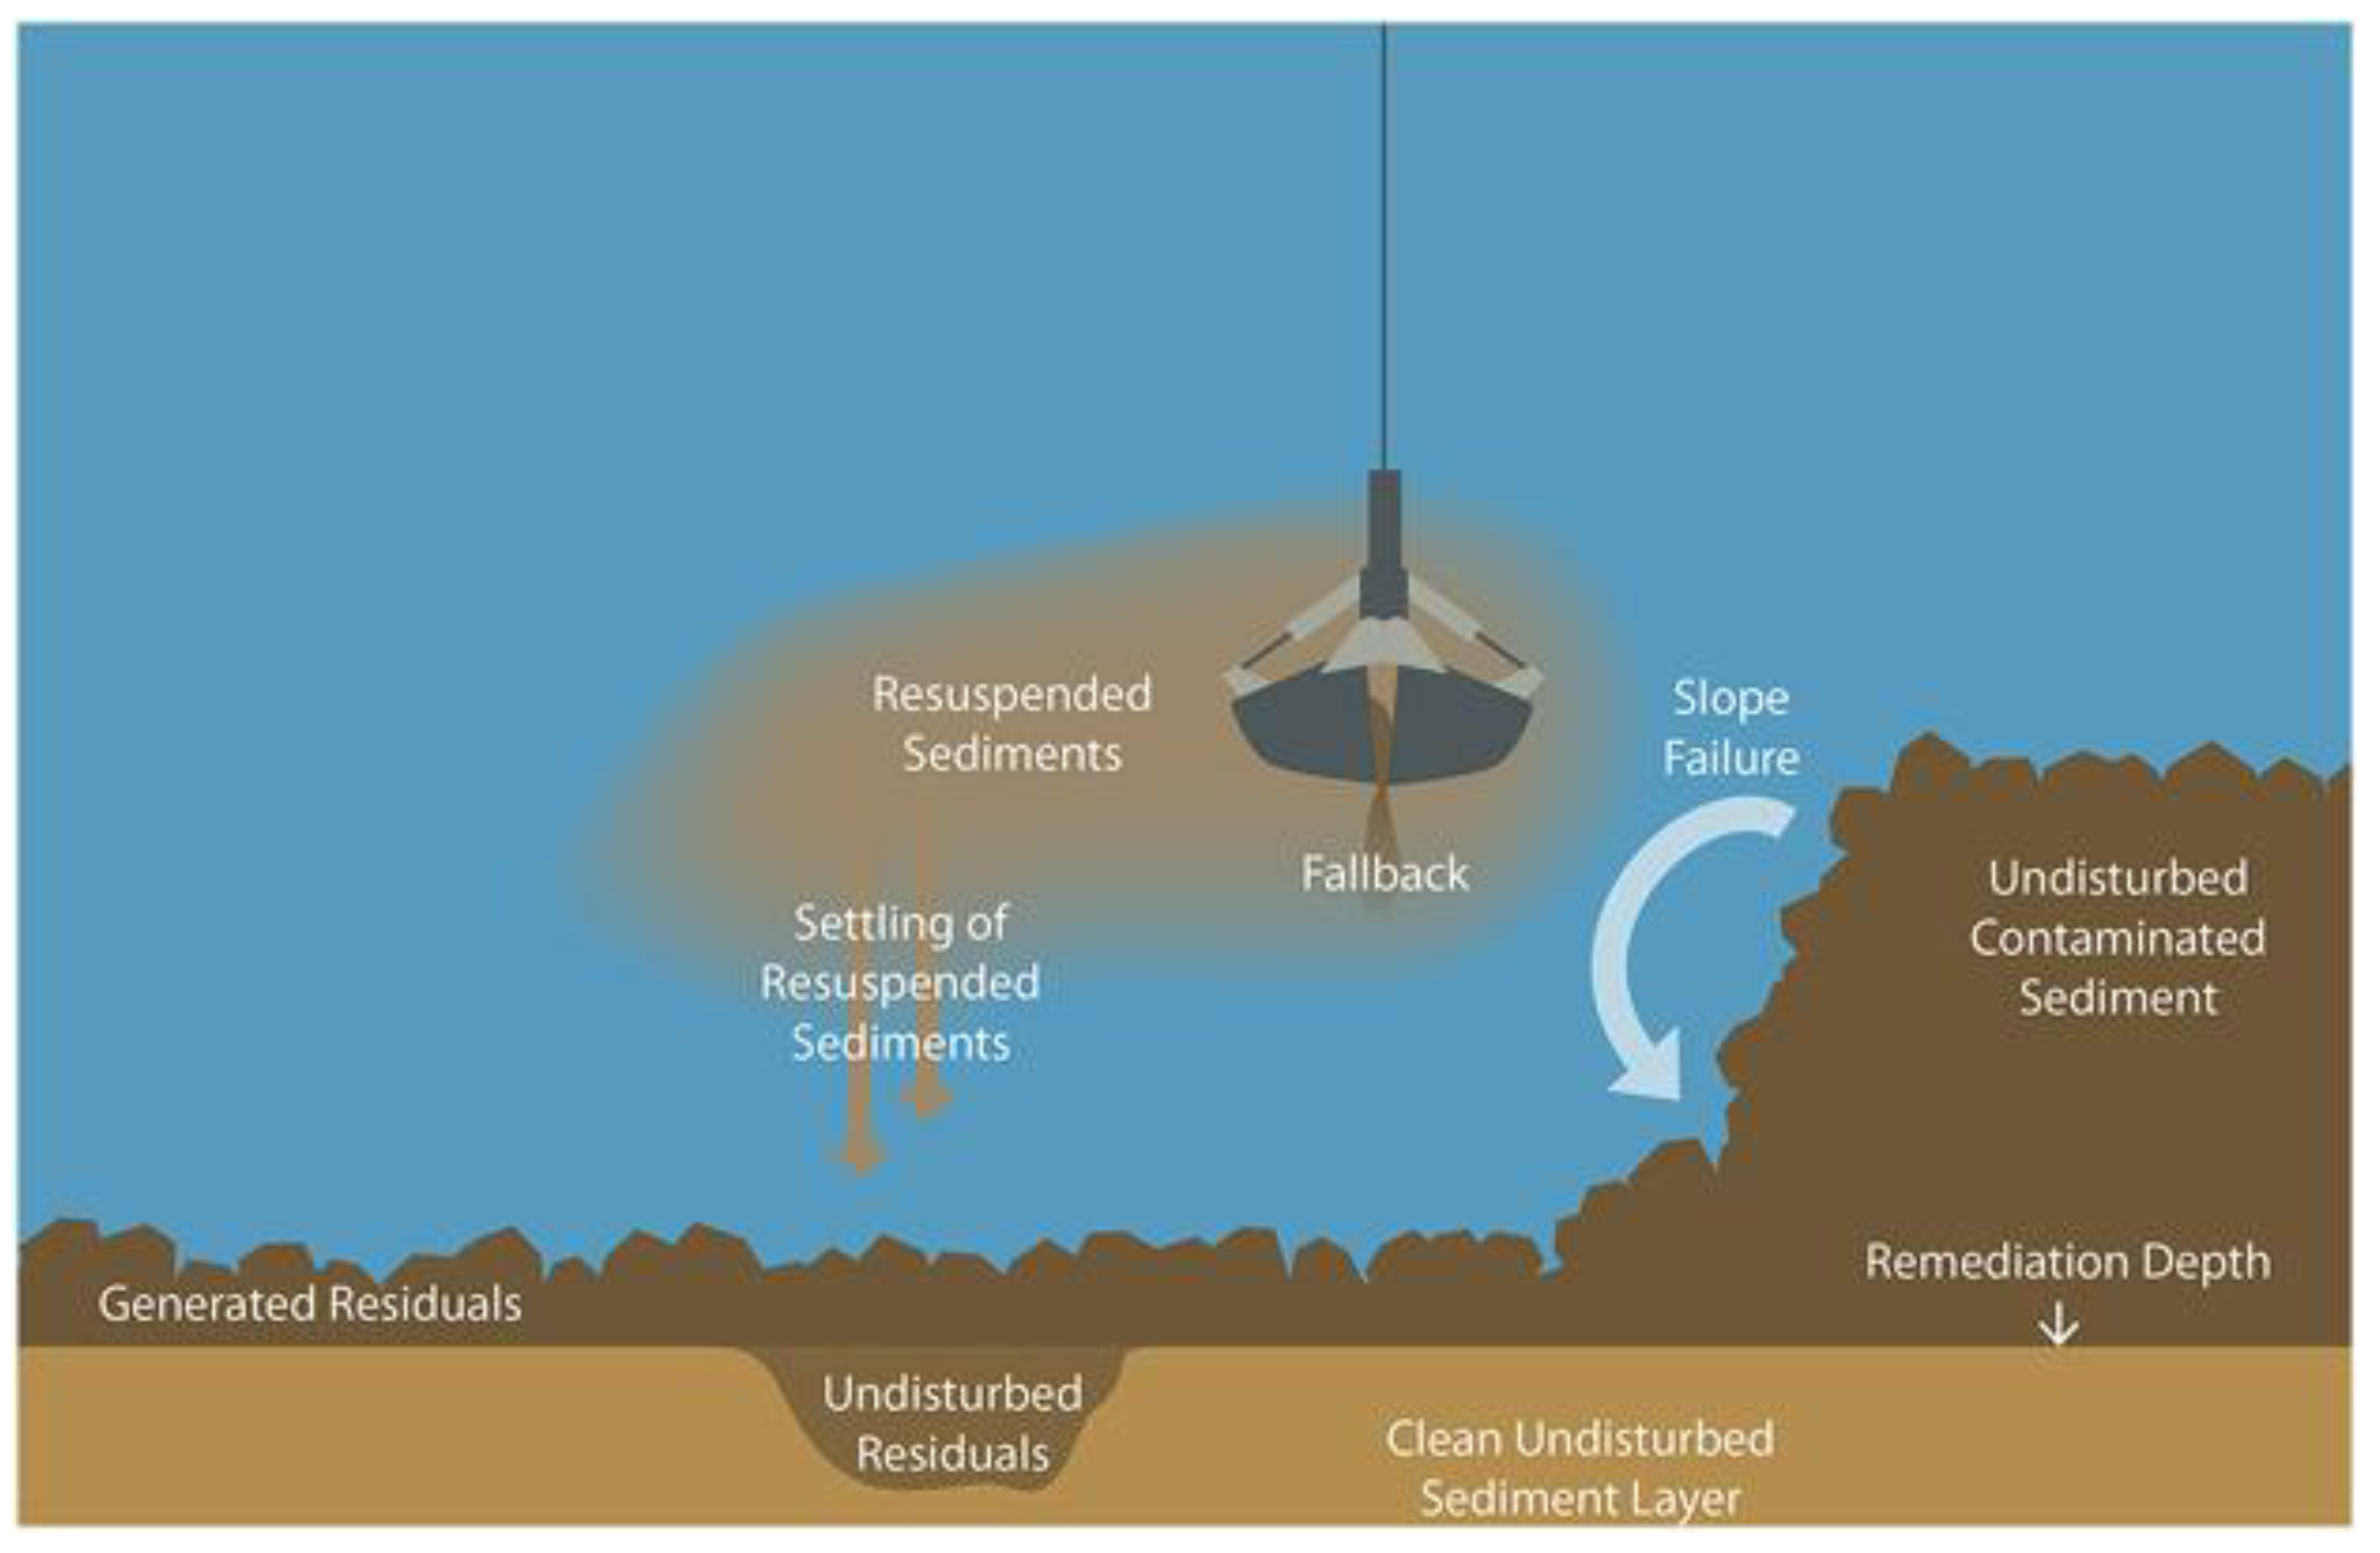
4. Discussion
5. Conclusions
Author Contributions
Funding
Data Availability Statement
Acknowledgments
Conflicts of Interest
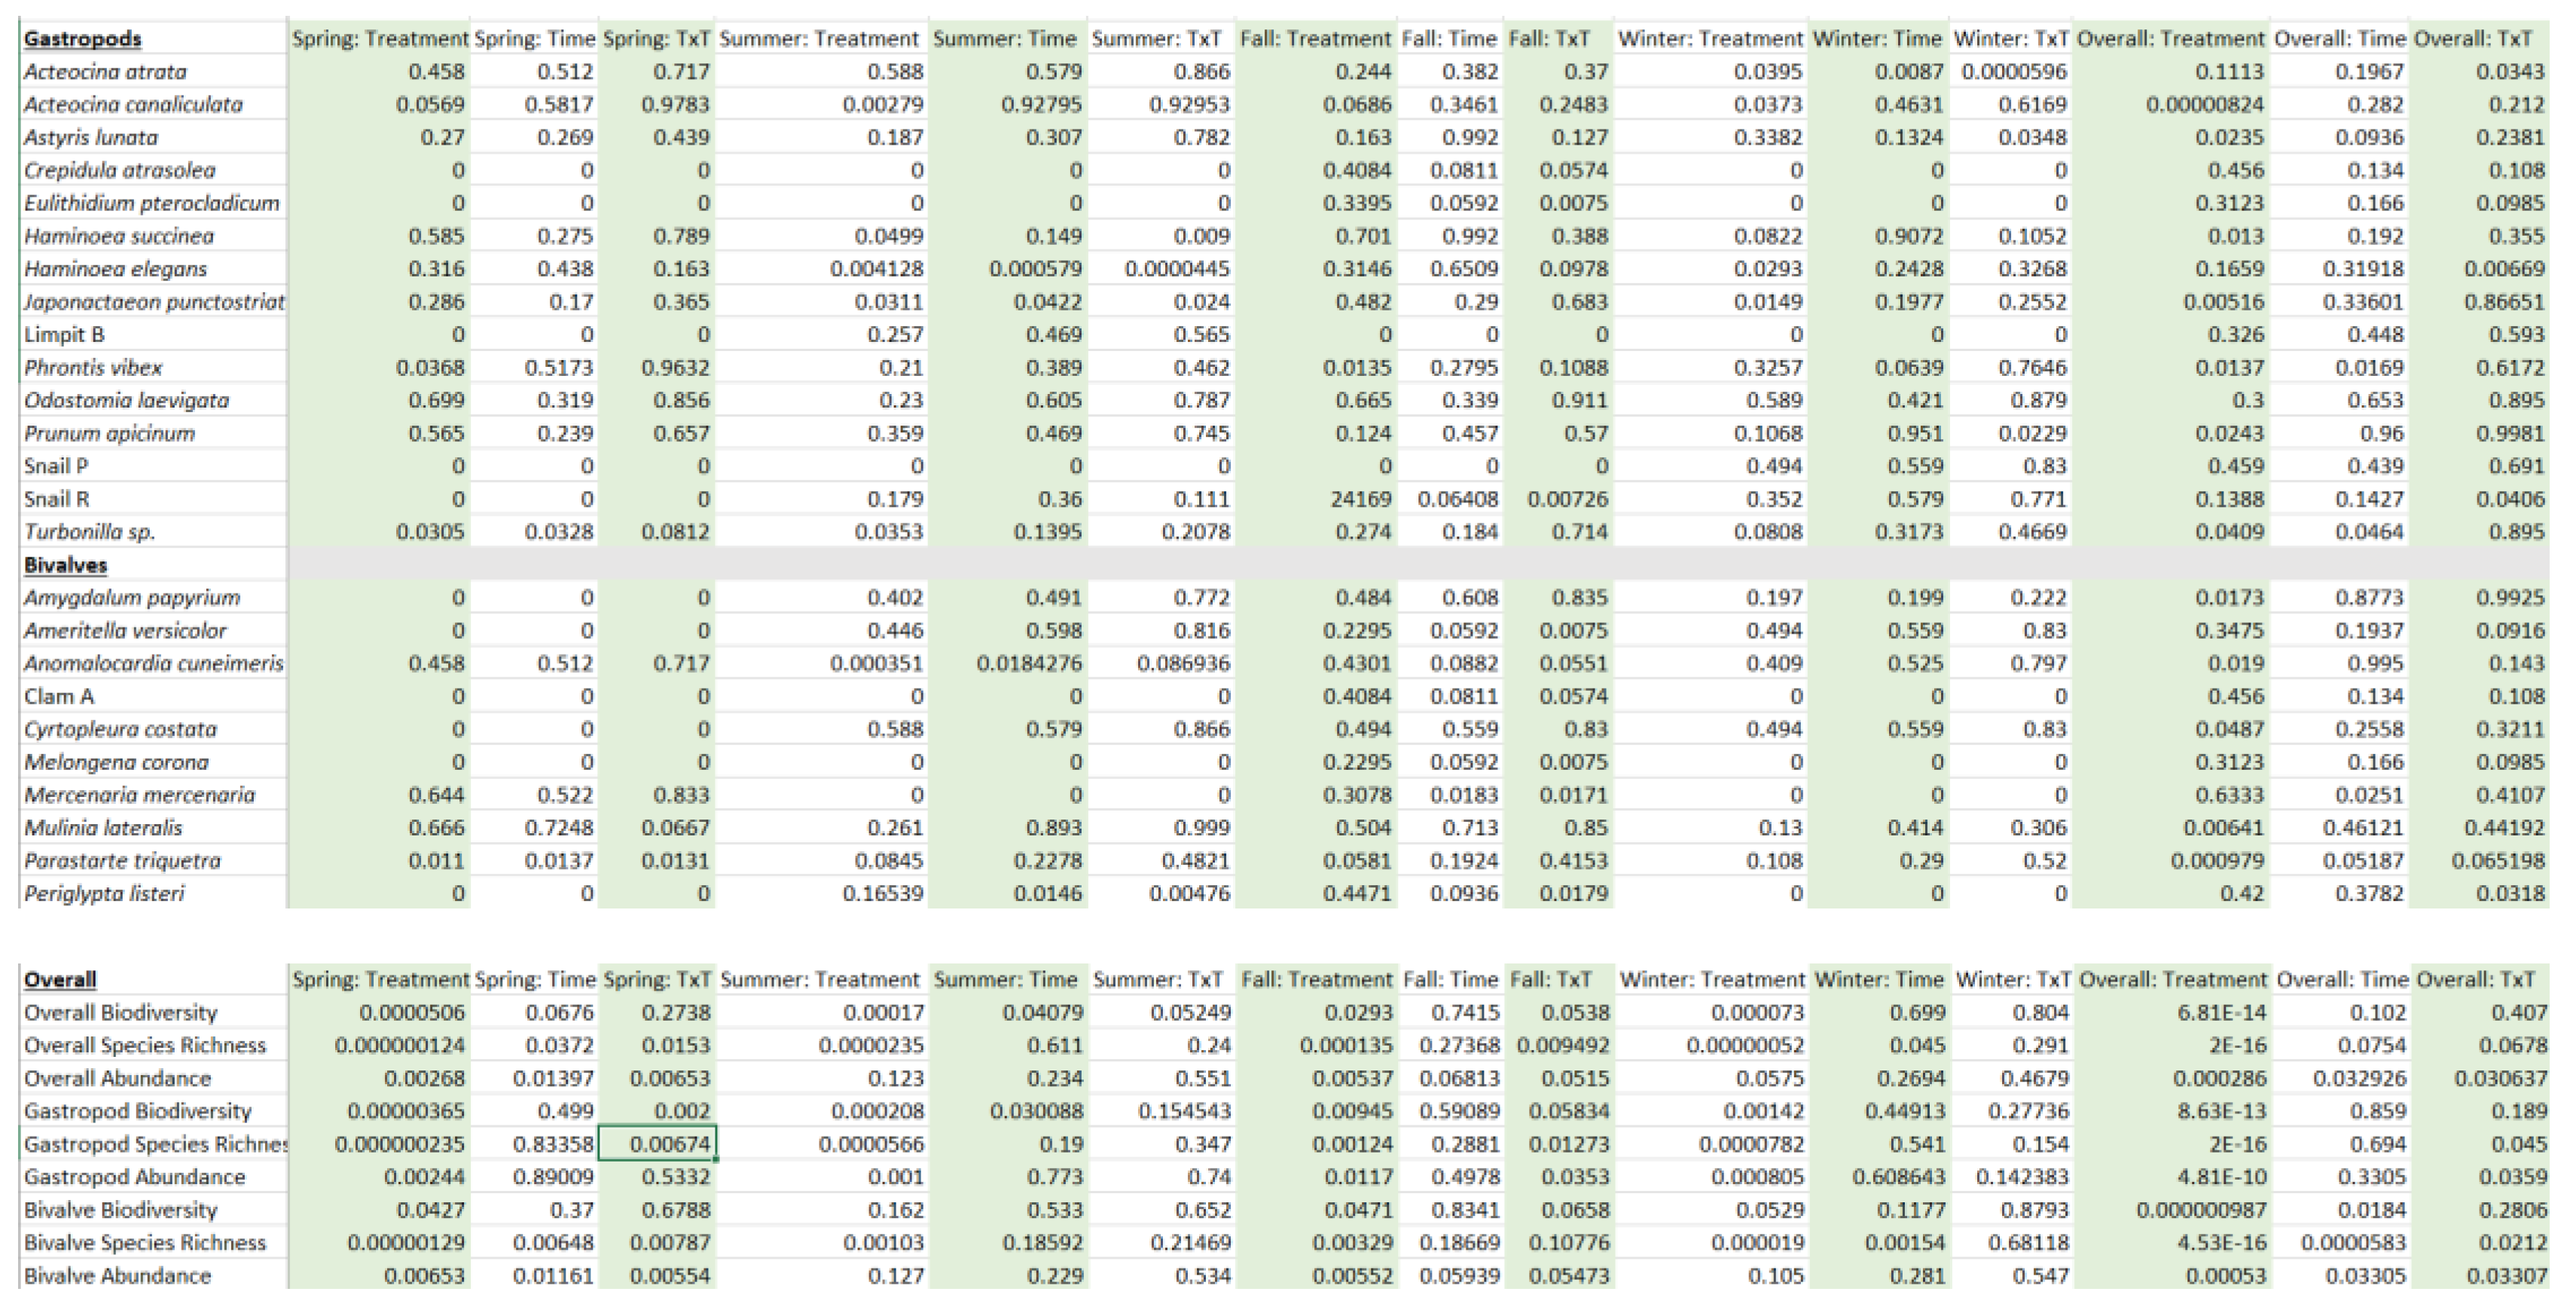
Appendix A
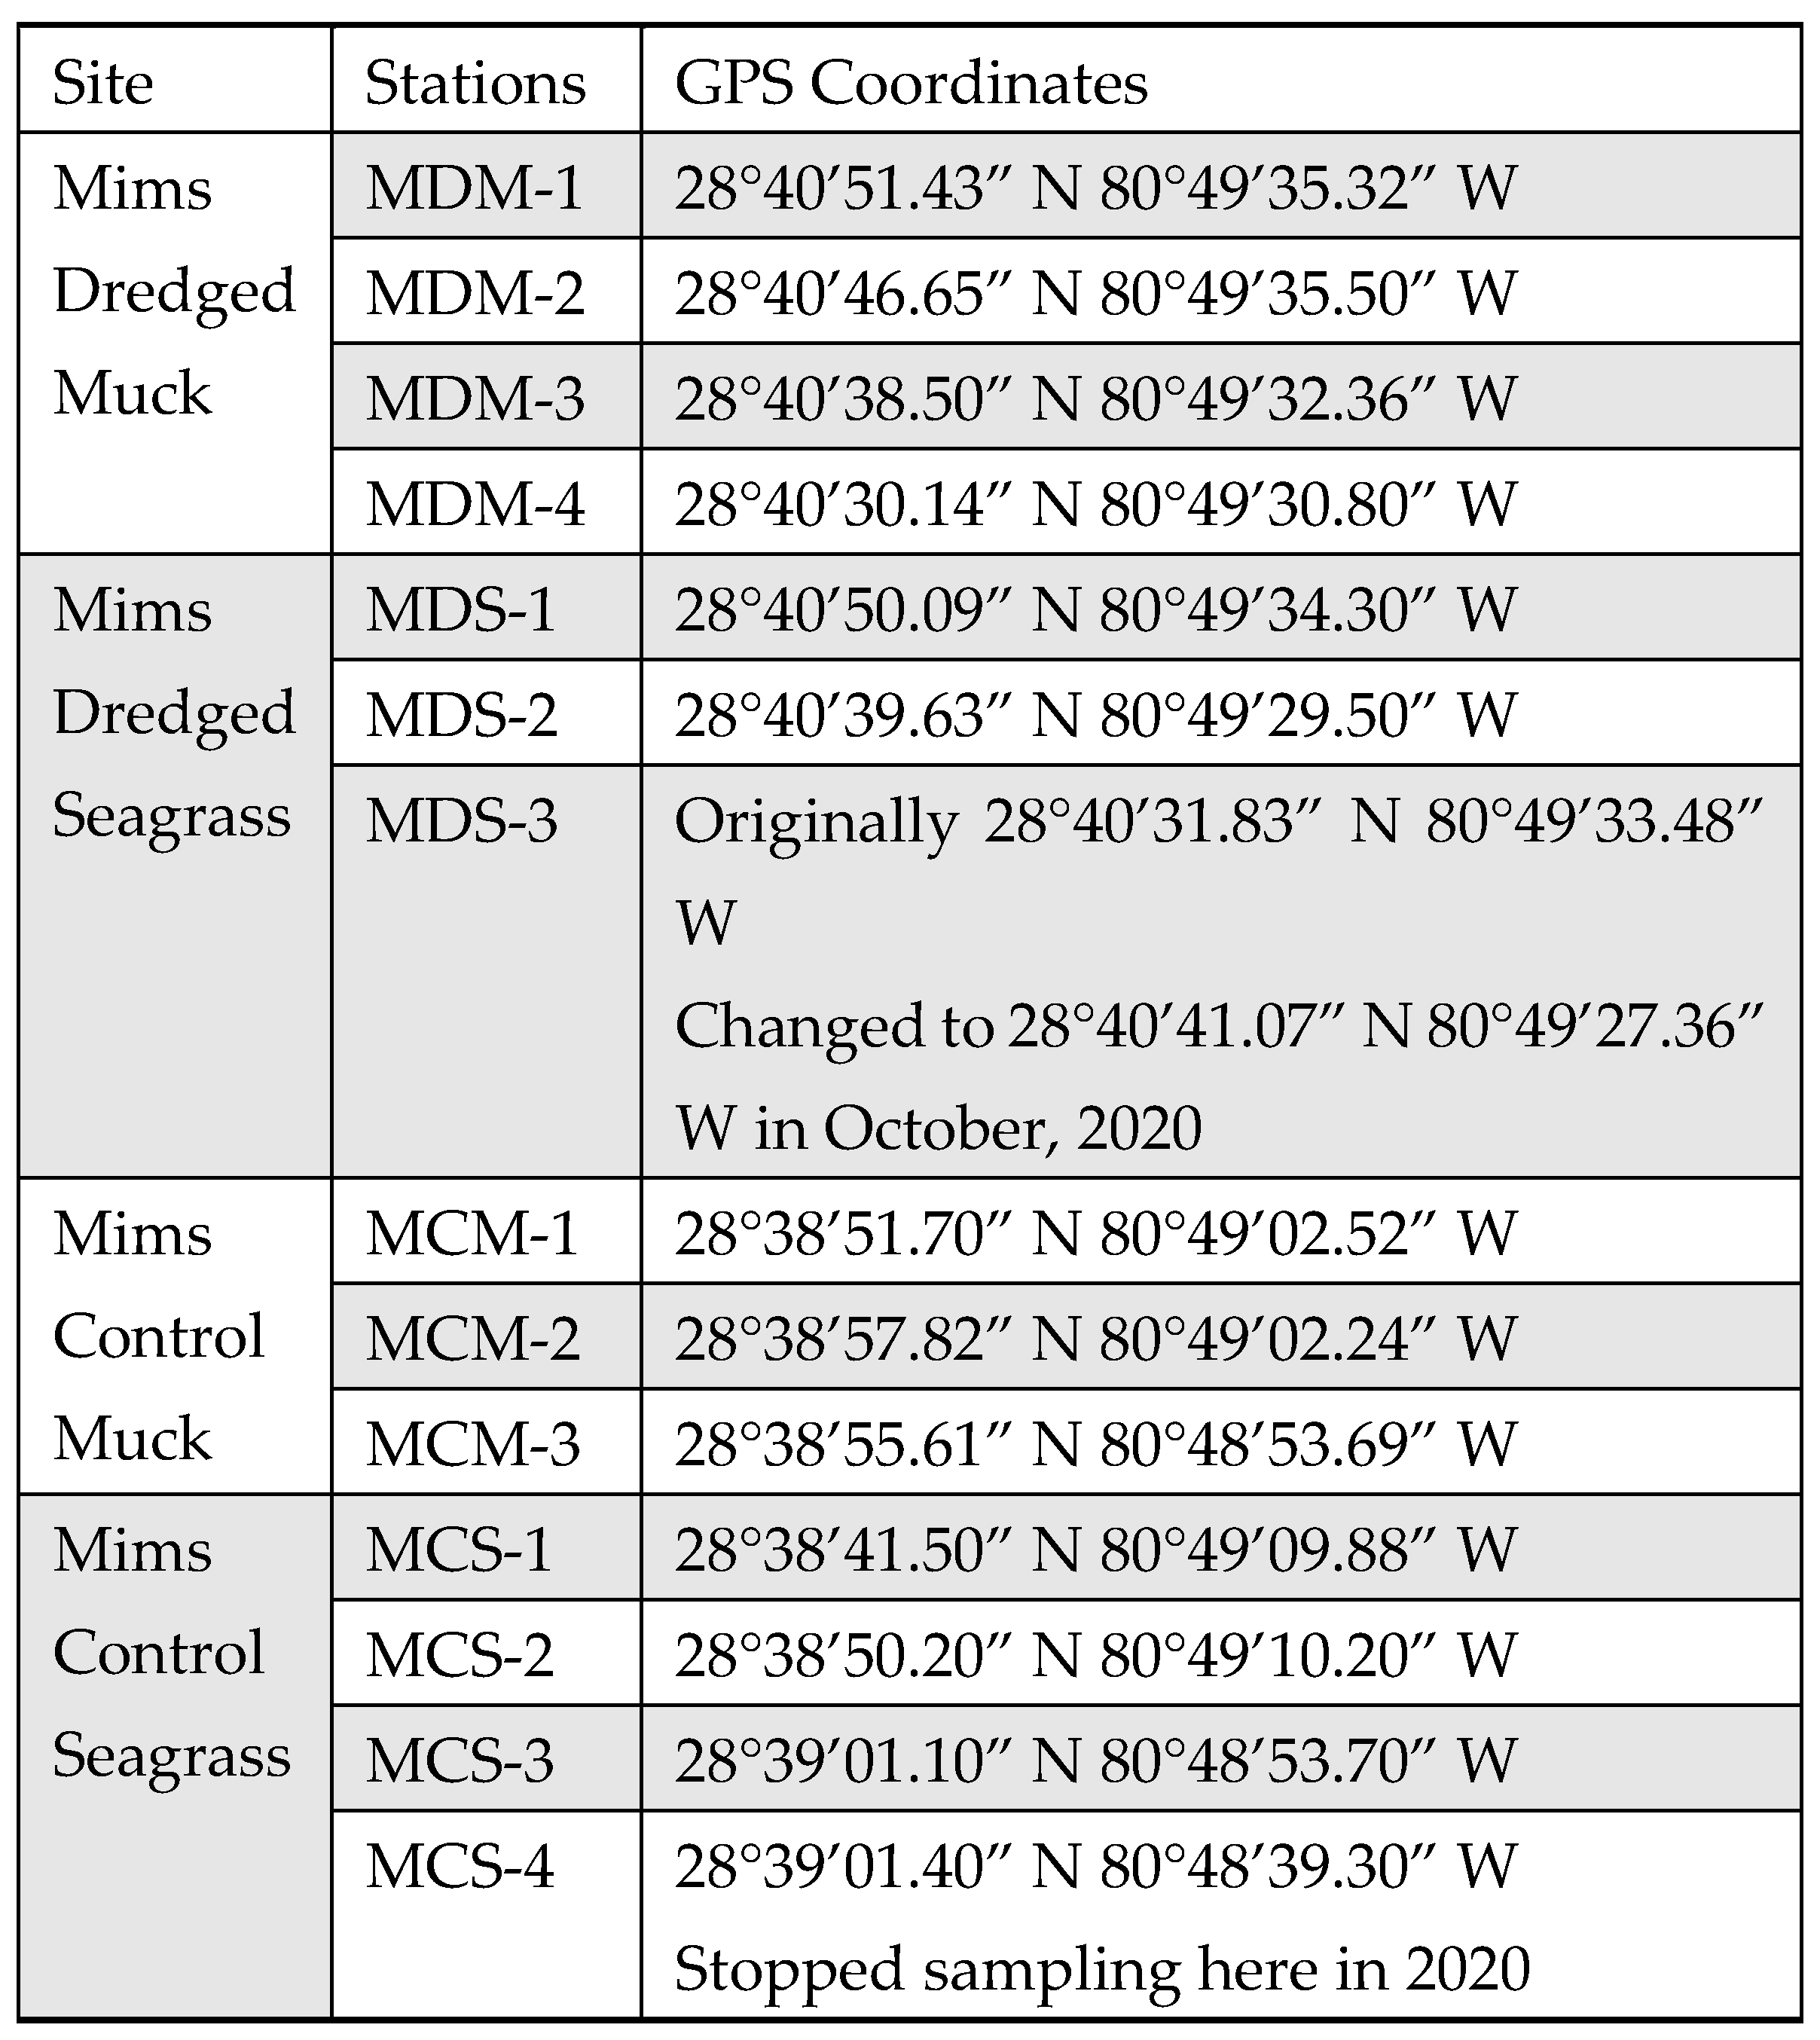
Appendix B

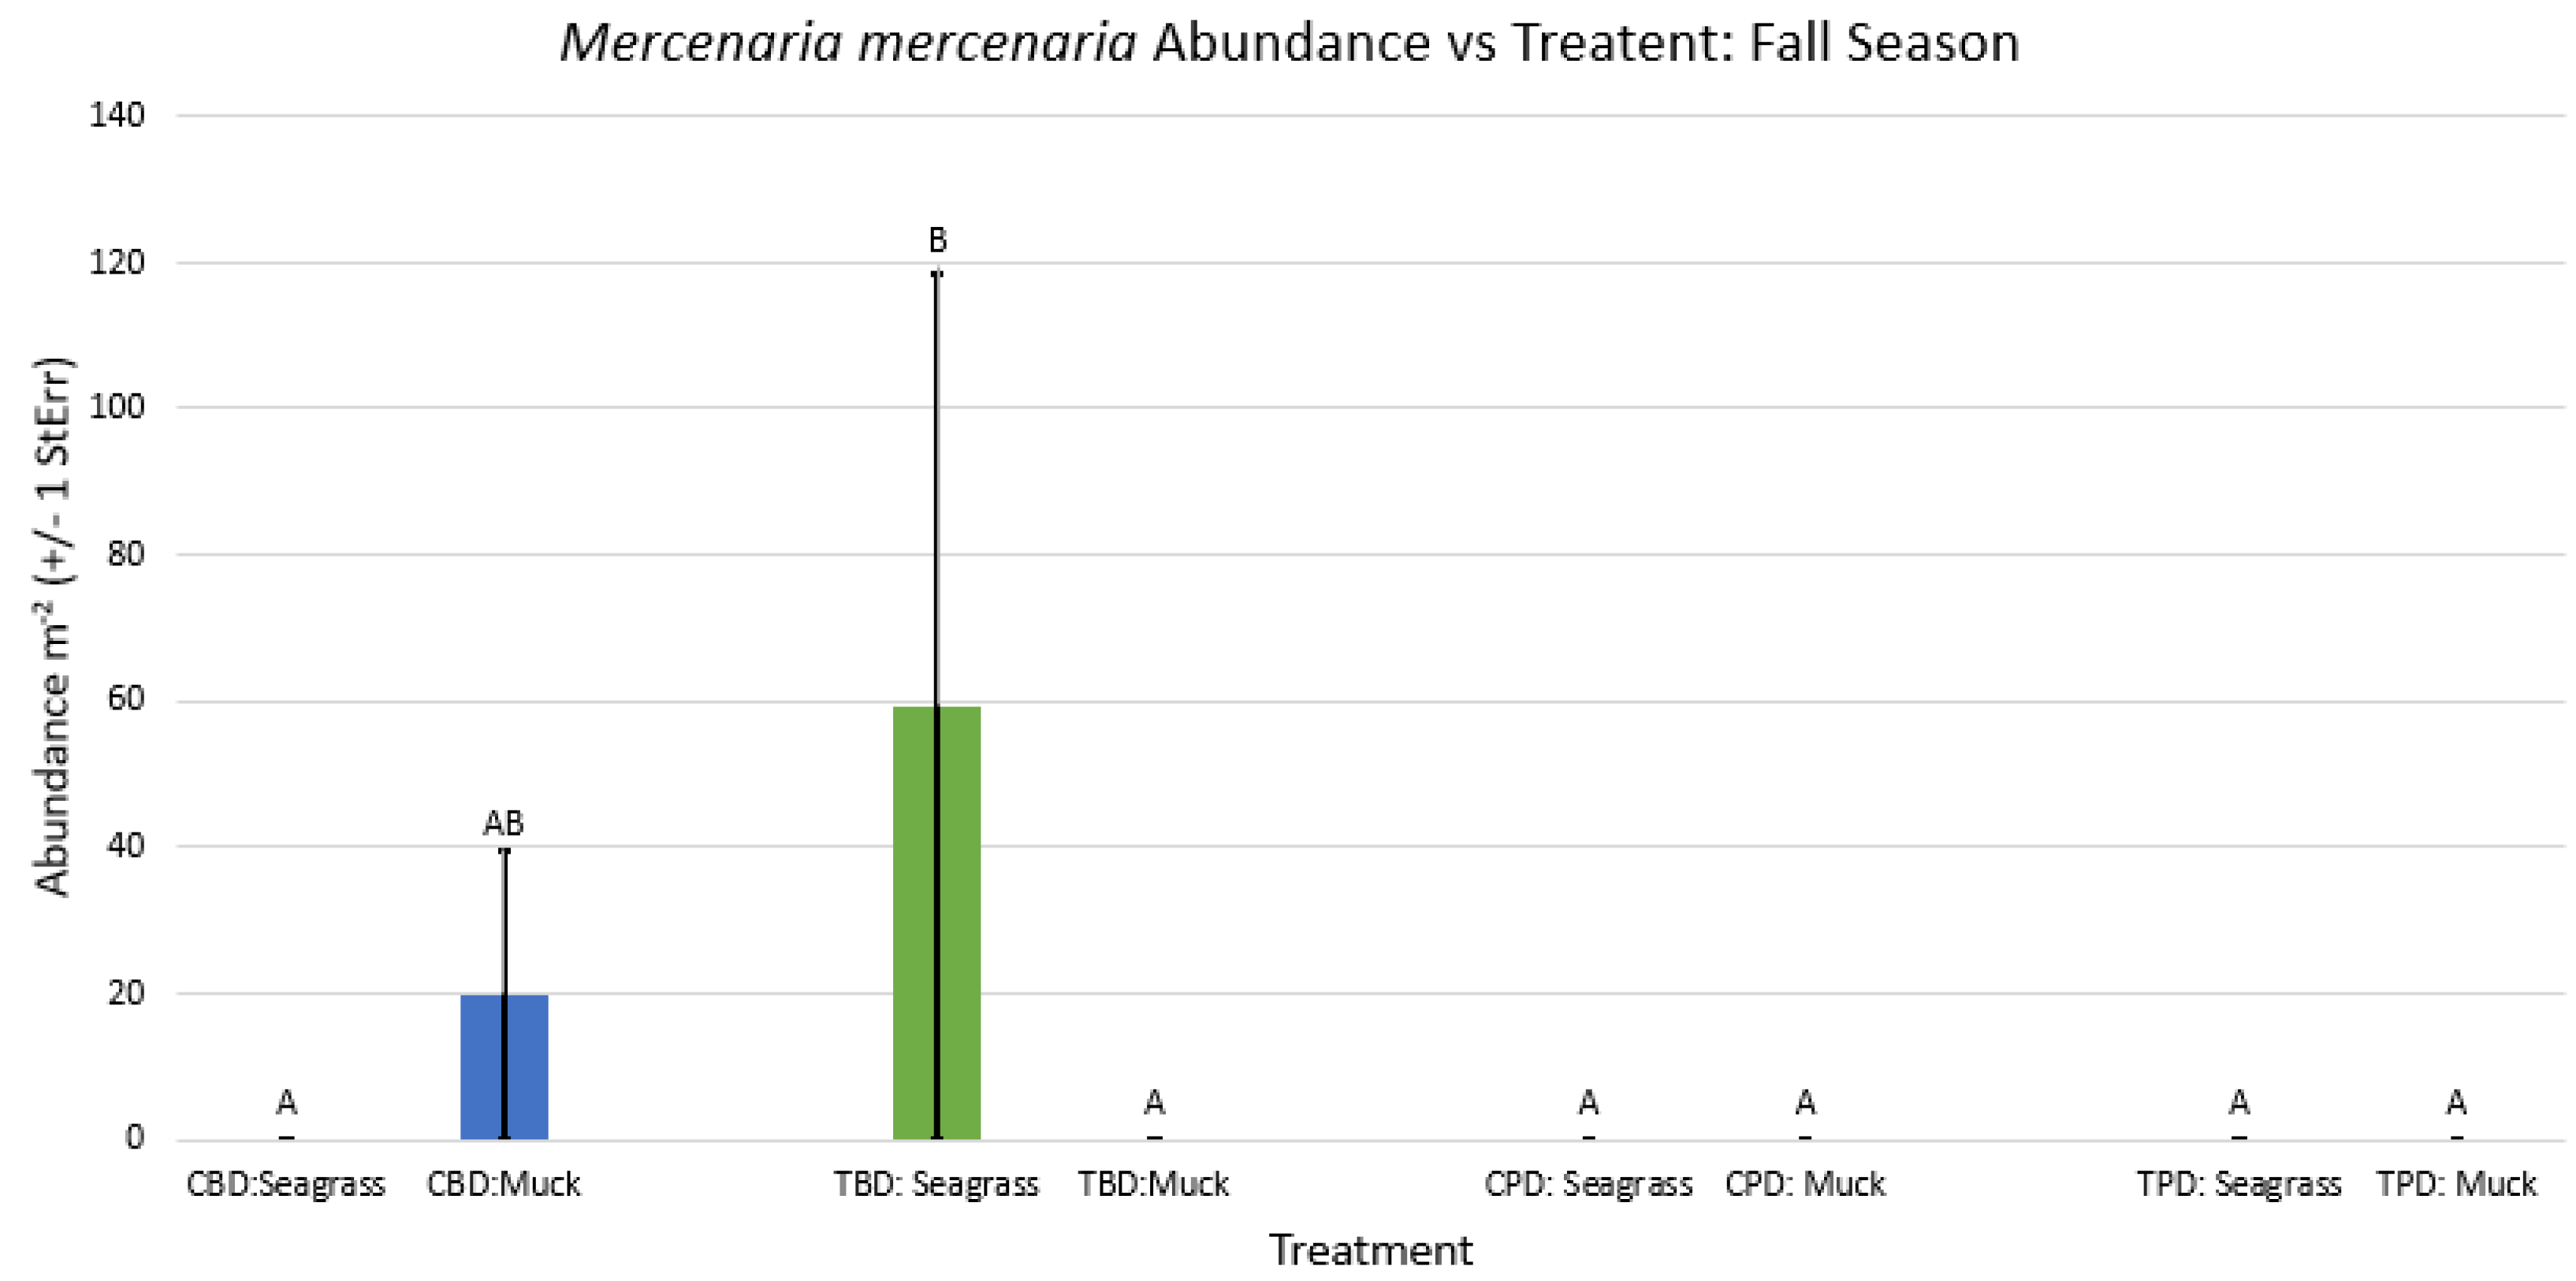
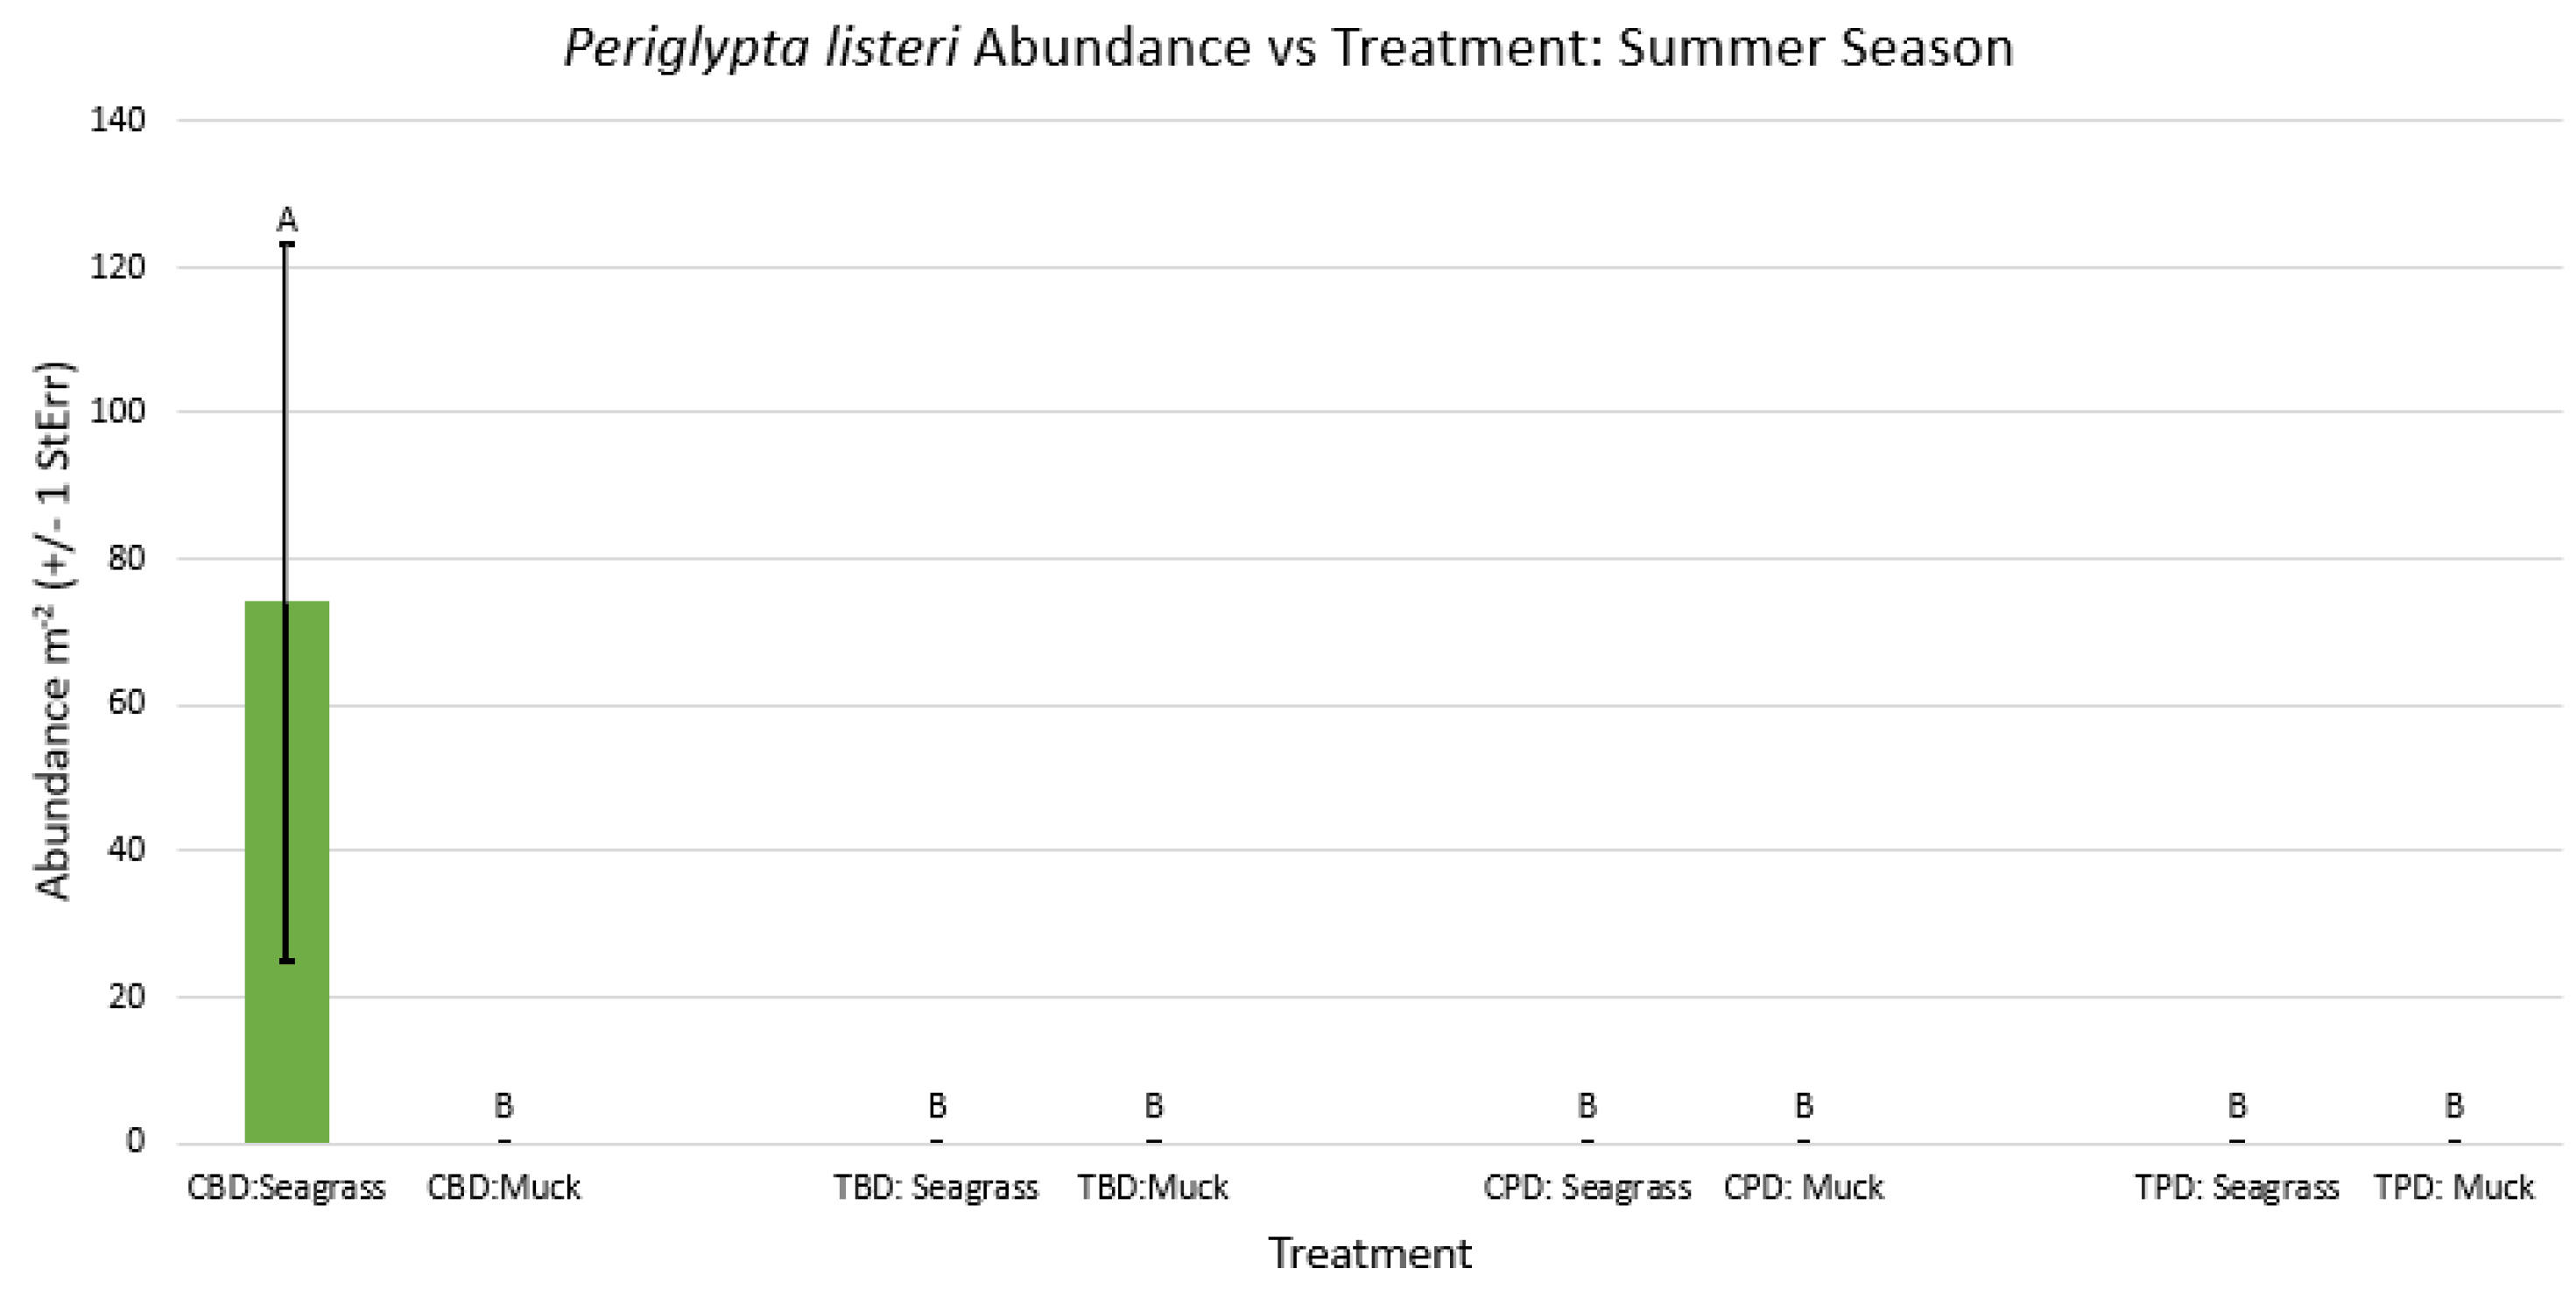
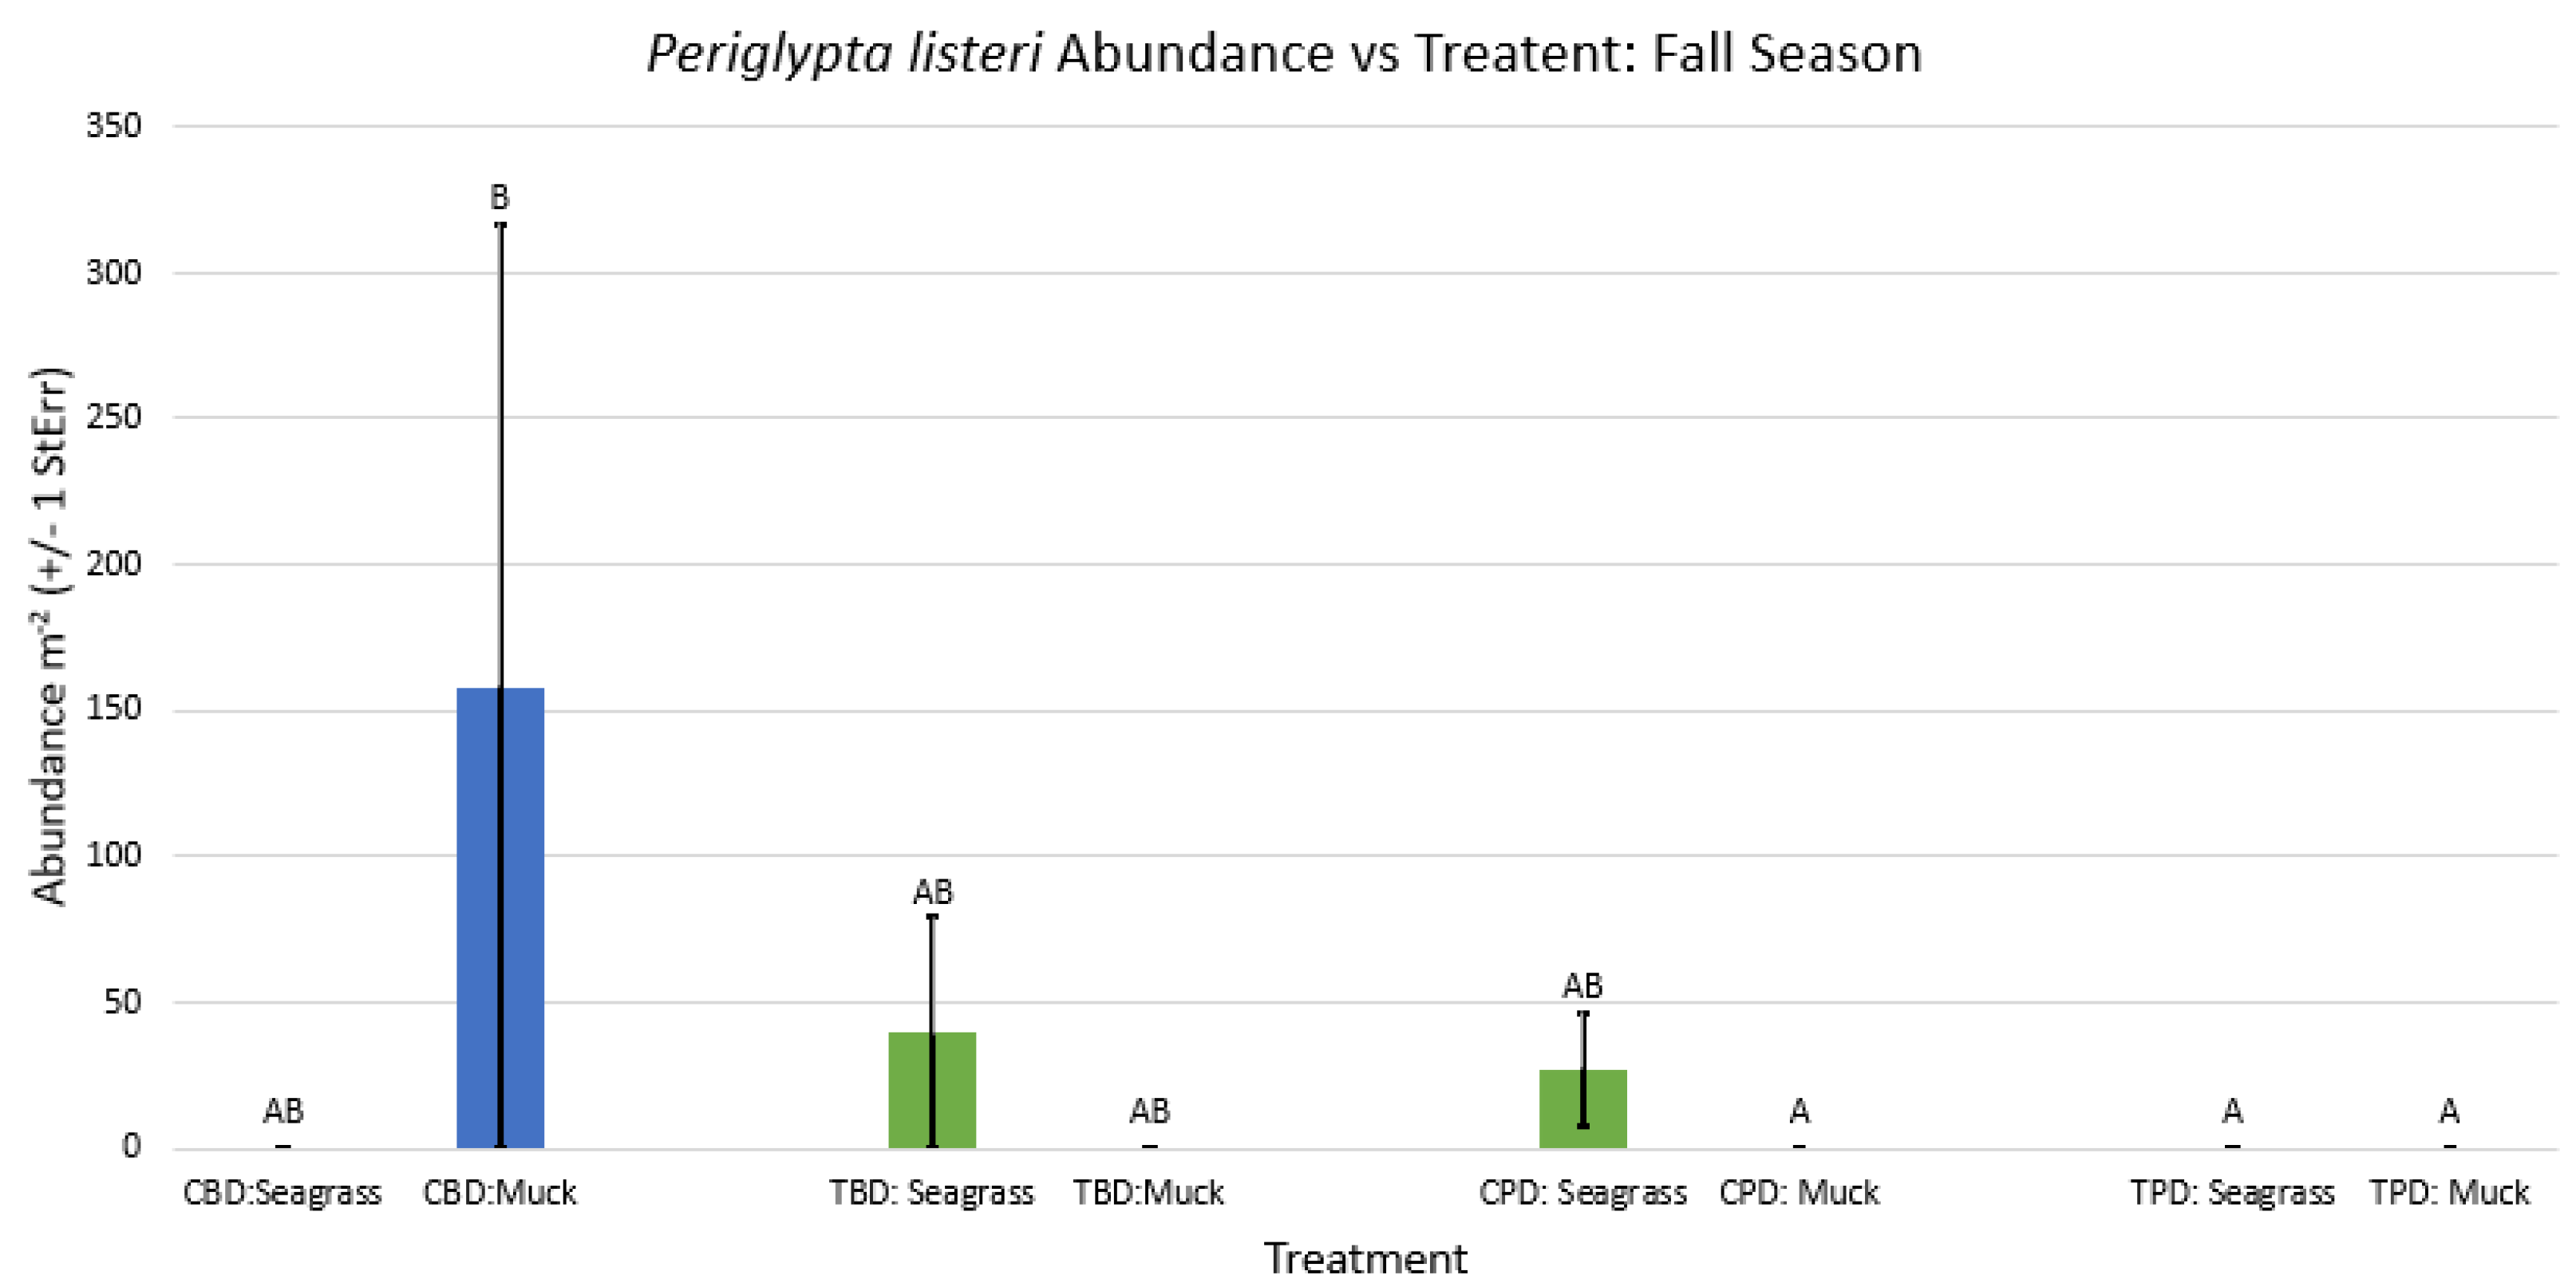
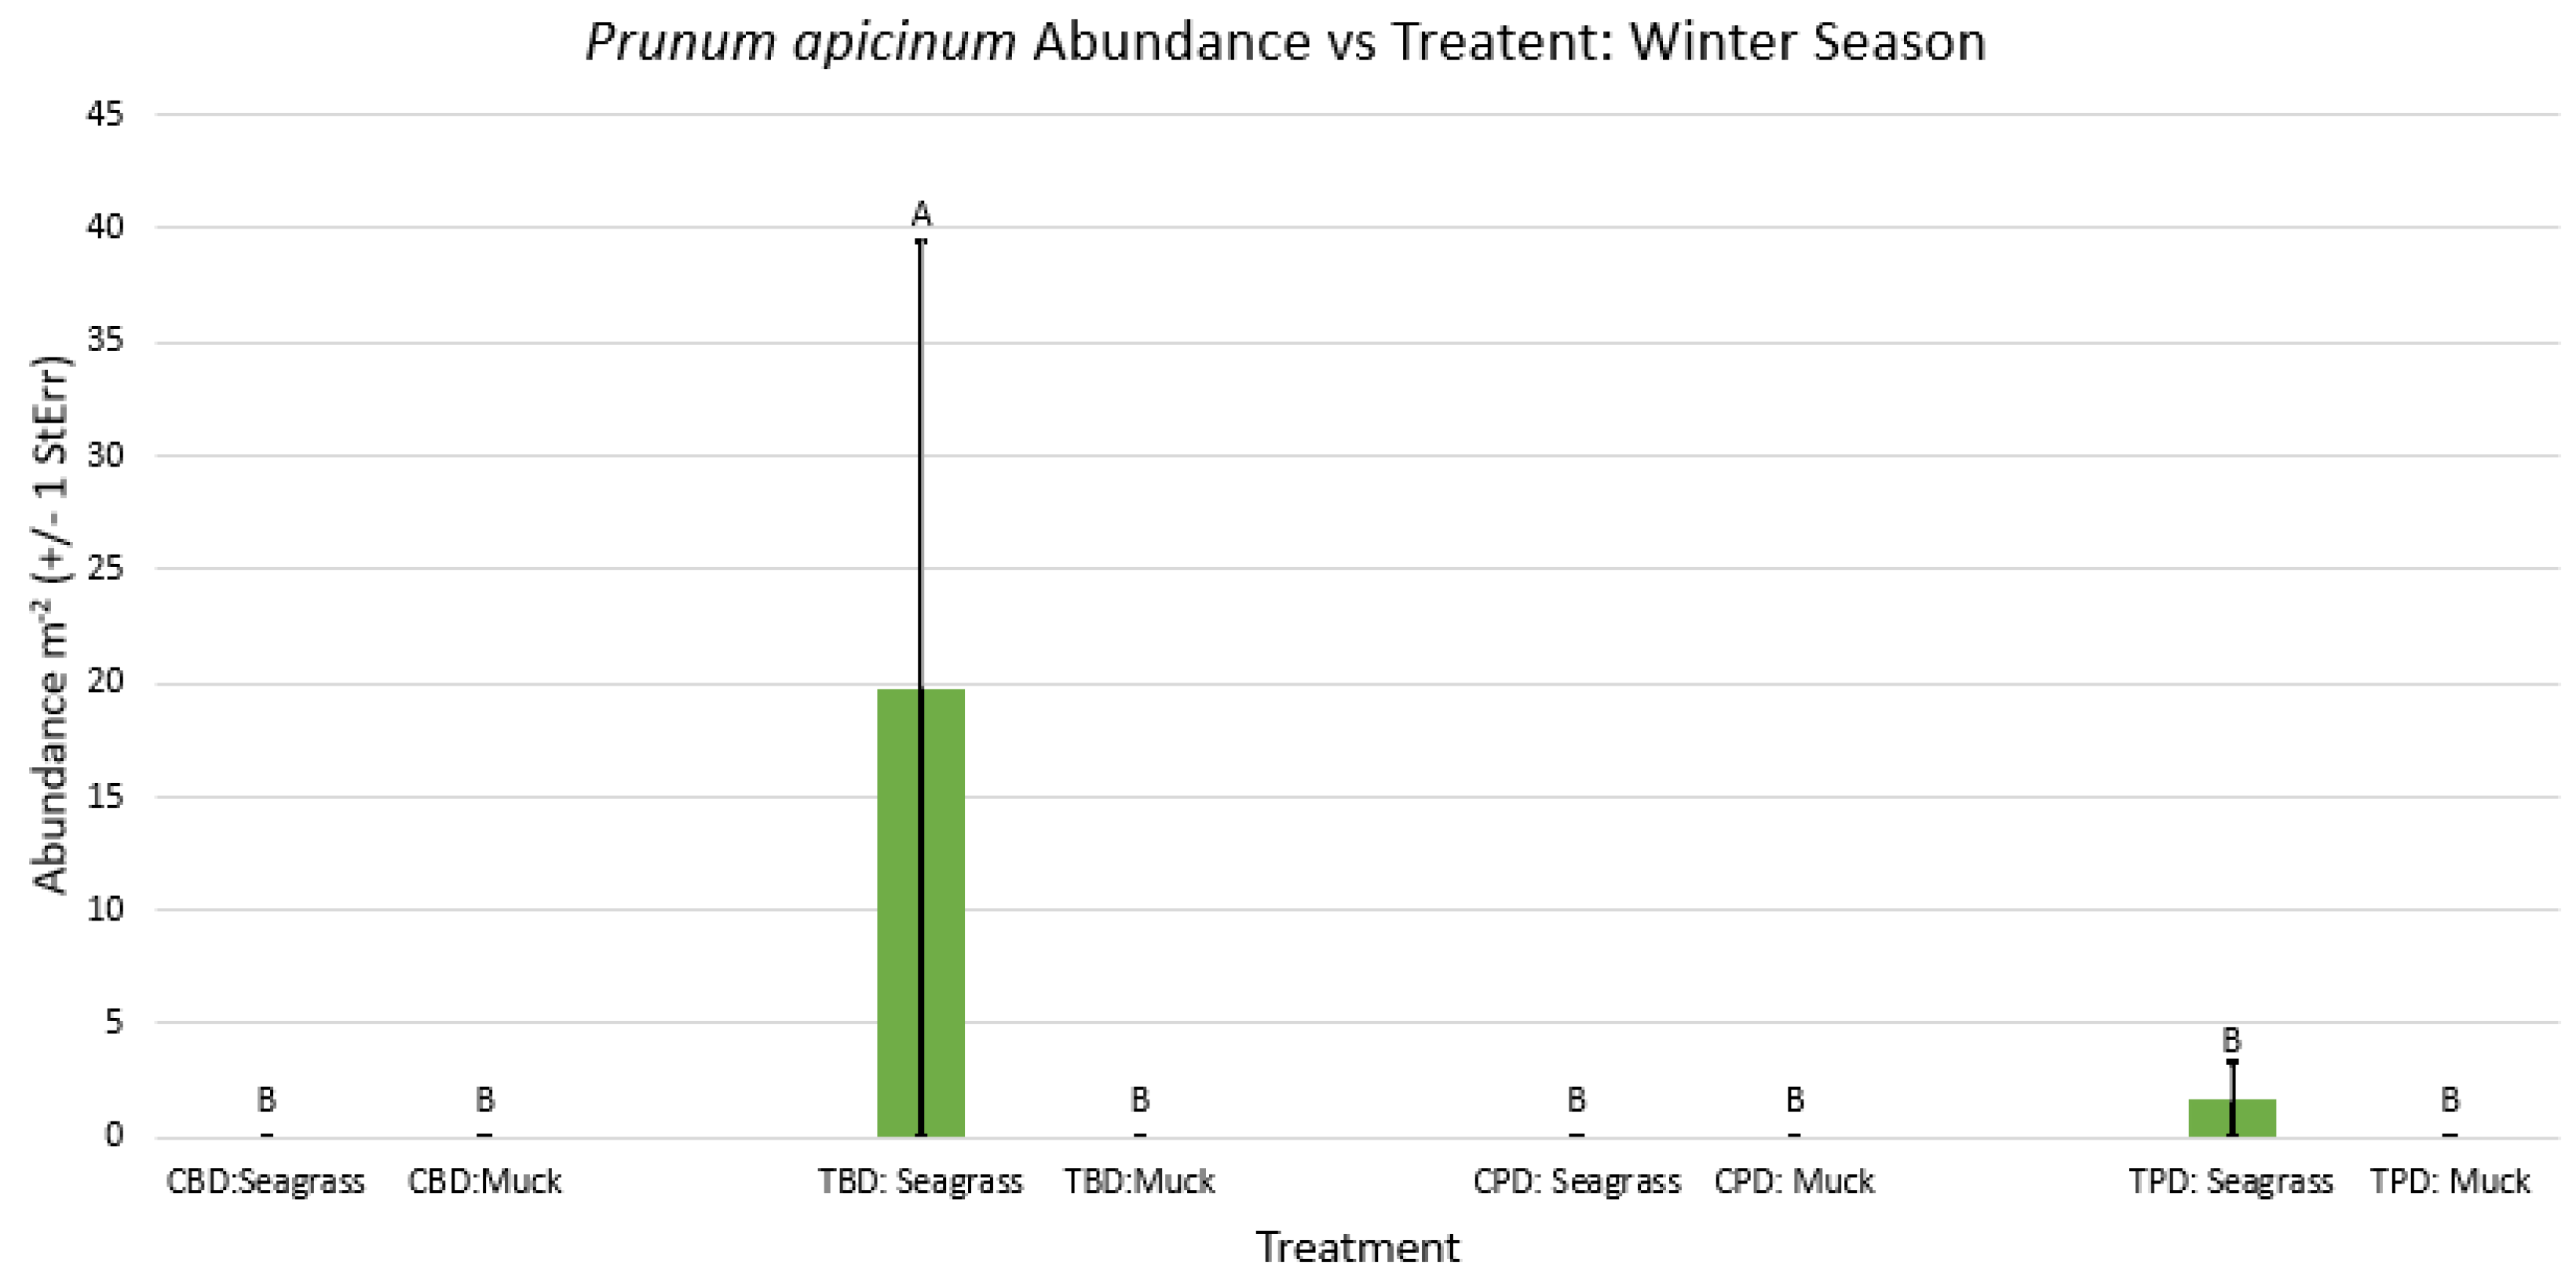



References
- Bricker, S. B., Longstaff, B., Dennison, W., Jones, A., Boicourt, K., Wicks, C., & Woerner, J. (2008). Effects of nutrient enrichment in the nation's estuaries: a decade of change. Harmful Algae, 8(1), 21-32. J. Mar. Sci. Eng. 2023, 11, 444. [CrossRef]
- Tremain, D. M., & Adams, D. H. (1995). Seasonal variations in species diversity, abundance, and composition of fish communities in the northern Indian River Lagoon, Florida. Bulletin of Marine Science, 57(1), 171-192.
- Dawes, C. J., Hanisak, D., & Kenworthy, J. W. (1995). Seagrass biodiversity in the Indian river lagoon. Bulletin of Marine Science, 57(1), 59-66.
- Barile, P. J. (2018). Widespread sewage pollution of the Indian River Lagoon system, Florida (USA) resolved by spatial analyses of macroalgal biogeochemistry. Marine pollution bulletin, 128, 557-574.
- Tetra Tech, Inc and Close Waters LLC. (2018). Save our lagoon project plan for Brevard County, Florida. Report to Brevard County Natural Resources Management Department.
- Fox, A. L., & Trefry, J. H. (2018). Environmental Dredging to Remove Fine Grained, Organic Rich Sediments and Reduce Inputs of Nitrogen and Phosphorus to a Subtropical Estuary. Marine Technology Society Journal, 52(4), 42-57.
- Bradshaw, D. J. , Dickens, N. J., Trefry, J. H., & McCarthy, P. J. (2020). Defining the sediment microbiome of the Indian River Lagoon, FL, USA, an Estuary of National Significance. bioRxiv.
- Erftemeijer, P. L. , & Lewis III, R. R. R. (2006). Environmental impacts of dredging on seagrasses: a review. Marine pollution bulletin, 52(12), 1553-1572.
- Donohue, I., & Garcia Molinos, J. (2009). Impacts of increased sediment loads on the ecology of lakes. Biological Reviews, 84(4), 517-531.
- Trefry, J. H., Trocine, R. P., & Woodall, D. W. (2007). Composition and sources of suspended matter in the Indian River Lagoon, Florida. Florida Scientist, 363-382.
- Nerlović, V., Doğan, A., & Hrs-Brenko, M. (2011). Response to oxygen deficiency (depletion): Bivalve assemblages as an indicator of ecosystem instability in the northern Adriatic Sea. Biologia, 66(6), 1114.
- Cox, A. , Hope, D., Angelica Zamora-Duran, M., & Johnson, K. B. (2018). Environmental Factors Influencing Benthic Polychaete Distributions in a Subtropical Lagoon. Marine Technology Society Journal, 52(4), 58-74.
- Mikkelsen, P. M., Mikkelsen, P. S., & Karlen, D. J. (1995). Molluscan biodiversity in the Indian River lagoon, Florida. Bulletin of Marine Science, 57(1), 94-127.
- Fedosov, A. E., & Puillandre, N. (2012). Phylogeny and taxonomy of the Kermia Pseudodaphnella (Mollusca: Gastropoda: Raphitomidae) genus complex: a remarkable radiation via diversification of larval development. Systematics and Biodiversity, 10(4), 447-477.
- Parkhaev, P. Y. (2017). Origin and the early evolution of the phylum Mollusca. Paleontological Journal, 51(6), 663-686.
- Coelho, J. P., Duarte, A. C., Pardal, M. A., & Pereira, M. E. (2014). Scrobicularia plana (Mollusca, Bivalvia) as a biomonitor for mercury contamination in Portuguese estuaries. Ecological indicators, 46, 447-453.
- Kim, Y. R., Lee, S., Kim, J., Kim, C. J., Choi, K. Y., & Chung, C. S. (2018). Thyasira tokunagai as an ecological indicator for the quality of sediment and benthic communities in the East Sea-Byeong, Korea. Marine pollution bulletin, 135, 873-879.
- Wu, H., Guan, Q., Lu, X., & Batzer, D. P. (2017). Snail (Mollusca: Gastropoda) assemblages as indicators of ecological condition in freshwater wetlands of Northeastern China. Ecological Indicators, 75, 203-209.
- McKeon, C. S., Tunberg, B. G., Johnston, C. A., & Barshis, D. J. (2015). Ecological drivers and habitat associations of estuarine bivalves. PeerJ, 3, e1348.
- Moraitis, M. L., Tsikopoulou, I., Geropoulos, A., Dimitriou, P. D., Papageorgiou, N., Giannoulaki, M., ... & Karakassis, I. (2018). Molluscan indicator species and their potential use in ecological status assessment using species distribution modeling. Marine environmental research, 140, 10-17.
- Johnson, K. B., Shenker, J. M., & Trefry, J. H. (2019, November). Muck Removal Efficiency plus Biological and Chemical Responses/Improvements after Dredging (Subtask 2).
- Bayne, B. L., & Newell, R. C. (1983). Physiological energetics of marine molluscs. In The mollusca (pp. 407-515). Academic Press.
- Fox, H. M., & Simmonds, B. G. (1933). Metabolic rates of aquatic arthropods from different habitats. Journal of Experimental Biology, 10(1), 67-74.
- Pamatmat, M. M. (1983). Measuring aerobic and anaerobic metabolism of benthic.
- infauna under natural conditions. Journal of Experimental Zoology, 228(3), 405-413.
- Salvato, B., Cuomo, V., Di Muro, P., & Beltramini, M. (2001). Effects of environmental parameters on the oxygen consumption of four marine invertebrates: a comparative factorial study. Marine Biology, 138(4), 659-668.
- Bayne, B. L. (Ed.). (1976). Marine mussels: their ecology and physiology (Vol. 10). Cambridge University Press.
- Theede, H., Ponat, A., Hiroki, K., & Schlieper, C. (1969). Studies on the resistance of marine bottom invertebrates to oxygen-deficiency and hydrogen sulphide. Marine Biology, 2(4), 325-337.
- Hope, D. C. (2016). The Tolerance of Benthic Infauna to Fine-Grained Organic Rich Sediments in a Shallow Subtropical Estuary (Doctoral dissertation).
- Pearson, T. H. (1980). Marine pollution effects of pulp and paper industry wastes. Helgoländer Meeresuntersuchungen, 33(1), 340.
- Rhoads, D. C. & Young, D. K., 1970. The influence of deposit feeding organisms on sediment stability and community trophic structure. - J. mar. Res. 28, 150-178.
- Folk, R. L. (1974). Petrology of sedimentary rocks: the University of Texas, Geology 370 K, 383 L, 383 M. Austin, TX: Hemphill.
- Sheridan, G. J., Noske, P. J., Whipp, R. K., & Wijesinghe, N. (2006). The effect of truck traffic and road water content on sediment delivery from unpaved forest roads. Hydrological Processes, 20(8), 1683–1699. [CrossRef]
- Dean Jr, W. E. (1974). Determination of carbonate and organic matter in calcareous sediments and sedimentary rocks by loss on ignition: comparison with other methods. Journal of Sedimentary Research, 44(1).
- Heiri, O. , Lotter, A. F., & Lemcke, G. (2001). Loss on ignition as a method for estimating organic and carbonate content in sediments: reproducibility and comparability of results. Journal of paleolimnology, 25(1), 101-110.
- Milliman, J. D. (1994). Organic matter content in US Atlantic continental slope sediments: decoupling the grain-size factor. Deep Sea Research Part II: Topical Studies in Oceanography, 41(4-6), 797-808.
- Hedges, J. I. , & Keil, R. G. (1995). Sedimentary organic matter preservation: an assessment and speculative synthesis. Marine chemistry, 49(2), 81-115.
- Wang, F. , & Chapman, P. M. (1999). Biological implications of sulfide in sediment—a review focusing on sediment toxicity. Environmental Toxicology and Chemistry, 18(11), 2526-2532.
- Mermillod-Blondin, F. , Rosenberg, R., François-Carcaillet, F., Norling, K., & Mauclaire, L. (2004). Influence of bioturbation by three benthic infaunal species on microbial communities and biogeochemical processes in marine sediment. Aquatic Microbial Ecology, 36(3), 271-284.
- Giblin, A. E. , Hopkinson, C. S., & Tucker, J. (1997). Benthic metabolism and nutrient cycling in Boston Harbor, Massachusetts. Estuaries, 20(2), 346- 364.
- Aller, R. C. (1994). Bioturbation and remineralization of sedimentary organic matter: effects of redox oscillation. Chemical Geology, 114(3), 331-345.
- Gray, J. S. (1982). Effects of pollutants on marine ecosystems. Netherlands Journal of Sea Research, 16, 424-443.
- Pearson, T. H., & Rosenberg, R. (1978). Macrobenthic succession in relation to organic enrichment and pollution of the marine environment. Oceanogr. Mar. Biol. Ann. Rev, 16, 229-311.
- Kodama, K., Lee, J. H., Oyama, M., Shiraishi, H., & Horiguchi, T. (2012). Disturbance of benthic macrofauna in relation to hypoxia and organic enrichment in a eutrophic coastal bay. Marine environmental research, 76, 80-89.
- Hyland, J., Balthis, L., Karakassis, I., Magni, P., Petrov, A., Shine, J., & Warwick, R. (2005). Organic carbon content of sediments as an indicator of stress in the marine benthos. Marine Ecology Progress Series, 295, 91-103.
- Magni, P. , Tagliapietra, D., Lardicci, C., Balthis, L., Castelli, A., Como, S., & Pessa, G. (2009). Animal-sediment relationships: Evaluating the ‘Pearson– Rosenberg paradigm in Mediterranean coastal lagoons. Marine Pollution Bulletin, 58(4), 478-486.
- Puente, A. , & Diaz, R. J. (2015). Response of benthos to ocean outfall discharges: does a general pattern exist?. Marine pollution bulletin, 101(1), 174-181.
- Gray, J. S., Wu, R. S. S., & Or, Y. Y. (2002). Effects of hypoxia and organic enrichment on the coastal marine environment. Marine Ecology Progress Series, 238, 249-279.
- Diaz, R. J. , & Rosenberg, R. (1995). Marine benthic hypoxia: a review of its ecological effects and the behavioural responses of benthic macrofauna. Oceanography and marine biology. An annual review, 33, 245-03.
- Viaroli, P. , Bartoli, M., Giordani, G., Naldi, M., Orfanidis, S., & Zaldivar, J. M. (2008). Community shifts, alternative stable states, biogeochemical controls and feedbacks in eutrophic coastal lagoons: a brief overview. Aquatic Conservation: Marine and Freshwater Ecosystems, 18(S1), S105-S117.
- Glassom, D. (1992). Predation/disturbance effects of greater flamingos (Phoenicopterus ruber) on the benthic communities of two Southern African lagoons (Master's thesis, University of Cape Town).
- Thistle, D. (1981). Natural physical disturbances and communities of marine soft bottoms. Marine Ecology Progress Series, 6(2), 223-228.
- Virnstein, R. W. (1977). The importance of predation by crabs and fishes on benthic infauna in Chesapeake Bay. Ecology, 58(6), 1199-1217.
- Virnstein, R. W. (1978). Predator caging experiments in soft sediments: caution advised. Estuarine interactions, 261-273.
- Quammen, M. L. (1984). Predation by shorebirds, fish, and crabs on invertebrates in intertidal mudflats: an experimental test. Ecology, 65(2), 529-537.
- Peterson, C. H. (1979). Predation, competitive exclusion, and diversity in the soft sediment benthic communities of estuaries and lagoons. In Ecological processes in coastal and marine systems (pp. 233-264). Springer, Boston, MA.
- Probert, P. K. (1984). Disturbance, sediment stability, and trophic structure of soft-bottom communities. Journal of Marine research, 42(4), 893-921.
- Chardy, P., & Clavier, J. (1988). Biomass and trophic structure of the macrobenthos in the south west lagoon of New Caledonia. Marine Biology, 99(2), 195-202.
- Woodin, S. A. (1999). Shallow water benthic ecology: a North American perspective of sedimentary habitats. Australian Journal of Ecology, 24(4), 291-301.
- Pelletiera, M. C., Goldb, A. J., Heltshec, J. F., & Buffumd, H. W. (2010). A method to identify estuarine macroinvertebrate pollution indicator species in the Virginian Biogeographic Province. Ecological Indicators, 10, 1037-1048.
- Engle, V. D., Summers, J. K., & Gaston, G. R. (1994). A benthic index of environmental condition of Gulf of Mexico estuaries. Estuaries, 17(2), 372-384.
- Dauvin, J. C. (2007). Paradox of estuarine quality: Benthic indicators and indices, consensus or debate for the future. Marine Pollution Bulletin, 55, 271-281.
- Borjaa, A. , Dauerb, D., Dıazc, R., Llansód, R. J., Muxikaa, I., Rodrıgueza, J. G., & Schaffnerc, L. (2007). Assessing estuarine benthic quality conditions in Chesapeake Bay: A comparison of three indices.
- Patmont, C., LaRosa, P., Narayanan, R., & Forrest, C. (2018). Environmental dredging residual generation and management. Integrated Environmental Assessment and Management, 14(3), 335-343.
- Bridges, T. S., Gustavson, K. E., Schroeder, P., Ells, S. J., Hayes, D., Nadeau, S. C., ... & Patmont, C. (2010). Dredging processes and remedy effectiveness: Relationship to the 4 Rs of environmental dredging. Integrated Environmental Assessment and Management, 6(4), 619-630.
- Bridges, T. S., Ells, S. J., Hayes, D. F., Mount, D., Nadeau, S. C., Palermo, M. R., ... & Schroeder, P. R. (2008). The four R's of environmental dredging: resuspension, release, residual and risk.
- Palermo, M. R., Schroeder, P. R., Estes, T. J., & Francingues, N. R. (2008). Technical guidelines for environmental dredging of contaminated sediments (No. ERDC/EL TR-08-29). Cold Regions Research and Engineering Laboratory (US).
Disclaimer/Publisher’s Note: The statements, opinions and data contained in all publications are solely those of the individual author(s) and contributor(s) and not of MDPI and/or the editor(s). MDPI and/or the editor(s) disclaim responsibility for any injury to people or property resulting from any ideas, methods, instructions or products referred to in the content. |
© 2024 by the authors. Licensee MDPI, Basel, Switzerland. This article is an open access article distributed under the terms and conditions of the Creative Commons Attribution (CC BY) license (http://creativecommons.org/licenses/by/4.0/).


