Preprint
Article

Interactomic Analyses and a Reverse Engineering Study Identify Specific Functional Activities of One-to-One Interactions of the S1 Subunit of the SARS-CoV-2 Spike Protein with the Human Proteome

Altmetrics

Downloads

103

Views

131

Comments

0

A peer-reviewed article of this preprint also exists.

This version is not peer-reviewed

Submitted:

03 October 2024

Posted:

05 October 2024

You are already at the latest version

Alerts
Abstract

The S1 subunit of SARS-CoV-2 Spike has been found in the blood of covid patients and vaccinated individuals. From BioGRID, we selected 146 significant human proteins experimentally interacting with S1. Then, we derived an interactome model that facilitated the study of functional activities. Through a reverse engineering approach, we identified 27 specific one-to-one interac-tions of S1 with the human proteome. S1 interacts in this manner independently from the biological context in which it operates, be it infection or vaccination. Instead, when it works together with viral proteins, carry multiple attacks on single human proteins out, showing a different functional engagement. Through Cytoscape we showed functional implications and its tropism to human organs/tissues, such as nervous system, liver, blood, and lungs. As a single protein, S1 operates in a complex metabolic landscape which includes 2557 GO biological processes, much more than the 1430 terms controlled when operating in a group. A Data-Merging approach shows that the total proteins involved by S1 in the cell are over 60,000 with an average involvement per single bio-logical process of 26.19. However, many human proteins get entangled in over 100 biological different activities each. Clustering analysis showed statistically significant activations of many molecular mechanisms, like those related to hepatitis-B infections. This suggests potential in-volvement in carcinogenesis, based on a viral strategy that uses the ubiquitin system to impair the tumor suppressor and antiviral functions of TP53, as well as the role of RPS27A in protein turnover and cellular stress responses.

Keywords: 
Subject: Medicine and Pharmacology  -   Epidemiology and Infectious Diseases

1. Introduction

Understanding COVID-19, like any emerging infectious disease, is an ongoing endeavor. COVID-19 is a systemic disease with many pathological implications but still with limited explanations [1,2]. The limited knowledge base on this disease also makes it difficult to gain a complete and systematic understanding of the clinical picture, especially because of the poor understanding of its molecular processes. This has led many clinicians to treat the disease with a similar logic to other viral diseases, stopping at the lab data and curing symptomatic effects [3]. In particular, the long phase of the disease, referred to as the “long Covid” (PCS, post-COVID-19 state), refers to a condition in which a patient presents with a variety of symptoms for months after an initial infection [5]. Although four years have now passed since the most acute phase of the pandemic, studies on the clinical syndrome of long Covid are still ongoing to define its characteristics more precisely.
This condition has a very complex and diverse symptomatology that is often treated with medications from other diseases that also show positive effects in this syndrome. PCS shows many disturbing effects, including the so-called "brain fog", immune dysregulation, headaches, fatigue [5]. These symptoms can disable and reduce quality of life, but the cause of PCS remains obscure and controversial. These events suggest that there is a lack of in-depth knowledge about the molecular processes underlying viral action. Researchers conduct controlled and randomized clinical trials, but they often neglect in-depth metabolic research. Therefore, because we don't know the molecular processes, we test many drugs based on symptoms [6].
An interesting viral object that we know little about is the S1 subunit of the S protein of SARS-CoV-2 (from now on S1). S1 not only plays a key role in binding Spike to ACE2 but also performs other activities as it has been found in the body [7] and is referred to as a “spikeopathy” [8]. The binding role is the best known, even in structural details, but S1 is involved both in the vaccine's action and during infection and there are many concerns. Ribosomes produce S1 during both infection and vaccination, even if the S1 mRNA is chemically modified, which increases its ribosomal frameshifting, the protein produced remains S1 with its immunogenic characteristics [9]. While with the vaccine it acts alone by interacting with human proteins, in the infection it attacks human proteins also together with other viral proteins [10,11]. However, there are also cases where it attacks specific human proteins with a one-to-one interaction [10]. This suggests that in these solitary activities, it appears to be in conditions like those of the vaccine. We know very little, if anything, about these activities of S1 outside of its role in ACE2. Even if we do not yet know who the vaccine interacts with, we can know who it attacks based on the molecular interactions studied experimentally.
Protein-protein interaction (PPI) experiments, such as those reported in BioGRID, offer unique, and valuable insights into potential physical interactions. However, it is crucial to confirm these interactions in complex metabolic contexts to find out their functional importance. Some considerations, such as differences in cellular context, post-translational modifications, and other viral proteins during infection, represent variables that may influence these interactions. There are other considerations that limit these reservations. The first is that S1 has many sites for PTM modifications, K, T, S and Y, scattered throughout the structure [12].
This means, considering that cell enzymes can also modify many residues together, that the number of proteoforms is so large that we can assume to be similar both in the vaccine and during Covid. Therefore, we can assume similar probabilities for both events, not being able to distinguish a characteristic outcome of vaccination or infection, since all conformations and proteoforms have the same probability of concrete and definable existence. The second consideration concerns the enzymes responsible for PTMs (such as kinases, acetyltransferases, etc.) which are present and active everywhere both during the vaccination response and during the infection. This implies that the wide range of proteoforms of the S1 protein may indeed be similar in both contexts. We also consider that BioGRID collects only physical interactions tested by cellular systems, therefore by active cells. This makes the data relevant for understanding interactions in a physiological context. Infection can alter the activity of many cell types, but not all. Cells that are positioned far away from the infection site in the organism have not been infected. Therefore, if we consider that the PTMs and protein interactions observed via BioGRID reflect a wide range of physiological conditions, we can assume that the one-to-one interactions of the S1 protein will be similar both in vaccination and during infection. The BioGRID data’s robustness, acquired from various cell systems and under realistic conditions, shows that we can treat the one-to-one interactions of the S1 protein as similar in both scenarios.
However, we should also consider other aspects of this disease. mRNA vaccines have been crucial during Covid-19 and have saved millions of lives. Unfortunately, we have some adverse post-vaccination effects that raise concerns about a direct pro-inflammatory effect of the vaccine [13]. Possible reasons include unique expression patterns and/or antigen effects in tissues or organs. A theory suggests that the S protein itself may play a role in the side effects of the vaccine. This hypothesis is based on the observation that the S protein can interact with various human cells and tissues, causing damage. These events have led many to study S1. The protein contains epitopes that the human immune system can recognize. Since the first injection and even after months, we can detect significant concentrations of the circulating S1 subunit, with blood levels of up to 150 pg/mL [14]. This amount corresponds to a concentration of 1.5 pM, which is much lower than the Kd value of the S1-ACE2 complex (120 nM), suggesting the predominant presence of the complex alone in the blood and not justifying such high concentrations of free S1. Circulating S1 in concentrations of ng/mL was also detected in Covid patients [15,16,17].
This shows that S1 concentrations are similar after vaccination and infection. It is difficult to establish a link between the symptoms observed in these individuals and the levels of S1 in the blood, regardless of whether they are vaccinated or infected. This is because the symptoms arise from profound metabolic activities of the protein (at the nanoscopic level). Therefore, placing the viral infection within the framework of existing pathologies becomes difficult because the symptoms and blood concentrations of metabolic compounds do not show a linear correlation with the actual molecular mechanisms induced by S1. This is because biological entities are nonlinear scaling systems, meaning that molecular results will not allow us to get the desired effect (or explanation) on a macroscopic scale of interest. To understand the profound metabolic organization of a disease and the molecular mechanisms that promote its progression, we need to know the constraints and laws that biological networks follow. Networks are vital tools for comprehending biological organizations at the nanoscopic level because they fit the architecture of human metabolism on different levels. In the network's representation, proteins play perhaps the most important role and among them those with the highest rank emerge, capable of interacting with and controlling hundreds of proteins and genes. These activities occur through a unique molecular mechanism, the interaction (functional and/or physical). To enable coherent and synchronous co-expression of the transcriptome, it is also necessary to calibrate the amounts of the proteins involved. Graph theory provides direct molecular information on associating the network with biological functions through a topological representation of network models.
We believe that understanding these aspects is possible by using relevant protein biosignatures as seeds for constructing protein-protein interactions (PPIs). The interactions are the crucial step in our analysis. They cannot be estimated indirectly but must be detected using the experimental methods of biophysics and/or biochemistry. Otherwise, the probability that we have reliable functional information and on which molecular mechanisms they are based decreases, so reducing the predictive power of the interactomic models. PPIs are important for deciphering profound molecular mechanisms under normal or pathological conditions. Therefore, it is necessary to rely on curated databases with a high percentage of well-established binary relationships. We have used BioGRID and STRING, two reliable public databases. They have undergone extensive integration, including the curation of thousands of journal articles, creating controlled vocabularies (ontologies) to describe PPI experiments, and defining standard formats for PPI data. They have introduced quality control measures by curation, methods for evaluating interactions and approaches for linking interactions to context. The database BioGRID boasts one of the best average coverages (≈ 70%) of binary relationships, whereas about 79% of those in STRING have also experimental verifications.
The aim of this study is to differentiate the molecular effects of the S1 subunit in the human host when it acts together with other viral proteins and when it acts alone. We emphasize again that experimental methods are necessary to gain certainty about the interactions. Otherwise, the predictive power of interactomic models is reduced because of a concrete reduction in the probability of having true functional information and the molecular mechanisms on which it is based. To achieve this result, we applied a biological reverse engineering protocol. Reverse engineering is based on the direct validation of the biological message exchanged between two nodes of the net by validating it with external data. This involves deriving from an external reference model of the real biological relationships that exist between the nodes of the network without a priori knowledge of the computational protocols [18,19]. So, we can analyse accurate mapping and prediction of protein interactions that contribute to disease pathology by exploiting protein-protein interaction networks (PPINs). This approach can provide valuable insights into the molecular mechanisms underlying S1 action by mitigating low-resolution processes targeting this protein through a more systematic understanding of the complex regulatory networks in which it takes part [20,21]. However, this approach requires experimental validation of the interactions to explain the molecular mechanisms underlying S1 actions. The results show the extreme functional complexity of the metabolic landscape in which S1 operates and how influential knowledge gaps and information biases become when we must evaluate where, when and to what extent certain functional events should occur.

2. Materials and Methods

2.1. BioGRID

BioGRID (https://thebiogrid.org/) is an important biomedical database that collects curated protein and genetic interactions, only from experimental studies and living cells [22]. Therefore, it represents a fundamental and unique resource for obtaining data on certified functional interactions in biological contexts. Through a specific Project (BioGRID COVID-19 Coronavirus Curation Project), BioGRID maintains complete and continuous coverage of protein interaction data between human proteins and all SARS-CoV-2 proteins. The Project is still active (https://thebiogrid.org/project/3) and provides comprehensive datasets of curated direct interactions for the viral proteins encoded by SARS-CoV-2.
The dataset encompasses all experimental interactions between viral proteins and host cell proteins, as well as post-translational modifications (PTMs). We accessed the area SARS-CoV-2 Protein Interactions on 2 June 2024. In this area, we found all curated interactions between the virus and human proteome in 32 subgroups (the sub-group for ORF1a protein is void) for about 41,683 interactions with 25,620 unique interactors and information for 156 PTM sites on viral proteins. In particular, the protein S1 (GU280_gp02) shows 3031 curated physical interactions with 1371 interactors and 41 PTM sites (https://thebiogrid.org/4383848/table/severe-acute-respiratory-syndrome-coronavirus-2/s.html) as supported by 903 publications.
BioGRID manages and integrates interaction data from low- and high-workflow experiments through a data curation and standardization process. This involves the analysis and validation of data from both types of experiments to ensure the quality and reliability of the information in the database.
Meaning of low- and high-throughput molecular interactions in BioGRID: in BioGRID, molecular interactions detected with low-throughput experiments are considered more significant than those detected with high-throughput experiments. This is because low-throughput experiments are more targeted and accurate in identifying specific, biologically relevant interactions. In contrast, high-throughput experiments may produce a higher number of interactions but may also include interactions that are not necessarily biologically significant. We carefully evaluate and integrate data from low-workflow experiments, which are considered more targeted and accurate in identifying specific and biologically relevant interactions, into the database. BioGRID uses well-defined curation standards and data integration protocols to ensure that information from both types of experiments is carefully documented and placed in the right context. This approach allows users to access a wide range of interaction data, from different experimental sources, in a consistent and reliable way. BioGRID currently contains over 2.7 million protein and genetic interactions, as well as over 1.5 million chemical interactions. The database is constantly growing as new data is curated and added.

2.2. STRING

STRING (Search Tool for the Retrieval of Interacting Genes/Proteins database) (https://string-db.org/) Version 12.0 is a database of predicted interactions for different organisms [23,24] the interactions include direct (physical) and indirect (functional) associations; they stem from computational prediction, from knowledge transfer between organisms, and from interactions aggregated from other (primary) databases. STRING is a database of known and predicted protein-protein interactions. The interactions include direct (physical) and indirect (functional) associations; they stem from computational prediction, from knowledge transfer between organisms, and from interactions aggregated from other (primary) databases. It considers conserved genomic neighborhood, gene fusion events and co-occurrence of genes across genomes, as well as information about orthologs. STRING quantifies the strength of the evidence supporting each interaction by assigning it a confidence score. This score is a combination of several sub-scores (based on seven channels of evidence), each of which is calculated in a personalized and source-specific way.

2.3. Protein Enrichment

It relies to some extent on prior knowledge, and statistical enrichment of annotated features may not be an intrinsic property of the input. To get a statistically valid enrichment test from STRING, we input the entire set of enriched proteins into STRING, ensuring that “first shell” and “second shell” are both set to “none”. To confirm the correctness of the procedure, we also checked the STRING annotation, which disappears when the analysis is performed correctly. Next, we introduce new interaction partners to the network to expand the interaction neighborhood according to the desired confidence score. We used 0.9 as the confidence score. We always added 1st order proteins (direct interactions) first and then 2nd order proteins (indirect interactions), when necessary.

2.4. Cytoscape and Network Topology Analysis.

Cytoscape [25,26] through Network Analyzer was used to analyze the topological parameters of networks. Using Cytoscape software (Version 3.10.1), we visualized and analyzed PPI networks, which offer diverse plugins for multiple analyses. Cytoscape represents PPI networks as graphs with nodes illustrating proteins and edges depicting associated interactions. We examined network architecture for topological parameters such as clustering coefficient, centralization, density, network diameter, and so on. Our analysis included undirected edges for every network. We termed the number of connected neighbors of a node in a network as the degree of a node. P(k) is used to describe distributing node degrees, which counts the number of nodes with degree k where k = 0, 1, 2, …. We calculated the power law of distribution of node degrees, which is one of the most crucial network topological characteristics. The coefficient R-squared value (R2), also known as the coefficient of determination, gives the proportion of variability in the dataset. We also examined other network parameters, including the distribution of various topological features. We performed a calculation of hub and bottleneck nodes based on relevant topological parameters. By examining the PPI network, we found the top 7 hub nodes. These nodes had higher degree values than the others and were in two central modules that were connected and compact.

2.5. CentiScaPe.

Regarding centralities for undirected, directed, and weighted networks, CentiScaPe [27] calculates specific centrality parameters describing the network topology. These parameters facilitate users in locating the most important nodes within a complex network. The computation of the plugin produces both numerical and graphical results, facilitating identifying key nodes even in extensive networks. Integrating network topological quantification with other numerical node attributes can provide relevant node identification and functional classification.

2.6. GO and KEGG Pathway Analyses

To better research and show the biological function of interacting proteins, we performed GO analysis, which included biological process (BP), cellular component (CC), molecular function (MF), and many other evaluations using the specific tools present in STRING. All functions shown by STRING are significant, having a p-value of <0.05.

2.7. SARS2-Human Proteome Interaction Database (SHPID)

We have collected in a single database all the files made available online by BioGRID, containing all the curated physical interactions of the 31 SARS-CoV-2 proteins gained through experiments in human cellular systems with viral baits, followed by purification and characterization with mass spectrometry [10]. These data are available as a zip file containing multiple zip files (32 zip files) each comprising interactions and post-translational modifications for each single SARS-CoV-2 protein for 33,823 interactions (as of June 2024). The database, therefore, contains the set of all real interactions existing between the SARS-CoV-2 proteome and all the proteins of the human proteome. We highlight that not all interactions are real, and some could derive from artifacts of the method, such as non-biological interactions, only because of the random encounter between proteins in the system used, representing an encounter that would never happen during an infection. However, the interactions derived from BioGRID all, even those with the lowest score, have a significant statistic with an FDR ≤ 0.01. This allows us to identify as many significant comparisons as possible while maintaining a low false positive rate, i.e., the probability of a false positive is less than 1%, so only 338 interactions among all are truly null. This database is the comprehensive repository of all interactions acknowledged as biologically possible between the virus and its human host. The database also contains interactions between individual viral proteins, where known. As part of database search actions, one can ask who interacts with whom, with queries that use single human or viral proteins. The search can include multiple sets of proteins.

2.8. Highlighting the Nodes of a STRING Network Involved in the Same Biological Process (GO)

STRING makes visible all the nodes involved in the same biological process evidenced through its databases mapped onto the proteins (GO, KEGG, REACTOME, and so on) by activating the process itself with a click of the cursor on the process line. Activation means that all nodes involved in the same metabolic process have the same color. Nodes involved in multiple processes receive multiple colors. This tool is very useful when one wants to analyze involving multiple nodes in many metabolic processes, distinguishing the effect of different processes between nodes, and identifying which nodes represent the crossing points. If individual nodes do not show any coloration after clicking, this identifies certain components of a path, or group, that a specific activated process does not influence. The relationships that determine the coloring of the nodes depend on the knowledge base that STRING organizes for a specific network by extracting data and information from the scientific literature in PubMed.

2.9. Evaluation of the HUB-and-Spoke Model

Many properties of a scale-free network depend on the value of the degree exponent of the power law γ [28]. Therefore, it is interesting to establish how network properties vary with γ. Estimating the expected maximum degree (also known as the natural cut-off) for a scale-free network, which represents the expected size of the largest hub, is based on the following formula [29]:
Kmax ~ Kmin 𝒩 1/γ‒ 1
Where Kmax and Kmin are the expected maximum and minimum degrees of a node. 𝒩 is the system size in terms of the number of nodes.

2.10. Cluster Analysis

For the cluster analysis, we use the K-Means Clustering method [30]. K-Means Clustering is an Unsupervised Learning algorithm (centroid-based clustering algorithm) used by STRING to group the protein dataset into different functional clusters. Centroid-based algorithms are efficient, effective, simple, and sensitive to initial conditions and outliers. This makes it useful in handling networks. Here, for K, which defines the number of predefined clusters, we used the value of 10 after various manual attempts to search the most reliable clusters in terms of compactness, metabolic functionality, and p-value.

2.11. Protein Intrinsic Disorder and Secondary Structure Prediction

We used the STRING feature as well as two online servers, Jpred 4 and IUPred2A. Jpred is a web server that takes protein sequences and, from these, predicts the location of secondary structures using a neural network called Jnet. It shows the prediction as a graph. IUPred2A [31,32] is a combined web interface that allows for the identification of disordered protein regions using IUPred2 and disordered binding regions using ANCHOR2. IUPred2A can identify disordered protein regions by analyzing their sequence, regardless of whether they are stable. Upon inspecting the graphic outputs of all the predictive systems, we have confirmed disordered segments in most of the examined proteins, whether viral or human.

2.12. Data Merging

Data Merging is a process in data management, used to coalesce multiple related datasets into one. The data-merging approach pools all data together and then estimates statistics on the resulting dataset of GO terms. The merging process enables the use of this combined data for more effective analysis, particularly for extensive sets [33]. Data Merging merges disparate data sources, such as databases, or experiments data, into a unified dataset. We have used Excel for calculations. It aids in improving the accuracy of statistical data analysis, filling missing values in datasets, identifying correlations between variables, and making the data cleaning process more efficient. This procedure also presents some challenges. These include handling large datasets, ensuring the correct alignment of merged data, and dealing with ambiguities when datasets have similar identifiers. These issues, if not dealt with carefully, can lead to data inconsistency or incorrect data interpretation. We have used this approach in integrating diverse data from various interactome analyses and data sources. The performance depends on the size of the datasets being merged and the computational resources available. With adequate resources, it is usually efficient and quick, providing a unified data view in relatively little time. We have used a storage repository that holds a vast amount of raw data in its native format (Data Lake).

2.13. CIDER

CIDER is a web-server developed by the Pappu Lab [34] for calculating parameters relating to disordered protein sequences, although it can generate values for any protein sequence. It is a Python backend, which allows you to run calculations locally, creating custom analytics pipelines. Specifically, CIDER calculates a set of parameters which help translate primary sequence information into better understanding how the protein might behave, as well as producing a diagram of states [34,35,36].
κ (kappa) - κ is a parameter to describe the extent of charged amino acid mixing in a sequence. For a sequence of fixed composition, as κ goes from 0 to 1, we can think of the sequences as becoming less well mixed regarding the positive and negative residues. Useful parameters to combine with κ are the fraction of charged residues (FCR) and net charge per residue (NCPR). As the fraction of charged residues increases, the relative impact of how those charges are spread across a sequence becomes more significant. They also relate to the conformational shape of the protein.
Disorder promoting - Residues can broadly be categorized into disorder promoting or order promoting, as defined by Dunker & Uversky [37]. A ‘disorder promoting’ result reflects the weight of the fraction of residues, which forms the disorder promoting set.
Regions on the diagram of-states. This defines the location on the diagram of-states where the sequence lies. S1 lies in weak polyampholytes & polyelectrolytes, where sequences are typically globules and tadpoles (region 1).

3. Results

3.1. A Brief Analysis of the Behavior that we Expect for S1 Free in Solution

Chemical-physical data of S1 subunit of SARS-CoV-2 Spike (Gene ID: 43740568 (ncbi.nlm.nih) and UniProtKB: PODTC2) were calculated by the web server CIDER [35], while their interpretation is exclusive to the author. The mature S1 subunit gets 711 aa, as decoded by its mRNA. We know many structural details of S1 in the Spike structure [38] and its mechanism of action in penetrating a living cell through ACE2 [24]. Spike (1273 aa in humans) is a precursor protein that is proteolytically cleaved by furin into an N-terminal S1 subunit and the C-terminal hydrophobic S2 subunit. This last one mediates cell attachment. S1 is completely visible in the extracellular environment. Its key role is to interact with ACE2 and, through its immunogenic epitopes, manage interactions with external proteins. The fate of the S1 particles released by furin has never received much attention [39]. However, S1 is detectable in the blood for a long time, both after infection and vaccination. The free structure of S1 at 3.6 Å is on PDBj (7A91; entry DOI:10.2210/pdb7a91/pdb). Neutralizing antibodies target the epitopes on the S1 surface [40]. Thus, researchers fragmented S1 into peptides to understand which epitopes have the greatest antigenic power. They found a high number of strong epitopes in the 440-600 region, where the HLA epitope (448-456), called NF9 peptide, dominates [41]. What the researchers have overlooked is the conformational behavior in solution and the chemical-physical characteristics of the subunit, since they have mainly studied techniques to develop detection assays. [42]. These are important features for assessing the interaction tendency of proteins. We used the platform CIDER of the Pappu’s lab for calculations (see methods for details). We can predict with approximation its conformational preference as weak polyampholytes (FCR < 0.3) for S1 (FCR < 0.160), by combining chemical-physical parameters calculated by sequence [24,29]. The S1 subunit shows a fraction of charged residues (FCR) of 0.160 and a net charge per residue (NCPR) of 0.006. This translates to a net positive charge at pH 7.0 of +4.95. The strong positive net-charge of S1 at neutral pH favors interactions with negatively charged proteins or surfaces, but also suggests an excellent solubility of the protein in aqueous media. The FCR and NCPR values, as calculated by the CIDER server, suggest a dispersed positive charge distribution over the entire protein with a high number of charged patches in the region 400–600 and in the N-terminal tail. Also, a K value (charge patterning parameter) of 0.175 suggests segregation of charged residues within the protein with conformational fluctuations caused by long-range electrostatic attractions. This value is zero for sequences with well-mixed charges [34].
CIDER calculated a value of disorder promoting capacity (DPC) of 0.549 [34]. The terminal segment, from residue 440 to about 700, is the one with the greatest number of disorder-promoting residues, according to Dunker [43]. This suggests that this region comprises many disordered segments. An analysis through IUPred3 confirmed this hypothesis, also suggesting high segmental flexibility (data not shown). The proline content of S1 (5.2%) is high (37 P residues, and, on average, one P every 19 residues). P is a residue that acts as a mobile hinge inducing structural orientation change, but it is also the protein residue with the most disorder-promoting potency [37]. We also need to put glycine on the same level as P because of its strong disorder-promoting ability [37]. Its content is also high, 46 residues (6.5%), with one G residue every 15.4 residues. This residue induces a strong structural flexibility in the structural environment that surrounds it, favoring broad structural fluctuations [44]. The set of highlighted parameters suggests an expanded and mobile globule-like structure [34], very flexible with disordered segments but also very soluble in solution (see figure 1S in Supplements) and susceptible to electrostatic interactions. This contradicts the general idea of compactness that arises from snapshot views of Spike by three-dimensional techniques. A fast sequence-encoded equilibrium between protein-solvent and intra-protein interactions should control the conformational properties of IDR segments in solution, which are crucial for interactions [36,45].
These chemical-physical and structural properties of S1, free in solution, explain well the reason for the many interactions with human proteins found in BioGRID. But S1 also displays 87 sites for post-translational modifications (PTMs) on its sequence. They modulate the structure and functionality of the protein in the different metabolic and temporal contexts in which it operates. Many sites in the IDRs undergo phosphorylation by serine/threonine kinases, which, by modifying the conformational properties of S1, allows it to coordinate many cellular signaling events [46]. These results highlight the importance of considering the intrinsic conformational behavior of this protein in solution when developing vaccines because the final mechanism releases S1 into the cell, free to interact with human proteins [47].

3.2. Data Source

All features highlighted in this study are based on experimental data extracted from BioGRID (see Methods). We selected 158 human proteins out of the 1371 unique interactors of S1, which induces 3002 raw interactions. The selected proteins are all characterized by a high significance level (level score ≥ 2) as well as by binding S1 with at least one Low Throughput (LT) interaction. BioGRID prioritizes molecular interactions detected with LT experiments over those detected with high-throughput (HT) experiments. This is because LT experiments are more targeted and accurate in identifying specific, biologically relevant interactions. Conversely, HT experiments can produce a larger number of interactions, including interactions that are not biologically significant [22].
Table 1S (Supplements) reports the proteins extracted from BioGRID that interact with S1 at LT. The figure 2S (Supplements) shows the interactome calculated by STRING for these proteins. The figure shows a compact network suggesting common functional activities. Although the confidence score is low (0.400) and all the 7 channels are open to collect as much information as possible, the proteins form a compact network with an excellent p-value suggesting shared biological activities. The low score value and the use of all channels were used to collect as much information as possible, postponing the pruning of the less significant nodes to a later time. However, twelve nodes remain disconnected. The lack of connection suggests either little research on these proteins or that they are not involved in this specific functional context [48]. Therefore, we eliminated them so as not to alter calculating the topological parameters [49,50,51,52]. We pruned these nodes of low significance (CACNA1C, CLPTM1, CNTN1, CSNK1G3, IL1RAPL2, LYSMD3, MPZL1, MSMP, PIM2, SLC6A15, SLC7A4, and WDR45B) to increase the accuracy and robustness of our conclusions. In Figure 3S, we show the new 146-node interactome. This new interactome appears well organized, with a central compact body and many peripheral sub-graphs, locations of specific biological activities. For instance, the sub-graph on the left (ZDHHCXX-GOLGA7) is the palmitoyl-transferase complex involved in protein transport from Golgi to cell surface [53]. While the pentagonal sub-graph (bottom compared to the previous one) shows components of the Coatomer cytosolic protein complex II (COPII) which promotes forming transport vesicles from the endoplasmic reticulum (ER) and regulates the intracellular membrane trafficking, from the formation of transport vesicles to their fusion with membranes [54]. Many of these 146 nodes have all the characteristics of functional compactness and high rank to maximize the metabolic processes of the network through enrichment as functional seeds [55]. Efficient seed selection should select the most influential nodes to achieve the maximum level of functional influence. This is because, in the enrichment phase, the robustness of seeds is essential to counteract potential disturbances, such as topological alterations. An accurate selection of influential seeds reduces perturbations in the network [56].
Functional enrichment is based on statistical parameters related to biological functions associated with the gene set extracted from BioGRID. It identifies biological and functional themes (pathways, Gene Ontology, diseases, etc.) that, although sometimes overrepresented, apply to the topic under study. Integrating multiple pathways (KEGG, Reactome, etc.) offers advantages in terms of more probable, more extensive, and robust functional annotations, necessary for a better understanding of the functions and metabolic regulation existing in a complex biological system such as the virus-host one.
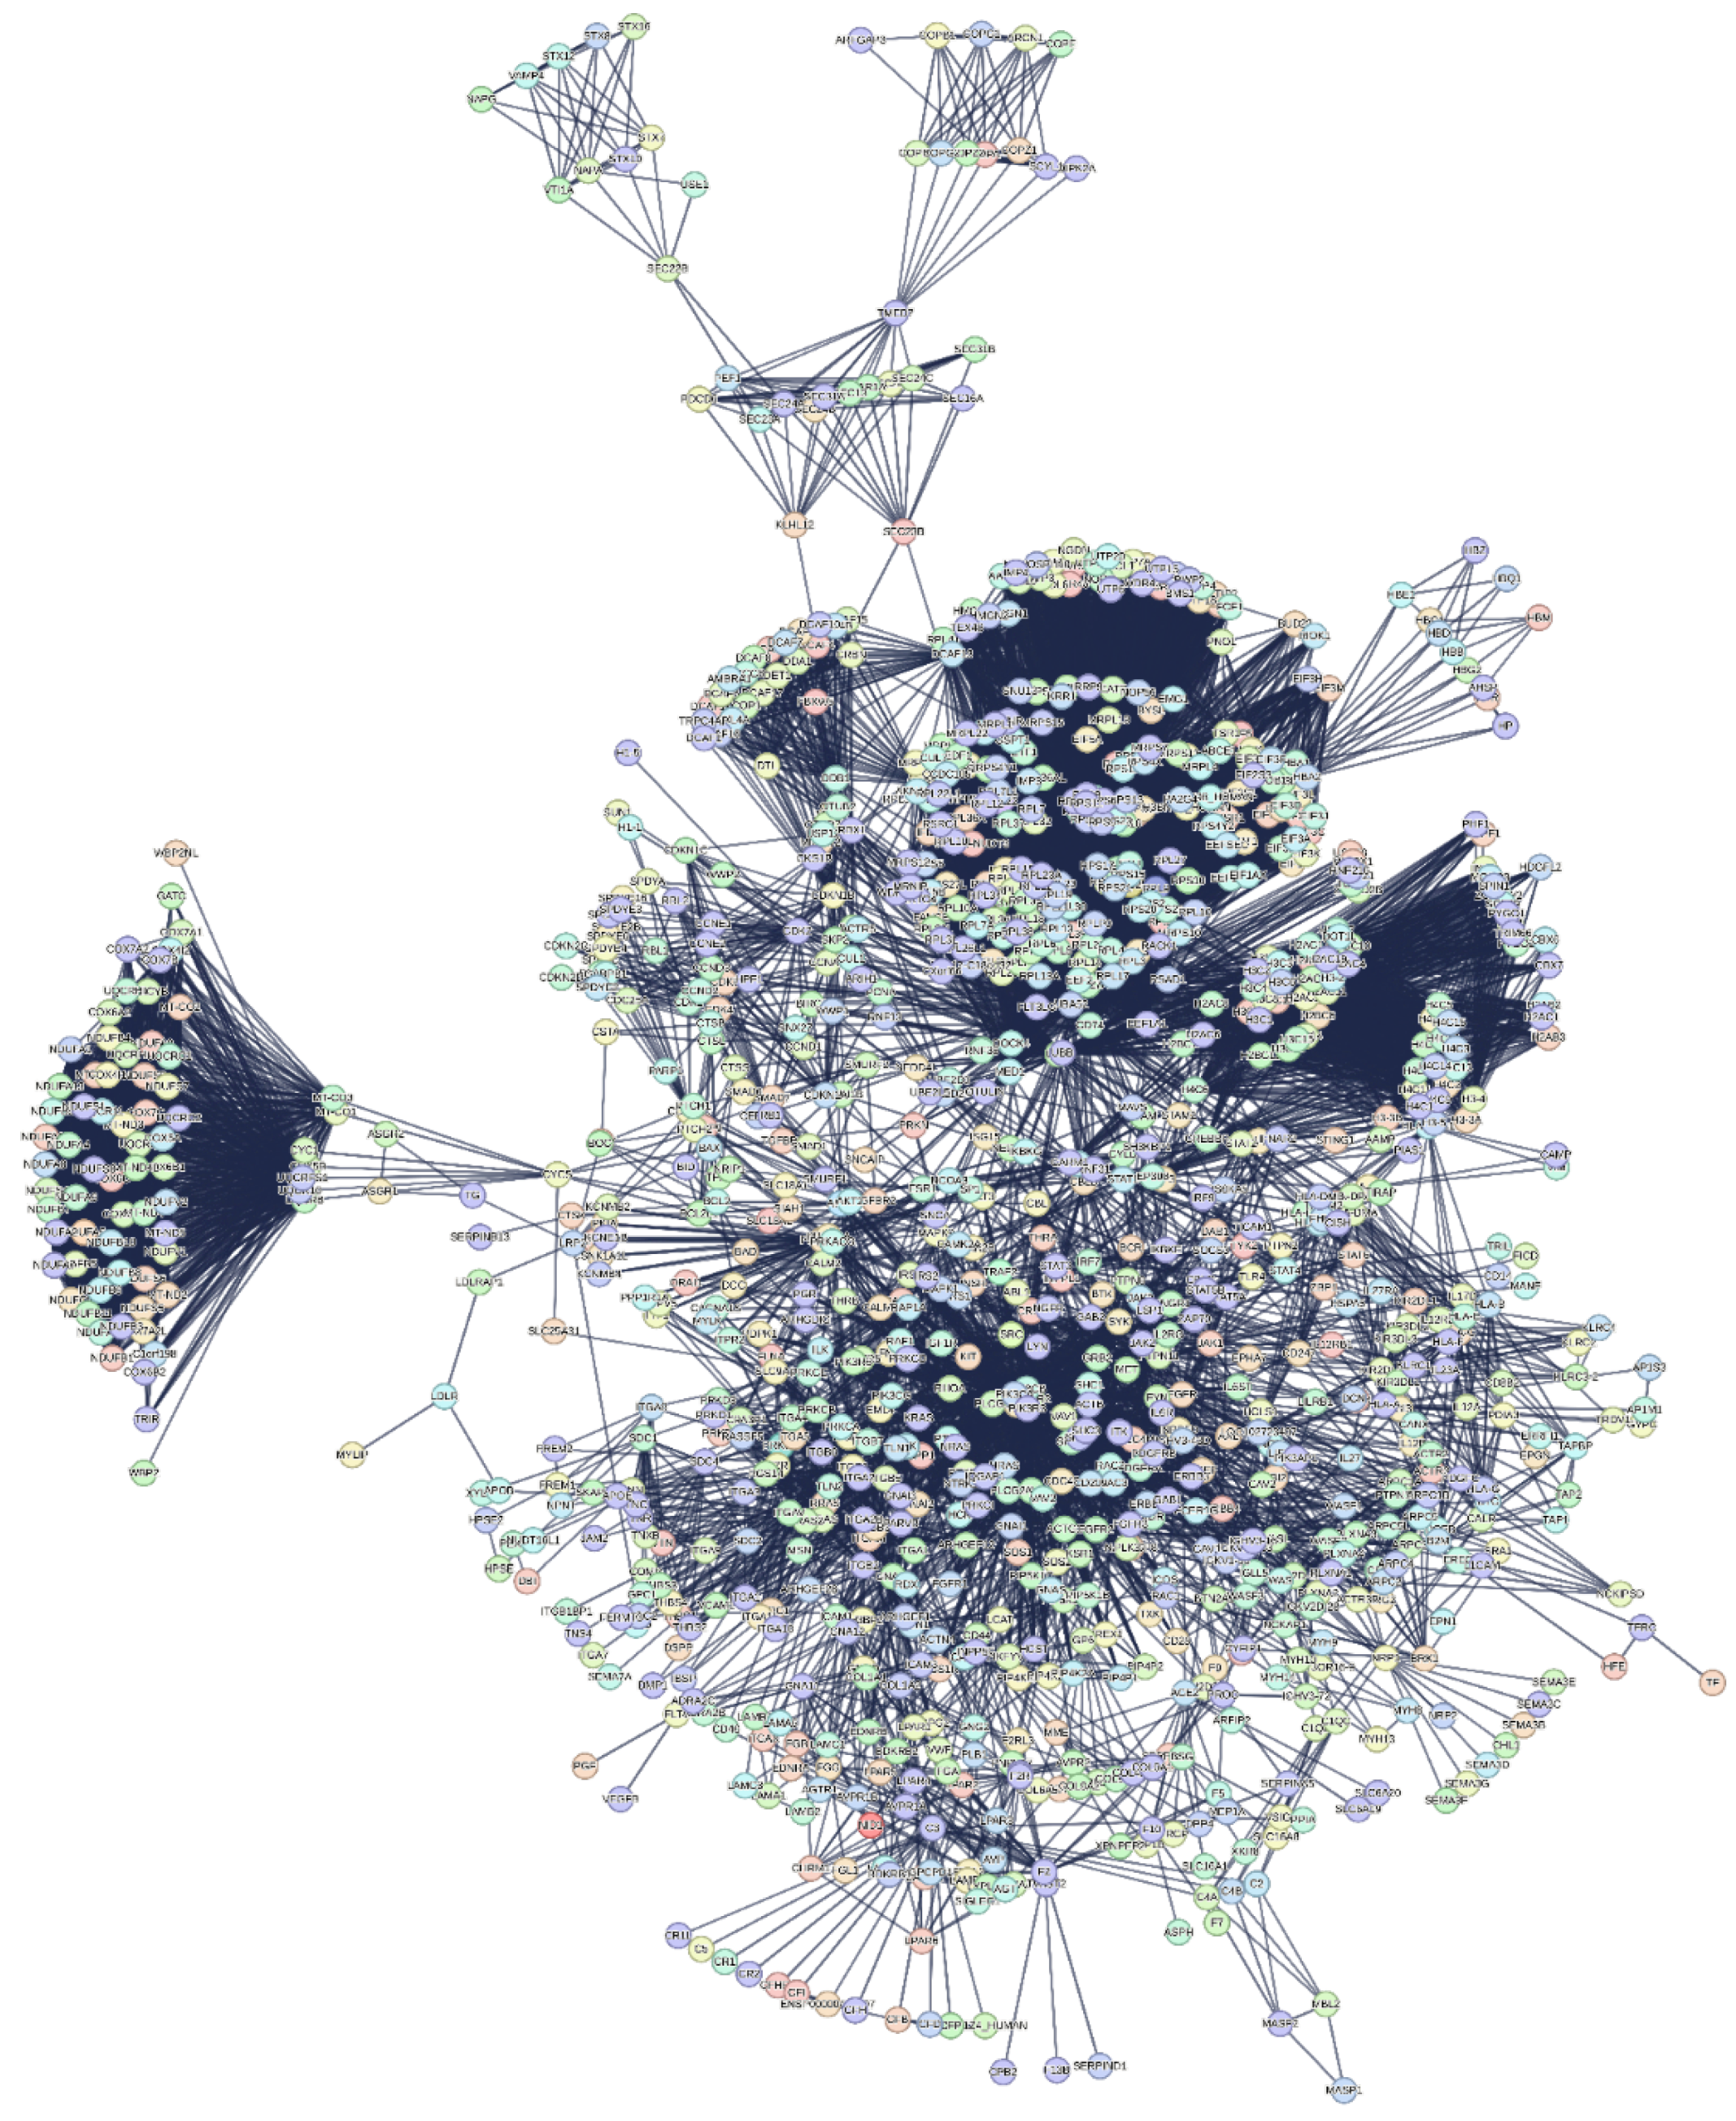
We have two major goals: extracting useful information from the functional processes of the proteome that are related to functional seeds, as a strategy; defining the topological space in which to represent and visualize the structural organization of the extracted metabolic processes as a method. STRING implemented the calculation for the functional enrichment of these nodes by adding 500 first and 500 second order proteins (direct and secondary interactions) until obtaining an interactome of 1146 nodes (see figure 4S). This interactome, despite being very compact and with an excellent statistic, still has disconnected nodes, most likely because of heterogeneous data. Although the access to scientific documents in natural language by Text Mining is easier, the results of this automated search are often not relevant to the needs of the user looking for experimental and quantitative data [57,58]. In fact, extracting information through key phrases and relationships used by these systems leads to heterogeneous results with differences among the scientific databases from which the articles were retrieved, even if articles are similar [57]. It’s important to note that bioinformatic platforms treat less studied genes/proteins as if they were background noise and often eliminate them from the calculations [59,60]. This generates uncertain in predictions or information, so we eliminated disconnected nodes. The Excel file 1 sheet 1 reports the pruning protocol with the degree-lists of the 1060 residual nodes and that with the 87 nodes eliminated. The figure 1 shows this interactome (from now on “interactome-1060”) as calculated by STRING.

3.3. The Interactome-1060

Figure 1 shows an interactome comprising proteins from the human proteome selected through a sequential selective process that identified those with the highest experimental probability of being involved in the metabolic processes induced by the S1 protein in the human organism. The interactome comprises 1,060 nodes and 17,494 edges, got by selecting the highest significance interactions (confidence score 0.900) and excluding the Text mining channel. This is another important point because of the uncertainty arising from detections of protein interactions, which is reflected in the network's structure [48]. PIN (Protein Interaction Network) analysis should be reproducible, by similar results across different scoring thresholds of calculation systems. This suggests that, for maximum confidence, we need to have a robust metric across the network to have meaningful and reproducible topological results [48]. The topology of the interactome-1060 is complex because of the many peripheral sub-graphs enveloping an extended central core. The various peripheral sub-graphs are connected through a few interactions of specific nodes at the interface with the central body and with each other. We can observe subgraphs (also called communities or molecular modules) densely connected within themselves but poorly connected with the rest of the network. The intensity of the connections and the compactness of each sub-graph suggest they represent molecular complexes that carry out specific and common functional activities [61,62,63]. This broad functional connectivity shows the possibility of an extensive repertoire of responses to stimuli. After all, the cell is a complex multi-agent system programmed to perform predefined functions at specific times. Therefore, the interactome-1060 represents a robust set of human proteins suitable for a reverse engineering approach. With it, we will assess the significance of each single interaction by evaluating its real biological meaning. We believe that this approach has a broader value than the rather reductionist meaning of reverse engineering as a technology [64]. In short, we try to discover the one-to-one interactions of S1 in the network by validating them through external biological information.
Figure 1. Human interactome generated by seed proteins physically interacting with S1 subunit of SARS-CoV-2. Topological parameters are in Table 2. STRING calculated the interactome.
Preprints 120198 g001

2.3.1. Quantitative Aspects of Interactome-1060 Functional Processes

Table 1 shows an overview of the functional processes activated by interactome-1060.
Table 1. Functional Processes activated in the human genome by the interactome-1060.
Biological Process Terms significantly enriched
Biological Process (Gene Ontology) 1430 terms
Molecular Function (Gene Ontology) 165 terms
Cellular Component (Gene Ontology) 283 terms
Reference publications (PubMed) >10,000 publications
Local network cluster (STRING) 251 clusters
KEGG Pathways 202 pathways
Reactome Pathways 693 pathways
WikiPathways 302 pathways
Disease-gene associations (DISEASES) 114 diseases
Tissue expression (TISSUES) 167 tissues
Subcellular localization (COMPARTMENTS) 287 compartments
Human Phenotype (Monarch) 787 phenotypes
Annotated Keywords (UniProt) 103 keywords
Protein Domains (Pfam) 17 domains
Protein Domains and Features (InterPro) 144 domains
Protein Domains (SMART) 44 domains
All enriched terms (without PubMed) 4989 enriched terms
The control of so many biological processes by S1 is remarkable. This analysis is based only on experimental data from BioGRID, functionally analyzed by STRING. The calculated interactome is based on select only the most statistically significant interactions (through the highest confidence score) deriving from data and information from over 10,000 scientific articles and from eliminating information from the text mining channel which introduces biases in the data and in information compared to everyone else. Such an approach favors the greatest possible certainty of the interactions in the interactome (Figure 1). However, the more complex a network is with many multi-node interactions, the more intrinsically robust it is with reduced false positive interactions. The Excel file 1, sheet 1 reports the node degrees of the entire interactome-1060. The node with the highest connectivity is RPS27A (nodal degree: 230), a ribosomal protein. Hubs connect multiple nodes to centralize network traffic through a single connection point. Barabasi suggests that the range of degrees for including the HUB nodes should be half the value of this node (65-67). This range includes 65 HUB nodes out of 1060 nodes (6%) from 230 to 115 degrees. A closer inspection shows that these nodes are almost all ribosomal proteins, even if in different roles.
Among these high-ranking nodes, four of them regulate and control many ribosomal activities, showing disproportionately more interactions than other proteins. They are RPS27A, its paralogue UBA52, FAU and RACK1. RPS27A and UBA52 play crucial roles in targeting cellular proteins for degradation by the 26S proteasome, maintaining the chromatin structure, regulating gene expression, and the stress response [68,69]. FAU is a protein contributing to the assembly and functionality of 40S ribosomal subunits in the cytoplasm [70]. It is implicated in ribosomal biogenesis and is associated with various protein complexes, contributing to regulating the cell cycle. While RACK1 is a protein that controls translation directly and acts as a scaffold for signaling to and from the ribosome [71]. Upon viral infection, RACK1 remodels ribosomes so that they become optimal for translating viral mRNAs but not for host mRNAs [72]. Thus, they interface with multiple cellular functions and processes. Here, we focused on their pivotal roles in the synthesis of new proteins. To gain more insight into their activity, we used the STRING action “recenter” that rewires the network around these proteins, showing all the proteins in STRING that interact with them. This specific interactome (figure 5S) reveals a strong connection between the four proteins and their control over the remaining 793 proteins. The functional picture that emerges is that of four essential cytosolic small ribosomal subunits involved in viral mRNA translation (GO:0002181 Cytoplasmic translation, p-value: 4.16x10-85; GO:0042274 Ribosomal small subunit biogenesis, p-value: 3.79x10-45; GO:0006412 Translation, p-value: 2.67x10-194; GO:0006364 rRNA processing, p-value: 2.85x10-88; GO:0042254 Ribosome biogenesis, p-value:1.38x10-109; GO:0022613 Ribonucleoprotein complex biogenesis, p-value: 9.71x10-126; GO:0034660 ncRNA metabolic process, p-value:1.86x10-65; CL:143 Viral mRNA Translation, and Sec61 translocon complex, p-value:1.26x10-91; HSA-192823 Viral mRNA Translation, p-value: 2.39x10-72). All this shows a dynamic ribosome action in mediating crucial cellular mechanisms, even in pathologic states. It is a view quite like that of some authors who contest the traditional view of ribosomes as static and invariable entities [73,74]. To support this consideration, studies have showed that certain ribosomal proteins impede viral action in cultured human cells, leading to changes in human functionalities [75,76,77]

2.3.2. Significant Topological Parameters of the Interactome-1060

Regardless of the deep molecular machinery underlying the functional characteristics, the space that emerges from the analysis of these topological configurations provides a logical substrate for understanding viral strategies. The main topological characteristics of this interactome (see table 2) reveal important principles of cellular organization and functionality. An extensive eccentricity of the network, as shown by the high values of its diameter and radius (10 and 5), suggests functional peripheral subgraphs (or communities). The heterogeneity (1.187) supports a large tendency to have hub nodes [78], while a centralization value close to zero (0.189) supports compact and dense connections within the network. Another interesting parameter is the value of the average clustering coefficient (0 ≤ C ≤ 1) which reflects a modular organization [79] that, at light of the large diameter, also suggests an asymmetric architecture, as we observe it.
Table 2. - Topological parameters of Interactome-1060*.
Number of nodes 1060
Number of edges 17493 **
Average node degree 33
Avg. local clustering coefficient 0.679
Expected number of edges 8382
PPI enrichment p-value <1.0✕10‒16
Confidence score 0.900
Source channels 6
Network diameter 10
Network radius 5
Characteristic path-length 3.717
Network heterogeneity 1.187
Network density 0.33
Network centralization 0.189
Connected components 1***
(*) Calculated by Cytoscape Network Analyzer, which computes a comprehensive set of topological parameters [80,81]. (**) The numerical value shown is half of that reported in the Excel file 1, sheet 2 where it refers to the total interactions present in the interactome (34,986). STRING in some of its calculations doubles the value because it considers the interaction of a pair (A-B) in the two directions (from A to B and from B to A). ***) The value of "1" shows that all nodes in the network are connected to each other. Existing unconnected components (0 ≤ C ≤ 1) alter the calculations of the topological parameters, making them unreliable [82]. This is the fundamental reason for pruning. A single component accounts for strong network community.

2.3.3. The Power Law of the Interactome-1060
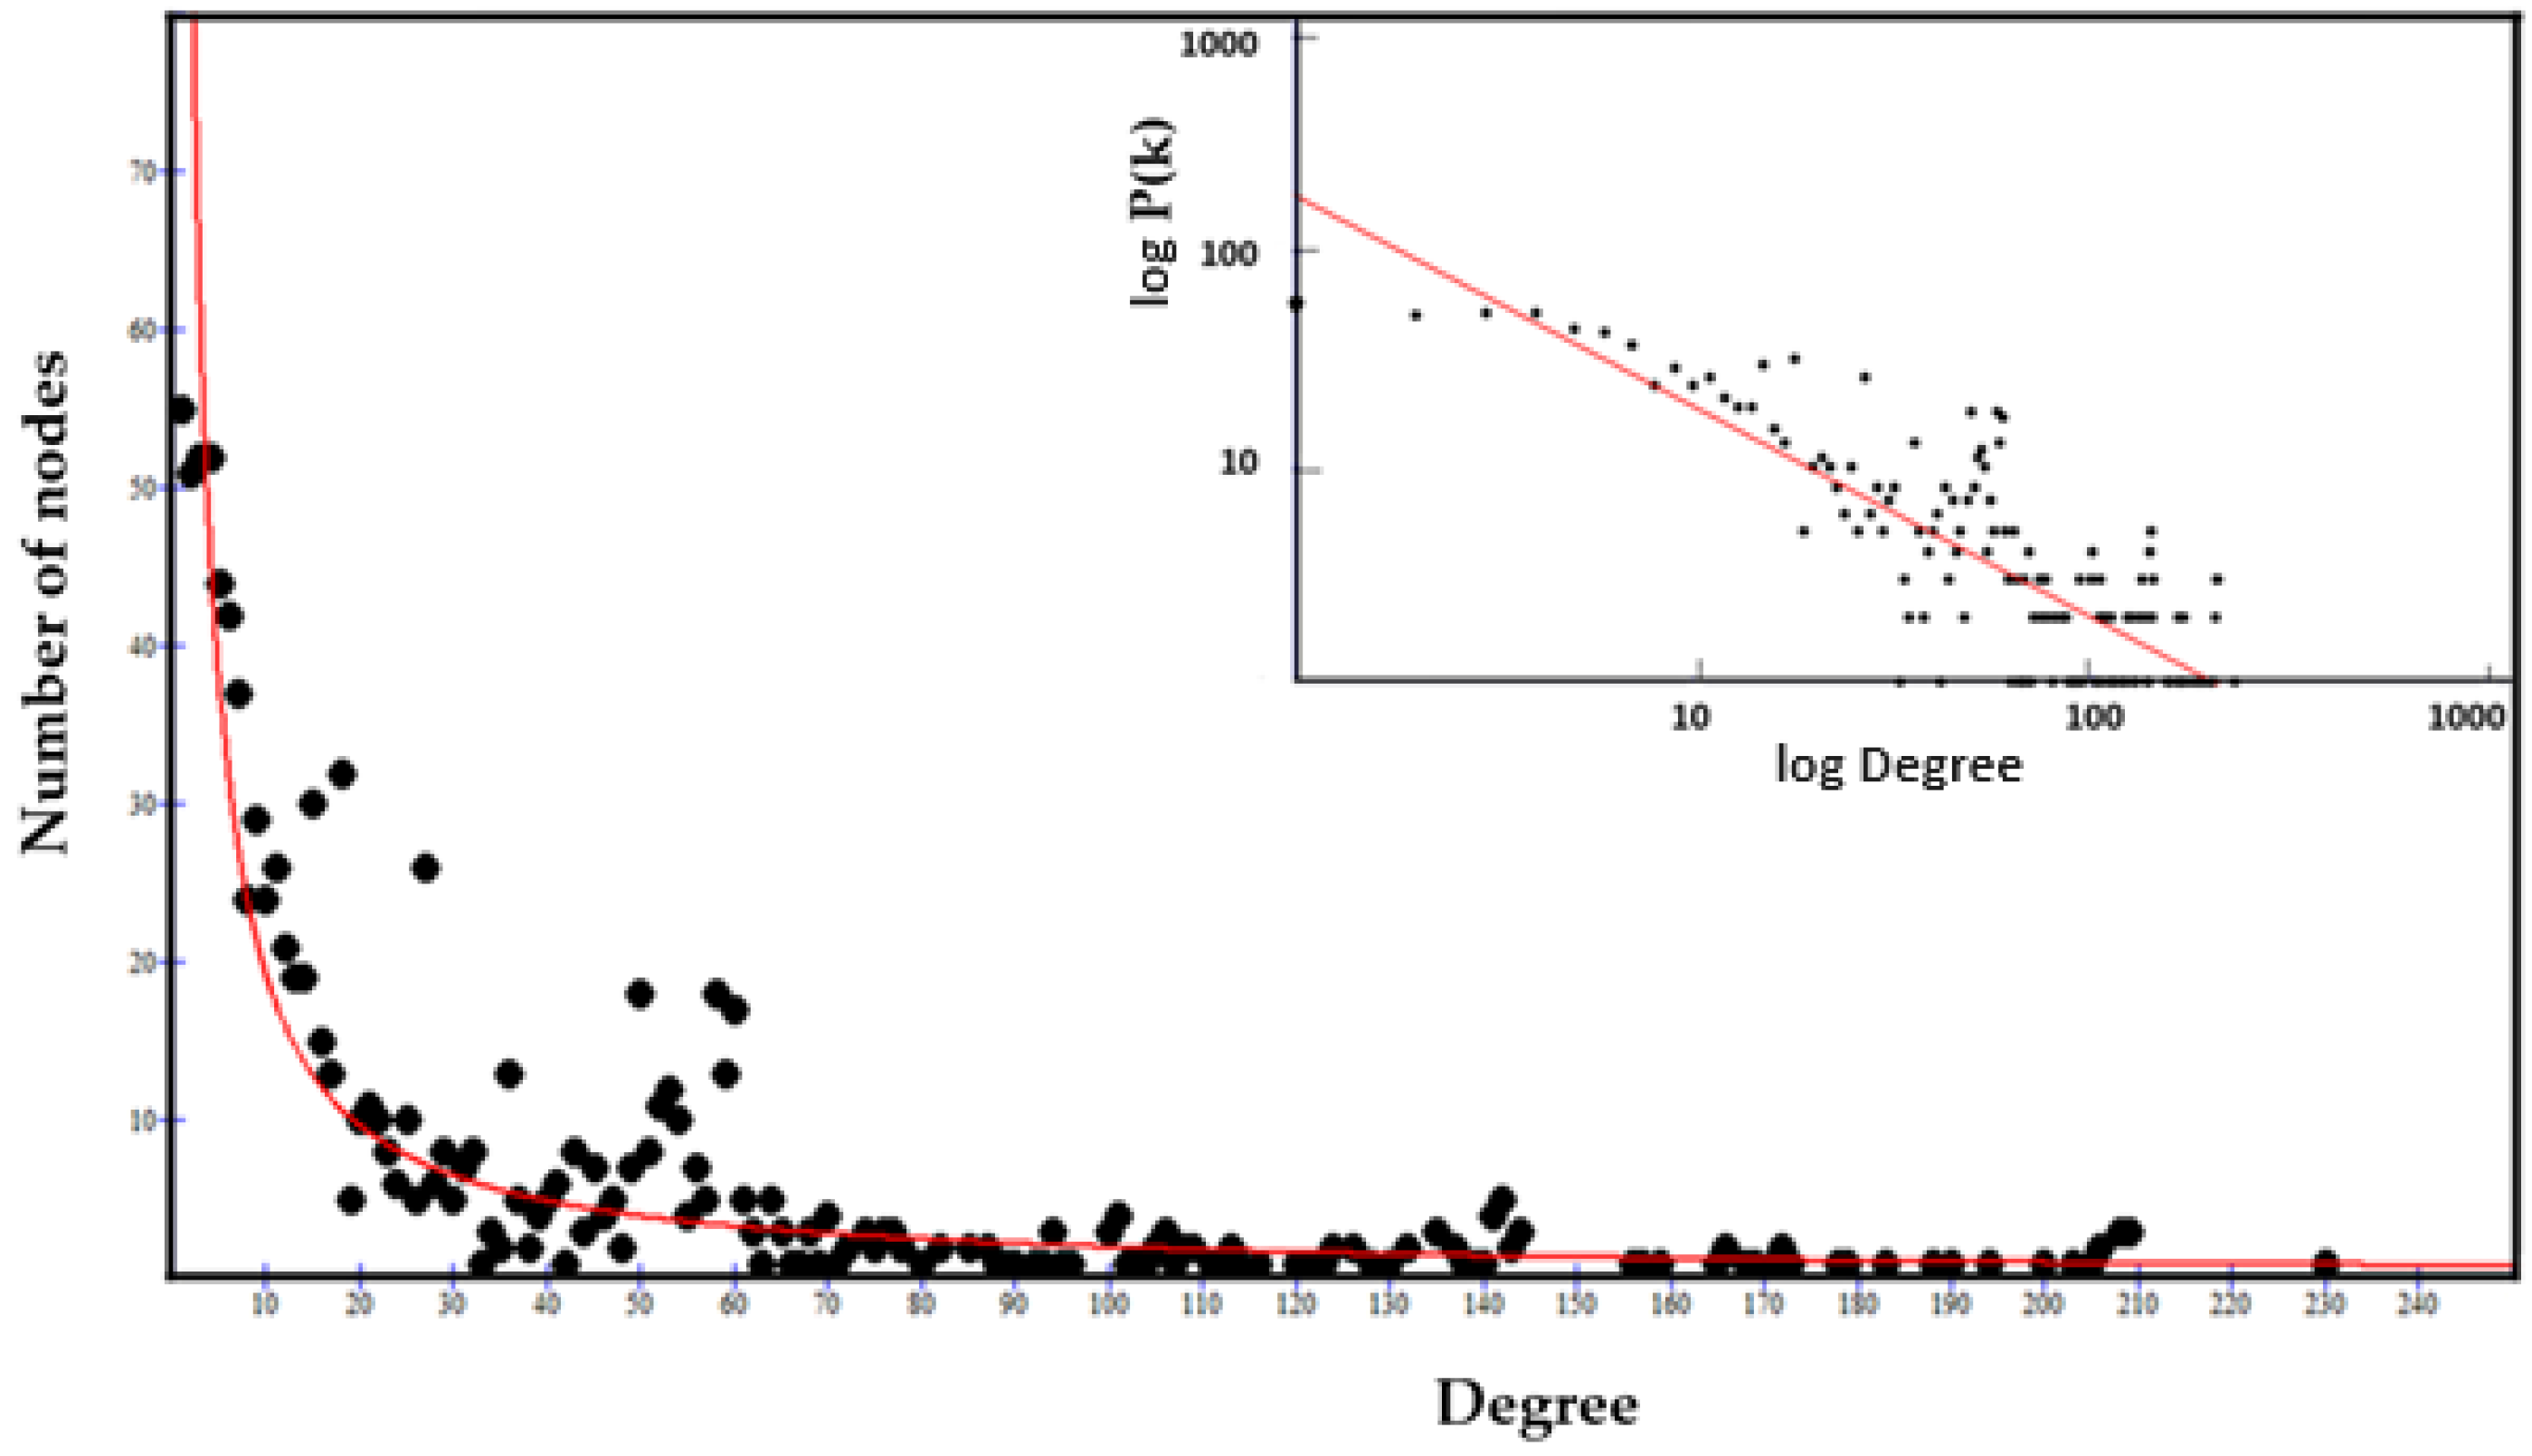
However, before any topological consideration, it is necessary to find out what distribution the interactome degrees show. Biological networks show scale-free behavior with a few hub nodes controlling multiple connections within the system. The lack of an internal scale means that nodes with a large difference of degrees coexist in the same network. Barabasi discovered this feature in many biological networks [83,84], where the fraction of nodes with degree k follows a power-law distribution, showing that the degree distribution of the network is well approximated by Pk ~ k-ƴ, (ƴ > 1). The exponent ƴ is the degree exponent, and many properties of a scale-free network depend on the value of the degree exponent [83,84]. Calculating the degree distribution is an important part of analyzing the properties of a network [85]. Figure 2 shows that the interactome-1060 follows the characteristic distribution law of the nodes of a scale-free network.
Figure 2. Power law distribution of interactome-1060. The distribution follows a free-scale distribution based on the power law. In the inset, we present the same nodes on a log–log scale, with the best fit of data (f(x) = 181.8x−0.98) shown in red. We calculated the slope (–0.517) on the best fit line in the log-log inset.
Preprints 120198 g002
To test the distribution, we fitted the function f(x) = axb, where the values of a, b (degree exponent), and R2 are 181.8, ‒0.98, and ‒0.272. Even though the interactome-1060 shows a significant p-value of 1.0✕10−16, the low correlation index of this fit underscores a strong expectation of heterogeneous associations among nodes, such as high clustering. The presence of clusters in the network topological architecture is useful for defining in a non-random way specific pharmacological attack points [86]. We note that nodes with high connectivity form a long tail (long-tailed distribution) and between degrees 30 and 70 there is a peak that characterizes an excessive number of nodes with these degrees compared to the fit. Some protein networks acknowledge the long tail 86he distribution as an intrinsic property rather than a byproduct of the specific algorithm used to compute the network [87]. This is also a characteristic property of scale-free networks that result in distributions with long tails where only the terminal nodes have high degree values [88].
In most real-world networks, new nodes prefer to connect to more connected nodes, according to a process called preferential attachment [89]. Therefore, the number of nodes grows because of the addition of new nodes, so growth and preferential attachment coexist. The power law should represent this tendency of the nodes. If we examine the degree distribution in the log-log graph (inset of fig.2) we find that the distribution deviates from a pure power law, which in logarithmic representation should follow a linear trend. The log-log distribution shows many overlapping linear plateaus in the high-k regime (the long-tail nodes) and a clear distortion in the low-K data. This suggests various subgraphs (molecular modules) each with its own specific hubs. [90].
According to the Barabasi's model [83,84], for b < 2, the exponent ƴ will be larger than one, as in our case. Hence, the number of connections to the largest hub will grow faster up to reach the global size of the network. This means that for very large N (total number of nodes) the highest degree hub could gain all nodes in the network. But this tendency slows down the connection speed [90,91] allowing also other nodes to increase their connectivity. Barabasi unraveled the complexity of this phenomenon, showing how a large scale-free network with b < 2 cannot exist without multi-link subgraphs [83,84]. Networks are not a static entity but grow by adding new nodes. The joint necessity of growth and preferential attachment generates scale-free networks and changing either of these factors will cause changes to the scale-free properties and network topology. Therefore, the growth rate of a hub node depends not only on its age, because other nodes can transform random transient interactions into a long-lived interaction. A common characteristic of these last nodes is an intrinsic property that we will call fitness [92,93]. Fitness is a property that favors the preferential attachment to other nodes by increasing the growth rate of their connectivity [94,95]. It is based on the set of distinctive structural and/or functional characteristics possessed by each node. On this basis, Barabasi has developed a specific model, the "Bianconi-Barabasi Model" or "Fitness Model" [92,96]. This model shows how nodes with different internal characteristics can gain links at different rates. It predicts that the growth rate of a node is determined by its fitness. One can measure the fitness by comparing the node with the temporal evolution of the fitness of other nodes in the network. This model presents a behavior of the nodes that is like that of Bose gas, studied by physicists [97].
This similarity explains very well the physical basis of forming the many independent and dense functional subgraphs observed in protein networks, characterized by their hubs. In fitness distributions, the network exhibits a "fit-get-rich" dynamic, meaning that the degree of each node is determined by its fitness, where new links not only arrive with new nodes but also occur between pre-existing nodes. The fitness model also shows that in many real systems, nodes, and links can change and disappear, explaining why nodes disconnect after enrichment and therefore need to be deleted [98].
Strictly speaking, if the linear preferential attachment governs the growing network, then a pure power law should emerge. However, it is rare to observe a pure power law in actual systems [99]. The Barabasi-Albert model is an idealized model that represents only the starting point for understanding the distribution degree in real networks [100] because fitness plays an important role. The concept of fitness in protein networks refers to the ability of a protein entity to survive and thrive within a protein network, because of its interaction with other proteins and its functional relevance. This plays an important role in the formation of those protein complexes that are crucial for a variety of biological processes. Protein fitness is based on many essential protein properties, such as secondary structure, solubility, binding affinity, flexibility, and functional specificity [101,102,103,104]. Therefore, in Interactomics, we can motivate this model only if there are experimental observations that explain the internal characteristics of the nodes. If we identify them correctly, then we can understand how fitness contributes to the formation of subgraphs and the topological evolution of the network [105]. In networks with many sub-graphs, such as the ones in this study, hubs connect to nodes of a small degree. As a result, we have a network that is unlikely to be represented by a single giant component. Networks in which hubs avoid connecting to each other but connect to many low-degree nodes are called disassortative and generate a hub organization with a hub-and-spoke pattern [106]. The logarithmic representation of the disassortative degree distribution is characteristic and very similar to the one calculated in figure 2. This means that our network (fig.1) has intrinsic troubles to be represented as a single giant component. We can appreciate this feature by measuring the slope of the linearization of its distribution. As we will see later, it is a measure of the speed of growth. The fit shows a negative slope (see figure 2 caption), and a lower probability of mutual interaction (y-axis) characterizes the nodes with the highest rank (x-axis) [107]. In conclusion, many statistically significant subgraphs give us the picture of the fundamental functions that the biological system performs and its dynamics. This allows us to understand with successful certainty the behavior of S1 in the system.

2.3.4. Origin of the Node Fitness in the Interactome-1060
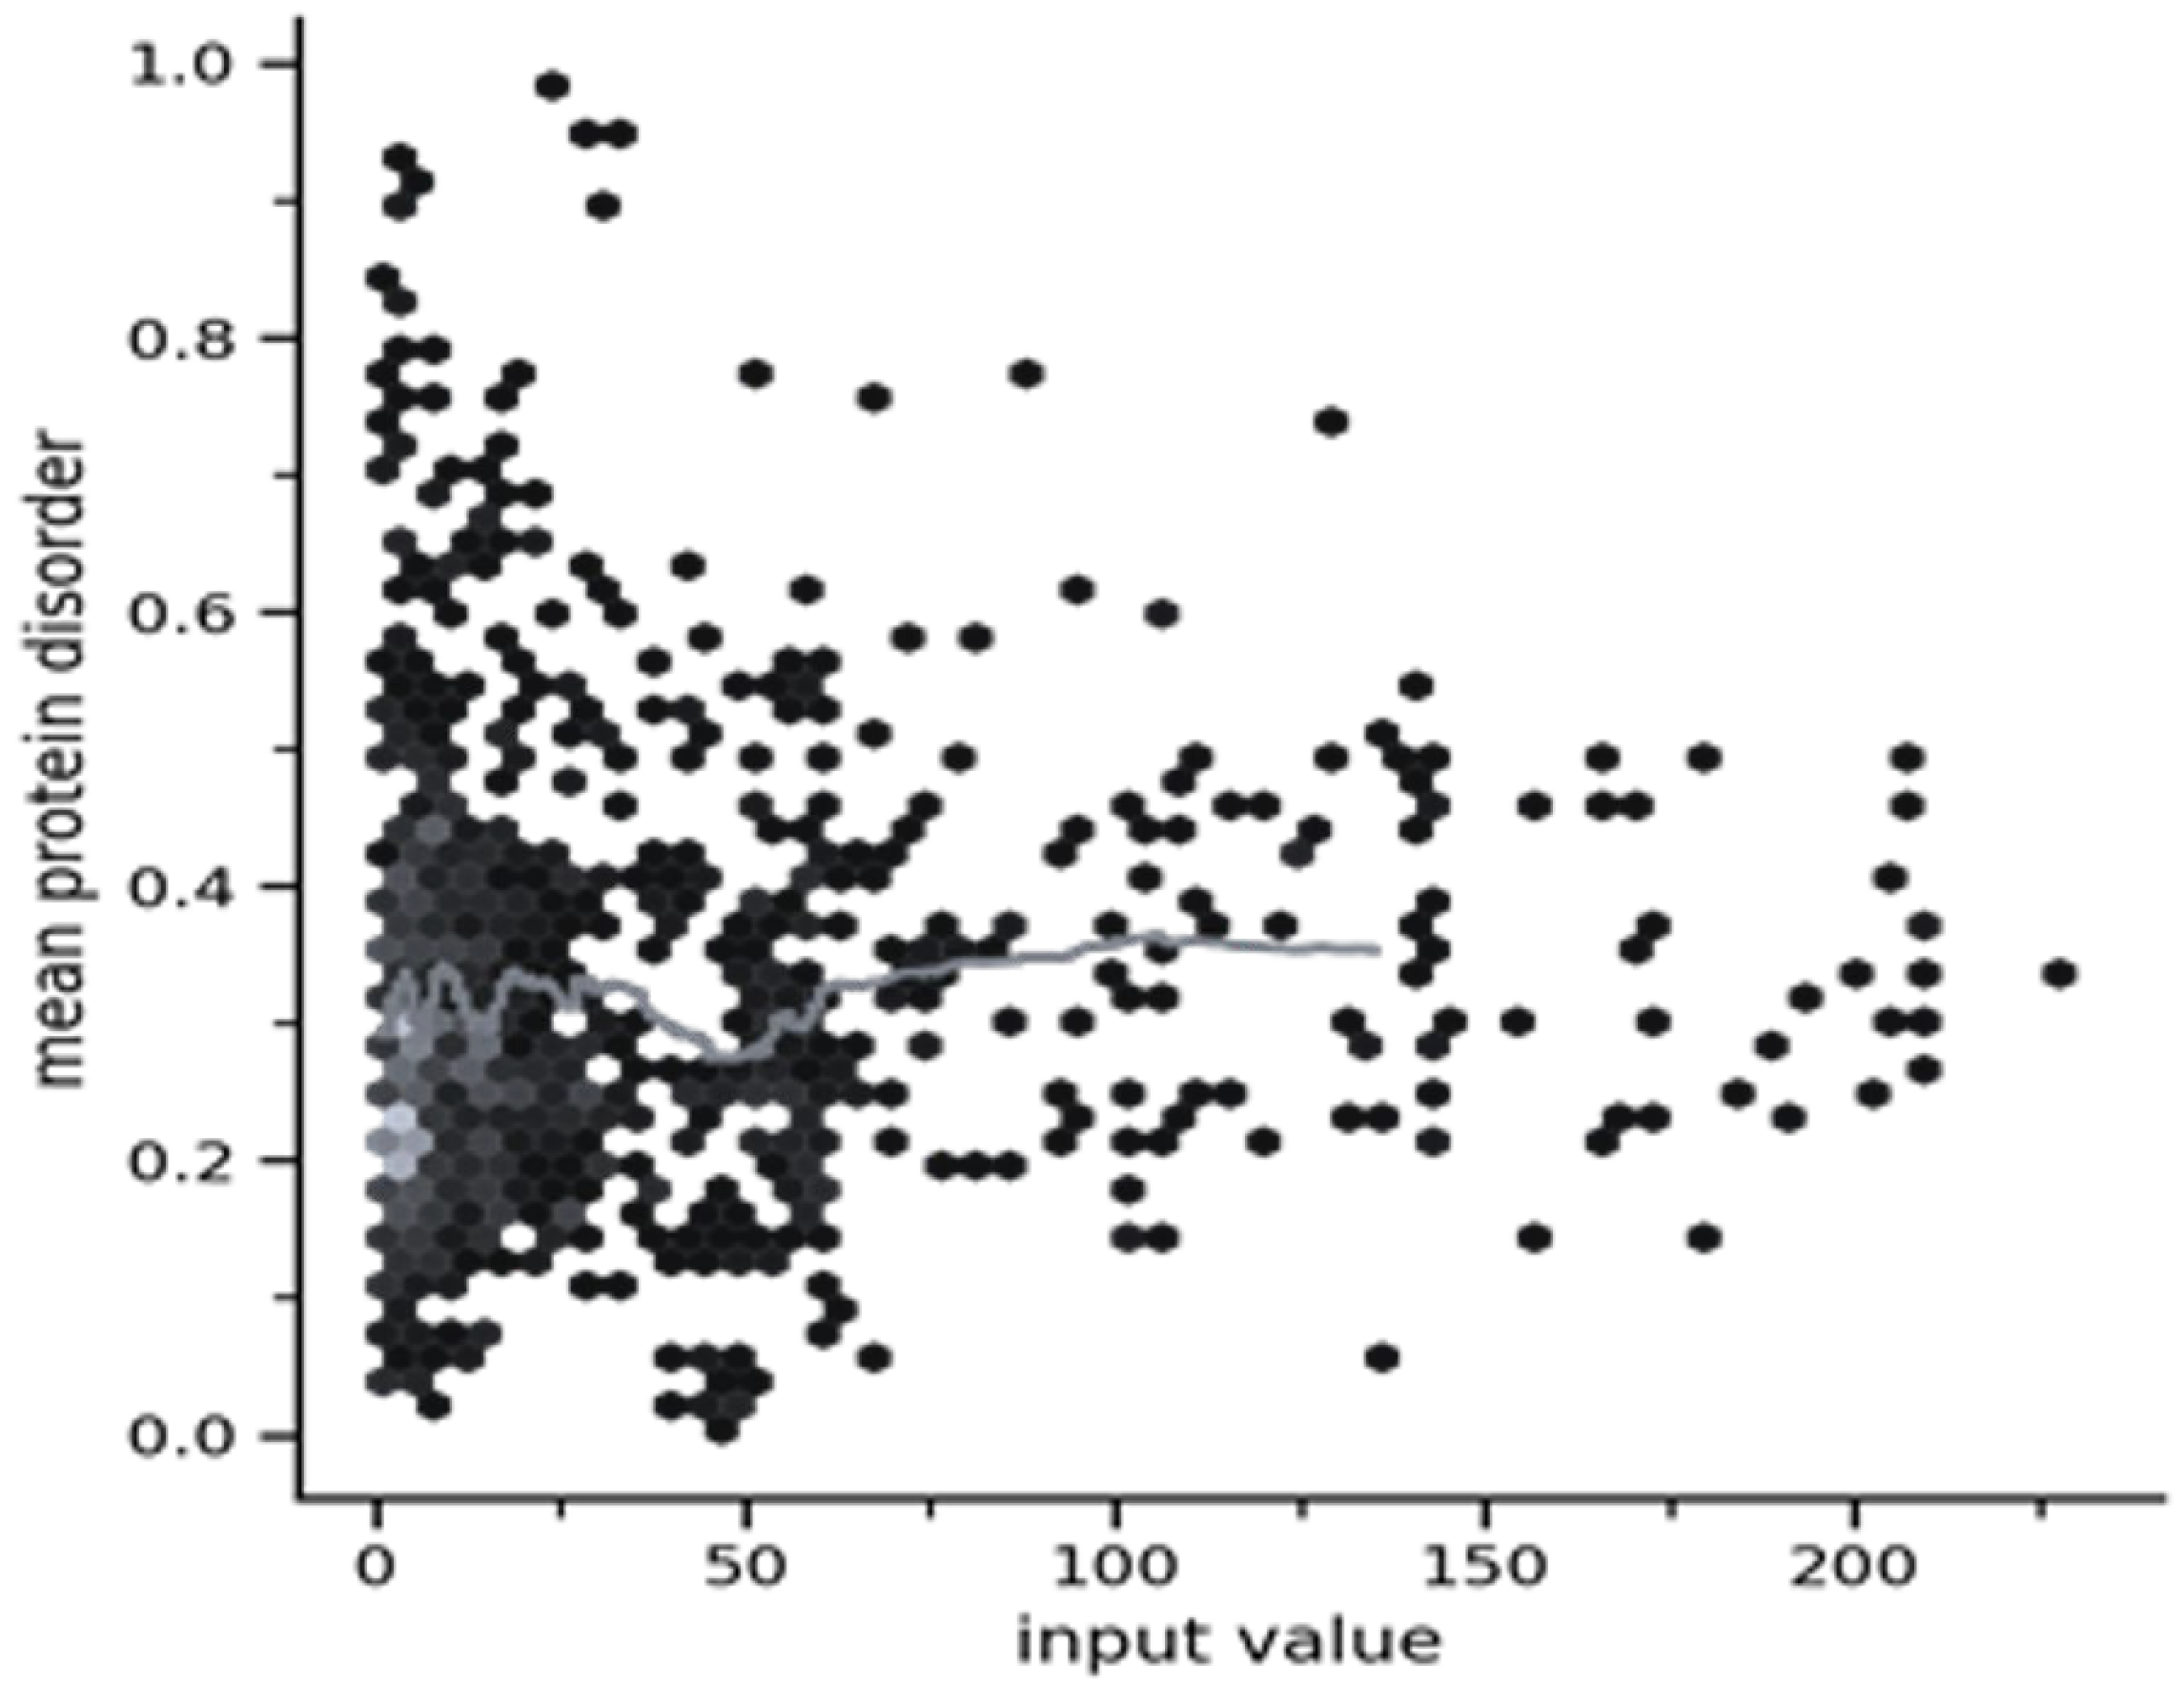
A question now arises: which structural property dominates the fitness of the interactome-1060? Certainly, each single protein-node has its own specific intrinsic properties, but which of these is the predominant one? We have considered many characteristics of the nodes (protein length, secondary structure, flexibility, intrinsic disorder) but one of them stands out above all. Protein-protein interactions within a cell are dynamic events which do not occur concurrently and in the same location. When molecules came together, they form complexes, where structural disorder of motifs at the interface often mediates transient interactions. This creates transient multi-state complexes that are characterized by dynamic assortments of subunits. These diverse transient combinations also facilitate occurring different conformational states entropically driven [108]. Thus, the intrinsic disorder is the most critical features associated with transient interactions. Weakly interacting proteins show a fast dynamic bound-unbound equilibrium, which also includes interactions that are triggered by an effector molecule and stabilized by a conformational change. The 66% of signaling proteins involved in cellular functions with strong temporal variation of activity show a high probability of involving transient interactions [109]. Temporary interactions wield a significant influence in determining the hub behaviors [110]. Many hub-proteins with variable co-expression partners show transient binding at different times. While with high co-expression partners, they develop stable complexes [111]. This highlights the importance of the intrinsic structural disorder in protein-protein networks, but even that it underlies connectivity and controls how hub proteins interact. Figure 3 shows the average distribution of the intrinsic disorder existing in the interactome-1060 interactions.
Figure 3. - The plot shows the average distribution of the protein disorder of the associated proteins in interactome-1060. Pearson's r value: ‒0.1; Pearson's p-value: 0.0015; BP-R2: 0.062 (medium). The grey light line is the median. STRING computed disorder content from sequences. The measure of BP-R2 is based on checking how much the values of the specified trend property deviate from the mean. Its scale (from 0 to 1) follows a quadratic pattern and does not have a confidence measure associated with the BP-R2. As a result, STRING has included some thresholds and the value of 0.15 is medium.
Preprints 120198 g003
The plot shows that intrinsically disordered proteins, which have a disorder percentage greater than 30% and play a crucial role in interactions, account for about half of the total interactions. The disorder content is very large, but almost all proteins show disorder. However, disordered segments can give interactions even shorten. All high-ranked nodes have a disorder content between 20 and 40% [112]. STRING used the binned pseudo-R-squared (BP-R2), a measure developed by Lun et al. to quantify complex signaling relationships between two variables, to assess the goodness of the fit [113]. The idea is to capture relationships that may not have a high Pearson or classification correlation, but that show associations, which are non-trivial. The range between 0 and 70 degrees shows a concentration of proteins with a high intrinsic disorder content. This range contains many of the proteins with high fitness potential. Disorder-enriched hub and non-hub nodes show a higher number of links, also because of the higher number of targeting, catalytic and many types of PTM sites [114]. In conclusion, we can say that the protein disorder is prevalent among these proteins. This is the structural feature that dominates fitness, driving the connectivity within the interactome-1060.

2.3.5. Centralities Based Analysis of the Interactome-1060
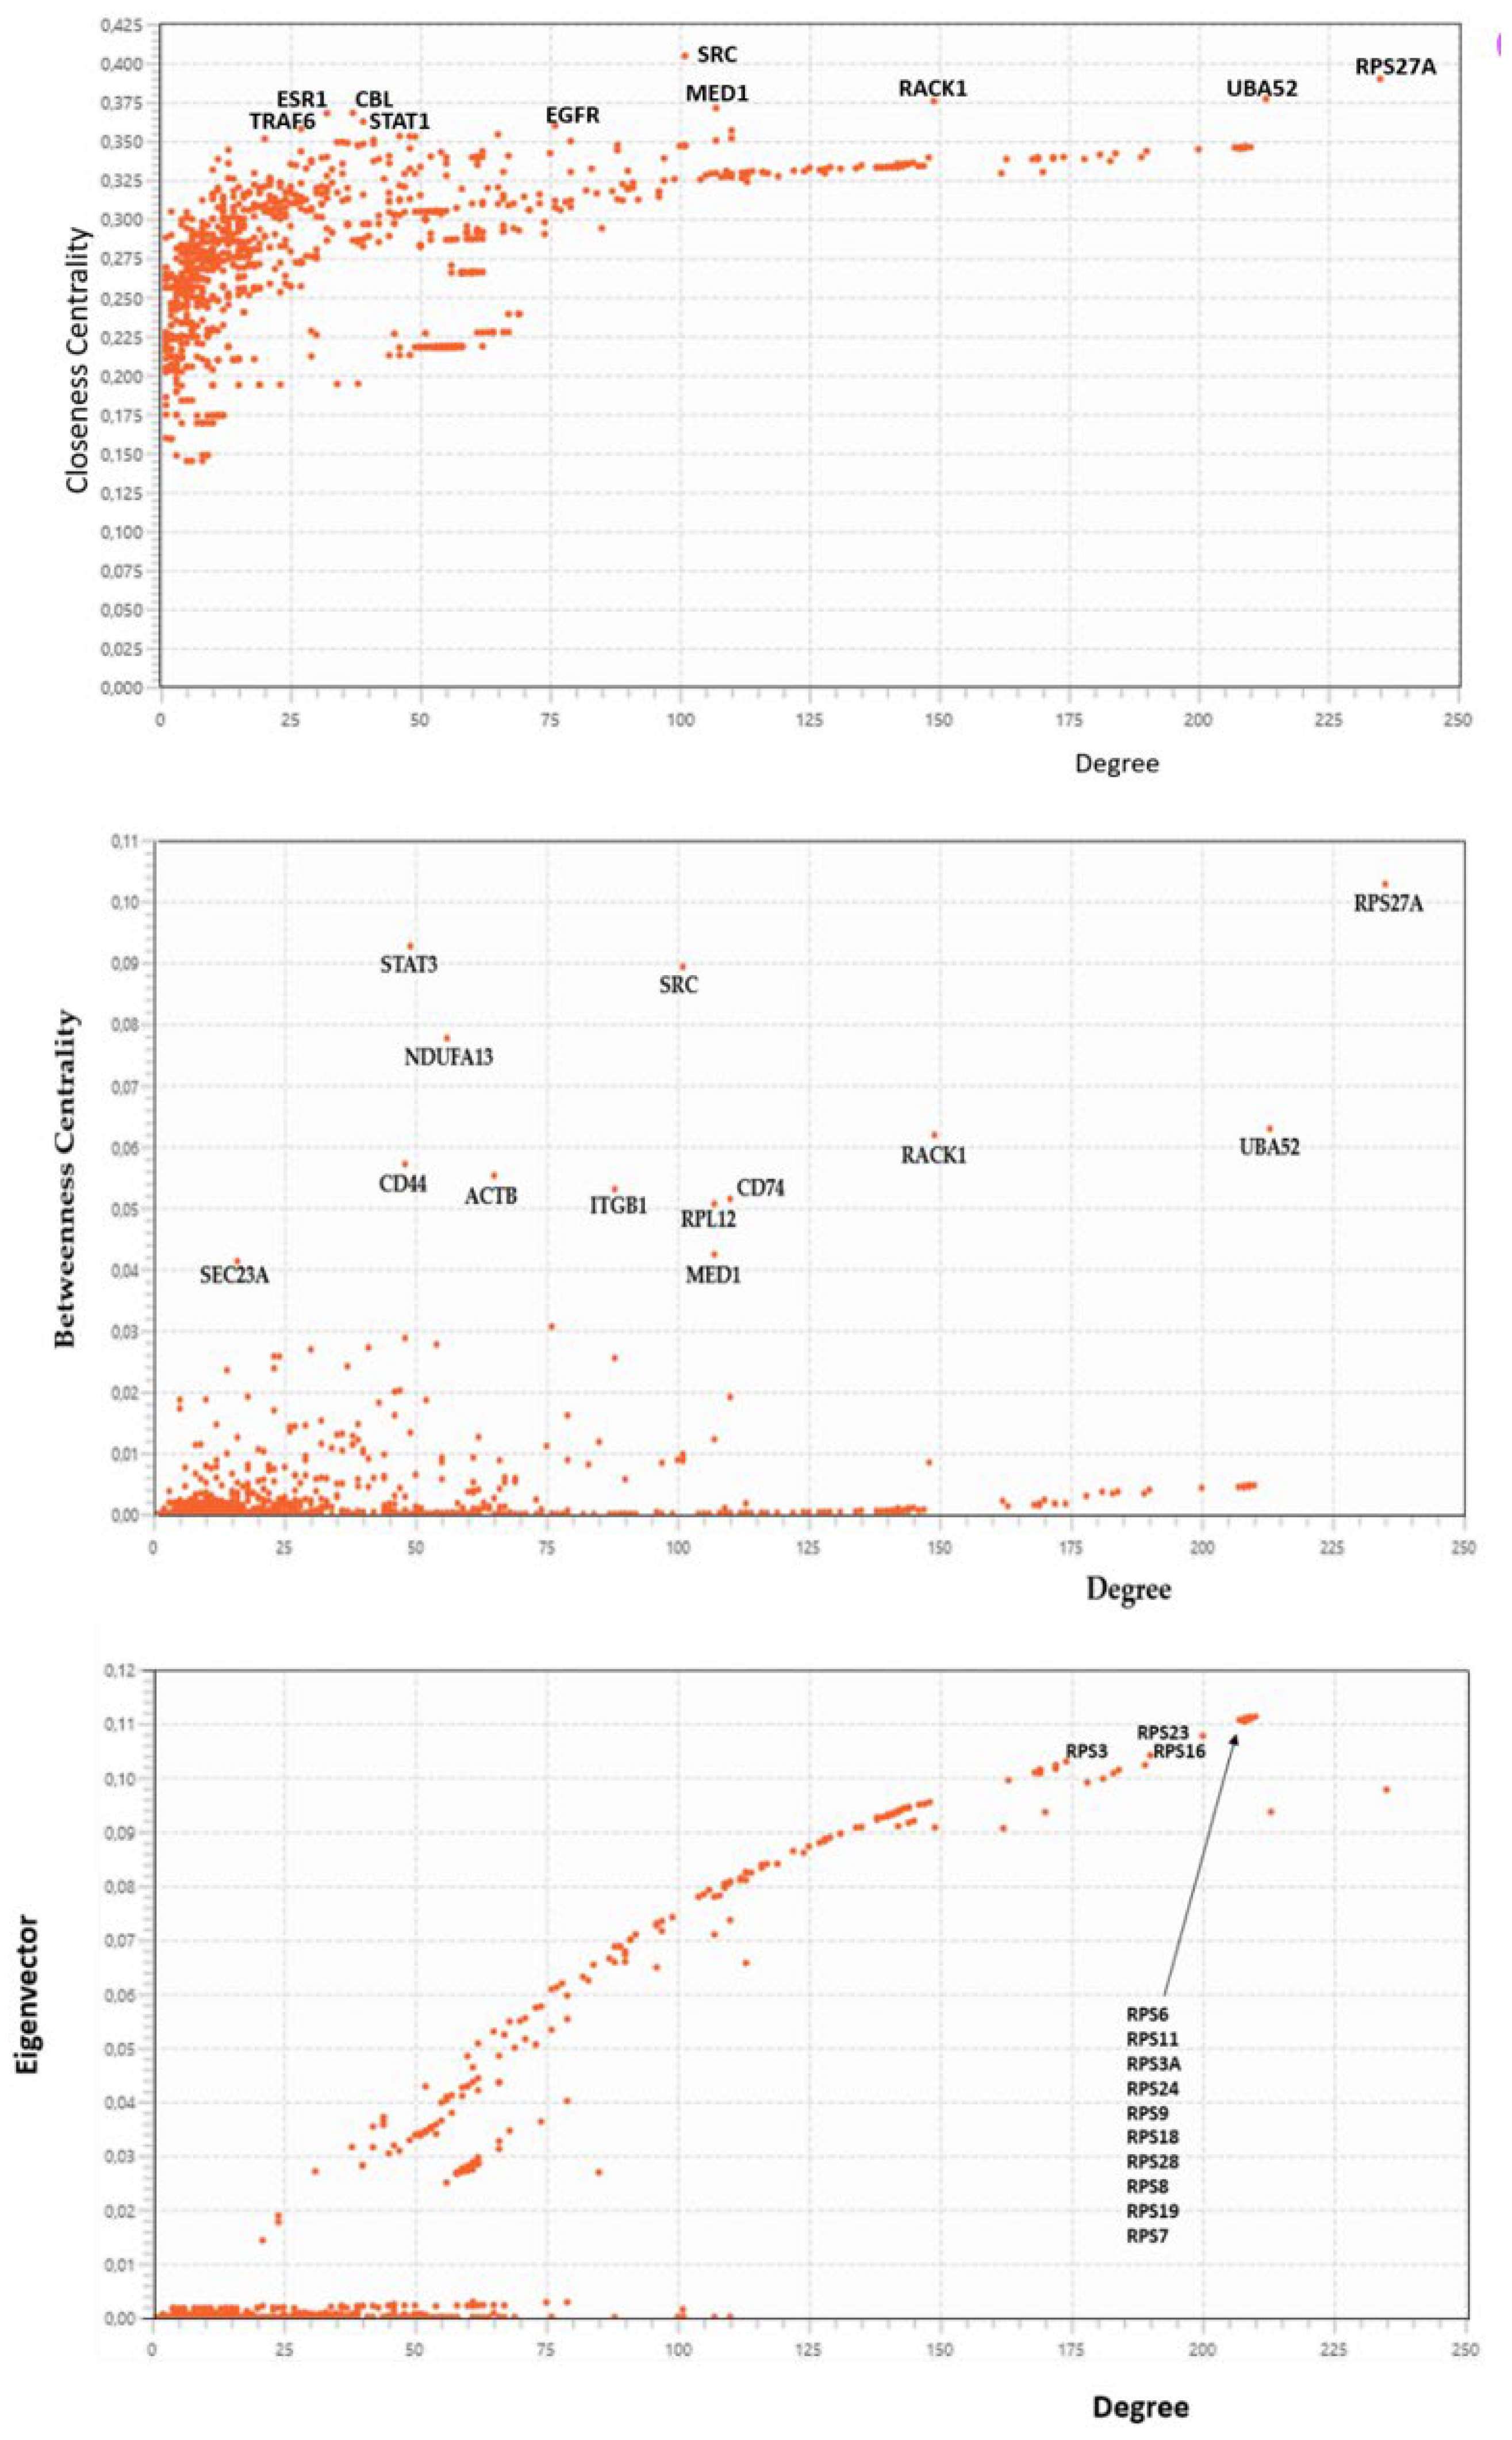
Topological analyses applied to protein networks show that some parameters such as Connectivity degree (k), betweenness centrality (BC), closeness centrality (CC), eigenvector centrality (EC), and eccentricity are crucial parameters of nodes [115]. They are indicators of centrality because assigning rankings to nodes within the graph; they characterize the most important vertices. Each centrality measure assigns a centrality value to each node in a network and captures different aspects of what it means for a node to be important in that graph. High-ranking target search, identifying suitable nodes for characterization, is a critical step in annotating functional processes and understanding their molecular basis. The priority is to narrow down the most important nodes. After defining the broad interactome induced by S1 (interactome-1060) and calculating its properties, it is useful to identify hubs and bottlenecks [116].
We define as hubs the top 10% of the nodes in the high-confidence protein interactome based on their node degree (the number of interactions associated with a node). While we consider another top 10% of the nodes, ranked by betweenness centrality and closeness centrality (BCC), as bottlenecks. Betweenness centrality is an indicator of a node’s centrality in a network. It is equal to the number of the shortest paths from all vertices to all others that pass through that node. While Closeness centrality calculates the average distance of all the shortest paths between a node and every other node within a network. Thus, nodes with a high closeness score have the shortest distances to all other nodes. Betweenness and closeness are a way of detecting bottleneck nodes that can spread information through a graph, even if they do not always have very high degrees [117,118,119,120]. Eigenvector centrality of a graph is a measure of the influence of a node in a connected network. Relative scores are given to every node within the network, understanding that connections to nodes with higher scores have a more substantial influence on their own score than connections to nodes with lower scores. A high eigenvector score shows a node has connections to many nodes that themselves have a high score. The resulting information allows us to identify key nodes in terms of connectivity relevance in the interactome, thus suggesting very similar and super-imposable results to those of node degree [121,122]. We know that nodes with large k are central because they might correspond to disease-causing genes/proteins, whereas bottleneck nodes are vital since they serve as a crossroads in major signaling "highways" or overpass across these "highways". We focused on the hubs and bottlenecks that were central to our PPI network, identifying these key proteins and considering their sub-networks as the backbone of S1 induced topology [123,124].
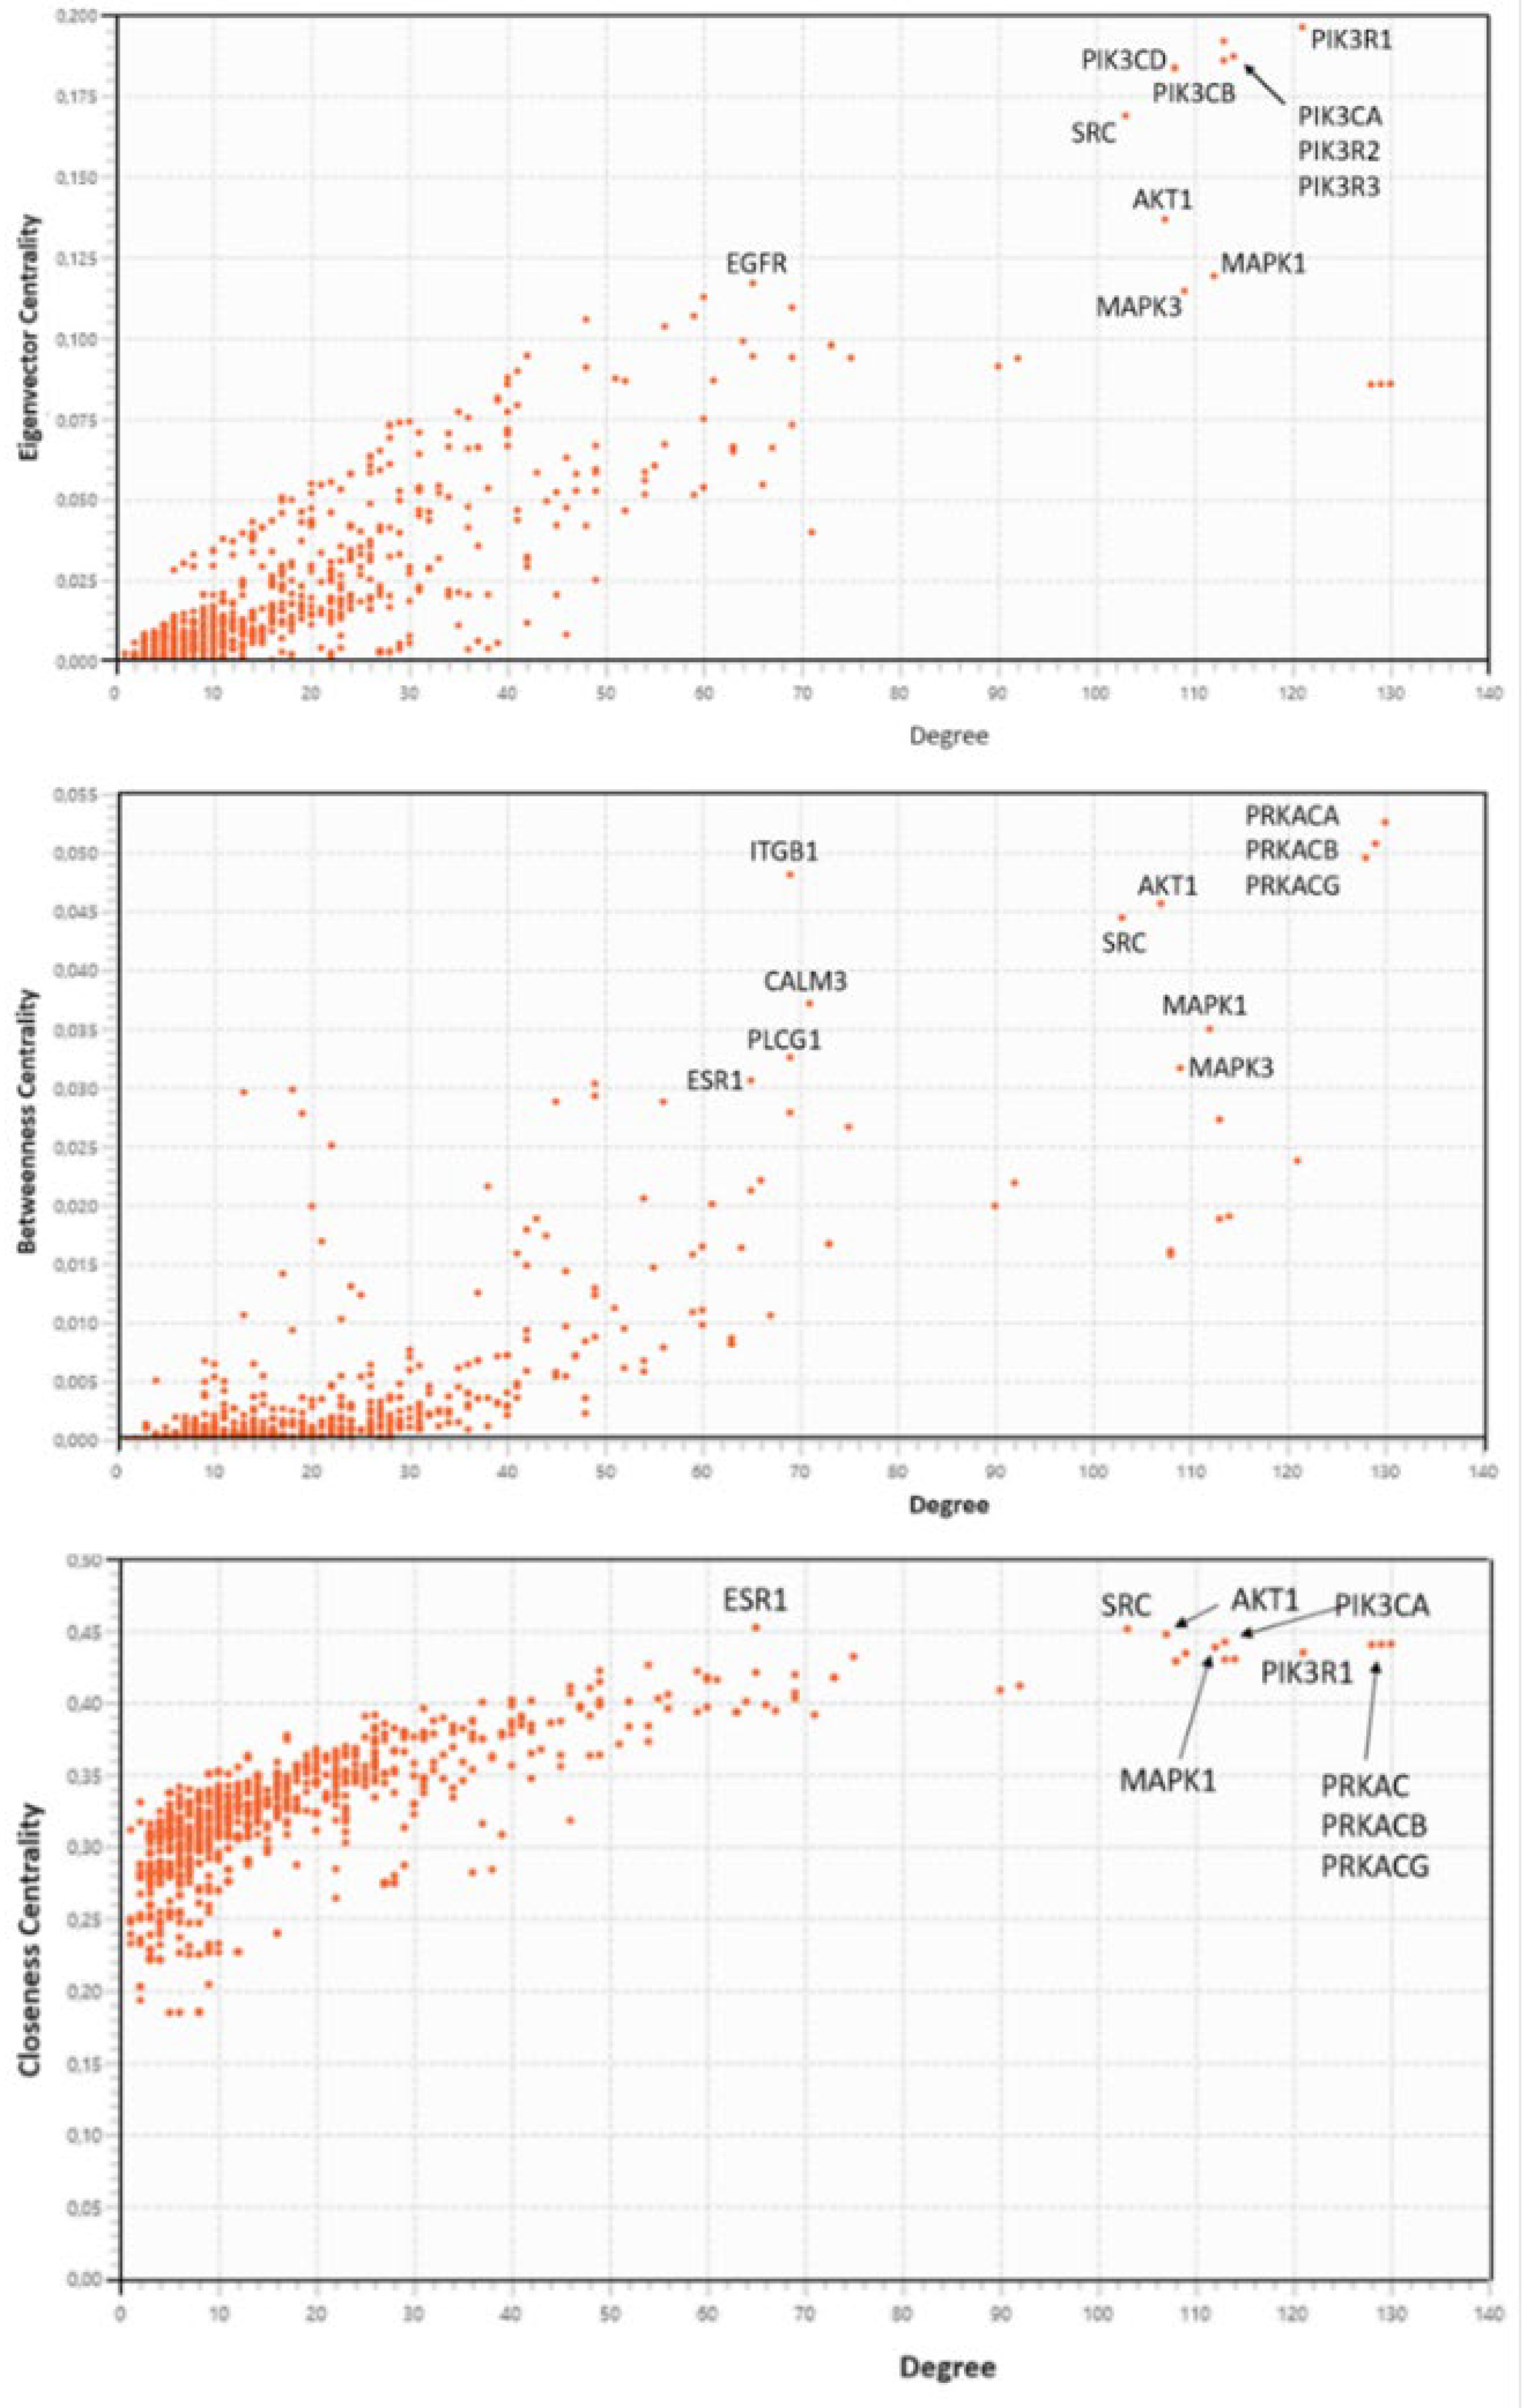
The Figure 4 reveals the node distributions according to their centralities as calculated by Cytoscape. We report the protein names for comparing them with the results in Table 3.
Figure 4. The figure shows the centrality distribution plots of interactome-1060: Closeness Centrality (top), Betweenness Centrality (middle) and Eigenvector (bottom). The Network Analyzer (version 4.5.0) on Cytoscape calculated the topological parameters to identify the node values [25,80,81]. The calculated distributions originate from the interactome.
Preprints 120198 g004
We extracted the 26 nodes with the highest centrality values from each distribution. They represent the candidates for the analysis of the topological properties. Both Closeness and Betweenness select the nodes with the best features as bottlenecks. While the eigenvector distribution shows the protein nodes with the highest connectivity comparable to high-degree HUBs. We can find the 26 values for each centrality in the Excel file 1, sheet 3. In the comparisons between the various sets (Betweenness vs Closeness and Eigenvectors vs Degree), we selected only nodes in common between both compared sets. This resulted in fewer bottlenecks. But even though the total number of selected nodes is lower, we created very significant sets of HUBs and bottlenecks (Table 3).
Table 3. High-ranked Hub and Bottleneck nodes of interactome-1060.
HUB nodes Degree Bottleneck Degree
RPS6 210 RPS27A 235
RPS11 209 UBA52 213
RPS3A 209 RACK1 149
RPS24 209 CD74 110
RPS9 209 MED1 107
RPS18 208 SRC 101
RPS28 209 EEF1A1 88
RPS8 208 EGFR 76
RPS19 207 ACTB 65
RPS7 208 CD44 48
RPS23 200 STAT3 49
RPS16 190 CBL 37
RPS3 174
RPS15 172
RPS5 189
FAU 172
RPS13 184
RPS21 169
RPS17 169
RPS14 183
RPS27 181
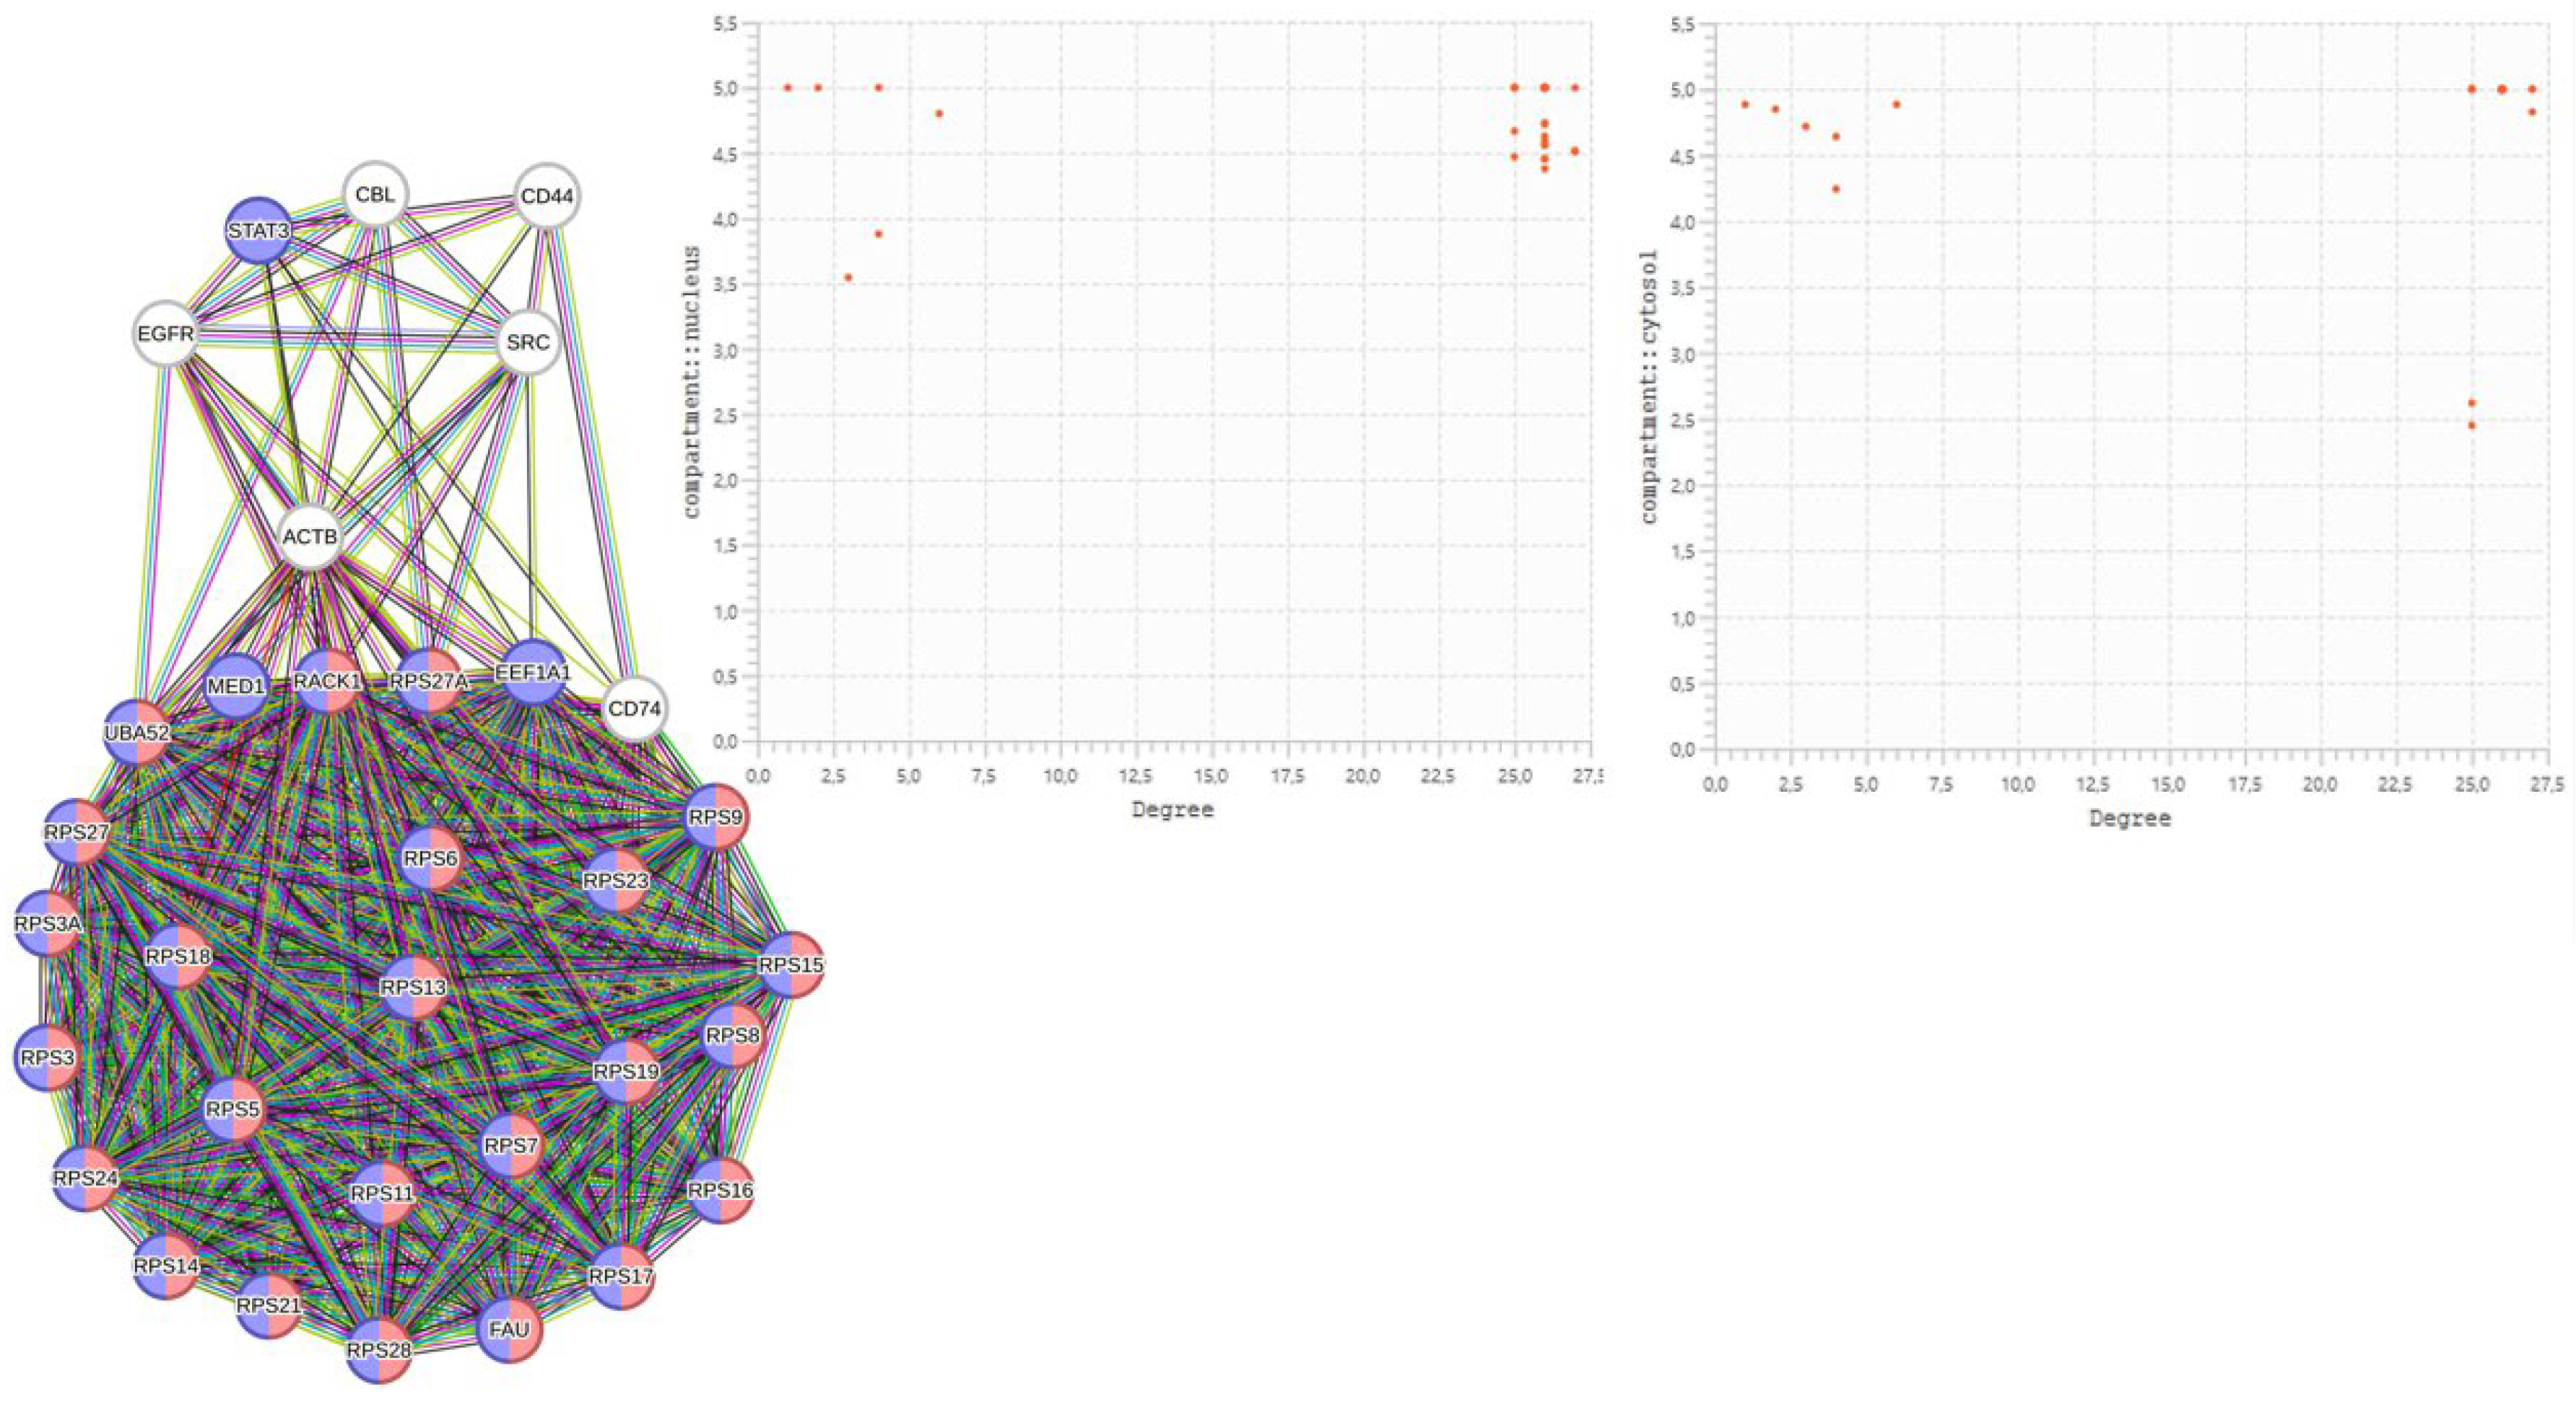
We computed hub and bottleneck nodes based on relevant topological parameters, but there is no consensus in the literature on a defined threshold to identify how many nodes should be hubs or bottlenecks in a protein network, because the possible and used criteria are too numerous and sometimes arbitrary [124]. However, these nodes should represent the backbone of the basic connectivity that should favor a balanced architecture of the entire network with specific functional aspects. Therefore, we have gathered the selected HUB and Bottleneck nodes in a group of 33 nodes (3.1%). This group (Table 3), besides the topological characteristics, should also show evidence of reliable interactions, forcing the network into a hub and spoke organization. We expect that, for the topological functions they perform, they should closely connect to each other, because they all interact with the same dominant hub. In this regime hub and spoke configuration show characteristics of disassortative networks [66,67].
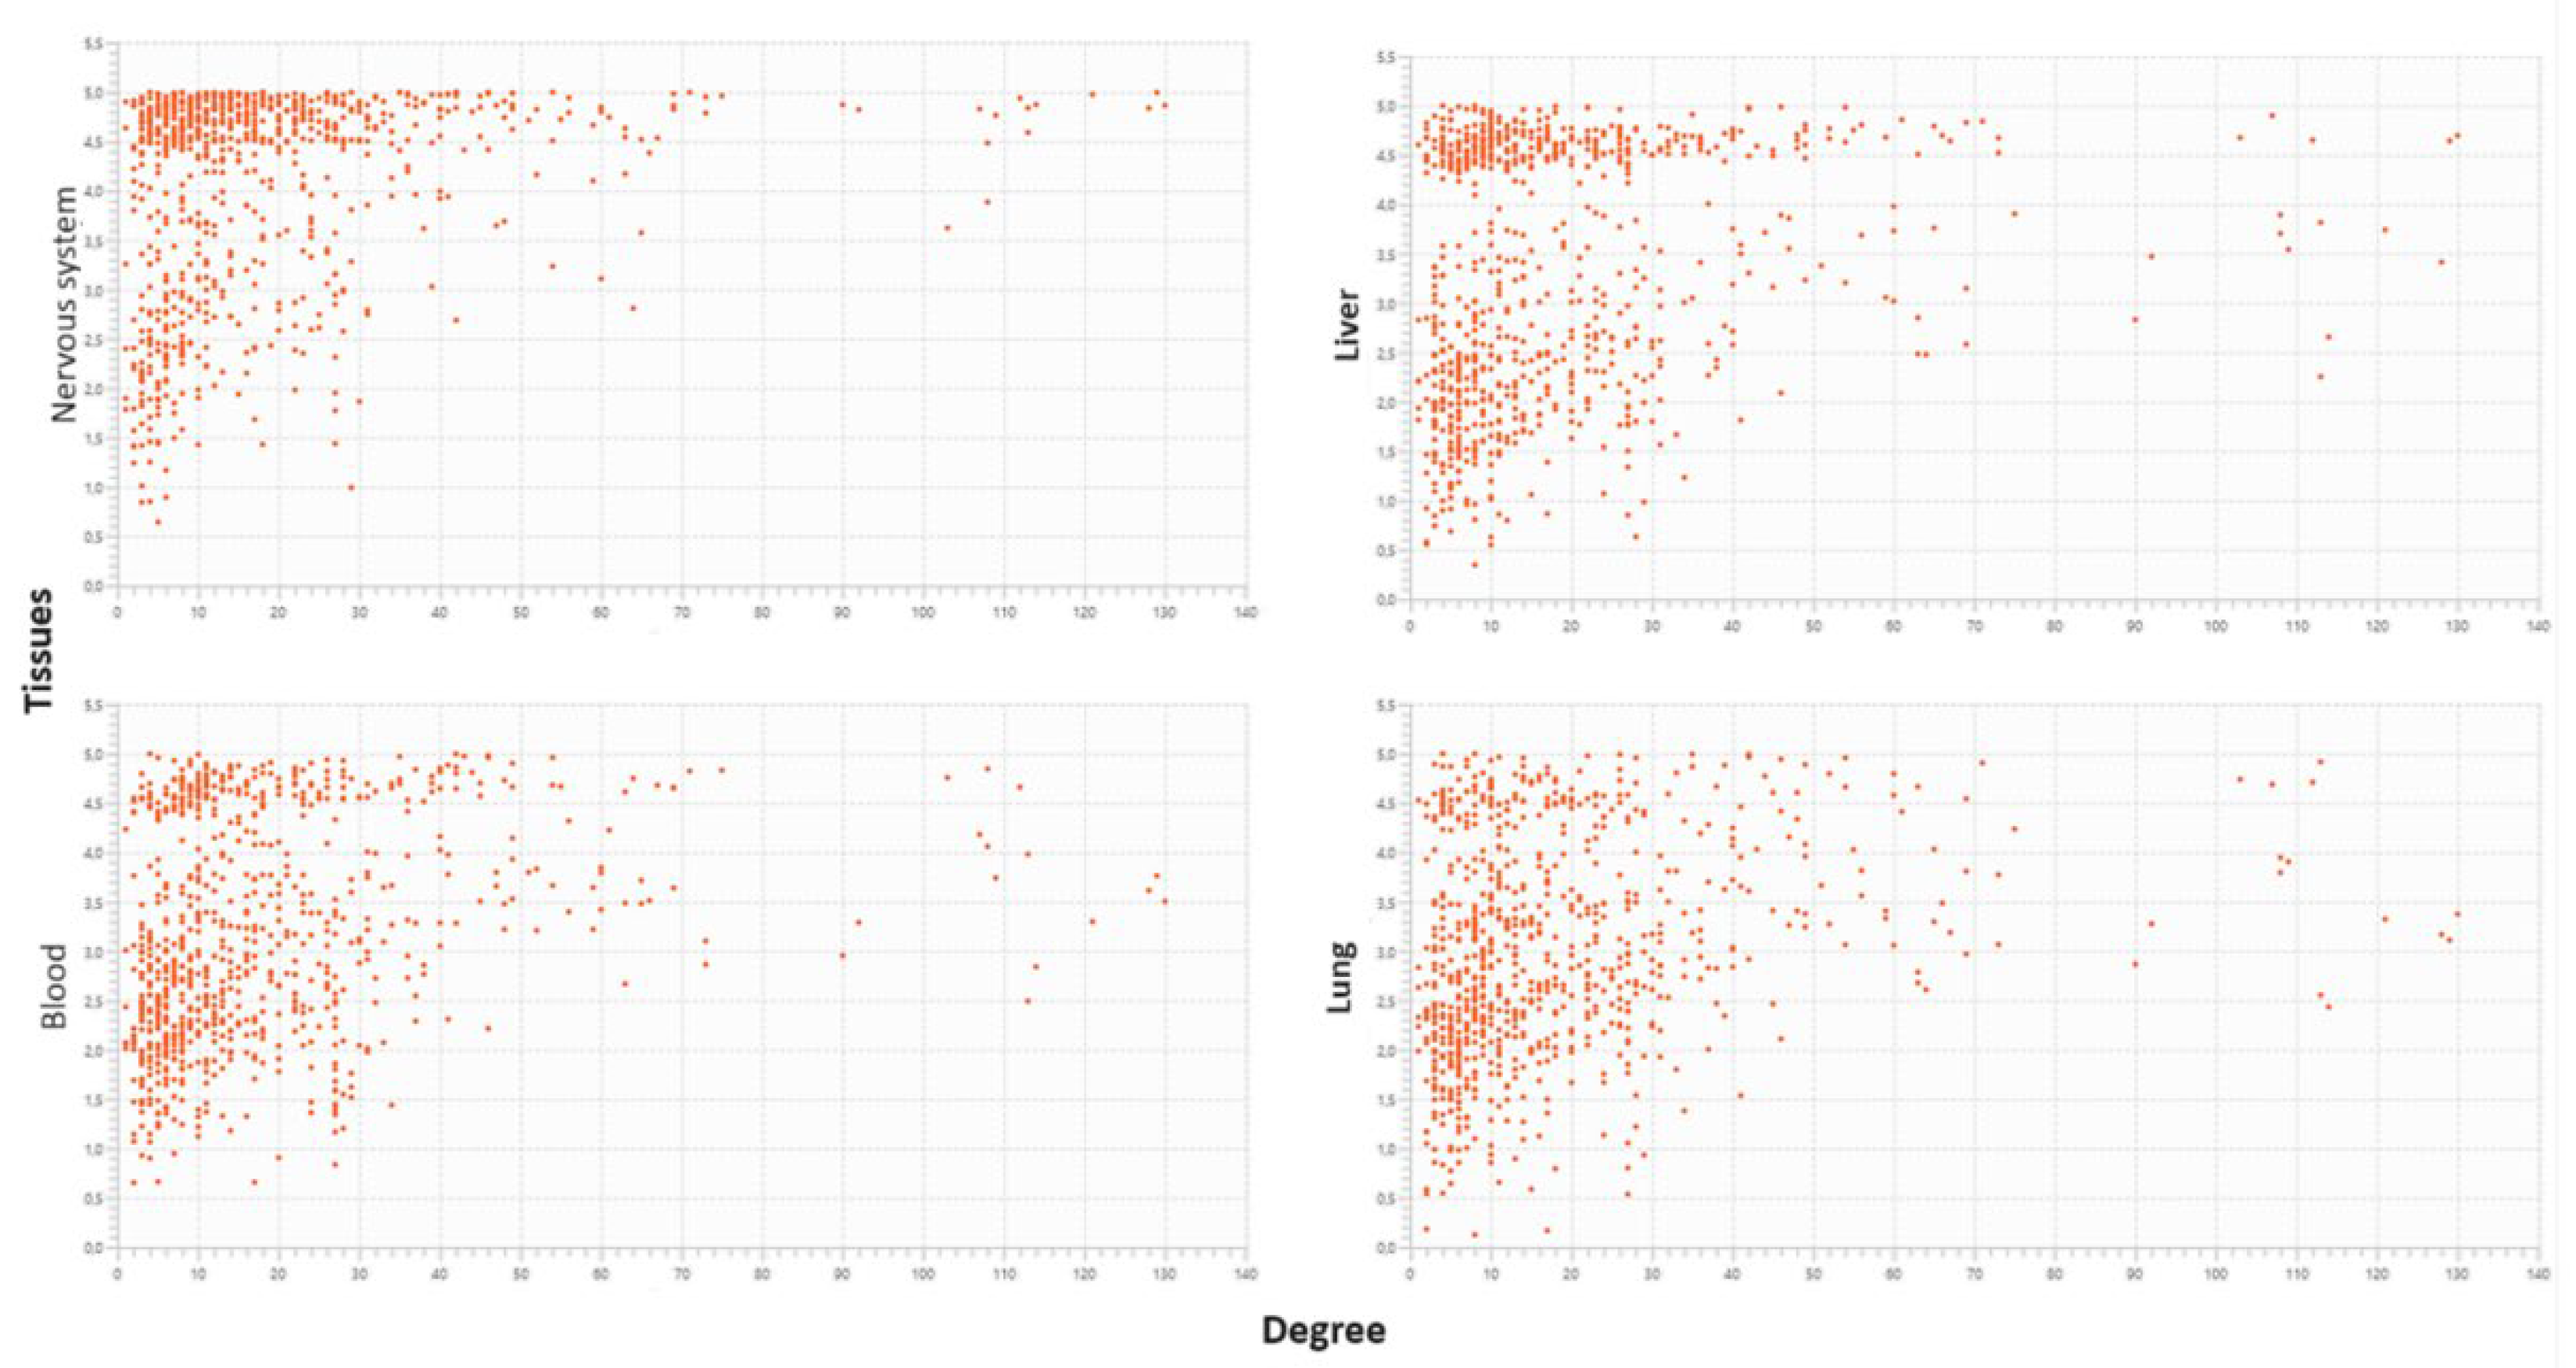
A look at the two plots in Figure 5 reveals that many of these high-ranked nodes (Hubs and Bottlenecks) concentrate in the nucleus and cytoplasmic system. This agrees with all activities related to viral translation. Both categories of nodes have significant biological importance, as they represent key connections and critical points of interaction. Bottleneck nodes possess a high centrality of intermediation, as they connect many parts of the network, influencing the information flow. The high scores between 4.5 and 5 justify these attributions.
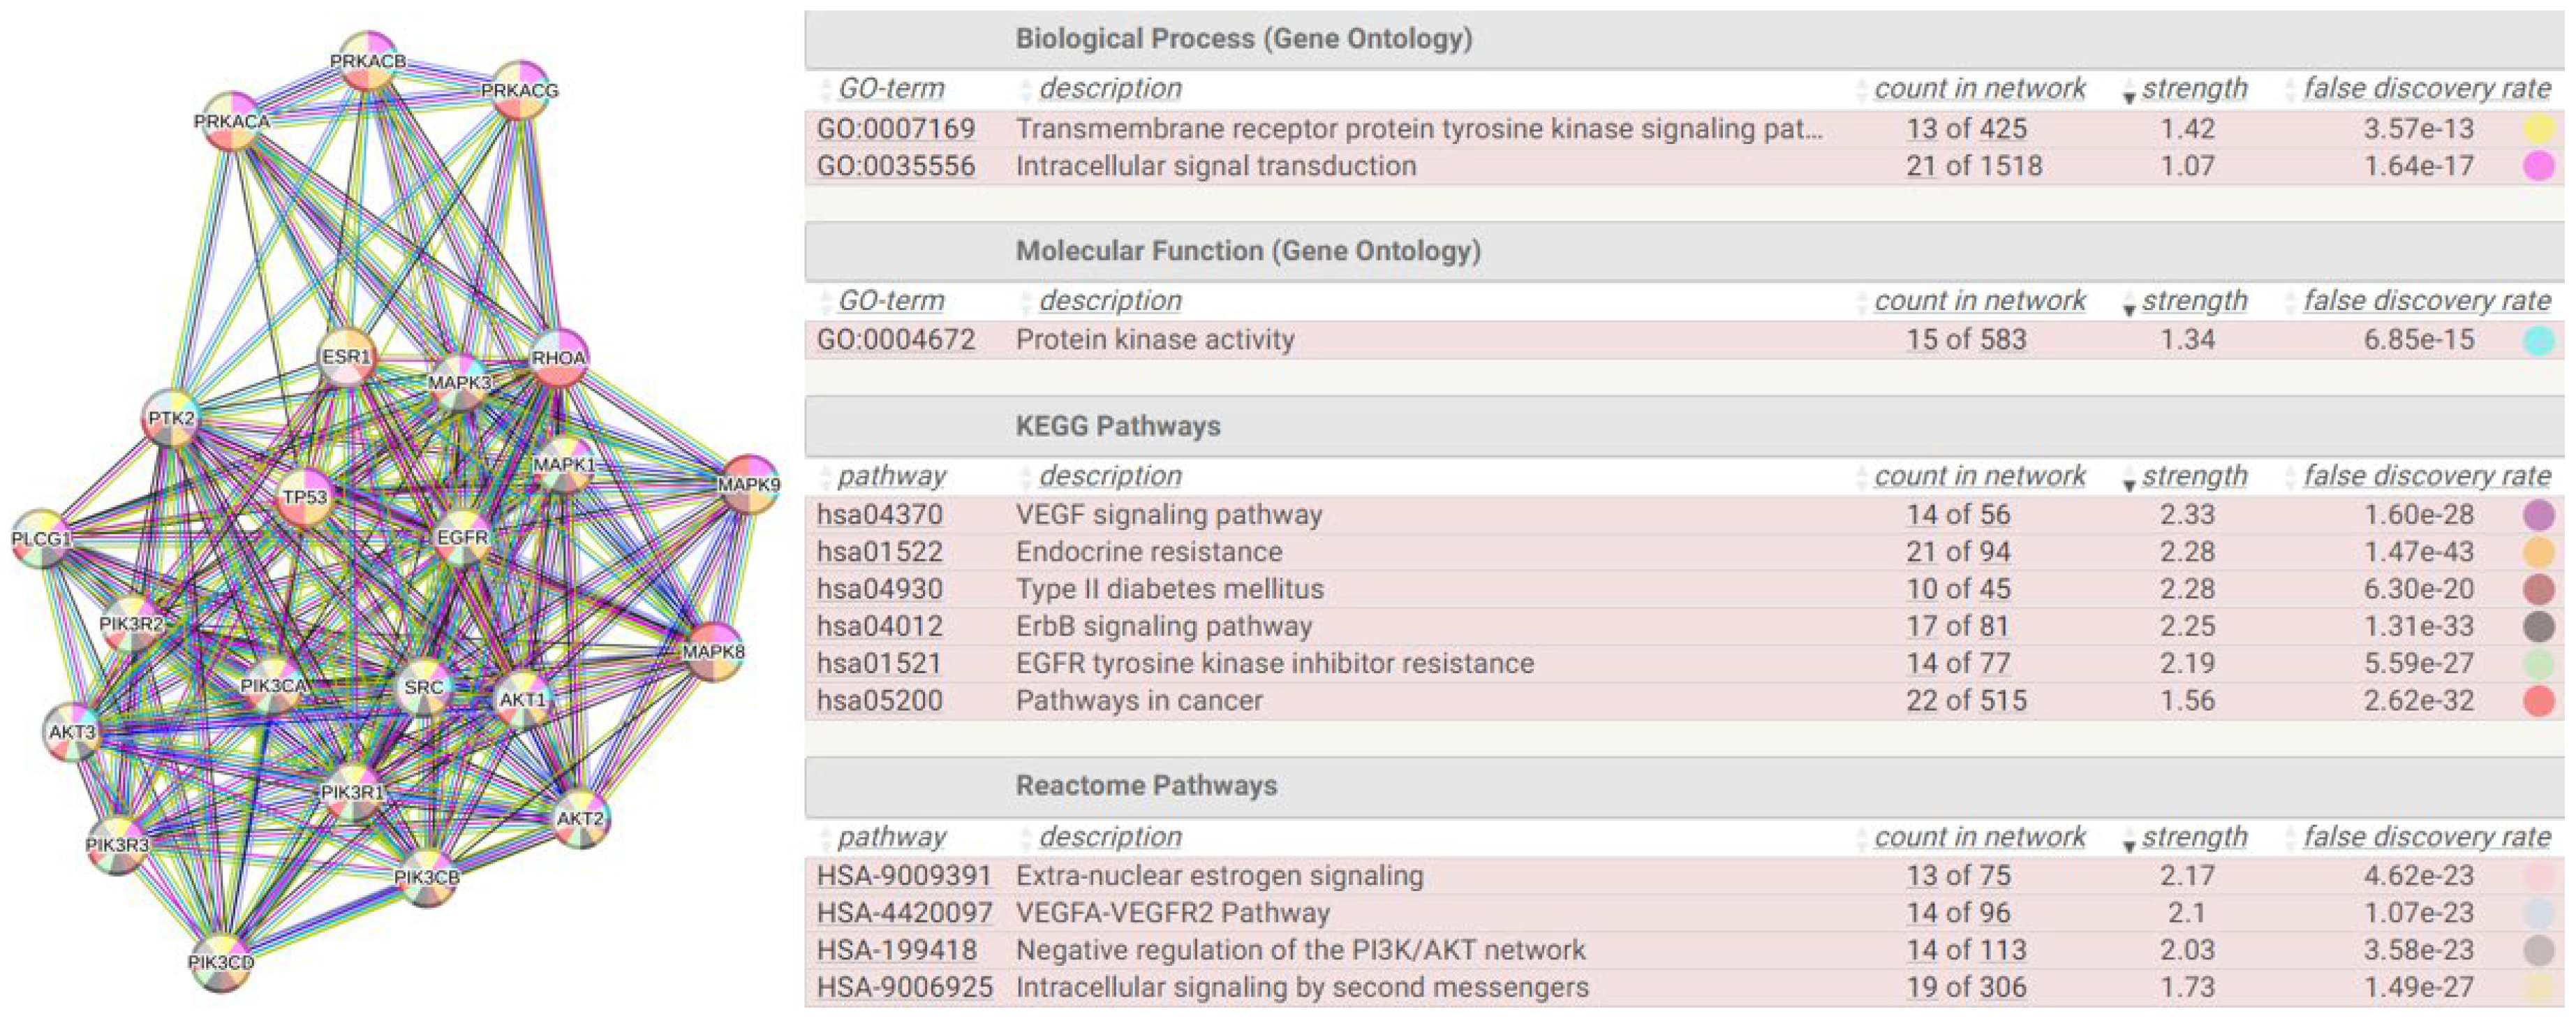
Figure 5. The graph shows the HUB-SPOKE pattern (left) generated by the selected nodes. The red color shows proteins involved in cytoplasmic translations (GO:0002181; strength: 2.07 and p-value: 6.81x10−41), while the blue one in gene expression (GO:0010467; strength: 0,89 and p-value: 4.00x10⁻¹⁸). STRING calculated the graph. Plots on the right show the distributions of nodes in the cellular compartments. These two classes of nodes operate in the cytosol and nucleus, some in both. Calculation performed by the Cytoscape.
Preprints 120198 g005
The spoke-hub architectural pattern (for an operational explanation see: https://cloud.google.com/architecture/deploy-hub-spoke-vpc-network-topology) expects the core system with high connectivity to comprise HUB nodes, while the well-connected bottleneck nodes are located outside. In our case (graph on the left), some bottleneck nodes (UBA52, MED1, RPS27A, RACK1, CD74, FAU, EF1A1) operate at the interface linking the remaining nodes (SRC, ACTB, STAT3, CBL, CD44, EGFR). In the graph, the colors identify the main overall functions they manage together. The red color shows cytoplasmic activities while the blue refers to overall nuclear ones. As we can note, all hub nodes operate in both compartments. Obviously, the graph highlights only the direct connectivity between these nodes because, in the complete network, each HUB, or Bottleneck node, manages many other “normal” nodes. White bottlenecks mediate many signaling activities. ACTB is involved in cytoskeletal control (GO: 0005925, focal adhesion, p-value 4.07✕10‒21).

2.4.1. Justifications for a One-to-One Study

The principles governing immune responses operate at the organ-scale. Propagation of immune signaling between organs shows inter-organ mechanisms of protective immunity mediated by soluble and cellular factors [125] that transcend organ boundaries [126]. Cellular factors such as memory T cells can patrol organs and infected tissue [127,128]. Changes in tissue gene expression following vaccination have also highlighted immune processes that operate at the organ scale through a protective network [129]. Recent work shows that vaccination, like repeated infections, provides protection even in very distant tissues. [130,131]. Researchers have used this logic to study shared and tissue-specific expression patterns [132,133] and their correlation with disease [134,135]. All this suggests isolating the biological activities one by one, specific to the S1 protein. Both during infection and vaccination, both events have in common the encoded information (mRNA). Therefore, in both cases, the mRNA must use the same biosynthesizing nano-machines and the decoded protein, when acting alone, should take part in the same cellular processes present in the human host.

2.5.1. Reverse Engineering

Reverse engineering in biology applies an engineering concept, that of dismantling a process to understand it and discover the biological strategy. Thus, it is often used to discover the design principles of a biological system when the relationships between microscopic and higher-level processes are degenerate (many-to-many or one-to-many). It addresses the understanding of a complex system when the nonlinear relationships between the system's capabilities and its deep molecular mechanisms change. This suggests its usefulness in analyzing a complex functional system, faced with limited a priori knowledge of its "design principles" [136]. At first glance, "disassembling to reassemble" may seem like a reductionist approach to systems biology. However, data-intensive biological fields use reverse engineering approaches to recognize nonrandom connectivity patterns and identify functional capabilities of the overall network architecture [137]. This enables a topological analysis that abstracts from the context of network connectivity to identify functional capabilities. It is an approach to understanding how certain components are wired to create a functional whole. The search for these design principles allows us to know lower-level causal details and becomes robust when integrated with external experimental data tested in vivo and which can therefore biologically validate an interaction as real [138].
Our goal is to understand whether, in the same system but with changed organizational features, S1 performs similar operations. Although the molecular mechanisms and the specific functions that are activated depend on specific metabolic parameters, it may be possible to identify parameter spaces for which the same functions hold. In a broader discussion, we should consider that groups of viral proteins contribute to enhance the virulence of the virus by attacking single human proteins with multiple interactions, but some also do so alone. This should not be surprising because we have already observed it in the liver within the covid [10]. SARS-CoV-2 shows a broad tissue tropism, although of varying degrees, perhaps greater than what clinicians can appreciate through observation. This tropism is, however, the expression of the steps necessary to progress the viral infection, even in phenotypically different individuals and represents a strategic adaptation to the host. This means that, to be successful in replication, the action of the virus depends not only on its virulence, favored by Spike's interactivity but also on the ability to adapt the strategy of the viral proteome to the specific metabolic landscape it encounters in the host. Among the main variables that the virus encounters are age, sex, nutritional status, and previous individual pathologies.
In the excel file 3 we show the overall results of the reverse engineering analysis. We checked one by one, all 1060 nodes of the interactome in figure 1 against the 25,521 interactions collected in our SHPID database [10]. These interactions derive from individual proteins encoded by the SARS-CoV-2 proteome and those of the human proteome, as reported in BioGRID.
This file shows that there are many multiple interactions of S1 together with other viral proteins (sheet 3). We also found many viral proteins that interact individually in a one-to-one manner with specific human proteins (sheet 2). They could be pharmacological targets. While many human proteins are apparently not involved in any viral activities. This result confirms our previous observations on covid [10]. Probably, proteins not involved control metabolic processes that are beneficial for both the virus and the human host. The most interesting observation (sheet 2) is a set of 27 unique one-to-one interactions of S1 with human proteins (ACE2, AGTR1, AKT2, APOE, ASGR1, AVPR1B, C1QB, C1QC, CD46, CFH, CFP, CLEC4M, COP1, CR2, DPP4, ESR1, F10, FLT1, L12RB1, ITGB6, LYPLA2, MBL2, NID1, SDC1, SDC2, SNCA, TLR4). Through these proteins we will try to understand in which functional processes they involve, with which human proteins, and whether these interactions could represent a functional framework exclusive to S1, or to the infection.
The multiple interactions refer to the attacks conducted by groups of viral proteins, including S1, against single human proteins. The file (sheet 3) lists 148 human proteins attacked in this way. A careful observation shows that the number of viral proteins attacking single human proteins is often considerable. An example of all, the gene EIF2S1, Eukaryotic Translation Initiation Factor 2 Subunit Alpha, encodes the protein IF2A_Human. This is a protein of 315 aa, with a mixed alpha/beta structure. It is a member of the eIF2 complex that functions in the early stages of protein synthesis by forming a ternary complex with GTP and initiator tRNA. 19 viral proteins (nsp1, nsp3, nsp4, nsp5, nsp6, nsp13, nsp14, E, M, N, S, ORF10, ORF3a, ORF3b, ORF6, ORF7b, ORF7a, ORF8, ORF9b) attack this protein. Given its small size, like that of the ternary complex itself, it is impossible for there to be enough surface space for the interactions of 19 proteins concurrently. This means that the interactions, although all brief and momentary, occur at different times. However, without the time sequence, it is impossible to define the actual functional mechanism affected by these interactions (even without wanting to consider the “where”). On this basis, it once again seems useless to define an overall mechanism through chronologically undefined single interactions.

2.6.1. The Interactome-814

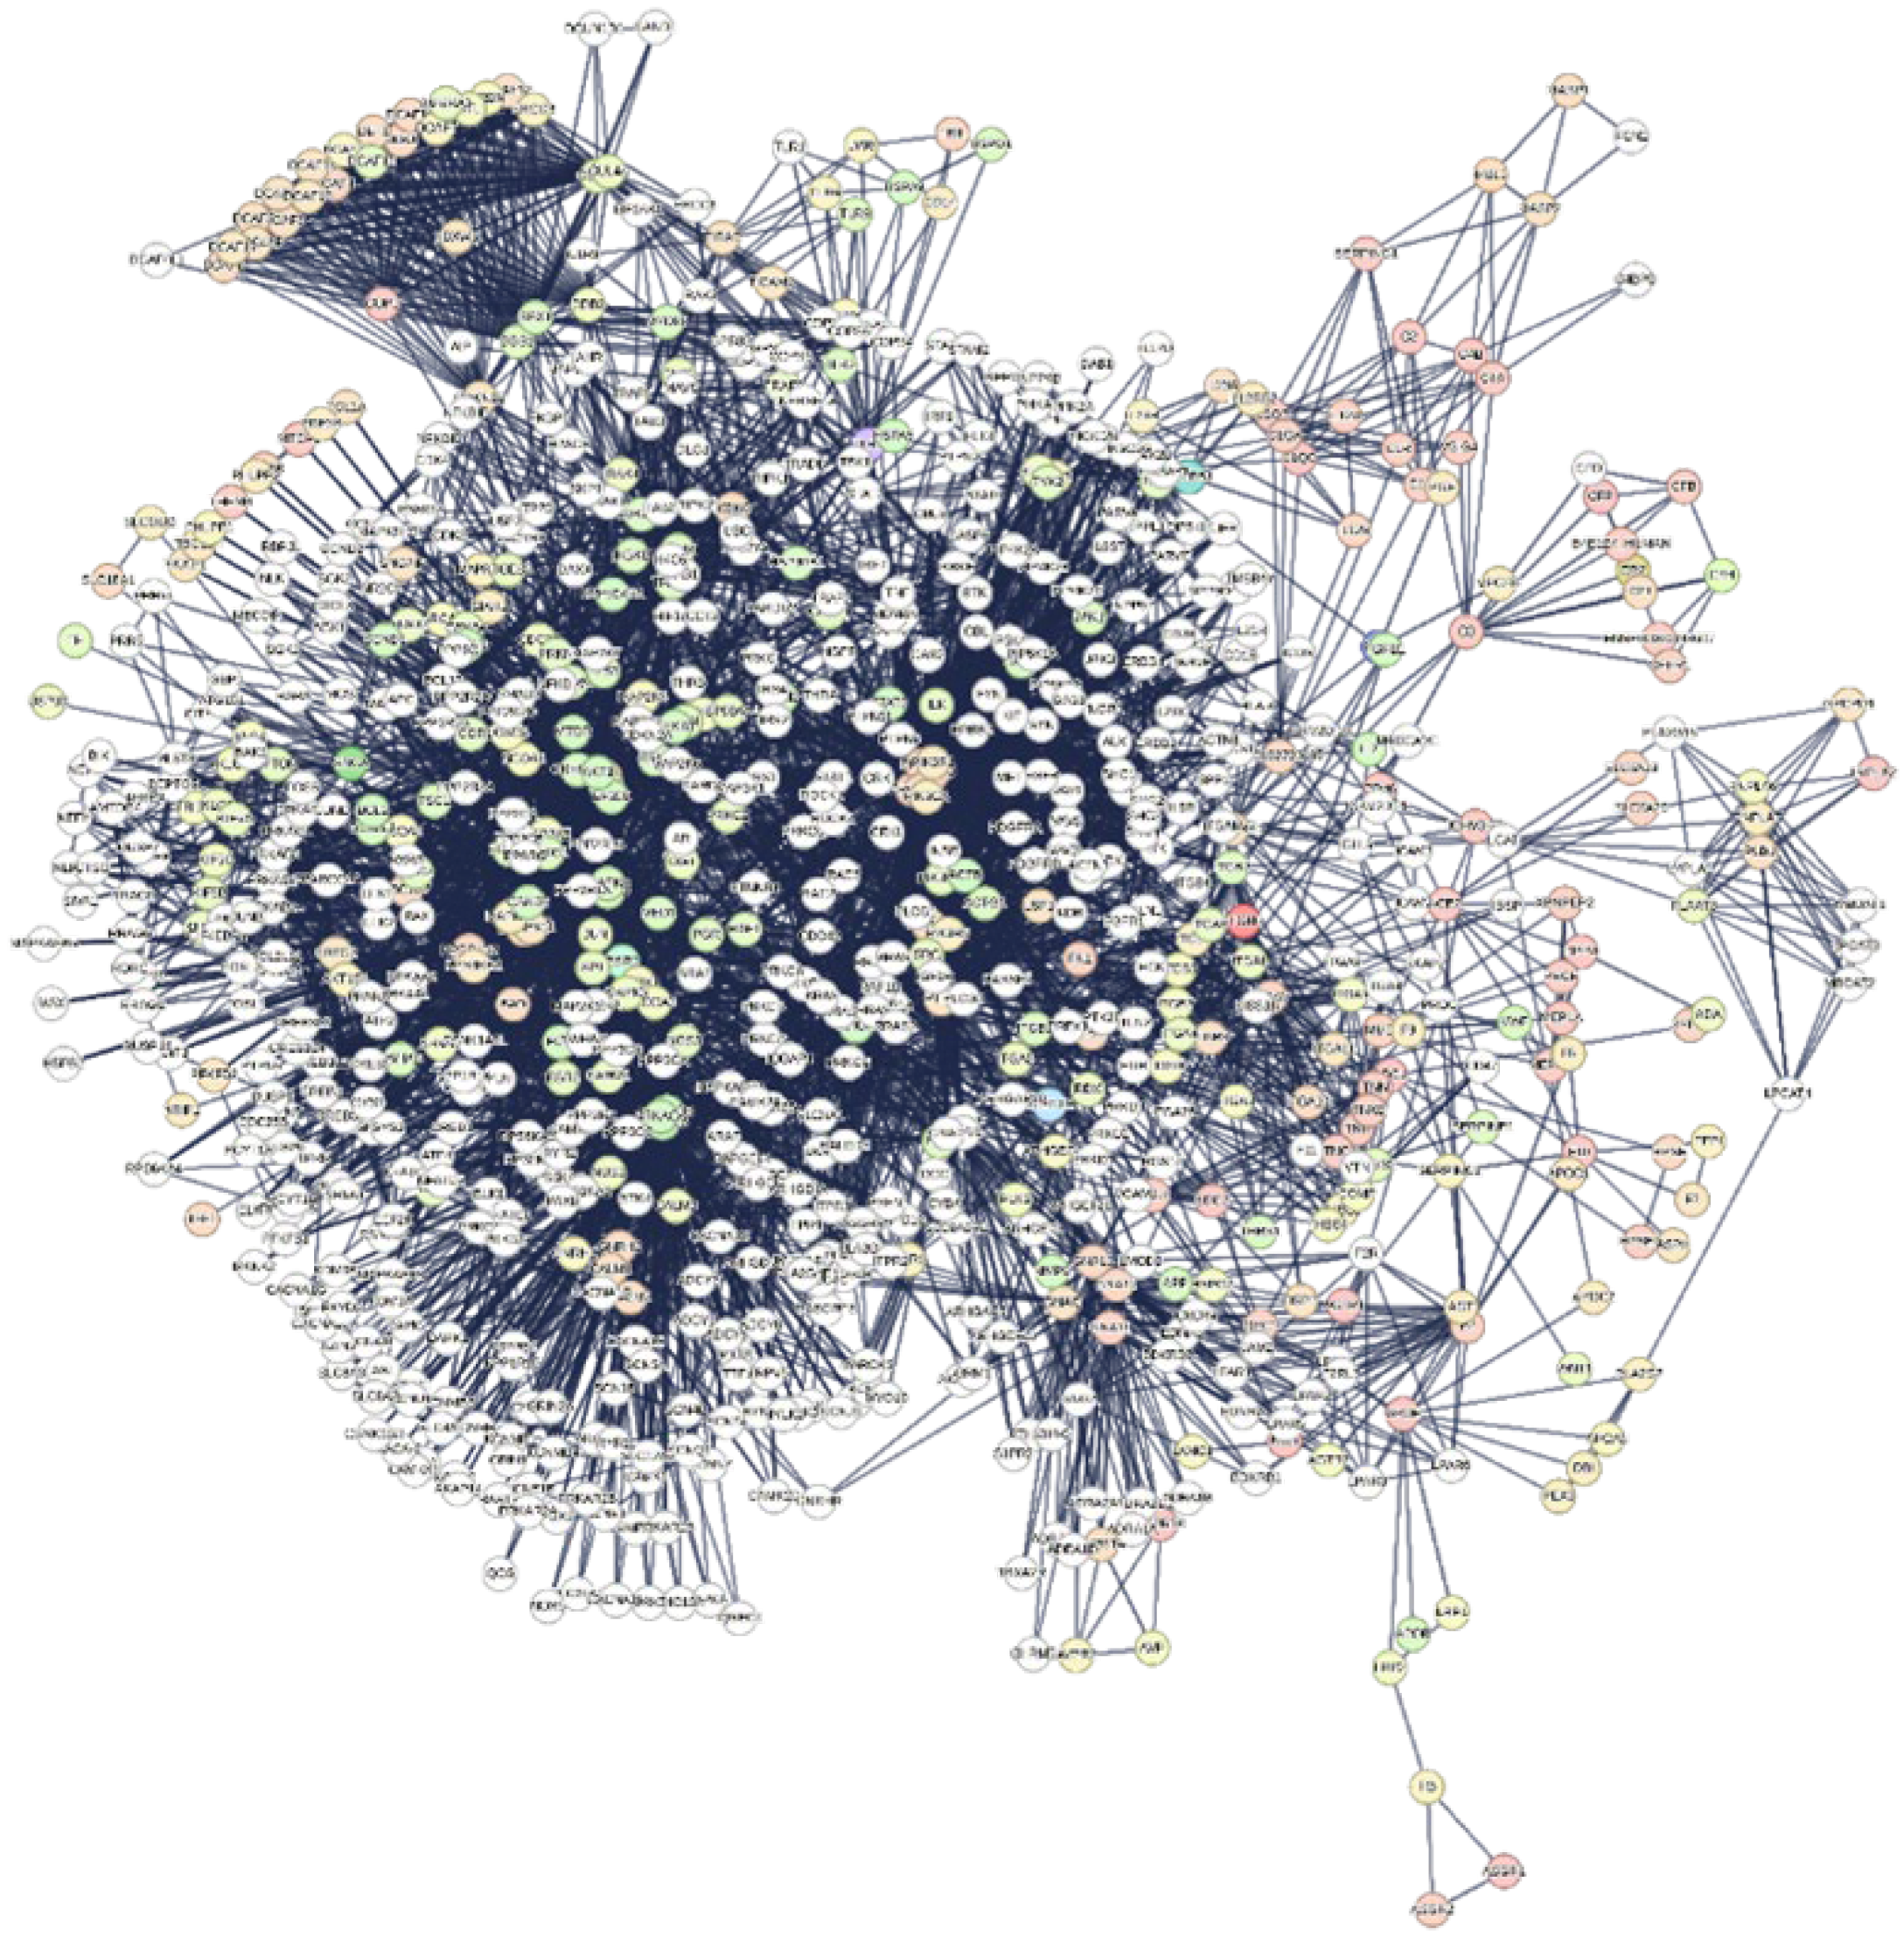
We used these twenty-seven proteins as functional seeds in the human proteome. Figure 6 shows the new interactome calculated by STRING.
Figure 6. -Interactome of the 27 human proteins interacting one-to-one with S1. Number of nodes: 814; number of edges: 7409; average node degree: 15.9; avg. local clustering coefficient: 0.547; expected number of edges: 2285; PPI enrichment p-value: < 1.0x10‒16; 6 channels (without Text mining); confidence score 0.900; enrichment: 500 1st order + 500 2nd order proteins.
Preprints 120198 g006
This interactome (from now on “interactome-814”) comprises 814 nodes (Excel file 2, sheet 1). The first observation is that despite we added 1000 proteins for the enrichment, the system only accommodates 787 of them (814 - 27 = 787). This seems to reflect a low number of experimentally proven interactions. We can consider that STRING classifies only 21.46% of them as High or Highest (Excel file 2, sheet 2), which brings us back to the considerations made in Appendix A. Table 4 shows that this interactome too has a periphery rich in subgraphs but is on average less dense (0.22) and with a value of the average number of neighbours about 50% lower than the interactome-1060. Heterogeneity (1.042) suggests the tendency of this network to contain hub nodes, while the centralization value (0.138) still supports compactness even if the distance between two nodes (diameter) is lower but still high and supports the almost asymmetrical architecture we observe. In conclusion, we have an interactome with a global organization quite like the previous one, although smaller and less dense in terms of connectivity.
Table 4. - Topological parameters of Interactome-814*.
Number of nodes 814
Number of edges 7409
Average node degree 15.9
Avg. local clustering coefficient 0.547
Expected number of edges 2285
PPI enrichment p-value <1.0✕10‒16
Confidence score 0.900
Source channels 6
Network diameter 7
Network radius 4
Characteristic path length 3.189
Network heterogeneity 1.042
Network density 0.22
Network centralization 0.138
Connected components 1**
(*) Calculated by Cytoscape Network Analyzer, which computes a comprehensive set of topological parameters [80,81]. (**) This value is “1” to show that all nodes in the network are connected to each other. Existing unconnected components (0 ≤ C ≤ 1) alter the calculations of the topological parameters, making them unreliable [82]. This is the fundamental reason for pruning. A single component accounts for strong network community.
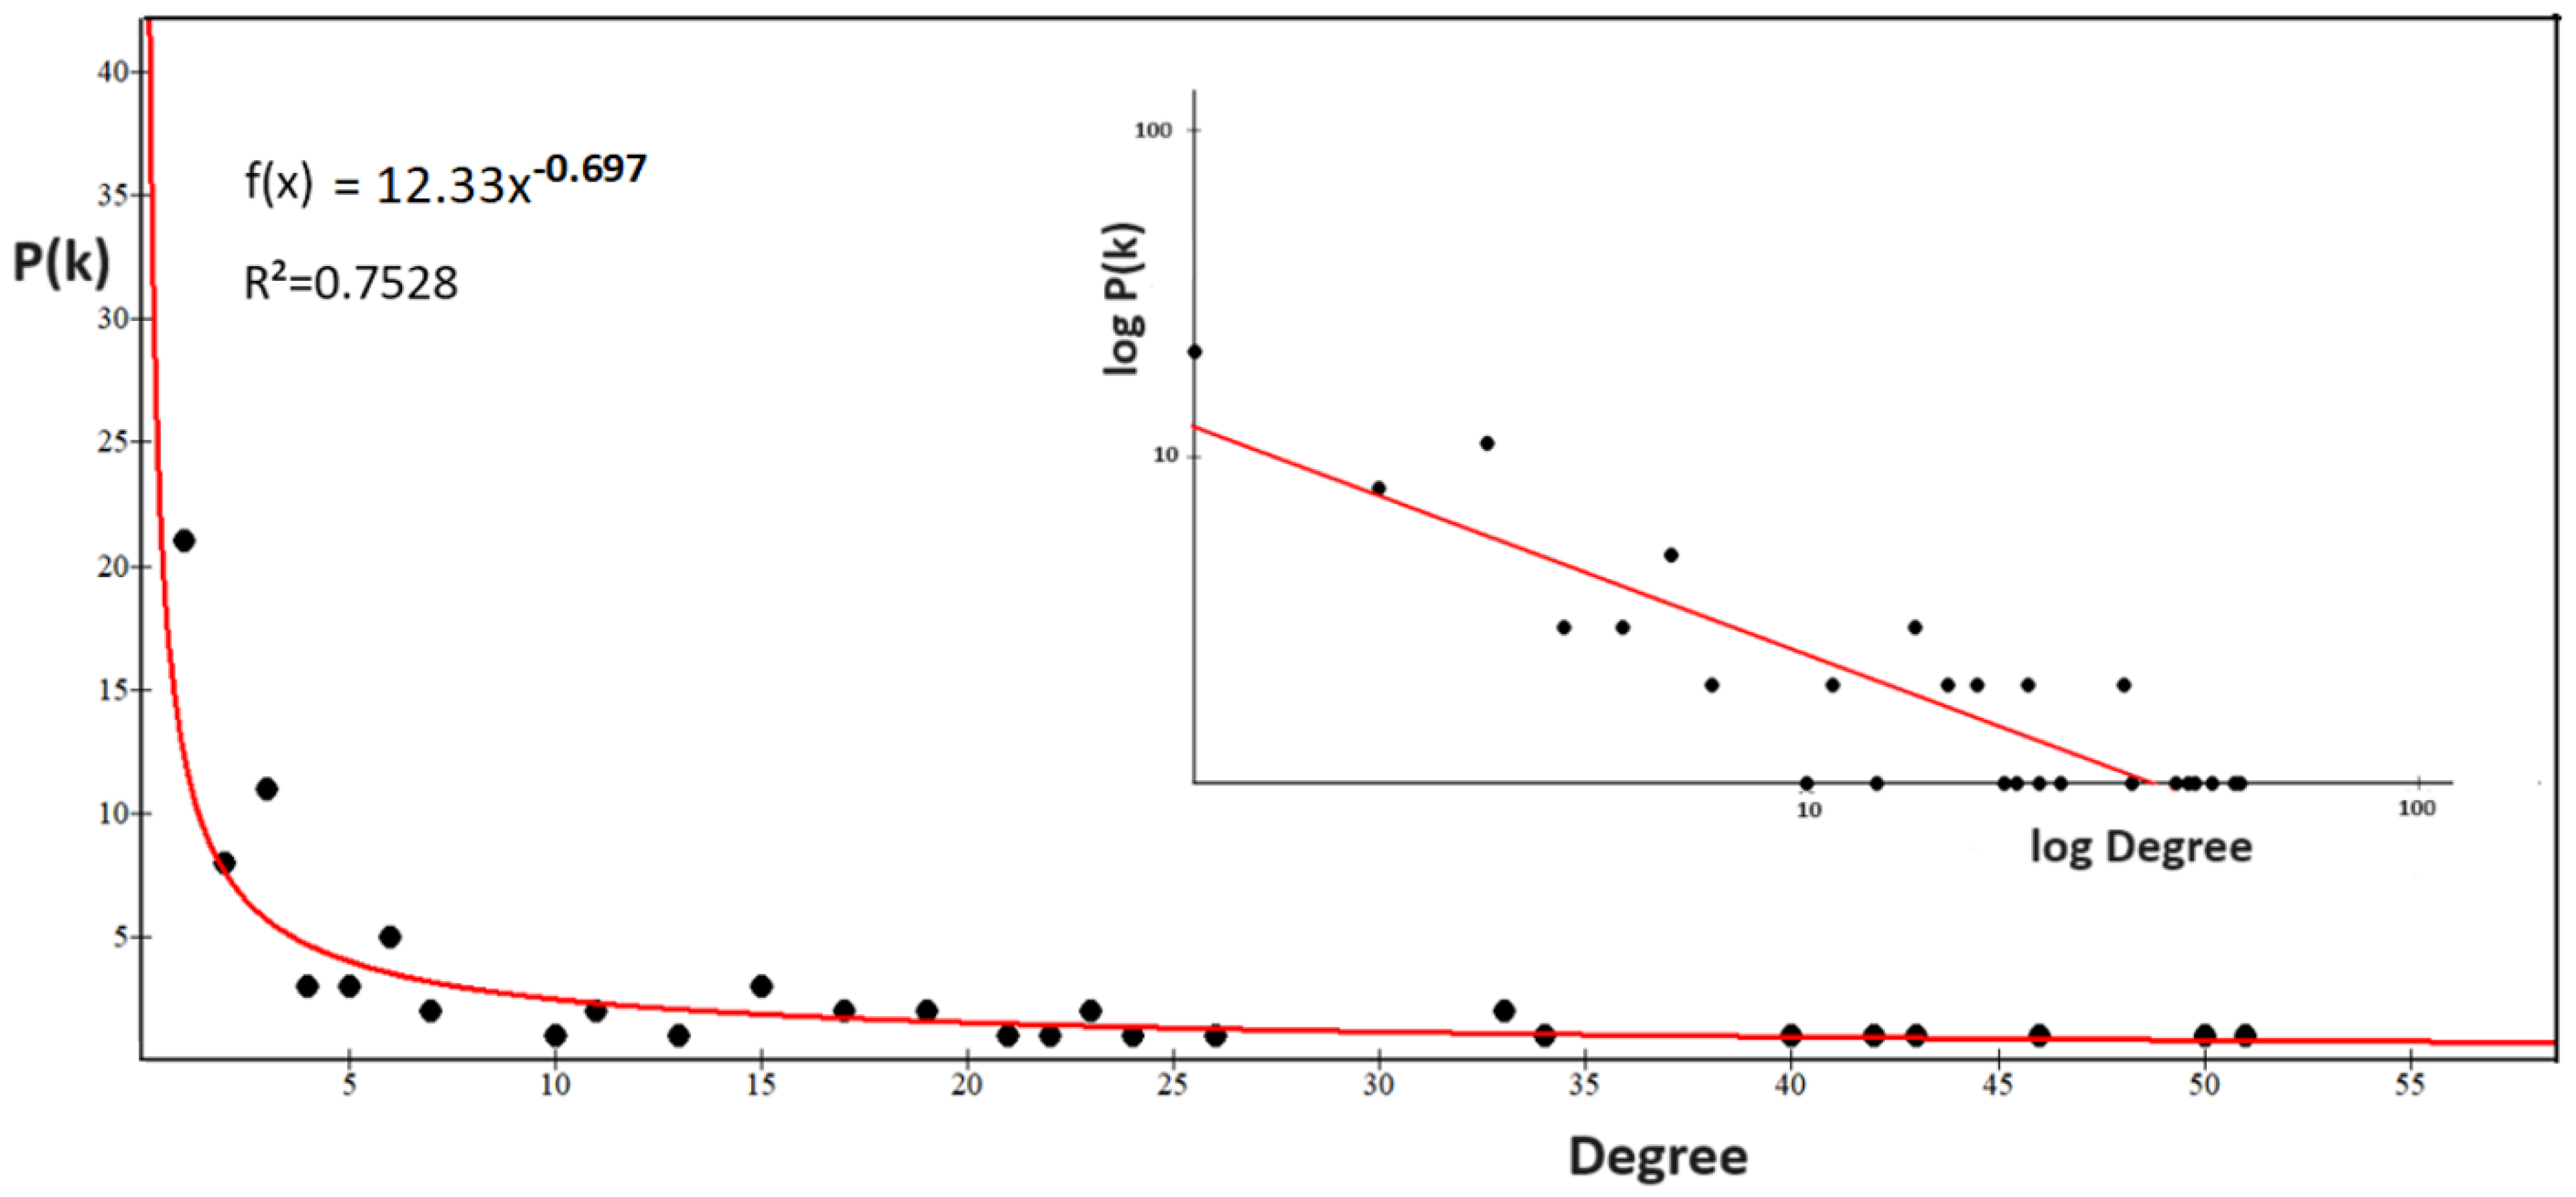
Figure 7. - Power law distribution of interactome-814. The distribution follows a free-scale distribution based on the power law. In the inset, we present the same nodes on a log–log scale, with the best fit of data shown in red. Slope is –0.374. We calculated the slope on the best fit line in the log-log inset.
Preprints 120198 g007
Also, the interactome-814 shows a power law characteristic of scale-free networks (figure 7). Differently from the interactome-1060, the log-log distribution plot shows a fit with a good R2 value of 0.7528, so this log-log fit is the signature of a system well described by the power-law equation. Hence, interactome-814 should show a very balanced and linear overall growth, without distorting effects. Also, in this case, the exponent y is greater than 1, showing a central component that does not prevent peripheral modules. As for the two slopes, comparing them, they are both negative and not very different in value. However, the slope shows different growth rates, with the number of nodes increasing faster in 1060. Probably the two interactomes, although structurally similar, react differently to internal or external factors and this could be because of the presence of the greater heterogeneity found in 1060. Finally, all this suggests that, despite the considerable underlying biological complexity, the relationships between metabolic processes and population sizes of the interactomes seem to obey a relatively simple relationship, given by the power equation. This is a further fact that justifies the comparisons we are making on the two interactomes and indirectly also the search for the specific functional activities of the S1 protein.
In Figure 8, we show the centrality distributions of interactome-814. We reported the numerical values of the first 26 terms for each distribution in the Excel file 2, sheet 3. The same procedure adopted for interactome-1060 was used to assign the highest-ranking values. We can see in the betweenness centrality distribution that the upper range of the distribution is very wide, involving proteins with both a high degree and medium-low degree. What is striking is that some of them are also present in the centrality distribution of the eigenvectors. Since these are different topological properties, this, as we will see later, suggests mixed proteins (Hub/Bottleneck), a situation not present in the interactome-1060.
Figure 8. The figure shows the centrality distribution plots of interactome-814: Closeness Centrality (top), Betweenness Centrality (middle) and Eigenvector (bottom). We calculated the topological parameters individually using the Network Analyzer (version 4.5.0) on Cytoscape to identify the node values [81].
Preprints 120198 g008
Table 5 reports the results showing the highest-ranking hub and bottleneck nodes. A comparison with Table 3 shows that although the architecture of the two interactomes may seem quite similar, the main proteins that underlie their structural and functional organization are totally different and behave differently. The nodes in Table 3, considered singly, perform only one activity, either as a hub or as a bottleneck. There are no mixed-activity nodes. We can consider those in Table 3 as pure hub and bottleneck nodes [139], while many of those in Table 5 show mixed activity.
Table 5. High-ranked Hub and Bottleneck nodes of interactome-814.
HUB nodes Degree Bottleneck nodes Degree
PIK3R1 121 AKT1 65
PIK3CA 113 EGFR 103
PIK3R2 114 ESR1 107
PIK3R3 113 MAPK1 113
PIK3CD 108 MAPK3 130
PIK3CB 108 PIK3CA 129
SRC 103 PIK3R1 128
AKT1 107 PRKACA 112
MAPK1 112 PRKACB 121
EGFR 65 PRKACG 109
MAPK3 109 PTK2 75
AKT3 73 RHOA 49
AKT2 73 SRC 65
ESR1 65 TP53 69
PLCG1 69
TP53 75
MAPK8 92
MAPK9 90
Note: the proteins in red are both hub and bottleneck.
The functional coincidence between some hubs and bottlenecks in the interactome shows that these proteins not only cover many interactions but play a critical role in maintaining connectivity and stability in the network [140]. The coincidence also suggests that these proteins are fundamental for the functioning of the biological system and may represent key points for therapeutic interventions or functional analyses [139]. In fact, both categories of strategic positions in the network help to understand the robustness and vulnerability of the interactome, revealing potential regulatory mechanisms [141]. This allows us to consider seriously that the S1 subunit behaves differently when it interacts alone with the human proteome. To get a more reliable picture, we verified whether a hub-spoke scheme also exists in this case and what are the main allocations these proteins have in the cellular compartments. Figure 9 shows a hub-spoke scheme where, however, the central system is mixed because both pure hubs and bottlenecks man it.
Figure 9. The Hub-Spoke organization of the Interactome-814. The lower central part of the graph (left) shows both pure Hub proteins and many mixed ones. The table on the right shows some of the most significant biological terms globally regulated by these high-ranking nodes. It is interesting to note how each of the nodes takes part in multiple biological functions simultaneously.
Preprints 120198 g009
The processes shown in the table are just some of the most relevant terms in which the nodes of the Hub/Spoke organization are globally involved. The graph shown is the structural backbone of the network. These activities, as well as many others not reported, support a deep involvement of S1 mainly in metabolic activities, even with worrying negative aspects (hsa05200 or HAS-199418). All processes show high Strength values, which suggest coordinated and active processes, and organizationally well-supported even at the gene expression level. It is worth noting that the graph includes 23 nodes among the highest-level ones and that 22 of them are involved in well-supported and statistically significant negative processes.
Figure 10 shows the four most significant distributions relative to the cellular compartments (cytosol and nucleus) and tissues (nervous system and blood) populated by the proteins of the interactome-814. The upper parts of the distributions exhibit dense population between the values 4 and 5. This shows a high functional activity of the proteins that populate it. The extent of involvement of high-ranking proteins can be determined by analyzing the distribution along the abscissa (degree). In this interactome, the cytosol, and nucleus stand out as the most involved and populated cellular compartments. However, the extracellular area and membrane level also exhibit intense metabolic activity (data not shown). Among the tissues, the nervous system is massively involved by proteins that include a large part of the high-ranking ones.
Figure 10. Distribution of interactome-814 proteins in cellular compartments (nucleus, and cytosol) and tissues (blood, and nervous system). Calculations performed by Cytoscape.
Preprints 120198 g010
In summary, the two interactomes, despite their seemingly similar structure, perform distinct functions that are currently only broadly defined. It becomes important to focus on the functional activity to understand if, and how much, they differ from the point of view of metabolic purposes and, above all, which are the genes that oversee these processes. Are they the same genes or are they different genes? What is surprising is that interactome-814, despite having a lower total number of nodes than interactome-1060, controls 7,120 terms and 40% more functions based on Gene Ontology terms. (See Table 6).
Table 6. Functional Processes activated in the human genome by the interactome-814.
Biological Process Terms significantly enriched
Biological Process (Gene Ontology) 2557 terms
Molecular Function (Gene Ontology) 321 terms
Cellular Component (Gene Ontology) 231 terms
Reference publications (PubMed) >10,000 publications
Local network cluster (STRING) 246 clusters
KEGG Pathways 213 pathways
Reactome Pathways 828 pathways
WikiPathways 453 pathways
Disease-gene associations (DISEASES) 222 diseases
Tissue expression (TISSUES) 223 tissues
Subcellular localization (COMPARTMENTS) 218 compartments
Human Phenotype (Monarch) 1196 phenotypes
Annotated Keywords (UniProt) 124 keywords
Protein Domains (Pfam) 14 domains
Protein Domains and Features (InterPro) 222 domains
Protein Domains (SMART) 52 domains
All enriched terms (without PubMed) 7120 enriched terms
In Barabasi-Albert network models, enrichment arises from a network growth process governed by the preferential attachment of nodes. The same protein can exert different functions by binding to different partners. A fundamental question is to understand how the opportunistic choices of individual nodes shape the properties of the global network. Precisely identifying these influential nodes is a challenging and still understudied task. We also consider that nodes are biological agents and links represent their functional interactions, which can also be modeled as cooperative activities. Nodes, taking part in an ever-increasing number of molecular processes, can change their local behavior or topology, maximizing their cooperative activity [142,143].
How does a protein select among a multitude of potential binding partners within a cell, expanding its functional repertoire? An adequate response should consider the location and translation rate of messenger RNA (mRNA), as both factors can cause spatial regulation of protein synthesis, affecting local protein concentrations and interactions [144,145]. The rate of translation elongation can indeed influence protein folding and, subsequently, its interactions with other proteins [146,147]. Slow translation can allow more time for co-translational folding and interaction with certain partners, while rapid translation might favor interactions with different proteins or lead to misfolding [148,149]. However, additional considerations can also come from other types of comparisons of the two interactomes.

2.7.1. Data Merging

The two interactomes, 1060 and 814, although induced by the same viral protein, appear to operate in different metabolic contexts. Characterizing the behavior of these two networks is essential to understand the complexity of S1 action [150]. The differences appear clear if we compare the set of GO processes controlling each interactome. The enrichment of interactome-814 showed 7,120 terms in 15 categories. While the interactome-1060 shows 4,989 terms in 15 categories. The difference in terms is 1.42-fold, but for ontological terms is 40% and the three Ontologies reflect the functions. Size and reliability of the datasets under study, the scientific design, and phenotype specificity affect the identification of critical nodes and functional processes in any system. We standardized these variables by making the methodological procedures as similar as possible and, most importantly, using only experimental data and selecting only those with the highest reliability. We considered the topological properties of nodes and evaluated their functional roles based on their ability to transmit information within and between modules in the network. Using Gene Ontology for genomic functional annotation is crucial, as it can reveal important biological information. Gene Ontology (GO) is divided into three aspects: molecular function, cellular component, and biological process [151]. But it has redundancy problems when analyzing them together, especially because of gene overlaps. The redundancy in GO annotations can complicate the interpretation of biological data [152]. Therefore, the analysis of a single ontology, such as Biological Processes, which are also the most many and all-encompassing, can be a useful strategy to limit the redundancy and improve the clarity and significance of the results [153,154].
By comparing the Biological Processes (GO) of the two interactomes, we still highlighted the large functional differences already noted. 2,557 processes for the interactome-814 versus 1,430 processes for the interactome-1060, is 44.1% more. A closer look at the two interactomes (see Excel file 1, sheet 4 and Excel file 2, sheet 4) shows that many functions are similar, while others appear specific to each of them. The same happens for many of the nodes involved. In fact, some of them appear many times in different biological processes associated with the same interactome. All this suggests an important and central role of these genes in regulating some cellular functions related to covid [155], but it also raises questions we cannot yet fully answer today. For example, if the same gene appears in dozens of different biological processes, does it do so simultaneously or over a long-time horizon? The analysis of cellular systems requires the coordination of large numbers of events, but identifying the temporal cues underlying interactions is the critical part of understanding cellular functions. With current knowledge, we could have a variety of interpretations, many probably distorted [156]. This has led us to investigate the overall behavior of biological processes, rather than wanting to find the gold-process at all costs.
The presence of multiple interactions within the interactome shows a complex network of gene regulation, in which some genes can directly or indirectly influence a myriad of biological processes. But, when we say many genes and a "myriad of biological processes", we need to know what we are talking about in quantitative terms. To our knowledge, no study related to SARS-CoV-2 has ever made such an assessment. To understand the similarity and dissimilarity of functions and the genes that support them, we used an analysis borrowed from marketing methods to compare the two data sets represented by the Biological Processes (GO). We compared the two interactomes through a Data Merging (details in Methods), combining the two large biological data sets into one (see Excel file 4, sheets 1 and 2). Data Merging is used to evaluate interactions parameters, append observations, and find repetitions. Therefore, the logic we used was that to distinguish common processes (coupled processes) from single processes (uncoupled processes) of each interactome. The purpose of merging is to optimize collecting all the data into a single set, maximizing the completeness with which critical information can be extracted and analyzed. Table 7 illustrates the general picture that emerges from the merging of the two data sets, both containing common processes, but also specific to one or the other data set.
Table 7. - Data Merging between Biological Processes (GO) of interactomes 1060 and 814.
Number of Biological Processes
(GO) (%)

Redundant genes
(%) *

Coding genes
Average genes per single process.
Genes found >100 times
Merging of 1060+814 (after pruning) ** 2837 (total)
68,003
(total)
--- 23.97
-----
Coupled processes in the merging of 1060+814 554 (39) *** 24,301
(35.8)
944 21.9 ABL1, AGT, AKT1, APOE, BCL2, BTK, CD28, EGFR, FYN, HLA, HRAS, IL12A, IL12B, IL12RB1, IL23A, JAK2, KDR, KIT, LYN, MAPK1, RHOA, SRC, SYK, THBS1, TICAM1, TLR4, TNF, TYK2, ZAP70.
Uncoupled processes in 814 1515 (53) 39,691
(58.3)
771 26.19 ADA, ADCY8, ADRA1A, ADRA2A, AGT, AGTR2, AKT1, AKT2, APOE, APP, AR, ASPH, ATF2, ATF4, ATP2B4, AVP, AVPR, BAD, BAK1, BAX, BCL2, CALM1, CTNNB1, CYBA, DLG1, EDNRA, EGFR, EP300, FOS, FOXO1, FOXO3, FYN, GNAI2, GSK3A, GSK3B, HIF1A, HSP90AA1, HSP90AB1, HSPA5, IGF1R, IL12B, IL2, INSR, IRAK1, ITGB1, JAK2, JUN, KCNE1, KCNQ1, KDR, KIT, LYN, MALT1, MAP2K1, MAPK1, MAPK14, MAPK3, MAPK8, MED1, MMP9, MTOR, MYD88, NFKB1, NKX3-1, NOS1, PODGFRA, PIK3CA, PIK3CG, PLCG2, PPARA, PPARG, PPP3CA, PRKCD, PTEN, PTK2B, PTPN2, RELA, RHOA, RIPK1, RIPK2, RACK1, RPTOR, SLC8A1, SMAD3, SNCA, SRC, STAT3, SYK, TGFB1, THBS1, TIRAP, TLR2, TLR4, TNF, TP53,
Uncoupled processes in 1060 214 (8) 4,011
(5.9)
701 18.74 Family EIF, Eukaryotic initiation factors gene family, (230), histones (295), family NDUF (352), family RPL (516), family RPS (411). ****
The red color identifies uncoupled events, biological actions, or genes referable only to the interactome-814, the black color identifies the uncoupled events of the interactome-1060, while the blue color refers to coupled activities common to the two interactomes. *) Multiple representations are possible for each gene. It is redundant because it belongs to multiple processes. **) We merged 1060+813 by considering only those Biological Processes GO with a Strength value >0.05 (see details in Methods). ***) After merging, we found 554 similar coupled processes (compared one to one), so in absolute value they correspond to 1108 single processes. ****) in parentheses, the number of genes that make up the family.
Table 7 shows how the data-merging reveals thousands of genes with widespread gene redundancy, but also many uncoupled processes. These results specifically show that the activities exerted by the S1 subunit alone in its one-to-one relationships (in 814) have a relevant functional incidence (53%). However, the large number of highly represented genes in the same processes also means that multiple genes will have to appear multiple times in biological processes associated with the same interactome. An average value of over twenty genes per process shows how difficult it is to single out a single signaling pathway, or even a metabolic process, and assign genes to it.
The observed differences in gene composition suggest that gene expression and its involvement can vary significantly depending on the specific context, such as different tissue types, conditions, or stages of development. This can cause different genes being highlighted, even at different times, within the same larger biological process. We should not overlook the perception of the many ways in which 68,003 genes can be organized into 2,837 different processes. In fact, an extremely high number of processes can be assigned to about twenty genes. The overall number of processes is 232837, while S1 specifically comprises 261515. This is an astronomical number of combinations, which makes it clear why adequate and correct experimental data, and their control, are necessary to reduce the combinations to a few when studying specific functional processes in any design context. As an illustration, when examining IL12A, involved in coupled processes, or RACK1, involved in uncoupled processes of 814, (Table 7), they exert a wide range of biological functions, so many that each of them is involved in over 100 processes. Therefore, how can we confidently ascribe the precise biological pathway in which each of these proteins takes part, considering their abundance of over 100 occurrences within the interactomes under investigation?
Studies on HeLa cells have revealed that protein expression levels exceeding 90% are consistent with the average level of protein expression [157]. This shows that there is ample evidence to support an excess of protein copies, even at the level of gene expression, encompassing a significant portion of transcripts that encode functional proteins. But this ensures the efficient functioning of the processes in which these proteins are involved [157,158,159]. Protein abundance can be determined by many factors, such as transcription, translation, or RNA/protein decay [160]. Therefore, these factors can combine to produce a certain expression value. The load balance between transcription and translation regulates gene expression necessary to optimize cellular fitness [161]. Low expression of essential proteins slows growth [162], but even generalized overexpression of proteins slows growth because it increases metabolic load [163] and energetic costs. Today, we can only say that the implications of over-representations of genes in an interactome can be multiple and each hypothesis influences the understanding of disease and cellular interactions [164]. Correct regulation of genes in space is necessary for proper function.
These claims may raise many questions, but there is no clear evidence to support any hypothesis or claims made about this matter. Despite technological advances in high-throughput sequencing, our ability to draw functional conclusions from expression data is lagging and mostly qualitative [165,166,167]. The cell organizes its biochemistry in space by forming distinct chemical compartments in which membranes are separating barriers. Achieving the ability to differentiate the functions of cells within a multicellular tissue requires standardizing spatial transcriptomics data and correlating it with cellular mappings using bioinformatics systems. This will enable the identification of various subpopulations with their distinct transcriptional profiles [168,169]. In addition, when we evaluate protein-protein interactions present in an interactome, we realize that, despite the integrations between different sources, they are far from complete in experimental terms [170,171]. This can lead to gaps in real physical characterization and certainty of the interaction that is reflected in distortions of functional knowledge in GO processes. While superimposition between gene sets can cause low specificity in over-representation analysis, affecting the results and conclusions. Thus, over-representation (also called enrichment analysis) in genomic analysis plays a crucial role in several aspects. It works by identifying pathways or gene/protein sets that have a higher overlap with a known gene/protein set of functional interest than expected by chance. For example, it helps identify significant biological pathways associated with certain conditions or diseases by revealing how overrepresented genes/proteins interconnect. The interconnectivity of genes, i.e., their membership in functional communities, enables us to unravel complex biological mechanisms that we cannot resolve by analyzing some individual processes or signaling pathways. In summary, overrepresentation is fundamental to interpret genomic data but when these are overabundant, complex, with high protein redundancies, as we find them here, it may be more appropriate to identify sets of genes that are highly interconnected and that exert specific functional activities in common. This way, we should have a more precise vision of the functional strategies in an interactome. Therefore, we eliminated redundancies from the three gene sets by isolating the single copy of each coding gene. We got three sets of coding genes: 944 genes for the coupled processes of the interactomes 1060+814, 689 for the uncoupled processes of the interactome-1060, and 771 for the uncoupled processes of the interactome-814. We performed a clustering analysis of each of the three sets of their decoded products (Excel file 5, sheets 1, 2 and 3). The sets encompass proteins related to common and interconnected functional processes (1060+814), proteins specifically involved in the one-to-one activity of S1 (814), and proteins derived from the 1060-interactome that do not fall into the sets.

2.8.1. Clustering Analysis

We conducted this analysis on the three sets of coding genes to get an overall picture of the activities exerted by each set. The Excel file 5 also reports the three sets of genes involved. Table 8 shows the overall results.
Table 8. Clustering Analysis of coding genes from Data-merging.
1-CLUSTERS OF UNCOUPLED FUNCTIONS OF INTERACTOME-1060
Cluster No. Primary description GO-term p-value Gene count *
1 Cytoplasmic translation GO:0002181 4.83 × 10−83 266
2 Focal adhesion GO:0005925 7.61 × 10−48 189
3 Aerobic electron transport chain GO:0019646 1.49 × 10−47 75
4 DNA replication-dependent chromatin assembly GO:0006335 6.67 × 10⁻¹⁹ 44
5 Antigen processing and presentation GO:0019882 6.67 × 10⁻¹⁶ 33
6 Complement activation, classical pathway GO:0006958 1.67 × 10⁻¹¹ 23
7 COPII vesicle coat GO:0030127 2.46 × 10⁻¹² 20
8 Activation of phospholipase C activity GO:0007202 3.30 × 10−06 18
9 COPI vesicle coat GO:0030126 1.90 × 10−09 11
10 Cholesterol metabolism hsa04979 2.70 × 10−04 10
Cluster No. Secondary description GO-term p-value Gene count
1 Formation of a pool of free 40S subunits HAS-72689 7.09 × 10−91 -
3 Respiratory chain complex GO:0098803 7.29 × 10−52 -
4 CENP-A containing nucleosome GO:0043505 5.51 × 10⁻¹⁵ -
6 Complement and coagulation cascades hsa04610 4.06 × 10−09 -
8 G alpha (q) signaling events HAS-418597 1.11 × 10−03 -
10 Plasma lipoprotein particle clearance GO:0034381 5.60 × 10−03 -
Cluster No. Tertiary description GO-term p-value Gene count
1 Ribosome GO:0005848 2.08 × 10−79 -
________________________________________________________________________________________________________
2—CLUSTERS OF COUPLED FUNCTIONS OF INTERACTOMES-1060+814
Cluster No. Primary description GO-term p-value Gene count
1 Positive regulation of transferase activity GO:0051347 2.76 × 10−63 409
2 Focal adhesion GO:0005925 5.66 × 10−44 232
3 ECM-receptor interaction hsa04512 9.88 × 10−36 79
4 Long-term potentiation HAS-9620244 7.01 × 10−06 54
5 Rho protein signal transduction GO:00072666 9.12 × 10−08 43
6 Formation of Fibrin Clot (Clotting Cascade) CL:18784 1.09 × 10−06 37
7 Antigen processing and presentation GO:0019882 7.05 × 10⁻¹³ 35
8 Complement activation GO:006956 1.33 × 10⁻¹⁸ 33
9 Cholesterol metabolism hsa04979 1.80 × 10−03 13
10 Renin-angiotensin system hsa4614 2.09 × 10−03 9
Cluster No. Secondary description GO-term p-value Gene count
1 Cellular responses to stress 7.56 × 10⁻¹¹ -
2 Mixed, incl. Constitutive Signaling by Aberrant PI3K in Cancer, and FCERI mediated Ca+2 mobilization CL:17328 2.28 × 10⁻³⁴ -
3 Protein complex involved in cell adhesion GOCC:0098636 1.09 × 10⁻²⁷ -
4 Calmodulin-binding KW.0112 5.05 × 10⁻¹⁵ -
5 G alpha (12/13) signaling events HAS-416482 1.69× 10−09 -
6 Blood coagulation GO:0007596 7.29 × 10⁻²⁴ -
9 Regulation of plasma lipoprotein particle levels GO:0097006 2.16 × 10−05 -
Cluster No. Tertiary description GO-term p-value Gene count
1 Protein kinase binding GO:0019901 6.94 × 10−74 -
5 Mixed, incl. Sema4D in semaphorin signaling, and ARHGEF1-like, PH domain. CL:17973 1.765× 10−06 -
9 Protein-lipid complex GO:0032994 6946 × 10−74 -
3-CLUSTERS OF UNCOUPLED FUNCTIONS OF INTERACTOME-814
Cluster No. Primary description GO-term p-value Gene count
1 Hepatitis B hsa055161 4.98 × 10−73 259
2 mTOR signaling pathway hsa04150 2.05 × 10−36 139
3 Fc gamma R-mediated phagocytosis hsa04555 6.62 × 10⁻³² 113
4 Long-term depression hsa04730 1.72 × 10⁻²⁹ 72
5 Blood vessels diameter maintenance GO:0097746 3.61 × 10⁻¹³ 61
6 ECM-receptor interaction hsa04512 9.96 × 10⁻²⁴ 56
7 Complement activation GO:0006956 3.73 × 10⁻¹⁸ 32
8 Renin-angiotensin system hsa04614 1.10 × 10−04 14
9 Glycerophospholipid metabolism Hsa00564 2.71 × 10−08 13
10 Plasma lipoprotein particle remodeling GO:0034369 9.94 × 10−05 12
Cluster No. Secondary description GO-term p-value Gene count
3 Constitutive Signaling by Aberrant PI3K in Cancer 1.12 × 10⁻³³ -
4 Calmodulin binding GO:0005516 1.11 × 10⁻²¹ -
5 Mixed, incl. Heterotrimeric G-protein complex, and Signaling transduction inhibitor CL24307 6.90 × 10⁻¹³ -
6 Cell adhesion mediated by integrin GO:0033627 2.32 × 10⁻¹⁴ -
7 Initial triggering of complement HAS-166663 5.26 × 10⁻¹² -
8 Dipeptidyl-peptidase activity, and Meprin A complex CL31769 6.08 × 10−03 -
10 Cholesterol metabolism hsa04979 1.98 × 10−49
Cluster No. Tertiary description GO-term p-value Gene count
3 GPVI-mediated activation cascade, and SH2 domain superfamily CL:17470 1.53 × 10⁻²⁷ -
5 Vascular smooth muscle contraction hsa04270 8.57 × 10−39 -
6 Integrin KW-0401 1.88 × 10⁻¹⁶ -
10 Protein-lipid complex GO:0032994 5.40 × 10−03 -
We marked the three clusters with the same colors used for Table 7. * ) The gene counts are total for the three descriptions of each cluster, so we report them only next to the Primary description. The cluster numbers reported in the first column on the left for the secondary and/or tertiary descriptions are associated with those of the primary description. For example, the association of 1) Cytoplasmic translation + 2) Formation of a pool of free 40S subunits + 3) Ribosome, involving 266 genes, forms Cluster No.1 of the interactome-1060.
Although we also reported data on uncoupled functions of the interactome-1060 and those coupled via the merging protocol, our analysis currently focuses only on one-to-one interactions of S1, but we will discuss uncorrelated data later to provide a broader perspective.
The list of biological processes and pathways provided by the clustering analysis (Table 8) reflects a complex interplay of metabolic activities influenced by the one-to-one interaction of the S1 subunit of the SARS-CoV-2 Spike protein. Many of these activities are central to the body's response to infection, immune regulation, and cell signaling, and can be disrupted during both viral infection and vaccination. No one can rule this out. The clustering results cover broad macroscopic areas of activity: 1. Immune system activation and regulation; 2. Vascular and cardiovascular implications; 3. Metabolic processes; 4. Cell signaling and structural integrity; and 5. Neural and cognitive processes.

2.8.1.1. The liver aspects

The appearance of the Hepatitis B pathway (hsa055161) is unexpected in SARS-CoV-2. The liver is one of the most affected organs by covid, and the increase in liver enzymes is the most common symptom [172]. There appears to be a correlation between the severity of the disease and older patients with other morbidities. Chronic HBV infection can lead to metabolic syndrome and liver dysfunction [173]. The pathways involved in liver metabolism may intersect with systemic responses to SARS-CoV-2, especially in patients with pre-existing liver conditions. Metabolic dysfunction (MASH) is common in Western countries and proceeds through a slow progression of inflammation and fibrosis, which is associated with the imbalance of lipid metabolism and insulin resistance, all components also common to COVID-19. This can certainly exacerbate liver effects in chronic patients. The virus mainly infects cholangiocytes with elevated levels of IL1, TNFA, MCP1, all potential factors that can induce the development of MASH with progression to advanced chronic states, but we cannot exclude possible cancerous states [174]. So, the appearance of the Hepatitis B path may come from shared immune mechanisms or pathways between SARS-CoV-2 and Hepatitis B virus (HBV), possibly relating to immune evasion strategies or overlapping receptor usage.
We could consider potential explanations: A) Cross-reactivity: The immune response triggered by the S1 subunit may have shared components or epitopes with the Hepatitis B virus, resulting in a cross-reactive immune response that affects Hepatitis B-related pathways as well [175]. B) It is conceivable that this could be a statistical anomaly or data noise, suggesting an indirect association not directly caused by the S1 subunit, but reflecting shared cellular machinery or immune pathways. C) Certain signaling pathways that are activated during viral infections, such as mTOR or immune-related pathways, play a role in the response to different viral infections, including Hepatitis B, resulting in concurrent pathway activation [176,177]. Both viruses induce strong inflammatory responses, resulting in the activation of similar pathways in host cells and the initiation of shared biological processes. The activation of signaling pathways, such as the mTOR pathway, in response to viral infection, serves as an illustrative example of a common theme. D) The metabolic alterations induced in host cells by both viruses facilitate the promotion of viral replication. As an example, HBV modifies lipid metabolism, a potential pathway that SARS-CoV-2 also affects via its protein. The overlapping biological processes highlight the intricate interplay between viral infections, immune responses, and cell metabolism, even though the S1 subunit of SARS-CoV-2 and hepatitis B might not explicitly link to direct metabolic activities. Understanding these connections can help explain the broader implications of viral infections on host health and the development of vaccines. Further research would be essential to clarify the specifics of these relationships. However, considering the results of the data-merging analysis, all this seems to be the effect of the huge number of genes involved, and the possibility of innumerable interactions with the same groups of overlapping molecules, to which we must add the scarcity of experimental data, all factors that can mislead even advanced computing systems.

2.8.1.2. Vascular aspects

The “Renin-angiotensin system” is crucial for blood pressure regulation and fluid balance [178], and its involvement may explain some of the cardiovascular manifestations seen in COVID-19. In chronic liver disease, alterations in this system can exacerbate portal hypertension and fluid retention. MTOR, the Renin-angiotensin system, “Blood vessels diameter maintenance” and “Vascular smooth muscle connection” are closely connected and regulated through the calcium signaling path by “Calmodulin Binding”. This latter influences also the action of both “FC gamma R-mediated phagocytosis” and “Cytoskeleton regulation”, driven by “Integrin” and “Integrin mediated cell adhesion” [179]. Immune cells, such as macrophages, use calcium signaling [180] to engulf and eliminate infected cells, including those who would be affected by hepatitis B. Integrins mediate cell-cell and cell-ECM interactions, influencing cell migration and signaling [181]. In liver injury, integrin signaling can affect hepatocyte survival and regeneration [181,182]. During infection or immune response, disruptions in lipid metabolism, such as Glycerophospholipid Metabolism (hsa00564) and Cholesterol Metabolism, may occur, potentially causing alterations in lipid profiles and contributing to the hypercoagulable states observed in COVID-19.

2.8.1.3. Cumulative effects may originate cancerous involvement

Certainly, the cumulative effects of chronic inflammation, metabolic dysfunction, and abnormal signaling pathways can increase the risk of hepatocellular carcinoma in individuals with underlying liver disease. However, we should also consider that these cumulative effects may promote oncogenesis. In this context, the mTOR pathway is crucial in regulating cell growth, proliferation, and survival, but it was often associated with cancer [183]. Molecular changes, such as mutations in oncogenes and tumor suppressor genes, can further drive any cancer development. Even in the other two clustering analyses, we can see connections with possible cancer progression, especially in terms of genomic instability, increased proliferation, immune evasion, and metastasis. Dysregulated kinase, such as PI3K and ECM-receptor, may support cancer progression [184,185]. Ribosome biogenesis and chromatin assembly might also lead to uncontrolled cell growth [186,187]. Targeted projects are necessary in these areas to get concrete answers and reveal significant signals of cancerous evolutions. Here, we only show that cancer evolution could be possible because the specific processes are active and in common.

2.8.1.4. Neural effects

The neural and cognitive processes are another important point. LTD, “Long-term Depression” and “Calmodulin Binding” are involved in neural signaling and plasticity [188], suggesting potential effects on neurological and/or cognitive functions, which aligns with reports of neurological complications observed in COVID-19 patients [189,190,191]. The action of both “FC gamma R-mediated phagocytosis” and “Cytoskeleton regulation” [192], driven by “Integrin” and “Integrin mediated cell adhesion” can affect LTD [193]. We have found LTD (hsa04730, p-value: 7.21x10‒92) connected to “LTP, Long-term Potentiation” (hsa04720, p-value: 2.16 x 10⁻³²) with many genes in common (see Figure 11).
Figure 11. Relationships between LTP and LTD processes. These two molecular processes show many nodes in common. LTP (in red), Long-term potentiation (hsa04720), 18 nodes involved, strength 2,16 and p-value: 3.50x10⁻³². LTD (in blue), Long-term depression (hsa04730), 39 nodes involved, strength 2.52, and p-value: 7.21x10‒92. LTD is a process involving a decrease in the synaptic strength with multiple signal transduction pathways involved. While LTP is long-lasting increase in synaptic efficacy. The high Strength values show that many proteins physiologically support the involvement of multiple signal transduction pathways in both processes.
Preprints 120198 g011
The brain’s actions involve the participation and connection of both molecular processes. But there is also a potential link between these neurological processes and the S1 protein that could provide some clues about the molecular basis of the neurological impact of covid. PRKCG, MAPK1, BRAF, KRAS, and ITPR1 are part of key signaling pathways like the MAPK/ERK pathway, which is often linked to cellular stress responses, inflammation, and apoptosis. Various COVID-19-related pathologies, particularly those affecting the immune response and inflammation in different tissues, including the brain, implicate them especially in the MAPK/ERK pathway, which is often linked to cellular stress responses, inflammation, and apoptosis [194,195]. While NOS1 (nitric oxide synthase 1) is involved in producing nitric oxide, a molecule with widespread roles in neurotransmission and vasodilation. Researchers have implicated dysregulation of nitric oxide in COVID-19, particularly in relation to endothelial dysfunction, which can also affect the brain [196]. Genes of phosphoprotein phosphatase family, like PPP2CA, PPP2CB, and PRKG1 are involved in signaling cascades related to protein phosphorylation, that finely tune platelet aggregation [197] but their dysregulation could contribute to the virus's ability to manipulate cellular environments [198]. In addition, these genes have connections to inflammation, oxidative stress, and synaptic plasticity. Processes that are frequently modified during viral infections and potentially contribute to the long-term neurological consequences of COVID-19. PRKCG (Protein kinase C gamma) and MAPK1 have been shown to modulate insulin signaling and glucose uptake [199], also in the brain [200]. Disruptions in insulin and glucose metabolism pathways could contribute to neurological symptoms, including brain fog and fatigue reported in Long COVID, as these pathways closely tie to cognitive function. However, a very pertinent observation is the altered glucose metabolism in the brain reported by two French research groups [201,202]. In terms of glucose metabolism, genes like RAF1 and MAPK1 regulate metabolic homeostasis, including their effects on glucose uptake and insulin sensitivity.
Genes like GNAI2, GNAI3 (G-protein subunits) are part of G-protein-coupled receptor (GPCR) signaling pathways, which are directly involved in neurotransmitter systems, including serotonin signaling [203]. Serotonin regulation in the brain is crucial for mood, cognition, and overall neurological function. Dysregulation in this pathway could contribute to both mood disorders and cognitive symptoms seen in Long COVID patients.
To our knowledge, these results show the first molecular evidence that COVID-19 may affect brain metabolism, because of the involvement of these genes in critical brain functions, synaptic plasticity, and metabolic pathways. They potentially contribute to neuroinflammation states and energy dysregulation, affecting cognitive performance. However, further experimental and computational work should merge these links to reveal new therapeutic targets.

3. Discussion

A multitude of studies have clarified the fundamental processes related to the S1 subunit of the Spike protein of SARS-CoV-2. The protein has garnered significant attention in scientific research because of its pivotal role in viral entry into host cells and its potential implications for immunogenicity and pathogenesis [204,205,206,207,208]. In a previous investigation of the liver during the Covid-19 pandemic, we observed the interaction of S1 with specific human proteins, namely ACE2, AGER, ESR1, FKBP4, KIF18A, MED1, NEK7, PRC1, RRAGC, S100A8, SFN, TLN1, TLR4, and TMPRSS2. We considered it an interesting anomaly [10], without extensively delving into the matter. Here, we found only three proteins that coincide with those identified in that study (ACE2, ESR1, and TLR4). This seems to show a disparity in the respective metabolic contexts.
The S1 protein, through its one-to-one interactions, has opened a window into the metabolic strategies of SARS-CoV-2. Beyond the specific and solitary actions of S1 that could also be real for the vaccine, the general picture we observe has revealed many surprises. Gene redundancy within the interactome suggests the existence of a complex gene regulatory network, in which some genes can influence metabolic processes through an equally complex network of internal and external signals. The first consideration makes concerns because of the enormous number of genes and proteins that operate in the cell involved in specific functions related to the disease. What perhaps we do not consider enough is that when we focus on a single functional process and try to attribute its constituent components to it, we do not consider that we must make choices among many combinations of components. A Western blotting is not enough to say that if there are proteins, we also have the hypothesized process. The proteins are certainly there, but these same proteins can be part of many processes. Only a canonical experimental approach gives us the certainty of what we are hypothesizing. The second consideration concerns the evolution that covid can have. There are some signals that suggest thrombophilic pathologies both following the disease and vaccination, but they are the unexpected signals that should make us reflect. Finding the statistical possibility of progression to hepatitis B among the results is puzzling. Most likely, it is a statistical consequence of the overlap of many similar processes in the two viruses. However, it prompted us to look at the results from a different angle.

3.1. Considerations on Cancer Development

Our results from the interactomic analysis of the SARS-CoV-2 S1 spike subunit reveal a fascinating and complex network of biological processes, some of which appear to be associated with cancer development. Let us analyze them and discuss the potential implications. S1 carries out its peculiar solitary activity when inside the infected cell where it also operates together with other viral proteins attacking individual human proteins with multiple interactions. In this context, mTOR dysregulation is associated with various cancers [209], making this a significant finding. The strong association also suggests that SARS-CoV-2 could affect pathways involved in cell growth and metabolism, potentially leading to oncogenic processes. PI3K is another critical pathway frequently dysregulated in cancer [210]. Its presence in our results shows a potential link between SARS-CoV-2 infection and the activation of oncogenic signaling pathways. Nor can we neglect focal adhesion. This process is involved in cell adhesion, motility, and cell survival. Aberrant focal adhesion signaling plays a role in cancer metastases [211]. The presence of this GO term with a significant p-value shows a role in altering cellular environments that could predispose to tumorigenesis.

3.2. Other Observations that Support Cancer Development

Other observations also support the same idea. Dysregulation of DNA replication and chromatin assembly can lead to genomic instability, a hallmark of cancer. The significant presence of this GO terms shows that SARS-CoV-2 could affect the fidelity of DNA replication, potentially leading to mutations and cancer development. We often implicate cholesterol metabolism in cancer progression, particularly in lipid rafts. Lipid rafts are cholesterol-rich micro-domains that facilitate cell signaling, including pathways involved in cancer [212]. Finally, chronic inflammation is also a well-known risk factor for cancer. The powerful signals in complement activation and coagulation pathways could suggest that SARS-CoV-2 could contribute to a pro-inflammatory and pro-coagulant state, which over time could lead to oncogenesis [213]. All this without considering the metabolic alterations induced by S1 in common with liver cancer that we have already discussed. Our interactomic analysis suggests that S1, in SARS-CoV-2 infection, might contribute to cancer development through multiple mechanisms. These include many dysregulated mechanisms and liver-related complications as showed by the association with hepatitis B. While these findings do not definitively establish a causal link between COVID-19 and cancer, they highlight potential areas for further research to understand how SARS-CoV-2 could contribute to cancer risk, especially in long-term survivors of infection. Given the complexity and importance of these pathways, it is critical to continue exploring these associations with detailed experimental studies. Therefore, we focused on TP53 and RPS27A, two peculiar high-ranking proteins of which interactions are present in our results. Their key features are that these proteins are involved in various ways in the viral/tumor progression of cells. To isolate and characterize their "world" in our interactome, we used the STRING action “recenter” that rewires the network on these proteins, showing all the proteins in STRING that interact with them. In figure 6S, we show the interactome. The results highlight an intricate network of protein interactions, centered on TP53, a crucial tumor suppressor protein, and RPS27A, a component of the ubiquitin-proteasome pathway. We analyzed the implications of these interactions in SARS-CoV-2 infection.

3.3. TP53 Interactions

TP53 is involved in maintaining genomic stability, cell cycle arrest and apoptosis, but its role may vary depending on its binding partners [10]. In viral infections, manipulations of TP53 can favor either cellular defense or viral replication [214].
Interaction with proteins such as ATR, CHEK1,2, BRCA1, and DDB2 signals the activation of DNA repair pathways and can lead to cell cycle arrest [215]. These mechanisms would favor the cell by preserving genomic integrity and preventing proliferating virus-infected cells. In addition, interactions with BAX, BAK1, and CASP8 suggest the activation of apoptotic pathways. This is part of the cell defense mechanisms to eliminate virus-infected cells, especially before the virus can replicate.
There is also transcriptional regulation through interactions with CREBBP, EP300 and SP1, which could stimulate expressing genes that protect the cell from viral attacks (pro-apoptotic genes or antiviral responses to interferon) [216].
The interaction with TIGAR (TP53 Induced Glycolysis Regulatory Phosphatase) and SLC2A1/SLC2A2 (glucose transporters) supports all of this at the metabolic level, potentially inhibiting viral replication. This occurs by limiting the availability of glucose and directing the pathway into the pentose phosphate shunt, as viruses depend on the host metabolism [217].
Faced with these mechanisms favorable to cellular defense, we can also highlight mechanisms that are favorable to the virus. MDM2 and MDM4, which promote its degradation, negatively regulated TP53 [218]. We know that SARS-CoV-2 proteins hijack the MDM2-TP53 axis to suppress TP53-mediated apoptosis, favoring viral survival and replication [219]. While interactions with MAPK1, MAPK3, and MAPK9 suggest modulation of cellular signaling pathways. SARS-CoV-2 can activate MAPKs to promote viral replication and evade immune responses [220]. We must also consider interactions with MAPK1, MAPK3, and MAPK9. SARS-CoV-2 can activate MAPKs to promote viral replication and evade immune responses. Antiapoptotic mechanisms facilitate initial viral multiplication, while, in the infection's progression, apoptosis through cell lysis favors the release of virions.
It is no coincidence that the functional diversity of p53 has been likened to an incessant “tug of war” [221], because opposing functional processes create metabolic uncertainty.

3.3.1. RPS27A Interactions

RPS27A (a precursor of ubiquitin and ribosomal protein S27A) plays a key role in ubiquitination, which regulates protein degradation and signaling pathways. Its interaction with TP53, MDM2, and ubiquitin-related proteins such as UBE2D1/D2/D3, UBB, UBC, and USP7 suggests RPS27A is an integral part of controlling TP53 stability [222,223]. Here too, we can evaluate cell-protective actions and mechanisms that favor the virus.
Proper regulation of ubiquitin-mediated proteolysis (Ubiquitination and Proteasomal Degradation) is essential to remove damaged proteins and maintain cellular health. Interactions of RPS27A with proteasome-related components (e.g., CUL1, SKP1, RBX1) can regulate the degradation of viral proteins, preventing viral assembly and replication [224]. But SARS-CoV-2 exploits the host ubiquitin-proteasome system to degrade antiviral proteins and facilitate its own replication [225]. The interaction of RPS27A with MDM2, a key regulator of TP53 degradation, suggests that viral infection could lead to TP53 inactivation by promoting its degradation via ubiquitination.
In addition, interactions with deubiquitinating enzymes such as USP7 and UBE2I play a critical role in regulating TP53 and RPS27A [202]. Both USP7 and UBE2I are involved in the removal of ubiquitin moieties, which influences the stability and function of proteins, especially key regulators such as TP53. The virus can exploit this regulatory mechanism to weaken cellular defenses, influencing the stability and function of the two proteins. If viral manipulation distorts these pathways, it could compromise the cell's ability to mount an effective defense. SARS-CoV-2, as with other viruses, hijacks the host ubiquitin-proteasome system to evade immune responses [224]. By interacting with USP7, UBE2I, and other ubiquitin-related enzymes, the virus could: 1. Protect viral proteins from degradation. 2. Suppress TP53 activity by promoting its degradation [217,218,223] or reducing its pro-apoptotic function via SUMOylation [225]. 3. Modulate immune responses by preventing the activation of key antiviral pathways [220].

4. Conclusions

This study highlights the multifaceted roles of the S1 subunit in immune modulation, metabolic reprogramming, and systemic effects. It underscores S1 prizing in understanding COVID-19 pathophysiology. We confirm many of the observations already known on SARS-CoV-2 and covid-19, to which we give a more organic role. In addition, we uncover novel functional associations and, notably, demonstrate the extensive repertoire of genes implicated, including a significant proportion involved in diverse processes.
The interactomic analysis revealed a complex network of interconnected biological processes, some of which are associated with cancer development and cognitive effects. S1 affects overall metabolism by altering energy production, influencing lipid metabolism, modulating immune responses, and affecting systemic inflammatory processes. These changes not only support viral replication but can also lead to various metabolic disturbances in the host, contributing to the overall pathology associated both with COVID-19 and vaccination. Understanding these mechanisms is crucial for developing effective treatments and vaccines.
The unexpected interplay between Hepatitis B and COVID-19 involves pathophysiological mechanisms that may exacerbate previous or under-observed clinical liver pathology, complicating patient treatments. However, even if there might not be an explicit link between the direct metabolic activities related to S1 and hepatitis B, these overlapping biological processes highlight an intricate interplay between viral infections, immune responses, and cell metabolism. Understanding these connections is crucial to explain the precise mechanisms regarding the inexplicable presence of hepatitis B-related processes or the broader implications of viral infections on host health. Many overlapping processes are also common to cancer progression. Then, we cannot exclude anything.
Our results reveal a network of biological processes, some of which are indeed associated with cancer development. The interactomic analysis suggests that SARS-CoV-2 infection might contribute to cancer development through the dysregulation of key oncogenic pathways like mTOR and PI3K, disruption of DNA replication and chromatin assembly, proteolytic cleavage, chronic inflammation, and liver-related complications, as shown by the Hepatitis B association. These activations, associated with proinflammatory mediator release, suggest an underlying activation of blood clotting-related gene expression by specific S1 interactions, which might predispose some individuals to inflammation-related anaphylaxis and blood clotting. Recent observations have highlighted the role of hematopoietic system aging in driving cancer progression through inflammation-induced impairment of immunity [226].
These findings do not establish a causal link between COVID-19 and cancer because of the complexity of these connections. However, they highlight potential areas for further research to understand how SARS-CoV-2 might contribute to cancer risk, especially in long-term survivors of the infection. We could study the deubiquitinating enzymes and the same S1 as potential drug targets.
However, our results have some limitations. The wide-ranging assortment of genes derived from Data-merging required us to interpret the findings as collective properties that emerge from the causal topological structure induced by S1 and its functional dynamics. This justifies our resolution to present the results as sets of processes with the most statistically reliable functional characteristics, rather than going to find single functional processes. Another constraint is the vast number of overlapping processes occurring at the cellular level, as previously discussed, which rely on the data quality and quantity provided by interactomic mathematical models to researchers for their analyses. Through the application of our approach to the S1-induced interactome, we not only confirmed existing associations, but also unveiled previously unknown connections. We provided insights into the intricate modulation of gene expressions that underlie both normal and pathological functional processes. Cells with the same molecules can exhibit many and different phenotypic properties at multiple levels, making them difficult to define, classify, and understand. We integrated multiple approaches to have a coherent vision that, despite the known spatio-temporal limitations, gave us useful information. The cultural landscape in which research on deep cellular mechanisms falls is based on a static and timeless vision of the metabolism, which produces static data. The basis for the calculations of bioinformatics systems lies in this same data, leading to the formation of intricate and heterogeneous networks. However, interactomics is a mandatory intermediate step if we want to decode gene expression in its functional aspects. We should never forget that epigenetic changes, such as DNA methylation or histone modifications, influence gene expression and lead to many and different cellular responses, which manifest themselves in an innumerable number of different human phenotypes. Therefore, the result of any strategy, viral or cancerous, must first confront the phenotype of its host to progress.

Funding

“This research received no external funding”

Institutional Review Board Statement

“Not applicable”

Informed Consent Statement

“Not applicable.”

Data Availability Statement

Details regarding the data supporting the reported results are available in Supplements and Excel, Files 1, 2, 3, 4, and 5, which were generated during the study, as mentioned in the Data Availability Statement.

Acknowledgments

The author acknowledges technical support given by Drs Vincenzo Saviano and Rosario Della Santa (Unit of Medical Informatics - AOU-L. Vanvitelli. University of Campania, Naples, Italy).

Conflicts of Interest

“The author declare no conflicts of interest.”

Appendix A

Perimeter Limits of Interactomic Analysis

Interactomes offer a valuable snapshot of protein interactions within a cell. These predictive models can reveal potential pathways and regulatory mechanisms involved in metabolism. The set of information sources and experimental data in scientific literature gives rise to the actual perimeter of knowledge on which each interactomic analysis is based. Data and information are distinct, and their technical definitions get nuanced. Information results from processing, structuring, and contextualizing data. It provides meaning and helps us understand something. Understanding this distinction is crucial in interactomics where it's difficult to get reliable and certain interactions with low values of Shannon entropy [227]. The predictive power of an interactomic model is ultimately an “entropic trade-off” between the experimental “certainty” given by physical/functional interactions between proteins (for which we need a low Boltzman thermodynamic entropy [228,229]) and the level of reliability of the information (for which we need a low Shannon information entropy [230]). In the first case we have a classic thermodynamic quantity that characterizes the existence of structural interactions between proteins with low microscopic degrees of freedom, in the second case we have a symbolic method based on information theory [231] to translate the physical hypothesis into a real macroscopic prediction, essential to derive correct biological predictions from network models. The interactome is an indeterministic object of Systems Biology and its computation requires specific information from the environment, relevant to complete that task. Therefore, in a network, the probability of an interaction is specific to the context in which it occurs because it depends on the physical and functional information contained. This also means that in a different biological environment, the predictive algorithm will not work in the same way. Despite their distinct disciplinary domains [232], the amalgamation of these two entropies converges into a unified notion: to what extent does the information extracted from scientific literature regarding the interaction between two proteins accurately reflect its experimental confirmation? The response is unparalleled, as it encompasses both entropy ontologies [233,234] for tasks such as information retrieval, relation extraction, and question answering, making them indispensable for interactomics. Entropy serves as a metric to evaluate the complexity of the graph, constituting a fundamental criterion to understand and evaluate its organization but also the evolution of knowledge.
The sensitivity and competence of the researcher play a crucial role in entrusting this balance because, by varying the balance ratios, the topology of the interactome can vary. The more information channels we use, even if they are poorly reliable, the more compact our interactome appears. When we limit channels for specific interactions, the interactome becomes more “loose” and “asymmetric” because of a reduction in the number of interactions and functions. This is a recurring issue which depends only on the reliability of the "perimeter" data used by the researcher. An example of all, F2, a gene involved in blood clotting, a frequent symptom of COVID-19 patients. Gene F2 (Prothrombin, UniProt P00754-THRB_Human) converts fibrinogen to fibrin and activates factors V, VII, VIII, XIII and, in complex with Thrombomodulin, protein C in blood homeostasis and inflammation. Furthermore, it triggers the production of pro-inflammatory cytokines. Using the interactome-1060 as a base, we set it with a confidence score of 0.900 and only 6 open-source channels (without Text Mining, TM), then with 5 source channels (without TM and DB), and finally with the only source of Experiments. F2 showed 25, 10, and 10 interactions, respectively, with the proteins surrounding it. While, if we use the score of 0.900 and all seven active channels, it shows 29 interactions, and with the seven open channels and a confidence score of 0.400, it shows 61 interactions (+ 83.7% compared to 10 interactions, or 6.1 times more). This simply means that if we want to give certain and safe interpretations using mainly experimental data and highly significant scores, we face an extremely arid information landscape with certain data, but which do not allow us to range much in terms of metabolic connections or prediction. At the other extreme, we will have about 80% of distorted or incorrect conclusions that will inevitably pollute human knowledge. The choice depends only on those who manage the experimental design of the research project and the controls implemented. Of course, the best framework to operate within is one that requires all interactions to be reliable, which is not the case today. However, the entropy remains a measure of the complexity and redundancy of the graph.
Besides the previous one, we report another example aimed at the interactome-1060 in its entirety and to highlight how scarce the true experimental data are. In Excel file 1 sheet 2, we provide the composition of each of the 34,986 interactions of our interactome-1060, based on the various data sources. Using a "high confidence score" produced a final "combined score" in which the "experimental" contribution is high and the most represented. To show the details of what we said, we calculated and analyzed some data from the interactome-1060, and Table 9 reports it. STRING among its complementary actions, calculates in terms of confidence score the contribution to the combined score of each individual interaction, based on the request global made by the researcher through the settings.
Table 9. Experimental contribution to interactions in interactome-1060.
Interaction type Abundance Confidence score Incidence%
Total interactions 34,986* - -
No experimental characterization 3,016 - 8.62
Highest score experimentally proven interactions 19,556 Score ≥ 0.9 55.89
High score experimentally proven interactions 5,233 0.7 ≤ score < 0.9 14.94
Medium score experimentally proven interactions 2,722 0.4 ≤ score < 0.7 7.78
Low score interactions 4,462 Score ≤ 0.4 12.75
Combined experimental interactions used in this study 24,789 high and highest 70.85
Notes: The file Excel 1 reports the original data. *) STRING doubles the number of calculated interactions as it considers both directions (from A to B and from B to A).
Table 9 reveals that, even when setting a high confidence score, other interfering factors from the different data sources contribute to a wide distribution of the percentage of incidences of the confidence score of the experimental data. Less certain interactions can lead to incomplete or inaccurate interpretations of metabolic pathways. While the use of only the "experimental" channel with the highest score would drastically limit and reduce the topology and calculated functions. Therefore, when we need as much “real” data as possible, it is necessary balancing the channels that introduce more interfering data. By understanding both the strengths and weaknesses of using interactomes, we can make informed decisions about the reliability of the results we encounter. In our case, we have 78.63% of reliable experimental data (highest + high), which is a compromise to eliminate the Text Mining channel. What is surprising is that 8.62% of interactions never had experimental characterization. But what is even more surprising is that, in the total absence of experimental data, corresponding channels (for example “annotated databases”) show confidence scores of 0.900 for these interactions, which means we have 8.62% interactions with misleading information. Many researchers will use this information to discuss their results or to design a new scientific project. The question to ask is, how much does this value influence scientific knowledge of the sector and future scientific projects? Most likely, the strong career pressures that many researchers face, the speed of the reviews that referees undergo, and the citations in predatory journals that eventually enter the scientific knowledge system all contribute to this bias. In conclusion, source matters because the reliability of information hinges on its source. Credible sources like established academic journals provide more reliable information. Anyway, also verification is crucial: just because information exists doesn't guarantee its truth. Cross-checking information with multiple sources, considering the researcher's expertise, and looking for potential biases are crucial for assessing reliability.

References

  1. Pietzner, M., Denaxas, S., Yasmeen, S., Ulmer, M. A., Nakanishi, T., Arnold, M., Kastenmüller, G,. Hemingway, H., & Langenberg, C. (2024). Complex patterns of multimorbidity associated with severe COVID-19 and long COVVID. Communications Medicine, 4(1), 94.
  2. Ewing, A. G., Salamon, S., Pretorius, E., Joffe, D., Fox, G., Bilodeau, S., & Bar-Yam, Y. (2024). Review of organ damage from COVID and Long COVID: a disease with a spectrum of pathology. Medical Review.
  3. Yu, G., & Huang, H. (2024). The logic of coronavirus infection: revealing the heterogeneity of disease progression and treatment outcomes in COVID patients. Res. Square, preprint. [CrossRef]
  4. Fernández-de-Las-Peñas, C., Torres-Macho, J., Catahay, J. A., Macasaet, R., Velasco, J. V., Macapagal, S., et al. & Notarte, K. I. (2024). Is antiviral treatment at the acute phase of COVID-19 effective for decreasing the risk of long-COVID? A systematic review. Infection, 52(1), 43-58.
  5. Greene, C., Connolly, R., Brennan, D., Laffan, A., O’Keeffe, E., Zaporojan, L., O’Callaghan, O., Thomson, B., Connolly, E., Argue, R., et al., (2024). Blood–brain barrier disruption and sustained systemic inflammation in individuals with long COVID-associated cognitive impairment. Nature neuroscience, 27(3), 421-432.
  6. Strongin, S. R., Stelson, E., Soares, L., Sukhatme, V., Dasher, P., Schito, M., Challa, AP., Geng, LN., & Walker, T. A. (2024). Using real-world data to accelerate the search for long COVID therapies. Life Sciences, 122940.
  7. Nahalka, J. (2024). 1-L Transcription of SARS-CoV-2 Spike Protein S1 Subunit. International Journal of Molecular Sciences, 25(8), 4440.
  8. Parry, PI; Lefringhausen, A.; Turni, C.; Neil, CJ; Cosford, R.; Hudson, NJ; Gillespie, J. 'Spikeopathy': la proteina spike del COVID-19 è patogena, sia dal virus che dall'mRNA del vaccino. Biomedicines 2023, 11, 2287. [ Google Scholar] [ CrossRef ].
  9. Mulroney, T. E., Pöyry, T., Yam-Puc, J. C., Rust, M., Harvey, R. F., Kalmar, L., Horne, E., Booth, L., Ferreira, AP., Stoneley, M., et al., (2024). N 1-methylpseudouridylation of mRNA causes+ 1 ribosomal frameshifting. Nature, 625(7993), 189-194.
  10. Colonna, G. (2024). Understanding the SARS-CoV-2–Human Liver Interactome Using a Comprehensive Analysis of the Individual Virus–Host Interactions. Livers, 4(2), 209-239.
  11. Mansueto, G., Fusco, G., & Colonna, G. (2024). A Tiny Viral Protein, SARS-CoV-2-ORF7b: Functional Molecular Mechanisms. Biomolecules, 14(5), 541.
  12. Sun, Z., Ren, K., Zhang, X., Chen, J., Jiang, Z., Jiang, J., ... & Li, L. (2021). Mass spectrometry analysis of newly emerging coronavirus HCoV-19 spike protein and human ACE2 reveals camouflaging glycans and unique post-translational modifications. Engineering, 7(10), 1441-1451.
  13. Mouliou, D. S., & Dardiotis, E. (2022). Current evidence in SARS-CoV-2 mRNA vaccines and post-vaccination adverse reports: knowns and unknowns. Diagnostics, 12(7), 1555.
  14. Cosentino, M., & Marino, F. (2022). The spike hypothesis in vaccine-induced adverse effects: questions and answers. Trends in molecular medicine, 28(10), 797-799.
  15. Tan, X., Lin, C., Zhang, J., Khaing Oo, M. K., & Fan, X. (2020). Rapid and quantitative detection of COVID-19 markers in micro-liter sized samples. BioRxiv, 2020-04.
  16. Bošnjak, B., Stein, S. C., Willenzon, S., Cordes, A. K., Puppe, W., Bernhardt, G., Ravens, I., Ritter, C., Schultze-Florey, C., Godecke, N., et al (2021). Low serum neutralizing anti-SARS-CoV-2 S antibody levels in mildly affected COVID-19 convalescent patients revealed by two different detection methods. Cellular & molecular immunology, 18(4), 936-944.
  17. Yonker, L. M., Swank, Z., Bartsch, Y. C., Burns, M. D., Kane, A., Boribong, B. P., Davis, JP., Loiselle, M., Novak, T., Senussi, Y., et al., (2023). Circulating spike protein detected in post–COVID-19 mRNA vaccine myocarditis. Circulation, 147(11), 867-876.
  18. Yang, Y.; Fang, Q.; Shen, H.-B. Predicting gene regulatory interactions based on spatial gene expression data and deep learning. PLoS Comput. Biol. 2019, 15, e1007324. [CrossRef]
  19. Chikofsky, E.; Cross, J. Reverse engineering and design recovery: A taxonomy. IEEE Softw. 1990, 7, 13–17. [CrossRef]
  20. Green, S. Can biological complexity be reverse engineered? Stud. Hist. Philos. Sci. Part C Stud. Hist. Philos. Biol. Biomed. Sci. 2015, 53, 73–83.
  21. Natale, J.L.; Hofmann, D.; Hernández, D.G.; Nemenman, I. Reverse-engineering biological networks from large data sets. arXiv 2017, arXiv:1705.06370.
  22. Oughtred R, Rust J, Chang C, Breitkreutz BJ, Stark C, Willems A, Boucher L, Leung G, Kolas N, Zhang F, Dolma S, Coulombe-Huntington J, Chatr-Aryamontri A, Dolinski K, Tyers M. The BioGRID database: A comprehensive biomedical resource of curated protein, genetic, and chemical interactions. Protein Sci. 2021 Jan;30(1):187-200. Epub 2020 Nov 23. PMID: 33070389; PMCID: PMC7737760. [CrossRef]
  23. Szklarczyk, D.; Gable, A.L.; Nastou, K.C.; Lyon, D.; Kirsch, R.; Pyysalo, S.; Doncheva, N.T.; Legeay, M.; Fang, T.; Bork, P.; et al. The STRING database in 2021: Customizable protein–protein networks, and functional characterization of user-uploaded gene/measurement sets. Nucleic Acids Res. 2020, 49, D605–D612; Erratum in: Nucleic Acids Res. 2021, 49, 10800. [CrossRef]
  24. Szklarczyk, D.; Kirsch, R.; Koutrouli, M.; Nastou, K.; Mehryary, F.; Hachilif, R.; Gable, A.L.; Fang, T.; Doncheva, N.T.; Pyysalo, S.; et al. The STRING database in 2023: Protein–protein association networks and functional enrichment analyses for any sequenced genome of interest. Nucleic Acids Res. 2022, 51, D638–D646. [CrossRef]
  25. Doncheva, N.T.; Morris, J.H.; Gorodkin, J.; Jensen, L.J. Cytoscape StringApp: Network Analysis and Visualization of Proteomics Data. J. Proteome Res. 2018, 18, 623–632. [CrossRef]
  26. Chung, F.; Lu, L.; Dewey, T.G.; Galas, D.J. Duplication Models for Biological Networks. J. Comput. Biol. 2003, 10, 677–687. [CrossRef]
  27. Scardoni, G.; Tosadori, G.; Faizan, M.; Spoto, F.; Fabbri, F.; Laudanna, C. Biological network analysis with CentiScaPe:Centralities and experimental dataset integration. F1000Research 2015, 3, 139. [CrossRef]
  28. Perera, S.; Perera, H.N.; Kasthurirathna, D. Structural characteristics of complex supply chain networks. In Proceedings of the 2017 Moratuwa Engineering Research Conference (MERCon), Moratuwa, Sri Lanka, 29–31 May 2017; pp. 135–140. h􀄴ps://doi.org/10.1109/MERCon.2017.7980470.
  29. Barabási, A.-L. Network Science, 1st ed.; Cambridge University Press: Cambridge, UK, 2016.
  30. Syakur, M.A.; Khotimah, BK.; Rochman, EMS.; Satoto, BD. Integration K-Means Clustering Method and Elbow Method for Identification of The Best Customer Profile Cluster — IOP Conference Series. Mater. Sci. Eng. 2018, 336, 012017. [CrossRef]
  31. Erdős, G.; Dosztányi, Z. Analyzing Protein Disorder with IUPred2A. Curr. Protoc. Bioinform. 2020, 70, e99. [CrossRef]
  32. Drozdetskiy, A.; Cole, C.; Procter, J.; Barton, G.J. JPred4: A protein secondary structure prediction server. Nucleic Acids Res. 2015, 43, W389–W394. h􀄴ps://doi.org/10.1093/nar/gkv332.
  33. Arakawa, K., Tomita, M. (2013). Merging Multiple Omics Datasets In Silico: Statistical Analyses and Data Interpretation. In: Alper, H. (eds) Systems Metabolic Engineering. Methods in Molecular Biology, vol 985. Humana Press, Totowa, NJ. [CrossRef]
  34. Das, R. K., & Pappu, R. V. (2013). Conformations of intrinsically disordered proteins are influenced by linear sequence distributions of oppositely charged residues. Proceedings of the National Academy of Sciences, 110(33), 13392-13397.
  35. A.S. Holehouse, R.K. Das, J.N. Ahad, M.O.G. Richardson, R.V. Pappu (2017) CIDER: Resources to analyze sequence-ensemble relationships of intrinsically disordered proteins. Biophysical Journal, 112: 16-21.
  36. Das, Rahul K.; Ruff, Kiersten M.; Pappu, Rohit V. Relating sequence encoded information to form and function of intrinsically disordered proteins. Current Opinion in Structural Biology (2015), 32 (), 102-112CODEN: COSBEF; ISSN:0959-440X. (Elsevier Ltd.).
  37. Theillet, F. X., Kalmar, L., Tompa, P., Han, K. H., Selenko, P., Dunker, A. K., ... & Uversky, V. N. (2013). The alphabet of intrinsic disorder: I. Act like a Pro: On the abundance and roles of proline residues in intrinsically disordered proteins. Intrinsically Disordered Proteins, 1(1), e24360.
  38. Ali SA, Ayalew H, Gautam B, Selvaraj B, She JW, Janardhanan JA, Yu HH. Detection of SARS-CoV-2 Spike Protein Using Micropatterned 3D Poly(3,4-Ethylenedioxythiophene) Nanorods Decorated with Gold Nanoparticles. ACS Appl Mater Interfaces. 2024 Jan 9. Epub ahead of print. PMID: 38193284. [CrossRef]
  39. Letarov AV, Babenko VV, Kulikov EE. Free SARS-CoV-2 Spike Protein S1 Particles May Play a Role in the Pathogenesis of COVID-19 Infection. Biochemistry (Mosc). 2021 Mar;86(3):257-261. PMID: 33838638; PMCID: PMC7772528. [CrossRef]
  40. V’kovski, Philip; Kratzel, Annika; Steiner, Silvio; Stalder, Hanspeter; Thiel, Volker (March 2021). "Coronavirus biology and replication: implications for SARS-CoV-2". Nature Reviews Microbiology. 19 (3): 155–170. [CrossRef]
  41. Cortés-Sarabia K, Luna-Pineda VM, Rodríguez-Ruiz HA, Leyva-Vázquez MA, Hernández-Sotelo D, Beltrán-Anaya FO, Vences-Velázquez A, Del Moral-Hernández O, Illades-Aguiar B. Utility of in silico-identified-peptides in spike-S1 domain and nucleocapsid of SARS-CoV-2 for antibody detection in COVID-19 patients and antibody production. Sci Rep. 2022 Sep 5;12(1):15057. PMID: 36064951; PMCID: PMC9442563. [CrossRef]
  42. Feng Y, Yi K, Gong F, Zhang Y, Shan X, Ji X, Zhou F, He Z. Ultra-sensitive detection of SARS-CoV-2 S1 protein by coupling rolling circle amplification with poly(N-isopropylacrylamide)-based sandwich-type assay. Talanta. 2024 Jul 14;279:126572. Epub ahead of print. PMID: 39024855. [CrossRef]
  43. Dunker, A. K., Lawson, J. D., Brown, C. J., Williams, R. M., Romero, P., Oh, J. S., Oldfield, C., Campen, AM., Ratlif, C., Hipps, K., Ausio, J., et al., (2001). Intrinsically disordered protein. Journal of molecular graphics and modelling, 19(1), 26-59. [CrossRef]
  44. Ragone, R., Facchiano, F., Facchiano, A., Facchiano, A. M., & Colonna, G. (1989). Flexibility plot of proteins. Protein Engineering, Design and Selection, 2(7), 497-504. [CrossRef]
  45. Mao, A. H., Lyle, N., & Pappu, R. V. (2013). Describing sequence–ensemble relationships for intrinsically disordered proteins. Biochemical Journal, 449(2), 307-318.
  46. Campen A, Williams RM, Brown CJ, Meng J, Uversky VN, Dunker AK. TOP-IDP-scale: a new amino acid scale measuring propensity for intrinsic disorder. Protein Pept Lett. 2008;15(9):956-63. PMID: 18991772; PMCID: PMC2676888. [CrossRef]
  47. Zhang XW, Yap YL. The 3D structure analysis of SARS-CoV S1 protein reveals a link to influenza virus neuraminidase and implications for drug and antibody discovery. Theochem. 2004 Jul 26;681(1):137-141. Epub 2004 Jul 9. PMID: 32287547; PMCID: PMC7126208. [CrossRef]
  48. Bozhilova, L. V., Whitmore, A. V., Wray, J., Reinert, G., & Deane, C. M. (2019). Measuring rank robustness in scored protein interaction networks. BMC bioinformatics, 20, 1-14.
  49. Guidotti, R.; Gardoni, P.; Chen, Y. Network reliability analysis with link and nodal weights and auxiliary nodes. Struct. Saf. 2017, 65, 12–26. [CrossRef]
  50. De Vico Fallani, F.; Richiardi, J.; Chavez, M.; Achard, S. Graph analysis of functional brain networks: Practical issues in translational neuroscience. Philos. Trans. R. Soc. B Biol. Sci. 2014, 369, 20130521. [CrossRef]
  51. Li, V.; Silvester, J. Performance Analysis of Networks with Unreliable Components. IEEE Trans. Commun. 1984, 32, 1105–1110. [CrossRef]
  52. 52] Knight, S.; Nguyen, H.X.; Falkner, N.; Bowden, R.; Roughan, M. The Internet Topology Zoo. IEEE J. Sel. Areas Commun. 2011, 29, 1765–1775. [CrossRef]
  53. Swarthout JT, Lobo S, Farh L, Croke MR, Greentree WK, Deschenes RJ, Linder ME. DHHC9 and GCP16 constitute a human protein fatty acyltransferase with specificity for H- and N-Ras. J Biol Chem. 2005 Sep 2;280(35):31141-8. Epub 2005 Jul 6. PMID: 16000296. [CrossRef]
  54. Marom R, Burrage LC, Venditti R, Clément A, Blanco-Sánchez B, Jain M, Scott DA, Rosenfeld JA, Sutton VR, Shinawi M, et al., Undiagnosed Diseases Network; Westerfield M, De Matteis MA, Lee B. COPB2 loss of function causes a coatopathy with osteoporosis and developmental delay. Am J Hum Genet. 2021 Sep 2;108(9):1710-1724. Epub 2021 Aug 26. PMID: 34450031; PMCID: PMC8456174. [CrossRef]
  55. Sheikhahmadi, A., Nematbakhsh, M. A., & Shokrollahi, A. (2015). Improving detection of influential nodes in complex networks. Physica A: Statistical Mechanics and its Applications, 436, 833-845.
  56. Kazemzadeh, Farzaneh & Safaei, Ali & Mirzarezaee, Mitra. (2022). Optimal selection of seed nodes by reducing the influence of common nodes in the influence maximization problem. 1-7. 10.1109/IKT57960.2022.10039040. Conference article: 13th International Conference on Information and Knowledge Technology (IKT).
  57. Tandel, S. S., Jamadar, A., & Dudugu, S. (2019, March). A survey on text mining techniques. In 2019 5th International Conference on Advanced Computing & Communication Systems (ICACCS) (pp. 1022-1026). IEEE.
  58. Salloum, S.A., Al-Emran, M., Monem, A.A., Shaalan, K. (2018). Using Text Mining Techniques for Extracting Information from Research Articles. In: Shaalan, K., Hassanien, A., Tolba, F. (eds) Intelligent Natural Language Processing: Trends and Applications. Studies in Computational Intelligence, vol 740. Springer, Cham. [CrossRef]
  59. Y. Hasin, M. Seldin and A. Lusis, Multi-omics approaches to disease, Genome Biol., 2017, 18(1), 83.
  60. Graw, S., Chappell, K., Charity L. Gies, A., Bird, J., Robeson, M., Stephanie D., Multi-omics data integration considerations and study design for biological systems and disease, Mol. Omics, 2021, 17, 2, 170-185, The Royal Society of Chemistry, doi="10.1039/D0MO00041H". [CrossRef]
  61. Spirin, V., Minry, LA., Protein complexes and functional modules in molecular networks. Proceedings of the National Academy of Sciences, 2003, 100.21: 12123-12128.
  62. Morea, F., & De Stefano, D. (2024). Enhancing Stability and Assessing Uncertainty in Community Detection through a Consensus-based Approach. arXiv preprint arXiv:2408.02959.
  63. Barabási, A. L. (2013). Network science. Philosophical Transactions of the Royal Society A: Mathematical, Physical and Engineering Sciences, 371(1987), Chapter 9, 20120375.
  64. Wimsatt, W. C. (2007). Re-engineering philosophy for limited beings: Piecewise approximations to reality. Harvard University Press.
  65. Chen, D., Lü, L., Shang, M. S., Zhang, Y. C., & Zhou, T. (2012). Identifying influential nodes in complex networks. Physica a: Statistical mechanics and its applications, 391(4), 1777-1787.
  66. Barabási, A. L. (2013). Network science. Philosophical Transactions of the Royal Society A: Mathematical, Physical and Engineering Sciences, 371(1987), 20120375.
  67. Barabási, A.-L. Network Science, 1st ed.; Cambridge University Press: Cambridge, UK, 2016.
  68. Mao J, O'Gorman C, Sutovsky M, Zigo M, Wells KD, Sutovsky P. Ubiquitin A-52 residue ribosomal protein fusion product 1 (Uba52) is essential for preimplantation embryo development. Biol Open. 2018 Oct 2;7(10):bio035717. PMID: 30135083; PMCID: PMC6215406. [CrossRef]
  69. Eastham MJ, Pelava A, Wells GR, Watkins NJ, Schneider C. RPS27a and RPL40, Which Are Produced as Ubiquitin Fusion Proteins, Are Not Essential for p53 Signalling. Biomolecules. 2023 May 28;13(6):898. PMID: 37371478; PMCID: PMC10296562. [CrossRef]
  70. van den Heuvel J, Ashiono C, Gillet LC, Dörner K, Wyler E, Zemp I, Kutay U. Processing of the ribosomal ubiquitin-like fusion protein FUBI-eS30/FAU is required for 40S maturation and depends on USP36. Elife. 2021 Jul 28;10:e70560. PMID: 34318747; PMCID: PMC8354635. [CrossRef]
  71. Park C, Walsh D. RACK1 Regulates Poxvirus Protein Synthesis Independently of Its Role in Ribosome-Based Stress Signaling. J Virol. 2022 Sep 28;96(18):e0109322. Epub 2022 Sep 13. PMID: 36098514; PMCID: PMC9517738. [CrossRef]
  72. Jha S, Rollins MG, Fuchs G, Procter DJ, Hall EA, Cozzolino K, Sarnow P, Savas JN, Walsh D. Trans-kingdom mimicry underlies ribosome customization by a poxvirus kinase. Nature. 2017 Jun 29;546(7660):651-655. Epub 2017 Jun 21. PMID: 28636603; PMCID: PMC5526112. [CrossRef]
  73. Mauro V.P., Edelman G.M. The ribosome filter hypothesis. Proc. Natl Acad. Sci. USA. 2002; 99:12031–12036.
  74. Elhamamsy, A.R., Metge, B.J., Alsheikh, H.A., Shevde, L.A., Samant, R.S. Ribosome biogenesis: a central player in cancer metastasis and therapeutic resistance. Cancer Res. 2022; 82:2344–2353.
  75. Lee A.S., Burdeinick-Kerr, R., Whelan, S.P. A ribosome-specialized translation initiation pathway is required for cap-dependent translation of vesicular stomatitis virus mRNAs. Proc. Natl Acad. Sci. USA. 2013; 110:324–329.
  76. Shi Z., Fujii K., Kovary K.M., Genuth N.R., Rost H.L., Teruel M.N., Barna M. Heterogeneous ribosomes preferentially translate distinct subpools of mRNAs genome-wide. Mol. Cell. 2017; 67:71–83.
  77. Tu C., Meng L., Nie H., Yuan S., Wang W., Du J., Lu G., Lin G., Tan Y.Q. A homozygous RPL10L missense mutation associated with male factor infertility and severe oligozoospermia. Fertil. Steril. 2020; 113:561–568.
  78. Dong, J. & Horvath, S. Understanding network concepts in modules. BMC Syst. Biol. 1, 24 (2007).
  79. Stelzl, U. et al. A human protein-protein interaction network: a resource for annotating the proteome. Cell 122, 957–968 (2005).
  80. Shannon, P.; Markiel, A.; Ozier, O.; Baliga, N.S.; Wang, J.T.; Ramage, D.; Amin, N.; Schwikowski, B.; Ideker, T. Cytoscape: A software environment for integrated models of Biomolecular Interaction Networks. Genome Res. 2003, 13, 2498–2504. h􀄴ps://doi.org/10.1101/gr.1239303.
  81. Assenov, Y.; Ramírez, F.; Schelhorn, S.-E.; Lengauer, T.; Albrecht, M. Computing topological parameters of biological networks. Bioinformatics 2008, 24, 282–284. h􀄴ps://doi.org/10.1093/bioinformatics/btm554.
  82. Li, V.; Silvester, J. Performance Analysis of Networks with Unreliable Components. IEEE Trans. Commun. 1984, 32, 1105–1110. [CrossRef]
  83. A.-L. Barabási, R.Albert, and H. Jeong. Mean-field theory of scale-free random networks. Physica A 272:173-187, 1999.
  84. H. Jeong, B. Tombor, R. Albert, Z. N. Oltvai, and A.-L. Barabási. The large-scale organization of metabolic networks. Nature 407: 651-654, 2000.
  85. Wagner, A. and D.A. Fell. The small world inside large metabolic networks. Proc. R. Soc. Lond. B 268: 1803–1810, 2001.
  86. L.A.N. Amaral, A. Scala, M. Barthelemy and H.E. Stanley. Classes of small-world networks. Proceeding National Academy of Sciences U. S. A. 97:11149-11152, 2000.
  87. K.-I. Goh, B. Kahng, and D. Kim. Universal behavior of load distribution in scale-free networks. Phys. Rev. Lett. 87: 278701, 2001.
  88. Strogatz, S. H. Exploring complex networks. Nature 410, 268–276 (2001).
  89. Chen, B., Fan, W., Liu, J., & Wu, F. X. (2014). Identifying protein complexes and functional modules—from static PPI networks to dynamic PPI networks. Briefings in bioinformatics, 15(2), 177-194.
  90. V. Havel. A remark on the existence of finite graphs. Casopis Pest. Mat., 80:477-480, 1955.
  91. Charo Del Genio, G. Thilo, and K.E. Bassler. All scale-free networks are sparse. Phys. Rev. Lett. 107:178701, 10 2011.
  92. G. Bianconi and A.-L. Barabási. Competition and multiscaling in evolving networks. Europhysics Letters, 54: 436-442, 2001.
  93. A.-L. Barabási, R. Albert, H. Jeong, and G. Bianconi. Power-law distribution of the world wide web. Science, 287: 2115, 2000.
  94. M. Medo, G. Cimini, and S. Gualdi. Temporal effects in the growth of networks. Phys. Rev. Lett., 107:238701, 2011.
  95. S. N. Dorogovtsev, J.F.F. Mendes, and A.N. Samukhin. Structure of growing networks with preferential linking. Phys. Rev. Lett., 85: 4633, 2000.
  96. G. Bianconi and A.-L. Barabási. Bose-Einstein condensation in complex networks. Phys. Rev. Lett., 86: 5632–5635, 2001.
  97. Yukalov, V I (2005). "Number-of-particle fluctuations in systems with Bose-Einstein condensate". Laser Physics Letters. 2 (3): 156–161.
  98. Pizzuti, C. (2017). Evolutionary computation for community detection in networks: A review. IEEE Transactions on Evolutionary Computation, 22(3), 464-483.
  99. Mardikoraem M, Woldring D. Protein Fitness Prediction Is Impacted by the Interplay of Language Models, Ensemble Learning, and Sampling Methods. Pharmaceutics. 2023 Apr 25;15(5):1337. PMID: 37242577; PMCID: PMC10224321. [CrossRef]
  100. Golinski A.W., Mischler K.M., Laxminarayan S., Neurock N.L., Fossing M., Pichman H., Martiniani S., Hackel B.J. High-Throughput Developability Assays Enable Library-Scale Identification of Producible Protein Scaffold Variants. Proc. Natl. Acad. Sci. USA. 2021;118:e2026658118. [CrossRef]
  101. Wang S., Liu D., Ding M., Du Z., Zhong Y., Song T., Zhu J., Zhao R. SE-OnionNet: A Convolution Neural Network for Protein–Ligand Binding Affinity Prediction. Front. Genet. 2021;11:607824. [CrossRef]
  102. Kuzmin K., Adeniyi A.E., DaSouza A.K., Lim D., Nguyen H., Molina N.R., Xiong L., Weber I.T., Harrison R.W. Machine Learning Methods Accurately Predict Host Specificity of Coronaviruses Based on Spike Sequences Alone. Biochem. Biophys. Res. Commun. 2020;533:553–558. [CrossRef]
  103. Das S., Chakrabarti S. Classification and Prediction of Protein–Protein Interaction Interface Using Machine Learning Algorithm. Sci. Rep. 2021;11:1761. [CrossRef]
  104. Stiuso, P., Ragone, R., & Colonna, G. (1990). Molecular organization and structural stability of. beta. s-crystallin from calf lens. Biochemistry, 29(16), 3929-3936.
  105. Vazquez, R. Pastor-Satorras, and A. Vespignani. Large-scale topological and dynamical properties of Internet. Phys. Rev., E 65: 066130, 2002.
  106. R. Xulvi-Brunet and I. M. Sokolov. Changing correlations in networks: assortativity and dissortativity. Acta Phys. Pol. B, 36: 1431, 2005.
  107. M. Posfai, Y Y. Liu, J-J Slotine, and A.-L. Barabási. Effect of correlations on network controllability. Scientific Reports, 3: 1067, 2013.
  108. Li, J., & Convertino, M. (2021). Inferring ecosystem networks as information flows. Scientific reports, 11(1), 7094.
  109. Iakoucheva, L.M., Brown, C.J., Lawson, J.D., Obradovic, Z., and Dunker, A.K. (2002). Intrinsic disorder in cell-signaling and cancer-associated proteins. J. Mol. Biol. 323, 573–584.
  110. Higurashi, M., Ishida, T., and Kinoshita, K. (2008). Identification of transient hub proteins and the possible structural basis for their multiple interactions. Protein Sci. 17, 72–78.
  111. Han, J.D., Bertin, N., Hao, T., Goldberg, D.S., Berriz, G.F., Zhang, L.V., Dupuy, D., Walhout, A.J., Cusick, M.E., Roth, F.P., and Vidal, M. (2004). Evidence for dynamically organized modularity in the yeast protein-protein interaction network. Nature 430, 88–93.
  112. Hu G, Wu Z, Uversky VN, Kurgan L. Functional Analysis of Human Hub Proteins and Their Interactors Involved in the Intrinsic Disorder-Enriched Interactions. Int J Mol Sci. 2017 Dec 19;18(12):2761. PMID: 29257115; PMCID: PMC5751360. [CrossRef]
  113. Lun XK, Zanotelli VR, Wade JD, Schapiro D, Tognetti M, Dobberstein N, Bodenmiller B. Influence of node abundance on signaling network state and dynamics analyzed by mass cytometry. Nat Biotechnol. 2017 Feb;35(2):164-172. Epub 2017 Jan 16. PMID: 28092656; PMCID: PMC5617104. [CrossRef]
  114. Perovic, V., Sumonja, N., Marsh, L. A., Radovanovic, S., Vukicevic, M., Roberts, S. G., & Veljkovic, N. (2018). IDPpi: Protein-protein interaction analyses of human intrinsically disordered proteins. Scientific reports, 8(1), 10563.
  115. Hwang, W., Cho, Y. R., Zhang, A., & Ramanathan, M. (2006, March). Bridging centrality: identifying bridging nodes in scale-free networks. In Proceedings of the 12th ACM SIGKDD international conference on knowledge discovery and data mining (pp. 20-23).
  116. Tripathi LP, et al. (2013) Understanding the Biological Context of NS5A-Host Interactions in HCV Infection: A Network-Based Approach. J Proteome Res. [PubMed:23682656].
  117. Soofi A, Taghizadeh M, Tabatabaei SM, Rezaei Tavirani M, Shakib H, Namaki S, Safari Alighiarloo N. Centrality Analysis of Protein-Protein Interaction Networks and Molecular Docking Prioritize Potential Drug-Targets in Type 1 Diabetes. Iran J Pharm Res. 2020 Fall;19(4):121-134. PMID: 33841528; PMCID: PMC8019861. [CrossRef]
  118. Zhang A. Protein interaction networks: computational Analysis. Cambridge University Press; 2009.
  119. Shannon P, Markiel A, Ozier O, Baliga NS, Wang JT, Ramage D, Amin N, Schwikowski B, Ideker T. Cytoscape: a software environment for integrated models of biomolecular interaction networks. Genome Res. 2003; 13:2498–504.
  120. Bu D, Zhao Y, Cai L, Xue H, Zhu X, Lu H, Zhang J, Sun S, Ling L, Zhang N, Li G, Chen R. Topological structure analysis of the protein-protein interaction network in budding yeast. Nucleic Acids Res. 2003 May 1;31(9):2443-50. PMID: 12711690; PMCID: PMC154226. [CrossRef]
  121. Negre CFA, Morzan UN, Hendrickson HP, Pal R, Lisi GP, Loria JP, Rivalta I, Ho J, Batista VS. Eigenvector centrality for characterization of protein allosteric pathways. Proc Natl Acad Sci U S A. 2018 Dec 26;115(52):E12201-E12208. Epub 2018 Dec 10. PMID: 30530700; PMCID: PMC6310864. [CrossRef]
  122. Fletcher, J. M., & Wennekers, T. (2018). From structure to activity: Using centrality measures to predict neuronal activity. International journal of neural systems, 28(02), 1750013.
  123. Chen, SJ., Liao, DL., Chen, CH. et al. Construction and Analysis of Protein-Protein Interaction Network of Heroin Use Disorder. Sci Rep 9, 4980 (2019). [CrossRef]
  124. Vallabhajosyula RR, Chakravarti D, Lutfeali S, Ray A, Raval A. Identifying hubs in protein interaction networks. PLoS One. 2009;4(4):e5344. Epub 2009 Apr 28. PMID: 19399170; PMCID: PMC2670494. [CrossRef]
  125. Kadoki M, Patil A, Thaiss CC, Brooks DJ, Pandey S, Deep D, Alvarez D, von Andrian UH, Wagers AJ, Nakai K, Mikkelsen TS, Soumillon M, Chevrier N. Organism-Level Analysis of Vaccination Reveals Networks of Protection across Tissues. Cell. 2017 Oct 5;171(2):398-413.e21. Epub 2017 Sep 21. PMID: 28942919; PMCID: PMC7895295. [CrossRef]
  126. López CB, and Hermesh T (2011). Systemic responses during local viral infections: type I IFNs sound the alarm. Current Opinion in Immunology 23, 495–499.
  127. Manz MG, and Boettcher S (2014). Emergency granulopoiesis. Nature Reviews Immunology 14, 302–314.
  128. Schenkel JM, and Masopust D (2014). Tissue-resident memory T cells. Immunity 41, 886–897.
  129. Kadoki M, Patil A, Thaiss CC, Brooks DJ, Pandey S, Deep D, Alvarez D, von Andrian UH, Wagers AJ, Nakai K, Mikkelsen TS, Soumillon M, Chevrier N. Organism-Level Analysis of Vaccination Reveals Networks of Protection across Tissues. Cell. 2017 Oct 5;171(2):398-413.e21. Epub 2017 Sep 21. PMID: 28942919; PMCID: PMC7895295. [CrossRef]
  130. Jiang X, Clark RA, Liu L, Wagers AJ, Fuhlbrigge RC, and Kupper TS (2012). Skin infection generates non-migratory memory CD8+ TRM cells providing global skin immunity. Nature 483, 227–231.
  131. Stary G, Olive A, Radovic-Moreno AF, Gondek D, Alvarez D, Basto PA, Perro M, Vrbanac VD, Tager AM, Shi J, et al. (2015). VACCINES. A mucosal vaccine against Chlamydia trachomatis generates two waves of protective memory T cells. Science 348, aaa8205.
  132. Scardoni, G. and Laudanna, C. (2012) ‘Centralities based analysis of complex networks’, New Frontiers in Graph Theory, InTech Open.
  133. Melé M, Ferreira PG, Reverter F, DeLuca DS, Monlong J, Sammeth M, Young TR, Goldmann JM, Pervouchine DD, Sullivan TJ, et al. (2015). The human transcriptome across tissues and individuals. Science 348, 660–665.
  134. Dobrin R, Zhu J, Molony C, Argman C, Parrish ML, Carlson S, Allan MF, Pomp D, and Schadt EE (2009). Multi-tissue coexpression networks reveal unexpected subnetworks associated with disease. Genome Biol 10, R55.
  135. Ariotti S, Hogenbirk MA, Dijkgraaf FE, Visser LL, Hoekstra ME, Song J-Y, Jacobs H, Haanen JB, and Schumacher TN (2014). T cell memory. Skin-resident memory CD8⁺ T cells trigger a state of tissue-wide pathogen alert. Science 346, 101–105.
  136. Braun, E., & Marom, S. (2015). Universality, complexity and the praxis of biology: Two case studies. Studies in History and Philosophy of Science Part C: Studies in History and Philosophy of Biological and Biomedical Sciences, 53, 68-72.
  137. Green, S. (2015). Can biological complexity be reverse engineered? Studies in History and Philosophy of Science Part C: Studies in History and Philosophy of Biological and Biomedical Sciences, 53, 73-83.
  138. Krohs, U. (2012). Convenience experimentation. Studies in History and Philosophy of Science Part C: Studies in History and Philosophy of Biological and Biomedical Sciences, 43(1), 52-57.
  139. Nithya, C., Kiran, M., & Nagarajaram, H. A. (2021). Comparative analysis of Pure Hubs and Pure Bottlenecks in Human Protein-protein Interaction Networks. bioRxiv, 2021-04.
  140. Pang E, Hao Y, Sun Y, Lin K. Differential variation patterns between hubs and bottlenecks in human protein-protein interaction networks. BMC Evol Biol. 2016 Dec 1;16(1):260. PMID: 27903259; PMCID: PMC5131443. [CrossRef]
  141. Yu H, Kim PM, Sprecher E, Trifonov V, Gerstein M. The importance of bottlenecks in protein networks: correlation with gene essentiality and expression dynamics. PLoS Comput Biol. 2007 Apr 20;3(4):e59. Epub 2007 Feb 14. PMID: 17447836; PMCID: PMC1853125. [CrossRef]
  142. Zimmermann M.G., Eguíluz V.M., San Miguel M., Spadaro A. Cooperation in an adaptive network Adv. Complex Syst., 03 (01n04) (2011), pp. 283-297, 10.1142/S0219525900000212.
  143. Skyrms B., Pemantle R. A dynamic model of social network formation Proc. Natl. Acad. Sci., 97 (16) (2000), pp. 9340-9346, 10.1073/pnas.97.16.9340.
  144. Paul, C. P., Good, P. D., Winer, I., & Engelke, D. R. (2002). Effective expression of small interfering RNA in human cells. Nature biotechnology, 20(5), 505-508.
  145. Wang, E. T., Cody, N. A., Jog, S., Biancolella, M., Wang, T. T., Treacy, D. J., ... & Burge, C. B. (2012). Transcriptome-wide regulation of pre-mRNA splicing and mRNA localization by muscle-blind proteins. Cell, 150(4), 710-724.
  146. Bauer, N. C., Doetsch, P. W., & Corbett, A. H. (2015). Mechanisms regulating protein localization. Traffic, 16(10), 1039-1061.
  147. Huang, H. Y., & Hopper, A. K. (2015). In vivo biochemical analyses reveal distinct roles of β-importins and eEF1A in tRNA subcellular traffic. Genes & development, 29(7), 772-783.
  148. Gasparski, A. N., Moissoglu, K., Pallikkuth, S., Meydan, S., Guydosh, N. R., & Mili, S. (2023). mRNA location and translation rate determine protein targeting to dual destinations. Molecular Cell, 83(15), 2726-2738.
  149. Komar, A. A., Samatova, E., & Rodnina, M. V. (2023). Translation Rates and Protein Folding. Journal of Molecular Biology, 168384.
  150. Barabási, A. L. (2007). Network medicine—from obesity to the “diseasome”. New England Journal of Medicine, 357(4), 404-407.
  151. Gene Ontology C. The gene ontology resource: enriching a gold mine. Nucleic Acids Res. 2021;49(D1):D325–D334.
  152. Gillis J, Pavlidis P. Assessing identity, redundancy and confounds in Gene Ontology annotations over time. Bioinformatics. 2013 Feb 15;29(4):476-82. Epub 2013 Jan 6. PMID: 23297035; PMCID: PMC3570208. [CrossRef]
  153. Thomas PD. The Gene Ontology and the Meaning of Biological Function. Methods Mol Biol. 2017; 1446:15-24. PMID: 27812932. [CrossRef]
  154. Martucci, D; Masseroli, M; Pinciroli, F. Gene ontology application to genomic functional annotation, statistical analysis and knowledge mining. In: Ontologies in Medicine. IOS Press, 2004. p. 108-131.
  155. Paci, P., Fiscon, G., Conte, F. et al. Gene co-expression in the interactome: moving from correlation toward causation via an integrated approach to disease module discovery. npj Syst Biol Appl 7, 3 (2021). [CrossRef]
  156. Przytycka, T. M., Singh, M., & Slonim, D. K. (2010). Toward the dynamic interactome: it's about time. Briefings in bioinformatics, 11(1), 15-29.
  157. Nagaraj N, Wisniewski JR, Geiger T, Cox J, Kircher M, Kelso J, Pääbo S, Mann M. Deep proteome and transcriptome mapping of a human cancer cell line. Mol Syst Biol. 2011 Nov 8;7:548. PMID: 22068331; PMCID: PMC3261714. [CrossRef]
  158. Wiggins, P., Choi, J., Huang, D., & Lo, T. (2024). Noise robustness and metabolic load determine the principles of central dogma regulation. Bulletin of the American Physical Society.
  159. Lo, T., Choi, J., Huang, D., & Wiggins, P., Noise robustness and metabolic load determine the principles of central dogma regulation. (2024), Science Advances, Vol. 10, No. 34. [CrossRef]
  160. Hausser J, Mayo A, Keren L, Alon U. Central dogma rates and the trade-off between precision and economy in gene expression. Nat Commun. 2019 Jan 8;10(1):68. PMID: 30622246; PMCID: PMC6325141. [CrossRef]
  161. Dekel, E., & Alon, U. (2005). Optimality and evolutionary tuning of the expression level of a protein. Nature, 436 (7050), 588-592.
  162. Gallagher, L. A., Bailey, J., & Manoil, C. (2020). Ranking essential bacterial processes by speed of mutant death. Proceedings of the National Academy of Sciences, 117(30), 18010-18017.
  163. Lengeler, Joseph W.; Drews, Gerhart; Schlegel, Hans G. (ed.). Biology of the Prokaryotes. John Wiley & Sons, 2009.
  164. Vidal M, Cusick ME, Barabási AL. Interactome networks and human disease. Cell. 2011 Mar 18;144(6):986-98. PMID: 21414488; PMCID: PMC3102045. [CrossRef]
  165. Satam H, Joshi K, Mangrolia U, Waghoo S, Zaidi G, Rawool S, Thakare RP, Banday S, Mishra AK, Das G, Malonia SK. Next-Generation Sequencing Technology: Current Trends and Advancements. Biology (Basel). 2023 Jul 13;12(7):997. Erratum in: Biology (Basel). 2024 Apr 24;13(5):286. https://doi.org/10.3390/biology13050286. PMID: 37508427; PMCID: PMC10376292. [CrossRef]
  166. Caudai, C., Galizia, A., Geraci, F., Le Pera, L., Morea, V., Salerno, E., Via, A., & Colombo, T. (2021). AI applications in functional genomics. Computational and Structural Biotechnology Journal, 19, 5762-5790.
  167. Koumakis, L. (2020). Deep learning models in genomics; are we there yet? Computational and Structural Biotechnology Journal, 18, 1466-1473.
  168. Asp M, Bergenstråhle J, Lundeberg J (October 2020). "Spatially Resolved Transcriptomes-Next Generation Tools for Tissue Exploration". BioEssays. 42 (10): e1900221. PMID 32363691. S2CID 218492475. [CrossRef]
  169. Ståhl PL, Salmén F, Vickovic S, Lundmark A, Navarro JF, Magnusson J, et al. (July 2016). "Visualization and analysis of gene expression in tissue sections by spatial transcriptomics". Science. 353 (6294): 78–82. PMID 27365449. [CrossRef]
  170. Keskin, O., Tuncbag, N., & Gursoy, A. (2016). Predicting protein–protein interactions from the molecular to the proteome level. Chemical reviews, 116(8), 4884-4909.
  171. Koh, G. C., Porras, P., Aranda, B., Hermjakob, H., & Orchard, S. E. (2012). Analyzing protein–protein interaction networks. Journal of proteome research, 11(4), 2014-2031.
  172. Su, Y. J., Chang, C. W., Chen, M. J., & Lai, Y. C. (2021). Impact of COVID-19 on liver. World journal of clinical cases, 9(27), 7998.
  173. Diao, Y., Tang, J., Wang, X., Deng, W., Tang, J., & You, C. (2023). Metabolic syndrome, nonalcoholic fatty liver disease, and chronic hepatitis B: A narrative review. Infectious Diseases and Therapy, 12(1), 53-66.
  174. Ali, F. E., Mohammedsaleh, Z. M., Ali, M. M., & Ghogar, O. M. (2021). Impact of cytokine storm and systemic inflammation on liver impairment patients infected by SARS-CoV-2: Prospective therapeutic challenges. World journal of gastroenterology, 27(15), 1531.
  175. Frank SA. Immunology and Evolution of Infectious Disease. Princeton (NJ): Princeton University Press; 2002. Chapter 4, Specificity and Cross-Reactivity.
  176. You, H., Qin, S., Zhang, F., Hu, W., Li, X., Liu, D., ... & Tang, R. (2022). Regulation of pattern-recognition.
  177. Xia, Z., & Storm, D. R. (2005). The role of calmodulin as a signal integrator for synaptic plasticity. Nature Reviews Neuroscience, 6(4), 267-276.
  178. Harrison-Bernard, L. M. (2009). The renal renin-angiotensin system. Advances in physiology education, 33(4), 270-274.
  179. Iwamoto DV, Calderwood DA. Regulation of integrin-mediated adhesions. Curr Opin Cell Biol. 2015 Oct;36:41-7. Epub 2015 Jul 17. PMID: 26189062; PMCID: PMC4639423. [CrossRef]
  180. Nunes-Hasler, P., Kaba, M., & Demaurex, N. (2020). Molecular mechanisms of calcium signaling during phagocytosis. Molecular and Cellular Biology of Phagocytosis, 103-128.
  181. Mylvaganam S, Freeman SA, Grinstein S. The cytoskeleton in phagocytosis and macropinocytosis. Curr Biol. 2021 May 24;31(10):R619-R632. PMID: 34033794. [CrossRef]
  182. Jaumouillé V, Waterman CM. Physical Constraints and Forces Involved in Phagocytosis. Front Immunol. 2020 Jun 12;11:1097. PMID: 32595635; PMCID: PMC7304309. [CrossRef]
  183. Guertin, D. A., & Sabatini, D. M. (2007). Defining the role of mTOR in cancer. Cancer cell, 12(1), 9-22.
  184. Huang, J., Wang, C., Hou, Y., Tian, Y., Li, Y., Zhang, H., ... & Li, W. (2023). Molecular mechanisms of Thrombospondin-2 modulates tumor vasculogenic mimicry by PI3K/AKT/mTOR signaling pathway. Biomedi-cine & Pharmacotherapy, 167, 115455.
  185. Lichner, Z., Ding, Q., Samaan, S., Saleh, C., Nasser, A., Al-Haddad, S., ... & Yousef, G. M. (2015). miRNAs dysregulated in association with Gleason grade regulate extracellular matrix, cytoskeleton and androgen receptor pathways. The Journal of pathology, 237(2), 226-237.
  186. Jiao, L., Liu, Y., Yu, X. Y., Pan, X., Zhang, Y., Tu, J., ... & Li, Y. (2023). Ribosome biogenesis in disease: new players and therapeutic targets. Signal Transduction and Targeted Therapy, 8(1), 15.
  187. Piazzi, M., Bavelloni, A., Gallo, A., Faenza, I., & Blalock, W. L. (2019). Signal transduction in ribosome biogenesis: a recipe to avoid disaster. International journal of molecular sciences, 20(11), 2718.
  188. Solà, C., Barrón, S., Tusell, J. M., & Serratosa, J. (1999). The Ca2+/calmodulin signaling system in the neural response to excitability. Involvement of neuronal and glial cells. Progress in neurobiology, 58(3), 207-232.
  189. Wu, H.-Y., Tomizawa, K., and Matsui, H. (2007). Calpain-calcineurin signaling in the pathogenesis of calci-um-dependent disorder. Acta Med. Okayama 61, 123–137. [CrossRef]
  190. Gonçalves, C. A., Sesterheim, P., Wartchow, K. M., Bobermin, L. D., Leipnitz, G., & Quincozes-Santos, A. (2022). Why antidiabetic drugs are potentially neuroprotective during the Sars-CoV-2 pandemic: The focus on astroglial UPR and calcium-binding proteins. Frontiers in Cellular Neuroscience, 16, 905218.
  191. Yapici-Eser, H., Koroglu, Y. E., Oztop-Cakmak, O., Keskin, O., Gursoy, A., & Gur-soy-Ozdemir, Y. (2021). Neuropsychiatric symptoms of COVID-19 explained by SARS-CoV-2 proteins’ mimicry of human protein interactions. Frontiers in Human Neuroscience, 15, 656313.
  192. Li, Y., Pehrson, A. L., Waller, J. A., Dale, E., Sanchez, C., & Gulinello, M. (2015). A critical evaluation of the activity-regulated cytoskeleton-associated protein (Arc/Arg3. 1)'s putative role in regulating dendritic plasticity, cogni-tive processes, and mood in animal models of depression. Frontiers in neuroscience, 9, 279.
  193. Bekhbat M, Treadway MT, Goldsmith DR, Woolwine BJ, Haroon E, Miller AH, Felger JC. Gene signatures in peripheral blood immune cells related to insulin resistance and low tyrosine metabolism define a sub-type of depression with high CRP and anhedonia. Brain Behav Immun. 2020 Aug;88:161-165. Epub 2020 Mar 18. PMID: 32198016; PMCID: PMC7415632. [CrossRef]
  194. Cusato, J., Manca, A., Palermiti, A., Mula, J., Costanzo, M., Antonucci, M., ... & Cal-cagno, A. (2023). COVID-19: a possible contribution of the MAPK pathway. Biomedi-cines, 11(5), 1459.
  195. Ghasemnejad-Berenji, M., & Pashapour, S. (2021). SARS-CoV-2 and the possible role of Raf/MEK/ERK pathway in viral survival: is this a potential therapeutic strategy for COVID-19?. Pharmacology, 106(1-2), 119-122.
  196. Almutairi, M. M., Sivandzade, F., Albekairi, T. H., Alqahtani, F., & Cucullo, L. (2021). Neuroinflammation and Its Impact on the Pathogenesis of COVID-19. Frontiers in medicine, 8, 745789.
  197. Shiravand, Y., Walter, U., & Jurk, K. (2021). Fine-Tuning of Platelet Responses by Serine/Threonine Protein Kinases and Phosphatases—Just the Beginning. Hämostaseologie, 41(03), 206-216.
  198. Guergnon, J., Godet, A. N., Galioot, A., Falanga, P. B., Colle, J. H., Cayla, X., & Garcia, A. (2011). PP2A targeting by viral proteins: a widespread biological strategy from DNA/RNA tumor viruses to HIV-1. Biochimica et Biophysica Acta (BBA)-Molecular Basis of Disease, 1812(11), 1498-1507.
  199. Dahlman, I., Belarbi, Y., Laurencikiene, J., Pettersson, A. M., Arner, P., & Kulyté, A. (2017). Comprehensive functional screening of miRNAs involved in fat cell insulin sensitivity among women. American Journal of Physiology-Endocrinology and Metabolism, 312(6), E482-E494.
  200. Todorovic, S., Simeunovic, V., Prvulovic, M., Dakic, T., Jevdjovic, T., Sokanovic, S., ... & Mladenovic, A. (2024). Dietary restriction alters insulin signaling pathway in the brain. BioFactors, 50(3), 450-466.
  201. Verger, A., Kas, A., Dudouet, P. et al. Visual interpretation of brain hypometabolism related to neurological long COVID: a French multicentric experience. Eur J Nucl Med Mol Imaging 49, 3197–3202 (2022). [CrossRef]
  202. Guedj, E., Campion, J.Y., Dudouet, P. et al. 18F-FDG brain PET hypometabolism in patients with long COVID. Eur J Nucl Med Mol Imaging 48, 2823–2833 (2021). [CrossRef]
  203. Bockaert, J., Perroy, J., Bécamel, C., Marin, P., & Fagni, L. (2010). GPCR interacting proteins (GIPs) in the nervous system: Roles in physiology and pathologies. Annual review of pharmacology and toxicology, 50(1), 89-109.
  204. Theobald, S. J., Simonis, A., Georgomanolis, T., Kreer, C., Zehner, M., Eisfeld, H. S., Albert, MC., Chen, J., Motameny, S., Erger, F., Fischer, J., et al., (2021). Long-lived macrophage reprogramming drives spike protein-mediated inflammasome activation in COVID-19. EMBO molecular medicine, 13(8), e14150.
  205. Li, X., Wu, K., Zeng, S., Zhao, F., Fan, J., Li, Z., Yi, L., Ding, H., Zhao, M., Fan, S., et al., (2021). Viral infection modulates mitochondrial function. International Journal of Molecular Sciences, 22(8), 4260.
  206. 206] Theofilis, P., Sagris, M., Oikonomou, E., Antonopoulos, A. S., Siasos, G., Tsioufis, C., & Tousoulis, D. (2021). Inflammatory mechanisms contributing to endothelial dysfunction. Biomedicines, 9(7), 781.
  207. Batabyal, R., Freishtat, N., Hill, E., Rehman, M., Freishtat, R., & Koutroulis, I. (2021). Metabolic dysfunction and immunometabolism in COVID-19 pathophysiology and therapeutics. International Journal of Obesity, 45(6), 1163-1169.
  208. Wheeler, S. E., Shurin, G. V., Yost, M., Anderson, A., Pinto, L., Wells, A., & Shurin, M. R. (2021). Differential antibody response to mRNA COVID-19 vaccines in healthy subjects. Microbiology spectrum, 9(1), 10-1128.
  209. Huang, S., & Houghton, P. J. (2003). Targeting mTOR signaling for cancer therapy. Current opinion in pharmacology, 3(4), 371-377.
  210. Yuan, T. L., & Cantley, L. (2008). PI3K pathway alterations in cancer: variations on a theme. Oncogene, 27(41), 5497-5510.
  211. Zhao, J., & Guan, J. L. (2009). Signal transduction by focal adhesion kinase in cancer. Cancer and Metastasis Reviews, 28, 35-49.
  212. Ding, X., Zhang, W., Li, S., & Yang, H. (2019). The role of cholesterol metabolism in cancer. American journal of cancer research, 9(2), 219.
  213. Chauhan, A. J., Wiffen, L. J., & Brown, T. P. (2020). COVID-19: a collision of complement, coagulation and inflammatory pathways. Journal of Thrombosis and Haemostasis, 18(9), 2110-2117.
  214. Milani, D., Caruso, L., Zauli, E., Al Owaifeer, A. M., Secchiero, P., Zauli, G., ... & Tisato, V. (2022). p53/NF-kB balance in SARS-CoV-2 infection: From OMICs, genomics and pharmacogenomics insights to tailored therapeutic perspectives (COVIDomics). Frontiers in Pharmacology, 13, 871583.
  215. Gioia, U., Tavella, S., Martínez-Orellana, P., Cicio, G., Colliva, A., Ceccon, M., ... & d’Adda di Fagagna, F. (2023). SARS-CoV-2 infection induces DNA damage, through CHK1 degradation and impaired 53BP1 recruitment, and cellular senescence. Nature Cell Biology, 25(4), 550-564.
  216. Cao, M., Wang, L., Xu, D., Bi, X., Guo, S., Xu, Z., ... & Li, K. (2022). The synergistic interaction landscape of chromatin regulators reveals their epigenetic regulation mechanisms across five cancer cell lines. Computational and Structural Biotechnology Journal, 20, 5028-5039.
  217. Icard, P., Lincet, H., Wu, Z., Coquerel, A., Forgez, P., Alifano, M., & Fournel, L. (2021). The key role of Warburg effect in SARS-CoV-2 replication and associated inflammatory response. Biochimie, 180, 169-177.
  218. Shi, D., & Gu, W. (2012). Dual roles of MDM2 in the regulation of p53: ubiquitination dependent and ubiquitination independent mechanisms of MDM2 repression of p53 activity. Genes & cancer, 3(3-4), 240-248.
  219. Zhang S, El-Deiry WS. Transfected SARS-CoV-2 spike DNA for mammalian cell expression inhibits p53 activation of p21(WAF1), TRAIL Death Receptor DR5 and MDM2 proteins in cancer cells and increases cancer cell viability after chemotherapy exposure. Oncotarget. 2024 May 3;15:275-284. PMID: 38709242; PMCID: PMC11073320. [CrossRef]
  220. Wang X, Liu Y, Li K, Hao Z. Roles of p53-Mediated Host-Virus Interaction in Coronavirus Infection. Int J Mol Sci. 2023 Mar 28;24(7):6371. PMID: 37047343; PMCID: PMC10094438. [CrossRef]
  221. Pal, A., Tripathi, S. K., Rani, P., Rastogi, M., & Das, S. (2024). p53 and RNA viruses: The tug of war. Wiley Interdisciplinary Reviews: RNA, 15(1), e1826.
  222. Chen, L., & Wang, H. (2019). Nicotine promotes human papillomavirus (HPV)-immortalized cervical epithelial cells (H8) proliferation by activating RPS27a-Mdm2-P53 pathway in vitro. Toxicological Sciences, 167(2), 408-418.
  223. Nanduri, B., Suvarnapunya, A. E., Venkatesan, M., & Edelmann, M. J. (2013). Deubiquitinating enzymes as promising drug targets for infectious diseases. Current pharmaceutical design, 19(18), 3234-3247.
  224. Valerdi, K. M., Hage, A., van Tol, S., Rajsbaum, R., & Giraldo, M. I. (2021). The role of the host ubiquitin system in promoting replication of emergent viruses. Viruses, 13(3), 369.
  225. Liu, X. M., Yang, F. F., Yuan, Y. F., Zhai, R., & Huo, L. J. (2013). SUMOylation of mouse p53b by SUMO-1 promotes its pro-apoptotic function in ovarian granulosa cells. PloS one, 8(5), e63680.
  226. Matteo D. Parco, Jessica Le Berichel, Paolina Hamon, C. Matthias Wilk, Meriem Belabed , Nader Yatim, Alexis Zafferano, Jesse Boumediene, Chiara Falcomatà, Miriam Merad et al., (2024). Hematopoietic aging promotes cancer by fueling IL-1⍺–driven emergency myelopoiesis. Science, eadn0327.
  227. Shannon C.E., Weaver W. The Mathematical Theory of Communication. University of Illinois Press; Champaign, IL, USA: 1949.
  228. Prigogine I. What is Entropy? Naturwissenschaften. 1989; 76:1–8. [CrossRef]
  229. Skene K.R. Life’s a Gas: A Thermodynamic Theory of Biological Evolution. Entropy. 2015; 17:5522–5548. [CrossRef]
  230. Dewar R.C. Maximum Entropy Production as an Inference Algorithm that Translates Physical Assumptions into Macroscopic Predictions: Don’t Shoot the Messenger. Entropy. 2009; 11:931–944. [CrossRef]
  231. Feistel R., Ebeling W. Entropy and the self-organization of information and value. Entropy. 2016; 18:193. [CrossRef]
  232. Ebeling W., Frömmel C. Entropy and predictability of information carriers. BioSystems. 1998; 46:47–55. [CrossRef]
  233. Calmet, J., & Daemi, A. (2004). From entropy to ontology. na.
  234. Daemi, A., & Calmet, J. (2004, November). From Ontologies to Trust through Entropy. In Proc. of the Int. Conf. on Advances in Intelligent Systems-Theory and Applications.
Disclaimer/Publisher’s Note: The statements, opinions and data contained in all publications are solely those of the individual author(s) and contributor(s) and not of MDPI and/or the editor(s). MDPI and/or the editor(s) disclaim responsibility for any injury to people or property resulting from any ideas, methods, instructions or products referred to in the content.
Copyright: This open access article is published under a Creative Commons CC BY 4.0 license, which permit the free download, distribution, and reuse, provided that the author and preprint are cited in any reuse.
Prerpints.org logo

Preprints.org is a free preprint server supported by MDPI in Basel, Switzerland.

Subscribe

© 2024 MDPI (Basel, Switzerland) unless otherwise stated