Preprint
Article

THOP1 Is Entailed in a Genetic Fingerprint Associated with Late-Onset Alzheimer’s Disease

Altmetrics

Downloads

74

Views

47

Comments

0

This version is not peer-reviewed

Submitted:

03 October 2024

Posted:

04 October 2024

You are already at the latest version

Alerts
Abstract
In a systematic explorative study of genetic patterns on chromosome 19, we discovered a pattern comprised of 23 SNP alleles that is significantly associated with late-onset Alzheimer’s disease (AD). This association is validated using two independent data sets. The pattern includes THOP1, which has a long and disputatious relationship with AD. It also spans SLC39A3 and SGTA and is upstream from DIRAS1. We utilized population data to observe the frequencies of this genetic pattern for 11 different ancestries and note that it is highly common for Europeans and relatively infrequent for Africans. This research provides a distinct genetic signature for AD risk as well as insights into the complicated relationship between this disease and THOP1.
Keywords: 
Subject: Biology and Life Sciences  -   Neuroscience and Neurology

Introduction

Thimet Oligopeptidase (THOP1), also known as EP24.15, MP24.15, and EC 3.4.24.15, belongs to the M3 family of zinc-dependent endopeptidases [1]. It moves between the cytoplasm and nucleus of neurons and glial cells and is secreted into extracellular space via multiple mechanisms [2,3,4,5,6]. Its function in major histocompatibility class I antigen presentation has been well-studied and more recently discovered roles in hyperlipidic diet-induced obesity, non-alcoholic liver steatosis, and insulin resistance are under investigation7. Due to the location of its active site at the bottom of a deep channel, THOP1 only cleaves peptides up to about 22 amino acids in length [7,8], but includes impactful substrates such as opioid peptides, bradykinin, somatostatin, neurotensin, angiotensin I, and gonadotrophin-releasing hormone (GnRH) [9,10,11,12].
While knockout of THOP1 does not affect viability, it lowers attention and memory retention and leads to depressive-like behavior [1]. In a sleep-depravation study of rat brains, THOP1 was shown to be dysregulated during depravation and recovery [13]. Based on the study of THOP1-/- mice, it was shown that nearly 400 genes are differentially expressed in hippocampus samples and it has been suggested that THOP1 may regulate at the transcriptional or post-transcriptional level via currently unknown mechanisms [1,7].
THOP1 has a long and tumultuous history with late-onset Alzheimer’s disease (AD) dating from the 1990’s. Due to the discovery that it was capable of cleaving the amyloid precursor protein (APP) beta-secretase cleavage site in test peptides, it was a prime suspect for the production of sticky amyloid-beta peptides, which ultimately congregate into the amyloid plaques that are a hallmark of AD. Several ensuing investigations explored this mechanism, ultimately resulting with the conclusion that it did not significantly alter amyloid-beta production [14,15]. However, Papastoitsis et al. demonstrated that THOP1 leads to the degradation of recombinant APP and produces a 15-kDa amyloidogenic fragments [16]. Based on further experiments using healthy human SKNMC cells, in 1999 this same group hypothesized that THOP1 leads to the degradation, rather than generation, of amyloid-beta peptides, presumably by modulating serine proteases [17]. Meanwhile, in 1996, THOP1 was connected with AD due to its linkage with the risk-associated region on chromosome 19q13.3 [18]. Two years later the location was corrected to 19p13.3, thereby refuting this linkage [19]. The strong signal at 19q13.3 is due to variants of APOE, which has the strongest currently known genetic associations with AD.
In 2008, a comprehensive proteomics analysis by Pollio et al. using cultured cortical neurons demonstrated knockdown of THOP1 increased amyloid-beta toxicity, while overexpression was neuroprotective [20]. Furthermore, this group observed increased THOP1 expression in brain tissue of an AD transgenic mouse model, and co-localization with amyloid-beta plaques. They also reported significant elevation of THOP1 expression in human AD brain tissue. Based on these concordant findings, Pollio et al. hypothesize that THOP1 provides neuroprotection in the early stages of AD. A recent broad transcriptomic study of AD brains further corroborated this association as THOP1 was shown to exhibit a neuroprotective role with a highly significant false discovery rate [21].
Within the last few years, THOP1 has emerged as a candidate CSF biomarker for AD. Campo et al. observed that it was among the top five differentially regulated between AD and non-AD dementias out of 665 proteins measured in 797 CSF samples [22] and they developed a panel of seven CSF biomarkers, including THOP1, to discriminate between Lewy body dementia and AD [23]. This group recently developed an antibody-based platform to measure CSF THOP1 with the aim of diagnosing AD at an early stage [24,25].
We encountered THOP1 in an unbiased investigation of genetic patterns on chromosome 19 that are associated with AD. Haplotypes are patterns of nucleotides in close proximity along a chromosome that are passed together across time and space. These patterns hold more power to dictate the specific properties of proteins produced and the regulation of this production than single variants. General haplotype inference methods phase all provided genotypes within the region of interest into two haplotypes without regard for the ages or evolutionary impact of each mutation, thus force the inclusion of more recent and/or neutral mutations. Alternatively, our previously introduced software, BlocBuster, identifies partial haplotypes that include only highly correlated nucleotides, referred to as blocs [26,27]. BlocBuster is a network modeling strategy that overcomes pitfalls of conventional network methods by leveraging an expanded network scaffolding and a unique correlation metric that anticipates heterogeneity of the individuals [28]. Due to these unique features, our exploration of the International HapMap [29] data for 11 global populations revealed an intriguing pair of massive blocs with opposite variants encompassing gephyrin on human chromosome 14 [30]. Open-source code for BlocBuster is available at https://www.cs.umsl.edu/~climer/blocBuster/code.html.
Given the heterogeneous nature of AD, we utilized BlocBuster to identify genetic risk patterns in the Alzheimer’s Disease Neuroimaging Initiative (ADNI) genotype data, revealing a bloc comprised of 23 SNP alleles spanning THOP1 and its upstream region. This pattern is quite common, with more than 60% of the normal controls being carriers, but extremely prevalent for AD cases. We validated this result in two separate trials of unseen data.
Being interested in the incidence of this pattern, we examined the HapMap data to determine ancestral frequencies. While it wasn’t possible to evaluate the entire 23-SNP pattern due to differences in the platforms, it is patently clear that the risk pattern is more widespread for European ancestries and less common for African populations.
THOP1’s association with AD has been enigmatic for several decades and the presented research provides explicit details of genetic variants in high linkage that are significantly associated with this perplexing disease.

Materials and Methods

AD data. We analyzed data for chromosome 19 provided in the Alzheimer’s Disease Neuroimaging Initiative (ADNI) database (adni.loni.usc.edu). The ADNI was launched in 2003 as a public-private partnership, led by Principal Investigator Michael W. Weiner, MD. The primary goal of ADNI has been to test whether serial magnetic resonance imaging (MRI), positron emission tomography (PET), other biological markers, and clinical and neuropsychological assessment can be combined to measure the progression of mild cognitive impairment (MCI) and early Alzheimer’s disease (AD). For up -to-date information, see www.adni-info.org.
WGS_Omni2.5M_20140220.zip containing genotypes for 812 individuals was downloaded and 47,527 SNPs on chromosome 19 were extracted. No individual had more than 1% missing in the original data. We removed SNPs with more than 10% missing data. The data were split into Discovery (42 AD, 69 MCI, and 87 controls), Validation (18 AD and 37 controls), and Replication (38 AD and 63 controls) groups.
HapMap data. HapMap bulk data were downloaded from https://ftp.ncbi.nlm.nih.gov/hapmap/genotypes/2010-08_phaseII+III/forward/. These data include genotypes for 11 populations: African Ancestry in SW USA [ASW], CEPH/Utah Collection with European ancestry [CEU], Han Chinese in Beijing, China [CHB], Chinese in Metropolitan Denver, CO, USA [CHD], Gujarati Indians in Houston, TX, USA [GIH], Japanese in Tokyo, Japan [JPT], Luhya in Webuye, Kenya [LWK], Mexican Ancestry in LA, CA, USA [MEX], Maasai in Kinyawa, Kenya [MKK], Toscani in Italia [TSI], and Yoruba in Ibadan, Nigeria [YRI]. The genotypes that were available for the 23 identified SNPs were extracted from each population. Individuals with more than 30% missing data for the extracted SNPs were excluded.
BlocBuster. Using BlocBuster, we built a network model using all AD, MCI, and control individuals (without labeling) in the Discovery data set. Pairwise correlations were computed using the Custom Correlation Coefficient (CCC) [26,27]. CCC is robust for heterogeneous traits as it returns a vector of four values rather than a single scalar quantity. Nodes in the network represent SNP alleles and edges represent pairwise correlations between alleles. We then extract the highest weight edges such that the overall average node degree is equal to one. Breadth-First Search was used to extract clusters of inter-correlated SNP alleles that are completely isolated from the other nodes in the network. Each of these clusters represent a genetic pattern and they were tested for association with AD.

Results

The BlocBuster network was built blindly from the Discovery data, without any information regarding AD, MCI, or normal control included. It had strong community structure with 84.3% singleton nodes, for which no edge was adjacent. The connected components ranged in size from 2 to 135 nodes.
The genetic patterns corresponding to each component were tested for associations between the AD and normal control individuals in the Discovery data. Eleven patterns with more than 10 nodes had significant odds ratio and 95% confidence intervals and were tested on the Validation individuals. The most significant bloc from this trial was comprised of 23 SNP alleles and was tested using the Replication data. As shown in Table 1, this bloc has odds ratios and 95% confidence intervals of 2.632 [1.044, 6.631], 10.348 [1.238, 86.506], and 2.667 [0.964, 7.375], in the Discovery, Validation, and Replication datasets, respectively. Note that the 95% confidence interval for the Replication dataset is slightly below 1.0, but due to the consistencies across all three datasets, this is likely due to the relatively small sample size rather than lack of genuine association.
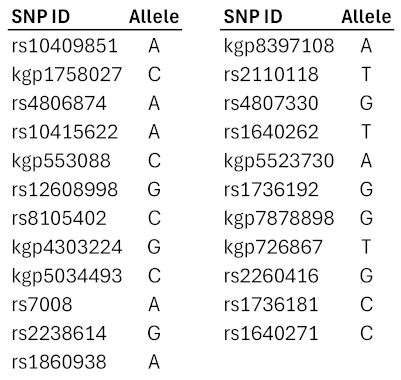
The identified pattern is located on chromosome 19p13.3, beginning upstream from DIRAS1 and spanning across SLC39A3, SGTA, and THOP1 (Table 2 and Figure 1). Annotations for the 23 SNPs are given in Supplementary Table S1.
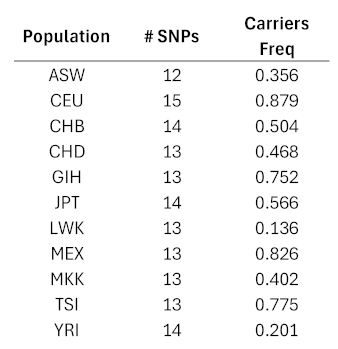
The numbers of SNPs in the bloc that were included in the HapMap data ranged from 12 to 15 for the 11 populations (Table 3). The frequencies of carriers ranged from 0.136 for the LWK population to 0.879 for the CEU. In general, the European ancestries exhibited high frequencies, African populations exhibited low frequencies, and the other populations were between the two extremes. Genotypes for the extracted SNPs are given in Supplementary Tables S2 – S12.

Discussion

The network model was created blindly using all individuals in the Discovery dataset, yet the strong linkage of the 23 SNPs was significantly associated with AD risk in all three datasets.
It is unclear how the identified genetic pattern impacts THOP1 production. Most of the markers are upstream and may affect transcriptional regulation. Surprisingly, the other genes spanned by this bloc have intriguing relationships and may be more directly involved in the observed AD association.
THOP1 is a zinc-activated oligopeptidase and SLC39A3, also known as ZIP3, transports zinc ions from extracellular space to the cytosol. While knocking out ZIP3 and another family member, ZIP1, provided neuroprotection for CA1 neurons, silencing of only ZIP3 resulted with attenuated CA3 neuronal cell death in mouse hippocampus [31,32].
Small glutamine rich tetratricopeptide repeat co-chaperone alpha (SGTA) interacts with steroid receptor complexes and other chaperones, including heat shock proteins HSP70 and HSP90 [33]. In its role as a co-chaperone, it identifies misfolded proteins and has been shown to directly bind exposed hydrophobic residues in vitro and in vivo [34]. This behavior may be at the root of its colocalization with aberrant intracellular aggregates, including Huntington Disease and polyQ diseases [35]. SGTA is also indispensable for cell division [36]. In general, this protein behaves in complex manners with both tissue-specific and cell-specific functions [33].
DIRAS family GTPase 1 (DIRAS1) belongs to a subfamily of small Ras monomeric GTPases. It has been observed to act as a tumor suppressor and down-regulation of this gene in several cancer types have been achieved via aberrant methylation [37]. Importantly, an epigenome-wide methylation study of entorhinal cortex in 337 human brains identified four differentially methylated genes associated with AD, one of which was DIRAS1 [38].
THOP1 is involved in many extracellular activities, such as the degradation of neuropeptides, including opioids, bradykinin, neurotensin, and gonadotropin releasing hormone (GnRH) [39]. Interestingly, its secretion to extracellular space is unconventional as it lacks a signal peptide sequence [4]. It has been shown that interactions with 14-3-3 epsilon, a phosphoserine/threonine-scaffold protein, facilitates THOP1 secretion [4]. Correño et al. demonstrated that phosphorylation of THOP1 at Ser(644) by protein kinase A (PKA) increases 14-3-3 epsilon interaction and the introduction of a point mutation S644A reduces it [4]. Future research is needed to delve into the 23-SNP genetic signature to pinpoint specific AD biological pathways, including secretion and selection of substrates.
Genotypes for all 23 SNPs were not available for the HapMap individuals, however, at least half were provided for each population. It could be expected that this pattern is most prevalent in the European ancestral populations as the ADNI database is currently predominantly European. Yet it is quite surprising that the African populations exhibit such low frequencies. Note that inclusion of the missing genotypes cannot increase the frequencies and might lower them even further. Future work is needed to evaluate the association of this bloc with AD for these populations.

Data Availability Statement

Data used in preparation of this article were obtained from the Alzheimer’s Disease Neuroimaging Initiative (ADNI) database (adni.loni.usc.edu). As such, the investigators within the ADNI contributed to the design and implementation of ADNI and/or provided data but did not participate in analysis or writing of this report. A complete listing of ADNI investigators can be found at: http://adni.loni.usc.edu/wp-content/uploads/how_to_apply/ADNI_Acknowledgement_List.pdf.

Acknowledgments

This research was funded by the Alzheimer’s Association (AARG-22-925002), National Institute on Aging (NIA) grants 1RF1AG053303-01 and 3RF1AG053303-01S2, and research grants from the University of Missouri – St. Louis. Special thanks to Elaina Rohlfing for help with the HapMap data. ADNI Acknowledgment: Data collection and sharing for this project was funded by the Alzheimer's Disease Neuroimaging Initiative (ADNI) (National Institutes of Health Grant U01 AG024904) and DOD ADNI (Department of Defense award number W81XWH-12-2-0012). ADNI is funded by the National Institute on Aging, the National Institute of Biomedical Imaging and Bioengineering, and through generous contributions from the following: AbbVie, Alzheimer’s Association; Alzheimer’s Drug Discovery Foundation; Araclon Biotech; BioClinica, Inc.; Biogen; Bristol-Myers Squibb Company; CereSpir, Inc.; Cogstate; Eisai Inc.; Elan Pharmaceuticals, Inc.; Eli Lilly and Company; EuroImmun; F. Hoffmann-La Roche Ltd and its affiliated company Genentech, Inc.; Fujirebio; GE Healthcare; IXICO Ltd.; Janssen Alzheimer Immunotherapy Research & Development, LLC.; Johnson & Johnson Pharmaceutical Research & Development LLC.; Lumosity; Lundbeck; Merck & Co., Inc.; Meso Scale Diagnostics, LLC.; NeuroRx Research; Neurotrack Technologies; Novartis Pharmaceuticals Corporation; Pfizer Inc.; Piramal Imaging; Servier; Takeda Pharmaceutical Company; and Transition Therapeutics. The Canadian Institutes of Health Research is providing funds to support ADNI clinical sites in Canada. Private sector contributions are facilitated by the Foundation for the National Institutes of Health (www.fnih.org). The grantee organization is the Northern California Institute for Research and Education, and the study is coordinated by the Alzheimer’s Therapeutic Research Institute at the University of Southern California. ADNI data are disseminated by the Laboratory for Neuro Imaging at the University of Southern California.

References

  1. Dos Santos, N. B. et al. Thimet oligopeptidase (EC 3.4.24.15) key functions suggested by knockout mice phenotype characterization. Biomolecules 9, 382 (2019).
  2. Fontenele-Neto, J. D., Massarelli, E. E., Garrido, P. A. G., Beaudet, A. & Ferro, E. S. Comparative fine structural distribution of endopeptidase 24.15 (EC3.4.24.15) and 24.16 (EC3.4.24.16) in rat brain. J. Comp. Neurol. 438, 399–410 (2001).
  3. Ferro, E. S. et al. Secretion of a neuropeptide-metabolizing enzyme similar to endopeptidase 22.19 by glioma C6 cells. Biochem. Biophys. Res. Commun. 191, 275–281 (1993). [CrossRef]
  4. Carreño, F. R., Goñi, C. N., Castro, L. M. & Ferro, E. S. 14-3-3 epsilon modulates the stimulated secretion of endopeptidase 24.15. J. Neurochem. 93, 10–25 (2005).
  5. Garrido, P. A. G. et al. Confocal Microscopy Reveals Thimet Oligopeptidase (EC 3.4.24.15) and Neurolysin (EC 3.4.24.16) in the Classical Secretory Pathway. DNA Cell Biol. 18, 323–331 (1999). [CrossRef]
  6. Ferro, E. S., Tullai, J. W., Glucksman, M. J. & Roberts, J. L. Secretion of Metalloendopeptidase 24.15 (EC 3.4.24.15). DNA Cell Biol. 18, 781–789 (1999). [CrossRef]
  7. Ferro, E. S., Gewehr, M. C. F. & Navon, A. Thimet oligopeptidase biochemical and biological significances: Past, present, and future directions. Biomolecules 10, 1–30 (2020).
  8. Ray, K., Hines, C. S., Coll-Rodriguez, J. & Rodgers, D. W. Crystal Structure of Human Thimet Oligopeptidase Provides Insight into Substrate Recognition, Regulation, and Localization. J. Biol. Chem. 279, 20480–20489 (2004).
  9. Healy, D. P. & Orlowski, M. Immunocytochemical localization of endopeptidase 24.15 in rat brain. Brain Res. 571, 121–128 (1992). [CrossRef]
  10. Rioli, V. et al. Neuropeptide specificity and inhibition of recombinant isoforms of the endopeptidase 3.4.24.16 family: Comparison with the related recombinant endopeptidase 3.4.24.15. Biochem. Biophys. Res. Commun. 250, 5–11 (1998).
  11. Acker, G. R., Molineaux, C. & Orlowski, M. Synaptosomal Membrane-Bound Form of Endopeptidase-24.15 Generates Leu-Enkephalin from Dynorphin 1-8, α- and β-Neoendorphin, and Met-Enkephalin from Met-Enkephalin-Arg6-Gly7-Leu. J. Neurochem. 48, 284–292 (1987).
  12. Molineaux, C. J., Lasdun, A., Michaud, C. & Orlowski, M. Endopeptidase-24.15 Is the Primary Enzyme that Degrades Luteinizing Hormone Releasing Hormone Both In Vitro and In Vivo. J. Neurochem. 51, 624–633 (1988).
  13. Visniauskas, B. et al. Sleep deprivation changes thimet oligopeptidase (THOP1) expression and activity in rat brain. Heliyon 5, (2019).
  14. Thompson, A., Grueninger-Leitch, F., Huber, G. & Malherbe, P. Expression and characterization of human β-secretase candidates metalloendopeptidase MP78 and cathepsin D in βAPP-overexpressing cells. Mol. Brain Res. 48, 206–214 (1997).
  15. McDermott, J. R., Biggins, J. A. & Gibson, A. M. Human brain peptidase activity with the specificity to generate the N-terminus of the Alzheimer β-amyloid protein from its precursor. Biochem. Biophys. Res. Commun. 185, 746–752 (1992).
  16. Papastoitsis, G., Abraham, C. R., Siman, R. & Scott, R. Identification of a Metalloprotease from Alzheimer’s Disease Brain Able To Degrade the β-Amyloid Precursor Protein and Generate Amyloidogenic Fragments. Biochemistry 33, 192–199 (1994).
  17. Yamin, R., Malgeri, E. G., Sloane, J. A., McGraw, W. T. & Abraham, C. R. Metalloendopeptidase EC 3.4.24.15 is necessary for Alzheimer’s amyloid- β peptide degradation. J. Biol. Chem. 274, 18777–18784 (1999).
  18. Meckelein, B. et al. Human endopeptidase (THOP1) is localized on chromosome 19 within the linkage region for the late-onset Alzheimer disease AD2 locus. Genomics 31, 246–249 (1996).
  19. Torres, M. P., Prange, C. & Lennon, G. Human endopeptidase 24.15 (THOP1) is localized on chromosome 19p13.3 and is excluded from the linkage region for late-onset Alzheimer disease. Genomics 53, 239–240 (1998).
  20. Pollio, G. et al. Increased expression of the oligopeptidase THOP1 is a neuroprotective response to Aβ toxicity. Neurobiol. Dis. 31, 145–158 (2008).
  21. Shi, Y. et al. Transcriptomic Analyses for Identification and Prioritization of Genes Associated With Alzheimer’s Disease in Humans. Front. Bioeng. Biotechnol. 8, 504172 (2020).
  22. del Campo, M. et al. CSF proteome profiling across the Alzheimer’s disease spectrum reflects the multifactorial nature of the disease and identifies specific biomarker panels. Nat. Aging 2, 1040–1053 (2022).
  23. del Campo, M. et al. CSF proteome profiling reveals biomarkers to discriminate dementia with Lewy bodies from Alzheimer´s disease. Nat. Commun. 14, 1–14 (2023).
  24. Hok-A-Hin, Y. S. et al. Thimet oligopeptidase as a potential CSF biomarker for Alzheimer’s disease: A cross-platform validation study. Alzheimer’s Dement. Diagnosis, Assess. Dis. Monit. 15, e12456 (2023).
  25. Hok-A-Hin, Y. S. et al. Thimet Oligopeptidase is a potential CSF biomarker for Alzheimer’s Disease. Alzheimer’s Dement. 18, e065528 (2022).
  26. Climer, S., Templeton, A. R. A. R. & Zhang, W. Allele-specific network reveals combinatorial interaction that transcends small effects in psoriasis GWAS. PLoS Comput. Biol. 10, e1003766 (2014).
  27. Climer, S., Yang, W., de las Fuentes, L., Dávila-Román, V. G. V. G. & Gu, C. C. C. A custom correlation coefficient (CCC) approach for fast identification of multi-SNP association patterns in genome-wide SNPs data. Genet. Epidemiol. 38, 610–621 (2014).
  28. Climer, S. Connecting the dots: The boons and banes of network modeling. Patterns 2, 100374 (2021).
  29. Altshuler, D. M. et al. Integrating common and rare genetic variation in diverse human populations. Nature 467, 52–8 (2010).
  30. Climer, S., Templeton, A. R. A. R. & Zhang, W. Human gephyrin is encompassed within giant functional noncoding yin-yang sequences. Nat. Commun. 6, (2015).
  31. Bogdanovic, M. et al. The ZIP3 Zinc Transporter Is Localized to Mossy Fiber Terminals and Is Required for Kainate-Induced Degeneration of CA3 Neurons. J. Neurosci. 42, 2824–2834 (2022).
  32. Qian, J. et al. Knockout of Zn transporters Zip-1 and Zip-3 attenuates seizure-induced CA1 neurodegeneration. J. Neurosci. 31, 97–104 (2011).
  33. Philp, L. K. et al. SGTA: A New Player in the Molecular Co-Chaperone Game. Hormones and Cancer 4, 343–357 (2013).
  34. Benarroch, R., Austin, J. M., Ahmed, F. & Isaacson, R. L. The roles of cytosolic quality control proteins, SGTA and the BAG6 complex, in disease. in Advances in Protein Chemistry and Structural Biology 114, 265–313 (Academic Press Inc., 2019).
  35. Kubota, S. et al. SGTA associates with intracellular aggregates in neurodegenerative diseases. Mol. Brain 14, 1–10 (2021).
  36. Winnefeld, M., Rommelaere, J. & Cziepluch, C. The human small glutamine-rich TPR-containing protein is required for progress through cell division. Exp. Cell Res. 293, 43–57 (2004).
  37. Rothhammer-Hampl, T. et al. Frequent Epigenetic Inactivation of DIRAS-1 and DIRAS-2 Contributes to Chemo-Resistance in Gliomas. Cancers (Basel). 13, 5113 (2021).
  38. Sommerer, Y. et al. Entorhinal cortex epigenome-wide association study highlights four novel loci showing differential methylation in Alzheimer’s disease. Alzheimer’s Res. Ther. 15, 1–13 (2023).
  39. Oliveira, V. et al. Calcium modulates endopeptidase 24.15 (EC 3.4.24.15) membrane association, secondary structure and substrate specificity. FEBS J. 272, 2978–2992 (2005).
Figure 1. Relative genomic locations of the 23 SNPs included in the AD-associated pattern. See Supplementary Table S1 for precise locations.
Preprints 120190 g001
Table 1. Results for the 23-SNP pattern for three trials using ADNI data. Numbers and percentages of individuals, odds ratio, and odds ratio 95% confidence intervals are shown.
Preprints 120190 i001
Table 2. SNP IDs and alleles for the 23-SNP genetic pattern.
Preprints 120190 i002
Table 3. Results for HapMap population data. The number of SNPs in the 23-SNP pattern that were genotyped in the HapMap data and the frequencies of carriers for the given patterns are shown for each of the 11 populations. The specific SNPs included for each population are given in Supplementary Tables S2-S12.
Preprints 120190 i003
Disclaimer/Publisher’s Note: The statements, opinions and data contained in all publications are solely those of the individual author(s) and contributor(s) and not of MDPI and/or the editor(s). MDPI and/or the editor(s) disclaim responsibility for any injury to people or property resulting from any ideas, methods, instructions or products referred to in the content.
Copyright: This open access article is published under a Creative Commons CC BY 4.0 license, which permit the free download, distribution, and reuse, provided that the author and preprint are cited in any reuse.
Prerpints.org logo

Preprints.org is a free preprint server supported by MDPI in Basel, Switzerland.

Subscribe

© 2024 MDPI (Basel, Switzerland) unless otherwise stated