1. Introduction
Camellia oleifera Abel, a species within the Dungarunga group or shrub category, holds a place in the esteemed Camellia family, scientifically known as Theaceae. It has high values in economic, edible, environmental and medicinal field [
1]. In 2019, there were 4.4 million hectares of land used to grow C.oleifera in China, in which production exceeded 2.4 million tons [
2]. C.oleifera cultivation is still facing great hazards from diseases and insect pests, some of which usually lead to 20%-40% reduction in fruit percentage and 10%--30% loss of seeds. It may cause the branches to wilt, even the entire plant to die in severe cases. Meanwhile, serious economic losses will occur, as disease spread rapidly and are difficult in control. At present, the control measures for diseases and insect pests of C. oleifera predominantly adopted are chemical interventions, and complemented by tea plantation sanitation. However, diseases are characterized by a lengthy incubation period and rapid dissemination, which is a challenge to determine the optimal timing for conventional control measures. Conrad et al. [
3] emphasize that manual detection of diseases is costly and inefficient. There is an pressing need for a fast, and accurate detection and segmentation method. However, conventional image processing techniques struggle to swiftly and accurately identify multiple diseases in intricate environments [
4].
With the modernization, and intelligence of agriculture, accurately identifying disease categories and taking corresponding measures are significant. In agriculture, the rapid advancement and adoption of machine learning have proven to be a powerful and efficient solution [
5]. Conventional mechanical learning methods, K-mean clustering, Markov Random Fields, Random Forests, and Support Vector Machines had been applied in the field of image segmentation for many years [
6]. However, they exhibited inefficiencies in computation, limited scalability, and poor generalization performance, especially for handling complex data and tasks. Thanks to the groundbreaking advancements in deep learning, remarkable strides have been achieved in the field of plant disease segmentation [
7,
8]. Deep learning models focused on the efficient processing and full utilizing for the contextual information of images, through automatic feature extraction. Convolutional Neural Networks (CNNs), as a important component of deep learning, have emerged as the preferred network architecture for numerous model. Lu et al. [
9] reviewed the application of CNN on diseases and insect pests of plant leaf. The convolutional layers were used to effectively capture local information in CNN. By stacking multiple layers of convolutional and pooling layers, CNN can learned hierarchical features, then efficiently comprehended both global and local contexts within the image. Consequently, the realm of image segmentation had witnessed the emergence of numerous innovative CNN-based architectures. Ramcharan et al. [
10] applied transfer learning to train neural networks for the recognition about diseases of cassava, a significant economic crop. Lu et al. [
11] introduced an automatic diagnosis system utilizing a supervised deep learning framework for identifying wheat disease. Moreover, it was packed into a real-time mobile application. Liu et al. [
12] introduced an innovative approach for grape leaf disease classification, which relied on an improved CNN. In the network, the Inception structure and dense connectivity strategy were introduced to boost the extraction of multidimensional features. For detecting five common leaf diseases of apple trees, the Inception and Rainbow were combined in a new deep learning network by Jiang et al. [
13]. Wang et al. [
14] developed a new model that combined U-Net and DeeplabV3+, specifically tailored for cucumber foliar disease segmentation in challenging background. Deng et al. [
15] proposed a cross-layer attentional mechanism combined with a multiscale convolutional module, which could greatly solved the problem of fuzzy edges and tiny disease in tomato foliar diseases.
Based on the above studies, we can infer that the segmentation of diseases and insect pests on important economic crops contributed to the development of agriculture. C. oleifera is also considered an economically significant crop, but the current relevant research mainly focused on pathological aspect. Meanwhile, DeeplabV3+ was a leading model of semantic segmentation model, which had the following advantages by comparing with other models such as UNet, UNet++, PSPNet, HrNetV2, et[
16]:
• The Encoder-Decoder architecture enhanced feature extraction by utilizing deep networks within the encoder, while the decoder improved the precision of segmentation outcomes through a process of upsampling.
• The use of enhanced dilated convolutions was strategically employed to effectively gather information from various spatial scales, thereby significantly expanding the receptive field of convolutional layers. It allowed the model to capture a broader context.
• The ASPP module enhanced segmentation accuracy through the multiple dilated convolutions of different rates.
Due to the lack of public dataset, we built own dataset of C. oleifera diseases and insect pests. The dataset was comprised of 1264 images and 5 different diseases, which all were shot in their natural environments. Then, we utilized the DeeplabV3+ model directly on self-build dataset, but encountered the following challenges:
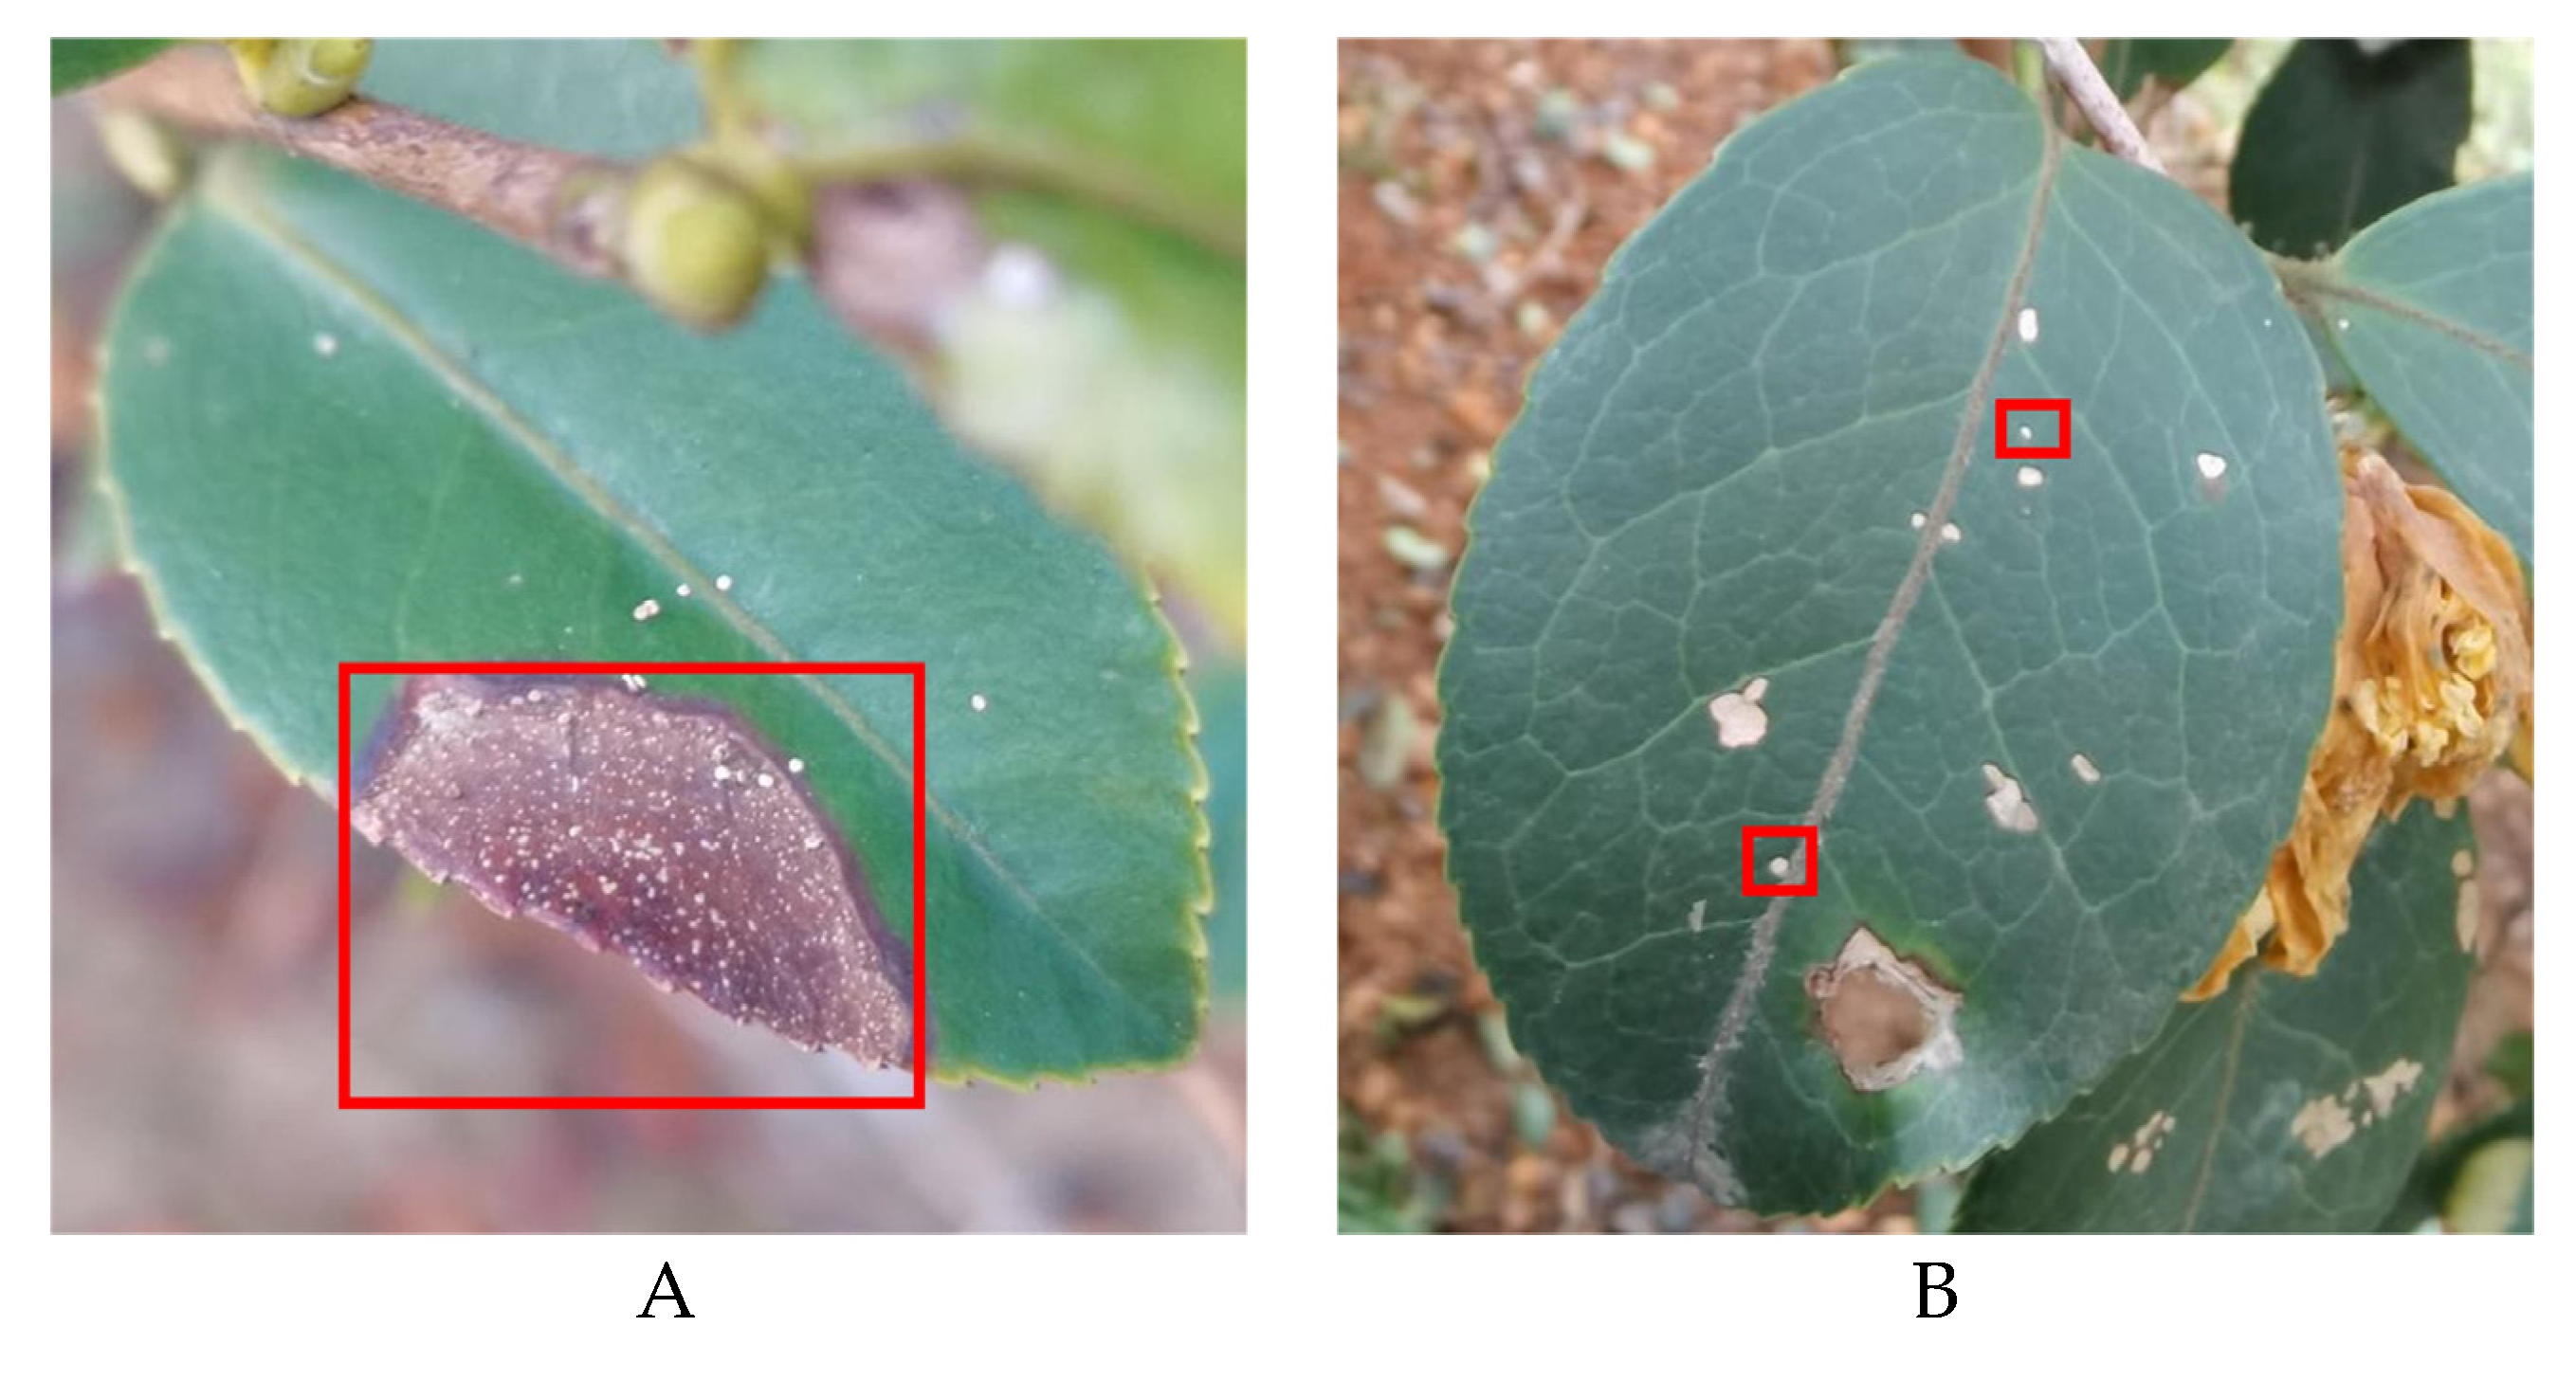
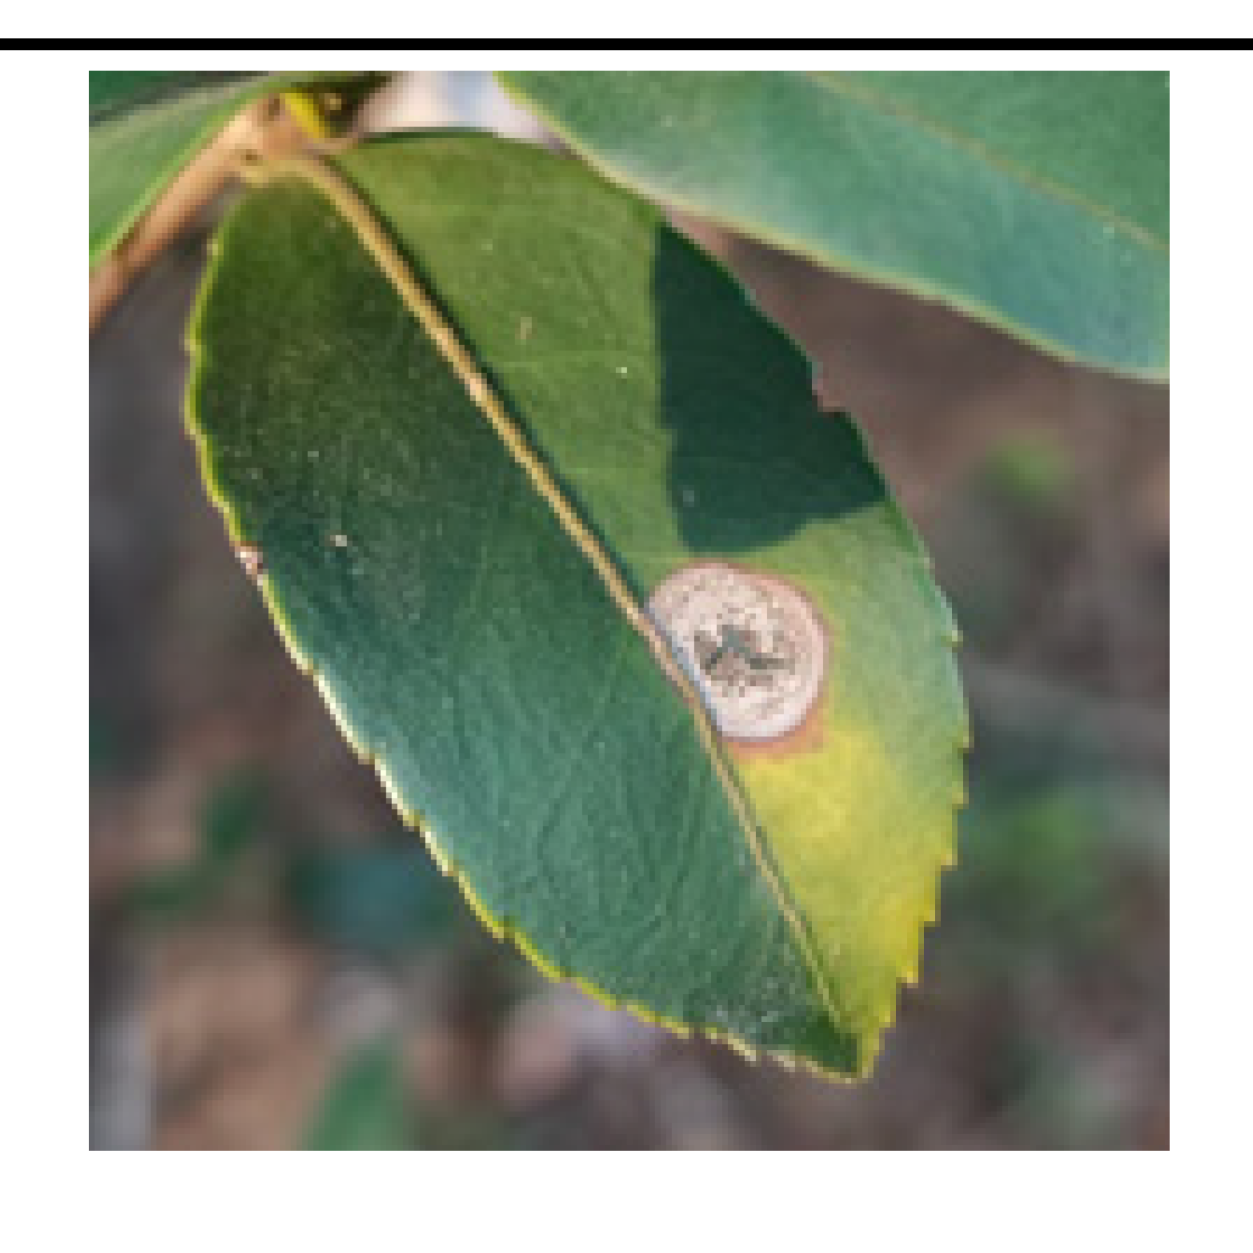
• The boundary of diseased leaves between the background was fuzzy, as shown in
Figure 1. (A). This presented a challenge for the conventional DeeplabV3+ network. It struggled to effectively differentiate between background and disease features, resulting in a notable reduction in feature extraction accuracy.
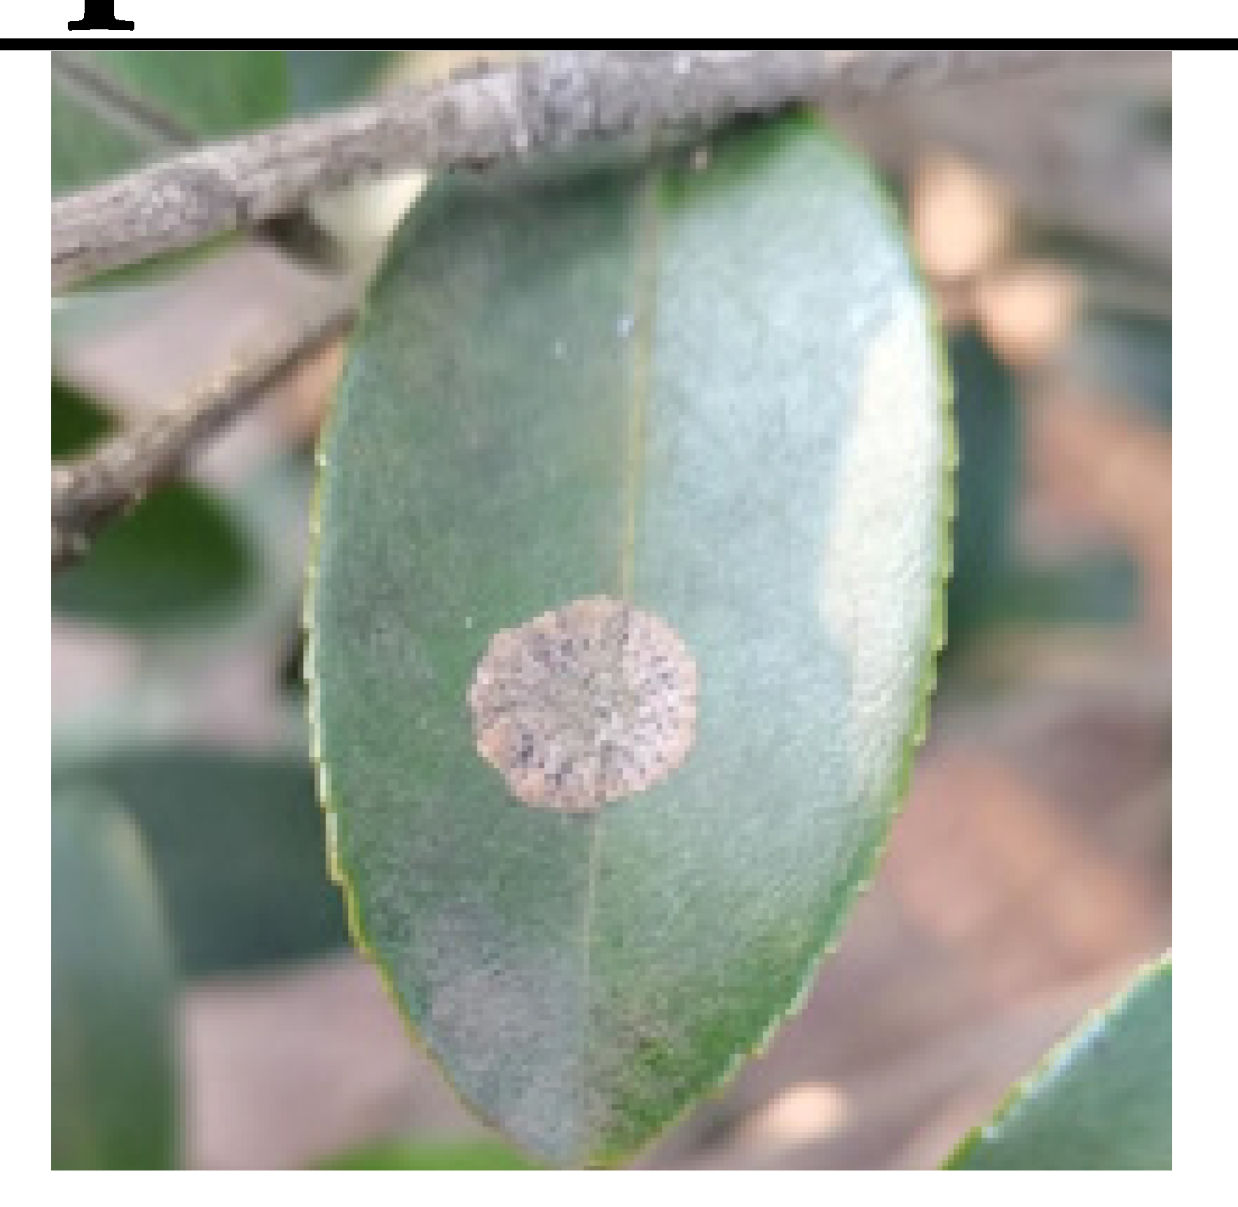
• The gridding of dilated convolutions increased the loss of tiny disease information. The average pooling layer also lost edge and texture information. This presented a difficulty for the model in accurately segmenting these small diseased areas, as shown in
Figure 1B.
• DeeplabV3+ adopted Xception as its backbone, which possessed a large number of parameters. The backbone produced complex computations and long segmentation duration. Consequently, it was unfit to be applied in practical crop production.
To solving the problem of fuzzy boundary between features and background, Khadidos et al. [
17] introduced an approach that relied on level set evolution. The method assigned weights to energy terms based on their significance in boundary delineation, which served the dual purpose of improving both the precision of feature extraction and the accuracy of boundary segmentation. Xia et al.[
18] integrated the Reverse Edge Attention Module (REAM) into their encoder architecture of model, strategically placing it between consecutive layers. We proposed a CBAM-ASPP module to solve not only the similarity of color between diseases and background, but also the presence of blurry boundaries. To improve the ability of capture features, we expanded convolution layers by assigning various dilation rate which captured features from different scales. Additionally, we removed the average pooling layer to better retain edge and texture information. By connecting Convolutional Block Attention Module (CBAM) with dilated convolutions, the model was directed to concentrate on salient features and distinguish the edges of diseased leaves more effectively.
The feature extraction of tiny disease also became a challenge. Gao et al.[
19] introduced the H-SimAM Attention Mechanism which aimed to concentrate on potential symptoms within the complex background. Xiao et al. [
20] developed the Context Enhancement Module and Feature Purification Module to enhance the detection accuracy, particularly for smaller targets. Due to the distinctive encoder-decoder architecture of DeeplabV3+, we have introduced the DANet attention mechanism to create an enhanced encoder. By focusing attention on feature maps via spatial and channel dimensions, the DANet mitigated impact of complex background and challenges of tiny object shapes.
The large model parameters and complex computations was also a serious problem. Liang et al.[
21] discussed that lightweight design based on repetitive feature maps mainly concentrated on lightweighting the cheap operations. However, these methods often neglected generalization capabilities of network and huge computational demands in convolutional layers. To address this, the authors implemented a group convolution technique aimed at decreasing the computational intensityof floating-point operations. MobileNetV2 was adopted as the backbone due to its suitability for mobile and embedded device. The key role of MobileNetV2 contributed to the design of inverted residual block, which was integrated into depthwise separable convolutions and linear bottleneck layers. These innovations enabled the model to effectively decrease parameters without decreasing accuracy of segmentation detection. As a result, MobileNetV2 provided more practical values for mobile devices in agriculture.
The key contributions were encapsulated as follows:
1. We designed an experimental simulation method for insect pest and disease segmentation based on CDM-DeeplabV3+ network and employed a self-build dataset containing 1265 images that had five of diseases and insect pests of C. oleifera. All the data analysis in this research were concluded from this proprietary dataset.
2. A Residual Attention ASPP (CBAM-ASPP) was proposed, which extended dilated convolution amount to five and integrates CBAM modules to form a new Attention Convolution Unit. This unit significantly enhanced the extraction of key semantic information across varying scales. Additionally, the module removed the use of the average pooling layer and redirected attention towards edge and texture features, thereby reinforcing the performance of network to accurately segment edge features of leaf diseases.
3. A Dual-Attention Encoder Module (DAM- Encoder) was applied to improve feature extraction capabilities along both spatial and channel dimensions. Within the encoder, we integrated the CBAM-ASPP and DANet modules in a parallel configuration. It captured minutely detailed features from diverse perspectives, effectively addressing the problem of losing tiny features.
4. We changed the backbone to MobilenetV2. Unlike Xeception, MobilenetV2 introduced the inverted residual block, which substantially decreased the number of parameters maintaining the precision of segmentation detection. The experimental results show that CDM-DeeplabV3+ achieved an mIoU of 85.63%, which had an increase of 5.82% to original model, and model parameters reduction by almost 5 times compared to original model.
2. Materials and Methods
DeeplabV3+ is an outstanding neural network proposed for image segmentation based on Encoder-decoder architecture [
22,
23]. The Encoder occupies an important position in feature extraction, while the Decoder refines these features to restore resolution and achieve detailed segmentation. Within the Encoder, the integration of the Xception and ASPP facilitates improved multi-scale feature fusion [
24].
2.1. CDM-DeeplabV3+ Network
A simulation experimental method was proposed which conducted using CDM-Deeplabv3+ network for insect pest and disease segmentation. We introduce a CDM-DeeplabV3+ model aim to overcome three primary difficulties encountered in the segmentation: the problem of indistinct boundaries between diseases and the background, the propensity of models to loss tiny pest characteristics, and the computational challenges are posed by large parameter.
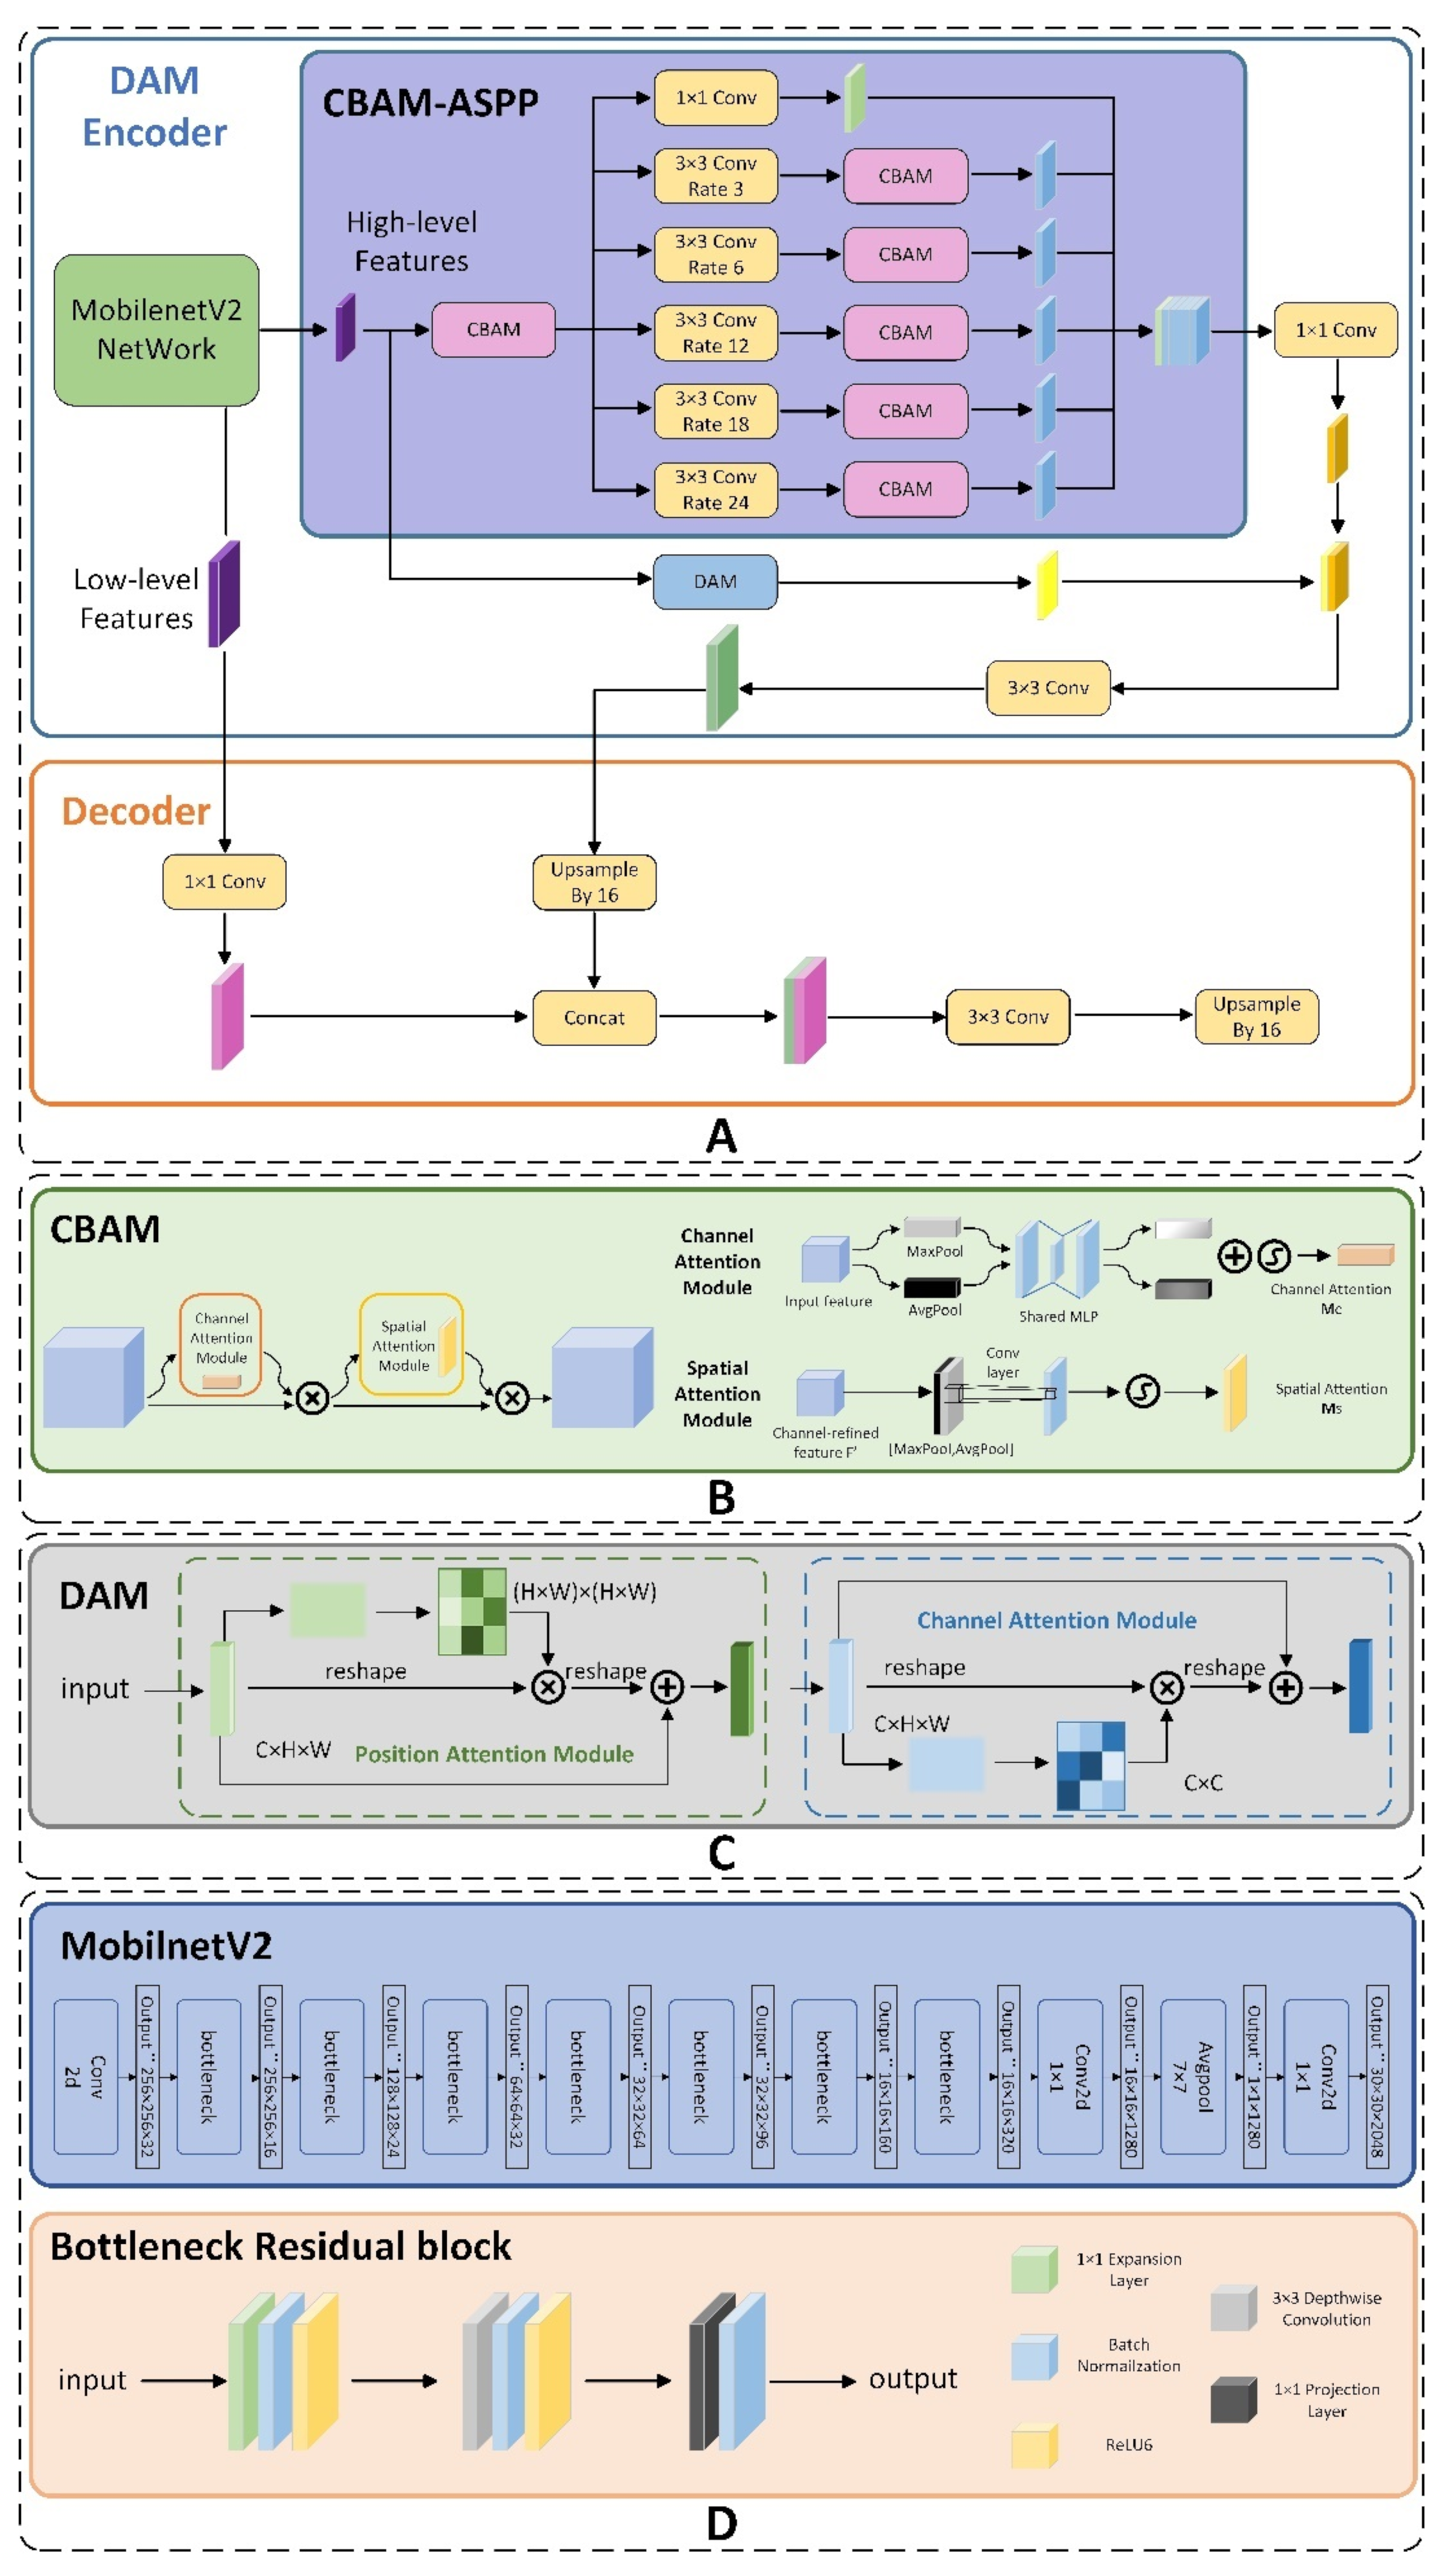
Figure 2A depicts the architectural design of the CDM-DeeplabV3+ model, which employs a traditional encoding and decoding framework. The encoding incorporates the MobilenetV2 as its backbone and integrates the residual attention space pyramid structure (CBAM-ASPP). To further enhance the model, we integrate the Dual Attention Network (DANet) within the architecture. Detailed explanations of each component follow in the subsequent sections.
2.2. CBAM-ASPP
Atrous Spatial Pyramid Pooling (ASPP), is an advanced approach that builds upon the foundations of Spatial Pyramid Pooling. Unlike SPP, ASPP is particularly effective at extracting semantic information at varying scales, thereby enhancing the ability of model to understand and represent features within image. ASPP substitutes conventional convolutions with dilated convolutions, which serve to enlarge the receptive field and bolster the capacity to extract semantic information [
25]. ASPP employs multiple dilated convolution layers in parallel, each with a unique dilation rate. This design allows the network to simultaneously perceive features at various scales, thereby improving its ability to process information across multiple scales. The ASPP module integrates a 1x1 convolution, 3x3 dilated convolutional layers with dilation rates of 18, 12, and 6, accompanied by an average pooling layer, all designed for simultaneous feature refinement through multi-scale receptive fields [
26]. The outcomes of these individual processes are then combined to produce a multi-scale fused feature map.
The CBAM is a straightforward and potent attention mechanism designed specifically for using in CNN [
27]. It comprises two distinct attention components: channel attention and spatial attention.
Figure 2B presents a schematic representation of the CBAM. This module utilizes its two attention dimensions to adaptively refine features, thereby enhancing the performance of model on feature extraction. Firstly, the feature graph F is inputted by the channel attention module, which generates a new feature map. This output is then combined with the original F through multiplication, forming an updated map labeled F1, as described in Equation (1). Subsequently, F1 passes through the spatial attention module to derive a further feature map. Ultimately, the computed result is multiplied by F1, giving rise to the final feature map F2, in accordance with the mathematical formulation outlined in Equation (2).
The module for channel attention computes a channel attention map by assessing the interdependencies among channels. This process entails spatial operations through max and average pooling on the input maps, followed by utilization of a Multi-Layer Perceptron (MLP) to compute attention weights. Then, these weights are utilized to the input features by multiplication, thereby generating the channel attention feature maps, as per the mathematical formulation detailed in Equation (3).
The spatial attention mechanism exploits the correlations between various spatial positions to compute a 2D spatial attention map. The process begins by utilizing maximum and average pooling to input features across channel dimensions. The outputs of these pooling operations are then fused to form a comprehensive feature descriptor. The descriptor is fed into a convolutional layer, generating a spatial attention map. This attention map is multiplied with the original input feature map to get the final output, as described in mathematical formulation in Equation (4).
After calculating both channel and spatial attentions, resulting maps are combined multiplicatively to generate the final adjusted feature map.
The classical ASPP structure had been the subject of extensive research. Qiu et al. [
28] introduced a spatial pyramid pooling network, and designed to emphasize significant features for effective target detection. In disease and pest identification tasks, the ASPP method utilized diverse dilation rates to gathering information across multiple scales. Nonetheless, the feature extraction might be adversely affected by the gridding of dilated convolutions. Furthermore, the presence of parallel branches in the ASPP can led to the redundant extraction of similar features, which may complicated the process of recognizing diseases [
29]. This study introduced a CBAM-ASPP structure to address the gridding issue associated with dilated convolutions. The CBAM-ASPP structure effectively solved the difficulties in segmentation caused by differences in size, occlusions, overlaps, and alterations in illumination conditions for C. oleifera diseases and insect pests. Consequently, it improved segmentation results when dealing with intricate and varied tasks.
The ASPP module feeds these up-sampled features directly into dilated convolution layers. But the dilated convolution struggles to accurately capture the edge information of diseases and insect pests on C. oleifera. In CBAM-ASPP, the up-sampled original features are first processed by the CBAM. This module is designed to focus on both the spatial and channel aspects of the significant features, thereby improving the capability of model to accurately extract edges. In order to preserving more detailed edge and texture features related to C. oleifera diseases and to minimizing the possibility of overfitting the model, we remove the average pooling layer from the architecture [
30]. To extract multiscale information from the diseases in C. oleifera and to facilitate their fusion, we extend the dilated convolution to incorporate five dilation rates: 3, 6, 12, 18, and 24, all while maintaining a convolution kernel size of 3x3. Different expansion rates can simulate different scaled receptive fields for capturing features at different scales. Dilated convolution, although adopt at capturing multi-scale features, may suffer from a limitation known as gridding artifacts. This occurs because the convolution kernel, when dilated, skips over certain points in the feature map, resulting in a sparse sampling pattern that can compromise the integrity of the learned representation. Moreover, employing excessively high dilation rates can lead to irregular feature extraction. To address this, we have integrated a 3x3 dilated convolution with a CBAM to create an Attention Convolution Module, and we have combined a 1x1 convolution with a CBAM to construct a Residual Module. By integrating convolution with the CBAM, we are able to effectively filter out extraneous features, thus facilitating the acquisition of consistent and significant features. The stability of network and robustness are improved by adding five attentional convolution modules and one residual module separately. This approach also helps maintain the integrity of spatial information within the network [
31]. Ultimately, the five feature maps are combined using a cascading process, after which the output is fed into a 1x1 convolution module to extract the last high-level features.
2.3. DAM-Encoder
Given that some C. oleifera diseases present with small symptoms and are influenced by intricate environmental factors, it is essential to improve the detection of these minute features. To address this, the Dual Attention Network (DANet) is integrated into the Encoder of DeeplabV3+. DANet facilitates the dynamic fusion of local details with their corresponding global context, thereby enhancing the ability of network to discern these tiny features.
DANet is composed of two distinct architectural components: the Location Attention Module and the Channel Attention Module, each designed to emphasize spatial and channel relationships, respectively. These modules are engineered to capture long-range dependencies across both spatial locations and feature channels, respectively.
Figure 2C presents a visual representation of the design architecture of the DANet.
The Positional Attention Module begins by accepting the input local features and processing them through a convolutional layer to reduce their dimensionality. This step results in the creation of three disparate feature maps, labeled as B, C, and D. Subsequently, the feature maps are transformed into an M by N matrix format, where N is calculated as the product of the original feature eight (H) and width (W) of maps. Upon reshaping the feature matrix, it is subjected to matrix multiplication, followed by a softmax operation, which yields the spatial attention map, labeled as S, as persent the mathematical formulation in Equation (5). This attention map is then applied to the original features and scaled by a factor of α before being subjected to an element-wise summation to produce the ultimate output, as shown in Equation (6).
In the mathematical expressions, Sji signifies the impact of the i-th position on the j-th position. Bi refers to the i-th feature at map B. Cj represents the j-th feature in map C. Ej denotes the j-th feature in map E. Di corresponds to the i-th feature in map D, while Aj corresponds to the j-th position of the remote feature mapping.
The Channel Attention Module calculates map directly using the original features. Analogous to the spatial attention process, the local features are reconfigured into a shape of M×N, as shown in Equation (7). The key distinction here is that the computation of the attention map involves direct operations on the original map without need to produce separate feature maps B, C, and D, as shown in Equation (8).
DANet optimizes the utilization of contextual information by transforming the feature outputs from its dual attention modules. Next, an element-wise addition is performed to merge the features, followed by the application of a convolutional layer to produce the final prediction map.
Integrating DANet into the Encoder enhances the clarity and effectiveness of presenting information, thereby mitigating misclassifications due to environmental influences. The proposed architecture greatly improves semantic coherence and facilitates superior segmentation of the minuscule features associated with diseases and pests.
Zhu et al. [
32] discovered that the connection between DANet and the ASPP module yields different outcomes. Consequently, as depicted in
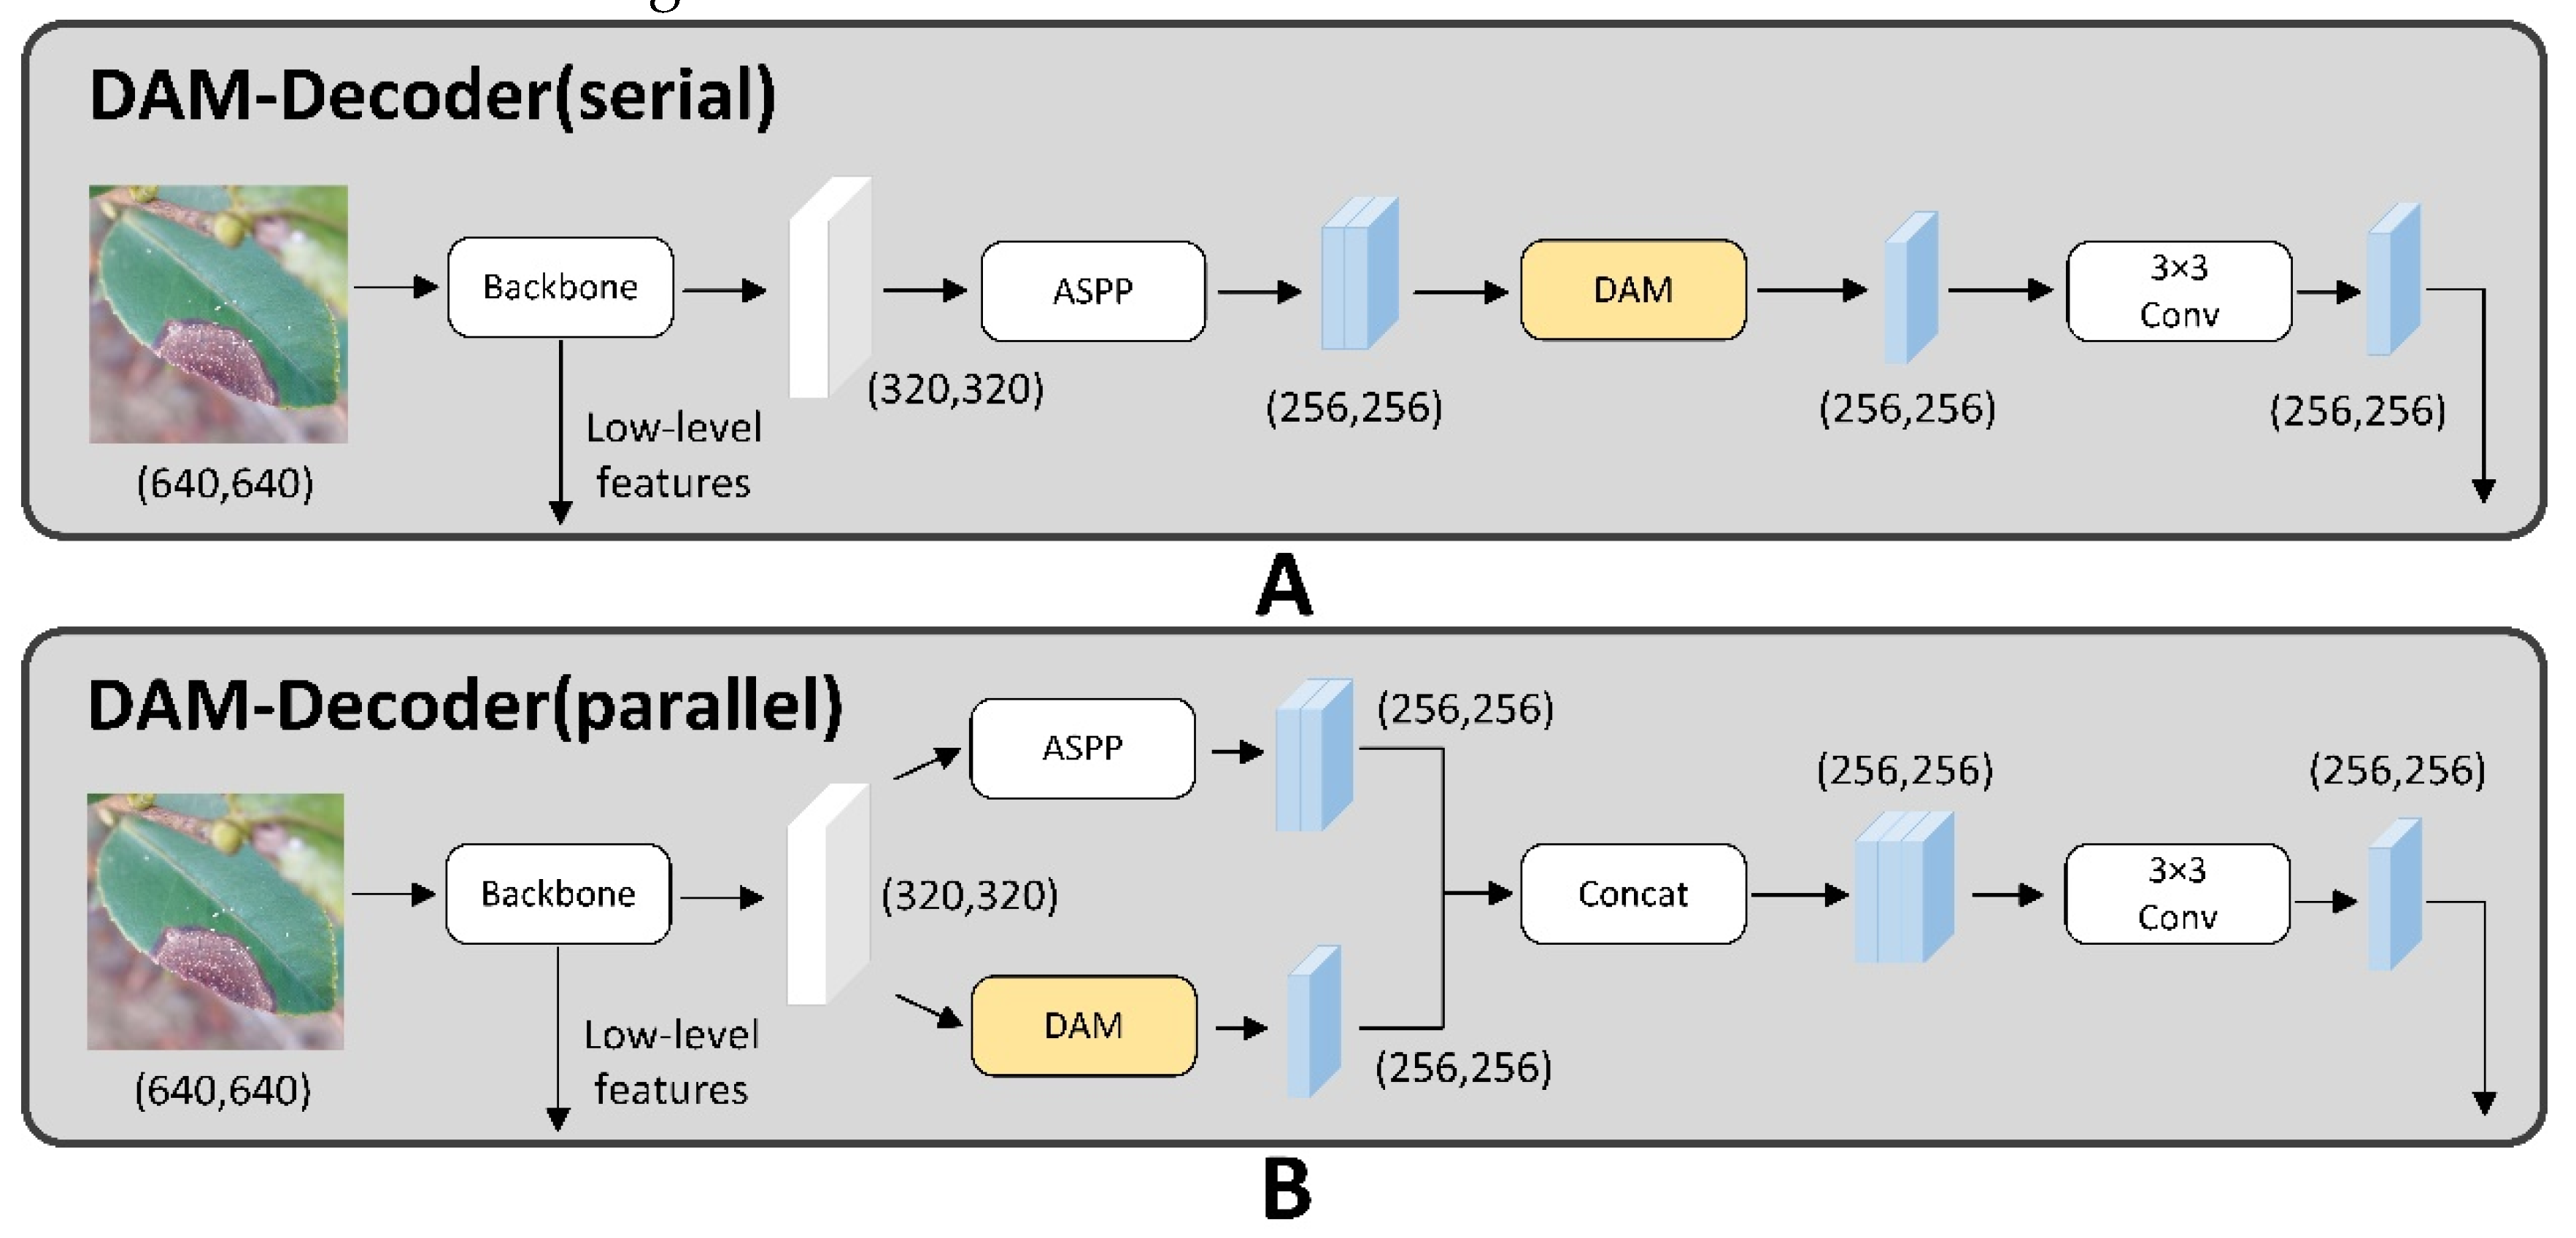
Figure 3, this research proposes two distinct architectures for combining DANet with ASPP.
In the first proposed structure, it is a sequential arrangement. The features extracted from the backbone are first inputted the ASPP module. Following this, the ASPP outputs are processed via the DANet module. Ultimately, the enhanced features derived from the DANet model are fused with the low-level features that extracted from the backbone.
In the second structure, DANet and ASPP are connected in parallel. This means that the features extracted from the backbone are inputted both modules concurrently. The resulting feature maps from each module are then subjected to further processing by a convolution module. Subsequently, the processed features are fused with the low-level features originating from the backbone, enhancing the overall feature representation.
Experimental comparisons reveal that the second structural marginally surpass the first one in terms of overall performance. As a result, the second structure is chosen for our investigation.
2.5. MobilenetV2
The DeeplabV3+ model typically employs the Xception backbone, which is highly regarded for its effectiveness in semantic segmentation tasks. But segmentation of C. oleifera diseases and insect pests demand small models with few parameters, fast computation, and ease of deployment on mobile devices. The Xception model is distinguished by its arrangement of 36 convolutional layers, organized into 14 modular sections, each consisting of multiple convolutions. It also boasts a substantial number of parameters in its fully connected layer [
33]. This complexity translates into a model that requires extensive training time, making it less ideal for use in segmenting diseases and insect pests in C. oleifera. Our approach adopts MobileNetV2 as the backbone. Unlike Xception, MobileNetV2 employs Depthwise Separable Convolutions (DSC) to construct inverted residual blocks and substitutes the traditional Rectified Linear Unit (ReLU) with a linear bottleneck layer. This design, characterized by its efficiency and reduced computational demands, is particularly suited for tasks focused on disease and insect pest segmentation within the context of C. oleifera.
Figure 2D shows the schematic diagram of MobileNetV2.
Convolutional play a key role in many efficient neural network designs. They process the input data by scanning across the receptive field to selectively identify and extract the most significant features, Enhancing the network’s capacity to discern crucial information within the regions of important. Conventional convolutional methods perform operations across both spatial and depth dimensions, which results in a substantial increase of parameters and computational load. Different from standard convolution, DSC employs a strategy where the full convolution splits into a pointwise convolution and a depthwise convolution. In a convolutional layer that includes K filters, each of dimension F×F, operating on an input layer with D channels. Equation (9) presents the total parameter count.
In the second step of DSC, we set the 1×1 convolution to D×K. Under the same conditions, the total parameters as shown in Equation (10).
The parameter count is decreased from K ×F2 × D to K × F2 + K × D by employing DSC. This method reduces the computational cost by segregating spatial and depth-wise operations, allowing each input channel to be processed separately. Consequently, DSC exhibits a significant decrease in computational demands compared to conventional convolution, as supported by the research conducted by Dang et al. [
34].
The residual block, introduced by He et al. [
35], serves as the central component of the ResNet framework. Its main purpose is to mitigate the problems of gradient vanishing or explosion that often arise as the depth of a neural network grows. Gradient vanishing or exploding can cause weights to become extremely small or large, which may lead to instability in the loss function and weights of model. This instability can impede the model from effectively learning the data distribution, ultimately leading to poor performance. MobileNetV2 introduces inverted residual blocks to minimize the quantity of parameters without compromising network performance [
36].
Figure 4 shows the schematic diagram of residual block and inverted residual block. These blocks first use a 1x1 convolution to increase the dimensionality of the input features. Then employs a depthwise separable convolution to capture spatial features within these enhanced dimensions. Subsequently, a second 1x1 convolution is utilized to reduce the feature dimensions, thereby completing the process of dimensionality reduction. The module also utilizes skip connections to connect inputs directly to the outputs. The inverted residual block not only streamlines the transformation process but also conserves computational power and minimizes the number of parameters required.
ReLU activation function, a common choice in neural networks, serves to a certain extent alleviate the issue of overfitting by introducing non-linearity. MobileNetV2 introduces inverted residual blocks, which employs DSC to effectively extract spatial features in higher dimensions while producing output features of lower dimensionality. But the ReLU activation function tends to eliminate low-dimensional feature information. However, the linear bottleneck layer in neural networks is designed to capture low-dimensional spatial information without incurring significant information loss due to nonlinear transformations.
3. Results
The experimental framework for insect pest and disease segmentation on C. oleifera leaf using deep learning models is shown in
Figure 5. Firstly, Images of C. oleifera with diseases were collected from different regions, including Jiading Town in Xinfeng County, Jiangxi Province; Yizhang County in Chenzhou City, Hunan Province; You County, Hunan Province; and Xingning City, Guangdong Province. Secondly, we performed image preprocessing on the collected photographs encompassing five categories of diseases and insect pests and annotated the augmented images. Then, the CDM-DeeplabV3+ model is trained using the images that have been processed and annotated for labels. Finally, the model is deployed to identify and segment the leaves symptom, generating the final segmentation outcomes to compare with the true result. Subsequently, the results are organized into four distinct segments to: (a) establish the experimental setup and parameter configurations. (b) parameter definition. (c) module performance assessment. (d) comparison of CDM-DeeplabV3+ model with other models.
3.1. Image Acquisition and Dataset Preparation
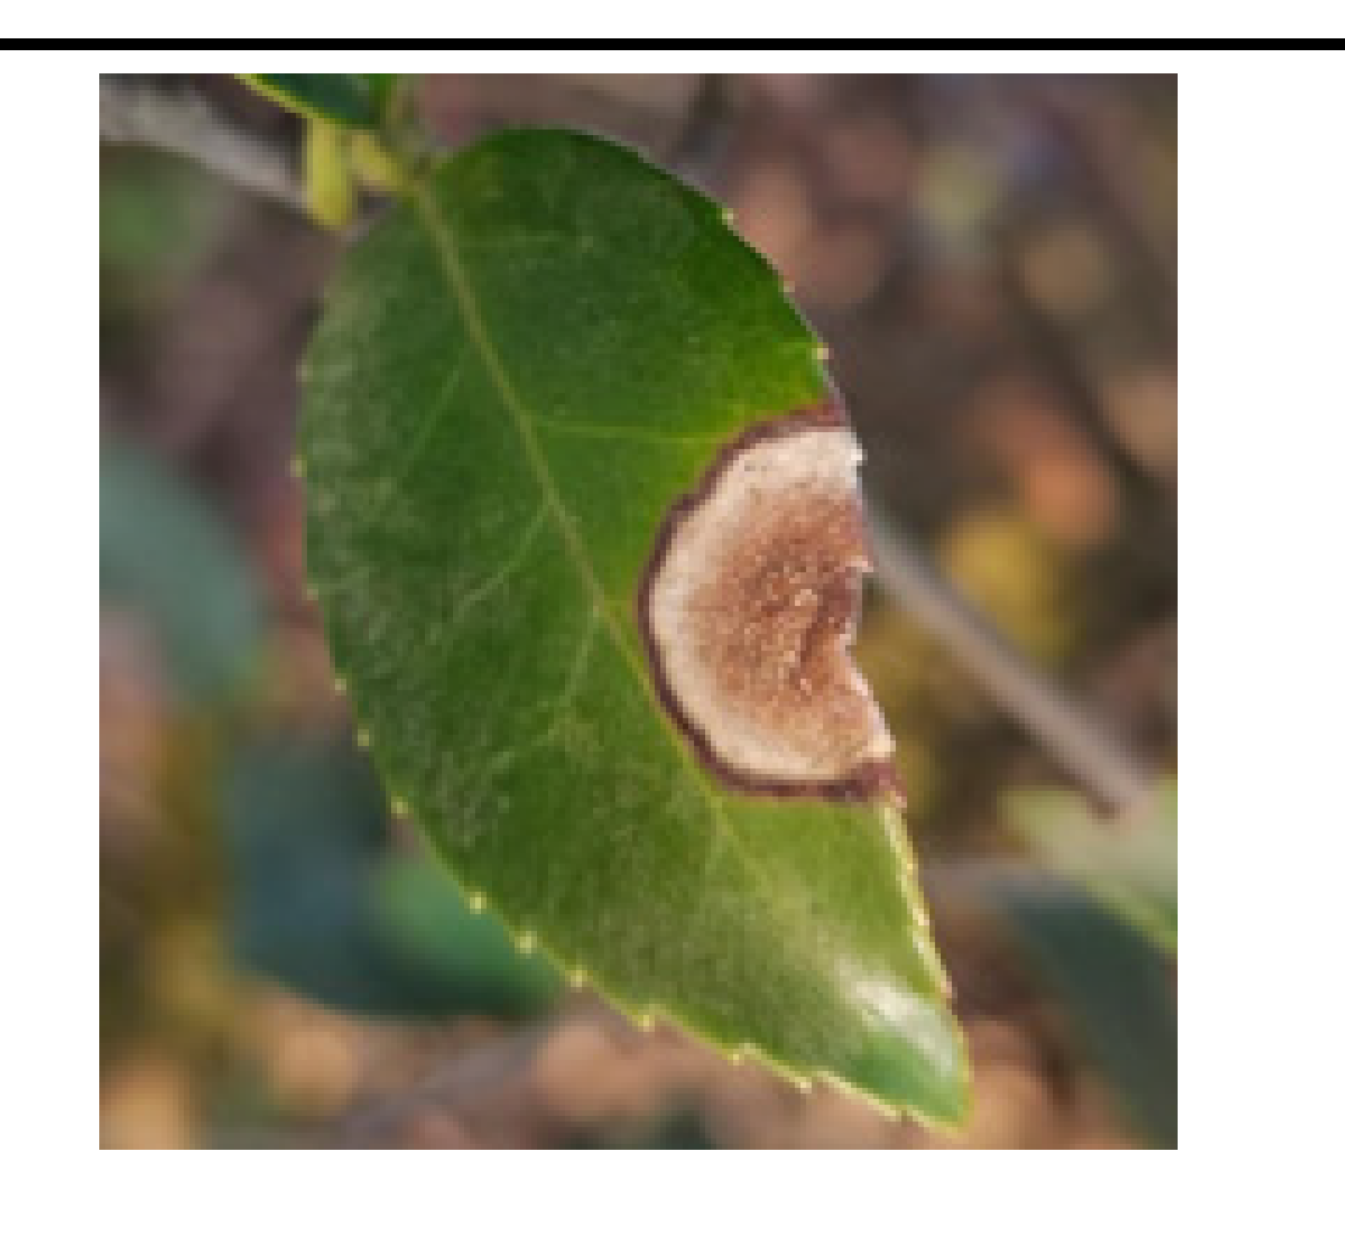
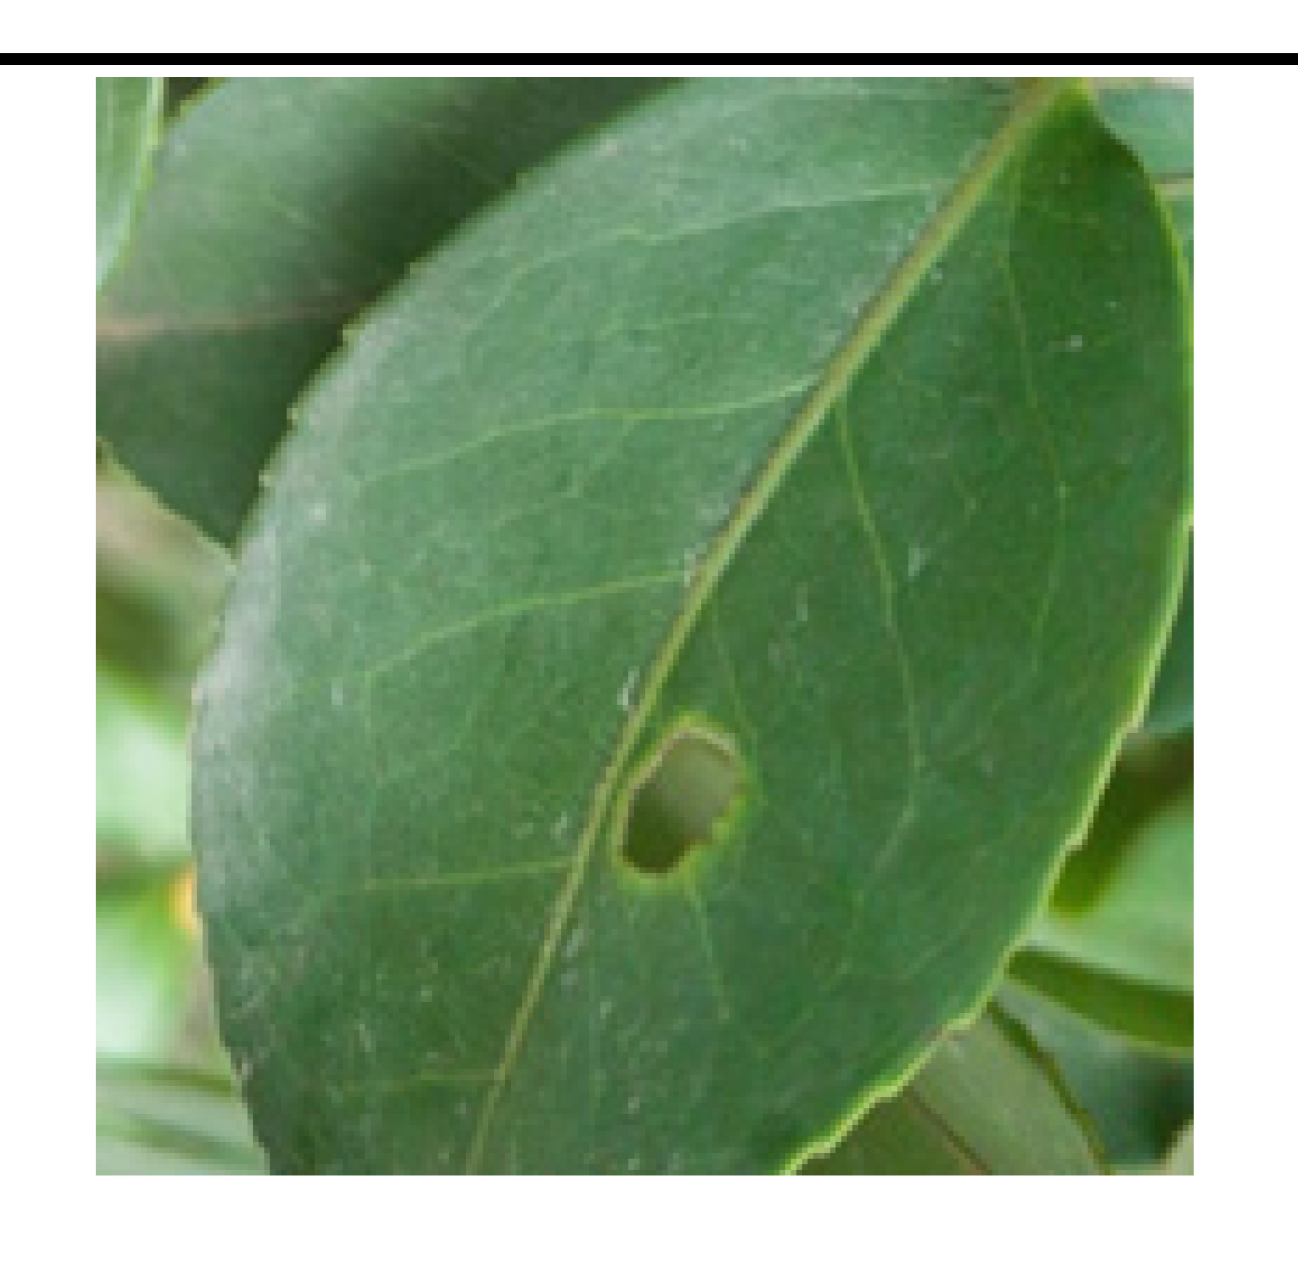
Considering the absence of public dataset pertaining to the leaf diseases and insect pests of C. oleifera, we built own dataset. The images were shot in two separate periods: one from April to June, and the other from September to November of 2023. To ensure a more diversity and comprehensive dataset, images were randomly collected across three different weather conditions: sunshine, overcast skies, and rainfall. The images were taken from various angles and under different light conditions using Huawei Mate40 camera. They were set to an aspect ratio of 1:1 and a resolution of 3072x3072 pixels. We collected a total of 3,172 high-quality images of C. oleifera diseases, which were rigorously vetted by experts and sorted into five categories: Anthracnose, Algae Leaf Spot Disease, Soft Rot Disease, Tea White Blister, and Worm Holes.
Data preprocessing aimed to highlight critical features, eased the learning process for models, reduced overfitting to particular datasets, and improved the ability of model to generalize new data. Given the high resolution of the C. oleifera images, traditional denoising techniques like Block-matching, Markov random field approaches, Contemporary wavelet and Three-dimensional (3D) filtering may inadvertently removed crucial details and texture information from the images. Consequently, we opted not to apply denoising procedures in our dataset. Our study addressed the challenges posed by the intricate backgrounds and inconsistent lighting of C. oleifera leaves by applying a range of image pre-processing techniques. These techniques encompassed mirroring, perspective correction, adjustments to contrast, and alterations to grayscale, all aimed at enhancing the complexity of the images for further analysis. We systematically applied one or more pre-processing methods to all leaves until the necessary criteria for training were satisfied. Following these pre-processing steps, the spatial distribution of leaf diseases was significantly improved. To expedite the training and reduce model size, the images were resized from 3072x3072 pixels to 640x640 pixels without compromising image quality. We utilized Labelme software to mark the locations of C. oleifera diseases and created corresponding mask maps.
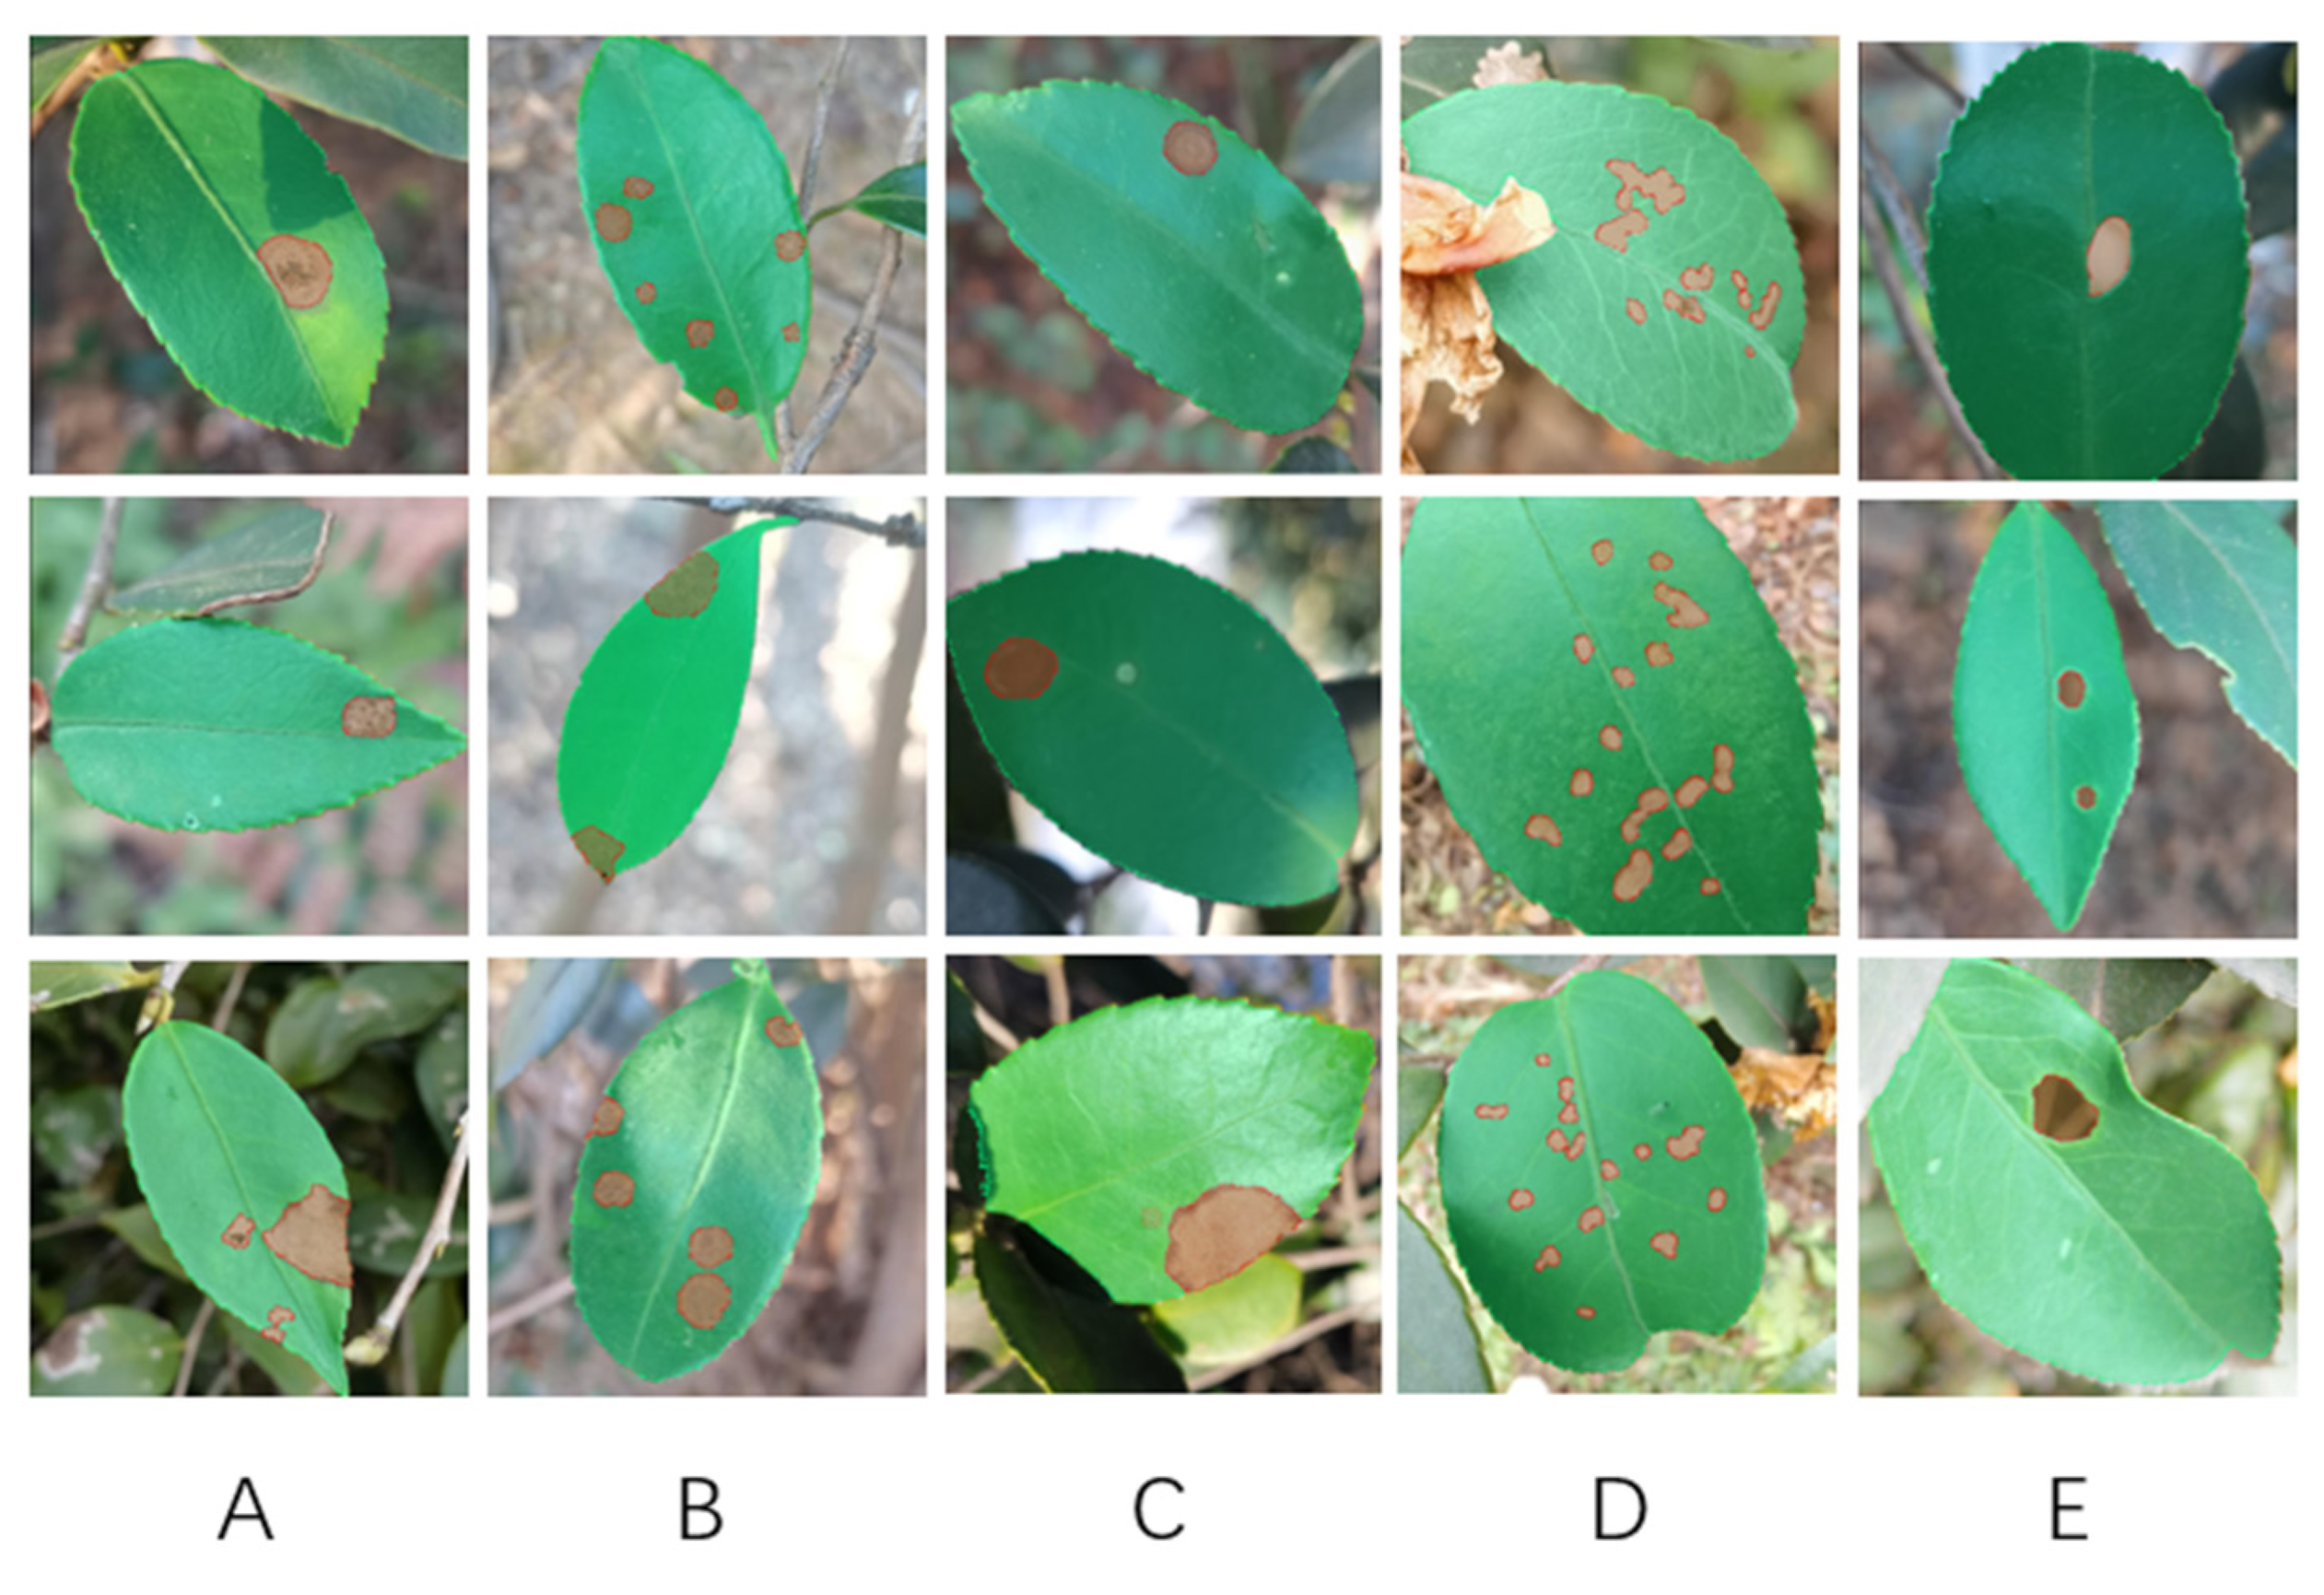
Figure 6 illustrated various disease labels, with each annotation of images saved in JSON format. A total of 1,265 photographs were selected following pre-processing to comprise the final dataset.
Table 1 presented the number of each C. oleifera disease categories along with their respective percentages. From the total, 80% (1012 photographs) were randomly chosen for training purposes, while the remaining 20% (253 photographs) were set aside for validation purposes. The ratio of training to validation throughout the training will remain the same.
3.2. Experimental Setup
To minimize hardware and network parameter influences on model training, all experiments were carried out under consistent hardware and software configurations. The specific hardware specifications used for training and prediction are presented in
Table 2. Furthermore, to preserve consistency and to prevent any external factors from affecting the experimental outcomes, the parameters for each network are standardized across all tests. As shown in
Table 2, this is the hyperparameter determined by us after a series of experiments.
3.3. Evaluation Indicators
The performance of model is assessed through a comprehensive set of five indicators: Mean Intersection over Union (mIoU), Recall, Precision, Parameter and Frames Per Second (FPS), providing a holistic understanding of its accuracy, efficiency, and resource consumption.
We first introduce the definitions of the four different types of regions: True Positive (TP): Represents the real diseased regions that have been identified as diseased. True Negative (TN): Represents the real healthy regions that have been identified as healthy. False Positives (FP): Represents the real healthy regions that have beenidentified as diseased. False Negative (FN): Represents the real diseased regions that have been identified as healthy. The definitions of these four regions in the segmentation results are shown in
Table 4.
The Intersection over Union (IoU) serves as a indicator to quantify the degree of overlap between the predicted segmented areas and actual segmented areas of Camellia oleifera diseases and insect pests. The mIoU, which are gained by averaging IoU across all diseases categories, is principal evaluation criterion in this study. It effectively assesses the performance of our model in semantic segmentation tasks, as shown in Equation (11).
Precision is defined as the proportion of correctly segmented Camellia oleifera leaf images relative to those that are incorrectly segmented within the dataset, as shown in Equation (12).
Recall, expressed as the ratio in Equation (13), refers to the proportion of actual C. oleifera leaf images that are correctly identified as needing segmentation out of all the instances that truly require segmentation.
FPS, or Frames Per Second, refers to the rate at which the model detects images. ‘T’ denotes the duration needed to process a single batch of images. During testing, we tested 100 times and determined the average FPS by calculating the mean of these 100 measurements to ensure accuracy, as shown in Equation (14).
3.4. Performance Evaluation of Each Module
The CBAM-ASPP module combines the CBAM with a dilated convolution, eliminating an average pooling layer. This structure facilitates the integration of multi-scale feature data, therefore significantly improving edge detection clarity. The DAM- Encoder integrates a DANet and CBAM-ASPP in parallel. This innovation allows the model to distinguish more small details of pests and diseases. Substituting the traditional backbone with MobileNetV2, which take the advantage of DSC, inverted residual blocks, and linear bottleneck layers, markedly decreases the quantity of parameters and accelerates computational efficiency.
3.4.1. Effectiveness of CBAM-ASPP
To overcome the issue of uneven sampling caused by dilated convolution, which can hinder the effective processing of edge information, we have incorporated dilated convolution with an attention module to create an attentional convolution module. The module addresses the challenge by selectively emphasizing important areas of the input. This approach not only enlarges the receptive field but also strengthens the extraction of edge features. Therefore, we perform experimental comparisons among five distinct attentional mechanisms: Convolutional Block Attention Module (CBAM), Dual Attention Network (DANet) [
37], Efficient Channel Attention (ECA) [
38], Shuffle Attention (SA) [
39], and Spatial Group-wise Enhance (SGE) [
40]. These mechanisms are evaluated for their effectiveness when are incorporated into the ASPP module. The experimental results are presented systematically in
Table 5 for clear interpretation and analysis.
The results indicate that incorporating attention mechanisms greatly improves the mIoU of the model. DANet stands out due to its exceptional increase in precision, primarily credited to its capability in effectively capturing long-range dependencies across spatial and channel dimensions. This enhancement facilitates to overcome the limitations of dilated convolution. CBAM achieves the highest mIoU and demonstrates a substantial improvement in Precision. For maximizing segmentation accuracy, we opt to integrate CBAM into the ASPP module.
3.4.2. Effectiveness of DAM- Encoder
In the previous research, DANet has been incorporated into the DeeplabV3+ framework to improve the segmentation of small disease by integrating local features with their corresponding global features. In our study, we examine two distinct methods for integrating DANet to the DeeplabV3+. The one is a parallel arrangement of DANet and ASPP, the other is a serial configuration of DANet and ASPP. The corresponding findings are illustrated in
Table 6. In the serial configuration, DANet processes features that have already been processed by ASPP. It might result in the loss of crucial details related to small-scale features. Conversely, when ASPP and DANet are connected in parallel, DANet processes high-level features which directly generated by backbone, allowing for the simultaneous extraction of disease features at different scales with ASPP. This parallel setup overlaps the outputs of DANet and ASPP, thereby enhancing the overall segmentation performance.
Table 6 indicates that the parallel DAM- Encoder structure yields an mIoU of 81.96%, which is an improvement over the previous mIoU of 79.81%. Furthermore, the parallel DAM- Encoder experiences only a marginal reduction of 0.55% in Precision relative to the serial structure. Given these results, we decide to adopt the DAM- Encoder (parallel) configuration for the task of identifying and detecting minuscule pests and diseases on Camellia oleifera leaves.
3.4.3. Effectiveness of MobilenetV2
To optimize the efficiency of model by decreasing parameter count and computational load without compromising segmentation performance, we substitute the Xception backbone with the MobileNetV2. The results of this substitution are presented in
Table 7. The modified parameters are diminished by roughly 8 times compared to the DeeplabV3+, and there is also a nearly 5-fold decrease compared to CDM-DeeplabV3+. Moreover, the adoption of MobilenetV2 as the backbone not only reduces the parameters and computational requirements but also maintains the integrity of vital features, leading to a modest increase in mIoU. According to the FPS measurements, the detection speed has improved. the system can process approximately twice as many images per second, from around 10 to 20. The integration of the innovative CBAM-ASPP and DAM-Encoder designs does not result in a observably rise in the quantity of parameters, thus preserving the detection speed. The results clearly show that MobilenetV2 can markedly decrease the quantity of network parameters and simultaneously boost processing efficiency without sacrificing the performance of network. Hence, MobilenetV2 is chosen as the backbone for this study.
3.4.4. Ablation Experiments
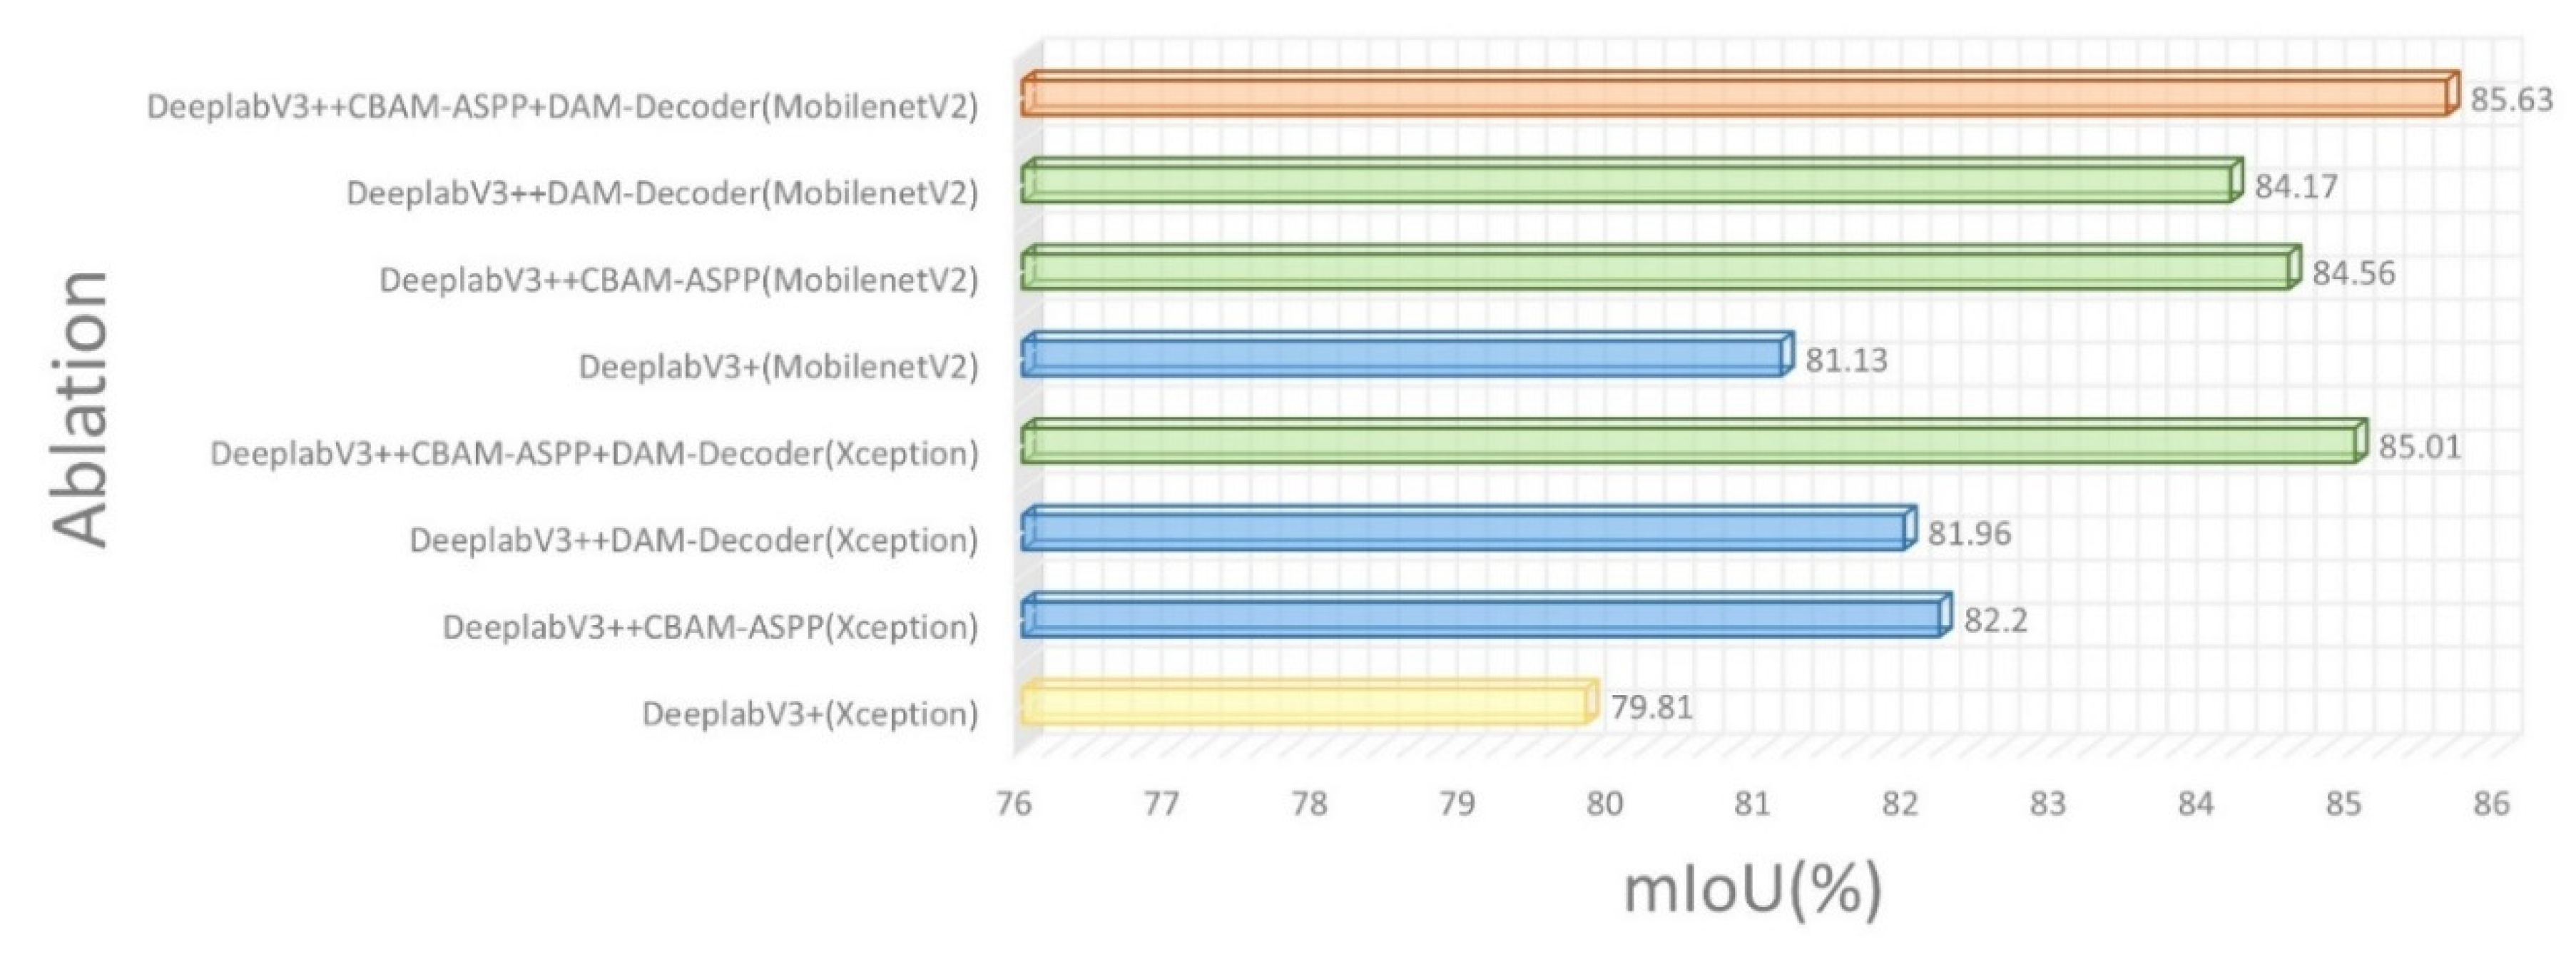
To evaluate the efficacy of our CDM-DeeplabV3+ model designed specifically for disease segmentation in C. oleifera leaves, we conducted a series of ablation studies. Each structure, including CBAM-ASPP, DAM-Encoder, and MobilenetV2, are added incrementally for comparative analysis. Our analysis primarily focuses on the change in mIoU as a metric to evaluate the performance of each module and its promotion to the model. Having already discussed above the improvements in network performance achieved by adding single modules, we will delve into the experimental outcomes to demonstrate the impact of integrating multiple modules together. These experimental data are presented in
Figure 7. The fused application of CBAM-ASPP and DAM-Encoder outperforming the single structure by 2.81% and 3.05% in mIoU, respectively. The integration of these two modules significantly enhances feature extraction, resolving the challenges of ambiguous boundaries and the detection of subtle characteristics. Consequently, this approach markedly bolsters the capabilities of network by various dimensions. Although integrating MobilenetV2 with the aforementioned modules does not lead to a substantial increase in mIoU, it notably diminishes the number of parameters by nearly 5 times. This reduction substantially enhances the efficiency of model, laying a solid foundation for real-time detection applications. The above conclusion of analysis are proved that introduction of our proposed modules have led to a considerable enhancement in the segmentation accuracy of diseased and insect pest C. oleifera leaves.
3.4.5. Edge and Tiny Problem Solving and Demonstration
In the introduction of this paper, we outline the challenges with the original DeeplabV3+ model, particularly highlighting the issues of edge blurring and the loss of small diseases.
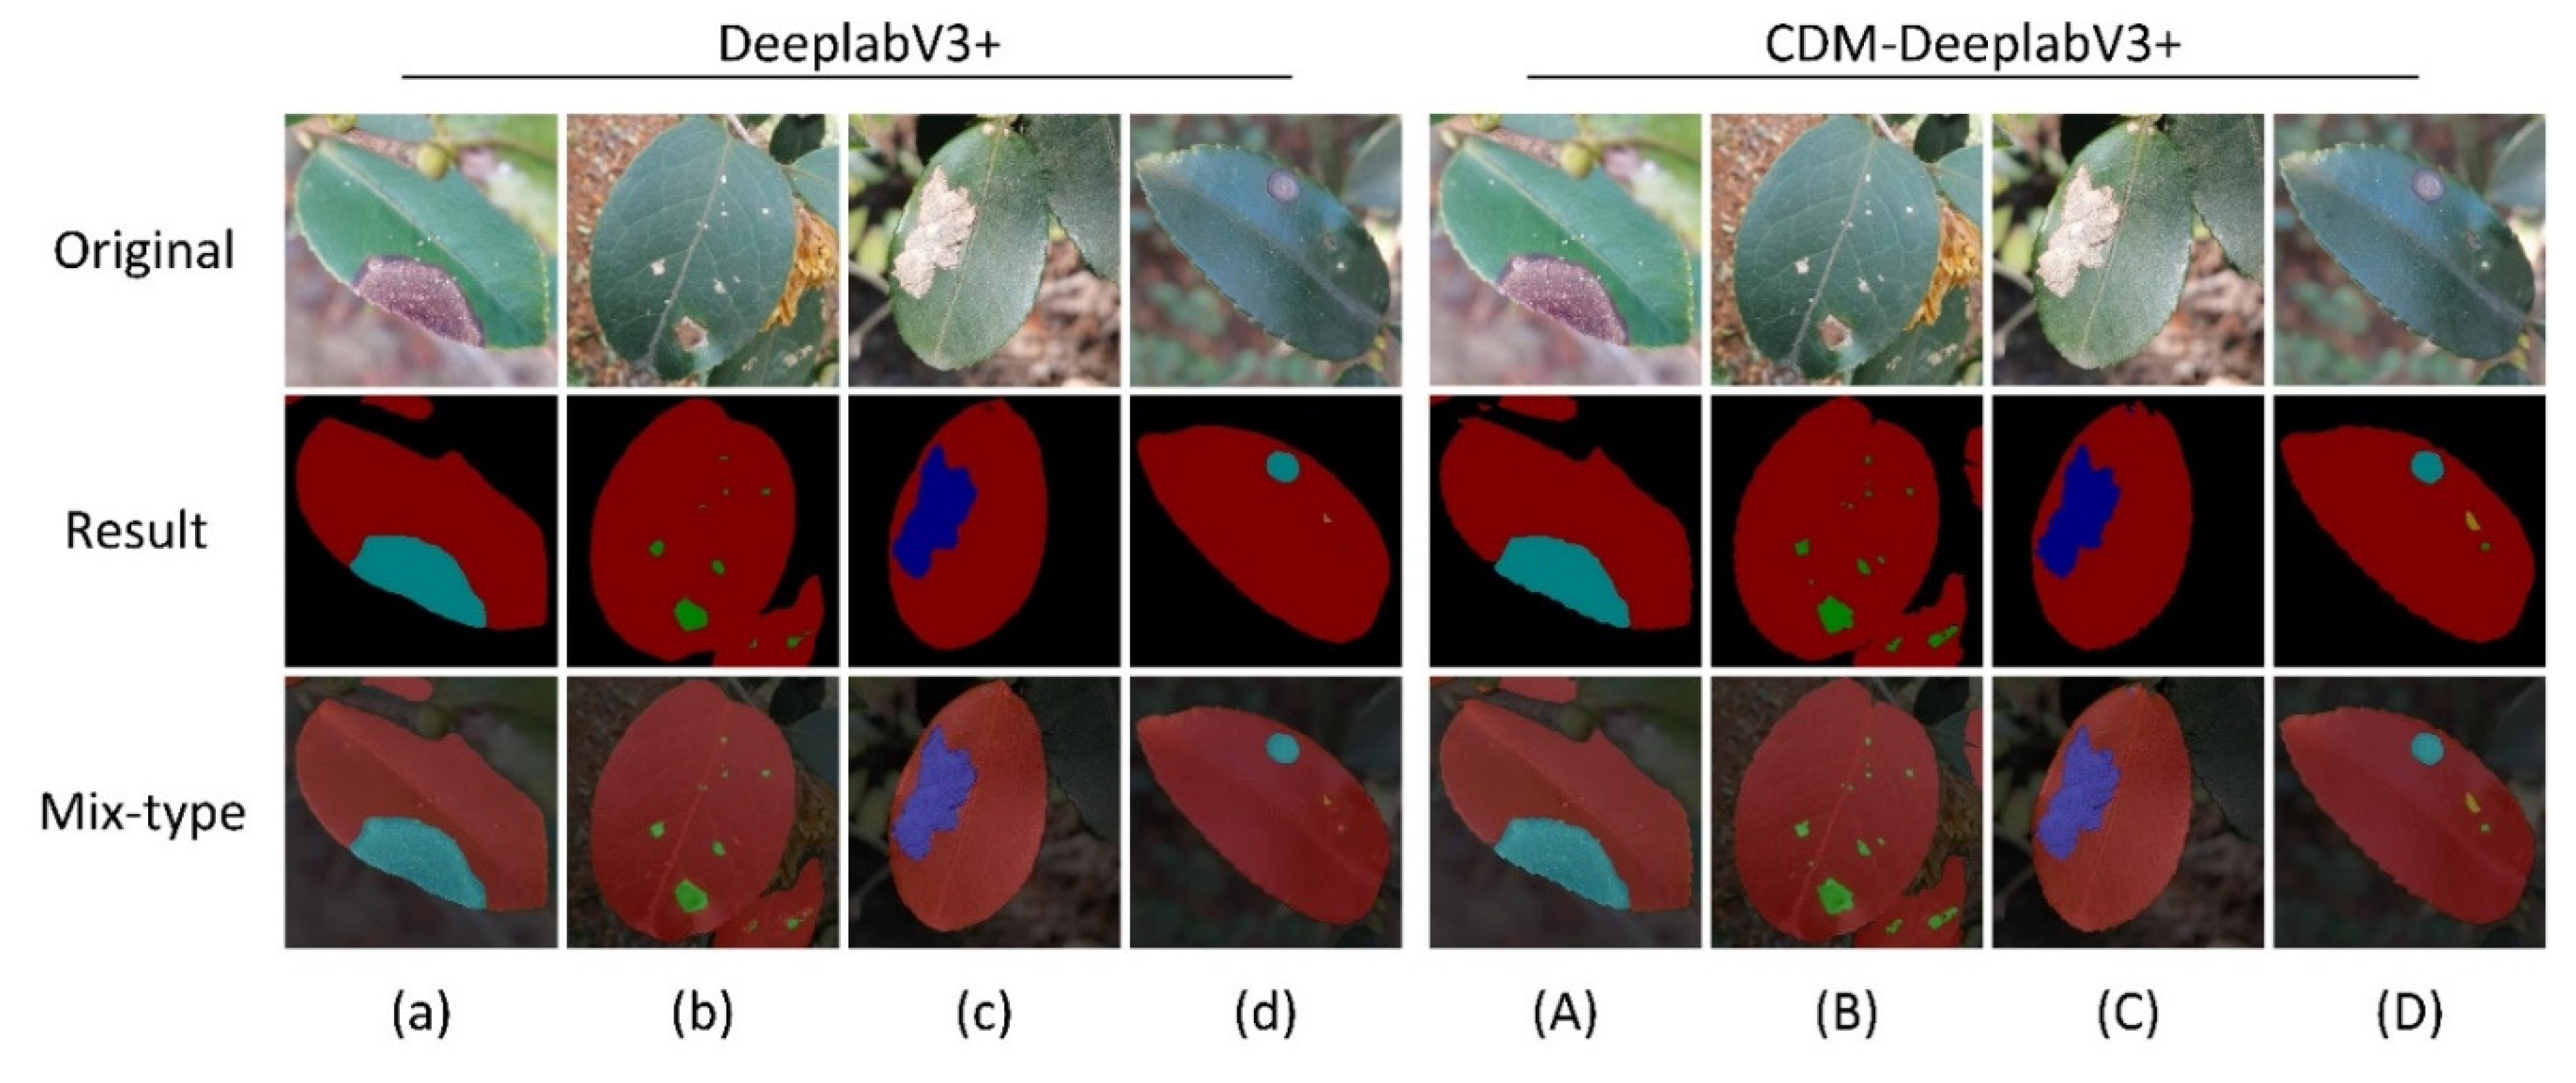
Figure 8 shows three distinct image types: the original image, its segmented image, and the composite image. In this study, as shown in
Figure 8,we carry out a comparative examination of the segmentation outcomes between the conventional DeeplabV3+ model and our innovative CDM-DeeplabV3+ design.
Figure 8(a) reveals that the original DeeplabV3+ struggles to accurately outline the diseased areas. Conversely, CDM-DeeplabV3+ (as shown in
Figure 8(A)) is proved has superior performance by delineating the jagged edges of diseases on C. oleifera leaves with greater precision. Additionally,
Figure 8(c) and
Figure 8(C) further highlight its effectiveness of edge segmentation by our proposed model. Regarding the segmentation of tiny diseases features, it is evident from a comparison of
Figure 8 that our proposed network exceeds in detecting and segmenting these fine elements. The tea white blister, a common diseases of C. oleifera leaves, presents on leaves just like as numerous small, white, dot-like lesions.
Figure 8(C) clearly shows that our model successfully segments all the area of tea white blister, effectively overcoming the difficulty of segmenting such tiny diseases.
Figure 8(d)and
Figure 8(D) depict situations where a C. oleifera leaf is simultaneously impacted by various diseases and insect pests. The CDM-DeeplabV3+ model still efficiently and accurately segments these complex overlapping issues.
3.5. Comparison of Other Models with the CDM-DeeplabV3+ Model
For this experiment, the performance of model is evaluated using the previously established metrics for the CDM-DeeplabV3+ architecture. Its performance was then compared to that of several advanced models, including UNet [
41], UNet++ [
42], PSPNet [
43], and HrNetV2 [
44].
Table 8 illustrates the results of each performance of model. PSPNet does not show significant advantages over the other models. Although it also uses a pyramid pooling structure, its receptive field is less extensive than the dilated convolutions employed in our approach, resulting in a lower mIoU. Moreover, the other evaluation metrics do not indicate outstanding performance. HrNetV2 (85.32% in mIoU, 85.58% in Precision) and UNet (78.70% in mIoU, 84.38% in Precision) exhibit better performances, compared with PSPNet (76.55% in mIoU, 80.37% in Precision). This indicates that HrNetV2 and UNet are equally effective in segmenting diseases and insect pests. We attribute the superior performance of HrNetV2 to continuous information exchange via iterative multiscale fusion. This process entails the integration of information from parallel representations at different resolutions, which enriches the data fusion and consequently improves segmentation accuracy. While HrNetV2 demonstrates strong segmentation capabilities, it comes with a parameter count that is roughly double that of our proposed network. In the context of agricultural disease and pest detection, the small model parameters are key. Therefore, our model can be applied in actual agriculture.
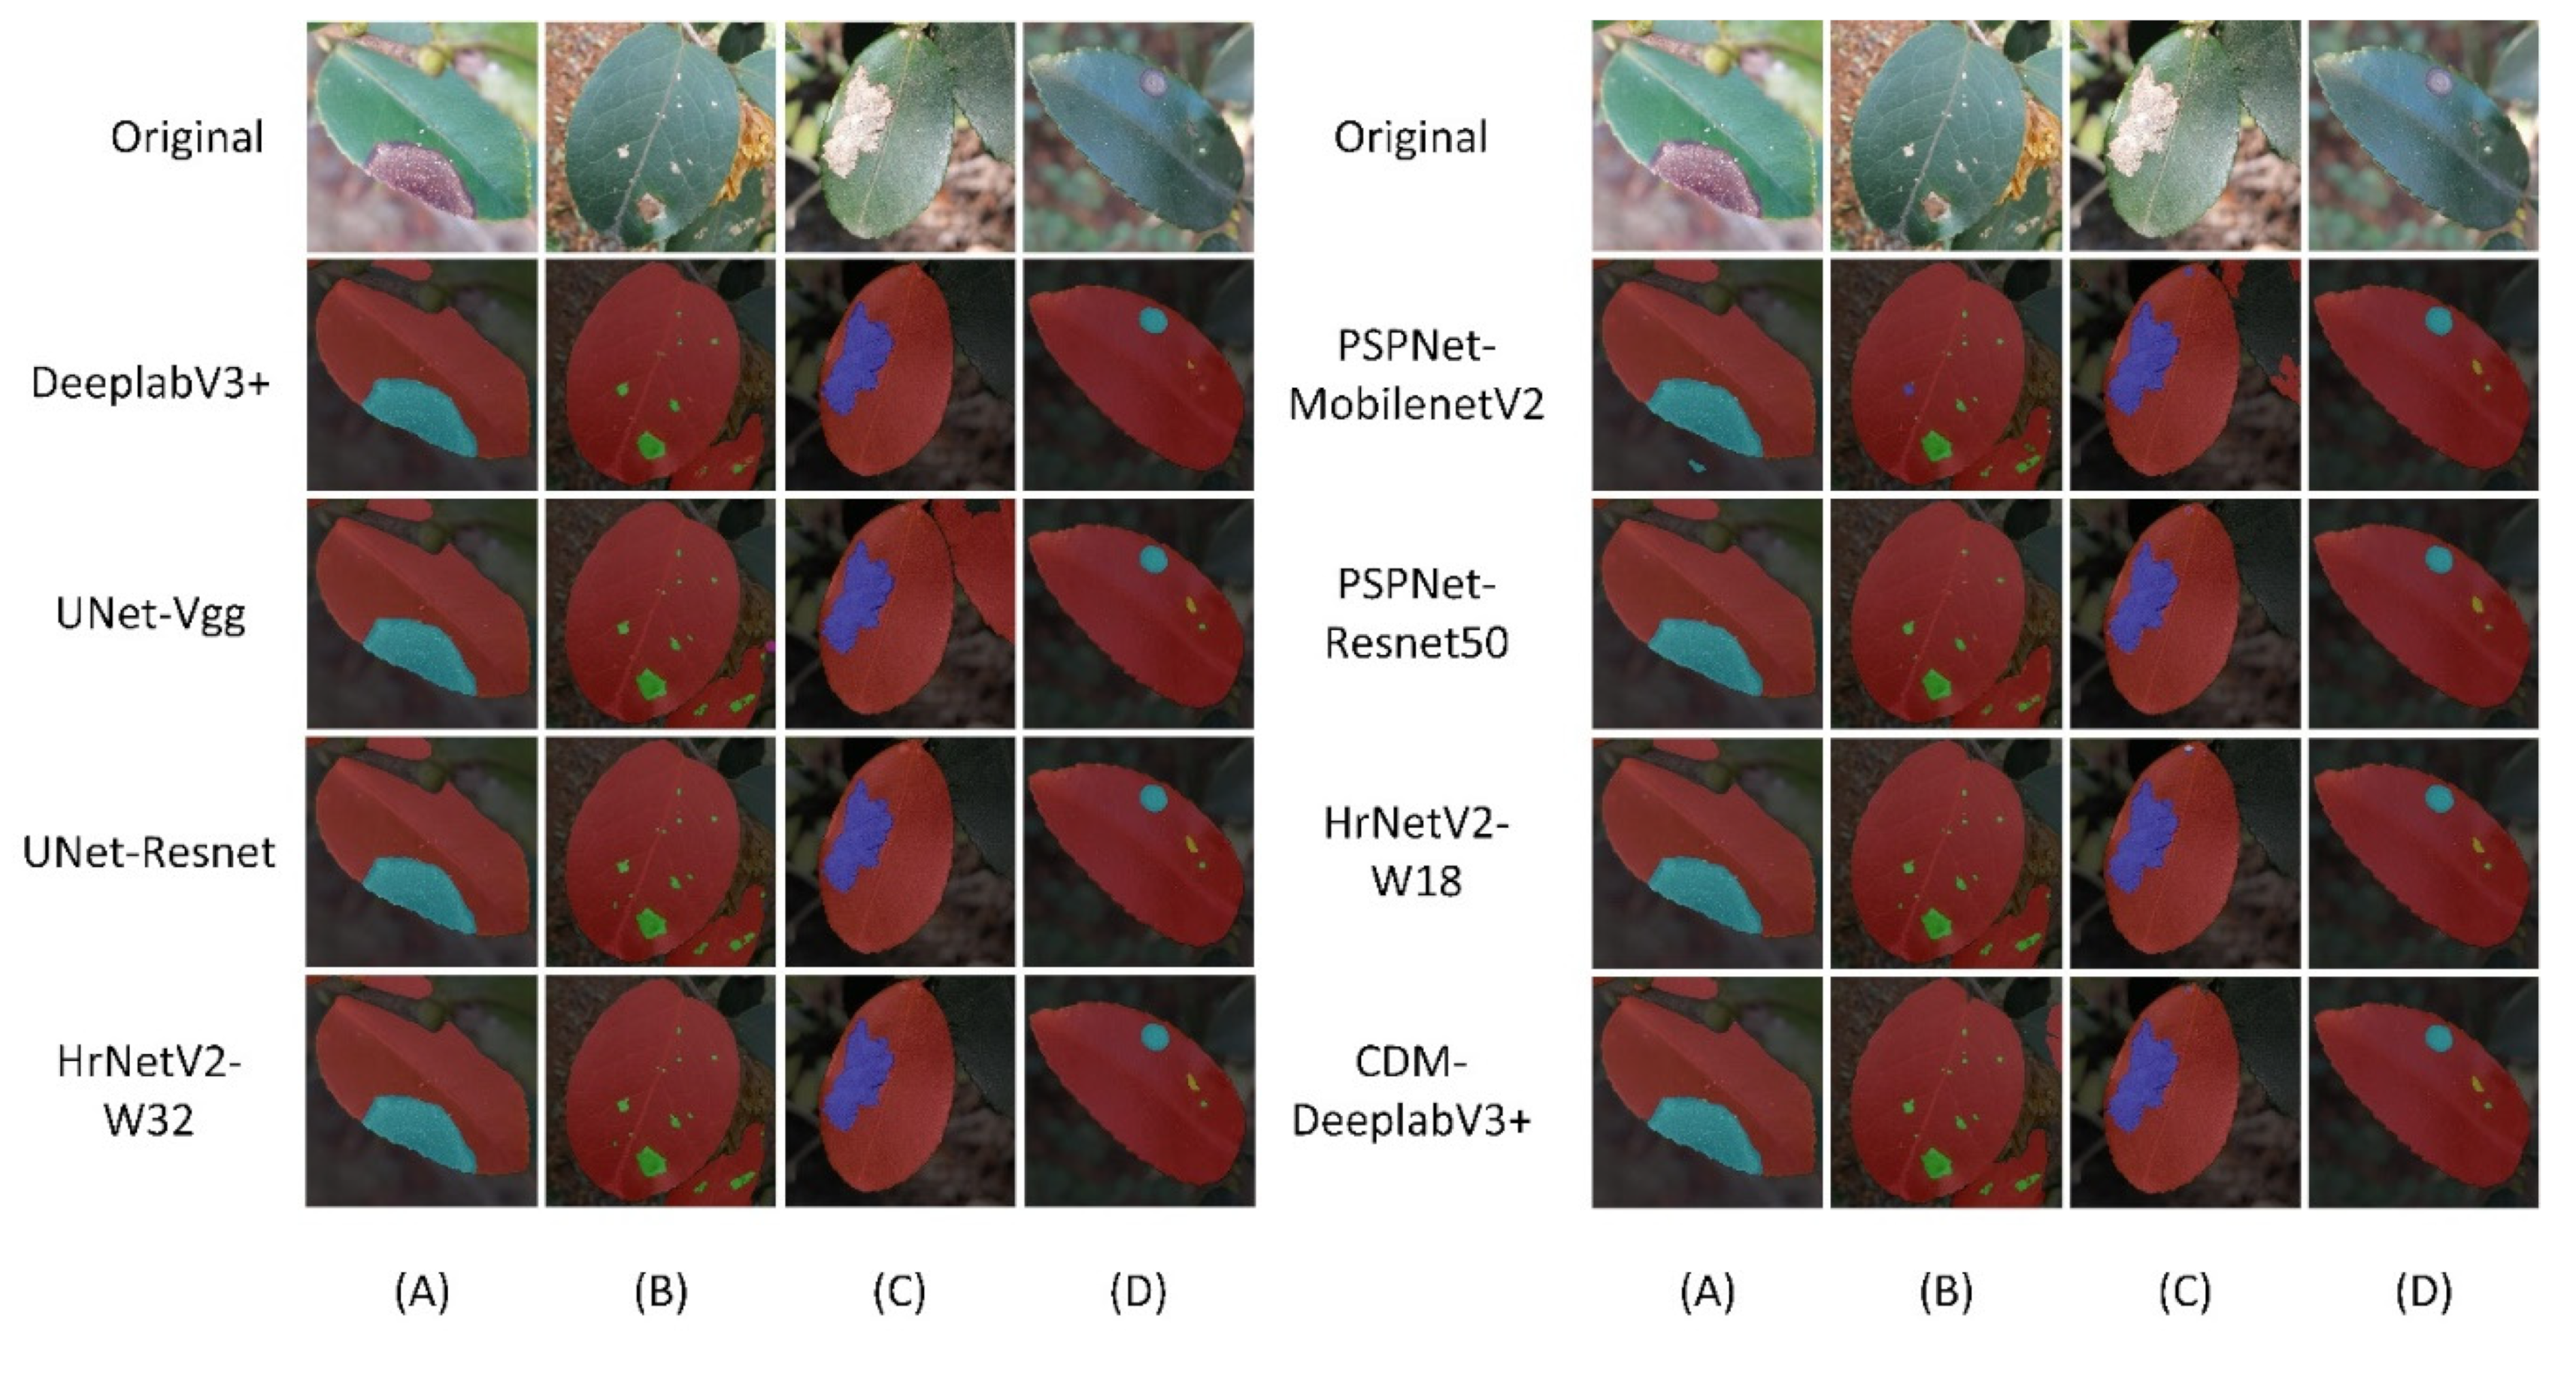
In order to comparing the segmentation outcomes with different models, we put typical images into each models. This approach offers a visual means of understanding the disparities in segmentation performance among the models.
Figure 5 presents the original images and the segmented results.
As depicted in
Figure 9A, when leaf edges are indistinct and specific diseases closely resembled the background, some models, such as DeeplabV3+ and PSPNet, show overfitting. Even leaves were clearly distinguishable from the background, as shown in
Figure 9C, the models also had difficulty precisely segmenting the edges of the diseased areas, resulting in inaccurate segmentation masks. The segmentation outcomes can effectively be discriminated between Camellia oleifera diseases and the background by our proposed models. In the case of severe disease, the leaves were eroded so that they blend with the dark background. But our model still could accurately segment serrated edges of the diseased leaves. Within the diseased leaves, it also could be depictured a jagged edge which more fit to diseases area, instead of an overfitting curve. The CBAM-ASPP module is effective in capturing multi-scale features. It retains vital edge information by prioritizing features located at the edges of diseases. The segmentation results of the CDM-DeeplabV3+ are corroborated more accurately, comparing with other networks.
Tea white blister is primarily characterized by small white spots, as shown in
Figure 9B. It is a challenge for original model, leading to the potential loss of information. CDM-DeeplabV3+ surpasses networks such as PSPNet in efficiently segmenting minuscule features. Additionally, it maintains robust recognition of Tea white blister even under varying illumination conditions. The capability of DAM-Encoder to integrate semantic information from both dimensions ensure robust extraction of small details and improve semantic coherence. The improved performance contributes to our proposed architecture.
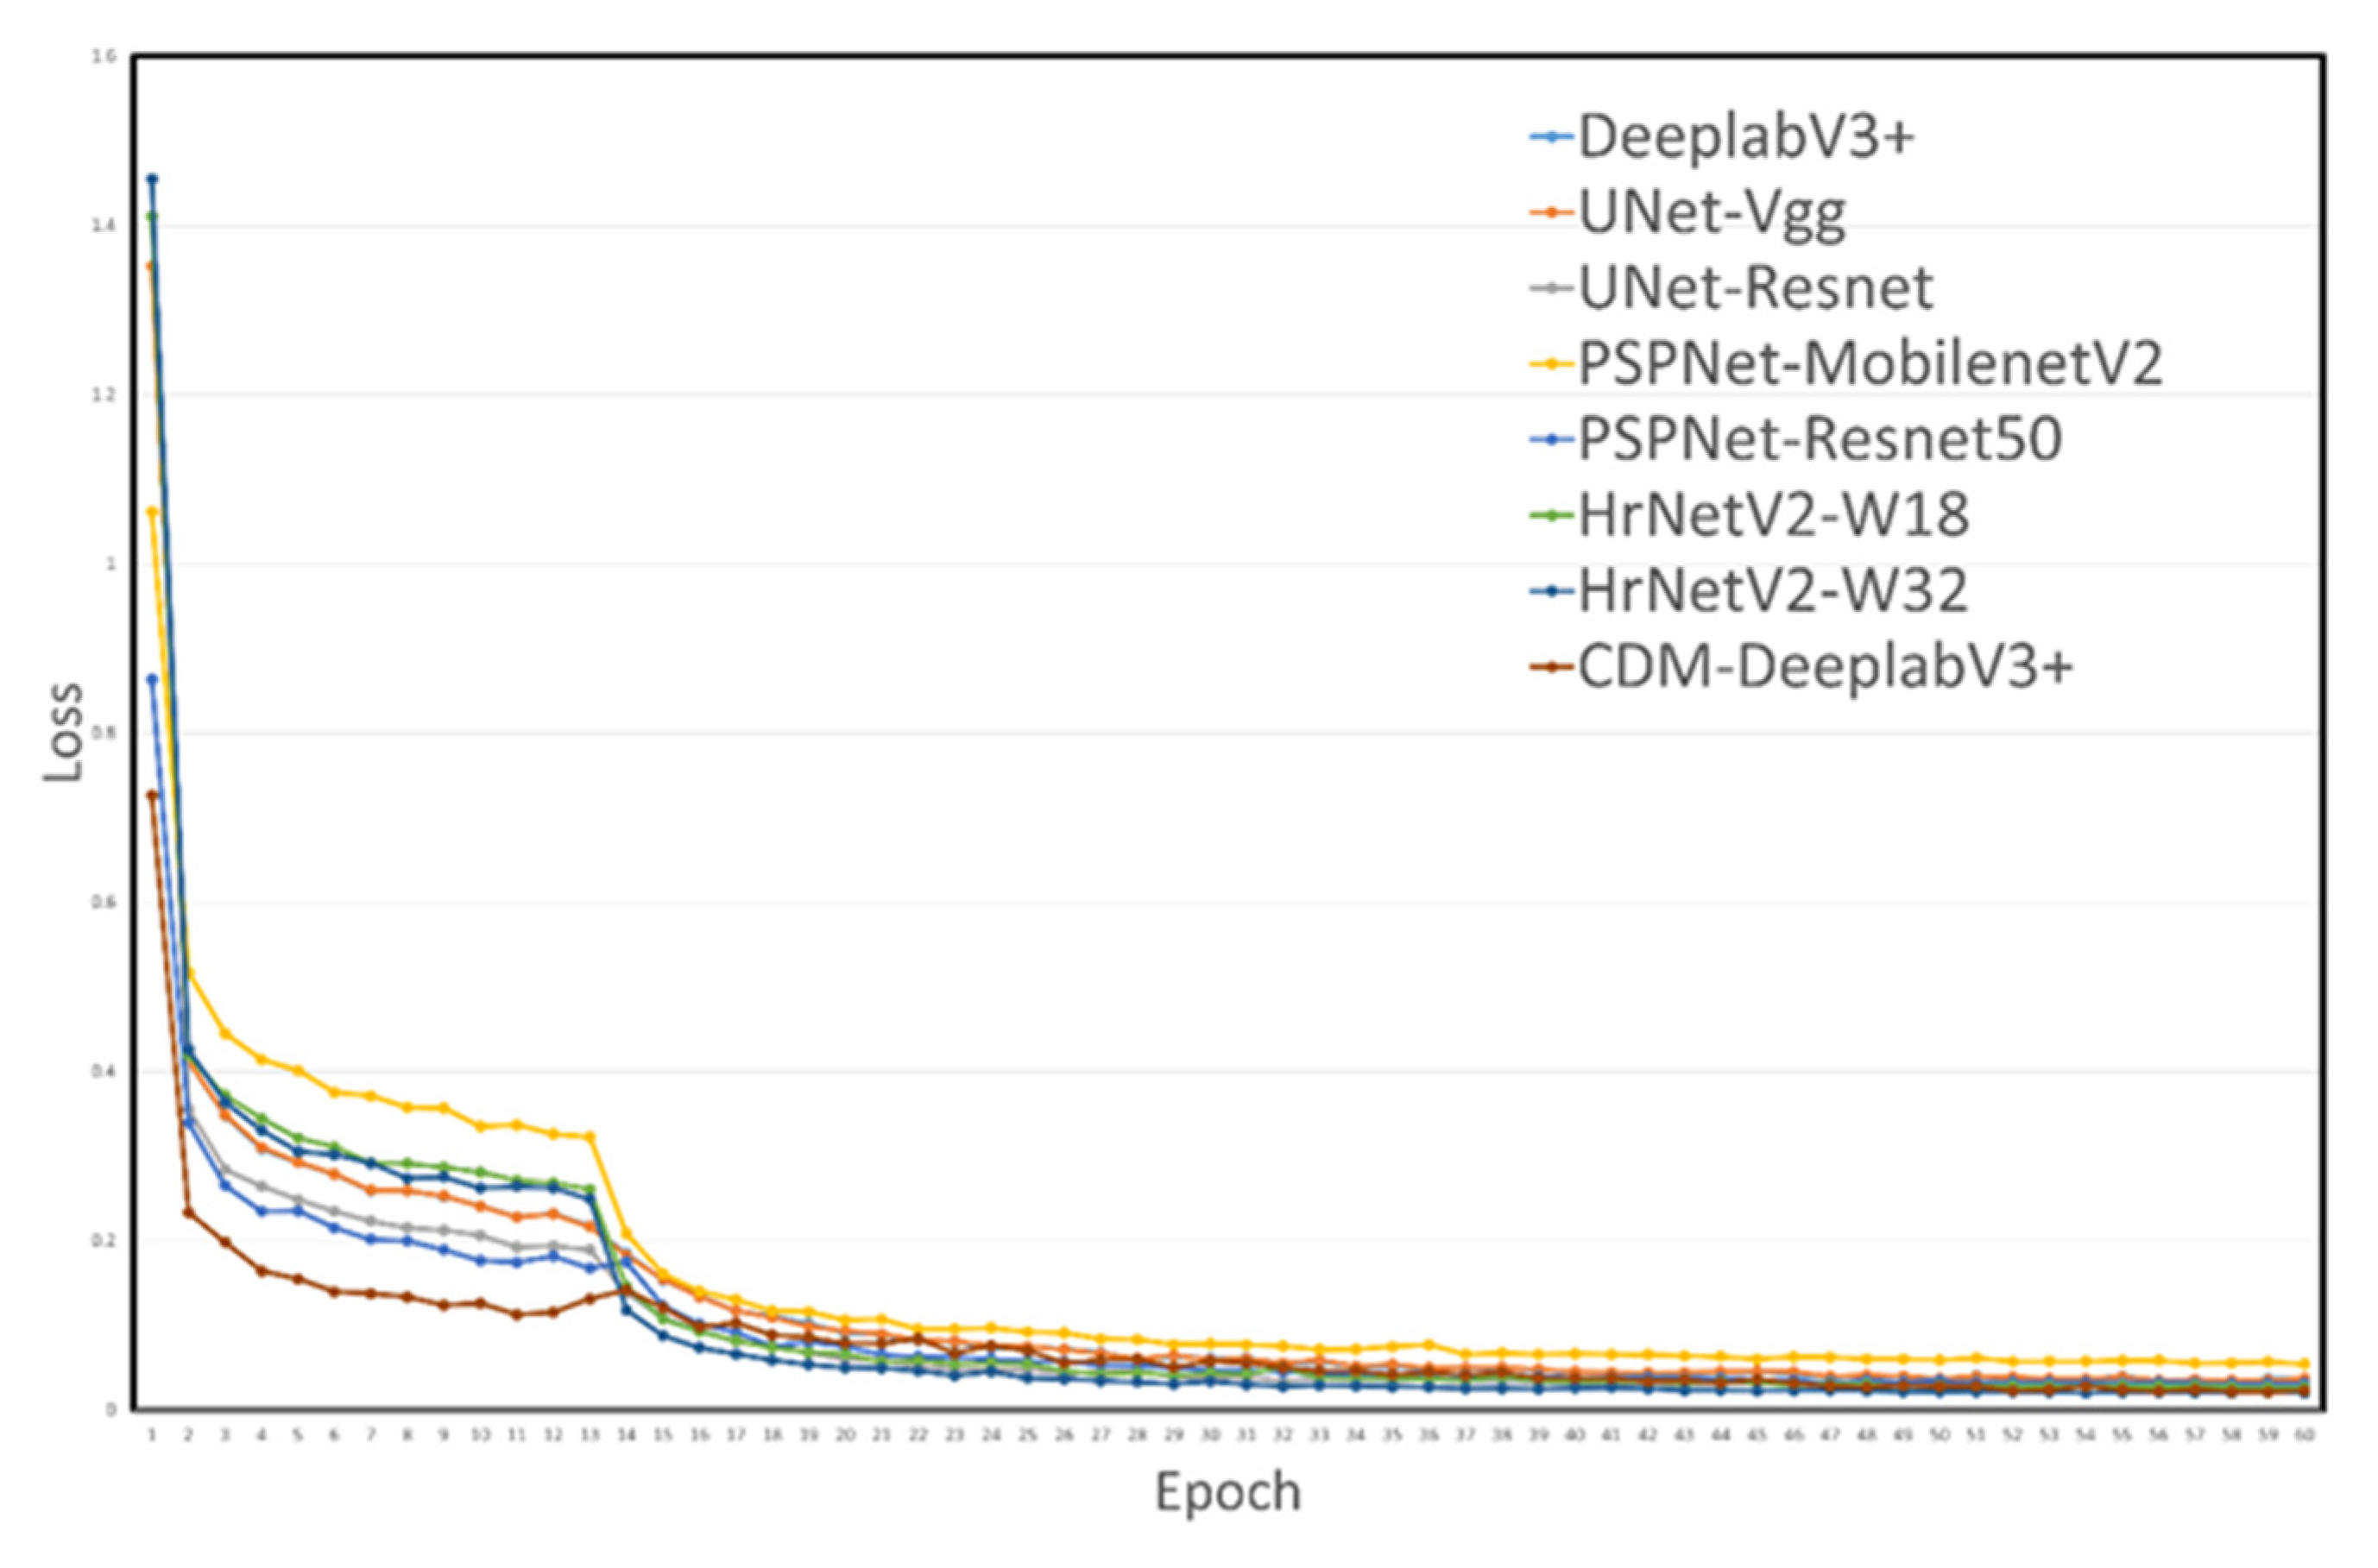
The loss function curves for various models are illustrated in
Figure 10. Initially, the loss values among the models vary significantly. As increasing training epochs, these values drop quickly and tend to stabilize across most subsequent epochs. Notably,
Figure 10 reveals that the proposed CDM-DeeplabV3+ model maintains consistently low loss, suggesting the robust generalization performance of network.4. Discussion
Authors should discuss the results and how they can be interpreted from the perspective of previous studies and of the working hypotheses. The findings and their implications should be discussed in the broadest context possible. Future research directions may also be highlighted.
