
Submitted:
06 October 2024
Posted:
07 October 2024
You are already at the latest version
Abstract
Soil fauna is integral to facilitating material cycles, energy flows, and the conservation of biodiversity in terrestrial ecosystems. However, the impacts of forest development on the compositions and structures of surface soil macrofauna remain uncertain. Here, we assessed the dynamics in abundance and diversity of soil macrofauna across eight successional age stages of Metasequoia glyptostroboides tree plantations (7-, 16-, 21-, 26-, 31-, 36-, 41-, 46-year-old stands) in a reclaimed coastal land in China. The results revealed that the total abundance of soil macrofauna initially decreased during the young to near-mature stand period (7- to 31-year-old stands), whereas it increased along the age series, from the near-mature to overmature stand period (31- to 46-year-old stands). Specifically, the dynamics showed a U-shaped curve with stand development. Further, there was a significantly negative correlation between the Shannon-Wiener diversity index and the total abundance of soil macrofauna across this plantation chronosequence. The variations in abundance of detritivores were consistent with the total abundance of soil macrofauna during stand development. The abundance and diversity of the soil macrofauna were strongly correlated with the soil environment (e.g., soil organic carbon, litter biomass, and microbial biomass nitrogen). These findings highlight that the compositions and structures of soil macrofauna were significantly altered with M. glyptostroboides stand development. This provides important insights for studying the interconnection of above- and belowground plantation ecosystems toward their optimal management.
Keywords:
soil macrofauna
; total abundance
; diversity
; functional groups
; stand development
1. Introduction
Soil macrofauna is an indispensable element of soil fauna in terrestrial ecosystems, which plays critical roles in nutrient cycling, soil structure maintenance, and ecosystem functionality [1]. The structural characteristics, diversity and ecological functions of soil fauna communities have garnered intense attention in the field of ecological research [2,3], because they can affect the aboveground- underground ecosystem process by affecting the surface litter decomposition, biogeochemical cycling processes, the composition and community structure of soil microbes, and vegetation productivity [4,5]. Soil fauna are also pivotal participants and effective drivers in the material cycling and energy flows of forest ecosystems, which play essential roles in surface litter decomposition [6], soil nutrient formation [3], and maintenance of soil fertility [7]. They are also biological indicators of vegetation succession [1,7], environmental disturbances [2], and climate change [8].
The global plantation forest area has steadily increased over the last 20 y, reaching 219 million hectares in 2015 [9], while the current (2024) worldwide total is 360.22 million hectares[10]. Currently, China has the largest forest plantations worldwide [11]. Long-term plantation development may significantly impact the components of soil macrofauna [12,13], by inducing changes in understory environments [13], soil structures [13], and nutrients [14,15]. Hierarchical modifications in tree plantation communities affect their physical living space and regulate the hydrothermal conditions of the soil; thus, affecting the metabolism, activities, and reproductive dynamics of soil macrofauna communities [3,8]. Conversely, changes in the compositions of available resources further impact the structural configurations and ecological functions of soil macrofauna [16]. Therefore, modifications in the compositions and environmental conditions of plantations significantly impact soil macrofauna communities. In response, they serve as important biological indicators of changes in the soil environment [17,18].
The ages of afforested plantations had significant influences on the diversity [19], abundance [13], and community structures of soil macrofauna [20]. It was observed that the diversity, abundance, and richness of soil macrofauna tended to steadily increase with stand age [21], albeit their diversity tended to be highest during both the early and mature seral stages [22]. Further, variations in the primary forest components and compositions of soil macrofauna varied across different succession stages [21]. Meanwhile, anthropogenic interference (e.g., thinning) impacted the abundance and diversity of soil macrofauna. Huang et al. (2014) reported that forest thinning altered the structures of understory vegetation and canopy covers of plantations. This led to modifications in the food resources available for soil macrofauna, which consequently altered their abundance and diversity; however, to what extent they change remains unclear.
Metasequoia glyptostroboides Hu et W. C. Cheng is a deciduous tree species belonging to the Taxodiaceae family that exhibits rapid growth and multifunctionality, as well as soil improvement. It is one of the principal tree species utilized in protective forest systems along the eastern coastlines of China [23]. Investigations into the feedback loops between the growth of M. glyptostroboides plantations, soil properties, and the activities of soil macrofauna can inform strategies for enhancing the sustainability of reforestation and afforestation projects, to ensure that these initiatives contribute positively to the conservation of biodiversity [12]. However, variations in the stand ages of M. glyptostroboides plantations induce changes in soil quality and understory environments, with potential repercussions for soil macrofauna populations, soil structures and fertility, albeit these potential impacts will require far deeper elucidation.
For this study, we investigated eight M. glyptostroboides plantations along a chronosequence to investigate the influences of stand development on the compositions and structures of soil macrofauna. Specifically, this study aimed to, (1) determine changes in the abundance and diversity of soil macrofauna as plantations develop; (2) analyze which primary environmental factors drive the dynamics of soil macrofauna as afforested trees develop. We hypothesized that, (H1) The abundance and diversity of soil macrofauna increases discontinuously as plantation develop, as factors including the top-down effects of predators and bottom-up impacts of resource availability [24] do not fully align with stand age related changes [13,15]; (H2) The total abundance and diversity of soil macrofauna are positively correlated across a plantation chronosequence, as the complementarity of species for resource use may increase over time [25,26]; (H3) The contributions of SOC, litter biomass, as well as microbial biomass nitrogen and carbon influence the dynamics of soil macrofauna as tree stands develop, as they significantly impact soil nutrients and microorganisms [25].
2. Materials and Methods
2.1. Site Description and Experimental Design
This study was conducted at the Yellow Sea State Forest Park of Dongtai County, Northern Jiangsu Province, in Eastern China (32°51′- 32°53′N, 120°48′-120°50′E) (Figure 1a), which located in a warm temperate-subtropical transition zone under the influence of a monsoon climate. The seasonal changes in temperature and precipitation were recorded at the Dongtai local meteorological station. The mean annual temperature in this area is approximately 13.7°C, with 1051.0 mm of annual rainfall, and an annual average relative humidity of 88.0%. The terrain encompasses the middle and lower reaches of the alluvial Yangtze River plain, with desalted sandy loam meadow soil [27]. The understory of the Metasequoia glyptostroboides plantations, is dominated by shrubs (Koelreuteria paniculata, Ligustrum lucidum, Morus alba, Broussonetia papyrifera, etc.) and herbaceous plants (Cayratia japonica, Duchesnea indica, Oplismenus undulatifolius, Erigeron annuus, Humulus scandens, Torilis scabra).
For this study, a chronosequence strategy was utilized that involved meticulous site selection and replication, which made it particularly suitable for examining the temporal dynamics of soil development across multiple time-scales [28]. Eight Metasequoia glyptostroboides plantations with different age gradients (7-, 16-, 21-, 26-, 31-, 36-, 41-, 46-year-old) were selected as experimental sites, which had similar pre-afforestation management and site conditions (Figure 1b). For each plantation age group, four replicate plots (20 m × 30 m) designated A, B, C, and D were established for a total of 32 plots. Each sample stand age plot was separated by >200 m intervals to avoid spatial autocorrelation (Table S1).
2.2. Collection and Identification of Soil Macrofauna
Soil macrofauna sampling proceeded during each season (August 2022 (summer), November 2022 (autumn), February 2023 (winter) and April 2023 (spring)). On each sampling date, four replicate soil samples were extracted from each plot using the S-shaped sampling method. A total of 512 samples for the identification of soil fauna were collected: 4 (seasons) × 8 (stand ages) × 4 (duplicate plots) × 4 (sampling points) = 512 (samples).
Soil fauna was gathered using disposable plastic cups, which served as traps. At each sampling point, the cups were placed into dug pits, leveled with the ground, and filled with a saturated NaCl solution. After 3 d the collected soil macrofauna were carefully sorted to plastic bottles filled with 75% ethanol. The bottles were sealed, stored in the dark, protected from compression, and subsequently brought back to the laboratory for further classification and identification [29].
Soil fauna identification: The collected soil fauna were classified, referring to the Chinese Soil Fauna [30], and counted under a stereomicroscope (LEICA M205A). Most of the soil fauna taxa were identified to the family level, with a few to the order level.
Functional group classification: based on the different feeding functions of the soil fauna, they were segregated into four functional groups, representing herbivores, carnivores, detritivores, and omnivores, respectively [31].
2.3. Measurement of Soil and Surface Litter Physicochemical Properties
In the field, ambient atmospheric and ground temperatures were recorded, accompanied by descriptions of the surrounding environments. Within each selected site, four sampling sites were randomly selected according to the S-shaped sampling method. Firstly, surface litter samples were mixed from the 50 cm × 50 cm surface materials of each sample point. Secondly, soil samples were extracted from the 0-15 cm soil depth using soil corers (Ø4 cm). A total of 512 samples were collected for the elucidation of physicochemical properties: 4 (seasons) × 8 (stand ages) × 4 (duplicate plots) × 4 (sampling points) = 512 (samples). All samples were immediately placed in plastic bags, sealed, labeled, and transferred to the laboratory for further processing.
The main soil properties (SOC, TN, NO3-, NH4+, MBN, MBC, ST, and SWC) and litter properties (LC, LN, LT, and LB) were selected as environmental factors to explain the community characteristics of the soil fauna [25]. The soil organic carbon (SOC) and total nitrogen (TN) concentrations were estimated using an elemental analyzer (Elementar Vario MACRO cube, Germany). Prior to the determination of the SOC, dried soil samples were sifted through a 0.149 mm mesh sieve, using HCl to remove any inorganic carbon [32]. The soil ammoniacal nitrogen (NH4+-N) and nitrate nitrogen (NO3—N) were extracted by adding a KCl solution (w:v = 1:5) and determined via a continuous analytical system (San++, Skalar, Netherlands) [33]. The microbial biomass carbon (MBC) and microbial biomass nitrogen (MBN) were estimated using a chloroform fumigation-K2SO4 extraction technique with an automatic TOC analyzer (Shimadzu Inc., Japan) and calculated as the difference between the fumigated and non-fumigated soil samples [32]. The soil pH was determined in a (1:2.5) soil:water ratio solution using a pH electrode (METTLER TOLEDO Five Easy Plus FP20) [34]. The soil moisture content was obtained by drying the soil at 105℃ and calculating the dry and fresh soil weight.
Floor litter mass was obtained following the removal of contaminants and subsequent drying in an oven at 65℃ until constant weight. Litter samples were then ground and thoroughly mixed before sieving through a 100-mesh sieve. Litter carbon (LC) and nitrogen (LN) were estimated using an elemental analyzer (Elementar Vario MACRO cube, Germany)[32].
2.4. Statistical Analysis
We categorized soil fauna taxa based on their abundance, such that when populations of certain groups were >10.0% of the total number captured, they were considered dominant. Taxa representing from 1.0%~10.0% were classified as common [35], while those accounting for <1.0% were rare. We used Shannon-Wiener (H’) and Pielou uniformity indices (J) to describe the characteristics of soil fauna diversity:
where, Pi= ni / N, ni (I = 1, 2, 3) is the number of individuals in group I; N is the number of individuals of all taxa; and S is the number of taxa. The statistical analysis of the data used Repeat-measured Two-way ANOVA and Pearson correlation analysis to test differences in the characteristics of soil fauna communities in different M. glyptostroboides plantations, and the significance level was set at α =0. 05. We made an lg (x + 1) transformation of the original data to conform or approximate a normal distribution. To examine the impacts of stand age and sampling date on the soil macrofauna composition, we conducted permutational multivariate analysis of variance (PerMANOVA) tests.
H′ = - Σ Pi lnPi
J = H / lnS
Redundancy analysis (RDA) was applied to analyze the relationships between the soil macrofauna communities and environmental factors. Soil macrofauna communities were entered as dependent variables, while environmental factors were variable explanatory inputs. Species variables had occasional zero values; thus, log (x + 1) transformations were performed. The significance of the first axis and all axes was evaluated by Monte Carlo tests (499 times) (P< 0.05). In addition, interactive-forward-selection was employed to determine the environmental factors that had significant impacts on the soil fauna, which was conducted using CANOCO 5.0. Statistical analysis was conducted via SPASS 22.0, and the figures were plotted via Origin 2021.
3. Results
3.1. Composition of Soil Macrofauna Communities as Forest Development
In this study, a total of 18 448 individual soil macrofauna, belonging to five classes, 16 orders, and 25 families were captured across eight different age stands. Isopoda, including Armadillidae (47.22%) and Oniscidae (38.02%), were dominant taxa in all stand ages; however, the proportions were different (Figure 2a). Moreover, the compositions and proportions of common and rare taxa varied between stand ages (P < 0.05).
The compositions of soil macrofauna exhibited significant changes with stand age (Table. S2). The greatest total abundance of soil fauna was captured in the young (7-year-old) stand, while the lowest total abundance of individuals was collected in the mature (31-year-old) stand (Figure 2b). Initially, the total abundance significantly decreased in the 7-31-year-old stands, and then substantially increased along the age series, in the 31-46-year-old stands (Figure 2b), with the dynamics showing a U-shaped curve with stand development.
Both the Shannon-Wiener index and Pielou evenness fluctuated as stand aged, peaked at age 31, and were the lowest at ages 21 and 46 (P < 0.01, Figure 3a, 3b). There existed a negative linear correlation between the Shannon-Wiener index and the total abundance of soil macrofauna across the plantation chronosequence (Figure 3c).
3.2. Distribution of Functional Groups in Soil Macrofauna Communities
During plantation development, the distribution of functional groups varied between stand ages, which were dominated by detritivores (91.94%), followed by carnivores (4.84%), herbivores (1.99%), and omnivores (1.24%). Both young and overmature stands exhibited a high proportion of detritivores, which was lower in intermediate-aged stands, to reach a minimum in the 36-year-old stands (Figure 4a). Conversely, at the mature forest stage, the 36-year-old stands showed a higher proportion of carnivores, herbivores, and omnivores. Furthermore, in the younger stands (7-16-year-old), the prevalence of carnivores was relatively low, while in young and overmature stands (7- and 46-year-old), herbivores comprised a smaller fraction (Figure 4a). Linear regression analysis revealed that there was a significantly positive correlation (P < 0.05) between the abundance of detritivores and total abundance of soil macrofauna along a plantation chronosequence (Figure 4b).
3.3. Associations between Environmental Factors and Soil Macrofauna Communities
Relationships between the soil fauna and environmental factors in microregions varied according to faunal community indices and the abundances of dominated groups across all sample sites. The total abundance and Oniscidae were negatively correlated (P < 0.01) with SOC (Table 1). Cryptodesmidae was negatively correlated (P < 0.05) with TN. Cydnidae was negatively correlated with SOC (P < 0.05) and TN (P < 0.01). Armadillidae was positively correlated (P < 0.05) with the total litter nitrogen (LN). Grylloidea was negatively correlated (P < 0.01) with SOC, but positively (P < 0.01) correlated with the litter biomass (LB). Araneae showed significant correlations (P < 0.05) with MBC. Finally, Scolopendridae was positively correlated (P < 0.05) with the soil temperature (ST).
Redundant analysis (RDA) of soil macrofauna and environmental factors was performed for two-dimensional ranking (Figure 5A). The first two principle components captured 33.93% of the variations in the compositions of soil fauna, with 25.11% in the first axis, while the second axis explained 8.82%. The conditional effects revealed that the distribution of soil macrofauna was greatly influenced by SOC, ST, MBN, and LB (Table 2). Of these environmental factors, SOC, ST, MBN, and LB accounted for 15.0%, 18.8%, 10.0%, and 8.4%, respectively, that could be explained by RDA. Further, in terms of the RDA of functional groups and environmental factors, the conditional effects revealed that the functional groups were significantly impacted by SWC, LT, LN, ST, and LC (Figure 5B, Table 2), accounting for 51.0%, 20.5%, 6.1%, 5.94%, and 4.6%, respectively, that could be explained by RDA (Figure 5B, Table 2).
4. Discussion
4.1. Abundance of Soil macrofauna Changes with Plantation Development
In alignment with our first hypothesis (H1), we found that the total faunal abundance exhibited a trend of initially decreasing during the young to near-mature stand (7-31-year-old) stages, while gradually increasing along the age series from near-mature stands to overmature stands (31-46-years-old) (Figure 2b). This might have been due to microenvironmental changes during forest development. Initially, young plantation ecosystems are in an unstable state, during which the soil environment undergoes rapid changes [12], including the formation of soil structures, accumulation of organic matter [36], and establishment of microbial communities [6,37,38]. Specifically, in this study, variations in the total abundances of soil macrofauna during the young to near-mature stand stages were primarily determined by the litter biomass (H3) (Figure 2b, Table 2). Besides, during the 7-31-year-old stand stages, thinning was conducted within the plots (Table S1) to promote rapid tree growth and optimize stand structures. This led to decreased litter biomass with stand development [39]. The reduced litter biomass (Table S3) indicated that younger plantations provided additional litter resources, which contributed to more habitat and food resources [1,4,40] for soil macrofauna. Subsequently, in the 31-46-year-old stands the frequency of thinning decreased (Table S1), which gradually translated to stand stabilization. Simultaneously, as the understory environment became more stable and the quantity of litter steadily increased, available food sources for soil macrofauna were enhanced, thereby inducing their recovery and growth [39]. Such plant mediated heterogeneity in resource availability played a decisive role in shaping the diversity of soil fauna populations, thereby reciprocally impacting the ecological dynamics within the plantation ecosystem itself [41].
4.2. Relationships between the Total Abundance and Diversity of Soil Macrofauna with Plantation Development
Moreover, linear regression analysis showed that there was a significantly (P < 0.05) negative correlation between the Shannon-Wiener diversity index and the total abundance of soil macrofauna across a plantation chronosequence (Figure 3c), which was inconsistent with our second hypothesis (H2). This may have been the result of the reallocation of resources [6,36]. In the early stages of plantation development, the soil environment distribution tends to be uneven, which leads to low diversity but high abundance of a few dominant species [42]. For example, the young systems are characterized by high numbers of Armadillidae , Oniscidae and Carabidae individuals but low species diversity . In this case, the few species that are present exploit available resources intensively [12,13]. However, as forests mature, resources begin to reallocate, enabling more soil macrofauna to obtain suitable habitats and resources in the new environment, which increases the diversity of soil macrofauna [12,13] (Figure3). In other words, more complex forest ecosystems might provide additional heterogeneous or temporarily stable resources; thus, contributing to the enhanced diversity of soil macrofauna species [43]. Furthermore, the types of litter in mature forests tend to be more distinct. This variety of organic matter provides a diverse range of food sources for different classes of soil macrofauna, leading to increased diversity. However, as competition and the distribution of resources have not yet attained a balanced state [44], the number of individuals per species remains relatively low, which results in a decrease in the total abundance (Figure 2).
Additionally, we found that despite some stands having relatively lower MBC and MBN (Table S3), they unexpectedly supported a high diversity of soil macrofauna (Figure 3). This finding suggested that the measured level of microbial biomass was not directly correlated with soil macrofauna diversity and might involve more complex ecological interactions (H3). The effects of MBC and MBN on the structures and dynamics of soil fauna communities were not immediate, exhibiting certain levels of temporal latency [26,45]. This suggested that changes in the soil MBC and MBN may gradually be manifest through composition and diversity of the soil macrofauna via impacts on the structures of soil food webs, nutrient availability, and interactions between microorganisms and soil fauna [26,46]. This temporal lag underscored the complexity and longevity of interactions between nutrient cycling and biotic community dynamics in ecosystems [26,45], which offers a new perspective toward the deeper elucidation of ecological processes.
4.3. Relationships between the Total Abundance of Soil Macrofauna and Functional Groups with Plantation Development
We found that the trends in the number of detritivores were consistent with the overall trends in the total abundance of soil macrofauna (Figure 2, 4). Detritivores formed the primary functional group in the plantations (Figure 4), which signified that their response patterns to environmental changes were similar to those of the overall soil macrofauna along a plantation chronosequence. Generally, detritivorous groups are primarily driven by fluctuations in litter quantity and quality, as well as changes in microbial taxa. They play pivotal roles in the decomposition of organic matter and serve as key indicators of soil fertility [47]. In this study, soil detritivorous families such as Armadillidae and Oniscidae comprised the primary functional groups among the captured surface macrofauna (Figure 2). These organisms consumed mostly fungi and decaying plants, which contributed significantly to the breakdown of organic matter [12,13].
Firstly, during the young to near-mature stand phases detritivore populations were observed to decrease. In particular, young plantations (7-years-old) were characterized by close spacing, a high canopy density (Table S1), and robust growth, wherein a slower litter decomposition rate translated to the accumulation of surface litter debris [25]. This was accompanied by higher N levels within the litter layer (Table S3). This enrichment supplied detritivores with ample litter N (H3) (Tables 1, S3) that facilitated their growth, thereby contributing to higher populations of these organisms [6]. Subsequently, particularly when the forest stands evolved from near-mature to overmature stands, the detritivore abundance increased. During this phase, the plantation gradually became more stable, which altered the complexity of the understory environment [48] that led to the accumulation of soil organic matter [6,36]. Further, since the resources available for detritivores increased, their total abundance was induced to grow. A higher SOC content also made the soil environment more complex (H3). This enhanced the niche diversity, which likely simultaneously intensified the interspecific competition that limited the populations of certain species to potentially reduce the soil macrofauna diversity.
5. Conclusions
This study provides strong evidences that the abundance and diversity of soil macrofauna are modified under prolonged plantation development. The results revealed that the total abundance of soil macrofauna initially decreased during the young to near-mature stand stages (7-31-years-old), and then gradually increased along an age series, from near-mature to overmature stands (31-46-years-old). There was a significantly negative correlation between the Shannon-Wiener diversity index and total abundance of soil macrofauna across a plantation chronosequence. It was found that tendencies in the abundance of detritivores were consistent with the overall trends in the total abundance of soil macrofauna. Changes in the soil macrofauna were strongly correlated with those of the soil environment, i.e., soil organic carbon, litter biomass, and microbial biomass nitrogen. Our findings highlight the variations in soil macrofauna communities with plantation development, while providing important insights regarding above- and belowground interconnectedness and plantation management practices toward the conservation of soil biodiversity in these specialized ecosystems.
Supplementary Materials
The following supporting information can be downloaded at the website of this paper posted on Preprints.org. Table S1. Basic characteristics of Metasequoia glyptostroboides plantations of different ages. Table S2. Effects of stand age and sampling date on the abundance of soil macrofauna of Metasequoia glyptostroboides plantations. Table S3. Properties of soil and litter during plantation succession.
Author Contributions
L.C. wrote the manuscript; L.C., H.R., and X.Z. designed the research; L.C., G.W., J.C. and Y.L.performed the experiments and. analyzed the data. All authors gave final approval for publication.
Funding
This study was supported by the National Key Research and Development Program of China (No. 2023YFD2200404 and No. 2021YFD2200402/3) and the key project of the open competition in Jiangsu Forestry (LYKJ[2023]01).
Conflicts of Interest
The authors declare no conflict of interest.
References
- Wardle, D. A.; Bardgett, R. D.; Klironomos, J. N.; Setälä, H.; van der Putten, W. H.; Wall, D. H. , Ecological linkages between aboveground and belowground biota. Science 2004, 304(5677), 1629–1633. [Google Scholar] [CrossRef] [PubMed]
- Ellers, J.; Berg, M. P.; Dias, A. T. C.; Fontana, S.; Ooms, A.; Moretti, M. , Diversity in form and function: Vertical distribution of soil fauna mediates multidimensional trait variation. Journal of Animal Ecology 2018, 87(4), 933–944. [Google Scholar] [CrossRef]
- Guidi, C.; Frey, B.; Brunner, I.; Meusburger, K.; Vogel, M. E.; Chen, X. M.; Stucky, T.; Gwiazdowicz, D. J.; Skubala, P.; Bose, A. K.; Schaub, M.; Rigling, A.; Hagedorn, F. , Soil fauna drives vertical redistribution of soil organic carbon in a long-term irrigated dry pine forest. Global Change Biology 2022, 28(9), 3145–3160. [Google Scholar] [CrossRef] [PubMed]
- Bardgett, R. D.; van der Putten, W. H. , Belowground biodiversity and ecosystem functioning. Nature 2014, 515(7528), 505–511. [Google Scholar] [CrossRef] [PubMed]
- Eisenhauer, N. , Aboveground-belowground interactions as a source of complementarity effects in biodiversity experiments. Plant and Soil 2012, 351, 1–22. [Google Scholar] [CrossRef]
- Carrillo, Y.; Ball, B. A.; Bradford, M. A.; Jordan, C. F.; Molina, M. , Soil fauna alter the effects of litter composition on nitrogen cycling in a mineral soil. Soil Biology & Biochemistry 2011, 43, 1440–1449. [Google Scholar]
- Hedenec, P.; Jose Jimenez, J.; Moradi, J.; Domene, X.; Hackenberger, D.; Barot, S.; Frossard, A.; Oktaba, L.; Filser, J.; Kindlmann, P.; Frouz, J. Global distribution of soil fauna functional groups and their estimated litter consumption across biomes. Scientific Reports 2022, 12 (1).
- Darby, B. J.; Neher, D. A.; Housman, D. C.; Belnap, J. Few apparent short-term effects of elevated soil temperature and increased frequency of summer precipitation on the abundance and taxonomic diversity of desert soil micro- and meso-fauna. Soil Biology & Biochemistry 2011, 43 (7), 1474-1481.
- Payn, T.; Carnus, J.-M.; Freer-Smith, P.; Kimberley, M.; Kollert, W.; Liu, S.; Orazio, C.; Rodriguez, L.; Silva, L. N.; Wingfield, M. J. , Changes in planted forests and future global implications. Forest Ecology and Management 2015, 352, 57–67. [Google Scholar] [CrossRef]
- Xu, H. T.; He, B.; Guo, L. L.; Yan, X.; Zeng, Y. L.; Yuan, W. P.; Zhong, Z. Q.; Tang, R.; Yang, Y.; Liu, H. M.; Chen, Y. N. Global Forest Plantations Mapping and Biomass Carbon Estimation. Journal of Geophysical Research-Biogeosciences 2024, 129 (3).
- Peng, S.-S.; Piao, S.; Zeng, Z.; Ciais, P.; Zhou, L.; Li, L. Z. X.; Myneni, R. B.; Yin, Y.; Zeng, H. , Afforestation in China cools local land surface temperature. Proceedings of the National Academy of Sciences 2014, 111(8), 2915–2919. [Google Scholar] [CrossRef] [PubMed]
- Feng, J.; Liu, Y.-R.; Eldridge, D.; Huang, Q.; Tan, W.; Delgado-Baquerizo, M. , Geologically younger ecosystems are more dependent on soil biodiversity for supporting function. Nature communications 2024, 15(1), 4141. [Google Scholar] [CrossRef]
- Islam, W.; Saqib, H. S. A.; Adnan, M.; Wang, Z.; Tayyab, M.; Huang, Z.; Chen, H. Y. H. , Differential response of soil microbial and animal communities along the chronosequence of Cunninghamia lanceolata at different soil depth levels in subtropical forest ecosystem. Journal of Advanced Research 2022, 38, 41–54. [Google Scholar] [CrossRef]
- Warren, M. W.; Zou, X. M. Soil macrofauna and litter nutrients in three tropical tree plantations on a disturbed site in Puerto Rico. Forest Ecology and Management 2002, 170 (1-3), 161-171.
- Zhang, L.; Zhang, P.; Yu, M. K.; Wu, T. G. In Soil organic carbon content and stocks in an age-sequence of Metasequoia glyptostroboides plantations in coastal area, East China, 4th International Conference on Sustainable Energy and Environmental Engineering (ICSEEE), Shenzhen, PEOPLES R CHINA, Dec 20-21; Shenzhen, PEOPLES R CHINA, 2015; pp 1004-1012.
- Bird, S. B.; Coulson, R. N.; Fisher, R. R. Changes in soil and litter arthropod abundance following tree harvesting and site preparation in a loblolly pine (Pinus taeda L.) plantation. Forest Ecology and Management 2004, 202 (1-3), 195-208.
- Scheu, S.; Albers, D.; Alphei, J.; Buryn, R.; Klages, U.; Migge, S.; Platner, C.; Salamon, J. A. , The soil fauna community in pure and mixed stands of beech and spruce of different age: trophic structure and structuring forces. Oikos 2003, 101(2), 225–238. [Google Scholar] [CrossRef]
- Xu, G. R.; Zhang, Y. X.; Zhang, S.; Ma, K. M. Biodiversity associations of soil fauna and plants depend on plant life form and are accounted for by rare taxa along an elevational gradient. Soil Biology & Biochemistry 2020, 140.
- Wang, G. L.; Chen, Y. W.; Liu, C. Z.; al., e., Effects of Eco-restoration of Abandoned Farmland on Soil Invertebrate Diversity in the Loess Plateau. Journal of Desert Research 2010, 30, 140-145.
- Yang, X.; Shao, M. A.; Li, T. C.; Gan, M.; Chen, M. Y. , Community characteristics and distribution patterns of soil fauna after vegetation restoration in the northern Loess Plateau. Ecological Indicators 2021, 122. [Google Scholar] [CrossRef]
- Yi, L.; You, W. H.; Song, Y. C. , Soil aninal communities in the litter of the evergreen broad-leaved forest at five succession stages in Tiantong. Acta Ecologica Sinica 2005, (03), 466–473. [Google Scholar]
- Wike, L. D.; Martin, F. D.; Paller, M. H.; Nelson, E. A. , Impact of forest seral stage on use of ant communities for rapid assessment of terrestrial ecosystem health. Journal of Insect Science 2010, 10. [Google Scholar] [CrossRef]
- Ge, B. M.; Zhang, D. Z.; Cui, J.; Zhang, H. B.; Zhou, C. L.; Tang, B. P. , Biodiversity Variations of Soil Macrofauna Communities in Forests in a Reclaimed Coast with Different Diked History. Pakistan Journal of Zoology 2014, 46(4), 1053–1059. [Google Scholar]
- Moore, J. C.; McCann, K.; Setälä, H.; De Ruiter, P. C. , Top-down is bottom-up:: Does predation in the rhizosphere regulate aboveground dynamics? Ecology 2003, 84(4), 846–857. [Google Scholar] [CrossRef]
- Yang, X.; Liu, R.; Li, T.; Dai, Y. Changes of soil fauna along the non-native tree afforestation chronosequence on Loess Plateau. Plant and Soil 2023, 485 (1-2), 489-505.
- Zhang, Y. K.; Peng, S.; Chen, X. L.; Chen, H. Y. H. , Plant diversity increases the abundance and diversity of soil fauna: A meta-analysis. Geoderma 2022, 411. [Google Scholar] [CrossRef]
- Ge, Z.; Fang, S.; Chen, H. Y. H.; Zhu, R.; Peng, S.; Ruan, H. , Soil Aggregation and Organic Carbon Dynamics in Poplar Plantations. Forests 2018, 9(9), 508. [Google Scholar] [CrossRef]
- Walker, L. R.; Wardle, D. A.; Bardgett, R. D.; Clarkson, B. D. , The use of chronosequences in studies of ecological succession and soil development. Journal of Ecology 2010, 98(4), 725–736. [Google Scholar] [CrossRef]
- Yin, W. Y. Subtropical soil animals of China. Beijing: Science Press: 1992; p 618.
- Yin, W. Y. , Pictorical keys to soil animals of China. Beijing: Science Press: 1998; p 756.
- Potapov, A. M.; Beaulieu, F.; Birkhofer, K.; Bluhm, S. L.; Degtyarev, M. I.; Devetter, M.; Goncharov, A. A.; Gongalsky, K. B.; Klarner, B.; Korobushkin, D. I.; Liebke, D. F.; Maraun, M.; Mc Donnell, R. J.; Pollierer, M. M.; Schaefer, I.; Shrubovych, J.; Semenyuk, II; Sendra, A.; Tuma, J.; Tumova, M.; Vassilieva, A. B.; Chen, T. W.; Geisen, S.; Schmidt, O.; Tiunov, A. V.; Scheu, S., Feeding habits and multifunctional classification of soil-associated consumers from protists to vertebrates. Biological Reviews 2022, 97 (3), 1057-1117.
- Chen, Z. B. , Instumental analysis experiment. Shanghai: Fudan University Press: 2018; p 105.
- Drolc, A.; Vrtovsek, J. , Nitrate and nitrite nitrogen determination in waste water using on-line UV spectrometric method. Bioresource Technology 2010, 101(11), 4228–4233. [Google Scholar] [CrossRef] [PubMed]
- Lu, R. K. , Methods for the chemical analysis of soil agriculture. Beijing: China Agricultural Science and Technology Press: 2000; p 638.
- Zhou, H. Y.; Zhang, J.; Zhang, D. J.; Zhang, J.; Wei, D. P.; Zhao, Y. B.; Zhao, B.; Li, C. B. , Community characteristics of soil fauna for different canopy density of a Pinus massoniana plantation. Acta Ecologica Sinica 2017, 37(06), 1939–1955. [Google Scholar]
- Zhang, H.; Sun, D. Y. , Effects of Different Ages of Japanese Larix kaempferi Artificial Forest on Litters and Soil Physicochemical Characteristics. Chinese Agricultural Science Bulletin 2016, 32(01), 12–16. [Google Scholar]
- Zhen, Y. F.; Li, X.; Wan, X. H.; Zou, B. Z.; Wang, S. R.; Huang, Z. Q. Changes of Soil Microbial Community Structure across Different Succession Stages of Secondary Forest. Journal of Subtropical Resources and Environment 2021, 16 (01), 23-28+34.
- Tong, F. C.; Wang, Q. L.; Liu, S. X.; Xiao, Y. H. , Dynamics of soil fauna communities during succession of secondary forests in Changbai Mountain. Chinese Journal of Applied Ecology 2004, (09), 1531–1535. [Google Scholar]
- Huang, P. S.; Lin, H. C.; Lin, C. P.; Tso, I. M. , The effect of thinning on ground spider diversity and microenvironmental factors of a subtropical spruce plantation forest in East Asia. European Journal of Forest Research 2014, 133(5), 919–930. [Google Scholar] [CrossRef]
- Diekötter, T.; Wamser, S.; Wolters, V.; Birkhofer, K. Landscape and management effects on structure and function of soil arthropod communities in winter wheat. Agriculture Ecosystems & Environment 2010, 137 (1-2), 108-112.
- Wei, X. X.; Chen, A. L.; Wang, S. Y.; Cao, G. Q.; Cai, P. Q.; Li, S. , A comparative study of soil microbial carbon source utilization in different A comparative study of soil microbial carbon source utilization in different successive rotation plantations of Chinese fir. Chin J Appl Environ Biol 2016, 22(03), 518–523. [Google Scholar]
- Tilman, D. , THE ECOLOGICAL CONSEQUENCES OF CHANGES IN BIODIVERSITY: A SEARCH FOR GENERAL PRINCIPLES. Ecology 1999, 80(5), 1455–1474. [Google Scholar] [CrossRef]
- Staab, M.; Schuldt, A.; Assmann, T.; Bfuelheide, H.; Klein, A.-M. Ant community structure during forest succession in a subtropical forest in South-East China. Acta Oecologica-International Journal of Ecology 2014, 61, 32-40.
- Leibold, M. A.; Holyoak, M.; Mouquet, N.; Amarasekare, P.; Chase, J. M.; Hoopes, M. F.; Holt, R. D.; Shurin, J. B.; Law, R.; Tilman, D.; Loreau, M.; Gonzalez, A. , The metacommunity concept: a framework for multi-scale community ecology. Ecology Letters 2004, 7(7), 601–613. [Google Scholar] [CrossRef]
- Ravenek, J. M.; Bessler, H.; Engels, C.; Scherer-Lorenzen, M.; Gessler, A.; Gockele, A.; De Luca, E.; Temperton, V. M.; Ebeling, A.; Roscher, C.; Schmid, B.; Weisser, W. W.; Wirth, C.; de Kroon, H.; Weigelt, A.; Mommer, L. , Long-term study of root biomass in a biodiversity experiment reveals shifts in diversity effects over time. Oikos 2014, 123(12), 1528–1536. [Google Scholar] [CrossRef]
- Chen, C.; Chen, H. Y. H.; Chen, X. L.; Huang, Z. Q. , Meta-analysis shows positive effects of plant diversity on microbial biomass and respiration. Nature Communications 2019, 10. [Google Scholar]
- Li, N.; Zhang, X. P.; Zhang, L. M. , Spatial and temporal variation of soil macro-fauna community structure in three temperate forests. Acta Ecologica Sinica 2013, 33(19), 6236–6245. [Google Scholar]
- Berg, M. P.; Hemerik, L. , Secondary succession of terrestrial isopod, centipede, and millipede communities in grasslands under restoration. Biology and Fertility of Soils 2004, 40(3), 163–170. [Google Scholar] [CrossRef]
Figure 1.
Location of the (a) study sites and conditions (b) sampled stand of the Metasequoia glyptostroboides plantations of different ages in Dongtai County, Northern Jiangsu Province, Eastern China.
Figure 1.
Location of the (a) study sites and conditions (b) sampled stand of the Metasequoia glyptostroboides plantations of different ages in Dongtai County, Northern Jiangsu Province, Eastern China.
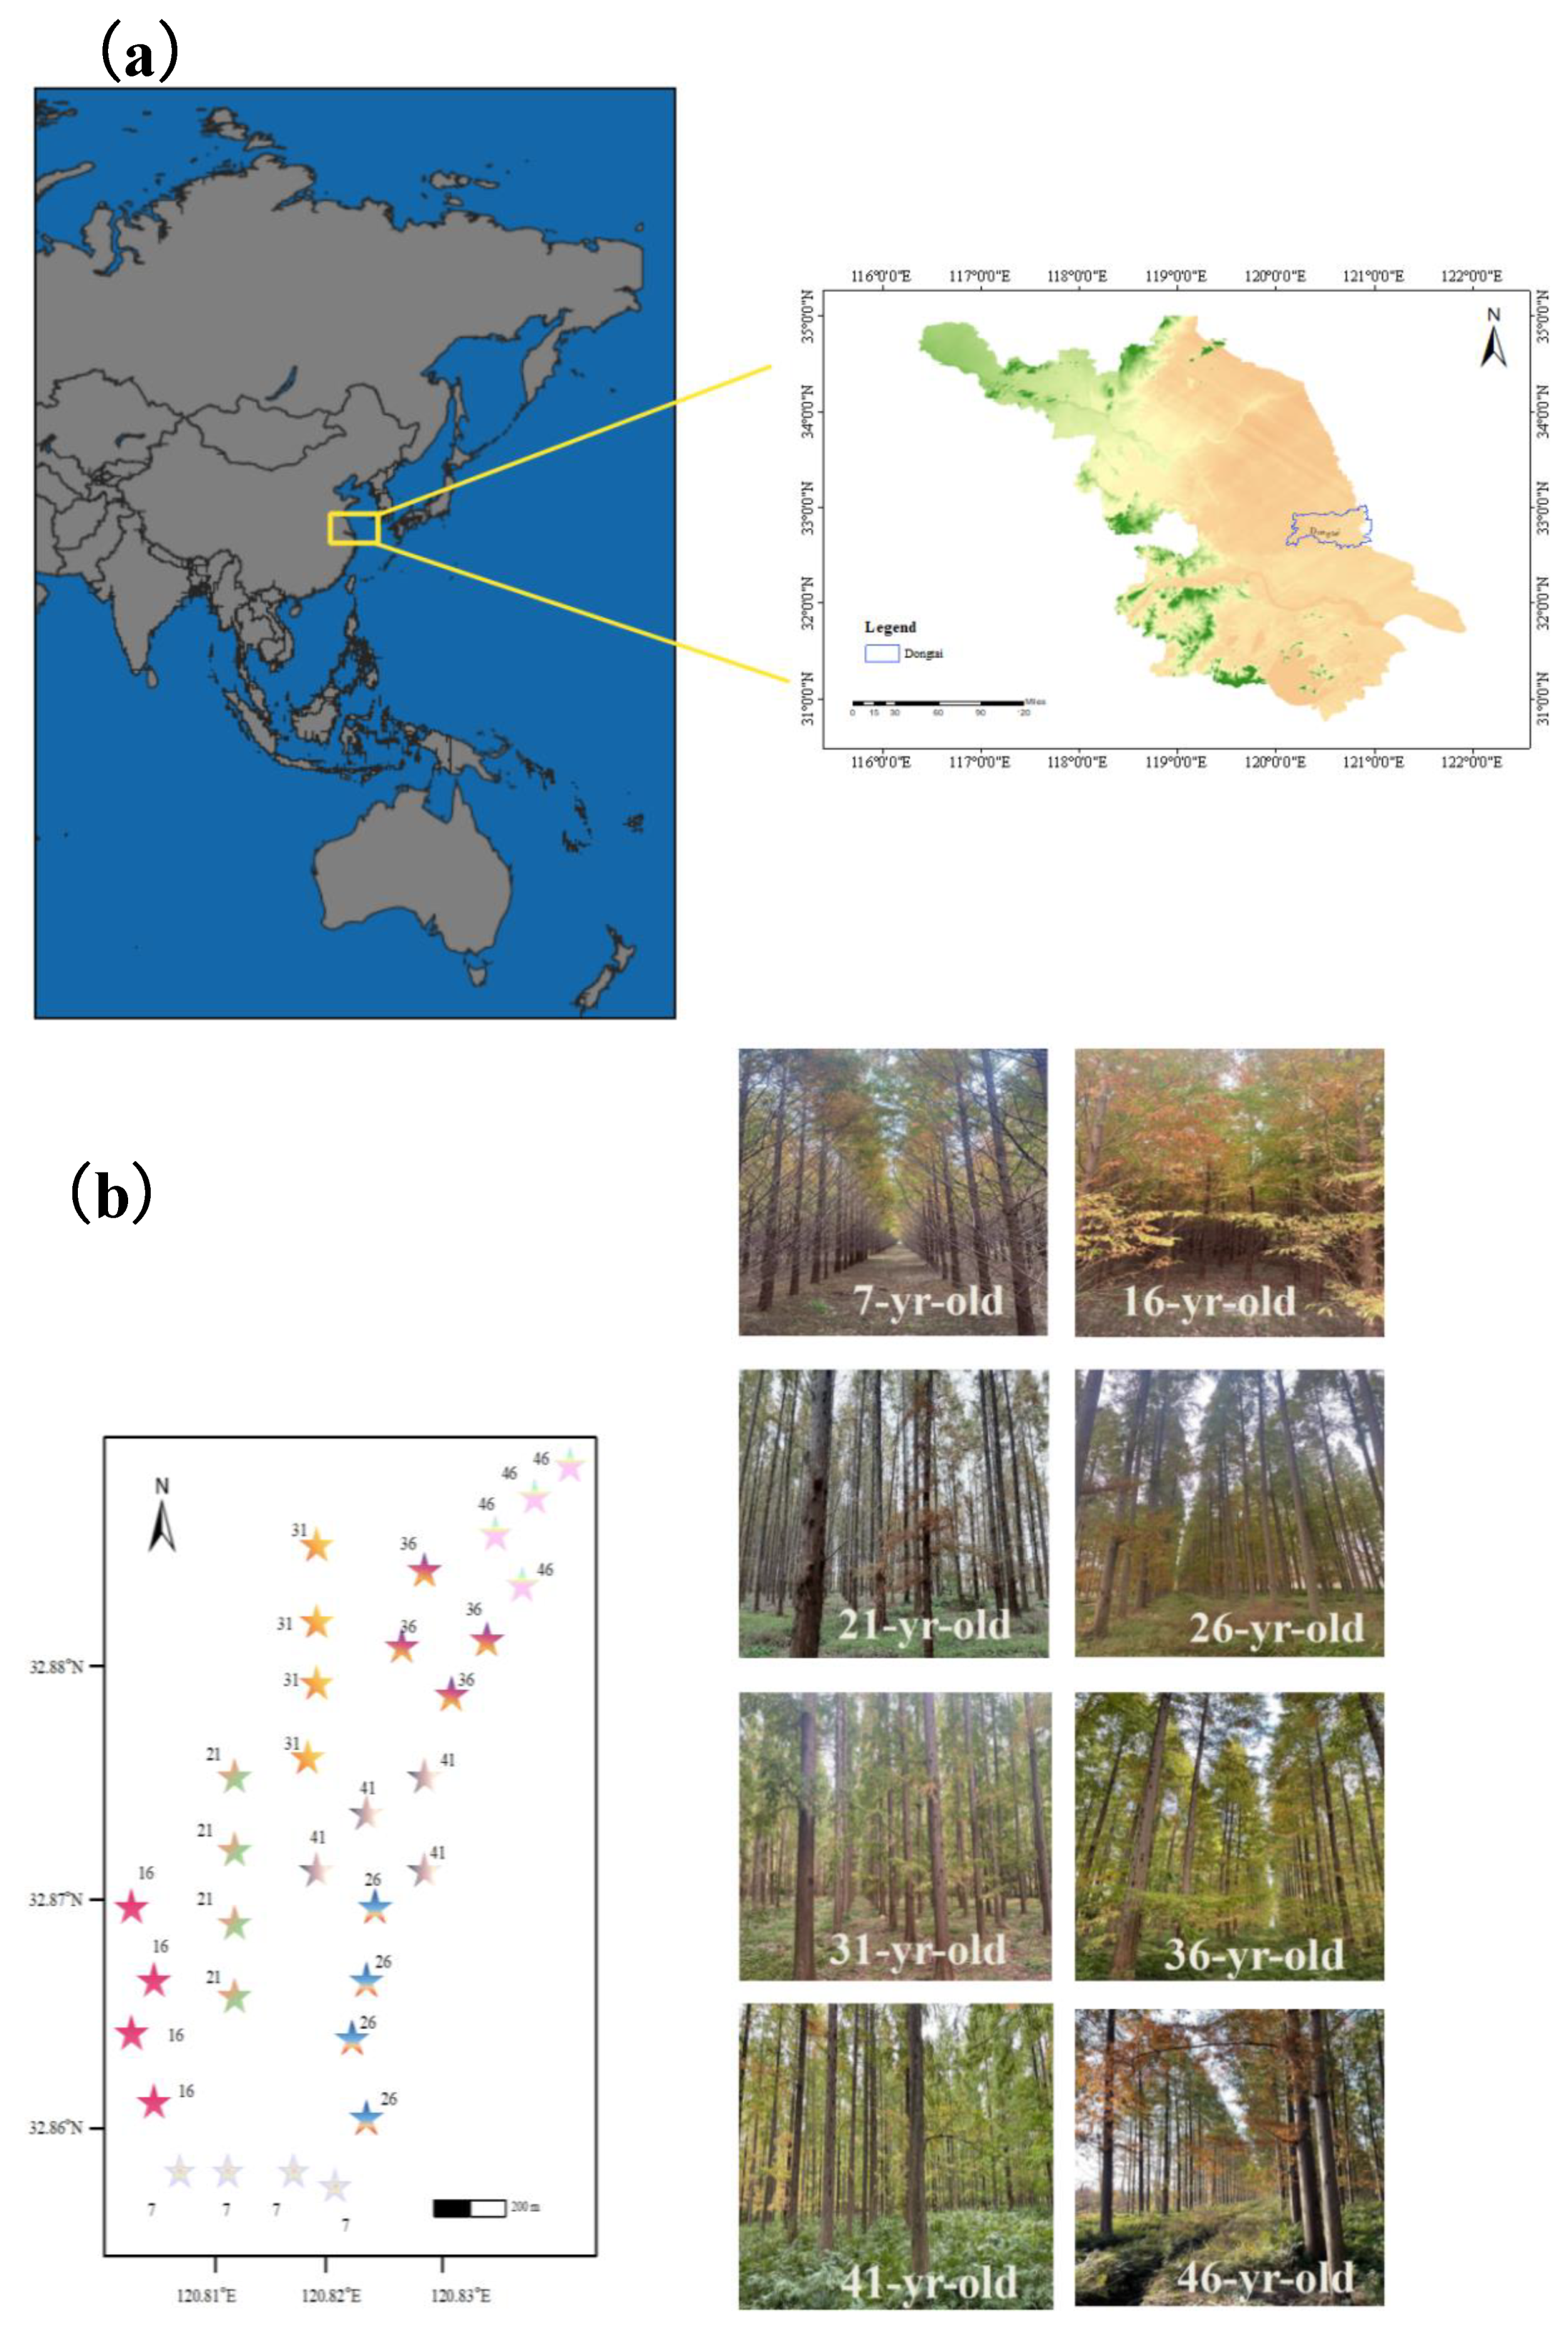
Figure 2.
Abundance of soil macrofauna across a Metasequoia glyptostroboides plantation chronosequence. Mean values of relative abundances (%) (a) of soil macrofauna in different groups. Total abundance (b) of soil macrofauna and abundance of main taxa are shown (bars indicate SE, n=4). The total abundance trend showed a U- shaped curve. A lg (x + 1) transformation of original individual soil macrofauna data was made to conform to, or approximate, normal distribution. Different letters indicate statistically significant differences among plantation ages for the same taxa based on the Tukey-HSD test (P < 0.05).
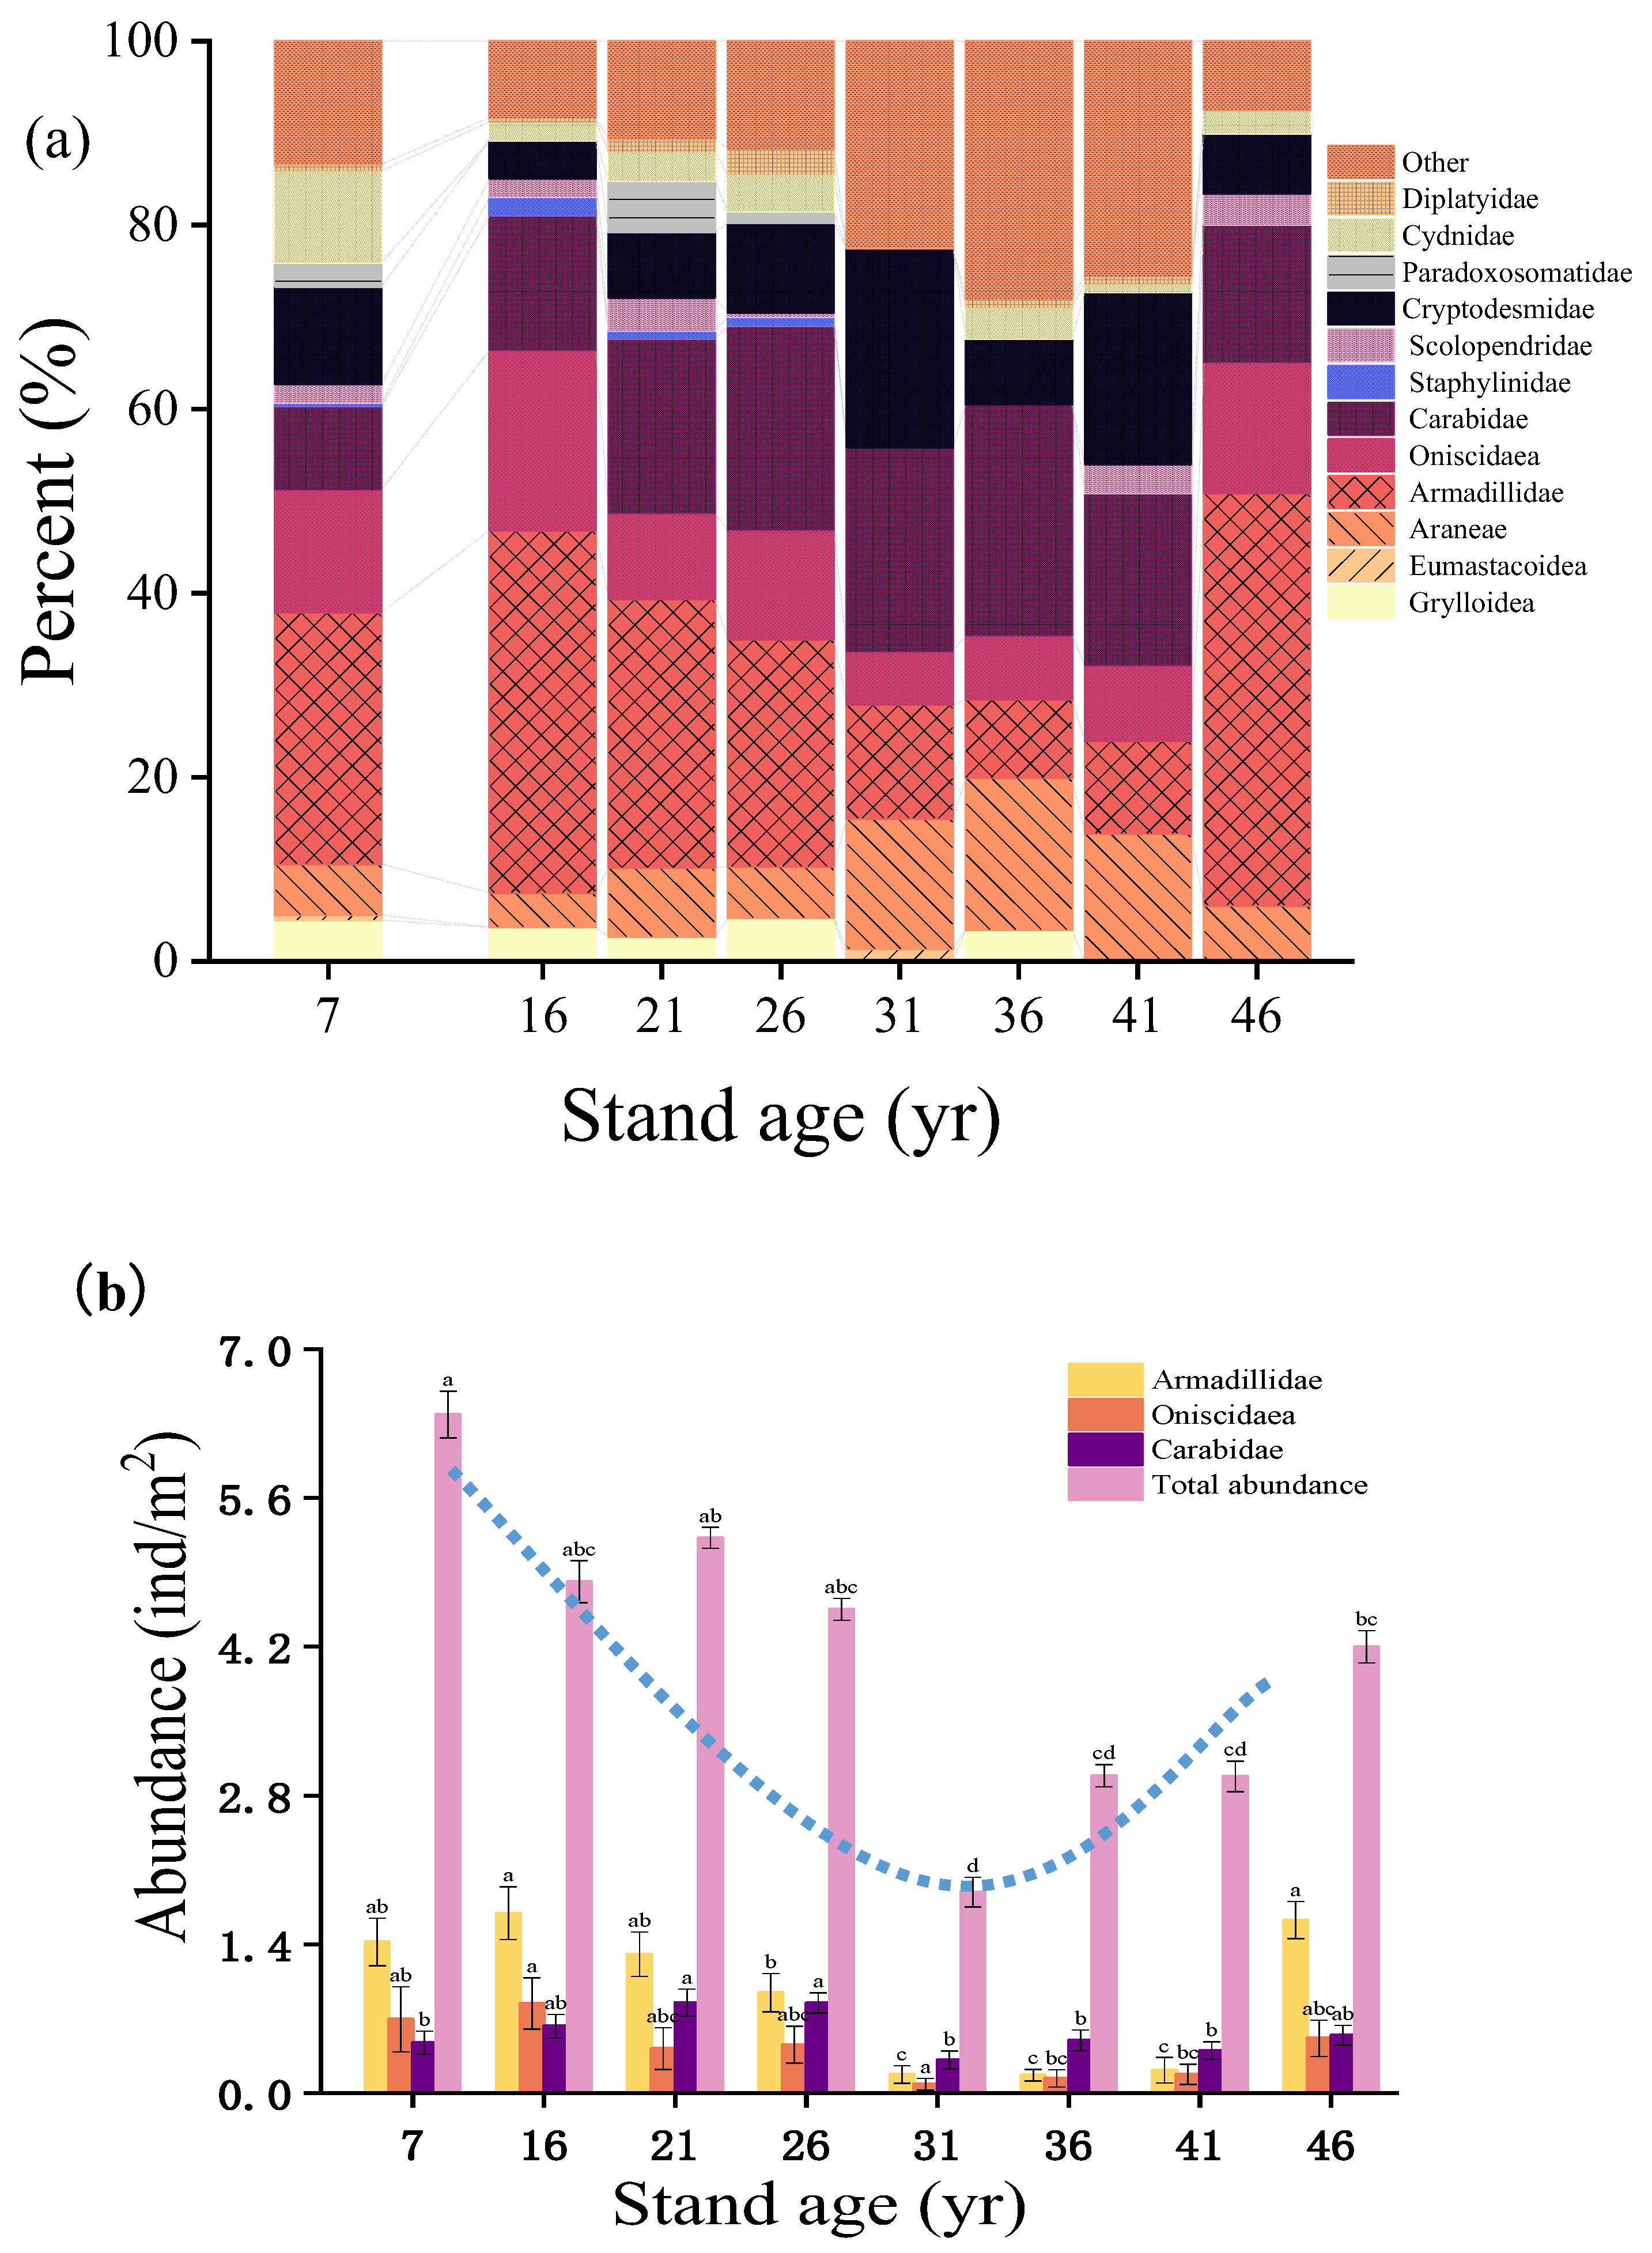
Figure 3.
Biodiversity characteristics of soil macrofauna in Metasequoia glyptostroboides plantations at different stand ages. Shannon-Wiener (a) and Pielou evenness indices (b) were used to analyze the diversity of soil fauna communities at different stand ages. Relationships (c) between the Shannon-Wiener index and total abundance are shown by linear regression analysis. A lg (x + 1) transformation of the original data of individual soil macrofauna was made to conform to, or approximate, normal distribution. The shaded areas explained the SE of each figure.
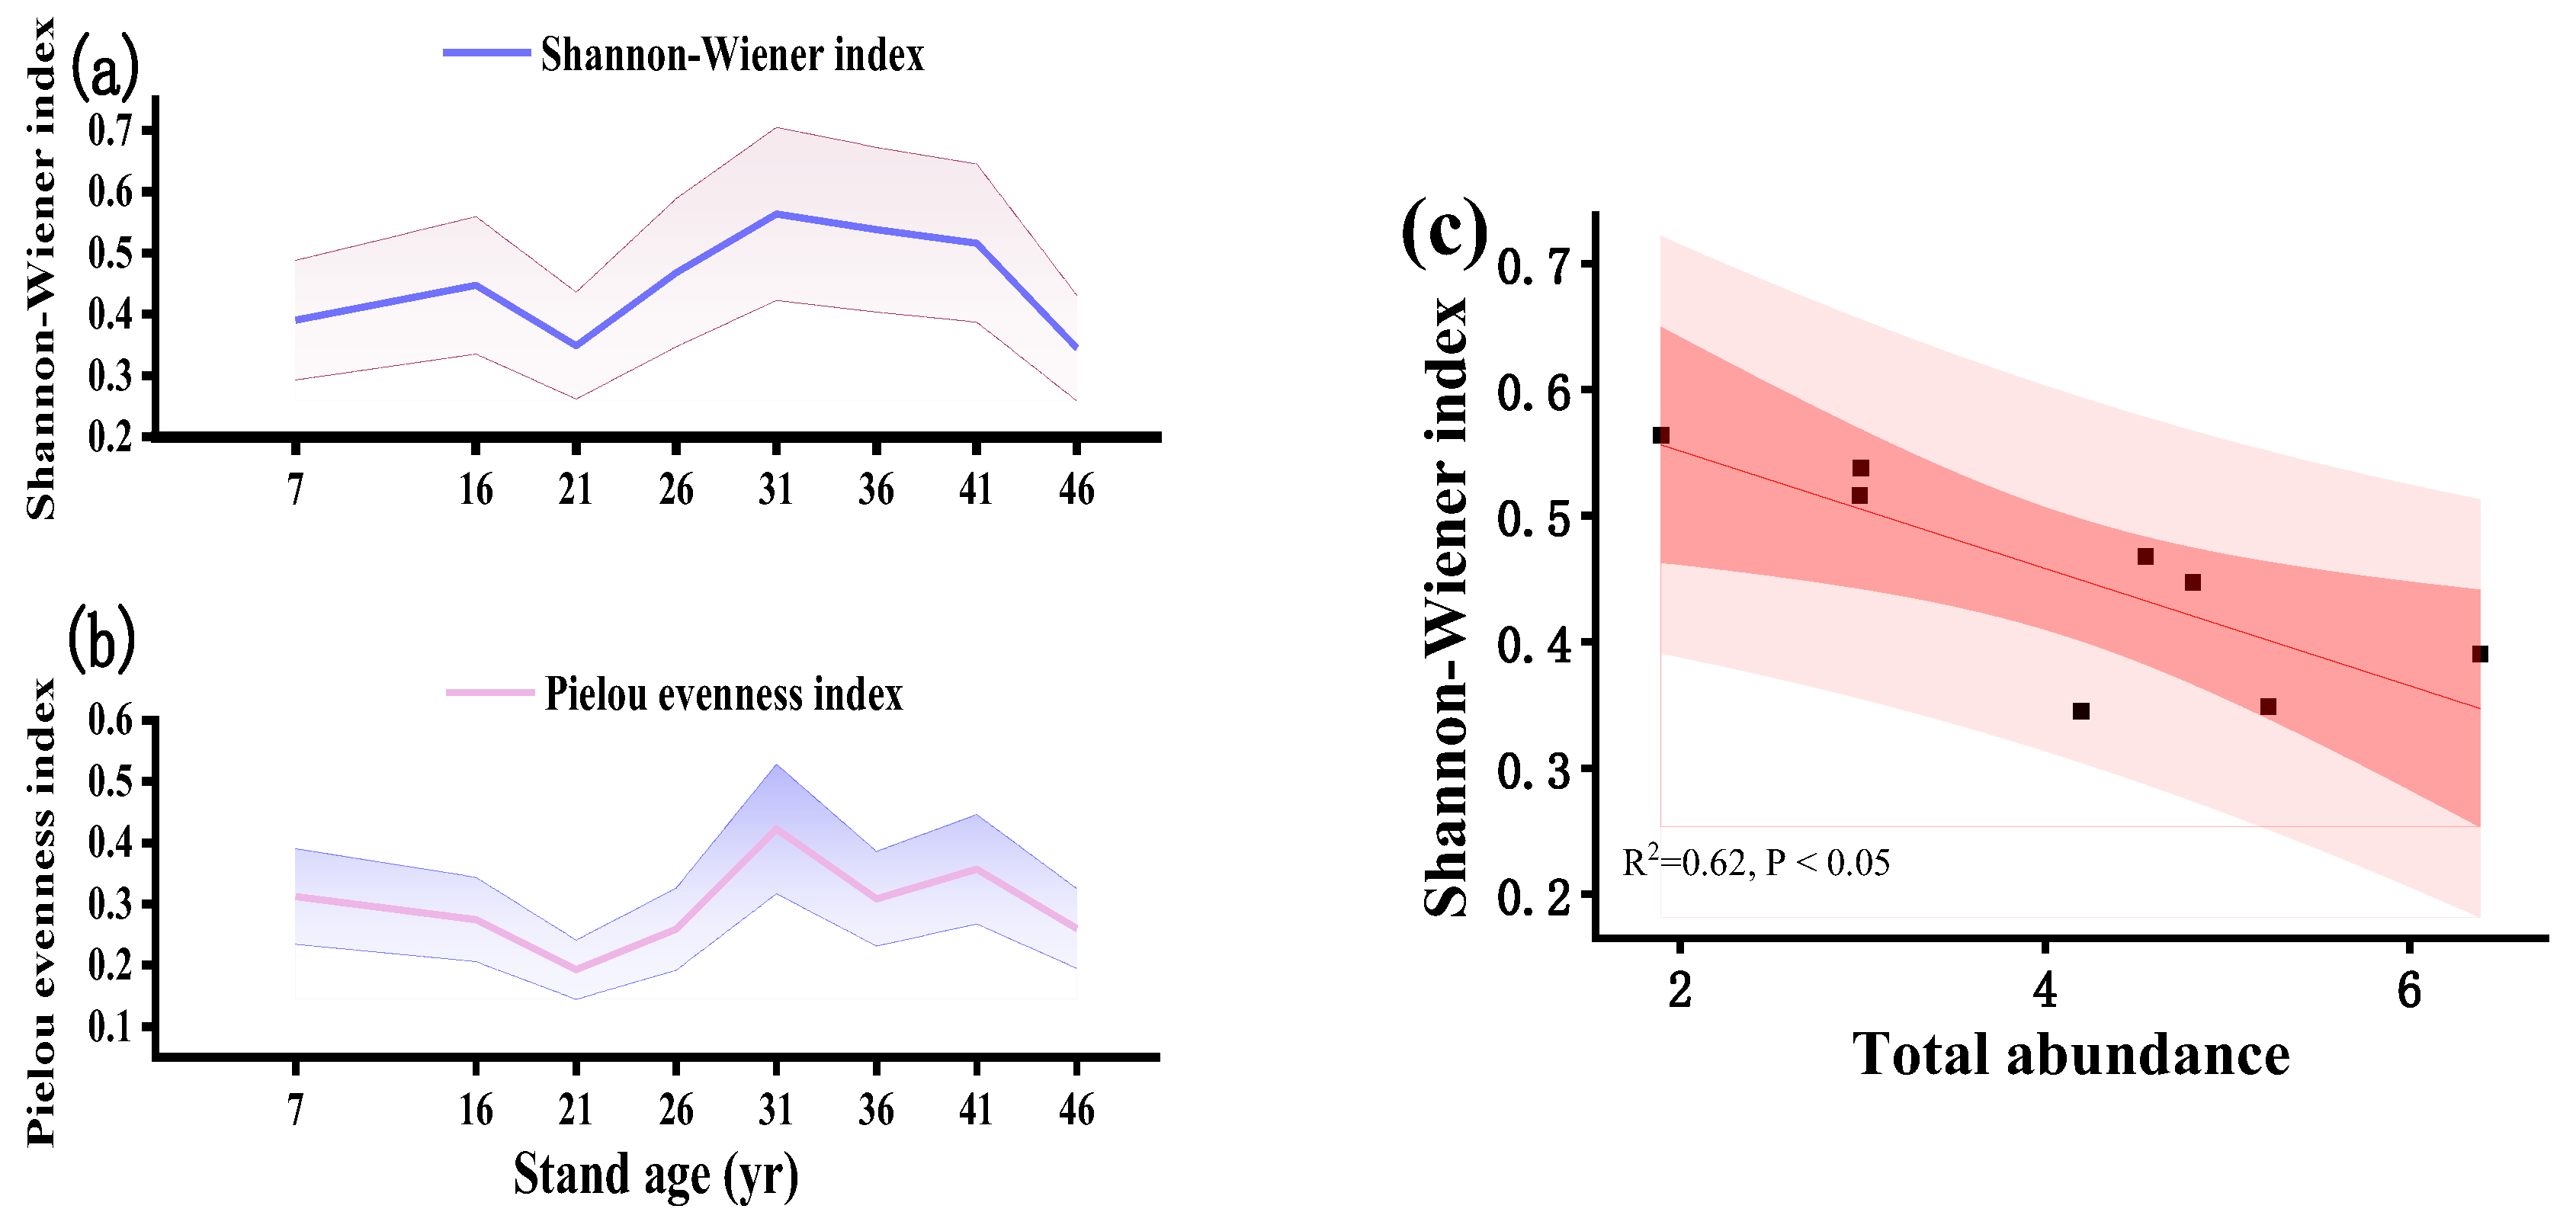
Figure 4.
Abundances of soil macrofauna with different functional groups across a Metasequoia glyptostroboides plantation chronosequence. Mean values of relative abundances (%) (a) of soil macrofauna with different functional groups. Purple, blue, yellow, and orange bars represent herbivores, carnivores, detritivores, and omnivores, respectively. Relationships (b) between the abundances of different functional groups and total abundance are revealed via linear regression analysis. A lg (x + 1) transformation of the original soil macrofauna data with different functional groups was made to conform to, or approximate, normal distribution.
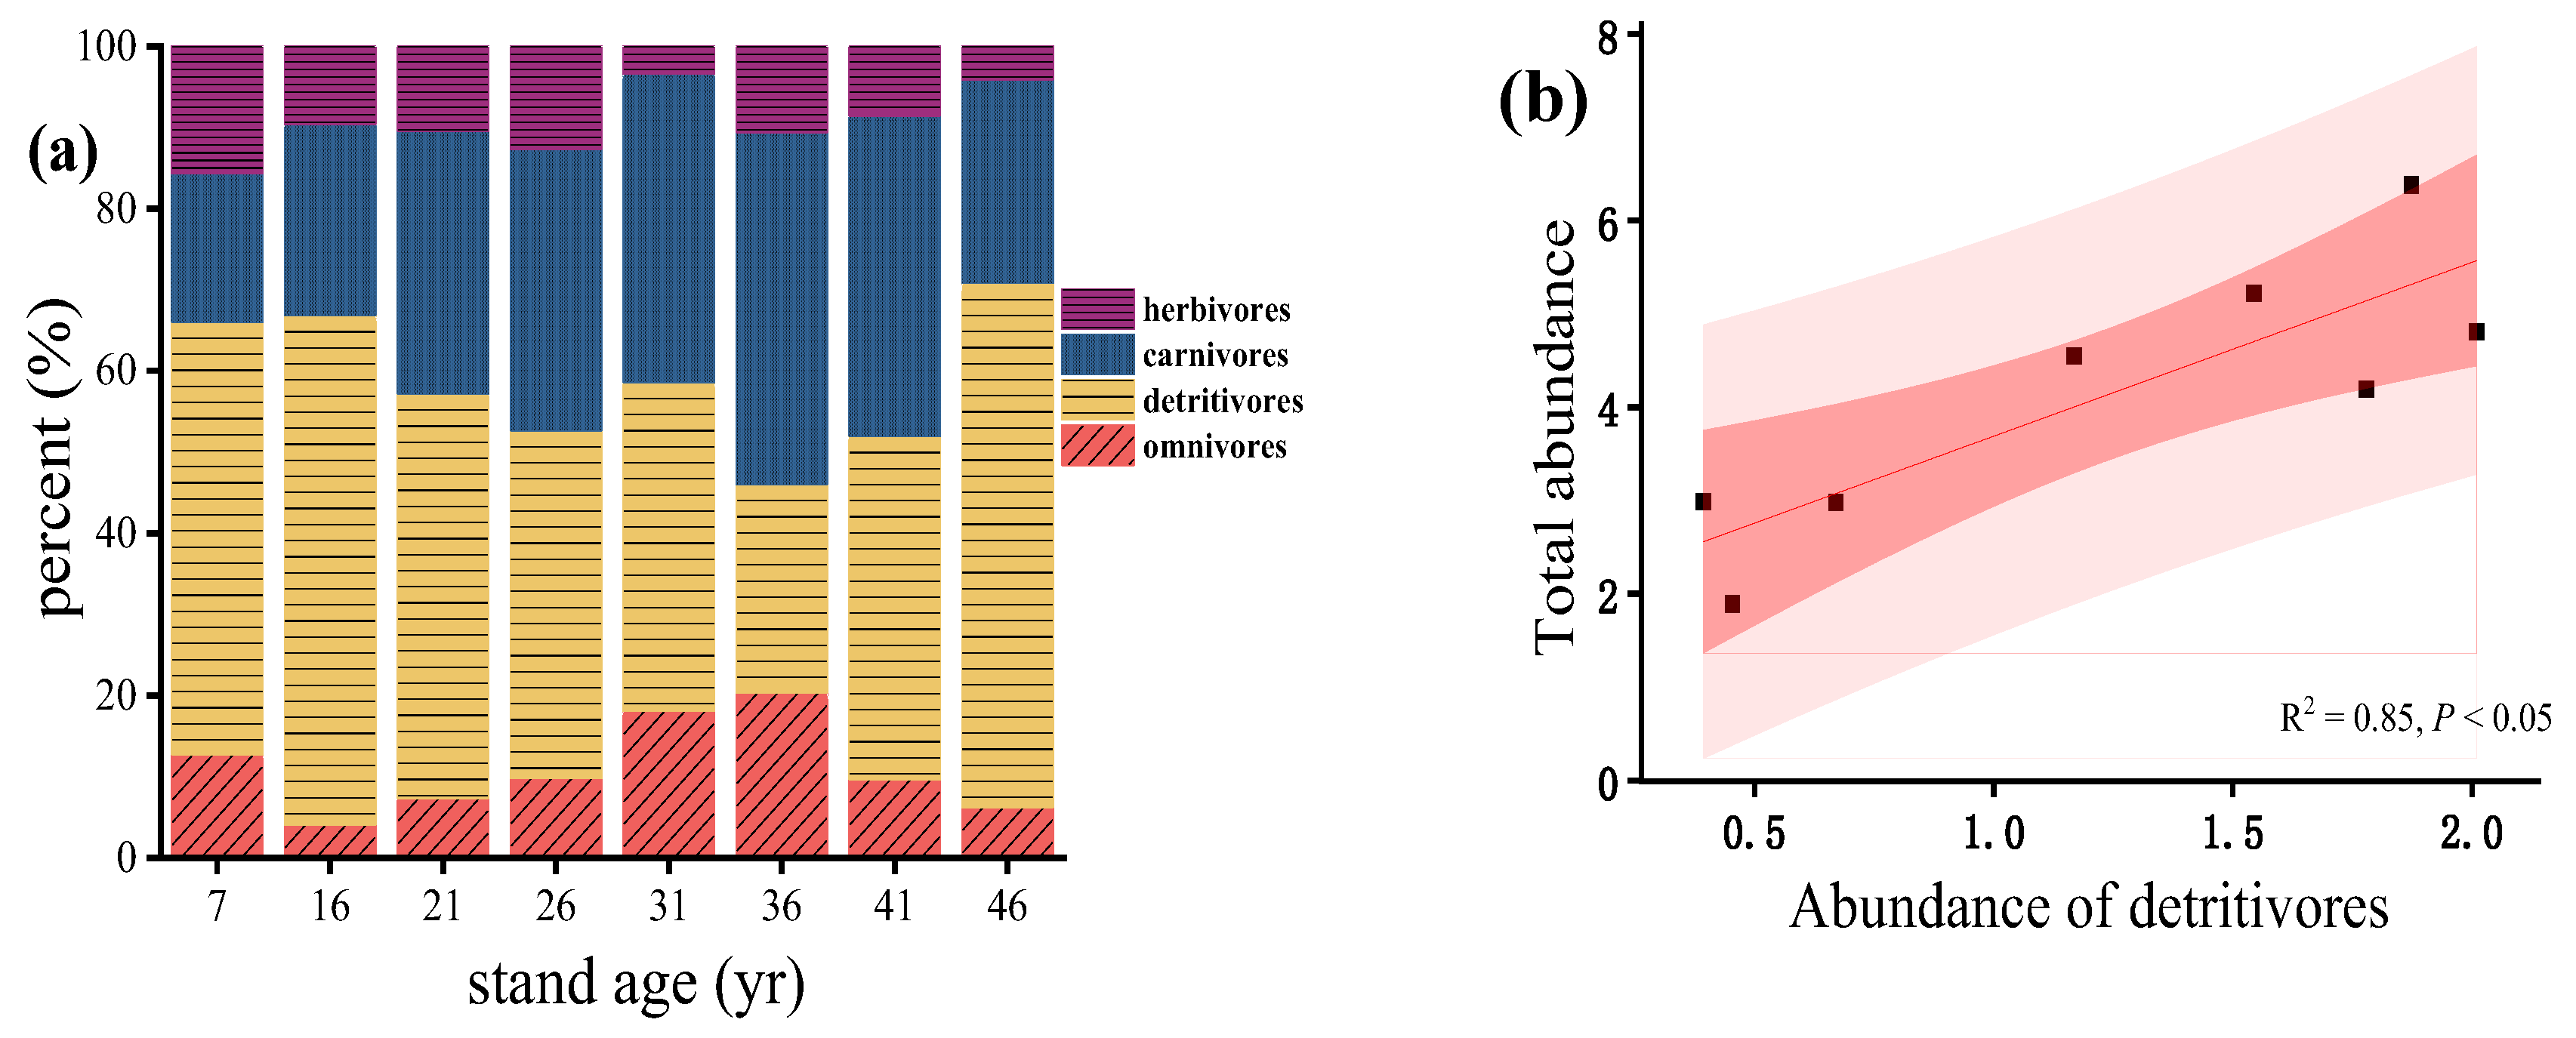
Figure 5.
Redundancy analysis (RDA) showing the relationships between soil macrofauna compositions (blue lines) and environment factors (red lines). (a) RDA showing the relationships between soil macrofauna compositions and environment factors. (b) RDA revealing the relationships between functional groups and environment factors. Abbreviations: soil organic carbon (SOC), total nitrogen (TN), nitrate nitrogen (NO3-), ammonium nitrogen (NH4+), microbial biomass carbon (MBC), microbial biomass nitrogen (MBN), soil water content (SWC), soil temperature (ST), litter temperature (LT), litter water content (LWC), litter biomass (LB), litter total carbon (LC), litter total nitrogen (LN). Armadillidae (Armadi), Oniscidae (Onisci), Carabidae (Carabi), Cryptodesmidae (Crypto), Paradoxosomatidae (Parado), Cydnidae (Cydnid), Araneae (Aranea), Eumastacoidea (Eumast), Scolopendridae (Scolop), Grylloidea (Gryllo), Diplatyidae (Diplat), Staphylinidae (Staphy), total abundance (A), detritivores (De), carnivores (Ca), Herbivores (He), and omnivores (Om).
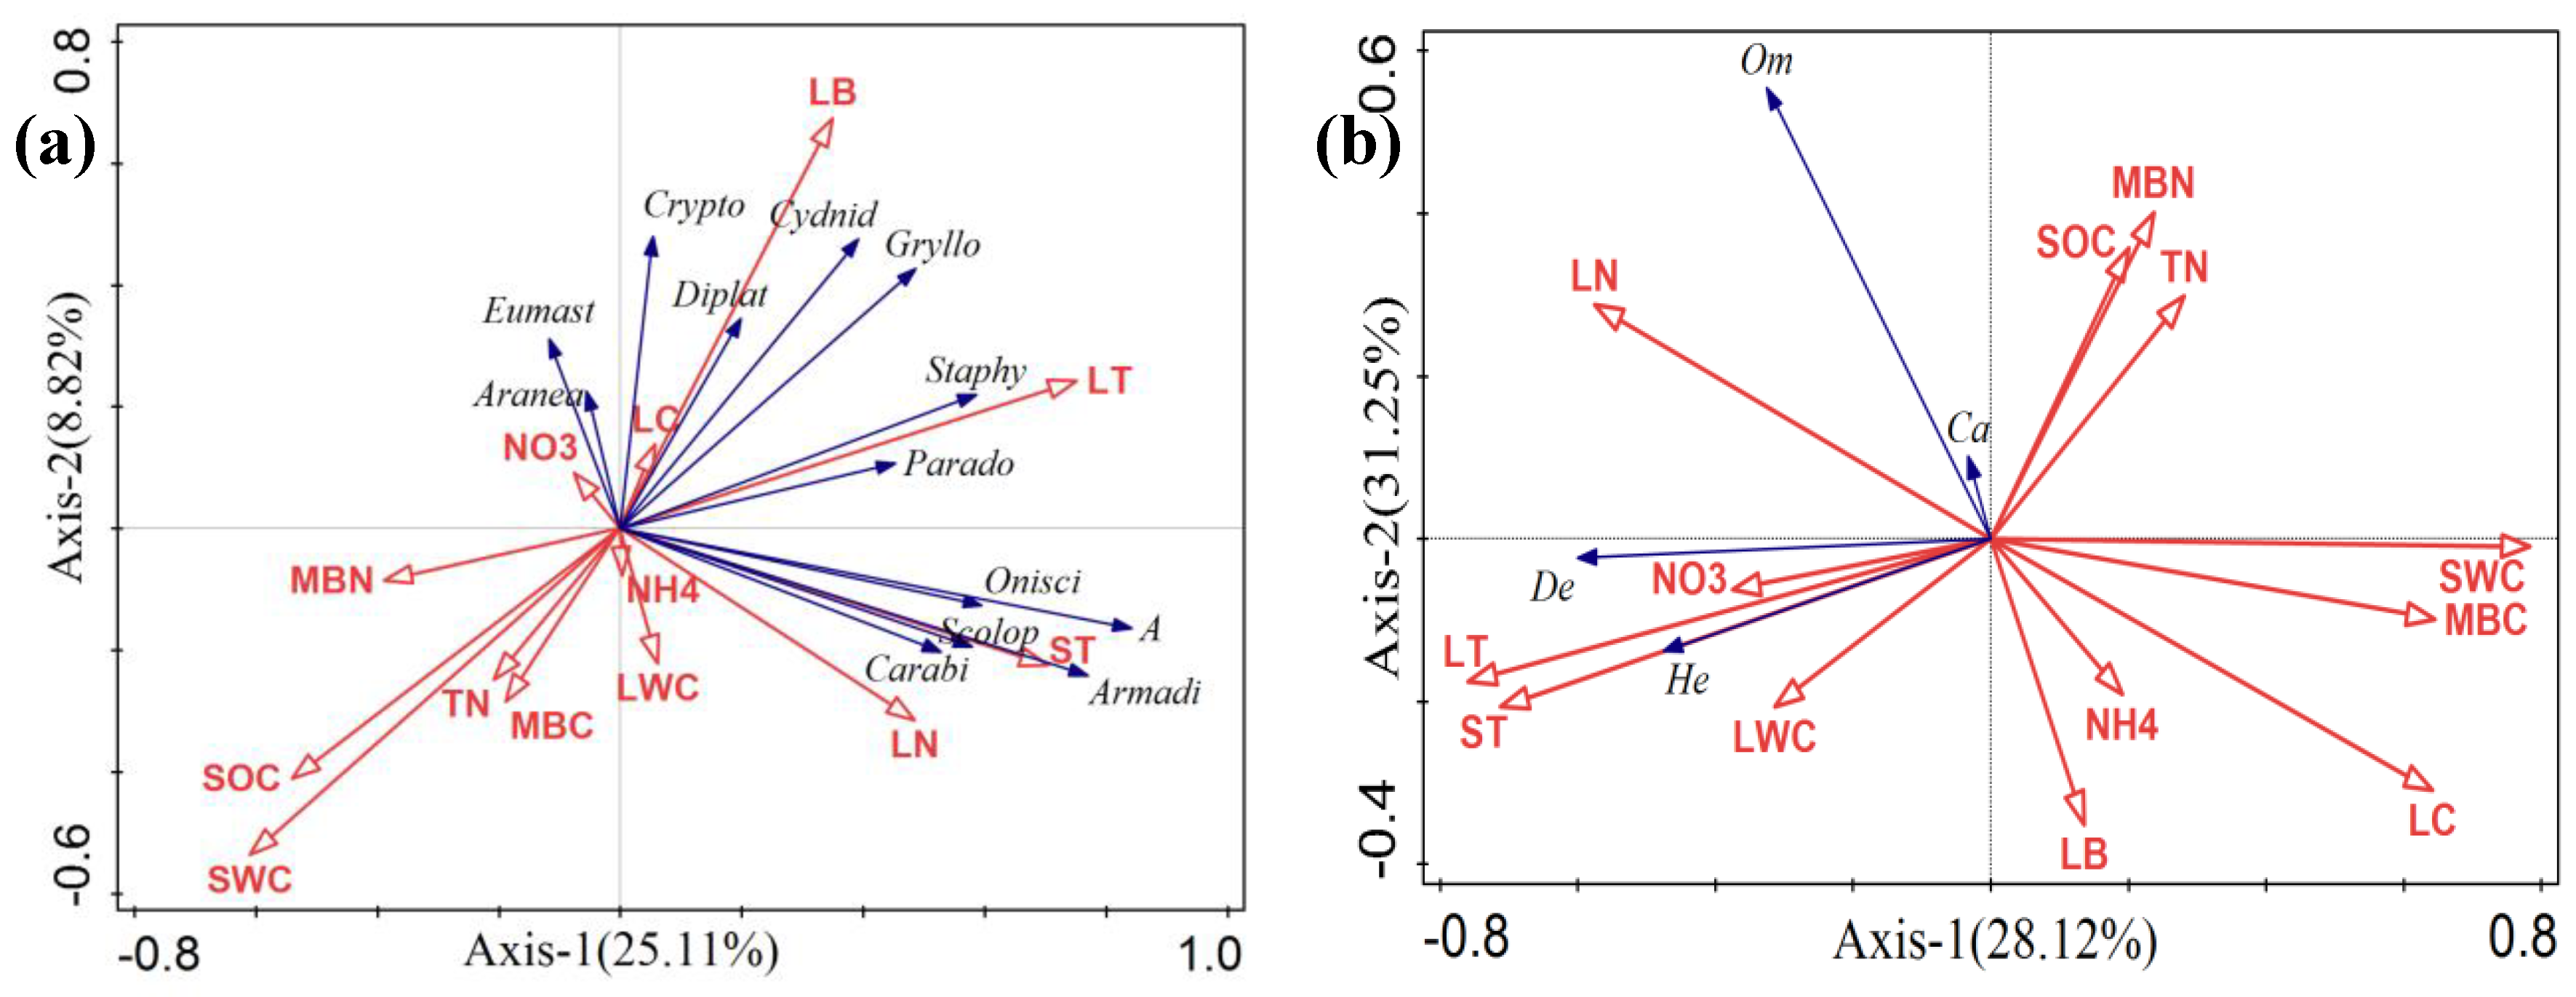

Table 1.
Pearson correlation matrix between main soil fauna taxa and quality parameters of environmental factors. Soil organic carbon (SOC), total nitrogen (TN), nitrate nitrogen (NO3-), ammonium nitrogen (NH4+), microbial biomass carbon (MBC), microbial biomass nitrogen (MBN), soil water content (SWC), soil temperature (ST), litter temperature (LT), litter biomass (LB), litter total carbon (LC), litter total nitrogen (LN), and total abundance (TA).
| Soil fauna taxa | Environmental factors | |||||||||||
| MBC | MBN | SOC | NH4+ | NO3- | TN | LC | LN | LB | LT | ST | SWC | |
| (mg kg-1) | (mg kg-1) | (g kg-1) | (mg kg-1) | (mg kg-1) | (g kg-1) | (g kg-1) | (g kg-1) | (g kg-1) | (℃) | (℃) | (%) | |
| TA | -0.344 | -0.399 | -0.779* | 0.13 | -0.308 | -0.643 | -0.007 | 0.594 | 0.534 | 0.65 | 0.67 | -0.63 |
| Oniscidae | -0.017 | -0.215 | -0.711* | 0.089 | -0.264 | -0.529 | -0.163 | 0.671 | 0.447 | 0.6 | 0.638 | -0.591 |
| Cryptodesmidae | -0.226 | 0.081 | -0.563 | 0.41 | -0.114 | -0.755* | -0.028 | -0.285 | 0.239 | 0.264 | 0.161 | -0.508 |
| Cydnidae | -0.521 | -0.331 | -0.738* | 0.129 | -0.453 | -0.906** | -0.132 | 0.251 | 0.691 | 0.307 | 0.122 | -0.59 |
| Armadillidae | -0.024 | -0.242 | -0.528 | 0.034 | -0.344 | -0.422 | -0.19 | 0.785* | 0.216 | 0.481 | 0.693 | -0.401 |
| Grylloidea | -0.431 | -0.299 | -0.911** | 0.229 | -0.152 | -0.594 | 0.186 | 0.263 | 0.839** | 0.595 | 0.291 | -0.753* |
| Araneae | -0.809* | -0.687 | 0.108 | -0.296 | -0.045 | -0.171 | 0.27 | -0.16 | 0.306 | 0.071 | -0.074 | 0.071 |
| Carabidae | -0.214 | -0.233 | -0.375 | 0.307 | -0.048 | 0.138 | 0.293 | 0.24 | 0.299 | 0.49 | 0.579 | -0.214 |
| Scolopendridae | -0.326 | -0.543 | -0.31 | -0.243 | -0.105 | -0.443 | 0.054 | 0.667 | 0.001 | 0.56 | 0.794* | -0.323 |
| Diplatyidae | -0.187 | 0.053 | -0.491 | 0.65 | -0.064 | -0.012 | 0.248 | -0.271 | 0.445 | 0.358 | 0.279 | -0.293 |
Table 2.
Quantifying the conditional effects of the measured environmental variables on taxa composition. Soil organic carbon (SOC), total nitrogen (TN), nitrate nitrogen (NO3-), ammonium nitrogen (NH4+), microbial biomass carbon (MBC), microbial biomass nitrogen (MBN), soil water content (SWC), litter water content (LWC), soil temperature (ST), litter temperature (LT), litter biomass (LB), litter total carbon (LC) and litter total nitrogen (LN).
| Variables | Soil macrofauna composition | Functional groups | ||||||
| Explains % | Contribution % | Pseudo-F | Variables | Explains % | Contribution % | Pseudo-F | ||
| MBC | 3.9 | 7.4 | 1.2 | SWC | 17.3 | 51 | 26.3** | |
| MBN | 5.2 | 10 | 1.7* | LT | 6.9 | 20.5 | 11.5** | |
| SOC | 7.9 | 15 | 2.7* | LN | 2.1 | 6.1 | 3.5* | |
| NH4+ | 1.5 | 2.8 | 0.5 | ST | 2 | 5.9 | 3.4* | |
| NO3- | 3 | 5.8 | 1 | LC | 1.6 | 4.6 | 2.7* | |
| TN | 4.6 | 8.7 | 1.6 | NO3 | 0.9 | 2.8 | 1.7 | |
| LC | 2 | 3.9 | 0.8 | LB | 0.9 | 2.8 | 1.7 | |
| LN | 3.7 | 7 | 1.4 | LWC | 0.7 | 2.2 | 1.3 | |
| LB | 4.4 | 8.4 | 1.7* | SOC | 0.4 | 1.1 | 0.7 | |
| LT | 1.7 | 3.1 | 0.6 | MBC | 0.4 | 1.2 | 0.7 | |
| ST | 9.9 | 18.8 | 3.7* | MBN | 0.3 | 1 | 0.6 | |
| LWC | 2.6 | 5 | 1 | TN | 0.2 | 0.6 | 0.3 | |
| SWC | 2.3 | 4.3 | 0.9 | NH4 | <0.1 | 0.3 | 0.1 | |
Disclaimer/Publisher’s Note: The statements, opinions and data contained in all publications are solely those of the individual author(s) and contributor(s) and not of MDPI and/or the editor(s). MDPI and/or the editor(s) disclaim responsibility for any injury to people or property resulting from any ideas, methods, instructions or products referred to in the content. |
© 2024 by the authors. Licensee MDPI, Basel, Switzerland. This article is an open access article distributed under the terms and conditions of the Creative Commons Attribution (CC BY) license (http://creativecommons.org/licenses/by/4.0/).
Copyright: This open access article is published under a Creative Commons CC BY 4.0 license, which permit the free download, distribution, and reuse, provided that the author and preprint are cited in any reuse.


