1. Introduction
The quality of drinking water whether it is in form of surface water or groundwater is getting deteriorated drastically with the passage of time. There are many reasons behind the degradation of drinking water quality. The causes of bad water quality are associated with the natural phenomenon as well as the anthropogenic activities. The natural causes include geological changes of layers, climate change, shortage of rainfall, acidic rainfall, etc. However, the anthropogenic reasons include over abstraction of water, urbanization, over population, disposal of untreated domestic and industrial sewage into streams, dumping of solid waste, overuse of agricultural fertilizers, etc. The issue of poor quality of drinking water is not only limited to the developing countries but developed countries are also grappling with the availability of safe drinking water as well. It is also investigated that about 20 billion people around the world are facing scarcity of safe and suitable drinking water, and almost 50-60% diseases in the world are the waterborne diseases [
1]. It is further evaluated through research that after 2025 almost 50% population of the world will face scarcity of suitable drinking water.
Pakistan is also one of the countries that are coping with the shortage of portable water. Research has revealed that only 30-40% people in Pakistan drink good drinking water, rest of people either struggle with the availability of water or consume poor drinking water [
3]. That’s the reason that in Pakistan abdominal diseases such as Gastro, diarrhoea, and other diseases such as cholera, malaria, typhoid, etc. are common owing to extremely contaminated drinking water [
4]. In the most parts of Pakistan particularly rural areas, residents are using unfit drinking water. This unhealthy water is not only affecting the economy of Pakistan but also increasing the patients of chronic diseases in Pakistan. The UNICEF and government authorities of Pakistan have confirmed that in the last ten years the patients of waterborne diseases have increased excessively [
5,
6]. The PCRWR (Pakistan Centre for Reclamation of Water Resources) have also confirmed that almost 60% drinking water in Pakistan is not fit for drinking. The major cause of the water pollution in Pakistan is the mixing of sewage with the surface water and ground water [
7]. is Therefore, scholars have been recommending that the government should immediately take remedial measures in order assure the supply of safe drinking water to the population of Pakistan.
However, neither it is feasible nor economical to provide treated water supply schemes everywhere. It also depends upon the source of water as well. For instance in the Tharparkar district of Sindh province of Pakistan, neither dam can be constructed because there is complete desert that does not allow rain water to move from one point to another nor the lined canal is constructed there by government. In such circumstances, residents are reluctantly drinking water from dug wells and aquifers, which are not safe for drinking due to variety of chemical and physical impurities. On the other hand, various cities only have accessibility to groundwater for their domestic uses, but, groundwater also exhibit variety of contamination. Therefore, the need of economical and locally available technique of water purification is the need of time in many countries in the world including Pakistan.
Clay water coolers locally known as (Dilla or Matt) are commonly used in the rural areas of Pakistan. Most of population in the rural areas use clay water coolers due to being cheaply available everywhere. Besides that many think that these clay water coolers may have negative or positive impact on the many water quality parameters. Thus, in order to assess the change in the properties of drinking water this study was proposed. And, frequent change in various parameters was assessed in the laboratory.
2. Materials and Methods
2.1. Materials
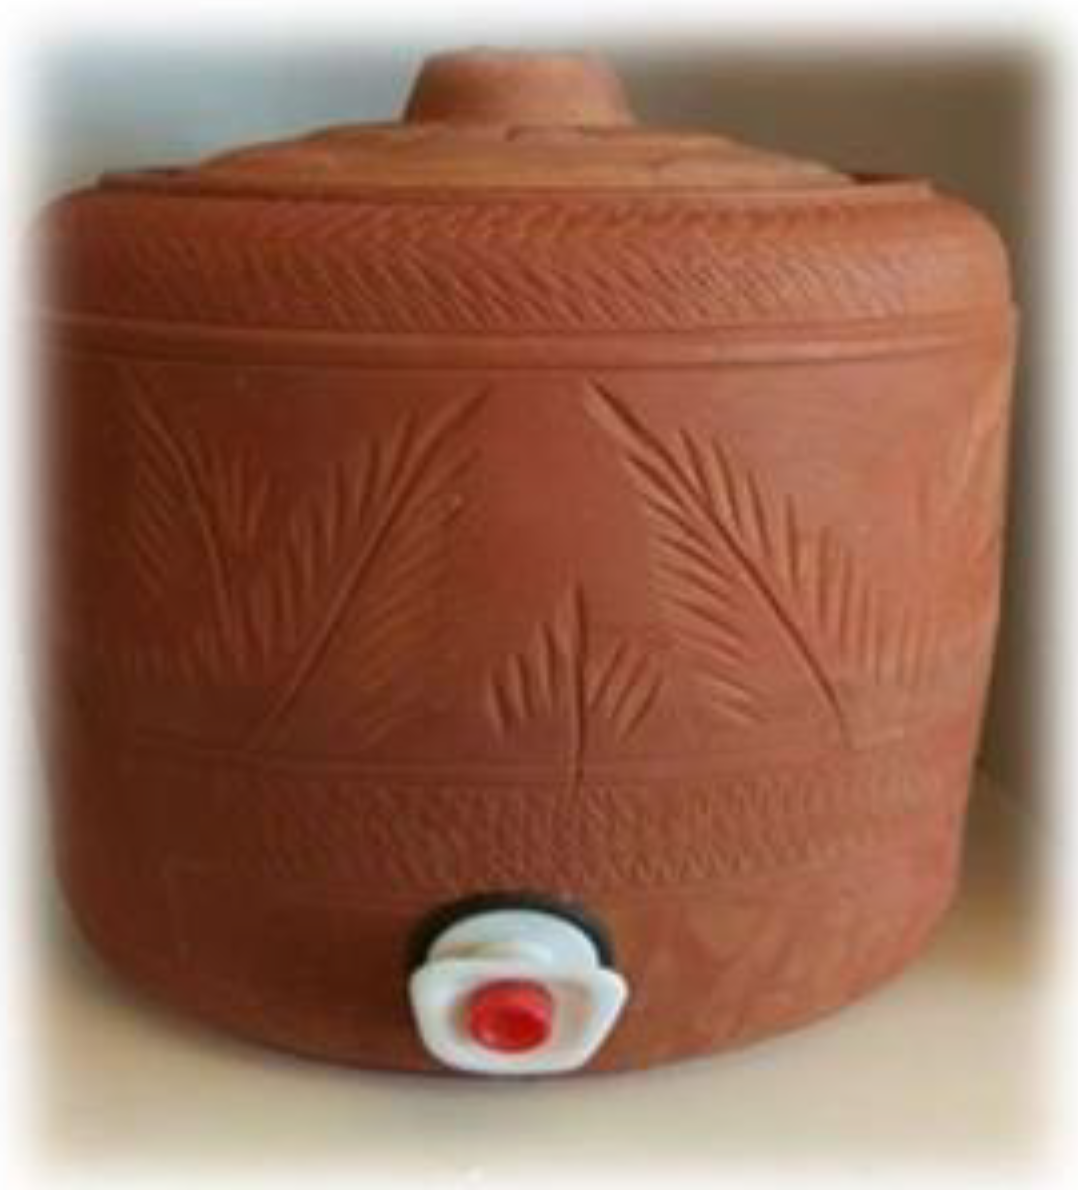
For assessing the effect of clay water cooler on the quality of drinking water, three clay water coolers shown
Figure 1 with proper cap and tap were purchased from the Larkana city and were brought the Laboratory of the University of Larkano.
2.1. Methods
For determining the change in the quality of drinking water the water quality parameters such as pH, Total Dissolved Solids (TDS), taste, odor, Total Hardness (TH), Chloride (Cl), Magnesium (Mg), and Calcium (Ca). The samples were collected from the electric motor of the University of Larkano. All tests were done following the standard laboratory methods. The water quality parameters were firstly checked before filling the clay water coolers so that the results could be matched with the forthcoming results. The clay water coolers were first properly washed and then filled with the same water and placed in the laboratory of the University of Larkano. Later on, the clay water coolers were left for three, eight, twelve, and fourteen hours. Firstly after three hours samples were collected from each Clay water Cooler and testing was done; samples were again collected after eight hours; twelve hours and lastly the samples from each Clay water cooler collected after fourteen hours and the concentration each parameter was determined. It should be noted that three samples of 250 ml were collected from three Clay water coolers and testing was done systematically. And, in the end all results were compared with the values of each parameter determined before filling the clay water cooler.
3. Results and Discussion
The results of the various water quality parameters such as such as pH, Total Dissolved Solids (TDS), taste, odor, Total Hardness (TH), Chloride (Cl), Magnesium (Mg) and Calcium (Ca), were determined initially before filling of clay water cooler, and after three, eight, twelve, and fourteen hours. The results of each parameter were compared with results after the three, eight, twelve, and fourteen hours. The effect of clay water cooler on the properties of drinking water is discussed below.
3.1. Taste and Odor
Taste and odor of drinking water samples were assessed initially and after three, eight, twelve and fourteen hours of storage in the Clay Water Coolers. When initially samples were assessed, samples did not have any color or odor and even after three, eight, twelve, and fourteen hours of storage in Clay water cooler, the water did not exhib change in taste. However, the odor of water slightly changed with passage of time and exhibited muddy odor.
3.2. pH
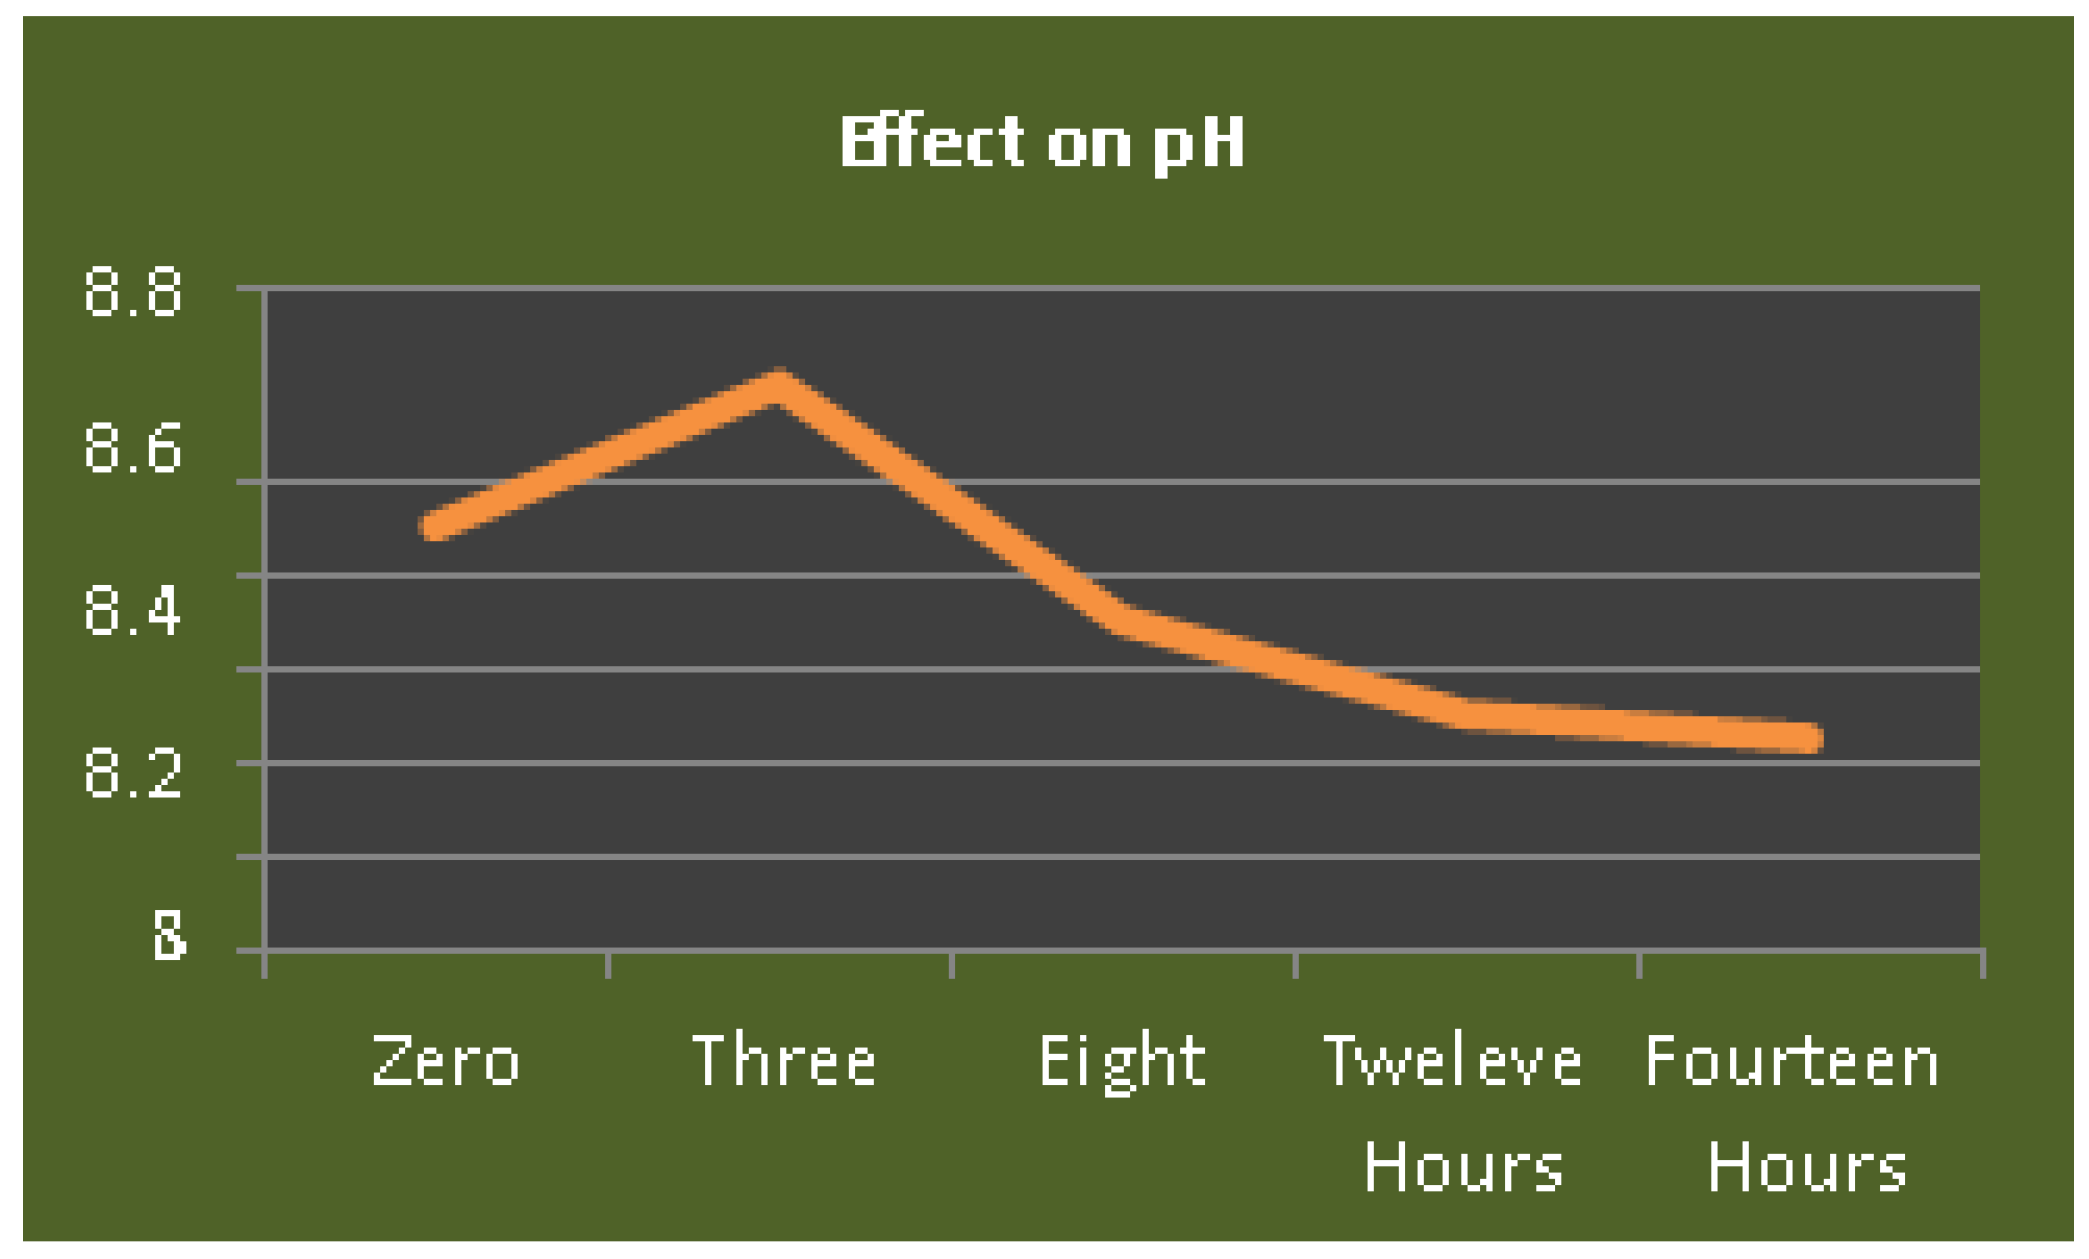
pH is a chemical drinking water quality parameter. The WHO recommends that the WHO in the drinking water should not exceed 8.5 neither should be lesser than 6.5. When the drinking water samples were initially tested for the pH the value of pH was found 8.3, and when the pH value of water stored three hours in the clay water was checked it displayed the value of 8.6 on the pH meter. However, the value started decreasing after the storage of eight hours. The value of pH after eight hours storage was found 8.1, after twelve hours it was 7.9 and after fourteen hours it was 7.85. Thus, results displayed reduction in the pH value with the increase in storage time. The results are displayed in
Figure 2.
3.3. Total Dissolved Solids (TDS) and Electrical Conductivity (EC)
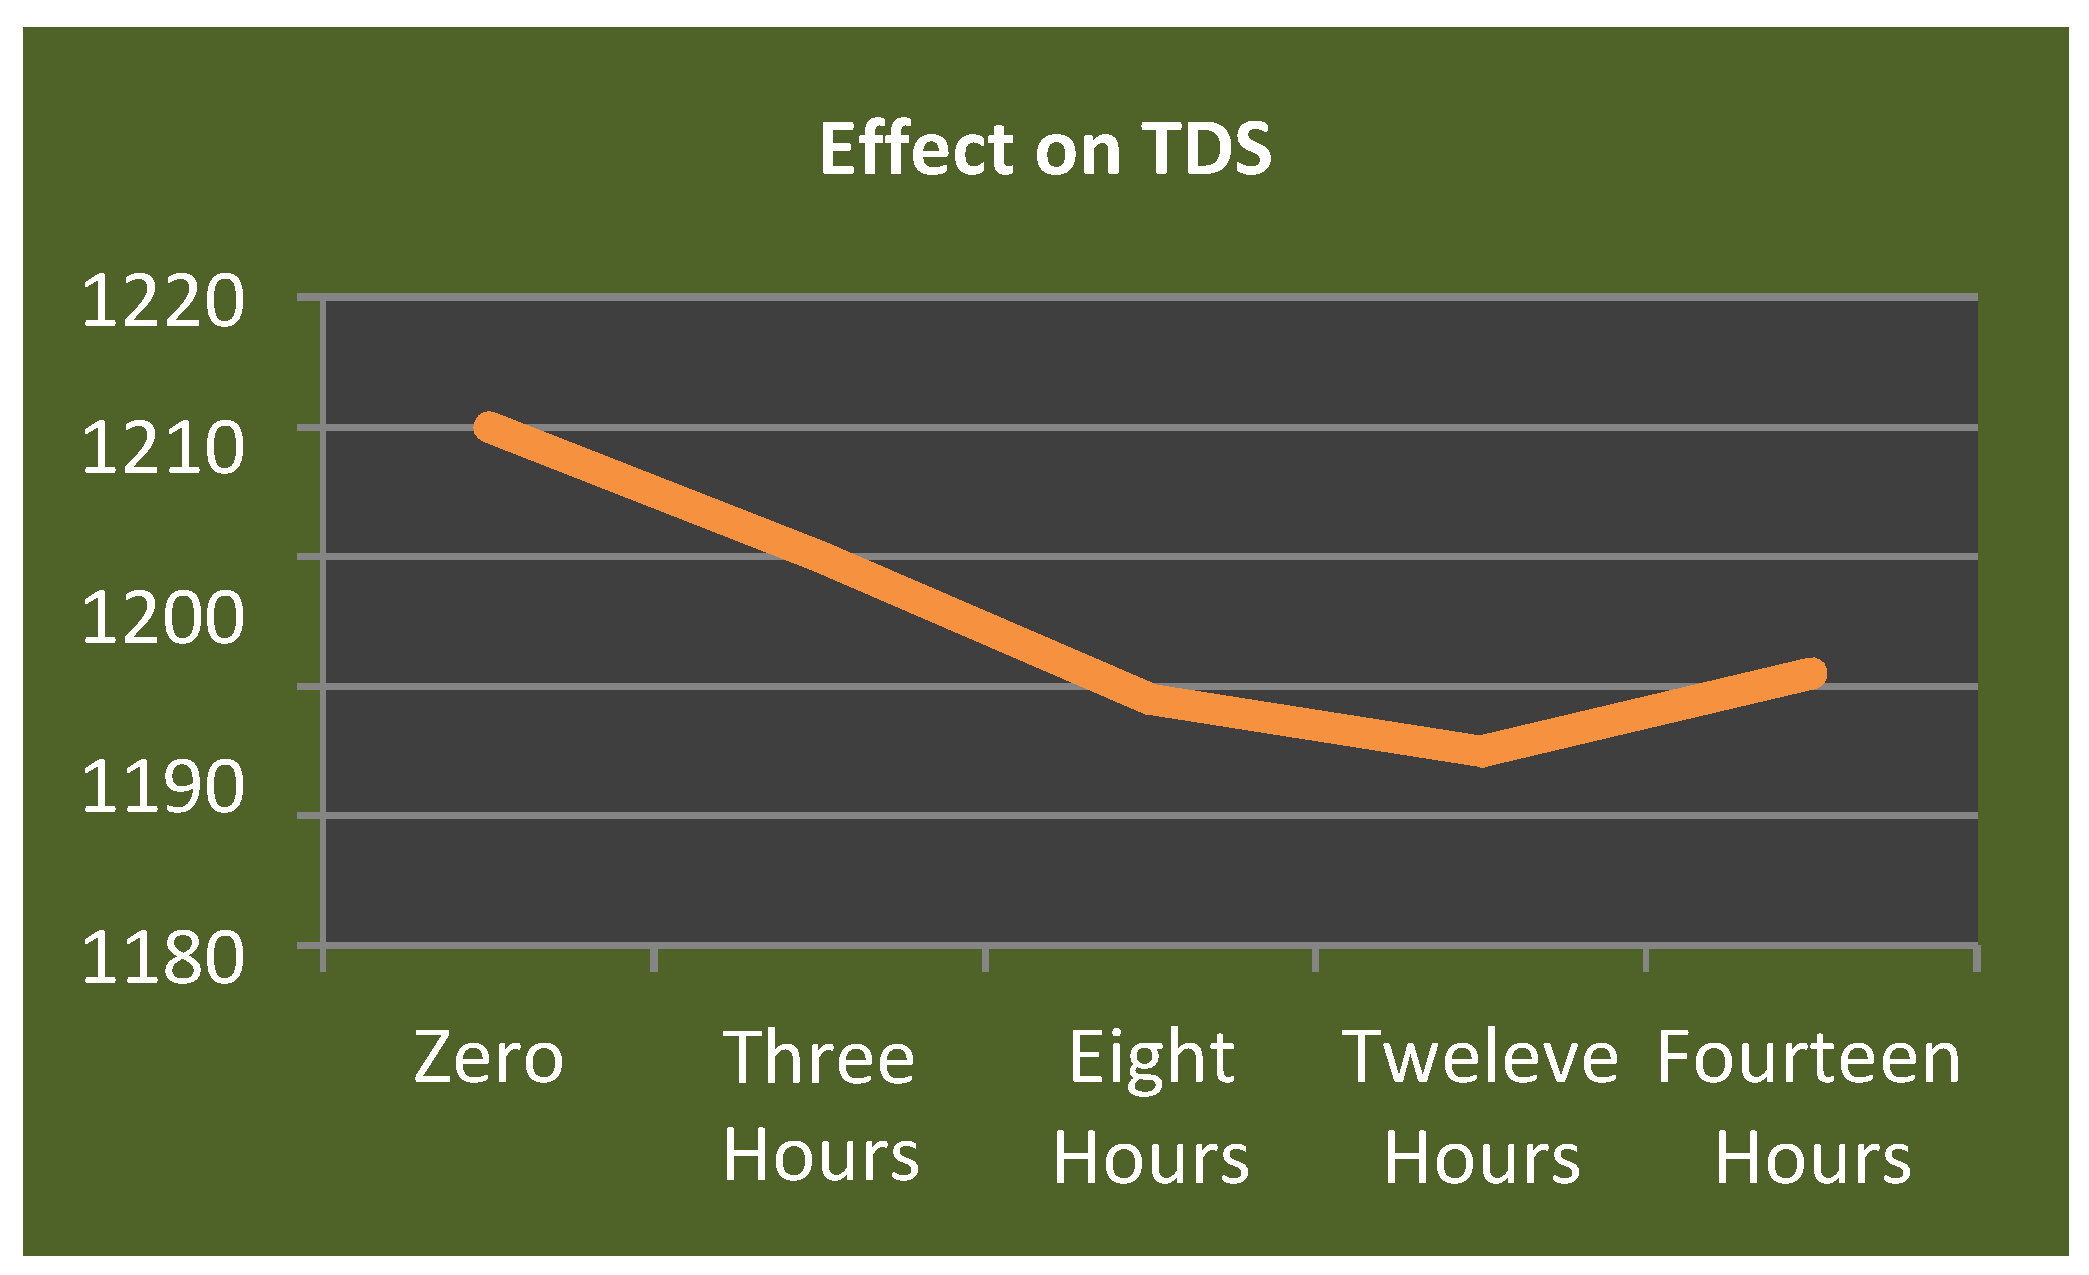
Total dissolved Solids (TDS) is the one of the important parameters of drinking water. The TDS in the drinking water samples were checked by using TDS meter. The results revealed that initially the value of TDS was found as 1210 ppm. However, after the storage of three hours in Clay water cooler it reduced to 1200 ppm, later on after eight hours it showed further decline its values from 1200 ppm to 1189 ppm, and after twelve hours it reduced to 1185 ppm. However, it displayed increase in the concentration of TDS after fourteen hours. The value after fourteen hours was recorded as 1191 ppm. The results are displayed in
Figure 3
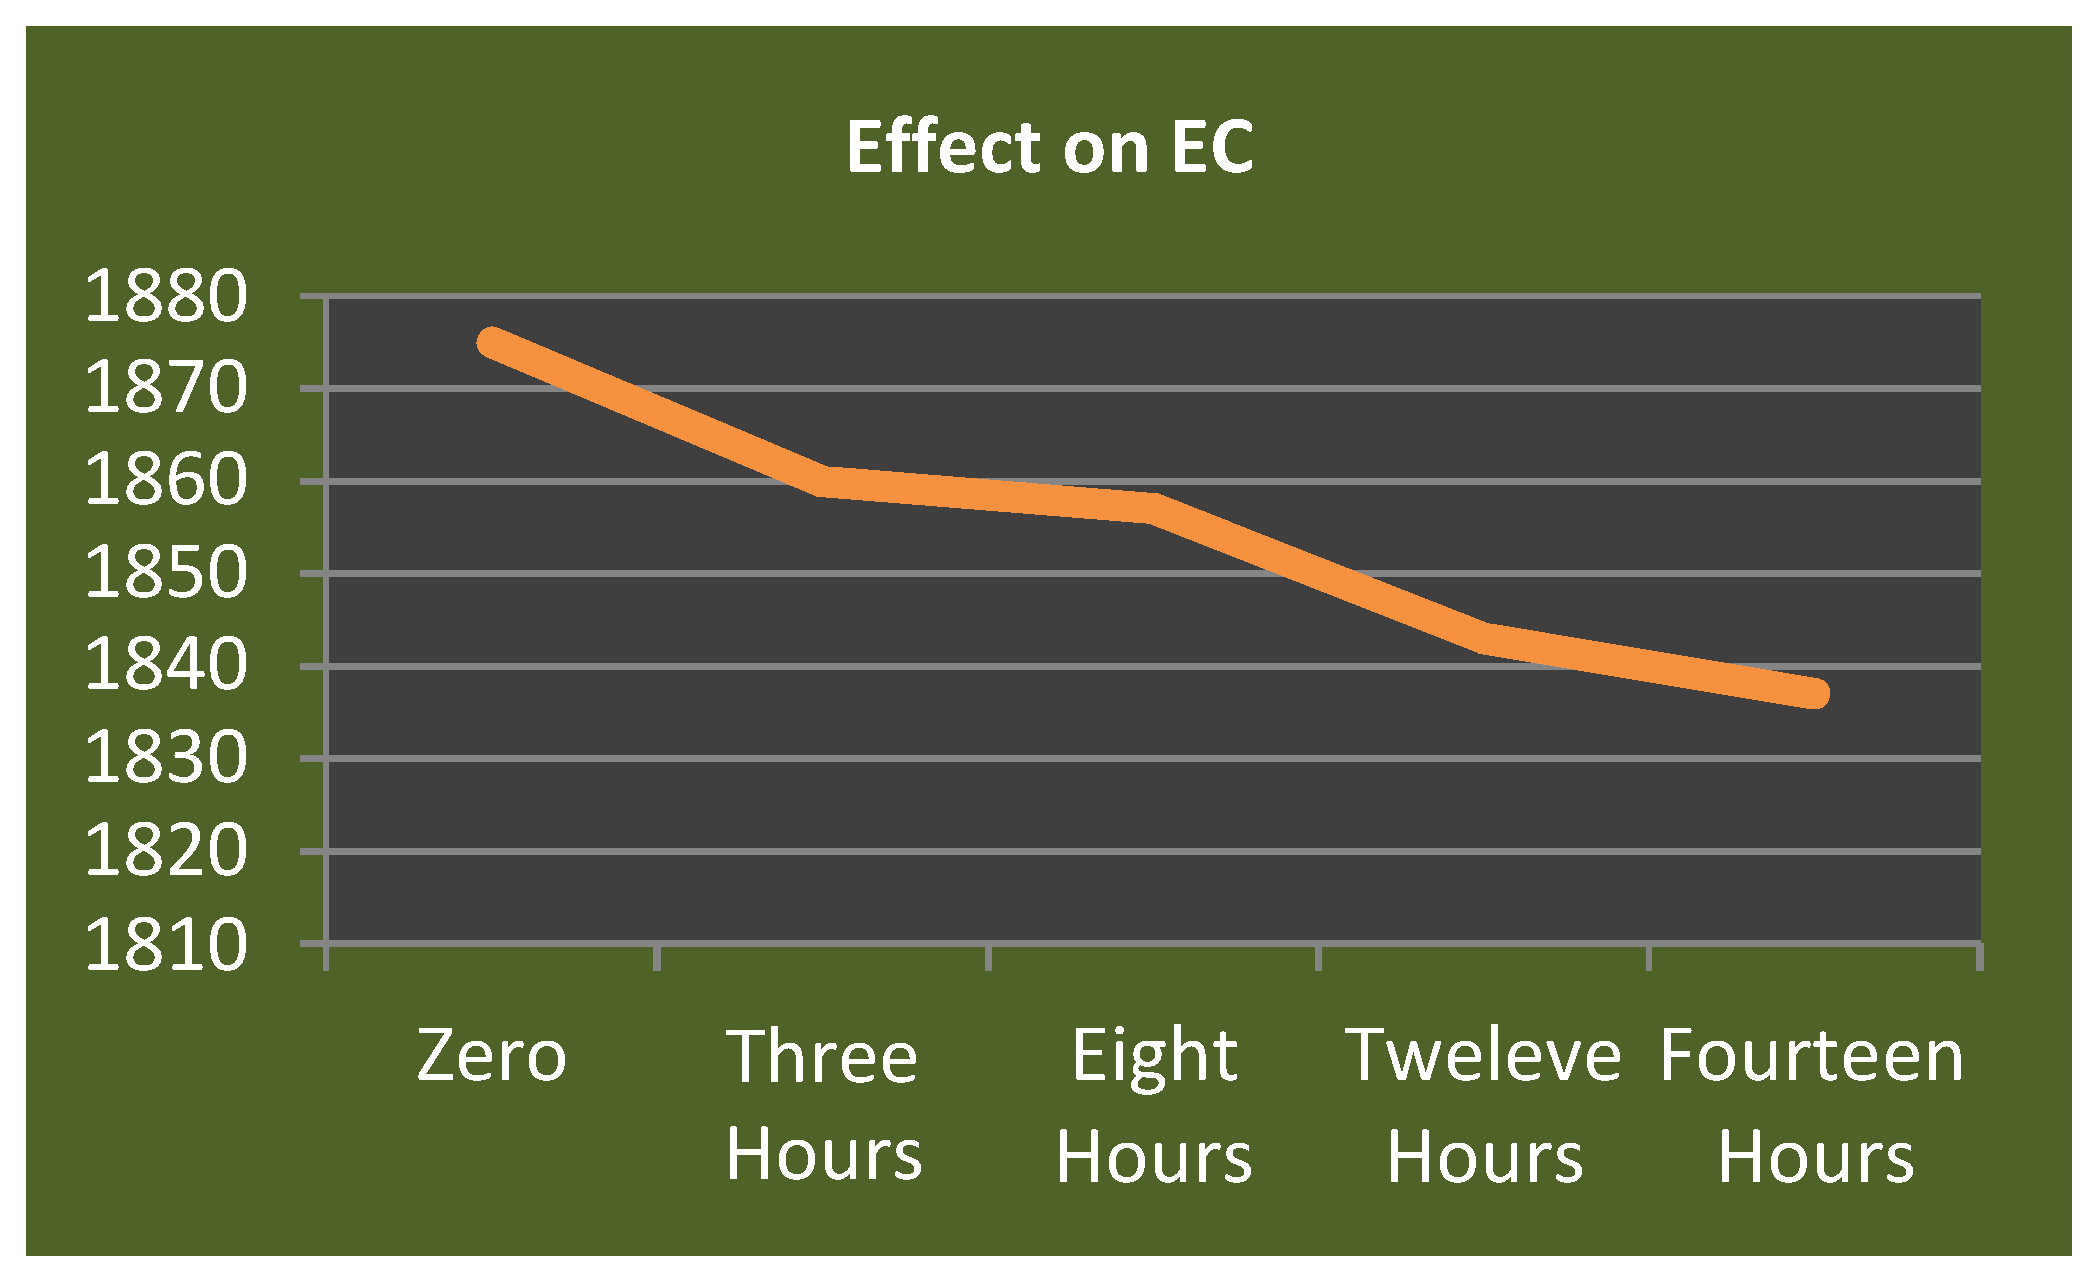
The electrical Conductivity of water followed the same pattern. Initially the value of EC was recorded as 1875 µS/cm, after three, eight, twelve, and fourteen hours it was recorded as 1860 µS/cm, 1857 µS/cm, 1843 µS/cm, 1837 µS/cm, and 1846 µS/cm respectively. The detailed results are displayed in
Figure 4.
3.4. Total Hardness (TH)
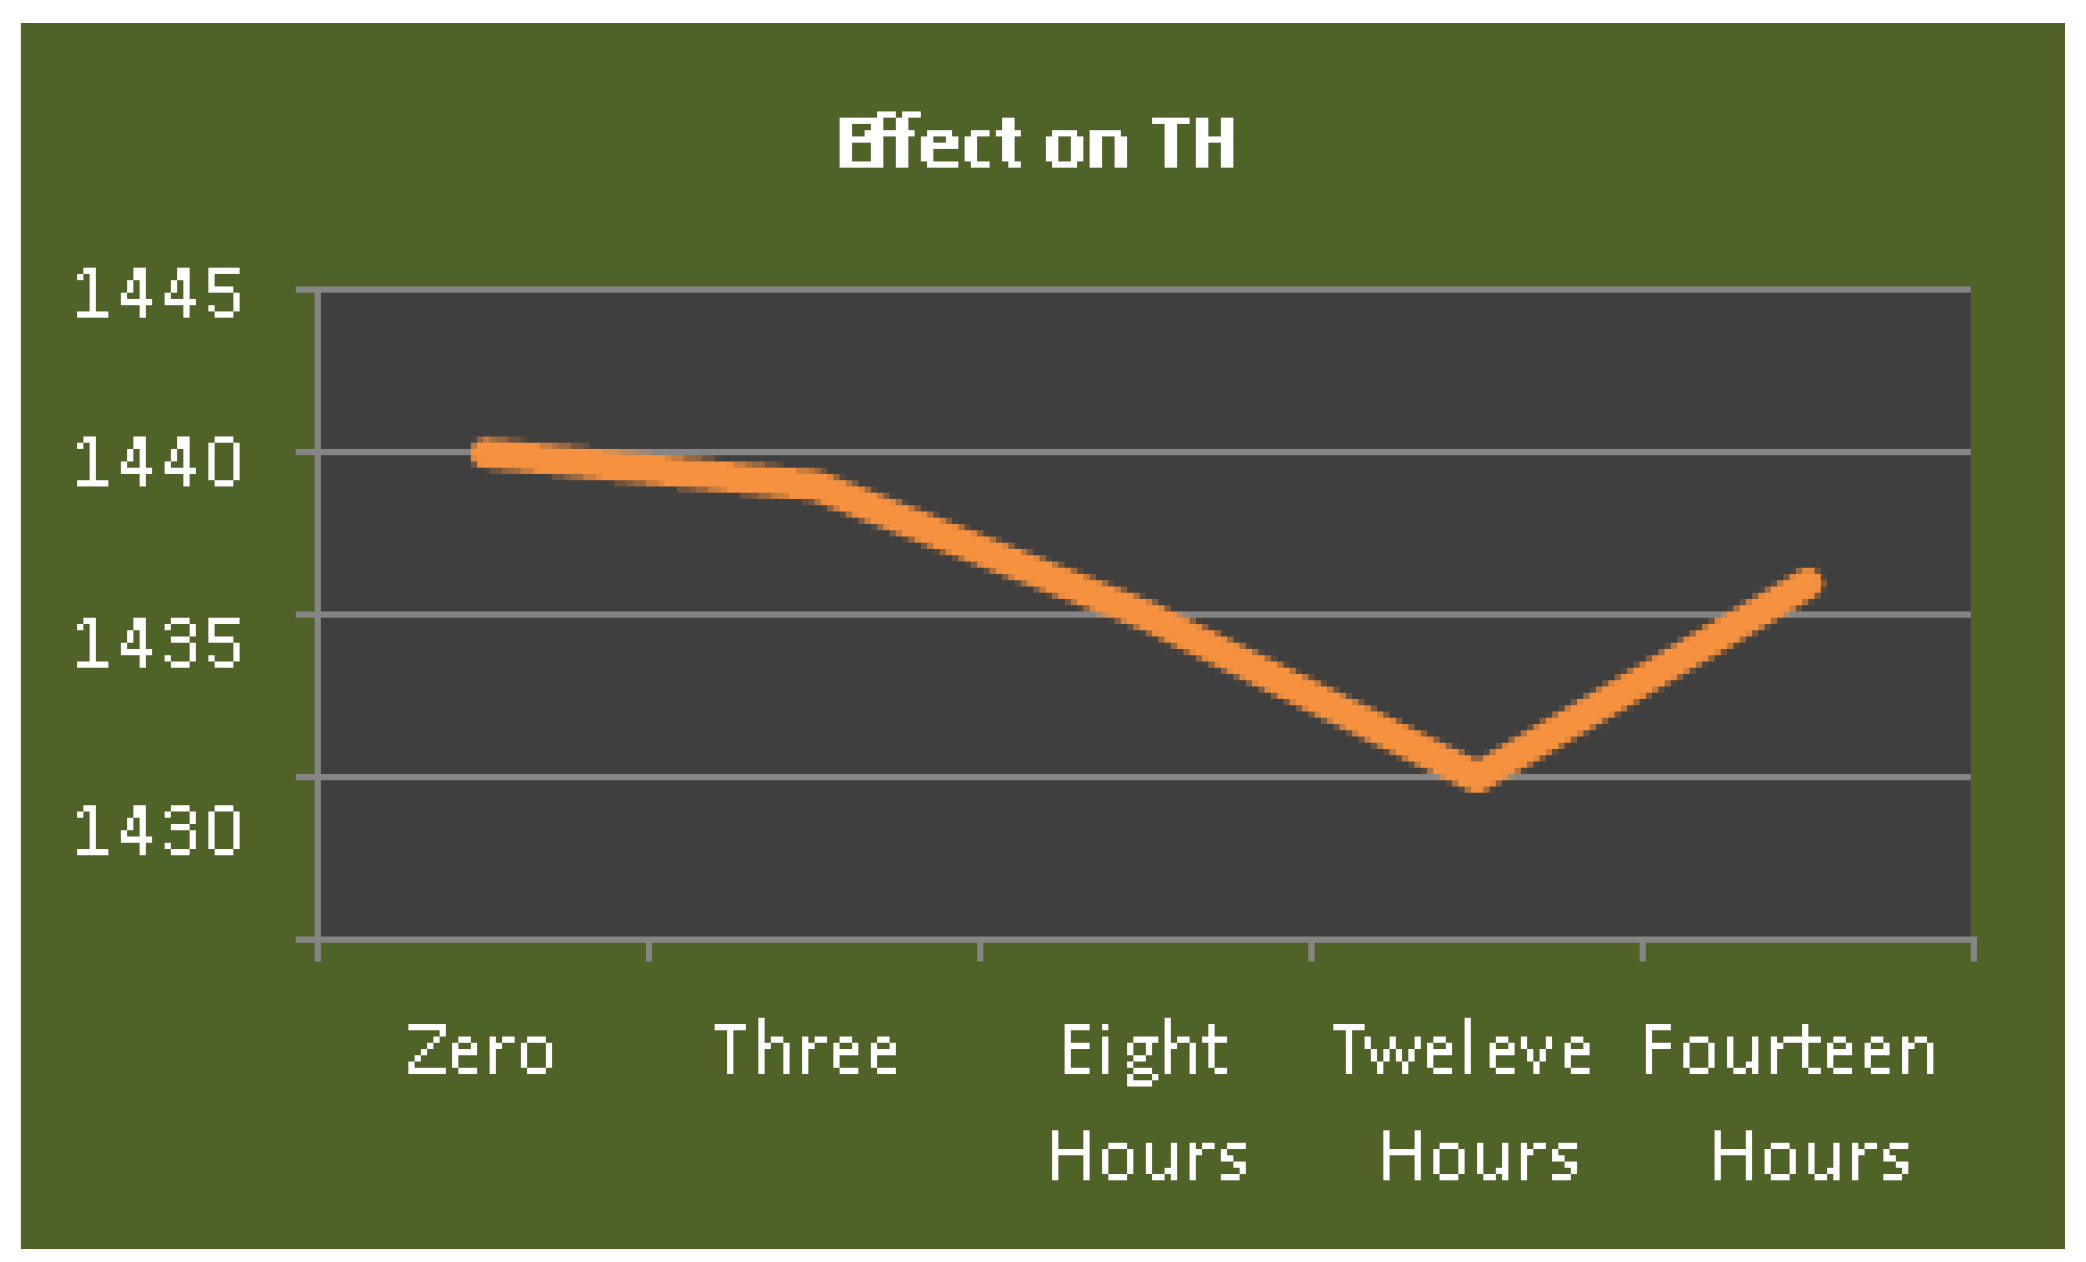
Similar pattern of testing as done for TDS, EC, Colr, and odor was followed for the Total Hardness. When the samples were checked initially, after three hours, eight hours, twelve, and fourteen hours, the value of TH was recorded as 1440 ppm, 1439 ppm, 1435 ppm, 1430 ppm, and 1436 ppm respectively. It also revealed that there is a positive impact on the total hardness of drinking water if water is stored for up to twelve hours, however, later it starts increasing as shown in
Figure 5.
3.5. Calcium (Ca) and Magnesium (Mg)
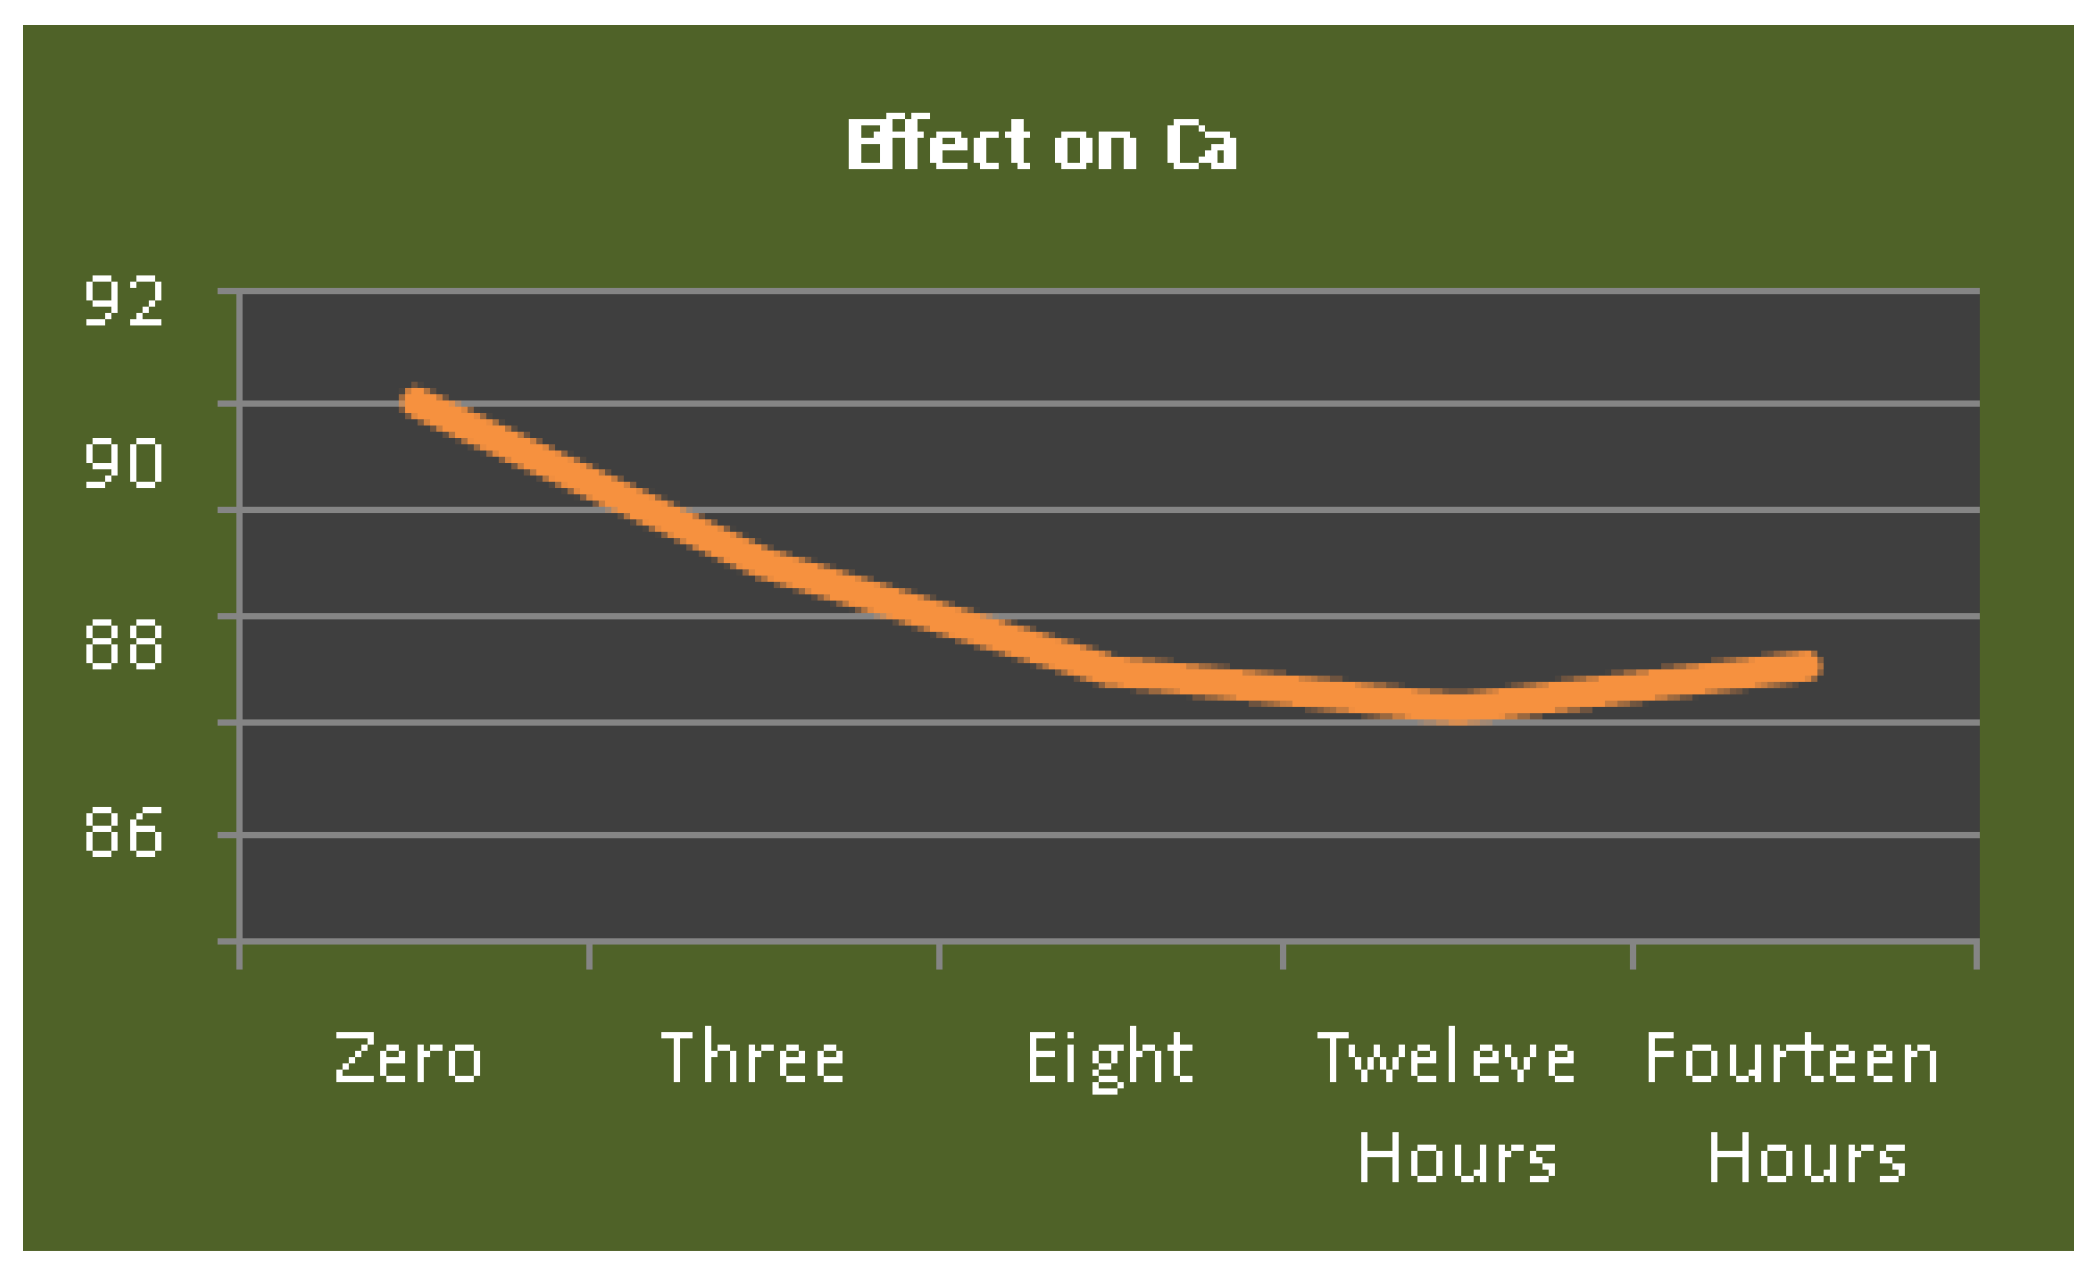
Calcium and Magnesium are another important elements of drinking water. These two parameters contribute to total hardness in the water.When the concentration of calcium was tested initially its value was observed as 90 ppm. However, when water was stored in the Clay Water cooler and samples were taken for testing after three, eight, twelve, and fourteen hours, the results revealed that the value of calcium reduced from 90 ppm to 87 ppm after three hours, after eight hours it reduced to 85 ppm, 84.3 ppm and 85.1 ppm after twelve and fourteen hours respectively. The details are shon in
Figure 6.
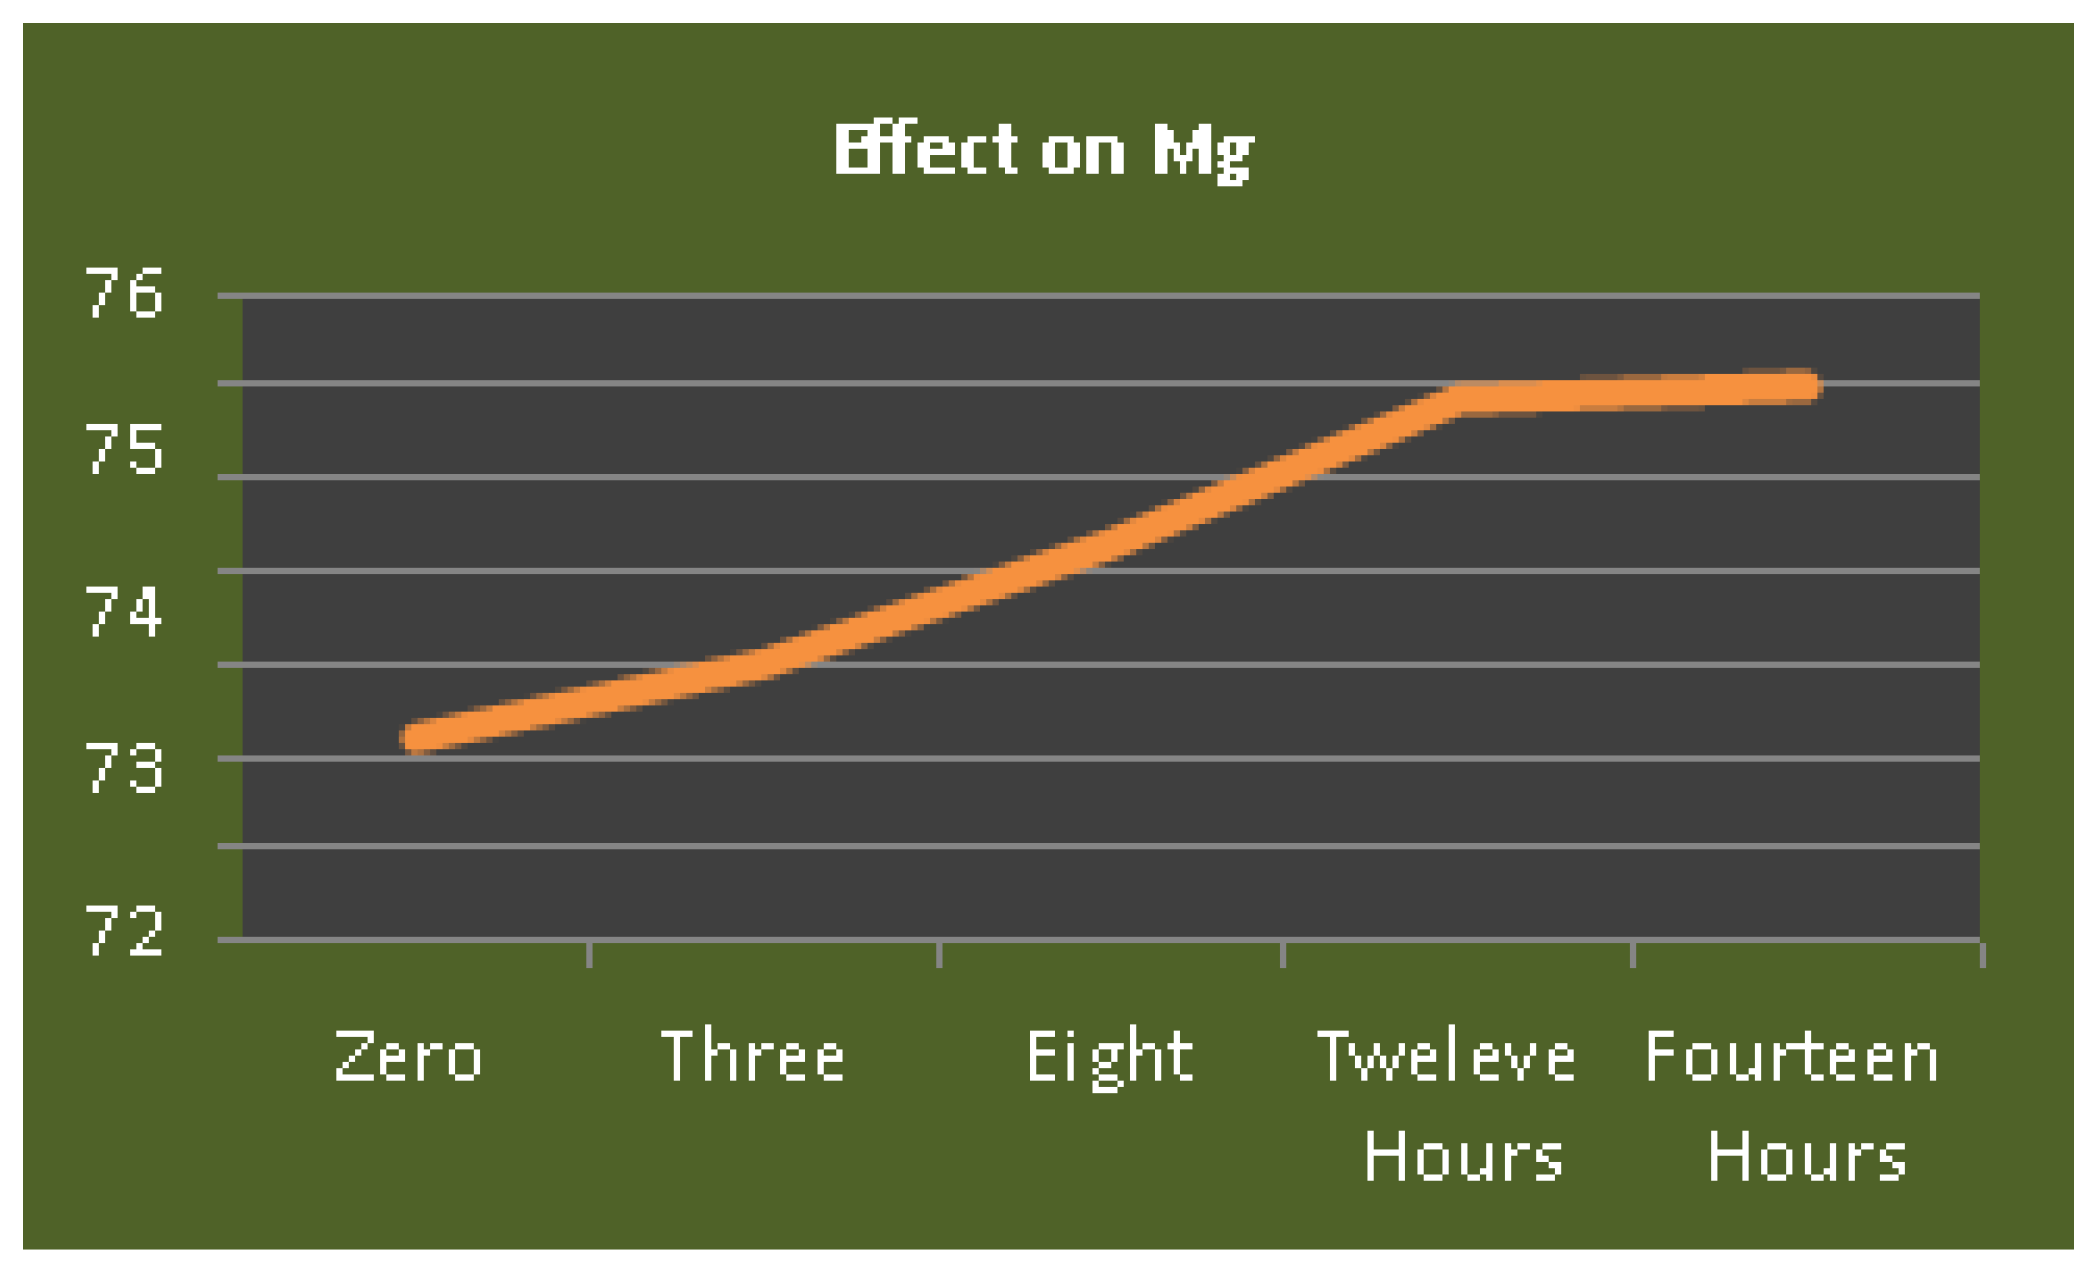
However, when magnesium in the water samples were tested as shown in
Figure 7, initially the value of Magnesium was observed as 71.2 ppm. When water samples were tested after three, eight, twelve, and fourteens the values of magnesium were observed as 72 ppm, 73.3 ppm, 74.86 ppm, and 75 ppm respectively.
In nutshell, the values of Calcium kept decreasing for the first twelve hours while values of Magnesium kept increasing throughout period.
4. Conclusions
Water is the most crucial source of life. However, this important element of life is on the verge of deterioration due to various anthropogenic and natural causes that have been making quality of water unsuitable for drinking. The major causes behind the shrinking quantity of safe drinking water are the mixing of industrial and domestic sewage with groundwater and surface water, shortage of rainfall, percolation of dangerous leachate to groundwater, and disposal sites of solid waste. Therefore, it has become important to introduce efficient and economical water treatment methods in Pakistan and other countries. Keeping this view in mind this effort was made to assess changes in the quality of drinking water when it is stored in the Clay water Cooler. The Clay water cooler is the most commonly used cooler for storing water particularly in rural areas of Pakistan. When the effect of clay water cooler on the quality of water was assessed the results revealed that there is a slight positive change in the various water quality parameters such as Calcium, Total hardness, Total dissolved solids, and pH if water is stored in the caly water cooler for the time not more than twelve hours. However, it was reported that the reduction in values of such parameters was not as reasonable as required, but, they are recommended when water is slightly contaminated and in such cases water can be made good for drinking by the use of Clay Water Coolers.
References
- Onda K, LoBuglio J, Bartram J (2012) Global access to safe water: accounting for water quality and the resulting impact on MDG progress. Int J Environ Res Public Health 9(3):880–894.
- Jamali, M.Z.; Solangi, G.S.; Keerio, M.A.; Keerio, J.A.; Bheel, N. Assessing and mapping the groundwater quality of Taluka Larkana, Sindh, Pakistan, using water quality indices and geospatial tools. Int. J. Environ. Sci. Technol. 2023, 20, 8849–8862. [Google Scholar] [CrossRef]
- Singh, K.R.; Dutta, R.; Kalamdhad, A.S.; Kumar, B. Review of existing heavy metal contamination indices and development of an entropy-based improved indexing approach. Environ. Dev. Sustain. 2020, 22, 7847–7864. [Google Scholar] [CrossRef]
- Jamali, M. Z. , Khoso, S., Soomro, Z., Sohu, S., & Abro, A. F. (2022). EVALUATING THE SUITABILITY OF GROUNDWATER IN PAKISTAN: AN ANALYSIS OF WATER QUALITY USING SYNTHETIC POLLUTION INDEX (SPI) AND WATER QUALITY INDEX (WQI). International Journal of Energy, Environment and Economics, 30(3), 311-328.
- Jamali, M.Z.; Solangi, G.S.; Keerio, M.A.; Keerio, J.A.; Bheel, N. Assessing and mapping the groundwater quality of Taluka Larkana, Sindh, Pakistan, using water quality indices and geospatial tools. Int. J. Environ. Sci. Technol. 2023, 20, 8849–8862. [Google Scholar] [CrossRef]
- Ahmed, S. , Jamali, M. A. ( 30(3), 211–226.
- Jamali, M. Z. , Solangi, G. S., & Keerio, M. A. (2020). Assessment of Groundwater Quality of Taluka Larkana, Sindh, Pakistan. International Journal of Scientific & Engineering Research, 11(5), 795-797.
|
Disclaimer/Publisher’s Note: The statements, opinions and data contained in all publications are solely those of the individual author(s) and contributor(s) and not of MDPI and/or the editor(s). MDPI and/or the editor(s) disclaim responsibility for any injury to people or property resulting from any ideas, methods, instructions or products referred to in the content. |
© 2024 by the authors. Licensee MDPI, Basel, Switzerland. This article is an open access article distributed under the terms and conditions of the Creative Commons Attribution (CC BY) license (http://creativecommons.org/licenses/by/4.0/).
