1. Introduction
The Niger Delta region of Nigeria, historically a major contributor to global oil production, is experiencing a gradual decline in its conventional light oil reserves. This depletion poses a significant challenge to the region's economic stability and energy security, necessitating the exploration of alternative hydrocarbon resources, such as heavy oil, which constitutes nearly 20% of Nigeria’s estimated crude oil reserves [
1,
2]. Heavy oil, characterized by its high viscosity and density, presents substantial recovery challenges, including low mobility and high production costs. To address these issues, Enhanced Oil Recovery (EOR) techniques have been increasingly employed to optimize recovery rates [
3,
4].
Among the various EOR methods, thermal and chemical flooding techniques have emerged as effective strategies for enhancing heavy oil recovery [
5,
6]. Thermal methods, such as steam flooding and in-situ combustion, are well-established but often limited by their high energy consumption and environmental impact [
7]. Conversely, chemical flooding, which involves injecting chemical agents like surfactants, polymers, and alkalis into the reservoir, has shown promise in improving oil displacement efficiency and reducing interfacial tension [
8,
9]. Recent advancements have explored the integration of thermal and chemical EOR methods to maximize recovery in heavy oil reservoirs [
10,
11].
In this context, the use of Artificial Neural Networks (ANN) has gained significant attention as a powerful tool for optimizing EOR processes [
12,
13]. ANNs, inspired by the human brain's neural structure, are capable of learning complex relationships between input and output parameters, making them particularly suitable for modeling the highly nonlinear behavior of reservoir performance [
14,
15]. The application of ANN in oil and gas operations has demonstrated success in predicting various reservoir properties, including permeability, porosity, and production rates, thereby aiding in decision-making processes [
16,
17].
Several studies have highlighted the effectiveness of ANN models in optimizing chemical EOR techniques. For instance, ANN has been successfully employed to predict the performance of surfactant-polymer flooding, achieving accurate predictions of oil recovery and operational parameters [
18]. Similarly, ANN has been used to optimize polymer flooding in heavy oil reservoirs, demonstrating improved recovery efficiencies compared to conventional methods [
19]. The versatility of ANN in modeling complex fluid-rock interactions and its ability to integrate vast datasets make it an invaluable tool in the optimization of EOR processes [
20,
21].
This study aims to leverage ANN modeling to optimize enhanced heavy oil recovery in the Niger Delta using a novel hot chemical flooding approach. By incorporating key reservoir parameters—porosity, permeability, oil specific gravity, and injection temperature—into the ANN model, this research seeks to develop a predictive framework for recovery efficiency. The study builds on previous works that have demonstrated the potential of hybrid EOR techniques combining thermal and chemical methods to enhance heavy oil recovery [
22,
23]. Furthermore, an economic analysis will compare the novel chemical flooding process with traditional steam flooding, highlighting the superior economic viability of the optimized hot chemical flooding strategy.
In conclusion, this paper contributes to the existing body of knowledge by demonstrating the application of ANN in optimizing hot chemical flooding for enhanced heavy oil recovery in the Niger Delta. The findings are expected to provide valuable insights into the adoption of innovative EOR strategies that maximize recovery rates while ensuring economic sustainability in heavy oil production [
24,
25].
2. Methodology
The methodology employed in this study involves the application of Artificial Neural Networks (ANN) to optimize enhanced oil recovery (EOR) in the Niger Delta using a novel hot chemical flooding approach. The dataset used for this study was derived from experimental analyses of chemical EOR processes conducted on heavy oil samples from the Niger Delta. The dataset consisted of 34 rows, each representing a unique experimental run with distinct reservoir and operational conditions. The input parameters for the ANN model included porosity (ϕ), permeability (k), oil specific gravity (SG), and chemical injection temperature (T). The output parameter is the Recovery Efficiency (RE), defined as the percentage of original oil in place (OOIP) that is recovered after the chemical flooding process.
The ANN model was developed using a feedforward neural network architecture, consisting of an input layer with four neurons corresponding to the four input parameters, three hidden layers with neurons optimized during model training, and an output layer with one neuron representing the recovery efficiency. The Levenberg-Marquardt (LM) algorithm was selected for training the ANN model due to its efficiency in handling nonlinear optimization problems and its robustness in converging to an optimal solution. The dataset was divided into training (70%), validation (15%), and testing (15%) subsets to ensure that the model generalized well to unseen data. The training subset was used to iteratively adjust the weights and biases of the network using the LM algorithm, minimizing the mean squared error (MSE) between the predicted and actual recovery efficiencies. The validation subset was utilized to fine-tune the model parameters and prevent overfitting, and the model's performance was evaluated by calculating the MSE and the coefficient of determination (R²) for both the training and validation datasets. The testing subset was reserved for final model evaluation to assess its predictive accuracy on completely unseen data.
To establish a mathematical relationship between the input and output parameters, a polynomial regression analysis was conducted. The regression model provided a mathematical expression for the recovery efficiency as a function of the input parameters (porosity, permeability, oil specific gravity, and chemical injection temperature). The polynomial equation was derived for each chemical flooding process, capturing the nonlinear interactions between the variables. For each chemical flooding experiment, the specific polynomial regression equations were extracted to analyze the contribution of each parameter to the recovery efficiency. These equations were crucial for understanding the dynamics of the flooding process and provided insights into optimizing the operational parameters for maximum recovery. The ANN model's predictions were cross-validated against these polynomial equations to ensure consistency and reliability. The final ANN model was validated using the testing subset to confirm its predictive accuracy and generalizability.
The ANN model development, training, and validation were conducted using MATLAB, a high-level language and interactive environment for numerical computation, visualization, and programming. The Neural Network Toolbox was employed to implement the feedforward neural network and the Levenberg-Marquardt training algorithm.
By following this methodology, the study aims to provide a comprehensive framework for optimizing heavy oil recovery in the Niger Delta using advanced machine learning techniques and a novel EOR strategy. The results obtained from this approach are expected to provide valuable insights into the adoption of innovative EOR strategies that maximize recovery rates while ensuring economic sustainability in heavy oil production.
3. Experimental Results
Data was extrapolated from the software simulation of the experimental analysis and was utilized in building machine learning models for predicting the heavy oil recovery efficiency for the hot chemicals used. Mathematical equations were then generated for each flooding mechanism to predict recovery without the necessity of experimental analysis.
3.1. Dissolved Liquid Soap ML Results:
3.1.1. ML Training Dataset
Table 1.
was extrapolated from the eclipse simulator, and represents a more detailed recovery analysis of an assumed heterogeneous reservoir, with flood parameters obtained from the chemical EOR experimental analysis.
Table 1.
was extrapolated from the eclipse simulator, and represents a more detailed recovery analysis of an assumed heterogeneous reservoir, with flood parameters obtained from the chemical EOR experimental analysis.
| Porosity |
Permeability |
Oil Specific Gravity |
Inj. Temp |
Recovery Efficiency |
| 0.2183 |
88.23 |
0.9542 |
50.0 |
82.76 |
| 0.2022 |
71.31 |
0.9542 |
52.0 |
83.92 |
| 0.2196 |
98.32 |
0.9542 |
54.0 |
85.08 |
| 0.2173 |
86.23 |
0.9542 |
56.0 |
86.24 |
| 0.2086 |
90.67 |
0.9542 |
58.0 |
87.40 |
| 0.2207 |
93.72 |
0.9542 |
60.0 |
88.56 |
| 0.2421 |
89.45 |
0.9542 |
62.0 |
89.72 |
| 0.2231 |
92.76 |
0.9542 |
64.0 |
90.88 |
| 0.2180 |
79.21 |
0.9542 |
66.0 |
92.04 |
| 0.2342 |
87.23 |
0.9542 |
68.0 |
93.20 |
| 0.2178 |
100.33 |
0.9542 |
70.0 |
94.36 |
| 0.2183 |
84.68 |
0.9542 |
72.0 |
95.52 |
| 0.2346 |
75.98 |
0.9542 |
74.0 |
96.18 |
| 0.2239 |
77.87 |
0.9542 |
76.0 |
96.84 |
| 0.2180 |
85.67 |
0.9542 |
78.0 |
97.50 |
| 0.2004 |
60.28 |
0.9542 |
80.0 |
92.31 |
| 0.2154 |
82.17 |
0.9542 |
82.0 |
98.22 |
| 0.2265 |
92.68 |
0.9542 |
84.0 |
98.33 |
| 0.2237 |
93.44 |
0.9542 |
86.0 |
98.44 |
| 0.2098 |
69.33 |
0.9542 |
88.0 |
98.44 |
| 0.2147 |
80.44 |
0.9542 |
90.0 |
98.55 |
| 0.2432 |
79.26 |
0.9542 |
92.0 |
98.55 |
| 0.2167 |
75.44 |
0.9542 |
94.0 |
98.66 |
| 0.2259 |
78.99 |
0.9542 |
96.0 |
98.66 |
| 0.2125 |
79.22 |
0.9542 |
98.0 |
98.77 |
| 0.2199 |
77.54 |
0.9542 |
100.0 |
98.77 |
| 0.2165 |
80.37 |
0.9542 |
105.0 |
98.88 |
| 0.2232 |
85.34 |
0.9542 |
110.0 |
98.99 |
| 0.2024 |
67.98 |
0.9542 |
115.0 |
98.99 |
| 0.2123 |
86.25 |
0.9542 |
120.0 |
99.10 |
| 0.2098 |
67.54 |
0.9542 |
125.0 |
99.10 |
| 0.2108 |
79.21 |
0.9542 |
130.0 |
99.11 |
3.1.2. ANN Model Analysis
- Training Results
Table 2.
DLS ANN parameters summary.
Table 2.
DLS ANN parameters summary.
| Data Division |
Random |
| Model |
Levenberg Marquardt |
| Input layer size |
4 |
| Hidden layer size |
3 |
| Output layer size |
1 |
| Training |
MSE |
0.0050 |
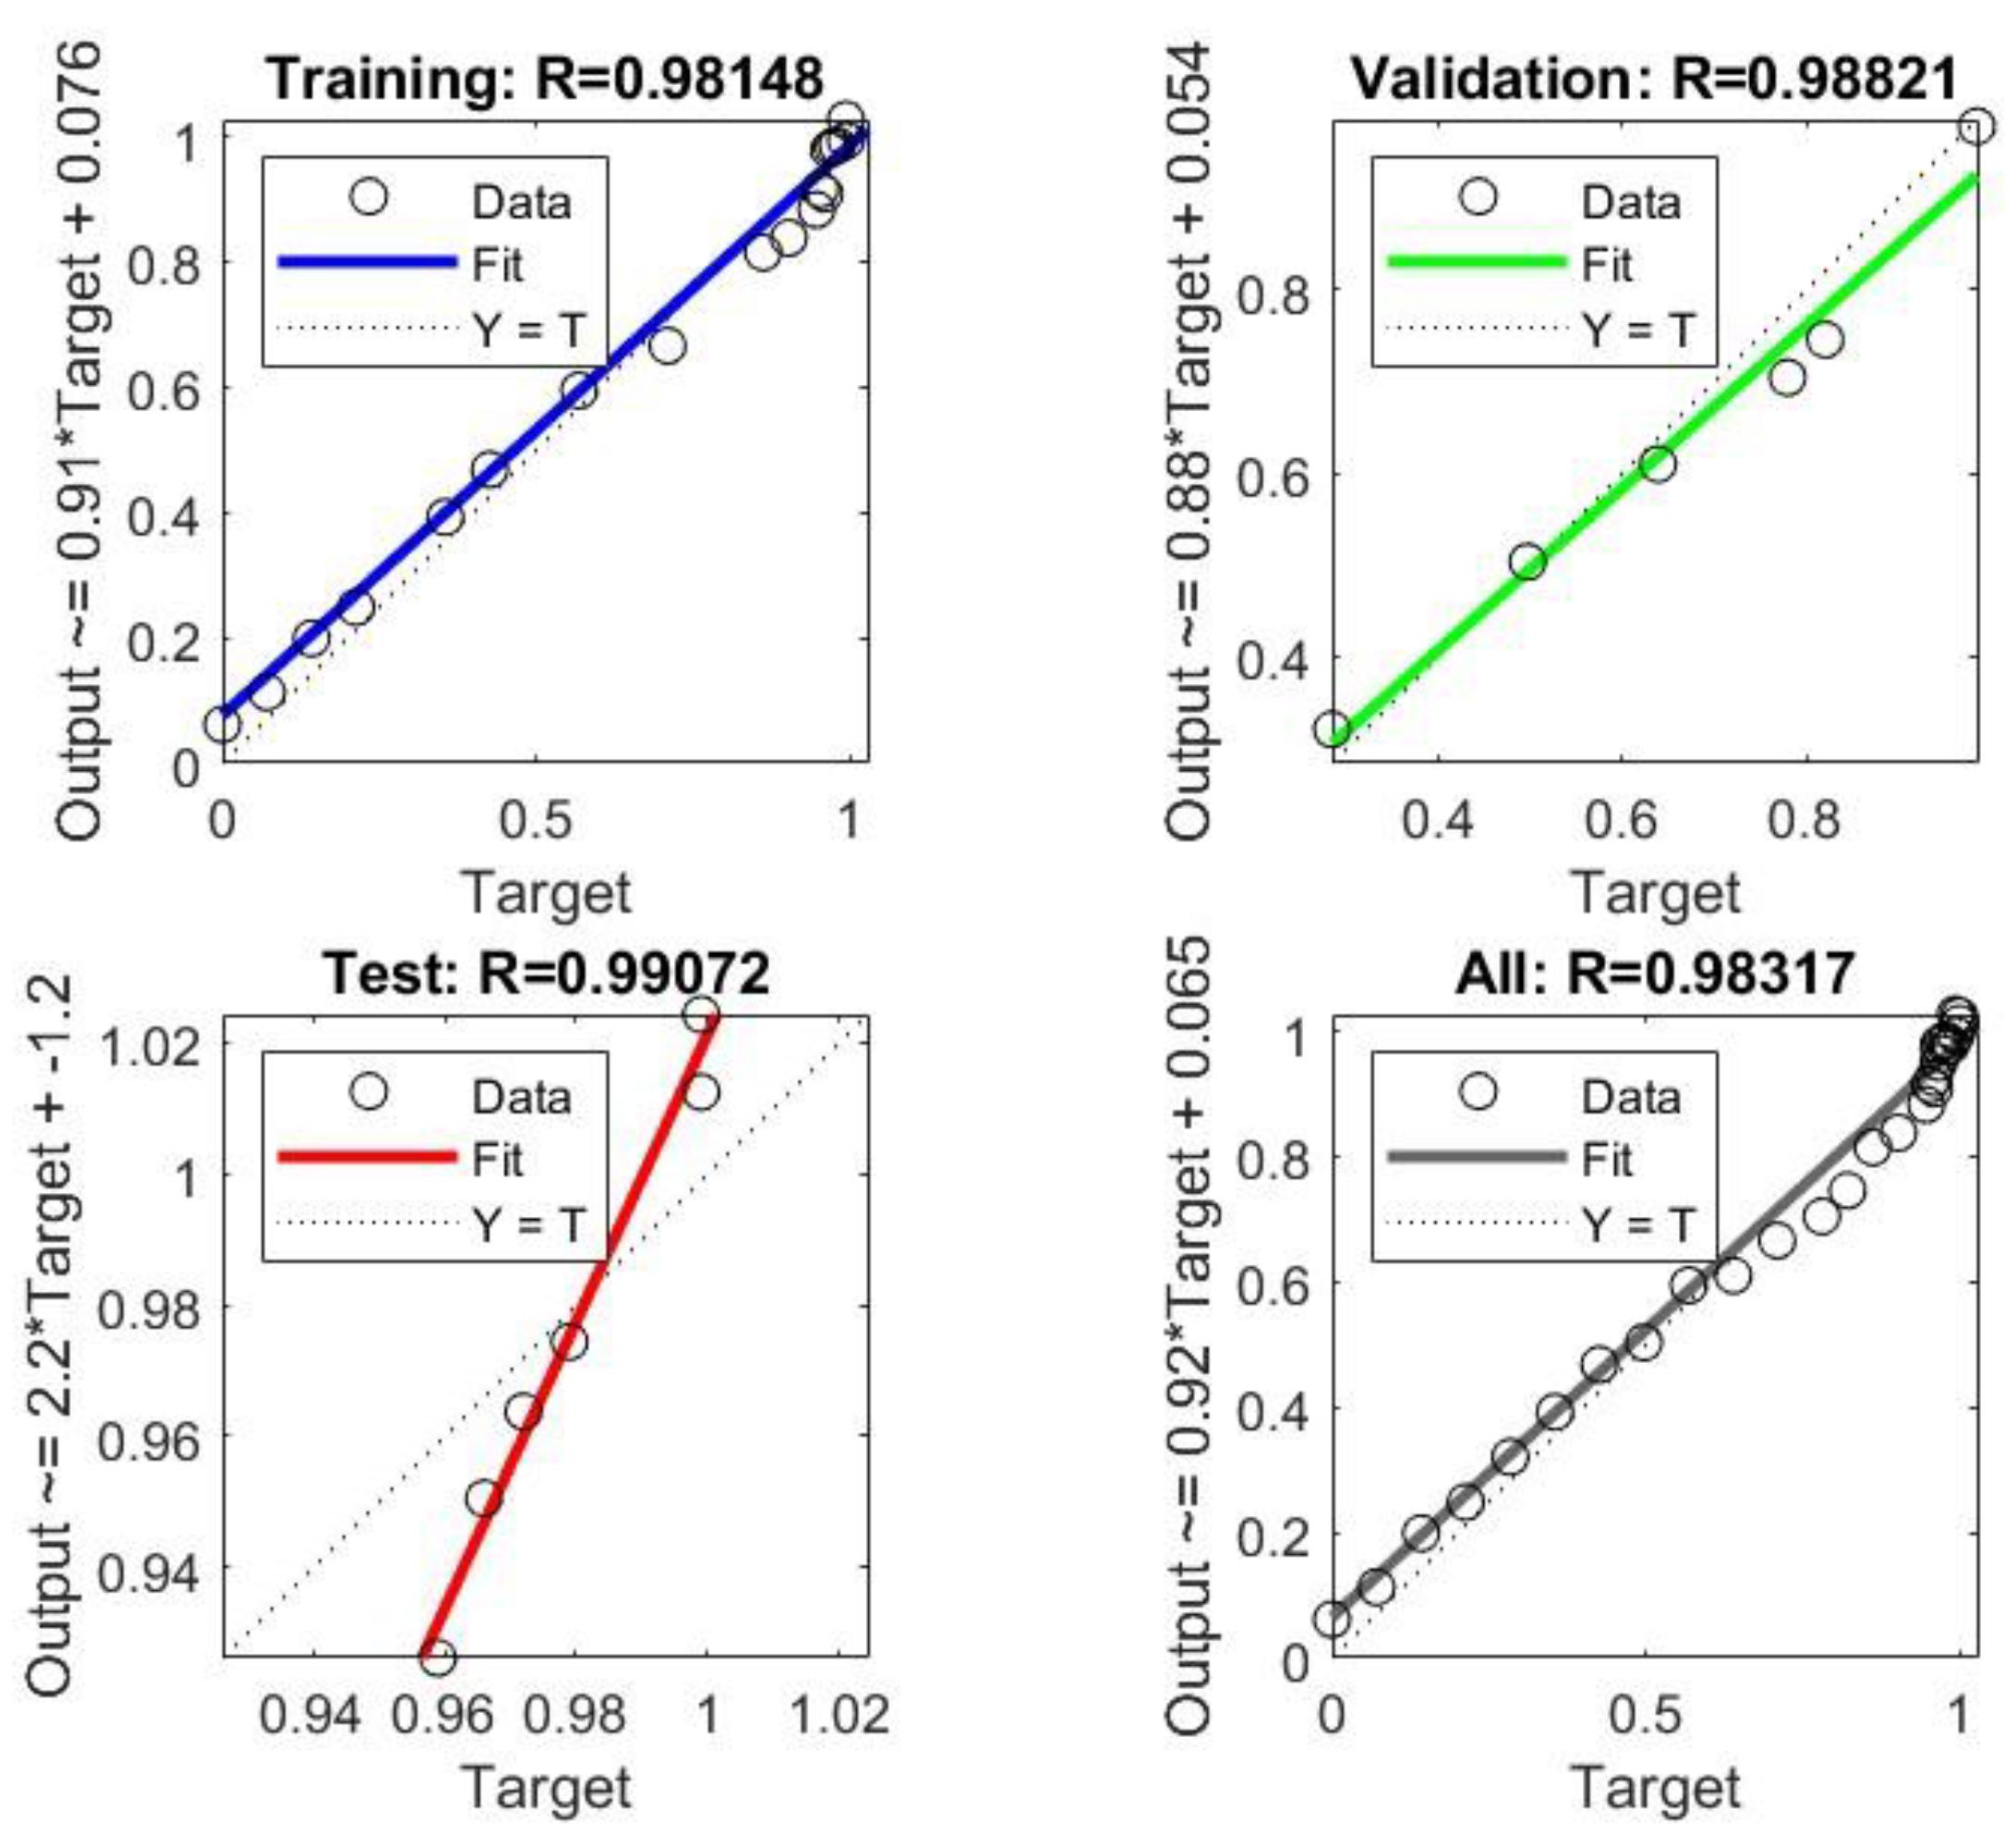
| R2
|
0.9815 |
| Validation |
MSE |
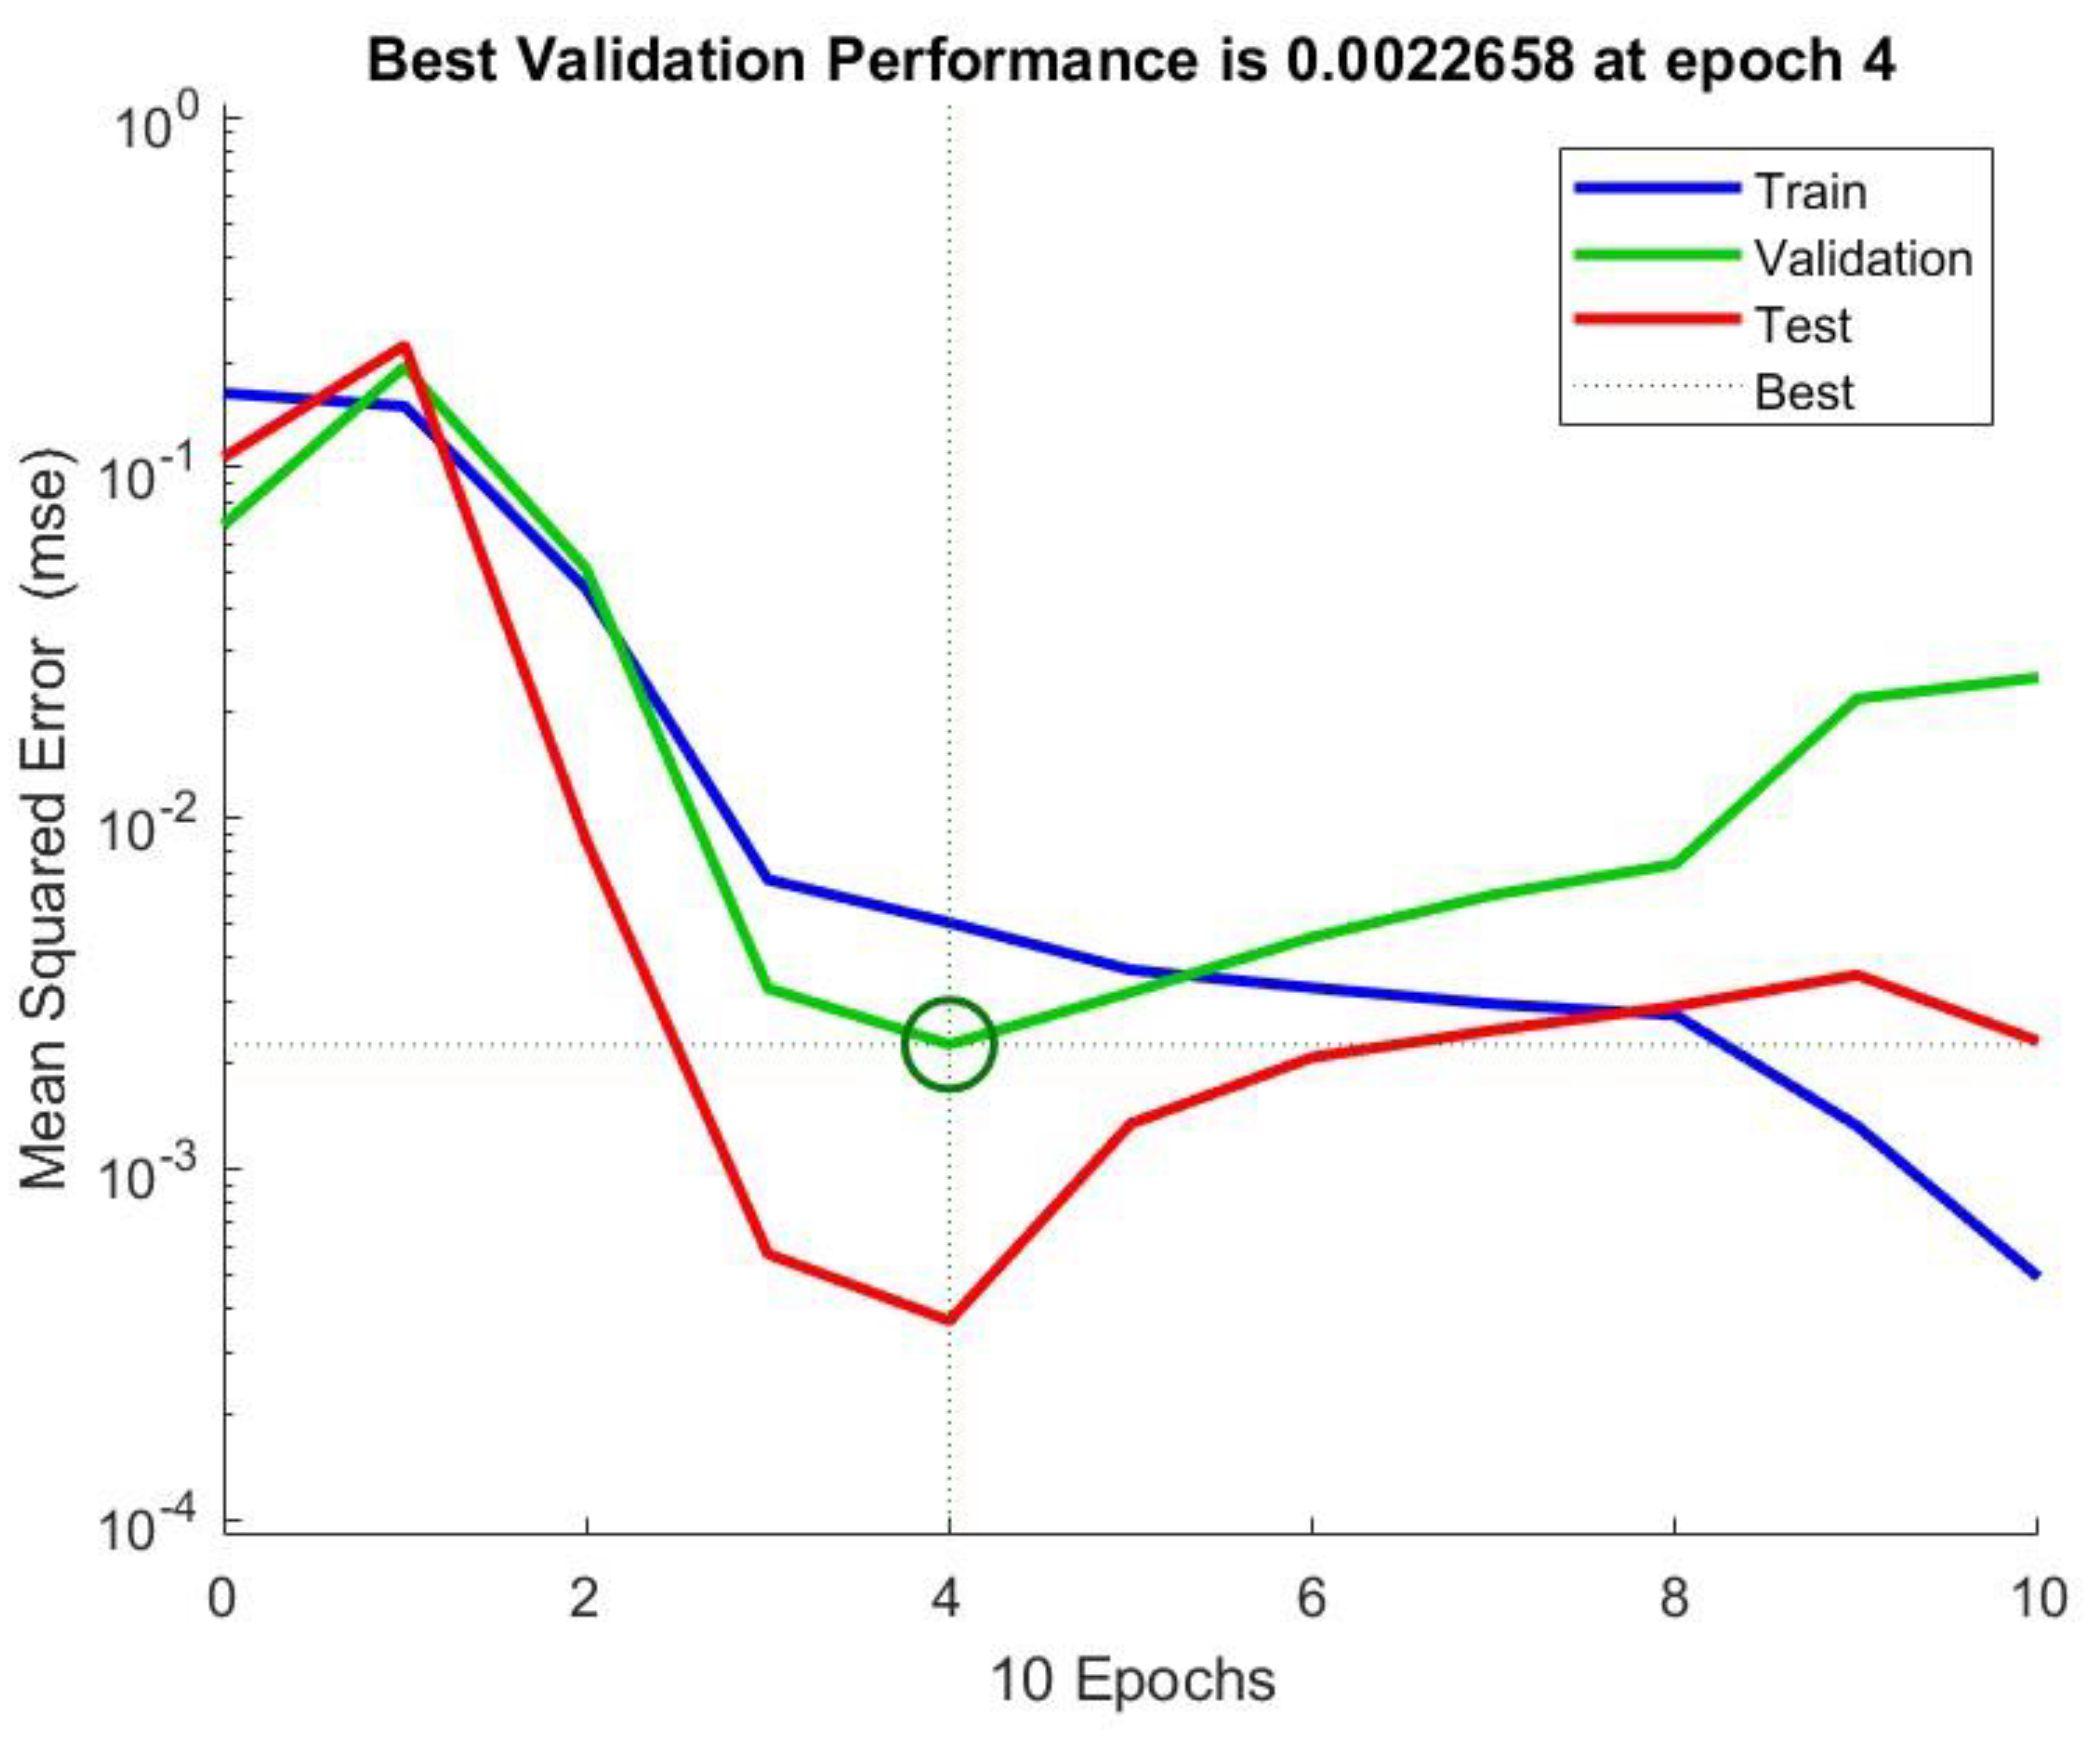
0.0023 |
| R2
|
0.9882 |
| Test |
MSE |
0.0004 |
| R2
|
0.9907 |
- Regression Plots
Figure 1.
DLS ANN model regression plots for training, validation and test data.
Figure 1.
DLS ANN model regression plots for training, validation and test data.
- Performance Plot
Figure 2.
DLS ANN model performance plot.
Figure 2.
DLS ANN model performance plot.
Equation 3.21 predicts the recovery efficiency for a Dissolved Liquid Soap EOR process, with an injection temperature T > 49 °C, flooding heavy crude oil of specific gravity γ, through a reservoir of porosity ∅ and permeability K. Further mathematical modifications could link the economic analysis equations with the recovery efficiency equation, providing clearer insights on the long-term economic viability of a hot DLS injection project in its planning stage.
3.2. Dry Gin ML Results:
3.2.1. ML Training Dataset
Table 3.
DG flooding extrapolated dataset.
Table 3.
DG flooding extrapolated dataset.
| Porosity |
Permeability |
Oil Specific Gravity |
Inj. Temp |
Recovery Efficiency |
| 0.2183 |
88.23 |
0.9542 |
50.0 |
91.89 |
| 0.2022 |
71.31 |
0.9542 |
52.0 |
92.49 |
| 0.2196 |
98.32 |
0.9542 |
54.0 |
93.09 |
| 0.2173 |
86.23 |
0.9542 |
56.0 |
93.69 |
| 0.2086 |
90.67 |
0.9542 |
58.0 |
94.29 |
| 0.2207 |
93.72 |
0.9542 |
60.0 |
94.89 |
| 0.2421 |
89.45 |
0.9542 |
62.0 |
95.29 |
| 0.2231 |
92.76 |
0.9542 |
64.0 |
95.69 |
| 0.2180 |
79.21 |
0.9542 |
66.0 |
95.89 |
| 0.2342 |
87.23 |
0.9542 |
68.0 |
96.09 |
| 0.2178 |
100.33 |
0.9542 |
70.0 |
96.29 |
| 0.2183 |
84.68 |
0.9542 |
72.0 |
96.39 |
| 0.2346 |
75.98 |
0.9542 |
74.0 |
96.49 |
| 0.2239 |
77.87 |
0.9542 |
76.0 |
96.59 |
| 0.2180 |
85.67 |
0.9542 |
78.0 |
96.69 |
| 0.2004 |
60.28 |
0.9542 |
80.0 |
96.36 |
| 0.2154 |
82.17 |
0.9542 |
82.0 |
96.46 |
| 0.2265 |
92.68 |
0.9542 |
84.0 |
96.56 |
| 0.2237 |
93.44 |
0.9542 |
86.0 |
96.56 |
| 0.2098 |
69.33 |
0.9542 |
88.0 |
96.66 |
| 0.2147 |
80.44 |
0.9542 |
90.0 |
96.66 |
| 0.2432 |
79.26 |
0.9542 |
92.0 |
96.76 |
| 0.2167 |
75.44 |
0.9542 |
94.0 |
96.76 |
| 0.2259 |
78.99 |
0.9542 |
96.0 |
96.86 |
| 0.2125 |
79.22 |
0.9542 |
98.0 |
96.86 |
| 0.2199 |
77.54 |
0.9542 |
100.0 |
96.96 |
| 0.2165 |
80.37 |
0.9542 |
105.0 |
97.06 |
| 0.2232 |
85.34 |
0.9542 |
110.0 |
97.16 |
| 0.2024 |
67.98 |
0.9542 |
115.0 |
97.26 |
| 0.2123 |
86.25 |
0.9542 |
120.0 |
97.36 |
| 0.2098 |
67.54 |
0.9542 |
125.0 |
97.46 |
| 0.2108 |
79.21 |
0.9542 |
130.0 |
97.56 |
3.2.2. Training Results
Table 4.
DG ANN parameters summary.
Table 4.
DG ANN parameters summary.
| Data Division |
Random |
| Model |
Levenberg Marquardt |
| Input layer size |
4 |
| Hidden layer size |
3 |
| Output layer size |
1 |
| Training |
MSE |
0.0031 |
| R2
|
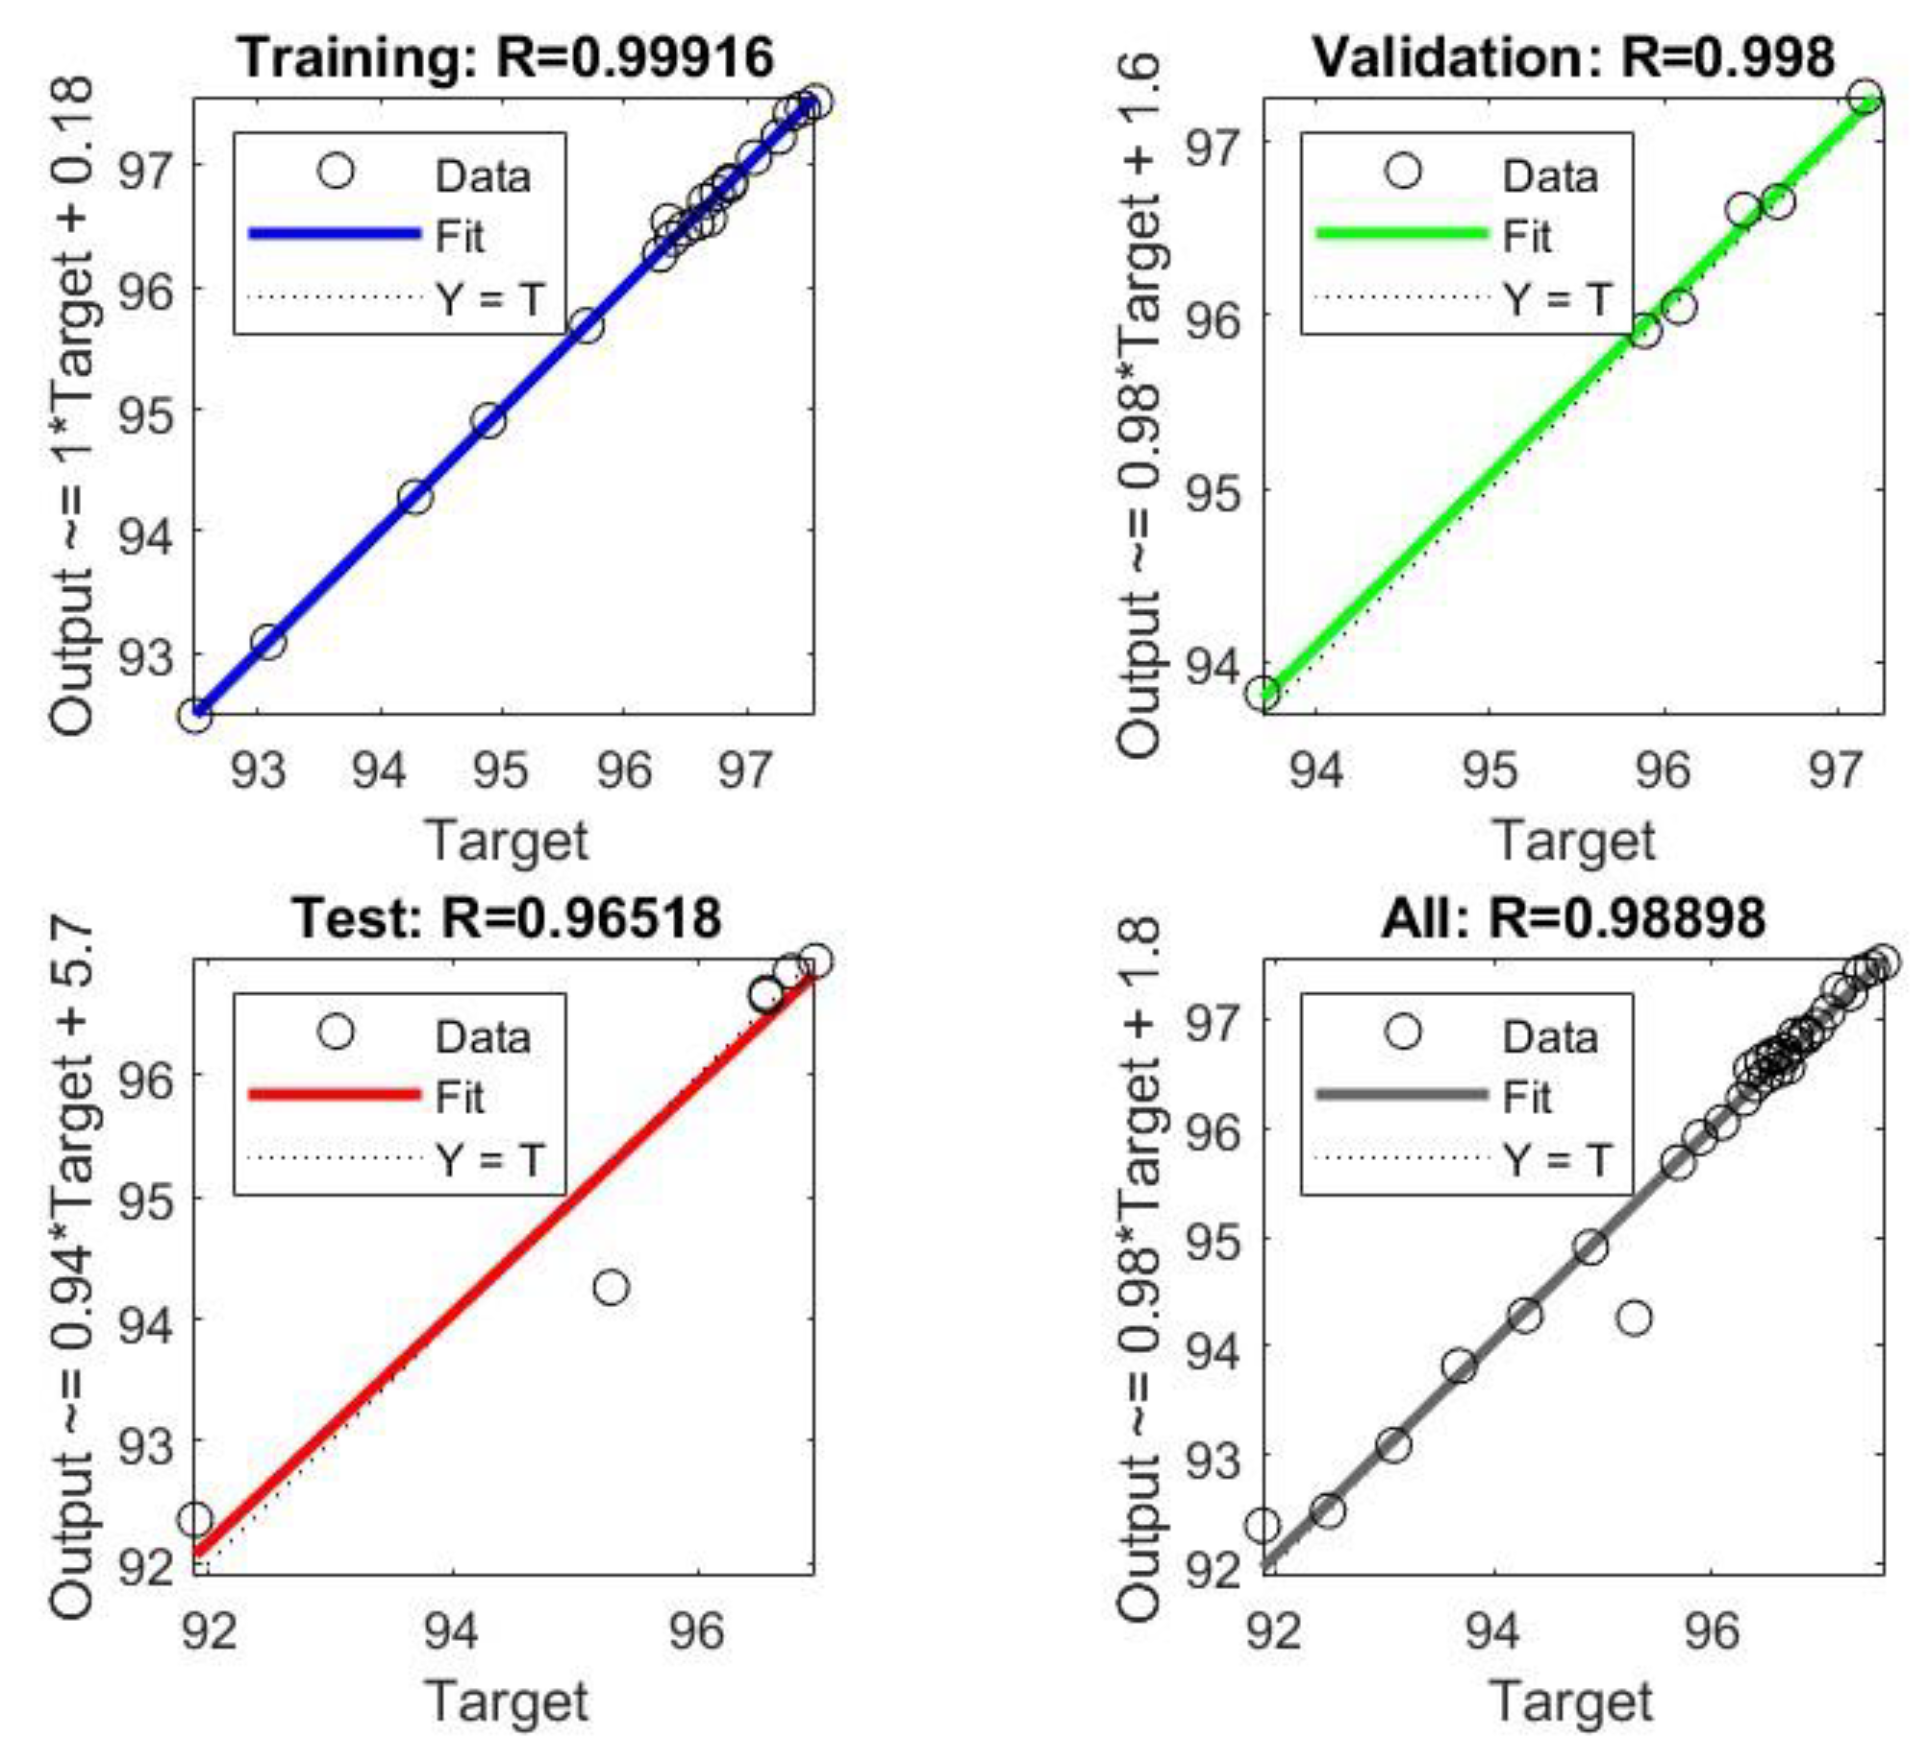
0.9992 |
| Validation |
MSE |
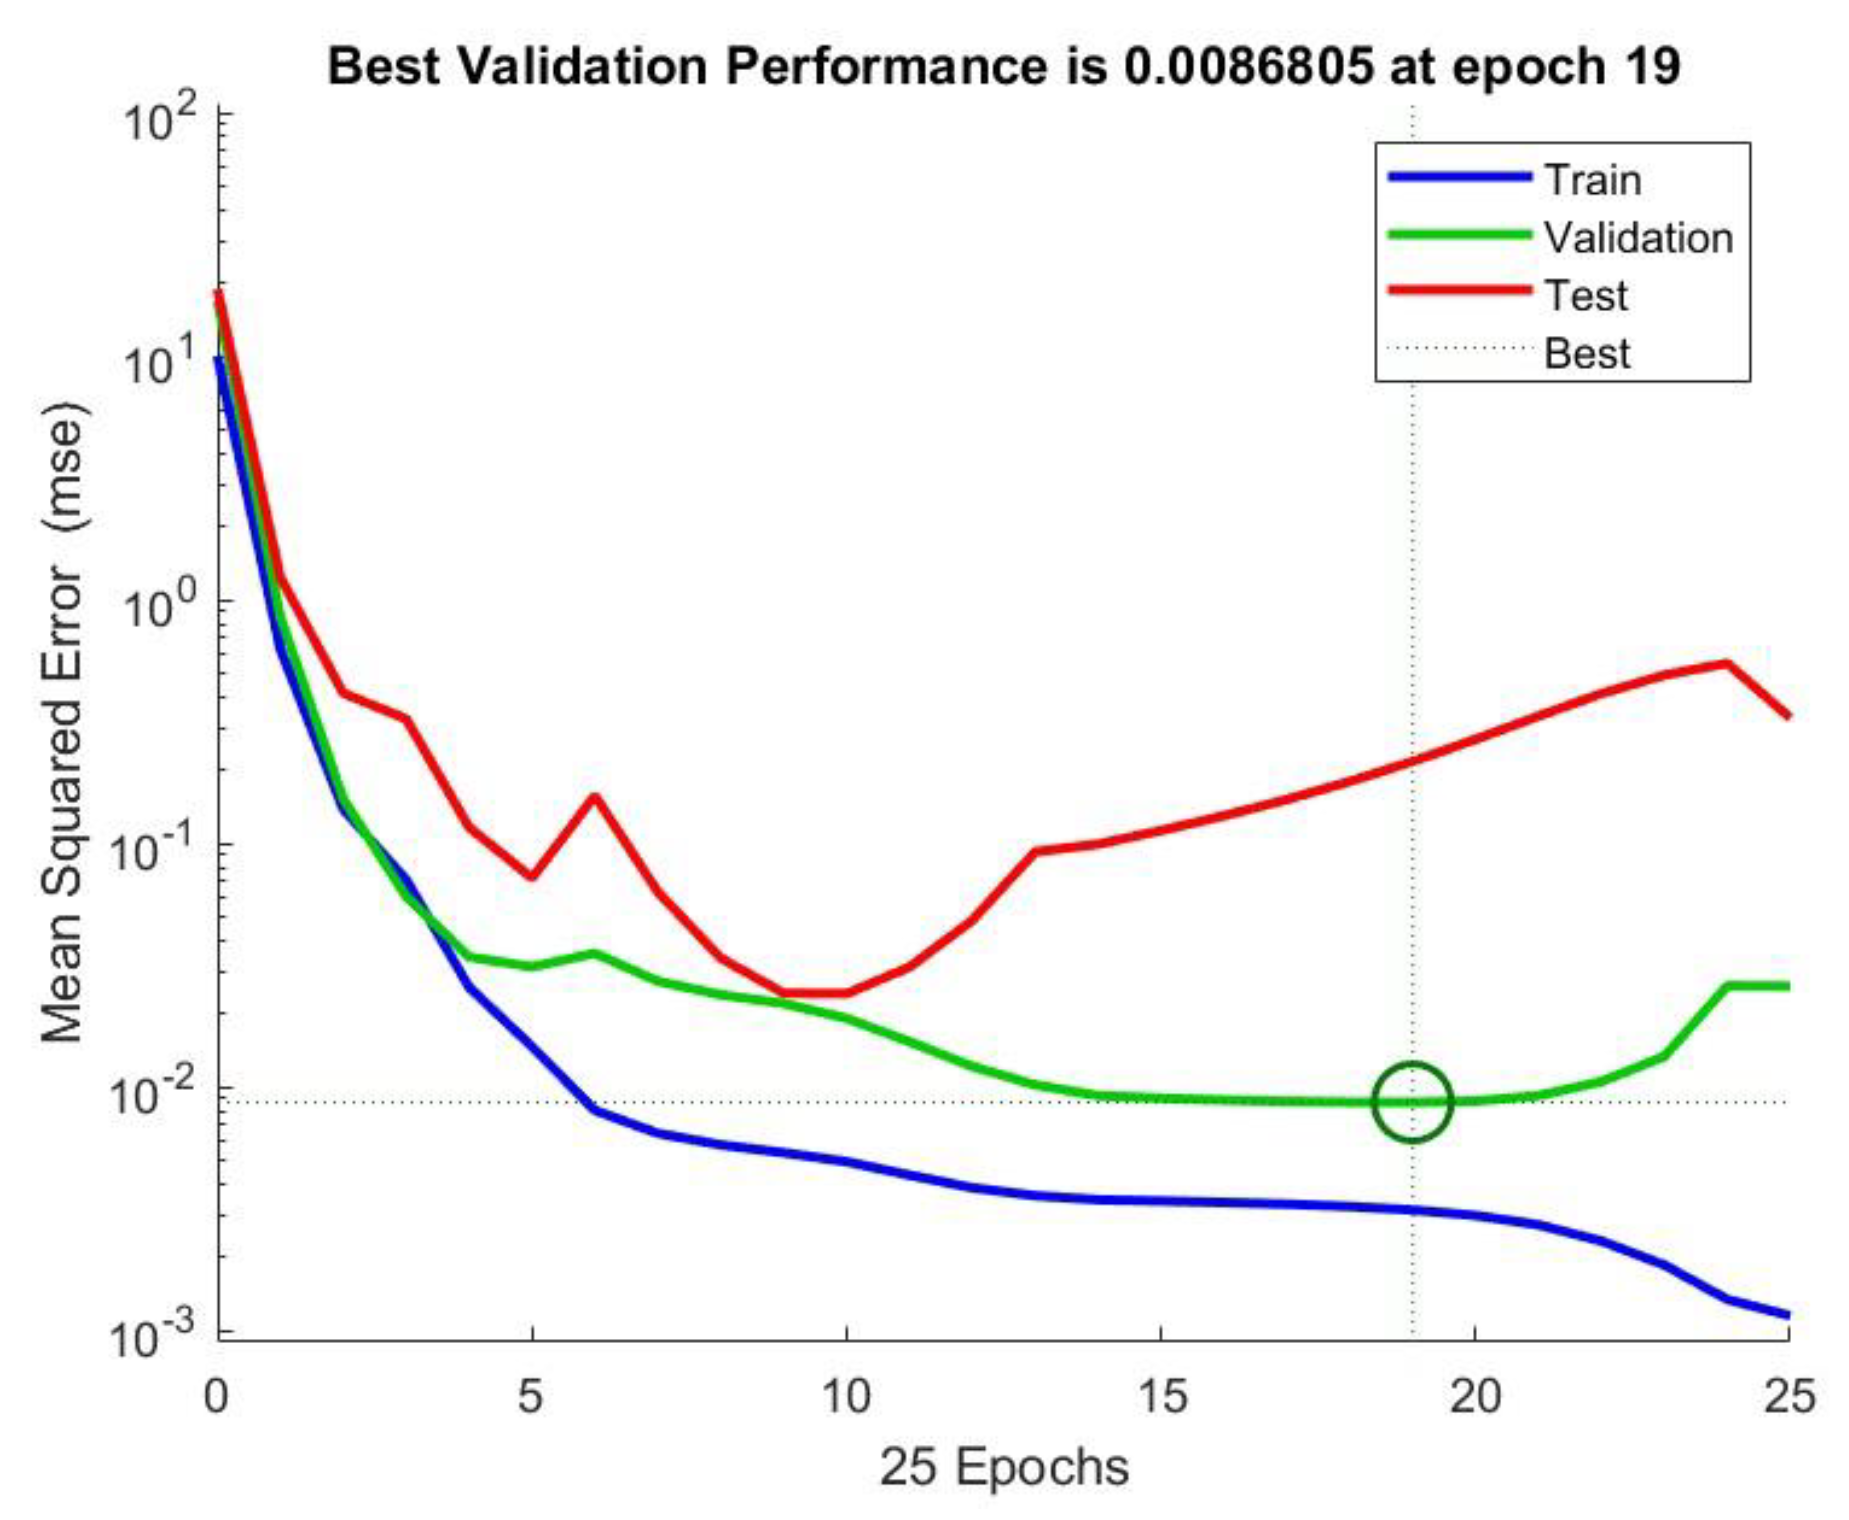
0.0087 |
| R2
|
0.9980 |
| Test |
MSE |
0.2181 |
| R2
|
0.9652 |
- Regression Plots
Figure 3.
DG ANN model regression plots for training, validation and test data.
Figure 3.
DG ANN model regression plots for training, validation and test data.
- Performance Plot
Figure 24.
DLS ANN model performance plot.
Figure 24.
DLS ANN model performance plot.
Equation 3.22 predicts the recovery efficiency for a Dry Gin EOR process, with an injection temperature T > 49 °C, flooding heavy crude oil of specific gravity γ, through a reservoir of porosity ∅ and permeability K.
3.3. Scent Leaf Extract ML Results:
3.3.1. ML Training Dataset
Table 5.
DG flooding extrapolated dataset.
Table 5.
DG flooding extrapolated dataset.
| Porosity |
Permeability |
Oil Specific Gravity |
Inj. Temp |
Recovery Efficiency |
| 0.2183 |
88.23 |
0.9542 |
50.0 |
85.99 |
| 0.2022 |
71.31 |
0.9542 |
52.0 |
86.70 |
| 0.2196 |
98.32 |
0.9542 |
54.0 |
87.41 |
| 0.2173 |
86.23 |
0.9542 |
56.0 |
88.12 |
| 0.2086 |
90.67 |
0.9542 |
58.0 |
88.83 |
| 0.2207 |
93.72 |
0.9542 |
60.0 |
89.54 |
| 0.2421 |
89.45 |
0.9542 |
62.0 |
90.25 |
| 0.2231 |
92.76 |
0.9542 |
64.0 |
90.76 |
| 0.2180 |
79.21 |
0.9542 |
66.0 |
91.27 |
| 0.2342 |
87.23 |
0.9542 |
68.0 |
91.57 |
| 0.2178 |
100.33 |
0.9542 |
70.0 |
91.87 |
| 0.2183 |
84.68 |
0.9542 |
72.0 |
92.07 |
| 0.2346 |
75.98 |
0.9542 |
74.0 |
92.27 |
| 0.2239 |
77.87 |
0.9542 |
76.0 |
92.37 |
| 0.2180 |
85.67 |
0.9542 |
78.0 |
92.47 |
| 0.2004 |
60.28 |
0.9542 |
80.0 |
93.00 |
| 0.2154 |
82.17 |
0.9542 |
82.0 |
92.57 |
| 0.2265 |
92.68 |
0.9542 |
84.0 |
92.67 |
| 0.2237 |
93.44 |
0.9542 |
86.0 |
92.77 |
| 0.2098 |
69.33 |
0.9542 |
88.0 |
92.77 |
| 0.2147 |
80.44 |
0.9542 |
90.0 |
92.87 |
| 0.2432 |
79.26 |
0.9542 |
92.0 |
92.87 |
| 0.2167 |
75.44 |
0.9542 |
94.0 |
92.97 |
| 0.2259 |
78.99 |
0.9542 |
96.0 |
92.97 |
| 0.2125 |
79.22 |
0.9542 |
98.0 |
93.07 |
| 0.2199 |
77.54 |
0.9542 |
100.0 |
93.07 |
| 0.2165 |
80.37 |
0.9542 |
105.0 |
93.17 |
| 0.2232 |
85.34 |
0.9542 |
110.0 |
93.27 |
| 0.2024 |
67.98 |
0.9542 |
115.0 |
93.37 |
| 0.2123 |
86.25 |
0.9542 |
120.0 |
93.47 |
| 0.2098 |
67.54 |
0.9542 |
125.0 |
93.57 |
| 0.2108 |
79.21 |
0.9542 |
130.0 |
93.67 |
3.3.2. Training Results
Table 6.
SLE ANN parameters summary.
Table 6.
SLE ANN parameters summary.
| Data Division |
Random |
| Model |
Levenberg Marquardt |
| Input layer size |
4 |
| Hidden layer size |
3 |
| Output layer size |
1 |
| Training |
MSE |
0.0024 |
| R2
|
0.9991 |
| Validation |
MSE |
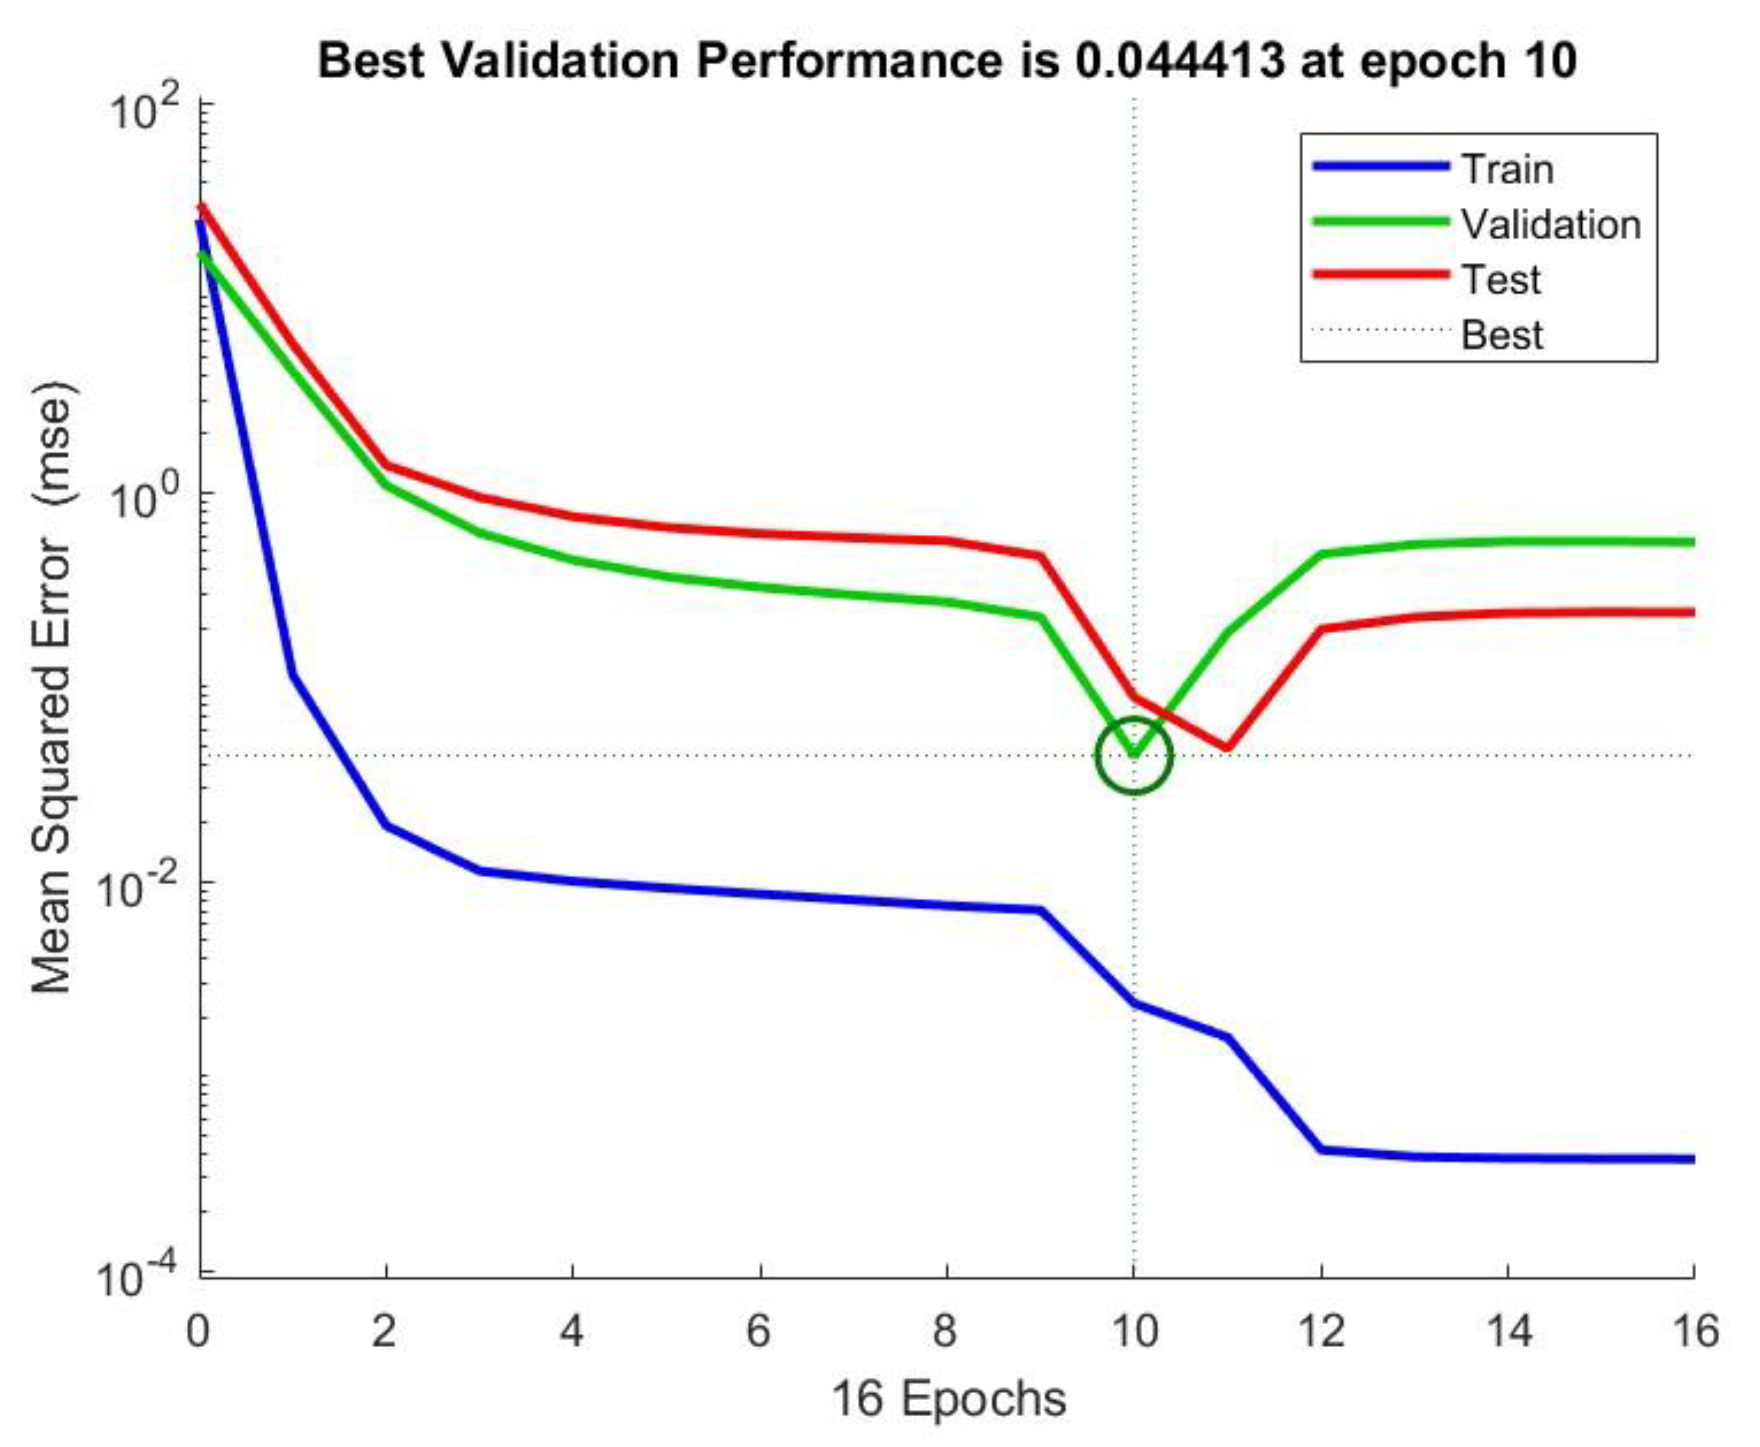
0.0444 |
| R2
|
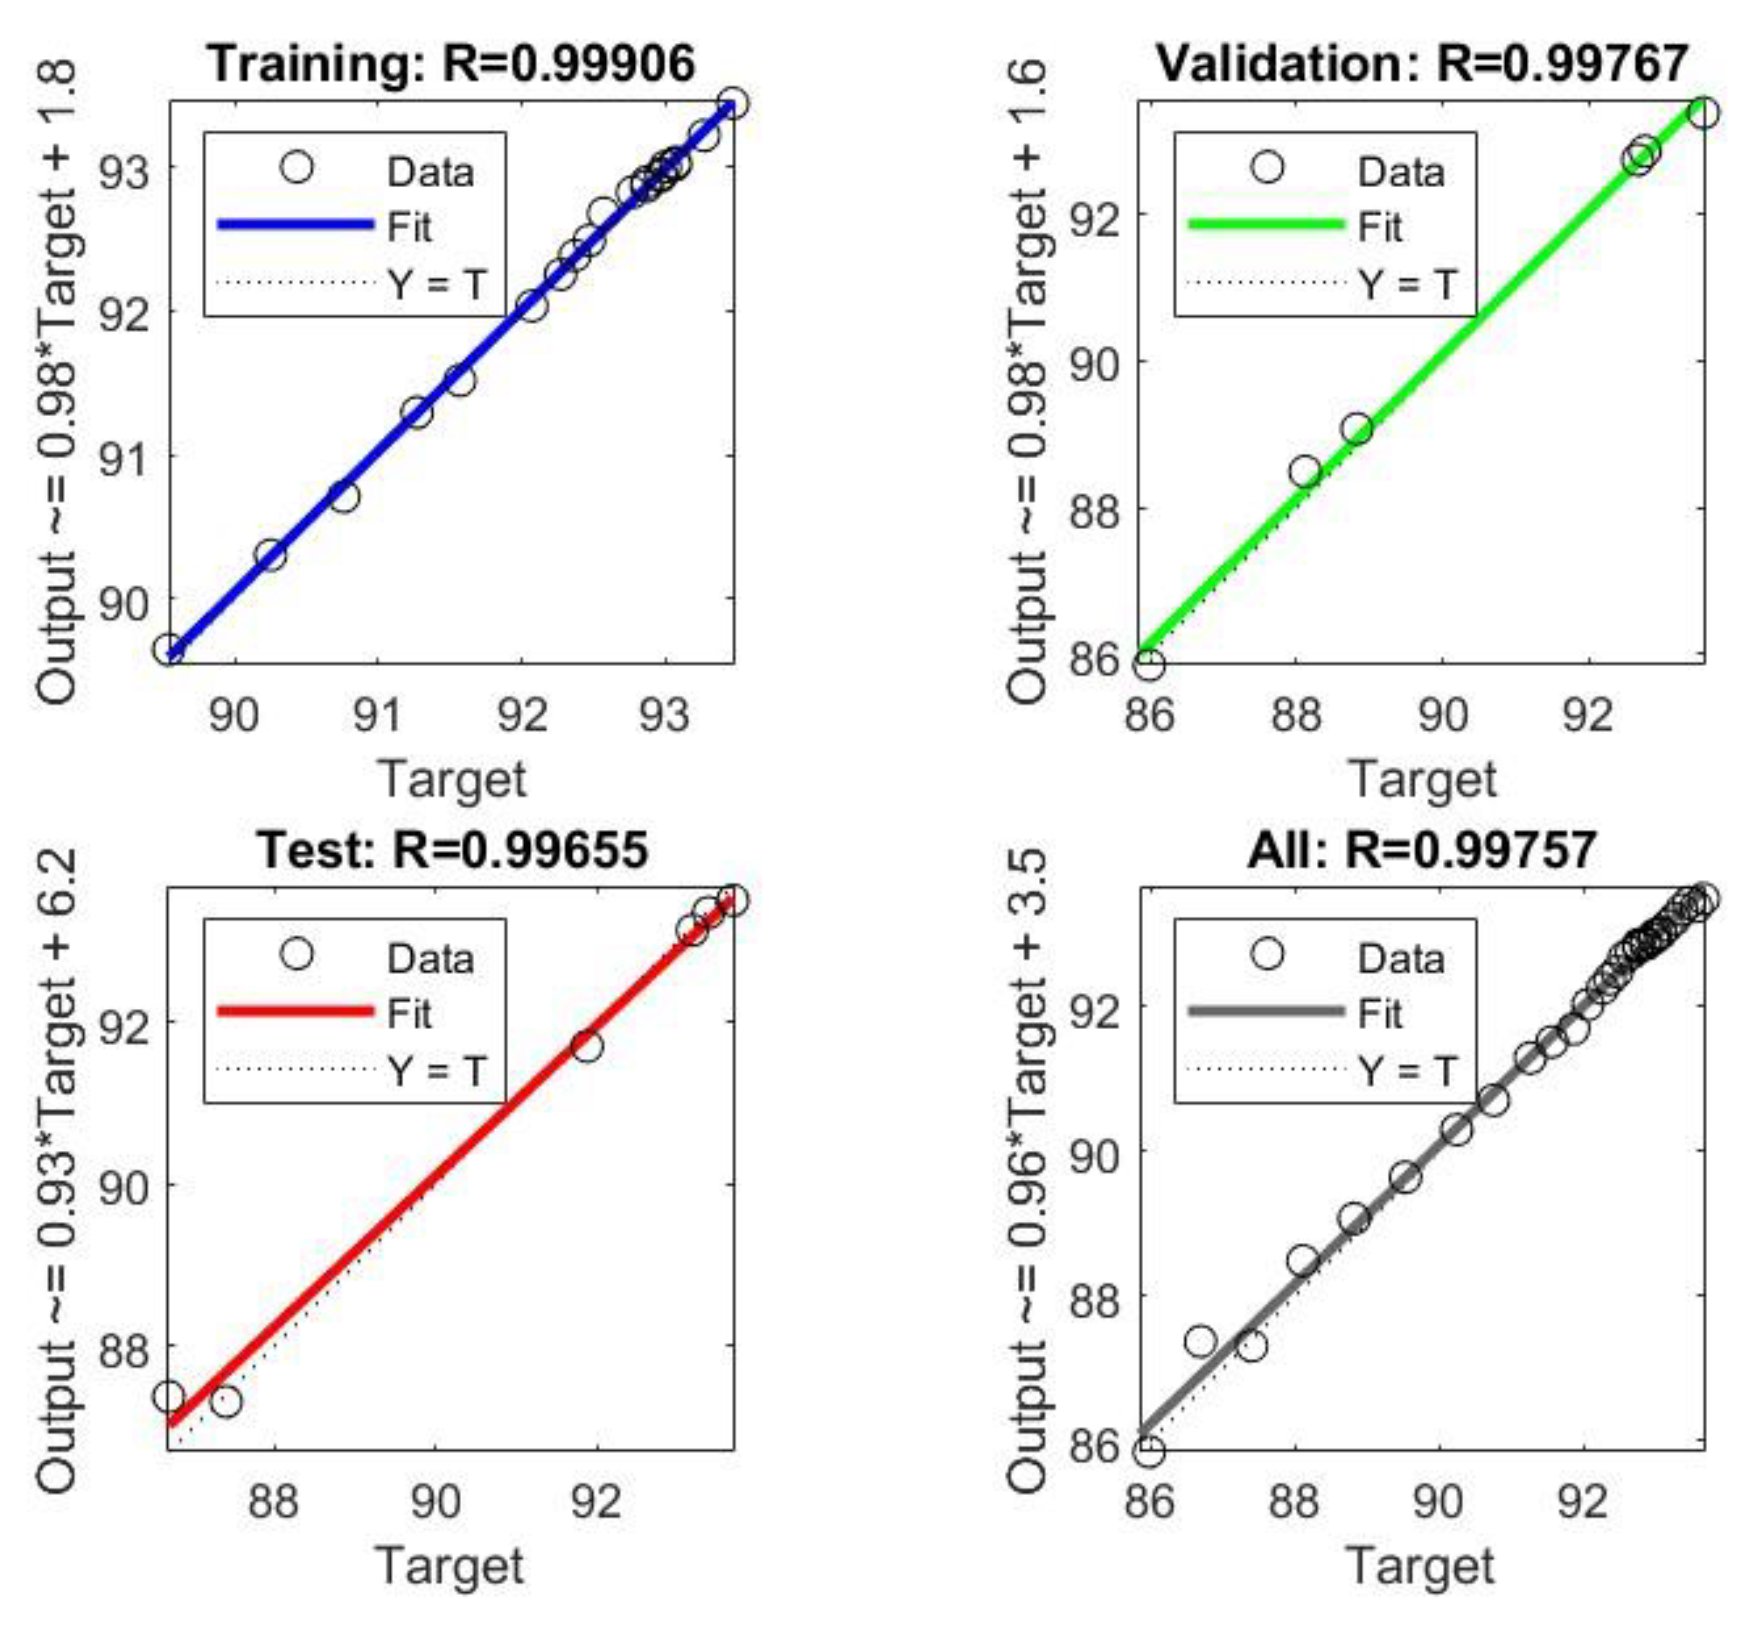
0.9977 |
| Test |
MSE |
0.0887 |
| R2
|
0.9965 |
- Regression Plots
Figure 4.
DG ANN model regression plots for training, validation and test data.
Figure 4.
DG ANN model regression plots for training, validation and test data.
- Performance Plot
Figure 5.
DLS ANN model performance plot.
Figure 5.
DLS ANN model performance plot.
Equation 3.23 predicts the recovery efficiency for a scent leaf extract EOR process, with an injection temperature T > 49 °C, flooding heavy crude oil of specific gravity γ, through a reservoir of porosity ∅ and permeability K.
3.4. DPFA ML Results:
3.4.1. ML Training Dataset
Table 7.
DPFA flooding extrapolated dataset.
Table 7.
DPFA flooding extrapolated dataset.
| Porosity |
Permeability |
Oil Specific Gravity |
Inj. Temp |
Recovery Efficiency |
| 0.2183 |
88.23 |
0.9542 |
50.0 |
84.19 |
| 0.2022 |
71.31 |
0.9542 |
52.0 |
85.10 |
| 0.2196 |
98.32 |
0.9542 |
54.0 |
86.01 |
| 0.2173 |
86.23 |
0.9542 |
56.0 |
86.92 |
| 0.2086 |
90.67 |
0.9542 |
58.0 |
87.83 |
| 0.2207 |
93.72 |
0.9542 |
60.0 |
88.74 |
| 0.2421 |
89.45 |
0.9542 |
62.0 |
89.45 |
| 0.2231 |
92.76 |
0.9542 |
64.0 |
90.16 |
| 0.2180 |
79.21 |
0.9542 |
66.0 |
90.66 |
| 0.2342 |
87.23 |
0.9542 |
68.0 |
91.16 |
| 0.2178 |
100.33 |
0.9542 |
70.0 |
91.46 |
| 0.2183 |
84.68 |
0.9542 |
72.0 |
91.76 |
| 0.2346 |
75.98 |
0.9542 |
74.0 |
91.96 |
| 0.2239 |
77.87 |
0.9542 |
76.0 |
92.06 |
| 0.2180 |
85.67 |
0.9542 |
78.0 |
92.16 |
| 0.2004 |
60.28 |
0.9542 |
80.0 |
92.30 |
| 0.2154 |
82.17 |
0.9542 |
82.0 |
92.26 |
| 0.2265 |
92.68 |
0.9542 |
84.0 |
92.36 |
| 0.2237 |
93.44 |
0.9542 |
86.0 |
92.46 |
| 0.2098 |
69.33 |
0.9542 |
88.0 |
92.46 |
| 0.2147 |
80.44 |
0.9542 |
90.0 |
92.56 |
| 0.2432 |
79.26 |
0.9542 |
92.0 |
92.56 |
| 0.2167 |
75.44 |
0.9542 |
94.0 |
92.66 |
| 0.2259 |
78.99 |
0.9542 |
96.0 |
92.66 |
| 0.2125 |
79.22 |
0.9542 |
98.0 |
92.76 |
| 0.2199 |
77.54 |
0.9542 |
100.0 |
92.76 |
| 0.2165 |
80.37 |
0.9542 |
105.0 |
92.86 |
| 0.2232 |
85.34 |
0.9542 |
110.0 |
92.96 |
| 0.2024 |
67.98 |
0.9542 |
115.0 |
93.06 |
| 0.2123 |
86.25 |
0.9542 |
120.0 |
93.16 |
| 0.2098 |
67.54 |
0.9542 |
125.0 |
93.26 |
| 0.2108 |
79.21 |
0.9542 |
130.0 |
93.36 |
3.4.2. Training Results
Table 8.
DPFA ANN parameters summary.
Table 8.
DPFA ANN parameters summary.
| Data Division |
Random |
| Model |
Levenberg Marquardt |
| Input layer size |
4 |
| Hidden layer size |
3 |
| Output layer size |
1 |
| Training |
MSE |
0.0179 |
| R2
|
0.9993 |
| Validation |
MSE |
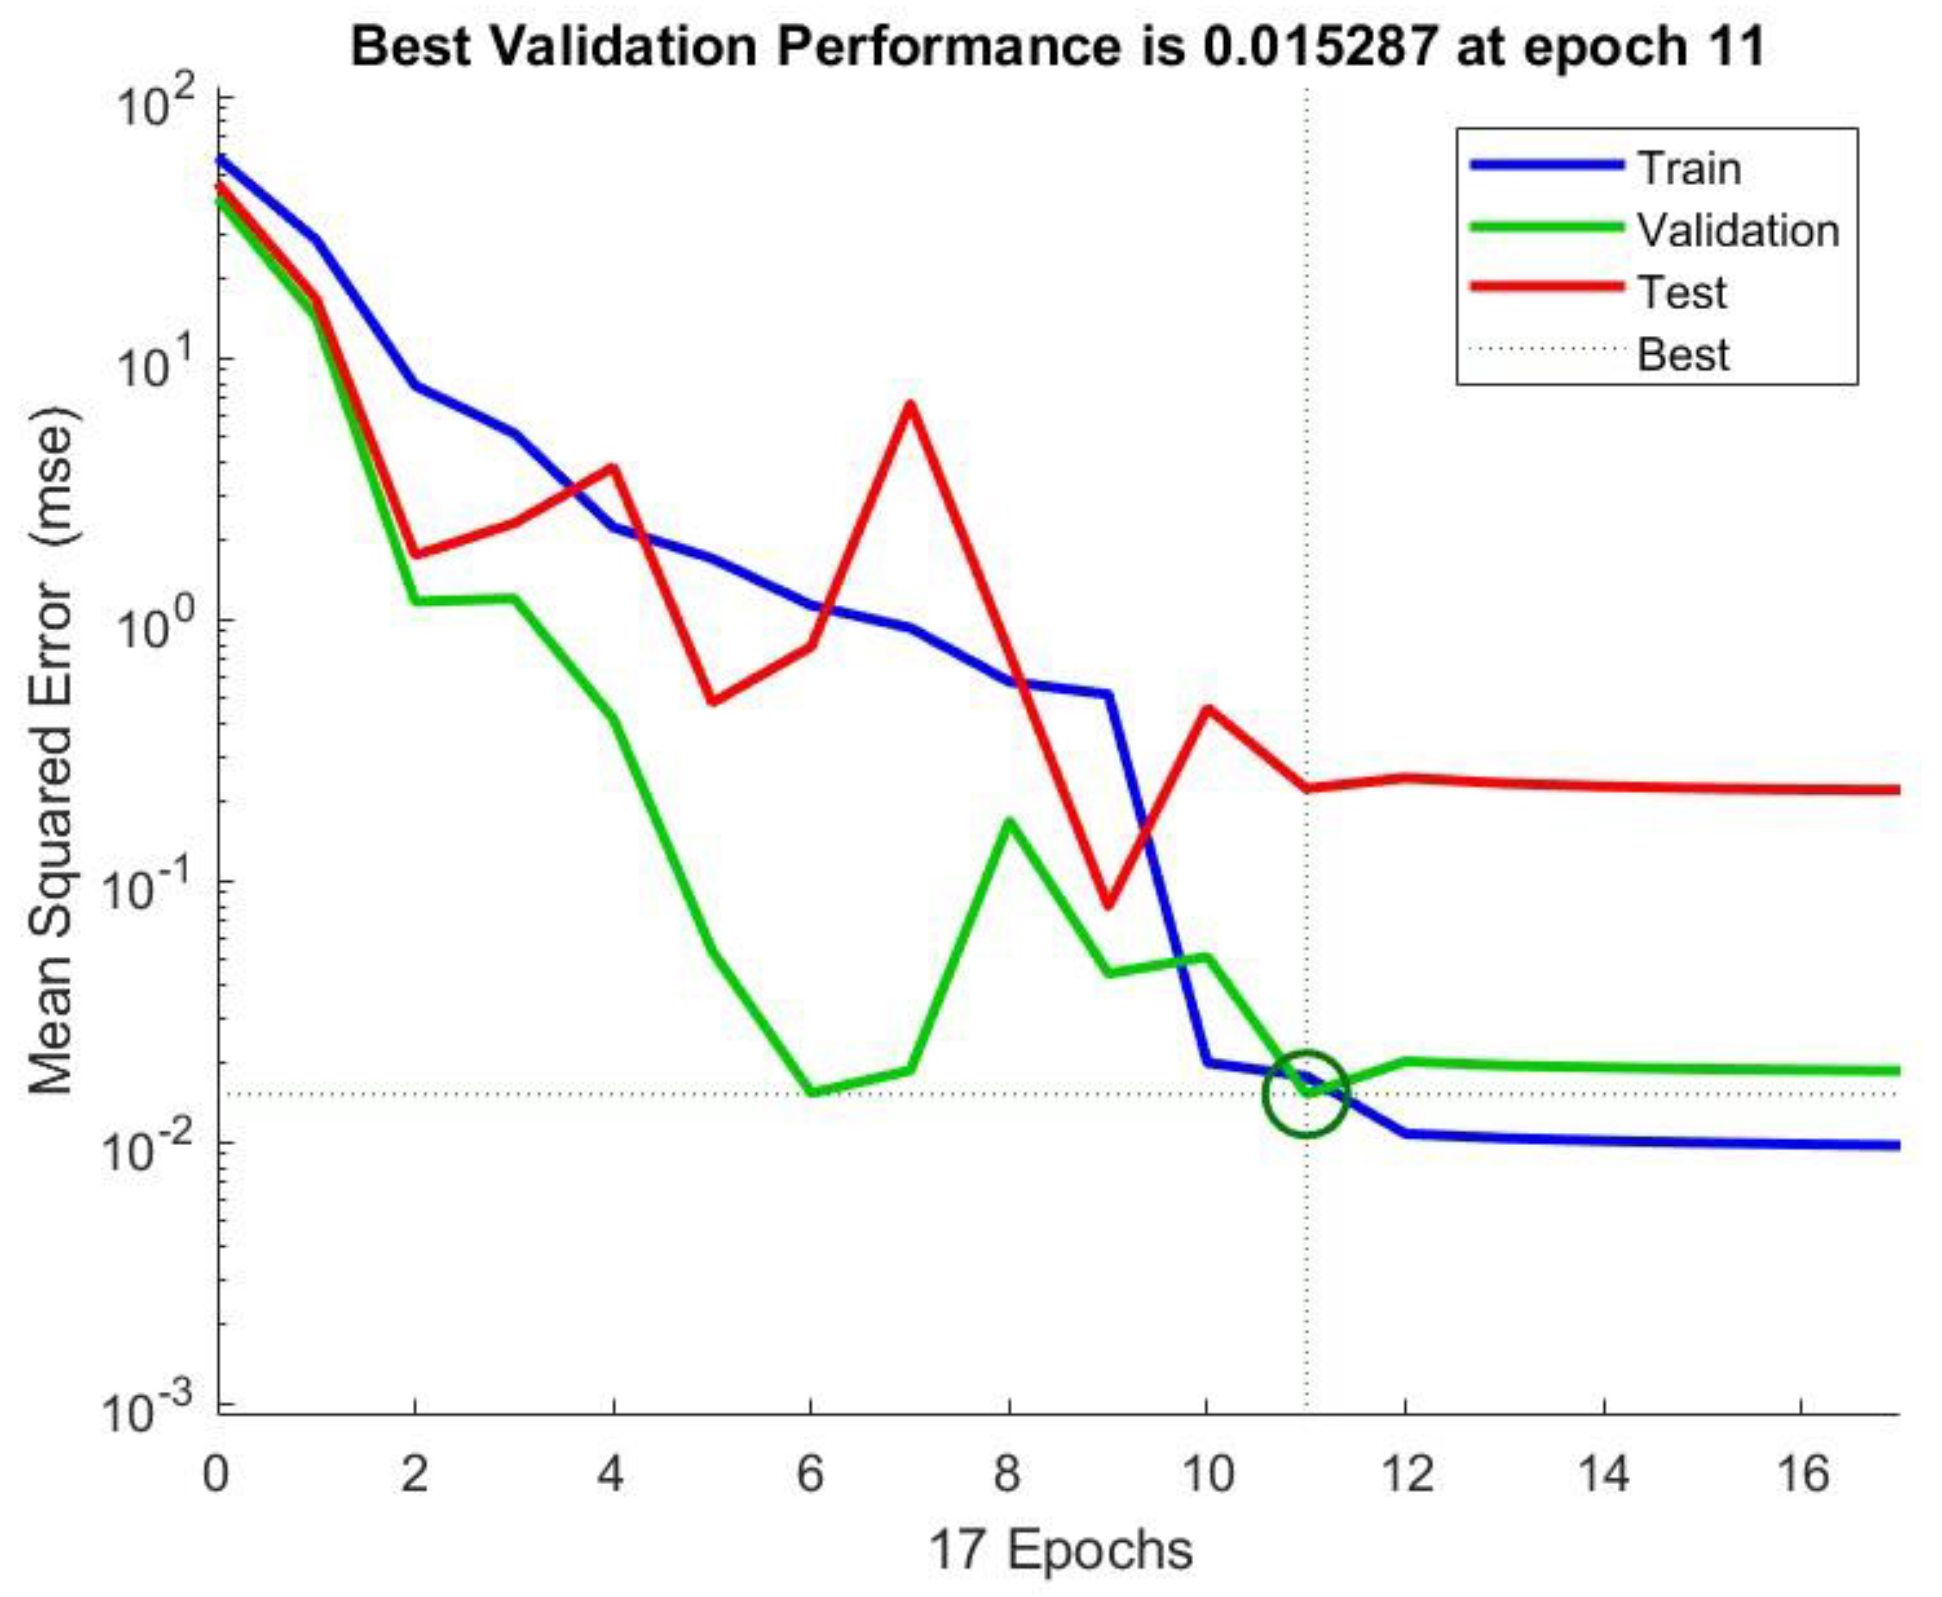
0.0153 |
| R2
|
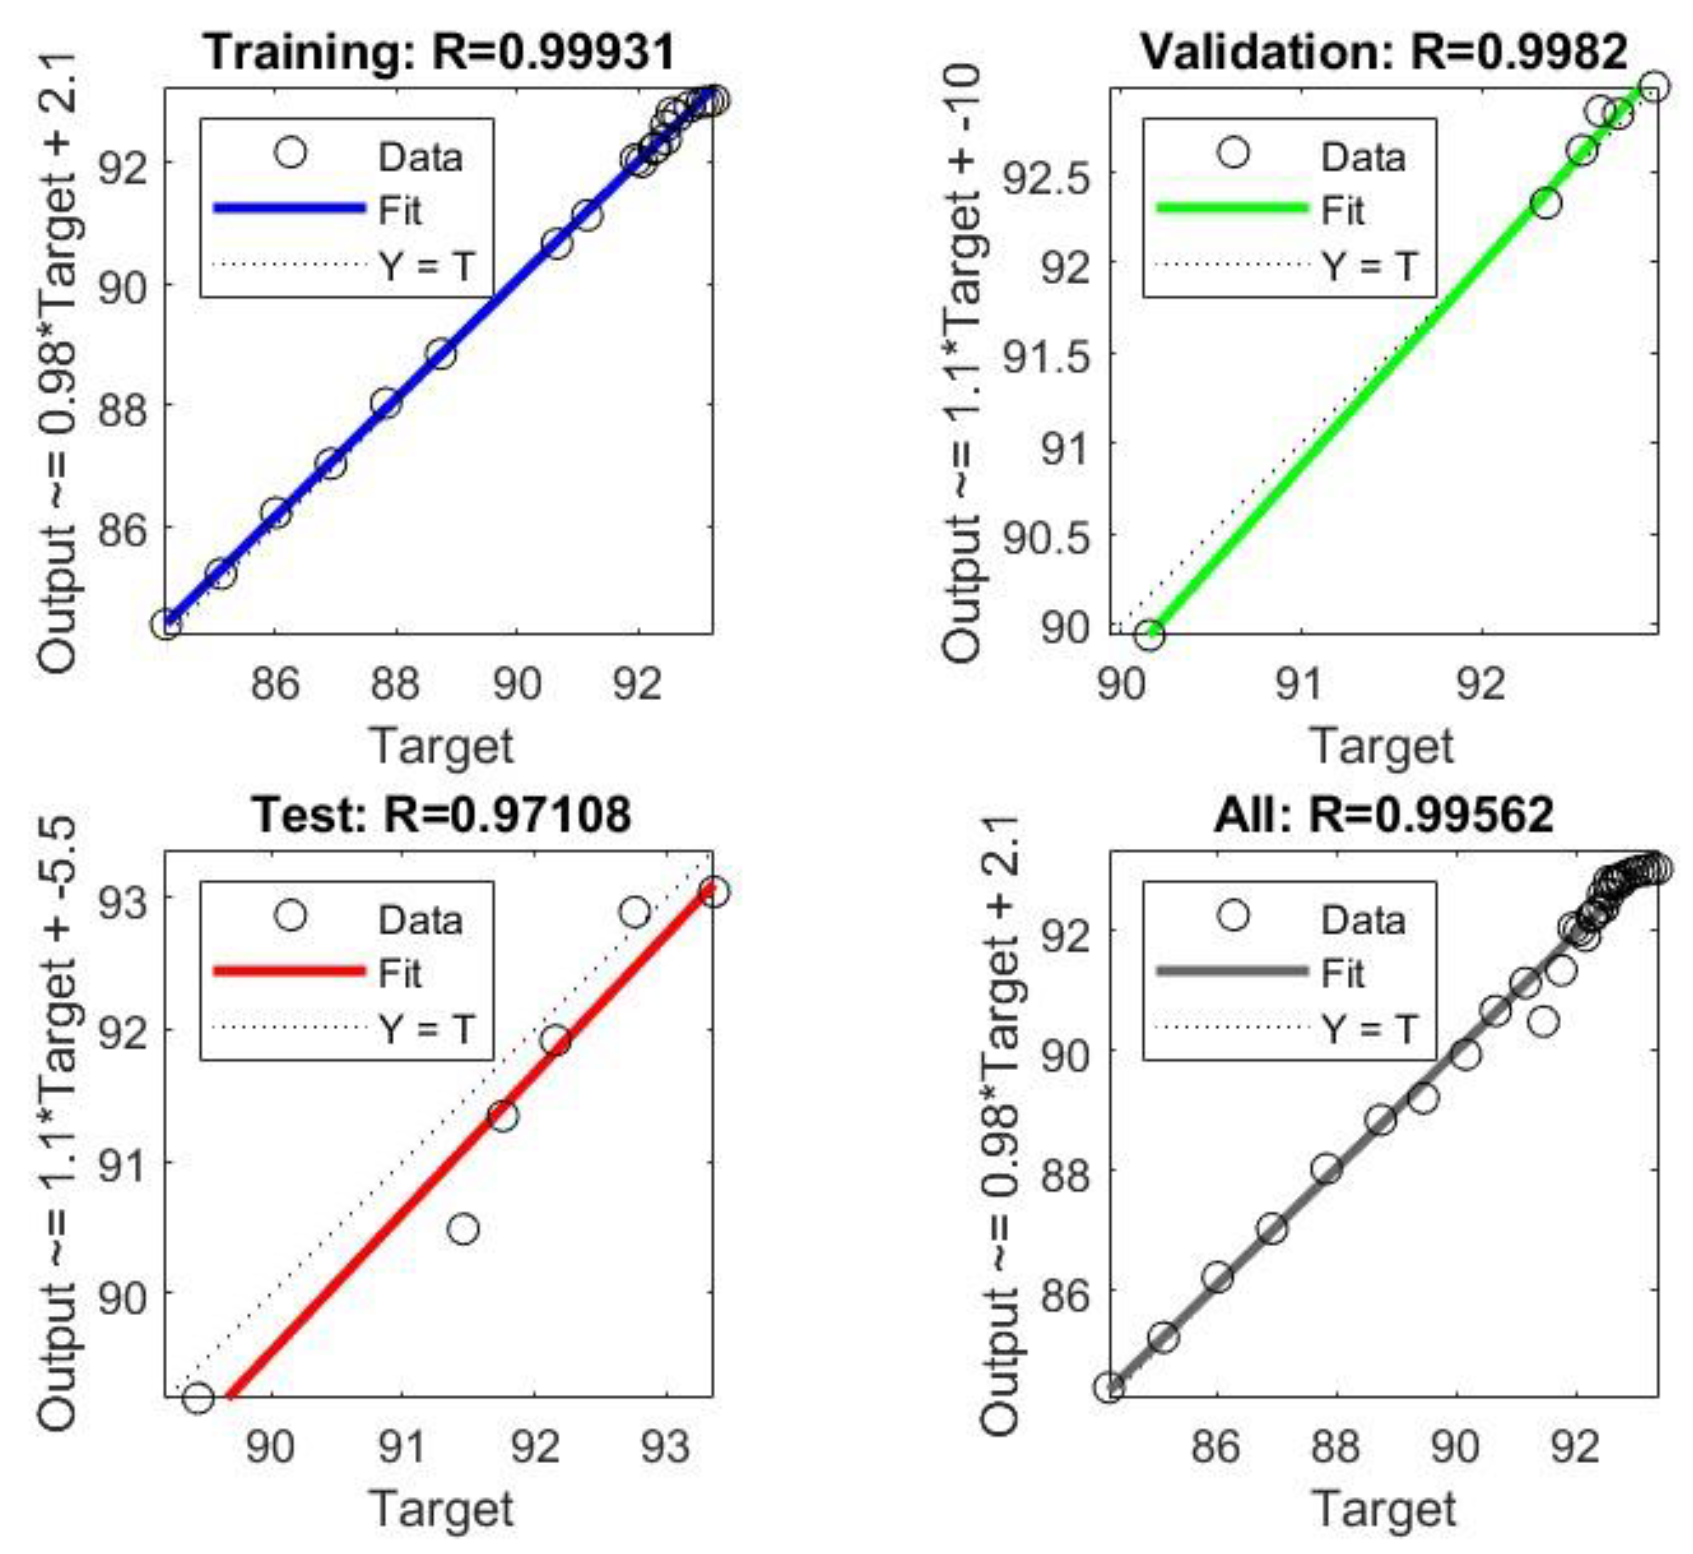
0.9982 |
| Test |
MSE |
0.2255 |
| R2
|
0.9711 |
- Regression Plots
Figure 6.
DPFA ANN model regression plots for training, validation and test data.
Figure 6.
DPFA ANN model regression plots for training, validation and test data.
- Performance Plots
Figure 7.
DPFA ANN model performance plot.
Figure 7.
DPFA ANN model performance plot.
- DPFA Mathematical model
Equation 3.24 predicts the recovery efficiency for a dissolved palm frond ash EOR process, with an injection temperature T > 49 °C, flooding heavy crude oil of specific gravity γ, through a reservoir of porosity ∅ and permeability K.
3.5. Bitter Leaf Extract ML Results
3.5.1. ML Training Dataset:
Table 9.
BLE flooding extrapolated dataset.
Table 9.
BLE flooding extrapolated dataset.
| Porosity |
Permeability |
Oil Specific Gravity |
Inj. Temp |
Recovery Efficiency |
| 0.2183 |
88.23 |
0.9542 |
50.0 |
91.81 |
| 0.2022 |
71.31 |
0.9542 |
52.0 |
92.52 |
| 0.2196 |
98.32 |
0.9542 |
54.0 |
93.23 |
| 0.2173 |
86.23 |
0.9542 |
56.0 |
93.84 |
| 0.2086 |
90.67 |
0.9542 |
58.0 |
94.35 |
| 0.2207 |
93.72 |
0.9542 |
60.0 |
94.76 |
| 0.2421 |
89.45 |
0.9542 |
62.0 |
95.17 |
| 0.2231 |
92.76 |
0.9542 |
64.0 |
95.48 |
| 0.2180 |
79.21 |
0.9542 |
66.0 |
95.79 |
| 0.2342 |
87.23 |
0.9542 |
68.0 |
96.00 |
| 0.2178 |
100.33 |
0.9542 |
70.0 |
96.20 |
| 0.2183 |
84.68 |
0.9542 |
72.0 |
96.41 |
| 0.2346 |
75.98 |
0.9542 |
74.0 |
96.51 |
| 0.2239 |
77.87 |
0.9542 |
76.0 |
96.61 |
| 0.2180 |
85.67 |
0.9542 |
78.0 |
96.72 |
| 0.2004 |
60.28 |
0.9542 |
80.0 |
96.82 |
| 0.2154 |
82.17 |
0.9542 |
82.0 |
96.92 |
| 0.2265 |
92.68 |
0.9542 |
84.0 |
96.92 |
| 0.2237 |
93.44 |
0.9542 |
86.0 |
97.02 |
| 0.2098 |
69.33 |
0.9542 |
88.0 |
97.02 |
| 0.2147 |
80.44 |
0.9542 |
90.0 |
97.13 |
| 0.2432 |
79.26 |
0.9542 |
92.0 |
97.13 |
| 0.2167 |
75.44 |
0.9542 |
94.0 |
97.23 |
| 0.2259 |
78.99 |
0.9542 |
96.0 |
97.23 |
| 0.2125 |
79.22 |
0.9542 |
98.0 |
97.33 |
| 0.2199 |
77.54 |
0.9542 |
100.0 |
97.33 |
| 0.2165 |
80.37 |
0.9542 |
105.0 |
97.44 |
| 0.2232 |
85.34 |
0.9542 |
110.0 |
97.44 |
| 0.2024 |
67.98 |
0.9542 |
115.0 |
97.54 |
| 0.2123 |
86.25 |
0.9542 |
120.0 |
97.54 |
| 0.2098 |
67.54 |
0.9542 |
125.0 |
97.64 |
| 0.2108 |
79.21 |
0.9542 |
130.0 |
97.64 |
3.5.2. Training Results
Table 10.
DPFA ANN parameters summary.
Table 10.
DPFA ANN parameters summary.
| Data Division |
Random |
| Model |
Scaled conjugate gradient |
| Input layer size |
4 |
| Hidden layer size |
3 |
| Output layer size |
1 |
| Training |
MSE |
0.0246 |
| R2
|
0.9927 |
| Validation |
MSE |
0.0913 |
| R2
|
0.9919 |
| Test |
MSE |
0.2512 |
| R2
|
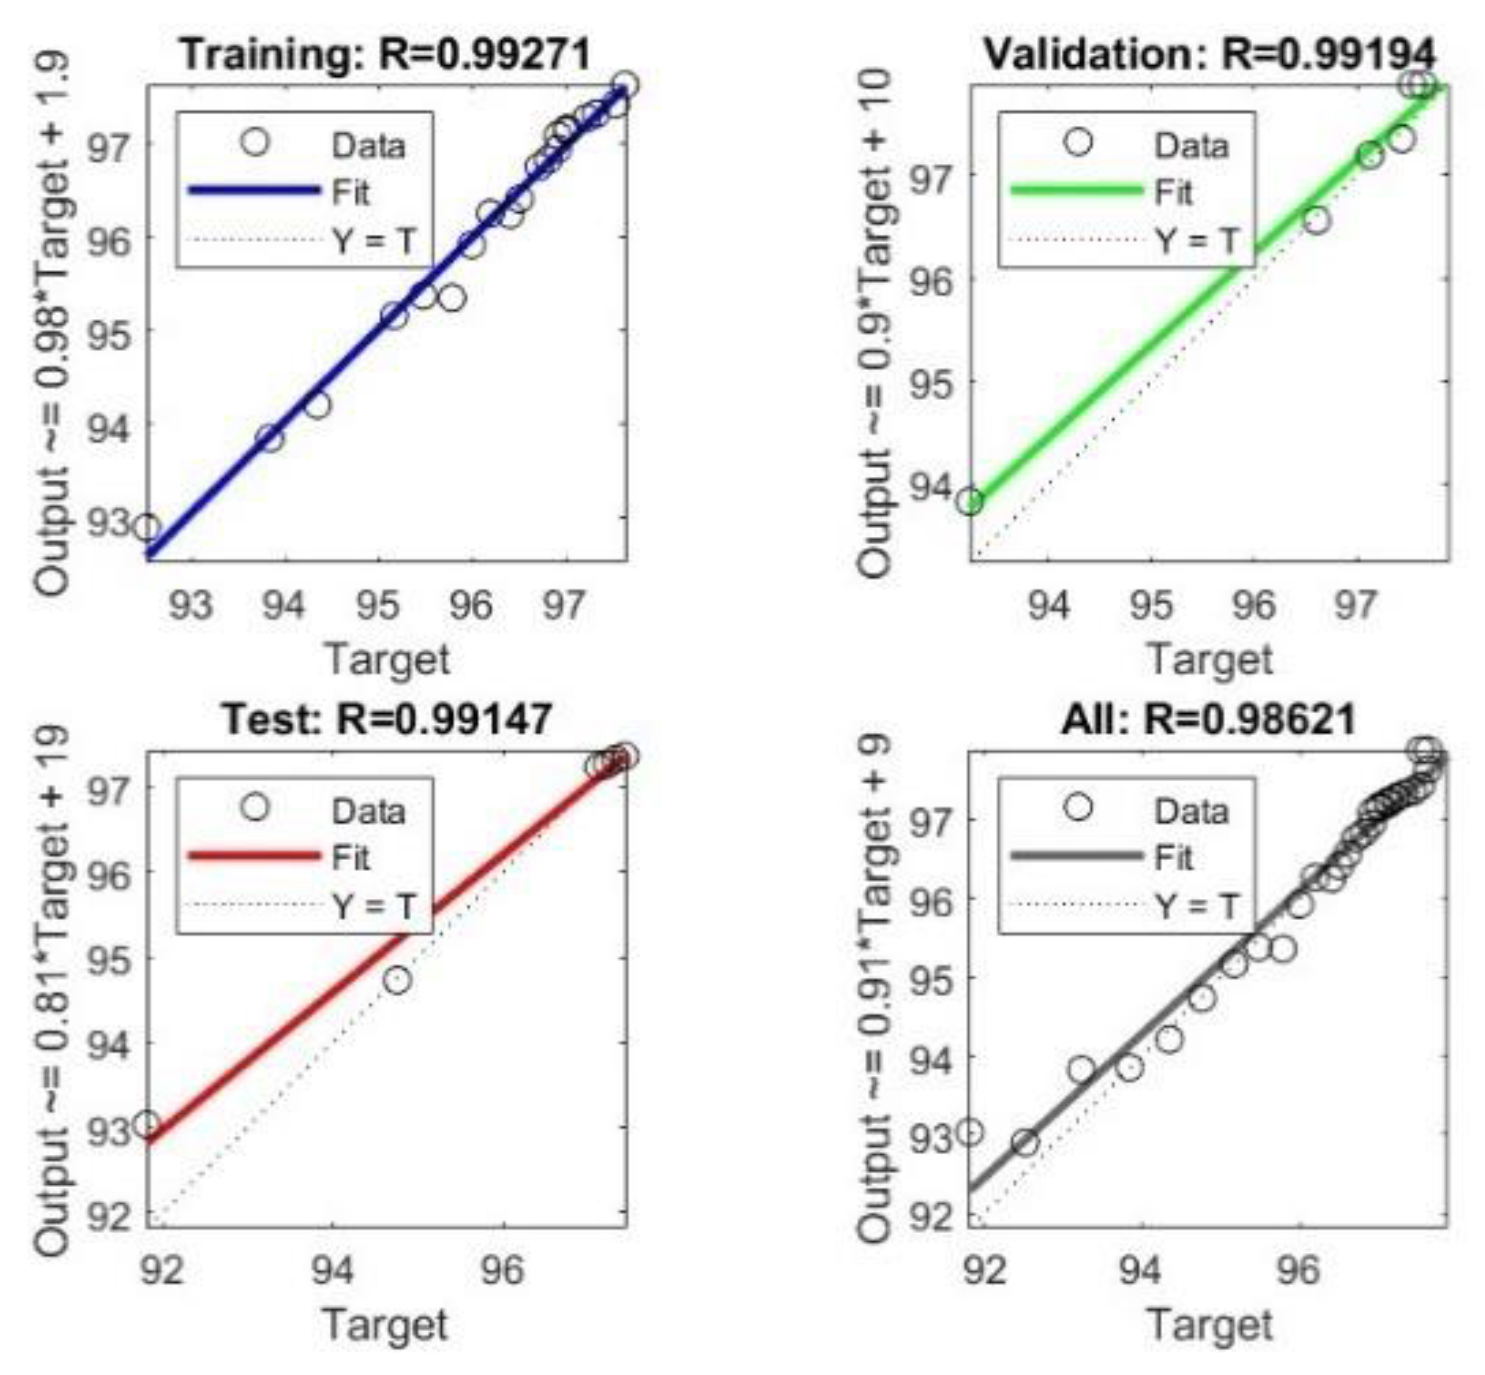
0.9915 |
- Regression Plots
Figure 8.
BLE ANN model regression plots for training, validation and test data.
Figure 8.
BLE ANN model regression plots for training, validation and test data.
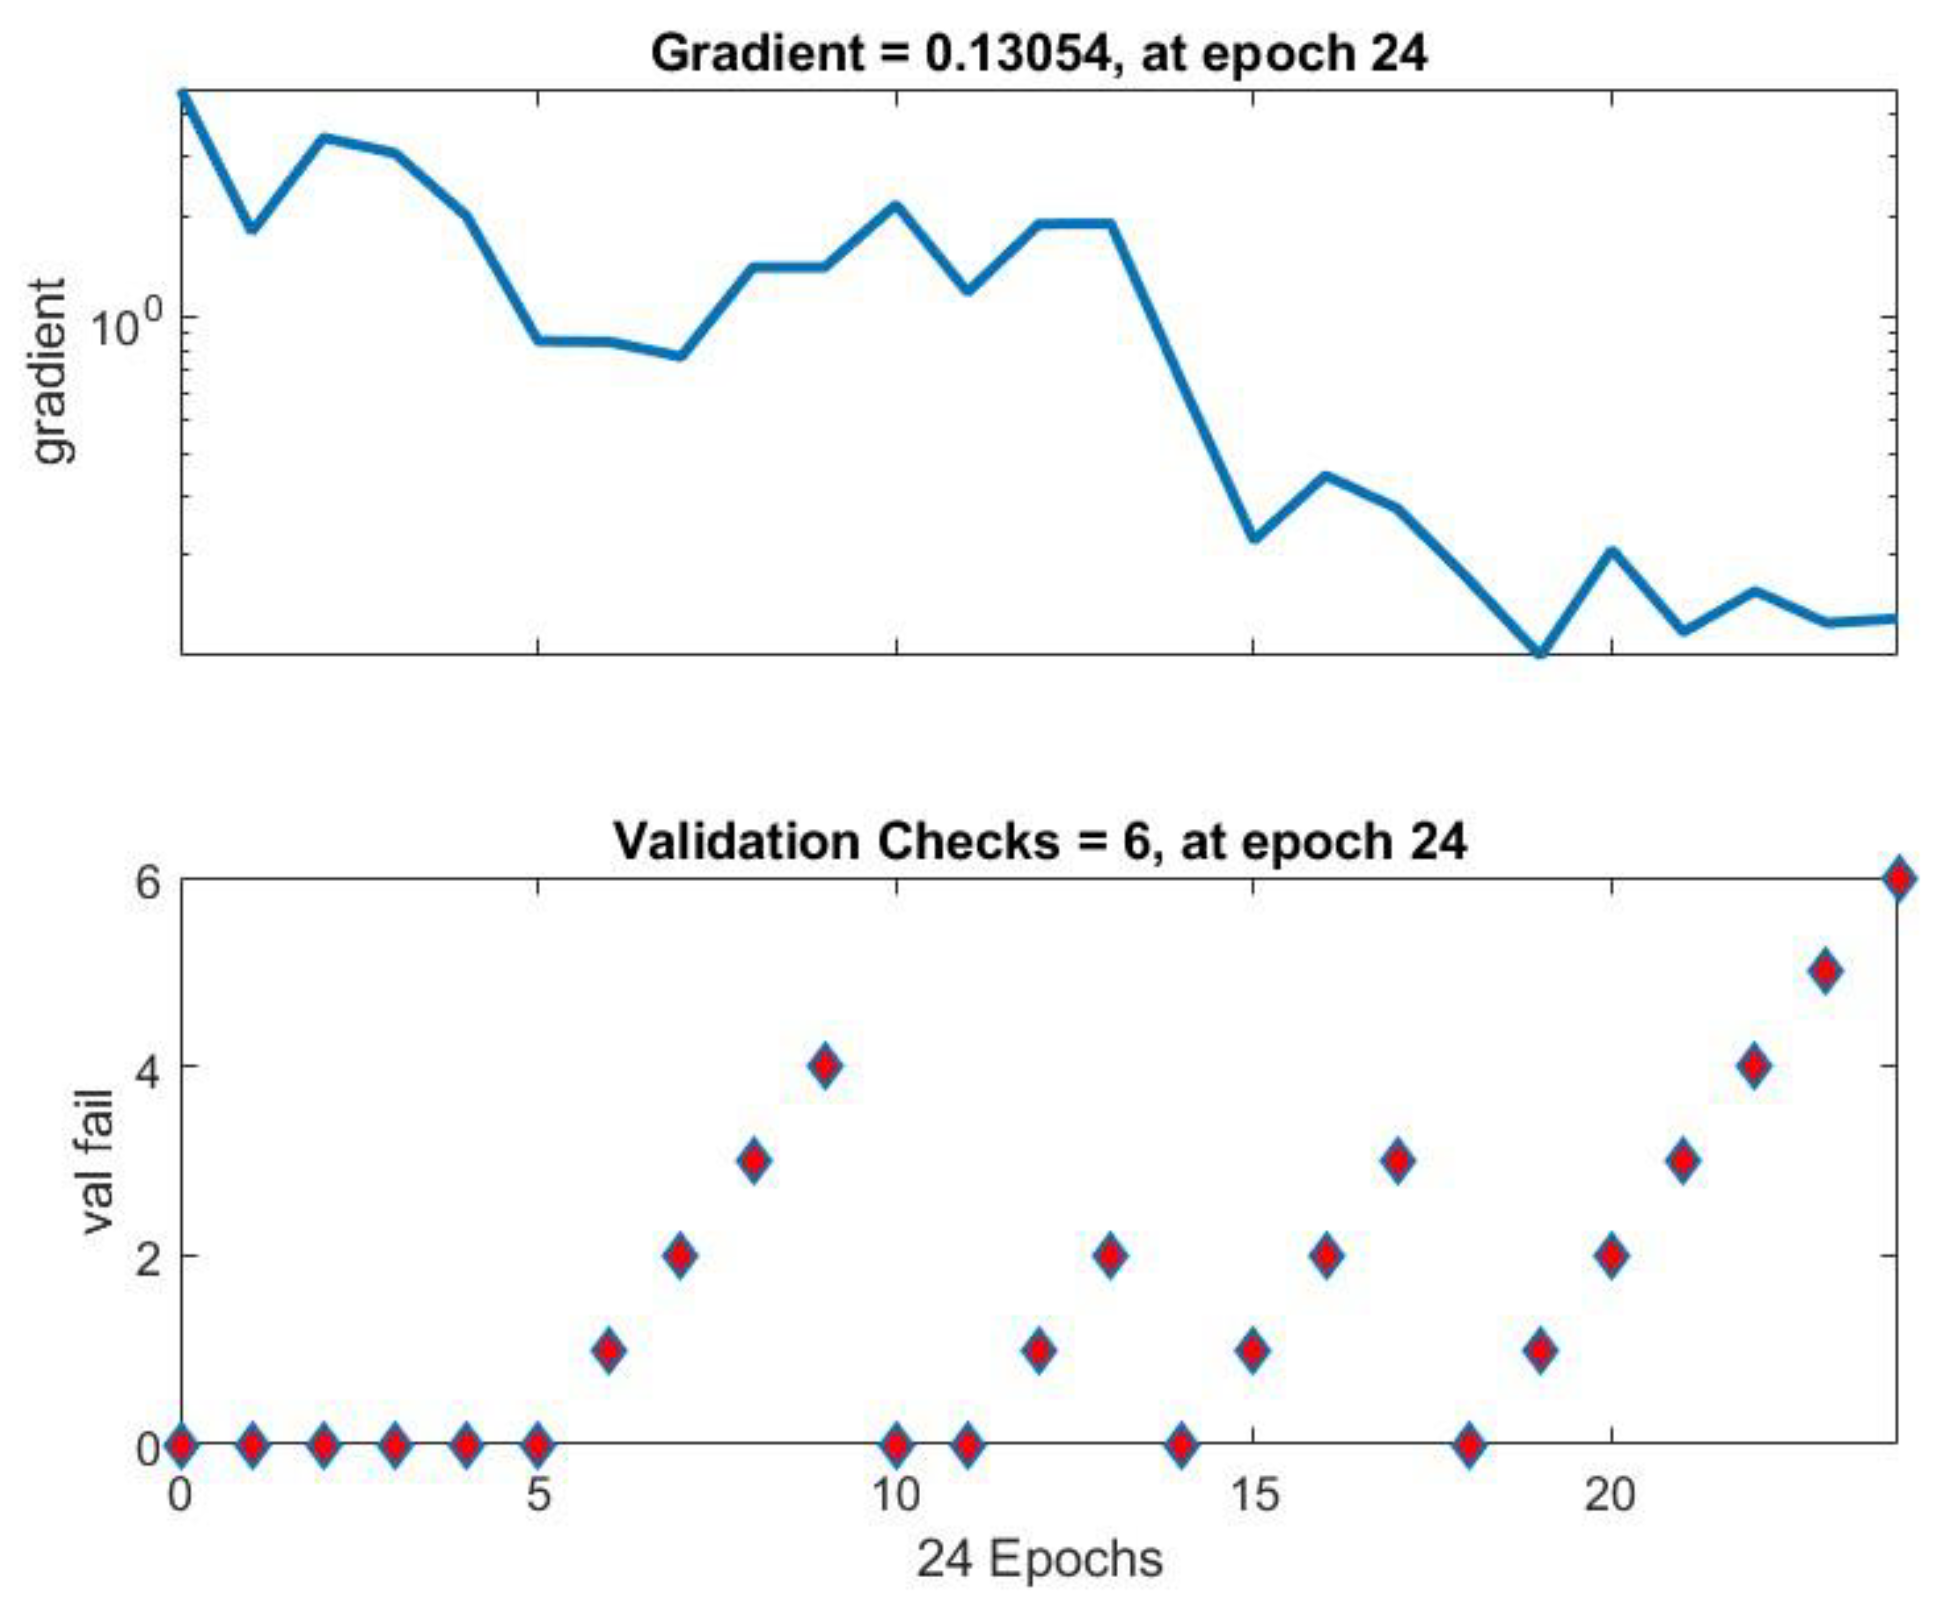
- Training State Plots
Figure 9.
BLE ANN training plot.
Figure 9.
BLE ANN training plot.
Equation 3.25 predicts the recovery efficiency for a bitter leaf extract EOR process, with an injection temperature T > 49 °C, flooding heavy crude oil of specific gravity γ, through a reservoir of porosity ∅ and permeability K.
3.6. Xanthan Gum ML Results:
3.6.1. ML Training Dataset:
Table 11.
XG flooding extrapolated dataset.
Table 11.
XG flooding extrapolated dataset.
| Porosity |
Permeability |
Oil Specific Gravity |
Inj. Temp |
Recovery Efficiency |
| 0.2183 |
88.23 |
0.9542 |
50.0 |
94.97 |
| 0.2022 |
71.31 |
0.9542 |
52.0 |
95.58 |
| 0.2196 |
98.32 |
0.9542 |
54.0 |
96.09 |
| 0.2173 |
86.23 |
0.9542 |
56.0 |
96.60 |
| 0.2086 |
90.67 |
0.9542 |
58.0 |
97.01 |
| 0.2207 |
93.72 |
0.9542 |
60.0 |
97.32 |
| 0.2421 |
89.45 |
0.9542 |
62.0 |
97.63 |
| 0.2231 |
92.76 |
0.9542 |
64.0 |
97.83 |
| 0.2180 |
79.21 |
0.9542 |
66.0 |
98.04 |
| 0.2342 |
87.23 |
0.9542 |
68.0 |
98.24 |
| 0.2178 |
100.33 |
0.9542 |
70.0 |
98.34 |
| 0.2183 |
84.68 |
0.9542 |
72.0 |
98.45 |
| 0.2346 |
75.98 |
0.9542 |
74.0 |
98.55 |
| 0.2239 |
77.87 |
0.9542 |
76.0 |
98.65 |
| 0.2180 |
85.67 |
0.9542 |
78.0 |
98.75 |
| 0.2004 |
60.28 |
0.9542 |
80.0 |
98.86 |
| 0.2154 |
82.17 |
0.9542 |
82.0 |
98.86 |
| 0.2265 |
92.68 |
0.9542 |
84.0 |
98.96 |
| 0.2237 |
93.44 |
0.9542 |
86.0 |
98.96 |
| 0.2098 |
69.33 |
0.9542 |
88.0 |
99.06 |
| 0.2147 |
80.44 |
0.9542 |
90.0 |
99.06 |
| 0.2432 |
79.26 |
0.9542 |
92.0 |
99.16 |
| 0.2167 |
75.44 |
0.9542 |
94.0 |
99.16 |
| 0.2259 |
78.99 |
0.9542 |
96.0 |
99.27 |
| 0.2125 |
79.22 |
0.9542 |
98.0 |
99.27 |
| 0.2199 |
77.54 |
0.9542 |
100.0 |
99.37 |
| 0.2165 |
80.37 |
0.9542 |
105.0 |
99.37 |
| 0.2232 |
85.34 |
0.9542 |
110.0 |
99.47 |
| 0.2024 |
67.98 |
0.9542 |
115.0 |
99.47 |
| 0.2123 |
86.25 |
0.9542 |
120.0 |
99.57 |
| 0.2098 |
67.54 |
0.9542 |
125.0 |
99.57 |
| 0.2108 |
79.21 |
0.9542 |
130.0 |
99.68 |
3.6.2. Training Results
Table 12.
XG ANN parameters summary.
Table 12.
XG ANN parameters summary.
| Data Division |
Random |
| Model |
Scaled conjugate gradient |
| Input layer size |
4 |
| Hidden layer size |
3 |
| Output layer size |
1 |
| Training |
MSE |
0.1492 |
| R2
|
0.9572 |
| Validation |
MSE |
0.0316 |
| R2
|
0.9805 |
| Test |
MSE |
0.1142 |
| R2
|
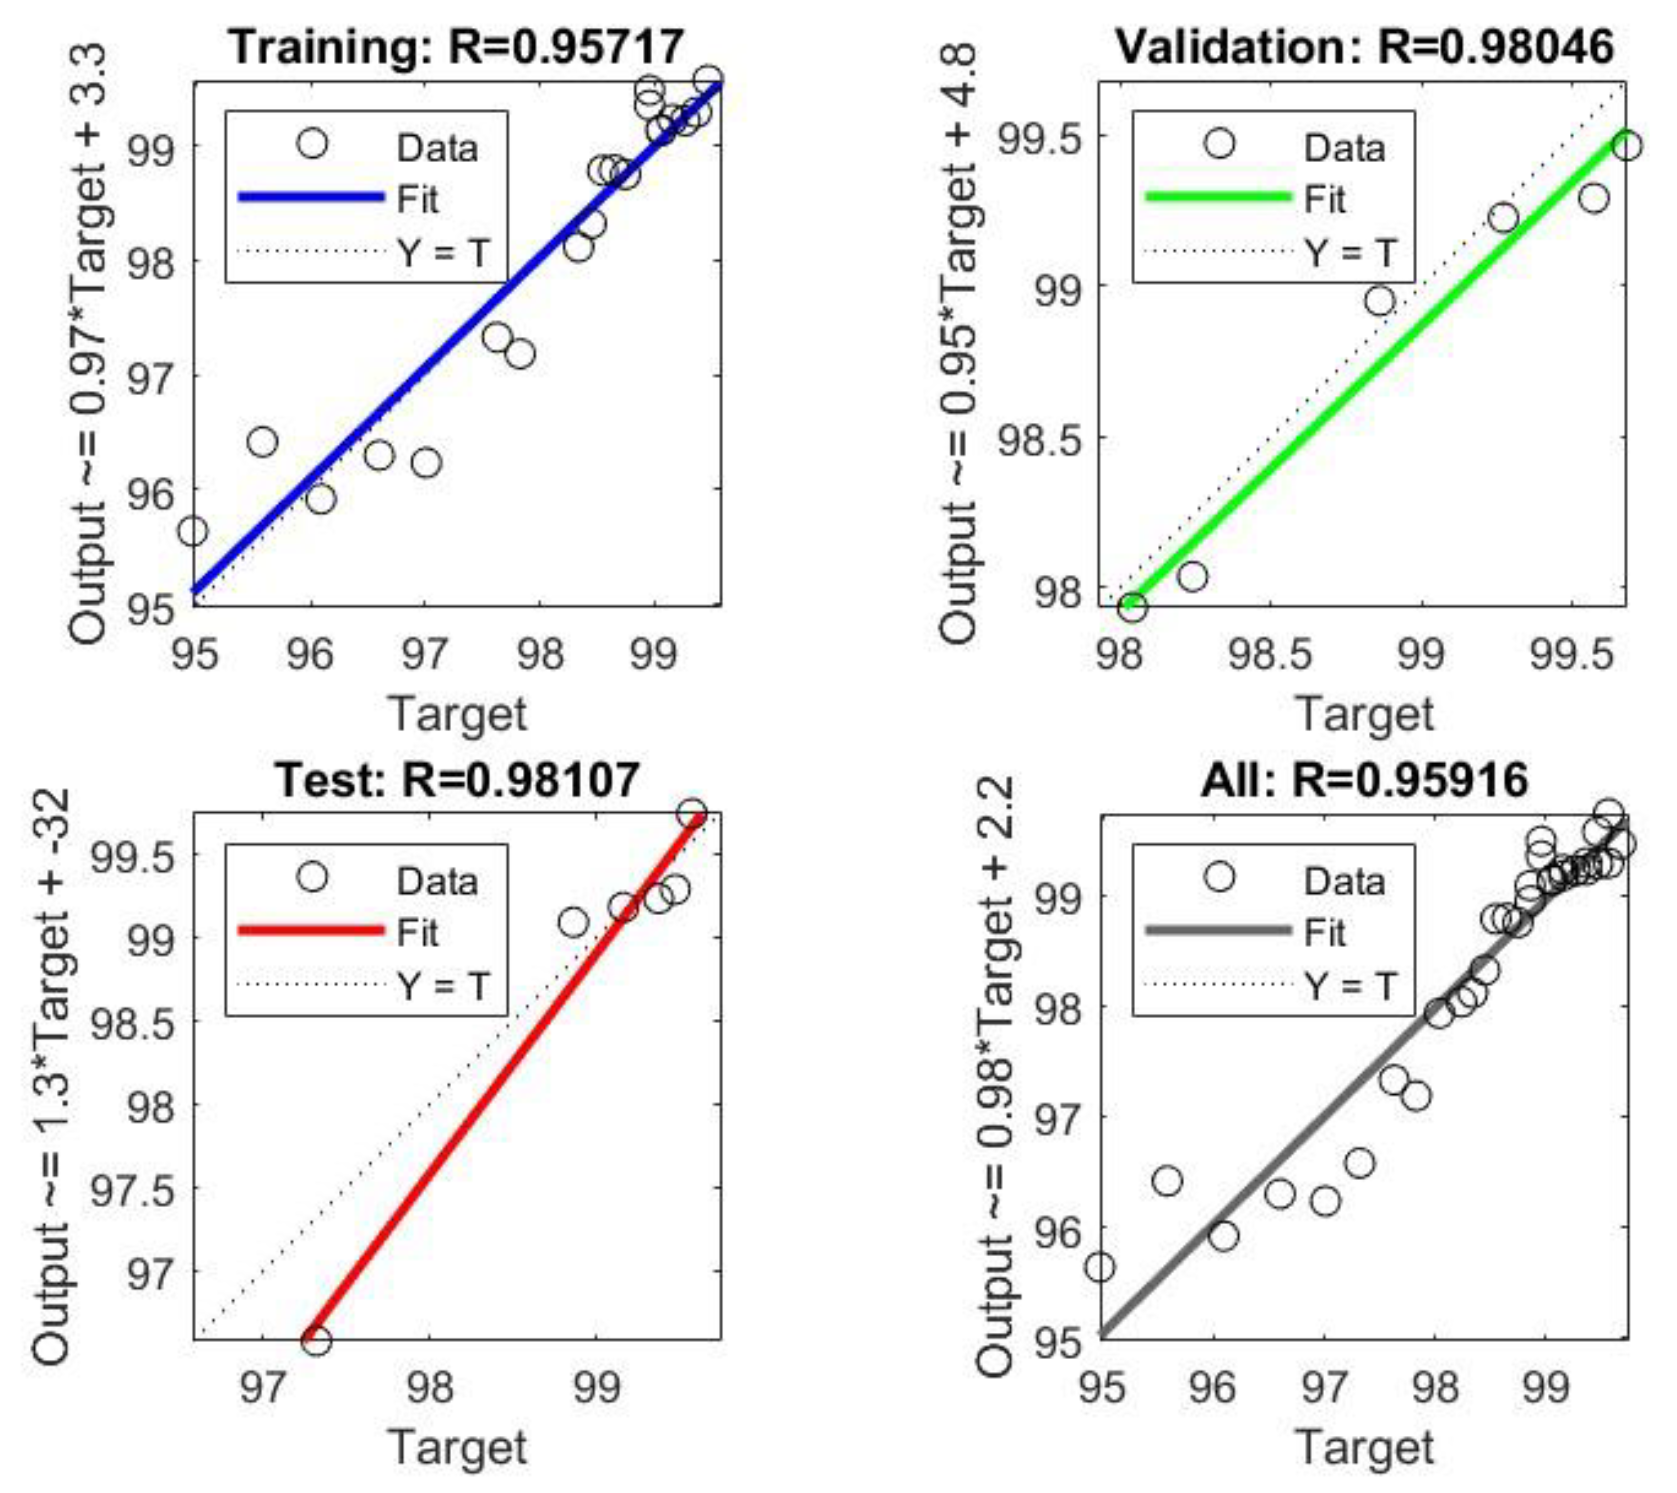
0.9811 |
- Regression Plots
Figure 10.
XG ANN model regression plots for training, validation and test data.
Figure 10.
XG ANN model regression plots for training, validation and test data.
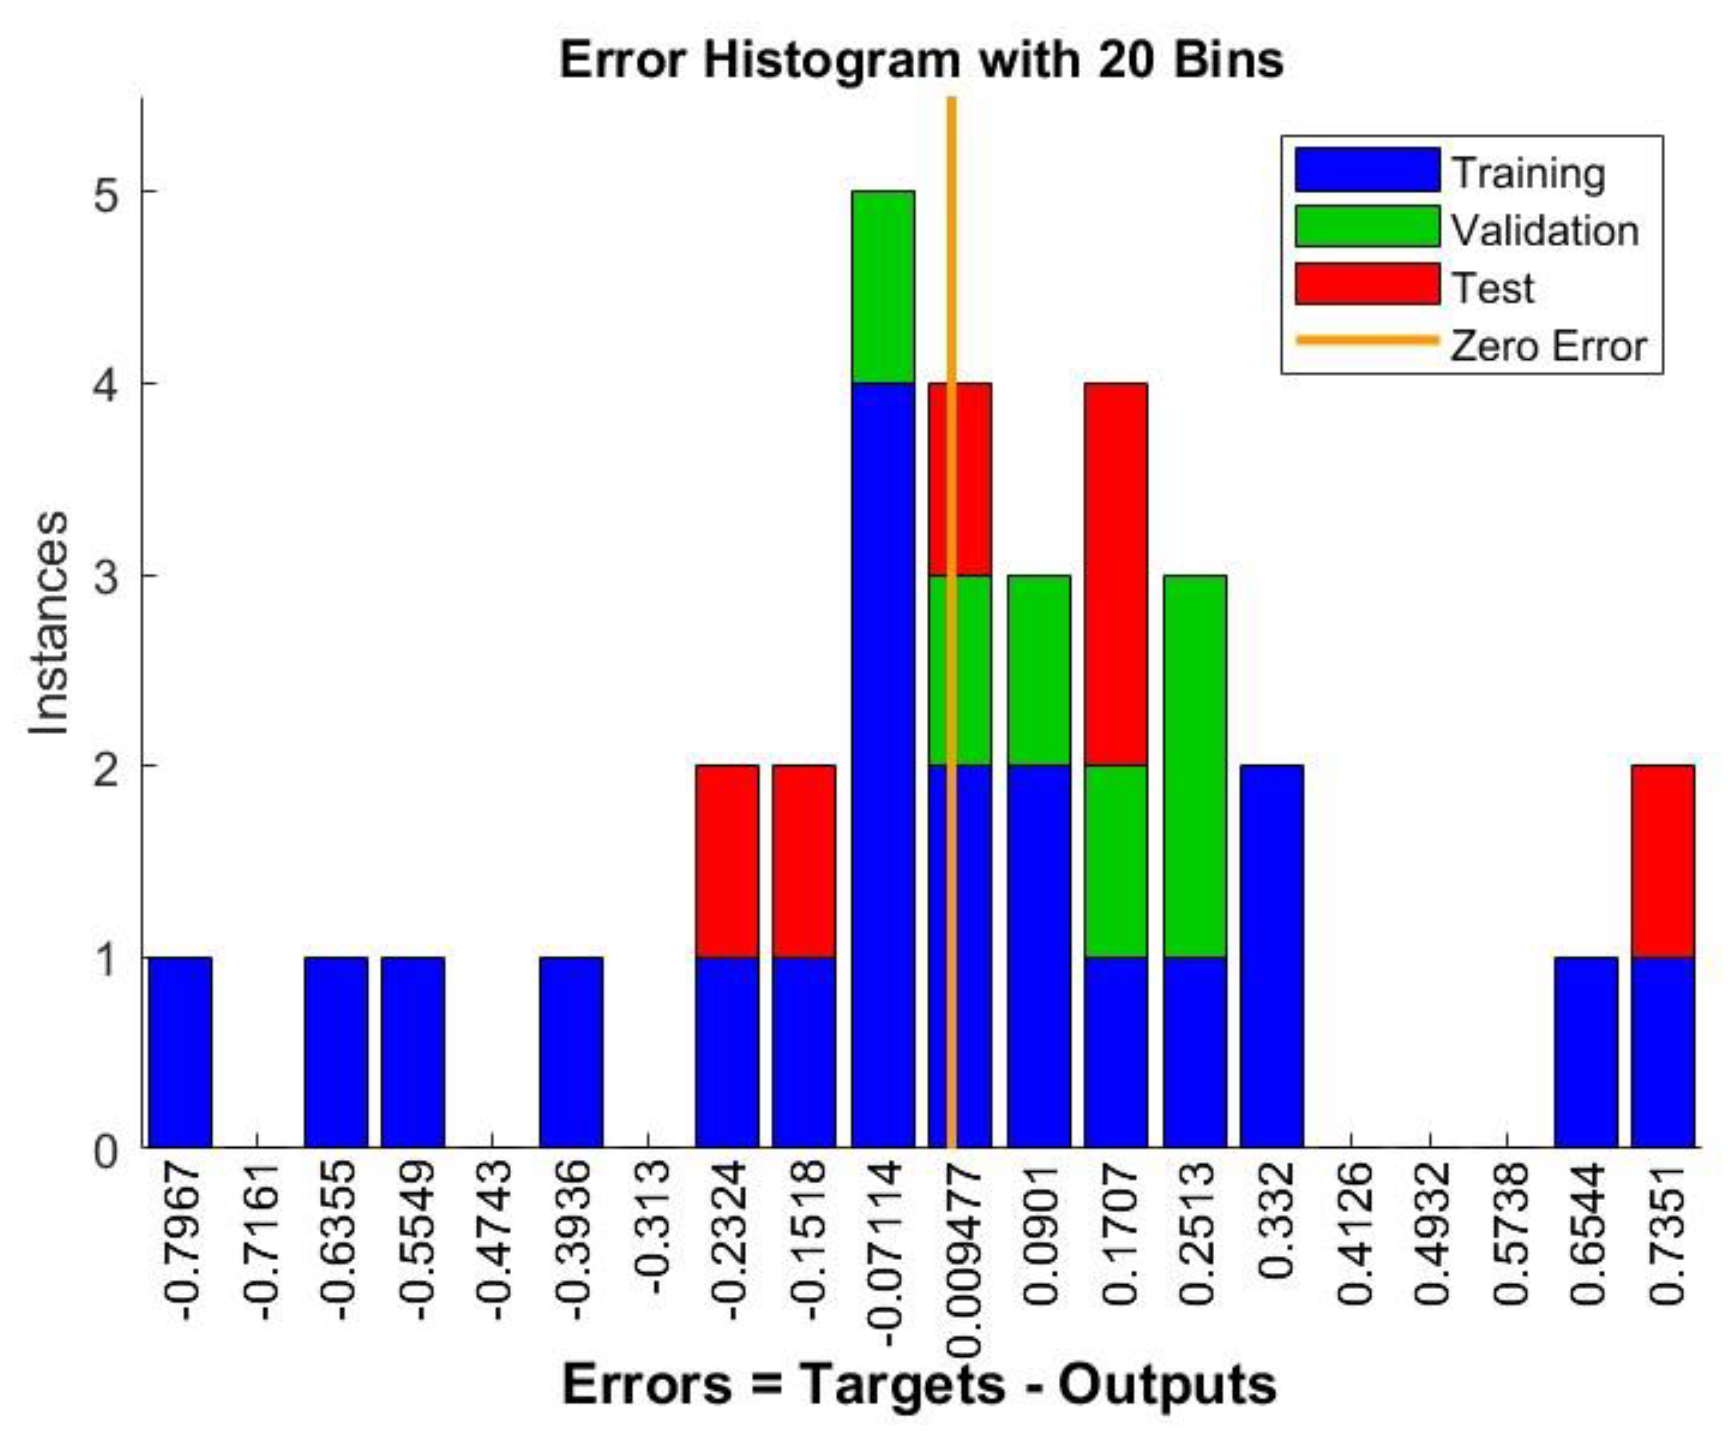
- Error Histogram
Figure 11.
XG ANN error histogram plot.
Figure 11.
XG ANN error histogram plot.
Equation 3.26 predicts the recovery efficiency for a heated xanthan gum EOR process, with an injection temperature T > 49 °C, flooding heavy crude oil of specific gravity γ, through a reservoir of porosity ∅ and permeability K.
3.7. DG + DPFA ML Results
3.7.1. ML Training Dataset
Table 13.
DG + DPFA flooding extrapolated dataset.
Table 13.
DG + DPFA flooding extrapolated dataset.
| Porosity |
Permeability |
Oil Specific Gravity |
Inj. Temp |
Recovery Efficiency |
| 0.2183 |
88.23 |
0.9542 |
50.0 |
93.63 |
| 0.2022 |
71.31 |
0.9542 |
52.0 |
94.24 |
| 0.2196 |
98.32 |
0.9542 |
54.0 |
94.85 |
| 0.2173 |
86.23 |
0.9542 |
56.0 |
95.36 |
| 0.2086 |
90.67 |
0.9542 |
58.0 |
95.77 |
| 0.2207 |
93.72 |
0.9542 |
60.0 |
96.18 |
| 0.2421 |
89.45 |
0.9542 |
62.0 |
96.49 |
| 0.2231 |
92.76 |
0.9542 |
64.0 |
96.80 |
| 0.2180 |
79.21 |
0.9542 |
66.0 |
97.00 |
| 0.2342 |
87.23 |
0.9542 |
68.0 |
97.21 |
| 0.2178 |
100.33 |
0.9542 |
70.0 |
97.41 |
| 0.2183 |
84.68 |
0.9542 |
72.0 |
97.51 |
| 0.2346 |
75.98 |
0.9542 |
74.0 |
97.62 |
| 0.2239 |
77.87 |
0.9542 |
76.0 |
97.72 |
| 0.2180 |
85.67 |
0.9542 |
78.0 |
97.82 |
| 0.2004 |
60.28 |
0.9542 |
80.0 |
97.92 |
| 0.2154 |
82.17 |
0.9542 |
82.0 |
98.03 |
| 0.2265 |
92.68 |
0.9542 |
84.0 |
98.03 |
| 0.2237 |
93.44 |
0.9542 |
86.0 |
98.13 |
| 0.2098 |
69.33 |
0.9542 |
88.0 |
98.13 |
| 0.2147 |
80.44 |
0.9542 |
90.0 |
98.23 |
| 0.2432 |
79.26 |
0.9542 |
92.0 |
98.23 |
| 0.2167 |
75.44 |
0.9542 |
94.0 |
98.33 |
| 0.2259 |
78.99 |
0.9542 |
96.0 |
98.33 |
| 0.2125 |
79.22 |
0.9542 |
98.0 |
98.44 |
| 0.2199 |
77.54 |
0.9542 |
100.0 |
98.44 |
| 0.2165 |
80.37 |
0.9542 |
105.0 |
98.54 |
| 0.2232 |
85.34 |
0.9542 |
110.0 |
98.54 |
| 0.2024 |
67.98 |
0.9542 |
115.0 |
98.64 |
| 0.2123 |
86.25 |
0.9542 |
120.0 |
98.64 |
| 0.2098 |
67.54 |
0.9542 |
125.0 |
98.74 |
| 0.2108 |
79.21 |
0.9542 |
130.0 |
98.74 |
3.7.2. Training Results
Table 14.
DG + DPFA ANN parameters summary.
Table 14.
DG + DPFA ANN parameters summary.
| Data Division |
Random |
| Model |
Levenberg - Maquandt |
| Input layer size |
4 |
| Hidden layer size |
3 |
| Output layer size |
1 |
| Training |
MSE |
0.0015 |
| R2
|
0.9995 |
| Validation |
MSE |
0.0123 |
| R2
|
0.9967 |
| Test |
MSE |
0.0693 |
| R2
|
0.9926 |
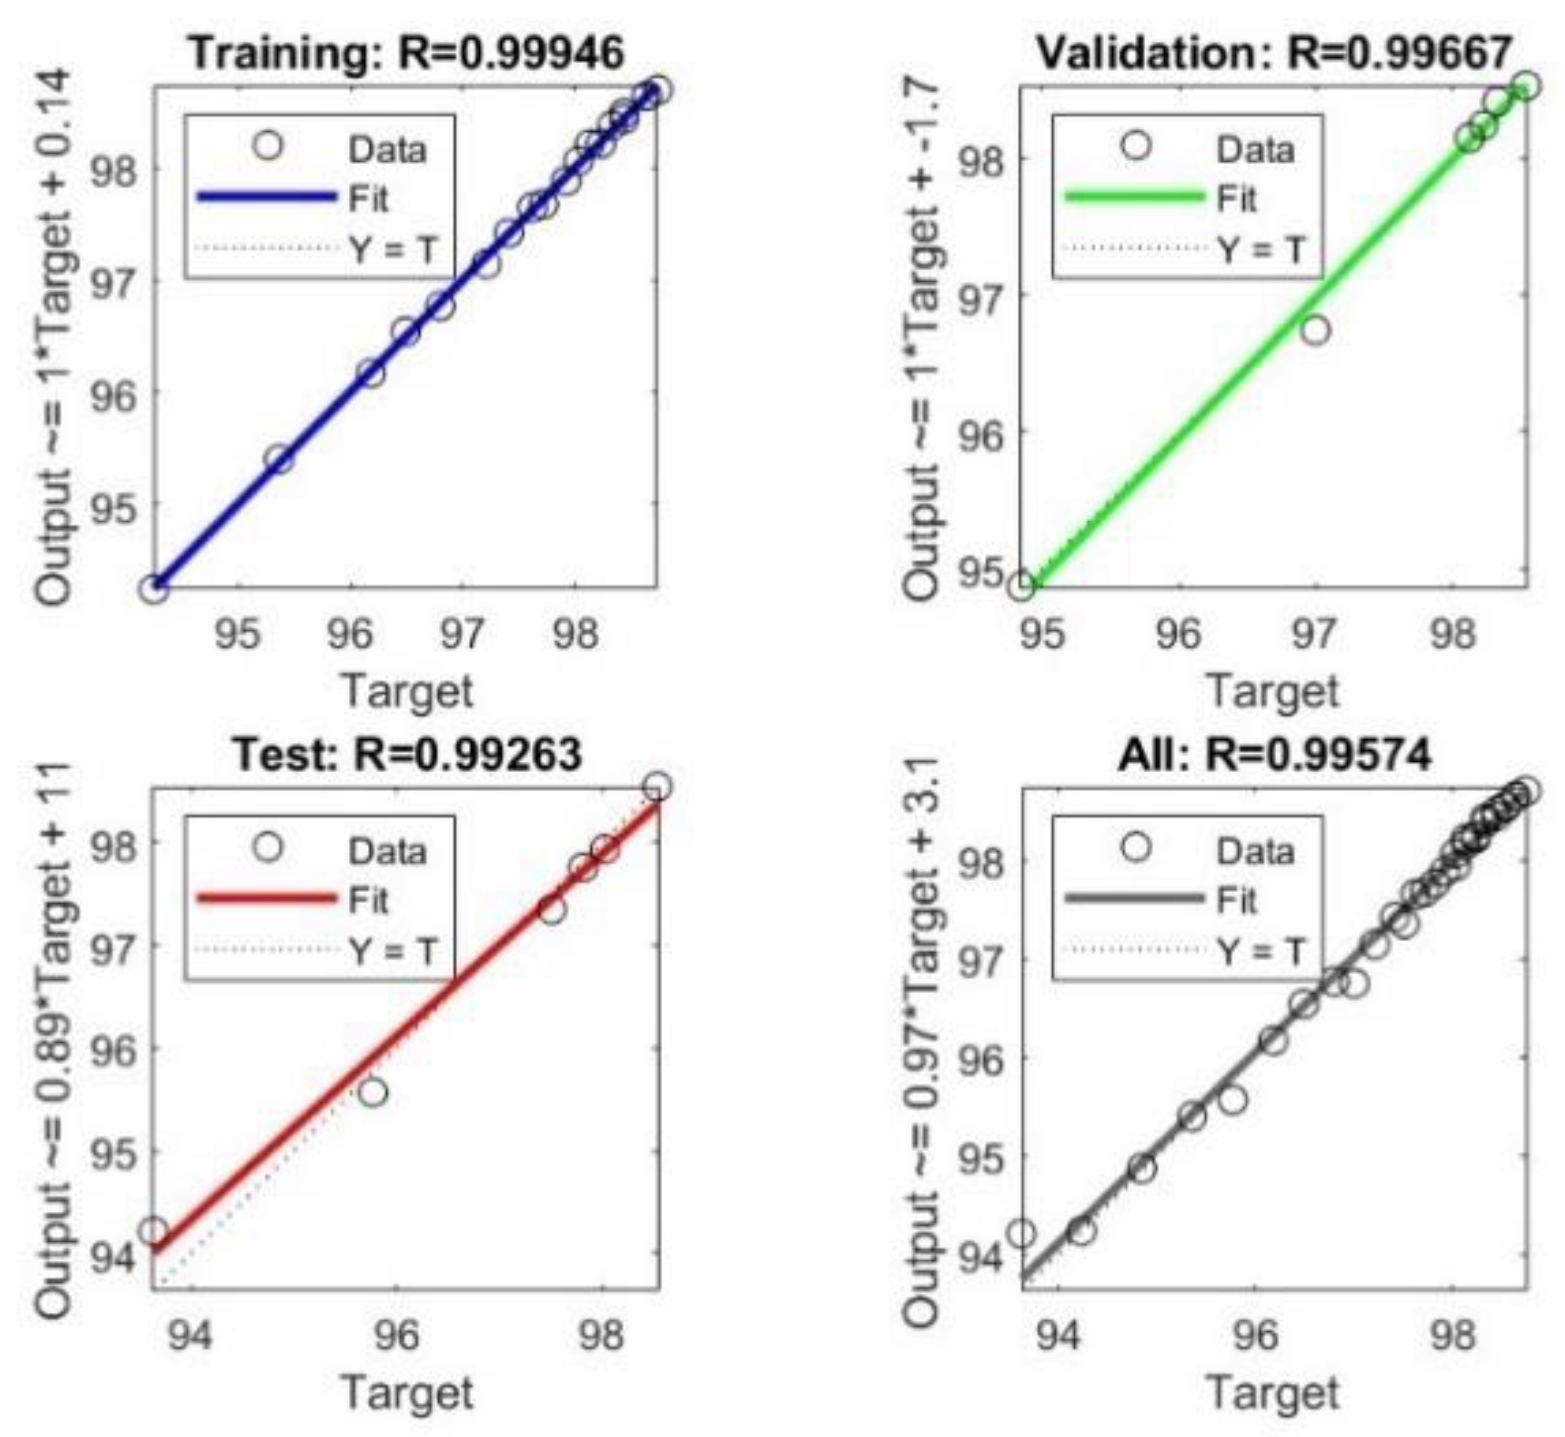
- Regression Plots
Figure 12.
DG + DPFA ANN model regression plots for training, validation and test data.
Figure 12.
DG + DPFA ANN model regression plots for training, validation and test data.
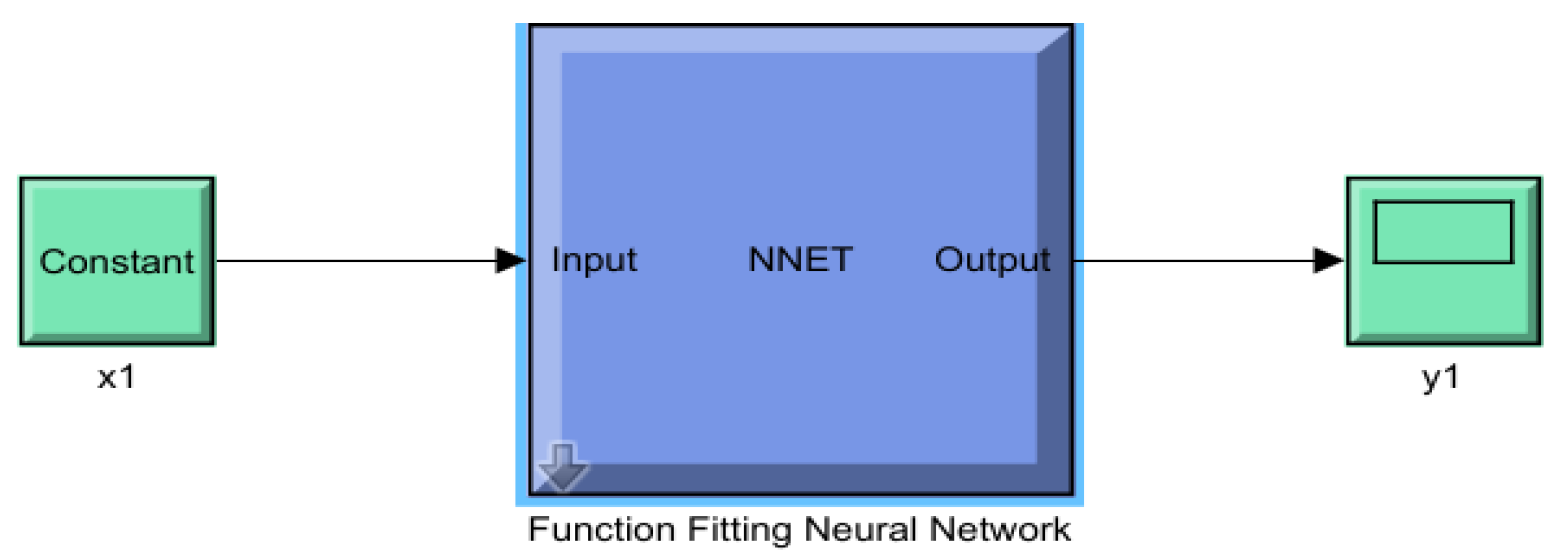
- Extended Visualization
Figure 13.
DG + DPFA function fitting neural network.
Figure 13.
DG + DPFA function fitting neural network.
- DG + DPFA Mathematical model
4. Conclusion
The application of Artificial Neural Networks (ANN) in optimizing enhanced oil recovery (EOR) for heavy oil production in the Niger Delta has proven to be a highly effective approach. This study successfully demonstrated the capability of ANN models to predict recovery efficiency with high accuracy, utilizing key reservoir parameters such as porosity, permeability, oil specific gravity, and chemical injection temperature as inputs. The ANN models developed in this research exhibited excellent performance, with high R-squared values and low mean squared errors across the training, validation, and testing datasets. This indicates the models' robustness and reliability in capturing the complex nonlinear relationships inherent in the EOR processes.
The polynomial regression equations derived for each chemical flooding process further validated the ANN predictions, showcasing strong predictive accuracy and offering a clear mathematical representation of the input-output relationships. These equations are invaluable for understanding the influence of various operational parameters on recovery efficiency and provide a quantitative basis for optimizing chemical flooding strategies in heavy oil reservoirs.
Moreover, the novel hot chemical flooding method developed and optimized through this study has demonstrated significant potential for improving heavy oil recovery rates while maintaining economic viability. The integration of thermal and chemical EOR techniques, supported by advanced machine learning models, provides a comprehensive framework for enhancing heavy oil production in the Niger Delta.
The findings from this research underscore the importance of leveraging advanced data-driven techniques like ANN for optimizing complex EOR processes. The study not only contributes to the body of knowledge on heavy oil recovery but also provides actionable insights for the oil and gas industry, particularly in regions like the Niger Delta, where heavy oil reserves represent a significant yet underutilized resource. Future research should focus on expanding the dataset and exploring additional reservoir and operational parameters to further refine the predictive models and enhance the understanding of EOR dynamics in diverse geological settings. The adoption of such innovative approaches is essential for ensuring the sustainable and efficient exploitation of heavy oil reserves, contributing to energy security and economic development.
References
- Adewumi, J., Ojo, T., and Oyetola, A. "Decline in Nigeria’s Oil Reserves and the Shift towards Heavy Oil Exploitation." Journal of Petroleum Science and Engineering, vol. 205, 2022, p. 109411.
- Omeke, F., and Yusuf, H. "The Future of Nigeria’s Heavy Oil Production: Challenges and Opportunities." Energy Policy Journal, vol. 157, 2023, p. 112343.
- Babadagli, T. "Development of Mature Oil Fields—a Review." Journal of Petroleum Science and Engineering, vol. 57, no. 3-4, 2007, pp. 221-46.
- Alvarado, V., and Manrique, E. "Enhanced Oil Recovery: An Update Review." Energies, vol. 3, no. 9, 2010, pp. 1529-75. [CrossRef]
- Guo, J., Li, X., and Zhang, J. "Advances in Chemical Enhanced Oil Recovery." Petroleum Exploration and Development, vol. 43, no. 6, 2016, pp. 927-33.
- Thomas, S. "Enhanced Oil Recovery—An Overview." Oil & Gas Science and Technology–Revue d’IFP Energies Nouvelles, vol. 63, no. 1, 2008, pp. 9-19.
- Hascakir, B., Breitenstein, S., and Castanier, L. M. "Heavy Oil Combustion Kinetics." Journal of Canadian Petroleum Technology, vol. 49, no. 3, 2010, pp. 29-34.
- Shah, D. O. Surface Chemistry and Electrochemistry of Membranes. CRC Press, 2012.
- Santanna, V. C., et al. "Chemical Enhanced Oil Recovery and the Role of Chemical Injection." Energy & Fuels, vol. 23, no. 9, 2009, pp. 4863-74.
- Taber, J. J., Martin, F. D., and Seright, R. S. "EOR Screening Criteria Revisited - Part 1: Introduction to Screening Criteria and Enhanced Recovery Field Projects." SPE Reservoir Engineering, vol. 12, no. 3, 1997, pp. 189-98. [CrossRef]
- Green, D. W., and Willhite, G. P. Enhanced Oil Recovery. Society of Petroleum Engineers, 2018.
- Salehi, S., Ayatollahi, S., and Akbari, M. "A Comprehensive Review on Applications of Artificial Intelligence in Oil and Gas Industry with a Special Focus on Artificial Neural Networks." Journal of Petroleum Science and Engineering, vol. 171, 2018, pp. 249-69.
- Ahmadi, M., Zendehboudi, S., and James, L. A. "Machine Learning Techniques for Predicting Carbonate Reservoir Permeability: A Comparative Study." Journal of Petroleum Science and Engineering, vol. 172, 2019, pp. 984-99.
- Hassoun, M. H. Fundamentals of Artificial Neural Networks. MIT Press, 1995.
- Haykin, S. Neural Networks: A Comprehensive Foundation. Prentice Hall, 1999.
- Shokir, E. M. E. "Application of Artificial Neural Networks for Reservoir Characterization with Special Reference to Fractured Reservoirs." Journal of Petroleum Science and Engineering, vol. 42, no. 1-2, 2004, pp. 1-20.
- Gharbi, R., and Elsharkawy, A. M. "Neural Network Model for Estimation of Formation Permeability." Journal of Petroleum Science and Engineering, vol. 24, no. 3-4, 1999, pp. 209-21.
- Mohaghegh, S. D., et al. "Application of Artificial Neural Networks for Reservoir Characterization and Enhanced Oil Recovery Prediction in a Fractured Carbonate Reservoir." SPE Reservoir Evaluation & Engineering, vol. 17, no. 3, 2014, pp. 232-46.
- Hossain, M. E., Al-Majed, A. A., and Saddique, A. A. "Artificial Intelligence Modeling of Heavy Oil Recovery: A Review and Case Study." Journal of Petroleum Exploration and Production Technology, vol. 8, no. 3, 2018, pp. 809-25.
- Nikookar, M., Rasaei, M. R., and Alizadeh, N. "Prediction of Water Saturation Using Artificial Neural Networks and Regression Analysis in One of the Iranian Carbonate Reservoirs." Journal of Petroleum Science and Engineering, vol. 126, 2015, pp. 1-7.
- Yousefi, S., Jalali, M., and Alizadeh, N. "Application of Artificial Neural Networks in Estimation of Well Productivity Index: Case Study from Carbonate Reservoirs." Journal of Petroleum Science and Engineering, vol. 184, 2020, p. 106494.
- Kokal, S. L., and Al-Kaabi, A. "Enhanced Oil Recovery: Challenges & Opportunities." World Petroleum Council, vol. 6, no. 2, 2010, pp. 1-13.
- Bryant, S. L., and Lockhart, T. P. "Reservoir Engineering of Chemical EOR: Guidelines for Field-Scale Project Evaluation." SPE Reservoir Evaluation & Engineering, 2002, pp. 385-93.
- Tavakkoli, R., Shakiba, M., and James, L. A. "Economic Analysis of Hybrid EOR Processes for Heavy Oil Recovery." Journal of Petroleum Science and Engineering, vol. 205, 2022, p. 108493.
- Haroun, M., and Al-Sahhaf, T. "Hot Chemical Flooding for Enhanced Heavy Oil Recovery.
|
Disclaimer/Publisher’s Note: The statements, opinions and data contained in all publications are solely those of the individual author(s) and contributor(s) and not of MDPI and/or the editor(s). MDPI and/or the editor(s) disclaim responsibility for any injury to people or property resulting from any ideas, methods, instructions or products referred to in the content. |
© 2024 by the authors. Licensee MDPI, Basel, Switzerland. This article is an open access article distributed under the terms and conditions of the Creative Commons Attribution (CC BY) license (http://creativecommons.org/licenses/by/4.0/).
