
Submitted:
07 October 2024
Posted:
08 October 2024
You are already at the latest version
Abstract
Mismatch repair (MMR) deficiency can be indicative of Lynch syndrome (LS) and guide treatment with immune checkpoint inhibitors. Colorectal cancers (CRCs) and endometrial cancers (ECs) are routinely screened to identify LS, primarily using immunohistochemistry (IHC) or Microsatellite Instability (MSI) testing, but concordance between methods is variable in ECs. Here, we investigate this variability by using the amplicon sequencing based Newcastle MSI assay (NCL_MSI) to re-analyse 361 ECs from the Ohio OCCPI/OPTEC (n=196) and Manchester PETALS (n=165) trials. NCL_MSI was consistent with Ohio results (94% and 97% concordance with IHC and original MSI assays respectively), and increased concordance in the Manchester cohort from 78% to 86% (MSI) and 84% (IHC). Among discordant Manchester samples, NCL_MSI was significantly associated with MLH1 promoter methylation status (p=0.0028), and had the highest concordance with methylation, 62/69 samples (90%), indicating utility as a screening tool in this tumour type. However, tumours with germline MSH6 defects were only detected efficiently with IHC; 7/8 LS tumours classified as MSS by either MSI assay had isolated MSH6 loss, compared to 4/12 classified as MSI-H by both (p=0.028). Furthermore, reduced MSI signal was observed in tumours with isolated MSH6 loss (p=0.009 Ohio, p=6.2x10⁻⁵ Manchester), and in both ECs and CRCs with germline defects although this only reached significance in CRCs (p=0.002). These results provide further evidence that ECs with MSH6 loss in particular, and LS tumours in general, have an attenuated MSI signal, and supports current guidelines specifically recommending IHC for LS detection and immune checkpoint therapy assessment in EC.
Keywords:
Endometrial Cancer
; Mismatch Repair Deficiency
; Immunohistochemistry
; Microsatellite Instability
; Lynch syndrome
1. Introduction
Detection of mismatch repair deficiency (MMRd) is of critical importance to the care of people with cancer and their families as it is a primary determinant of the efficacy of immune checkpoint blockade therapy [1,2] and helps to identify individuals with Lynch syndrome (LS) who can benefit, along with affected family members, from enhanced surveillance and chemoprevention [3,4].
LS, the most common inherited cancer syndrome, predisposes to a range of tumours, with colorectal cancer (CRC) and endometrial cancer (EC) being the most common [5,6]. It is caused by heterozygous pathogenic variants affecting one of four genes central to the mismatch repair (MMR) pathway; MLH1, MSH2, MSH6 and PMS2. Somatic loss of the second allele leads to failure of DNA repair and accumulation of potentially tumorigenic variants. Repetitive sequences are especially prone to error induced by replication slippage, resulting in the associated molecular phenotype of microsatellite instability (MSI) [7,8]. Tumour spectrum and penetrance varies extensively by gene affected [9], leading to the suggestion that LS be considered four separate clinical entities [10].
Almost all CRCs and ECs are routinely screened in England to identify LS cases, primarily using immunohistochemistry (IHC) or MSI analysis [11]. The former involves analysis of expression of all four MMR proteins in tumour sections [12]. The latter most commonly involves fragment length analysis of highly informative PCR amplified microsatellite markers (FLA-PCR [13,14]) using, for example, the Promega MSI Analysis System V1.2 (Promega MSI, [15]). Melt curve analysis of MSI marker amplicons [16], or analysis of markers within high throughput/panel sequencing data [17,18] are also now used.
These methods vary in terms of cost, throughput, and ease of use and result interpretation [11,12,13]. For instance, IHC is readily integrated with hospital pathology services, can often identify the gene affected, and is robust to heterogeneity in tumour cell content, but it requires expert interpretation and can miss up to 6% of pathogenic variants which do not affect antibody binding [19]. As a result, there is no single gold standard method for MMRd detection, and tumour specific guidelines for LS screening have been developed in the UK based on health economic evaluation [20,21], with IHC or FLA-PCR based MSI methods recommended for CRCs (https://www.nice.org.uk/guidance/dg27), and IHC specifically recommended for ECs (https://www.nice.org.uk/guidance/dg42). Similarly, US and European medical professional organisations recommend the use of IHC over MSI to determine MMR status in EC patients being considered for immunotherapy [22,23].
One factor contributing to tumour specific guidelines is that while IHC and MSI give highly concordant results in CRCs [24,25], test concordance in ECs is much more variable [11,26]. Some variability can be attributed to use of dinucleotide repeat markers in early MSI assays which do not efficiently identify MSH6 deficiency, common in EC [27,28,29]. Levels of MSI are also generally lower in EC relative to CRC [30,31], suggesting that current MSI assays lack sensitivity or need to be optimised for use in this tumour type [18].
We have recently developed an amplicon sequencing based MSI method [32,33] which has been adopted as the primary assay of MMRd in CRC in our NHS region – the Newcastle MSI assay (NCL_MSI). Here we use this assay to analyse previously well characterised clinical trial cohorts with distinct concordance levels between IHC and MSI [34,35,36], and assess the impact both of using a larger and more sensitive MSI marker panel [32] and classification criteria specific for ECs. We also analyse the MSI signal within sporadic and LS tumours with respect to MMR protein loss and MMR gene affected.
2. Materials and Methods
2.1. Sample Details
A cohort of 200 EC DNAs were provided by the Ohio State University Comprehensive Cancer Center as two sets of 100 samples. Set 1 (training) were from individuals diagnosed with primary invasive EC between 2013 and 2016, prospectively enrolled onto the Ohio Colorectal Cancer Prevention Initiative (OCCPI [35]). Set 2 (validation) were from women for whom a hysterectomy or diagnostic biopsy had confirmed a newly-diagnosed EC between 2017 and 2020, and were enrolled on the Ohio Prevention and Treatment of Endometrial Cancer trial (OPTEC [34]). A second cohort of 191 ECs comprised women recruited to Manchester University NHS Foundation Trust gynaecological clinics between 2015 and 2017 following a diagnosis of EC, previously analysed in the Proportion of Endometrial Tumours Associated with Lynch Syndrome (PETALS) prospective study [37]. These were also divided into training (n=95), and validation (n=96) sets.
Both cohorts had similar numbers of MMRd/MMRp samples (~50:50) and included a small number of samples from LS patients (see Table S1). IHC results from all four MMR proteins were available for both cohorts. Promega MSI V1.2 results were available for all Manchester and OPTEC samples, and all OCCPI samples had clinical NGS MSI typing results together with Promega MSI from 76 samples (100% concordance between MSI methods). The MSI Low classification was treated as equivalent to MSS [38]. For validation sets, previous assay results and associated data were only provided after sequence analysis and initial NCL_MSI classification.
A further 35 CRCs derived from LS patients enrolled on the CaPP3 clinical trial (Trial number ISRCTN16261285) were obtained from the Cancer Prevention Programme bioresource, Newcastle University, and 56 unselected CRCs were obtained as anonymised discard FFPE clinical samples from the Newcastle NHS Genomics Laboratory Hub.
2.2. DNA Extraction, MSI Marker Panels, MIP Amplification and SEQUENCING
DNA was extracted from FFPE curls using the Gene Read DNA FFPE Kit (Qiagen, Hilden, Germany), and quantified using a QuBit 2.0 Fluorometer with QuBit dsDNA BR/HS Kits (Invitrogen, Paisley, UK). MSI marker panels (Table S2) and molecular Inversion Probes (MIP) sequences are described in [32,33,39] and Table S3. Oligos were obtained from Metabion (Planegg, Germany). MIP preparation and amplification was performed according to the protocol outlined in [33] using 100ng of template DNA. Amplicons were purified using AMPure XP beads (Beckman Coulter, Brea, CA, USA), diluted to 4nM in 10mM Tris pH 8.5, pooled in equal volumes, and sequenced as paired reads on MiSeq V3 kits (Illumina, SanDiego, CA, USA) to a depth of ~2000 reads per marker per sample using custom primers [40].
2.3. Sequence Analysis and MSI Classification
Sequencing reads were aligned against the hg19 human reference using BWA v0.7.17 [41], and classified using a naïve Bayes approach to produce an MSI score as outlined in [39]. In brief, training cohorts were used to estimate the probabilities of observing a microsatellite deletion allele frequency (and allelic bias where a nearby SNP could be used to distinguish paternal and maternal alleles) for each MSI marker in MSS and MSI-H tumours, enabling the posterior probability of a new sample being MSS or MSI-H to be estimated. Assay scores are log10 odds that a sample is MSI-H versus MSS, with scores >0 classified as MSI-H and <0 as MSS. The MSI marker panels and scoring methods are collectively referred to here as the Newcastle_MSI assay (NCL_MSI).
2.4. Comparison of Tumour Cell Content with MSI Classification
Tumour cell content (TCC) estimates were available for OCCPI and Manchester samples. In OCCPI they were recorded in 10% increments, but were not uniformly recorded for Manchester samples, with specific as well as minimum, maximum, and range estimates used. For analysis, range estimates were arbitrarily recoded as the midpoint, and minimum/maximum values were recoded as 5% above/below the figure given. A single text entry “very sparse” was recoded to 4%, 1% below the lowest numeric value recorded.
2.5. Statistical Analyses
All analyses were performed in R v3.3.1. Graphs were generated using the ggplot and ggpmisc packages. Analyses of the distribution of variables between sample cohorts/groups were performed using Fisher’s exact tests. For analysis of the relative frequency of marker reference alleles (RAFs) between sample groups, frequencies were normalised with respect to medians in a reference group to allow comparison across different markers. A two-sided binomial test was used to assess whether there was a significant excess or reduction in the number of markers showing increased VAF with respect to the reference group. For convenience we plotted the variant allele frequency (VAF = 1-RAF). For groups containing small numbers of samples, such an approach may not reflect general characteristics of the group as it does not account for correlations between different microsatellites within a sample. We therefore used Beta regression (as implemented in the R package glmmTMB) and mixed models to investigate the significance of these changes, allowing for differences in instability across individuals and markers.
3. Results
The Ohio (OCCPI/OPTEC) and Manchester (PETALS) trials involved unselected series of EC patients, with MMRd tumour frequencies between 25% and 29% [34,35,36]. Concordance between IHC and MSI was uniformly high within the Ohio pathway [42,43], but was only 88% within the PETALS trial (n=500), falling to 61% among MMRd samples [36]. The sample cohorts obtained for analysis with the NCL_MSI assay were enriched to contain approximately equal numbers of MMRd/MMRp samples.
We first amplified both cohorts using our CRC trained Molecular Inversion Probe (MIP) 24 marker MSI panel (NCL_MSI) [33]. Sequence data was successfully generated from 196/200 Ohio samples (received as purified DNAs), but 26/191 (14%) of the Manchester samples (received as paraffin embedded blocks) had to be excluded due to processing, amplification, or sequence quality issues (see Table S4). Analysis of the previously reported IHC and MSI status of these samples (Table 1), confirmed there was a difference in assay concordance between Ohio and Manchester cohorts (18%) which was highly significant (p=1.2x10⁻⁷). MMR defects within the cohorts, in terms of genes affected and inheritance status, are summarised in Table S1.
3.1. NCL_MSI Is Highly Concordant with Ohio Assay Results
Concordance of the NCL_MSI results with the original assays, and sensitivity and specificity relative to IHC (the method recommended for LS screening of ECs), are presented in Table 2, split by cohort (Ohio/Manchester) and dataset (training/validation). Results from both the Ohio training (OCCPI) and validation (OPTEC) datasets were consistent with the original studies, with concordance ranging from 94% to 98%. In merged data (n=196), NCL_MSI gave 97% concordance with Ohio MSI results and 94% with IHC, similar to the concordance between the original assays (96%). NCL_MSI showed slight reductions in both sensitivity (93% v 95%) and specificity (96% v 97%) relative to IHC, but the changes were not significant.
3.2. NCL_MSI Increases Assay Concordance and Sensitivity in the Manchester Cohort
Concordance between the original assays was higher in the Manchester validation dataset than in the training dataset (82% v 73%, Table 2), but the difference did not reach statistical significance (p=0.14). The NCL_MSI assay increased concordance with IHC in both datasets, reducing the difference between the two (85% vs 84%). In merged data, concordance values with both original assays were similar (86% with MSI, 84% with IHC), concordance with IHC was improved (78% to 84%), and there was an increase in sensitivity of 11% (65% to 76%). However, these improvements were not significant (both p>0.05).
3.3. Increasing Marker Number and MSI Classifier Retraining Does Not Improve Assay Concordance
Although the NCL_MSI assay reduced the difference in concordance between IHC and MSI classifications in the Ohio and Manchester cohorts (Table 2), they remained significantly different between cohorts (original p=5x10⁻⁵, NCL_MSI p= 0.002). Before analysing the Manchester data in more detail, we therefore tried to improve assay concordance further by increasing MSI marker number, and by altering the training data used with the MSI classifier (Table S5).
We first scored both cohorts with an updated MIP panel of 56 highly discriminating MSI markers, known to improve the separation between classifier scores of MSS and MSI-H CRCs [32]. Data was successfully generated from all 196 Ohio samples and 156/165 Manchester samples. Reclassification resulted in small increases in concordance (94% to 96%) and sensitivity (93% to 96%) with respect to IHC in the Ohio cohort, and reductions in concordance (84% to 81%) and sensitivity (76% to 70%) in the Manchester cohort. None were statistically significant (p>0.05). We also assessed the impact of training the 24 marker classifier using ECs, the appropriate tumour type. Again, only minor and non-significant changes were observed (Table S5). All subsequent analyses of the Manchester cohort were therefore performed using the original 24 marker NCL_MSI results.
3.4. Improved Concordance Predominantly Affects IHC MMRd and Promega MSS Classifications
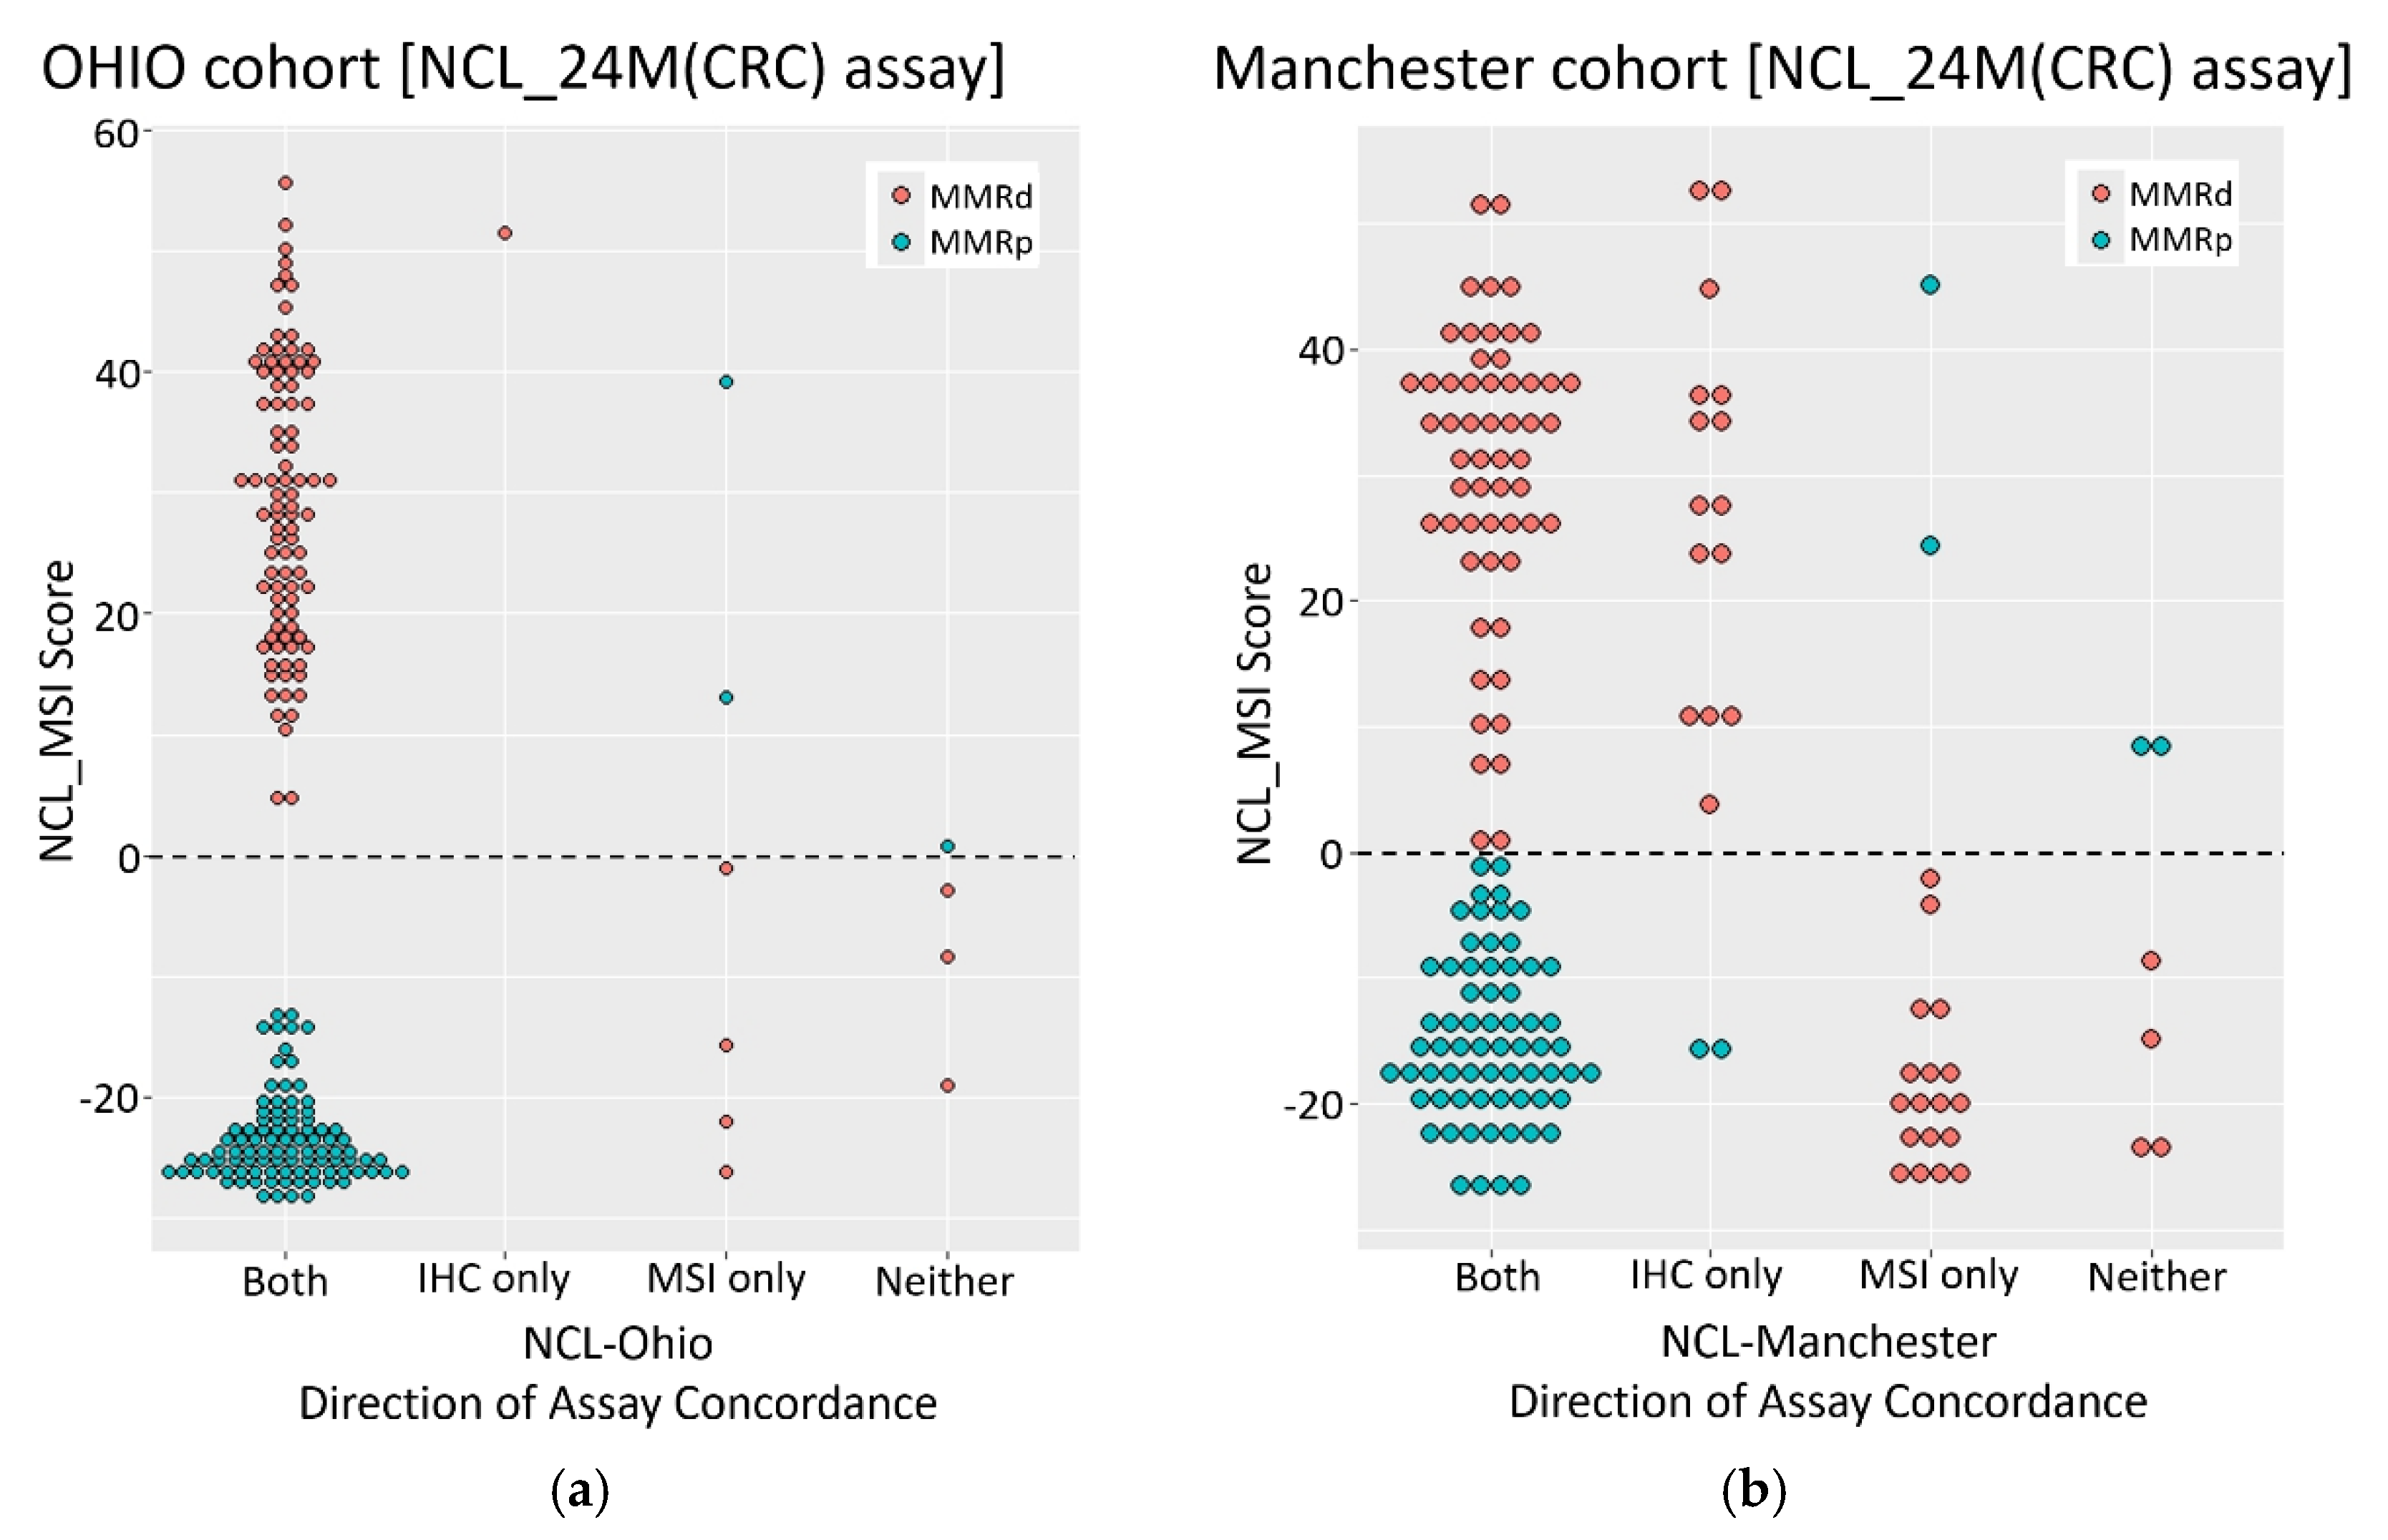
To investigate the discordance between assays and cohorts in more detail, we plotted NCL_MSI scores with respect to both the nature of assay concordance, and MMR status as defined by IHC (Figure 1). In the Ohio cohort, the NCL_MSI assay was concordant with both original assays in 94% of cases, with MSI-H and MSS samples clearly dichotomised by assay score. Of 11 samples showing discordance between NCL_MSI and one or both of the original assay results, one agreed with IHC only, six with MSI only, and four with neither (Figure 1a, Table S6). Only six samples (3%) gave scores within 10 points of the classification threshold.
In contrast, the Manchester samples were not so clearly dichotomised, with 28 (17%) giving NCL_MSI scores of between +10 and -10 (Figure 1b). In total, 43 (26%) showed discordance between the NCL_MSI classification and one or both of the original assay results (Figure 1b and Table S7). The majority of these (37) were MMRd by IHC. Only six were discordant with both original assays (2 MSI-H, 4 MSS by NCL_MSI). Most samples where the NCL_MSI assay was concordant with IHC only were MSI-H by NCL_MSI but MSS by Promega MSI (15/17, scores >0). In contrast, most samples where the NCL_MSI assay was concordant with Promega MSI only were MSS by both MSI analyses but MMRd by IHC (18/20, scores <0). This association between NCL_MSI status and direction of assay concordance was significant (p<1x10⁻⁵), indicating a systematic difference in assay performance within this cohort.
3.5. Manchester Discordance Suggests Promega MSI False Negatives and IHC False Positives
To try to resolve the origin of assay discordance in the Manchester cohort, we used MLH1 promoter hypermethylation status which was available for 92 samples, including 69 sporadic cases with loss of MLH1 protein staining (Figure 2 and Tables S7 and S8), as an independent measure of MMR status (truth set). Among sporadic samples with loss of MLH1 protein expression and discordant assay results (Figure 2) there was a significant association between NCL_MSI classification and MLH1 promoter hypermethylation status (p=0.0028). Specifically, 11/12 samples where NCL_MSI was concordant with IHC but not Promega MSI were both MSI-H by NCL_MSI and hypermethylated, indicating probable Promega MSI false negatives. In contrast, 8/11 samples concordant with Promega MSI but not IHC were MSS by both MSI assays and had normal methylation, indicating probable IHC false positives. This suggests that a minimum of 19 out of 69 sporadic samples with MLH1 loss (28%) may have been incorrectly classified by one or other assay in the original analysis. Furthermore, among these samples, NCL_MSI classification had the highest overall concordance with methylation status; 62/69 samples (90%), compared to 57/69 (83%) for IHC, and 52/69 (75%) for Promega MSI (Figure 2).
3.6. Sample Tumour Cell Content Differs between Cohorts and Impacts Upon MSI Classification
As accuracy of MSI classification is known to be affected by tumour cell content (TCC), we reviewed the results in relation to estimates of TCC where available. This information was not recorded in the same way in the two cohorts (see methods), but a clear difference was apparent: Within the Ohio cohort, 85/87 (98%) of samples for which data was available had TCC estimates of 50% or above (Table S6), compared to only 47/96 (49%) within the Manchester cohort (Table S7). Furthermore, the lowest estimate was 40% in the Ohio samples, whereas 23 Manchester samples had a TCC of 20% or less, necessitating enrichment through macrodissection prior to DNA extraction, as per the PETALS protocol [36]. Manchester samples classified as MSS by Promega MSI were found to have a lower TCC than samples classified as MSI-H (p=0.037, Mann Whitney U test), but no difference was observed with respect to NCL_MSI classification (p=0.11) although the trend was the same. This suggests that the lower TCC of the Manchester samples could be contributing to Promega MSI false negatives, despite enrichment. Furthermore, 12 samples were recorded as having patchy IHC staining within the Manchester cohort (Table S7), suggestive of subclonal MMRd, and these were found to be over represented in samples with MSI/IHC discordance (7/42 v 5/123, p=0.013).
3.7. Germline Cases Are Not Identified Efficiently by Either MSI Assay in the Manchester Cohort
As LS detection is a major rationale for MMRd/MSI analysis, we next examined assay performance in tumours with germline pathogenic MMR mutations as a separate group (Table 3). In the Ohio cohort, all three assays identified 5/6 LS tumours as MMRd/MSI-H, with one (ECT192) identified only by IHC, and one (ECT102) identified only by both MSI assays. In the Manchester cohort, IHC identified all 14 LS tumours with known pathogenic germline variants, while 8/14 and 7/14 were classified as MSI-H by NCL_MSI and Promega MSI respectively. There was disagreement between the MSI assays in three cases, and both classified 5/8 tumours with isolated MSH6 loss as MSS.
Across tumours with pathogenic germline mutations there was a significant association between MSH6 loss and MSS classification (p=0.028); isolated MSH6 loss was found in 7/8 tumours classified as MSS by either MSI assay, compared to 4/12 classified MSI-H by both (Table 3). This suggested that LS derived ECs, particularly those with MSH6 loss, are difficult to identify with MSI analyses and led us to investigate the association between somatic variation in microsatellite length and pathogenic germline MMR variants.
3.8. Variant Allele Frequencies Are Lower in Tumours from MMR Germline Defect Carriers
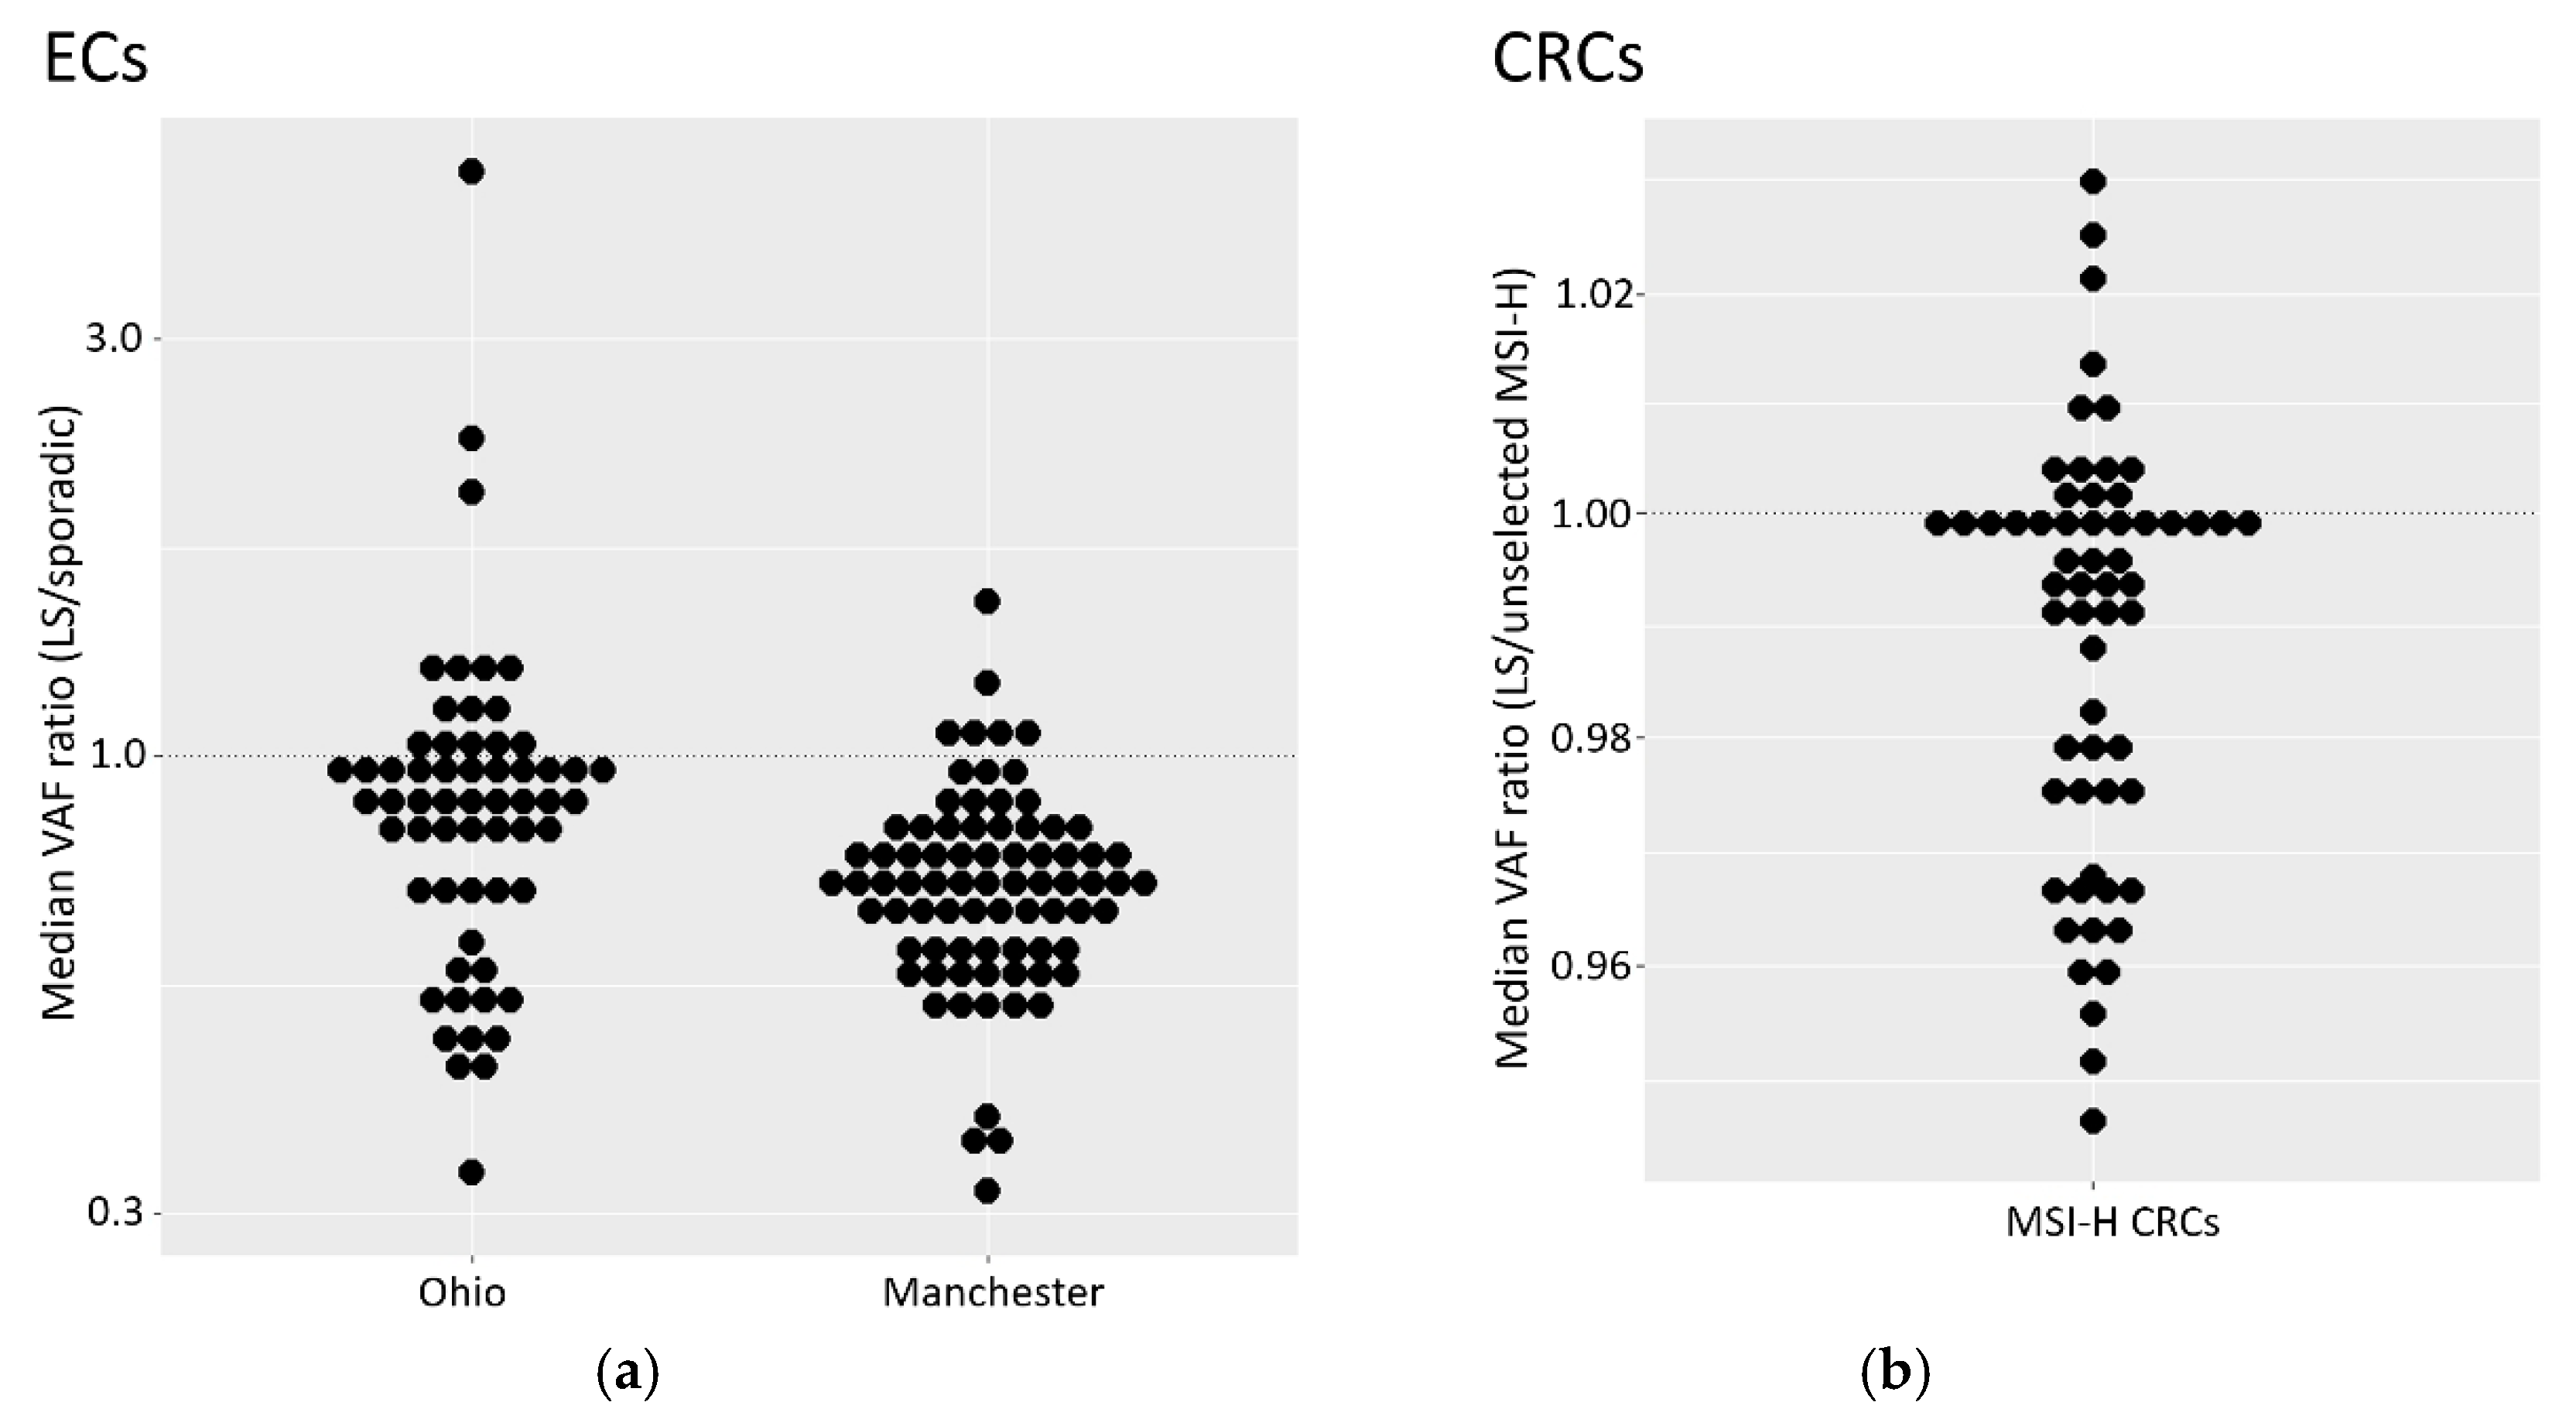
To explore the relationship between tumour origin (germline/sporadic) and MSI levels, the median VAF for markers in tumours from germline carriers were normalised against the median VAF for each marker in sporadic tumours (Figure 3a and see methods). This mitigated against inter-marker differences and allowed comparison across all MSI markers. A ratio below 1 represents a reduction in median VAF among germline tumours compared to sporadic.
Across both EC cohorts, MSI markers in samples with germline mutations showed lower variant allele frequencies than in sporadic samples (Figure 3a, p values: 5.8x10⁻⁵ for Ohio, 1.8 x10⁻¹⁵ for Manchester). However, these results are expected to be influenced by correlations between VAFs within samples (for example due to variation in TCC). Analysis of each marker separately did not lead to statistically significant differences due, possibly, to the small number of germline cases in both cohorts (six and 14). We therefore explored whether similar results could be observed in a cohort of 35 MSI-H CRCs from LS patients previously analysed with 60 MSI markers (Tables S2 and S3), normalised to a cohort of 56 unselected MSI-H tumours (see methods). Beta regression, and a mixed model to account for sample specific effects within samples, identified a significant effect of LS status (Figure 3b, p=0.002). This is consistent with the observations in EC, although the magnitude of the difference relative to the control group was greatly reduced. The unselected reference group was, however, treated as if they included no germline defects, an assumption which could reduce the apparent difference between groups.
3.9. Variant Allele Frequency is Reduced in ECs with Isolated Loss of MSH6 Expression
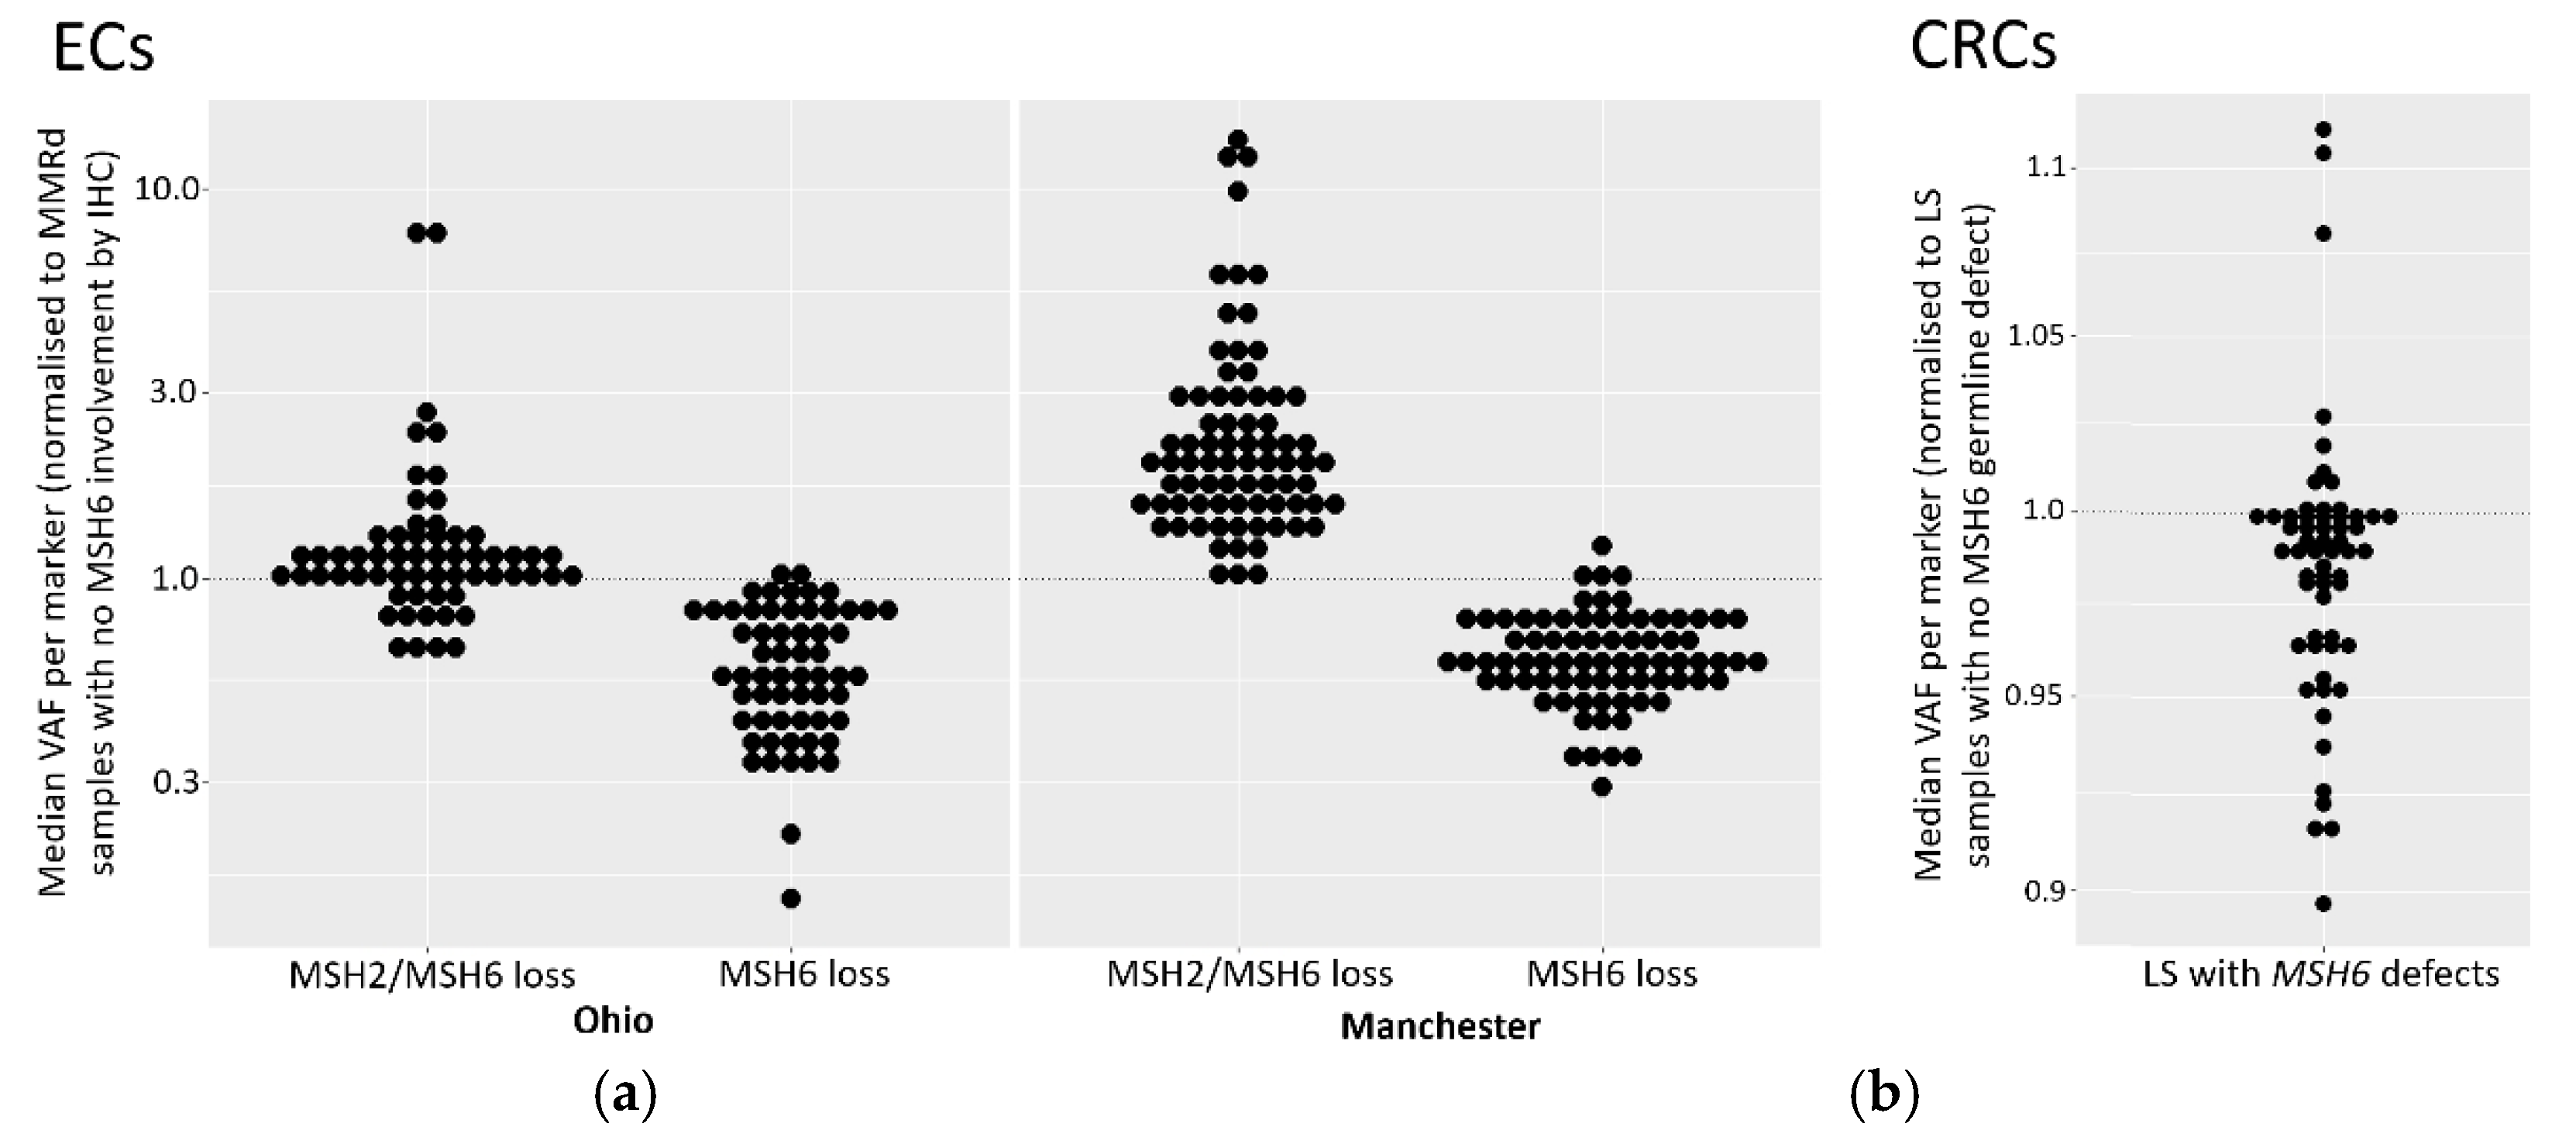
To investigate the relationship between variant allele frequencies (VAFs) and loss of MSH6 protein expression we analysed median MSI marker VAFs, both in samples with isolated MSH6 loss and in samples lacking expression of MSH6 and MSH2, normalised to MMRd samples with no MSH6 loss (Figure 4a). Across both cohorts, ECs with isolated MSH6 loss had lower marker VAFs (p values: 1.0x 10⁻¹⁸ for Manchester; 8.5 x 10 -16 for Ohio), indicative of lower MSI. In contrast, in ECs with loss of both MSH2 and MSH6 expression, VAFs were higher (p-values: 1.8 x 10⁻⁴ and 1.0 x 10⁻²¹ for the Ohio and Manchester cohorts respectively). A mixed effect model, to account for within sample correlations, showed significant differences between samples with isolated MSH6 loss compared to samples without MSH6 loss in both cohorts (p-values: 0.009 and 6.2x10⁻⁵ for Ohio and Manchester respectively). However, the differences did not reach statistical significance when comparing samples with MSH2 and MSH6 loss to samples without MSH6 loss (p-values 0.30 and 0.07 and for Ohio and Manchester respectively).
We also sought to replicate these findings in the cohort of CRCs from LS patients (n=35) by comparing median marker VAFs from tumours with MSH6 lesions, normalised to tumours with germline defects in other MMR genes. The results (Figure 4b) showed an excess of markers with median normalised VAFs below 1 in samples with MSH6 germline lesions. While the small number of patients with MSH6 defects in the CRCs (n=3) precluded more sophisticated analyses, this result is consistent with the observations in ECs.
4. Discussion
We assessed the performance of the amplicon sequencing based NCL_MSI assay for use in ECs by re-analysing well characterised tumour cohorts from prospective clinical trials, and investigated the basis of previously reported discordance between IHC and MSI results. The NCL_MSI results were very consistent with the Ohio studies; concordance between NCL_MSI, IHC, and the original MSI results being >94%, comparable to the concordance between IHC and MSI in CRCs [12,19,24,43]. In the Manchester cohort, the NCL_MSI assay improved MSI sensitivity with respect to IHC by over 10% compared to the Promega MSI assay. MLH1 promoter methylation data enabled two main groups of discordant samples to be identified (Figure 2): one suggesting Promega MSI false negatives (11 with MLH1 loss, hypermethylation, MSI-H by NCL_MSI but MSS by Promega MSI), the other IHC false positives (eight with MLH1 loss, normal methylation, and MSS by both MSI assays). This suggests that in the original Manchester analysis, up to 16% of tumours with MLH1 protein loss were Promega MSI false negatives, and up to 12% with loss of MLH1 were IHC false positives.
These results establish that the NCL_MSI assay can be more sensitive than Promega MSI in some EC cohorts. One potential confounding factor is that Ohio samples analysed were the same DNA aliquots used in the trials, whereas the Manchester samples were DNAs extracted from independent tissue curls taken from the original FFPE blocks analysed. This resulted in sample drop out and may have contributed to the higher discordance of the NCL_MSI assay with these samples. However, it cannot account for the significant skew with respect to IHC/Promega MSI classification, or significant association of NCL_MSI-H calls with MLH1 promoter methylation status among discordant samples.
The results do not establish why assay concordance was significantly different between the original Ohio and Manchester analyses. All three trials (OCCPI, OPTEC, PETALS) had very similar enrolment and study protocols, but there are two potentially important differences.
First, although IHC methodology was comparable between studies, how tumours were dichotomised as MMRd or MMRp differed. Ohio samples were classified using College of American Pathologist (CAP) guidelines [44], where samples with equivocal or weak IHC staining (cut off defined as >1% positive nuclei) are classified as mismatch repair proficient (MMRp). In the Manchester cohort, classification of such samples was based on consensus guidelines [37], staining was repeated if results were inconclusive, and final classification was agreed by a team of expert pathologists. As a result, some samples with patchy IHC staining were classified as MMRd, others as MMRp (Table s003 [36]), with all being referred on for germline MMR gene testing.
The potential impact of this difference can be understood by considering how IHC was conceptually embedded within the care pathways. In Ohio, it was complementary to MSI testing, with the expectation that any MMRd tumours missed as a result of the stringent IHC classification would be picked up by MSI testing [43]. Within Manchester, IHC was deployed as a stand alone assay to identify all potential LS cases, with anomalous results leading to referral for germline testing irrespective of MSI status [37]. In such a pipeline, a small number of IHC MMRd false positives can be tolerated, even considered desirable, as they are of minor consequence relative to a missed LS diagnosis and would be excluded in subsequent steps of the LS diagnostic pathway.
In this context it is noteworthy that regions of tumours with patchy or subclonal MMR protein loss are known to have elevated frequencies of MSI [45] or somatic MMR gene mutations [46,47], and subclonal or weak MMR protein staining has recently been shown to account for much of the discordance between IHC and MSI assays [48,49]. This has led to the revision of US CAP recommendations to ensure that anomalous staining patterns are reported and interpreted consistently [48].
Second, review of Pathology reports established that some Manchester samples had low TCC, with a quarter having 20% or below and requiring enrichment prior to MSI analysis. Several were 5% or lower. Given that the limit of detection of Promega MSI is 10% tumour cells for CRC material [15], compared to ~3% for NCL_MSI [33], the significant association between low TCC and Promega MSS calls in the Manchester data strongly suggest that this contributed to Promega false negatives, and highlights the importance of selecting material with high TCC for molecular testing in ECs.
Despite the increased sensitivity of the NCL_MSI assay in the Manchester cohort, it could not reliably identify tumours with inherited pathogenic MMR mutations, particularly cases with isolated MSH6 loss by IHC, classifying six out of 11 as MSS (Table 3). While low TCC could be a contributing factor with specific samples (PET31 in particular), three of the Manchester LS MSH6 samples classified as MSS by NCL_MSI had TCCs of 50% or above (Table S7). These results therefore support current guidelines recommending IHC as the primary assay for LS detection, and assessment for immunotherapy treatment in EC patients (https://www.nice.org.uk/guidance/dg42, [22,23]).
However, IHC interpretation is subjective, can give equivocal results requiring repeat analysis, and relies on the expertise of the pathologist. Furthermore, MSI analysis can identify MMR mutations which do not affect antibody binding [50]. The assays are therefore complimentary, and use of both is desirable [43], and may be of particular importance in ECs given the variation in concordance observed here and elsewhere (reviewed in [26]). We have recently developed a direct to sequencing multiplex PCR format of the NCL_MSI assay [51] to facilitate routine and high throughput use. In addition, a further Promega MSI assay using longer microsatellite markers has been developed (LMR MSI) which also shows increased sensitivity for EC MMRd detection compared to the V1.2 assay [52].
The reduction of MSI signal we observe in ECs with isolated MSH6 loss adds to a growing body of evidence that detection of such tumours is particularly challenging using MSI. That there is also a reduced signal in LS tumours suggests that MSI-based detection of MMRd in ECs from LS patients with MSH6 lesions is particularly difficult. Because of the relatively low number of LS and MSH6 tumours in both EC cohorts, we also analysed CRC cohorts, and identified small, but significant, reductions in VAFs in both MSH6 and LS tumours.
An attenuated MSH6 MSI signal was first reported in CRC over 20 years ago [53] and is assumed to be due to functional redundancy between MSH6 and MSH3 [54,55]. The inclusion in early MSI panels of dinucleotide repeats, which MSH6 plays no role in repairing, may have accentuated this difference, but it has now been reported using a variety of MSI assays (including those using only mononucleotide repeats) and in a variety of disease contexts [16,32,56,57,58,59,60]. This is particularly noticeable in EC due to lower levels of MSI relative to CRC [30,31].
The evidence for a weaker MSI signal in LS derived tumours is less well documented. An early comparison of inherited and sporadic CRC [61] reported a reduction in the number of unstable markers in the former (72% vs 87%), but as six out of the 10 MSI markers used were dinucleotide repeats, this may have been related to higher rates of MSH6 deficiency among the inherited CRCs. Why LS tumours may have a reduced MSI signal is unknown, but could relate to differing tumorigenesis pathways and selection pressures. For example, MMRd tumours are highly immunogenic due to mutations in coding microsatellites leading to novel frameshift peptides [62,63], and increased T cell counts have been reported in the stroma, tumour, or invasive margins of MMRd/MSI-H LS derived CRCs [64,65], adenomas [66], and ECs [67,68], relative to sporadic tumours. Furthermore, the normal colonic mucosa of MMR mutation carriers develop numerous MMRd crypt foci not present in the general population [69] which could lead to immune surveillance, and LS cancers are often diagnosed before the 6th decade of life, the age at which the immune system begins to noticeably weaken [70]. Both could increase selection against increased frameshift peptide burden caused by high levels of MSI and result in the observed lower MSI marker VAFs within LS tumours.
5. Conclusions
Our re-analysis of clinical trial cohorts suggests that the Newcastle_MSI assay is more sensitive than Promega MSI V1.2, but further supports the prioritisation of IHC for LS detection in EC due to a reduced MSI signal relative to CRC which is particularly pronounced within inherited and sporadic MSH6 mutated tumours. The results also highlight how differences in IHC deployment, and tumour cell enrichment prior to molecular analyses, can impact upon assay concordance. However, as the use of IHC in isolation is also known to result in missed LS cases regardless of pathology expertise [19,71,72] and will result in some cases suitable for immune checkpoint inhibitor treatment being missed. A dual approach combining upfront IHC and MSI testing could provide optimal outcomes, particularly in healthcare systems like the UKs where low cost genomic testing operates alongside a histopathology service with documented staffing challenges [73,74].
Supplementary Materials
The following supporting information can be downloaded at the website of this paper posted on Preprints.org, Table S1: Summary of all tumour cohorts analysed; Table S2: Details of markers, marker sets and samples analysed; Table S3: MIP sequences of transcribed MSI markers used to analyse CRCs. Table S4; Sample numbers received, processed and analysed by cohort; Table S5: Impact of classifier retraining on assay concordance and sensitivity/specificity with respect to IHC; Table S6. Details of Ohio cohort with original assay results, NCL_MSI scores and concordance patterns; Table S7: Details of Manchester cohort with original assay results, NCL_MSI scores and concordance patterns; Table S8: MLH1 Promoter Hypermethylation and NCL_MSI (24 marker CRC trained) classification relative to concordance with original Manchester assay results.
Author Contributions
Conceptualization, John Burn, Mauro Santibanez-Koref and Michael Jackson; Data curation, Richard Gallon, Mauro Santibanez-Koref and Michael Jackson; Formal analysis, Peter Sowter, Richard Gallon, Mauro Santibanez-Koref and Michael Jackson; Funding acquisition, Emma Crosbie and John Burn; Investigation, Peter Sowter, Christine Hayes, Rachel Phelps, Shaun Prior, Jenny Combe and Neil Ryan; Project administration, Gillian Borthwick; Resources, Rachel Pearlman, Heather Hampel, Paul Goodfellow, D Evans, Emma Crosbie and Neil Ryan; Supervision, John Burn, Mauro Santibanez-Koref and Michael Jackson; Visualization, Peter Sowter and Mauro Santibanez-Koref; Writing – original draft, Richard Gallon, John Burn, Mauro Santibanez-Koref and Michael Jackson; Writing – review & editing, Peter Sowter, Richard Gallon, Holly Buist, Heather Hampel, Emma Crosbie, John Burn, Mauro Santibanez-Koref and Michael Jackson.
Funding
This research was funded by Cancer Research UK, grant numbers C569/A24991 and C1297/A15934, a donation from the Barbour Foundation UK (Charity number 328081), a National Institute for Health and Care Research (NIHR) Advanced Fellowship (NIHR300650) and the NIHR Manchester Biomedical Research Centre (NIHR203308).
Institutional Review Board Statement
The study was conducted in accordance with the Declaration of Helsinki, and approved by the NHS Health Research Authority Research Ethics Committee (References 13/LO/1514 and 14/NE/0103).
Informed Consent Statement
Informed consent was obtained from all subjects involved in the study.
Data Availability Statement
All FASTQ files are available from the EMBL-EBI European Nucleotide Archive, Project Accession reference PRJEB79220.
Conflicts of Interest
RG, JB, MS-K and MSJ are named inventors on patents covering the microsatellite instability markers analysed: WO/2018/027231, WO/2021/019197 and BG2114136.1 (filed October 1st 2021). All other authors declare no conflicts of interest. The funders had no role in the design of the study; in the collection, analyses, or interpretation of data; in the writing of the manuscript; or in the decision to publish the results.
References
- Le DT, Durham JN, Smith KN, Wang H, Bartlett BR, Aulakh LK, et al. Mismatch repair deficiency predicts response of solid tumors to PD-1 blockade. Science. 2017;357(6349):409-13. [CrossRef] [PubMed]
- Andre T, Shiu KK, Kim TW, Jensen BV, Jensen LH, Punt C, et al. Pembrolizumab in Microsatellite-Instability-High Advanced Colorectal Cancer. N Engl J Med. 2020;383(23):2207-18. [CrossRef] [PubMed]
- Burn J, Sheth H, Elliott F, Reed L, Macrae F, Mecklin JP, et al. Cancer prevention with aspirin in hereditary colorectal cancer (Lynch syndrome), 10-year follow-up and registry-based 20-year data in the CAPP2 study: a double-blind, randomised, placebo-controlled trial. Lancet. 2020;395(10240):1855-63. [CrossRef] [PubMed]
- Monahan KJR, N.; Monje-Garcia, L.; Armstrong, R.; Church, D. N.; Cook, J.; Elghobashy, A.; Lalloo, F.; Lane, S.; Frank D McDermott, F. D.; Miles, T.; Hardy, S. A.; Tyson, A.; Ya Wen Wang, V.; Kim, A. ; Gelinas, S; Faravelli, F.; Elmslie, F.; Shaw, A. C. The English National Lynch Syndrome transformation project: an NHS Genomic Medicine Service Alliance (GMSA) programme. BMJ Oncology. 2023;2:e000124. [CrossRef]
- Lynch HT, Lynch PM, Lanspa SJ, Snyder CL, Lynch JF, Boland CR. Review of the Lynch syndrome: history, molecular genetics, screening, differential diagnosis, and medicolegal ramifications. Clin Genet. 2009;76(1):1-18. [CrossRef] [PubMed]
- Duraturo F, Liccardo R, De Rosa M, Izzo P. Genetics, diagnosis and treatment of Lynch syndrome: Old lessons and current challenges. Oncol Lett. 2019;17(3):3048-54. [CrossRef] [PubMed]
- Battaglin F, Naseem M, Lenz HJ, Salem ME. Microsatellite instability in colorectal cancer: overview of its clinical significance and novel perspectives. Clin Adv Hematol Oncol. 2018;16(11):735-45. PubMed PubMed Central PMCID: PMCPMC7493692. [PubMed]
- Latham A, Srinivasan P, Kemel Y, Shia J, Bandlamudi C, Mandelker D, et al. Microsatellite Instability Is Associated With the Presence of Lynch Syndrome Pan-Cancer. J Clin Oncol. 2019;37(4):286-95. Epub 20181030. [CrossRef] [PubMed]
- Dominguez-Valentin M, Haupt S, Seppala TT, Sampson JR, Sunde L, Bernstein I, et al. Mortality by age, gene and gender in carriers of pathogenic mismatch repair gene variants receiving surveillance for early cancer diagnosis and treatment: a report from the prospective Lynch syndrome database. EClinicalMedicine. 2023;58:101909. Epub 20230320. [CrossRef] [PubMed]
- Moller P, Seppala TT, Ahadova A, Crosbie EJ, Holinski-Feder E, Scott R, et al. Dominantly inherited micro-satellite instable cancer - the four Lynch syndromes - an EHTG, PLSD position statement. Hered Cancer Clin Pract. 2023;21(1):19. Epub 20231011. [CrossRef] [PubMed]
- Gallon R, Gawthorpe P, Phelps RL, Hayes C, Borthwick GM, Santibanez-Koref M, et al. How Should We Test for Lynch Syndrome? A Review of Current Guidelines and Future Strategies. Cancers (Basel). 2021;13(3):406. [CrossRef] [PubMed]
- Shia, J. Immunohistochemistry versus microsatellite instability testing for screening colorectal cancer patients at risk for hereditary nonpolyposis colorectal cancer syndrome. Part I. The utility of immunohistochemistry. J Mol Diagn. 2008;10(4):293-300. Epub 20080613. [CrossRef] [PubMed]
- Zhang, L. Immunohistochemistry versus microsatellite instability testing for screening colorectal cancer patients at risk for hereditary nonpolyposis colorectal cancer syndrome. Part II. The utility of microsatellite instability testing. J Mol Diagn. 2008;10(4):301-7. Epub 20080613. [CrossRef] [PubMed]
- De’ Angelis GL, Bottarelli L, Azzoni C, De’ Angelis N, Leandro G, Di Mario F, et al. Microsatellite instability in colorectal cancer. Acta Biomed. 2018;89(9-S):97-101. [CrossRef] [PubMed]
- Berg KD, Glaser CL, Thompson RE, Hamilton SR, Griffin CA, Eshleman JR. Detection of microsatellite instability by fluorescence multiplex polymerase chain reaction. J Mol Diagn. 2000;2(1):20-8. [CrossRef] [PubMed]
- Ukkola I, Nummela P, Pasanen A, Kero M, Lepisto A, Kytola S, et al. Detection of microsatellite instability with Idylla MSI assay in colorectal and endometrial cancer. Virchows Arch. 2021;479(3):471-9. Epub 20210323. [CrossRef] [PubMed]
- Renault V, Tubacher E, How-Kit A. Assessment of Microsatellite Instability from Next-Generation Sequencing Data. Adv Exp Med Biol. 2022;1361:75-100. [CrossRef] [PubMed]
- Vanderwalde A, Spetzler D, Xiao N, Gatalica Z, Marshall J. Microsatellite instability status determined by next-generation sequencing and compared with PD-L1 and tumor mutational burden in 11,348 patients. Cancer Med. 2018;7(3):746-56. Epub 20180213. [CrossRef] [PubMed]
- Hechtman JF, Rana S, Middha S, Stadler ZK, Latham A, Benayed R, et al. Retained mismatch repair protein expression occurs in approximately 6% of microsatellite instability-high cancers and is associated with missense mutations in mismatch repair genes. Mod Pathol. 2020;33(5):871-9. Epub 20191219. [CrossRef] [PubMed]
- Snowsill T, Huxley N, Hoyle M, Jones-Hughes T, Coelho H, Cooper C, et al. A systematic review and economic evaluation of diagnostic strategies for Lynch syndrome. Health Technol Assess. 2014;18(58):1-406. [CrossRef] [PubMed]
- Snowsill TM, Ryan NAJ, Crosbie EJ. Cost-Effectiveness of the Manchester Approach to Identifying Lynch Syndrome in Women with Endometrial Cancer. Journal of Clinical Medicine. 2020;9(6). [CrossRef]
- Bartley AN, Mills AM, Konnick E, Overman M, Ventura CB, Souter L, et al. Mismatch Repair and Microsatellite Instability Testing for Immune Checkpoint Inhibitor Therapy: Guideline From the College of American Pathologists in Collaboration With the Association for Molecular Pathology and Fight Colorectal Cancer. Arch Pathol Lab Med. 2022;146(10):1194-210. [CrossRef] [PubMed]
- Luchini C, Bibeau F, Ligtenberg MJL, Singh N, Nottegar A, Bosse T, et al. ESMO recommendations on microsatellite instability testing for immunotherapy in cancer, and its relationship with PD-1/PD-L1 expression and tumour mutational burden: a systematic review-based approach. Ann Oncol. 2019;30(8):1232-43. [CrossRef] [PubMed]
- Guyot D’Asnieres De Salins A, Tachon G, Cohen R, Karayan-Tapon L, Junca A, Frouin E, et al. Discordance between immunochemistry of mismatch repair proteins and molecular testing of microsatellite instability in colorectal cancer. ESMO Open. 2021;6(3):100120. Epub 20210428. [CrossRef] [PubMed]
- Hampel H, Pearlman R, Beightol M, Zhao W, Jones D, Frankel WL, et al. Assessment of Tumor Sequencing as a Replacement for Lynch Syndrome Screening and Current Molecular Tests for Patients With Colorectal Cancer. JAMA Oncol. 2018;4(6):806-13. [CrossRef] [PubMed]
- Crosbie EJ, Ryan NAJ, Arends MJ, Bosse T, Burn J, Cornes JM, et al. The Manchester International Consensus Group recommendations for the management of gynecological cancers in Lynch syndrome. Genet Med. 2019;21(10):2390-400. [CrossRef] [PubMed]
- Berends MJ, Wu Y, Sijmons RH, van der Sluis T, Ek WB, Ligtenberg MJ, et al. Toward new strategies to select young endometrial cancer patients for mismatch repair gene mutation analysis. J Clin Oncol. 2003;21(23):4364-70. [CrossRef] [PubMed]
- Lu KH, Schorge JO, Rodabaugh KJ, Daniels MS, Sun CC, Soliman PT, et al. Prospective determination of prevalence of lynch syndrome in young women with endometrial cancer. J Clin Oncol. 2007;25(33):5158-64. Epub 20071009. [CrossRef] [PubMed]
- Rubio I, Ibanez-Feijoo E, Andres L, Aguirre E, Balmana J, Blay P, et al. Analysis of Lynch Syndrome Mismatch Repair Genes in Women with Endometrial Cancer. Oncology. 2016;91(3):171-6. Epub 20160712. [CrossRef] [PubMed]
- Wang Y, Shi C, Eisenberg R, Vnencak-Jones CL. Differences in Microsatellite Instability Profiles between Endometrioid and Colorectal Cancers: A Potential Cause for False-Negative Results? J Mol Diagn. 2017;19(1):57-64. Epub 20161101. [CrossRef] [PubMed]
- Wu X, Snir O, Rottmann D, Wong S, Buza N, Hui P. Minimal microsatellite shift in microsatellite instability high endometrial cancer: a significant pitfall in diagnostic interpretation. Mod Pathol. 2019;32(5):650-8. Epub 20181115. [CrossRef] [PubMed]
- Gallon R, Phelps R, Hayes C, Brugieres L, Guerrini-Rousseau L, Colas C, et al. Constitutional Microsatellite Instability, Genotype, and Phenotype Correlations in Constitutional Mismatch Repair Deficiency. Gastroenterology. 2023;164(4):579-92 e8. Epub 20221229. [CrossRef] [PubMed]
- Gallon R, Sheth H, Hayes C, Redford L, Alhilal G, O’Brien O, et al. Sequencing-based microsatellite instability testing using as few as six markers for high-throughput clinical diagnostics. Hum Mutat. 2020;41(1):332-41. [CrossRef] [PubMed]
- Levine MD, Pearlman R, Hampel H, Cosgrove C, Cohn D, Chassen A, et al. Up-Front Multigene Panel Testing for Cancer Susceptibility in Patients With Newly Diagnosed Endometrial Cancer: A Multicenter Prospective Study. JCO Precis Oncol. 2021;5:1588-602. [CrossRef] [PubMed]
- Pearlman R, Frankel WL, Swanson BJ, Jones D, Zhao W, Yilmaz A, et al. Prospective Statewide Study of Universal Screening for Hereditary Colorectal Cancer: The Ohio Colorectal Cancer Prevention Initiative. JCO Precis Oncol. 2021;5. Epub 20210505. [CrossRef] [PubMed]
- Ryan NAJ, McMahon R, Tobi S, Snowsill T, Esquibel S, Wallace AJ, et al. The proportion of endometrial tumours associated with Lynch syndrome (PETALS): A prospective cross-sectional study. PLoS Med. 2020;17(9):e1003263. Epub 20200917. [CrossRef] [PubMed]
- Ryan N, Wall J, Crosbie EJ, Arends M, Bosse T, Arif S, et al. Lynch syndrome screening in gynaecological cancers: results of an international survey with recommendations for uniform reporting terminology for mismatch repair immunohistochemistry results. Histopathology. 2019;75(6):813-24. Epub 20190906. [CrossRef] [PubMed]
- Halford S, Sasieni P, Rowan A, Wasan H, Bodmer W, Talbot I, et al. Low-level microsatellite instability occurs in most colorectal cancers and is a nonrandomly distributed quantitative trait. Cancer Research. 2002;62(1):53-7. PubMed PMID: WOS:000173382600012.
- Redford L, Alhilal G, Needham S, O’Brien O, Coaker J, Tyson J, et al. A novel panel of short mononucleotide repeats linked to informative polymorphisms enabling effective high volume low cost discrimination between mismatch repair deficient and proficient tumours. PLoS One. 2018;13(8):e0203052. [CrossRef] [PubMed]
- Hiatt JB, Pritchard CC, Salipante SJ, O’Roak BJ, Shendure J. Single molecule molecular inversion probes for targeted, high-accuracy detection of low-frequency variation. Genome Res. 2013;23(5):843-54. [CrossRef] [PubMed]
- Li H, Durbin R. Fast and accurate short read alignment with Burrows-Wheeler transform. Bioinformatics. 2009;25(14):1754-60. [CrossRef] [PubMed]
- McConechy MK, Talhouk A, Li-Chang HH, Leung S, Huntsman DG, Gilks CB, McAlpine JN. Detection of DNA mismatch repair (MMR) deficiencies by immunohistochemistry can effectively diagnose the microsatellite instability (MSI) phenotype in endometrial carcinomas. Gynecol Oncol. 2015;137(2):306-10. Epub 20150128. [CrossRef] [PubMed]
- Goodfellow PJ, Billingsley CC, Lankes HA, Ali S, Cohn DE, Broaddus RJ, et al. Combined Microsatellite Instability, MLH1 Methylation Analysis, and Immunohistochemistry for Lynch Syndrome Screening in Endometrial Cancers From GOG210: An NRG Oncology and Gynecologic Oncology Group Study. J Clin Oncol. 2015;33(36):4301-8. Epub 20151109. [CrossRef] [PubMed]
- Longacre TA, Broaddus R, Chuang LT, Cohen MB, Jarboe EA, Mutter GL, et al. Template for Reporting Results of Biomarker Testing of Specimens From Patients With Carcinoma of the Endometrium. Arch Pathol Lab Med. 2017;141(11):1508-12. Epub 20170316. [CrossRef] [PubMed]
- Pai RK, Plesec TP, Abdul-Karim FW, Yang B, Marquard J, Shadrach B, Roma AR. Abrupt loss of MLH1 and PMS2 expression in endometrial carcinoma: molecular and morphologic analysis of 6 cases. Am J Surg Pathol. 2015;39(7):993-9. [CrossRef] [PubMed]
- McCarthy AJ, Capo-Chichi JM, Spence T, Grenier S, Stockley T, Kamel-Reid S, et al. Heterogenous loss of mismatch repair (MMR) protein expression: a challenge for immunohistochemical interpretation and microsatellite instability (MSI) evaluation. J Pathol Clin Res. 2019;5(2):115-29. Epub 20181219. [CrossRef] [PubMed]
- Mendoza RP, Wang P, Schulte JJ, Tjota MY, Jani I, Martinez AC, et al. Endometrial Carcinomas With Subclonal Loss of Mismatch Repair Proteins: A Clinicopathologic and Genomic Study. Am J Surg Pathol. 2023;47(5):589-98. Epub 20230303. [CrossRef] [PubMed]
- Scheiderer A, Riedinger C, Kimball K, Kilgore L, Orucevic A. Reporting Subclonal Immunohistochemical Staining of Mismatch Repair Proteins in Endometrial Carcinoma in the Times of Ever-Changing Guidelines. Arch Pathol Lab Med. 2022;146(9):1114-21. [CrossRef] [PubMed]
- Riedinger CJ, Esnakula A, Haight PJ, Suarez AA, Chen W, Gillespie J, et al. Characterization of mismatch-repair (MMR)/microsatellite instability (MSI)-discordant endometrial cancers. Cancer. 2024;130(3):385-99. Epub 20230926. [CrossRef] [PubMed]
- Nagabhushana P, Kumari S, Rohilla M, Srinivasan R, Arora A, Rastogi P. Discordant immunohistochemistry in an unusual MLH1 gene variant in a case of Lynch syndrome. Gynecol Oncol Rep. 2021;37:100854. Epub 20210828. [CrossRef] [PubMed]
- Gallon R, Herrero-Belmonte P, Phelps R, Hayes C, Sollars E, Egan D, et al. A novel colorectal cancer test combining microsatellite instability and BRAF/RAS analysis: Clinical validation and impact on Lynch syndrome screening. BJC Rep. 2024;2(1):48. Epub 20240701. [CrossRef] [PubMed]
- Lin JH, Chen S, Pallavajjala A, Guedes LB, Lotan TL, Bacher JW, Eshleman JR. Validation of Long Mononucleotide Repeat Markers for Detection of Microsatellite Instability. J Mol Diagn. 2022;24(2):144-57. Epub 20211202. [CrossRef] [PubMed]
- Berends MJ, Wu Y, Sijmons RH, Mensink RG, van der Sluis T, Hordijk-Hos JM, et al. Molecular and clinical characteristics of MSH6 variants: an analysis of 25 index carriers of a germline variant. Am J Hum Genet. 2002;70(1):26-37. [CrossRef] [PubMed]
- Acharya S, Wilson T, Gradia S, Kane MF, Guerrette S, Marsischky GT, et al. hMSH2 forms specific mispair-binding complexes with hMSH3 and hMSH6. Proc Natl Acad Sci U S A. 1996;93(24):13629-34. [CrossRef] [PubMed]
- Marsischky GT, Filosi N, Kane MF, Kolodner R. Redundancy of Saccharomyces cerevisiae MSH3 and MSH6 in MSH2-dependent mismatch repair. Genes Dev. 1996;10(4):407-20. [CrossRef] [PubMed]
- Hampel H, Frankel W, Panescu J, Lockman J, Sotamaa K, Fix D, et al. Screening for Lynch syndrome (hereditary nonpolyposis colorectal cancer) among endometrial cancer patients. Cancer Res. 2006;66(15):7810-7. [CrossRef] [PubMed]
- Bennett JA, Pesci A, Morales-Oyarvide V, Da Silva A, Nardi V, Oliva E. Incidence of Mismatch Repair Protein Deficiency and Associated Clinicopathologic Features in a Cohort of 104 Ovarian Endometrioid Carcinomas. Am J Surg Pathol. 2019;43(2):235-43. [CrossRef] [PubMed]
- Gatius S, Velasco A, Varela M, Cuatrecasas M, Jares P, Setaffy L, et al. Comparison of the Idylla MSI assay with the Promega MSI Analysis System and immunohistochemistry on formalin-fixed paraffin-embedded tissue of endometrial carcinoma: results from an international, multicenter study. Virchows Arch. 2022;480(5):1031-9. Epub 20220205. [CrossRef] [PubMed]
- You JF, Buhard O, Ligtenberg MJ, Kets CM, Niessen RC, Hofstra RM, et al. Tumours with loss of MSH6 expression are MSI-H when screened with a pentaplex of five mononucleotide repeats. Br J Cancer. 2010;103(12):1840-5. Epub 20101116. [CrossRef] [PubMed]
- Helderman NC, Van Der Werf-‘t Lam AS, Msh6 Tumor G, Morreau H, Boot A, Van Wezel T, Nielsen M. Molecular Profile of MSH6-Associated Colorectal Carcinomas Shows Distinct Features From Other Lynch Syndrome-Associated Colorectal Carcinomas. Gastroenterology. 2023;165(1):271-4 e2. Epub 20230315. [CrossRef] [PubMed]
- Young J, Simms LA, Biden KG, Wynter C, Whitehall V, Karamatic R, et al. Features of colorectal cancers with high-level microsatellite instability occurring in familial and sporadic settings: parallel pathways of tumorigenesis. Am J Pathol. 2001;159(6):2107-16. [CrossRef] [PubMed]
- Bohaumilitzky L, von Knebel Doeberitz M, Kloor M, Ahadova A. Implications of Hereditary Origin on the Immune Phenotype of Mismatch Repair-Deficient Cancers: Systematic Literature Review. J Clin Med. 2020;9(6). Epub 20200604. [CrossRef] [PubMed]
- Schwitalle Y, Kloor M, Eiermann S, Linnebacher M, Kienle P, Knaebel HP, et al. Immune response against frameshift-induced neopeptides in HNPCC patients and healthy HNPCC mutation carriers. Gastroenterology. 2008;134(4):988-97. Epub 20080111. [CrossRef] [PubMed]
- Shia J, Ellis NA, Paty PB, Nash GM, Qin J, Offit K, et al. Value of histopathology in predicting microsatellite instability in hereditary nonpolyposis colorectal cancer and sporadic colorectal cancer. Am J Surg Pathol. 2003;27(11):1407-17. [CrossRef] [PubMed]
- Janikovits J, Muller M, Krzykalla J, Korner S, Echterdiek F, Lahrmann B, et al. High numbers of PDCD1 (PD-1)-positive T cells and B2M mutations in microsatellite-unstable colorectal cancer. Oncoimmunology. 2018;7(2):e1390640. Epub 20171106. [CrossRef] [PubMed]
- Koornstra JJ, de Jong S, Boersma-van Eck W, Zwart N, Hollema H, de Vries EG, Kleibeuker JH. Fas ligand expression in lynch syndrome-associated colorectal tumours. Pathol Oncol Res. 2009;15(3):399-406. [CrossRef] [PubMed]
- Pakish JB, Zhang Q, Chen Z, Liang H, Chisholm GB, Yuan Y, et al. Immune Microenvironment in Microsatellite-Instable Endometrial Cancers: Hereditary or Sporadic Origin Matters. Clin Cancer Res. 2017;23(15):4473-81. Epub 20170306. [CrossRef] [PubMed]
- Ramchander NC, Ryan NAJ, Walker TDJ, Harries L, Bolton J, Bosse T, et al. Distinct Immunological Landscapes Characterize Inherited and Sporadic Mismatch Repair Deficient Endometrial Cancer. Front Immunol. 2019;10:3023. Epub 20200109. [CrossRef] [PubMed]
- Staffa L, Echterdiek F, Nelius N, Benner A, Werft W, Lahrmann B, et al. Mismatch repair-deficient crypt foci in Lynch syndrome--molecular alterations and association with clinical parameters. PLoS One. 2015;10(3):e0121980. Epub 20150327. [CrossRef] [PubMed]
- Weyand CM, Goronzy JJ. Aging of the Immune System. Mechanisms and Therapeutic Targets. Ann Am Thorac Soc. 2016;13 Suppl 5(Suppl 5):S422-S8. [CrossRef] [PubMed]
- Stelloo E, Jansen AML, Osse EM, Nout RA, Creutzberg CL, Ruano D, et al. Practical guidance for mismatch repair-deficiency testing in endometrial cancer. Ann Oncol. 2017;28(1):96-102. [CrossRef] [PubMed]
- Li X, Zhang S, Zeng J, Song SS, Liu X, Kang W, et al. Heterogeneous expression of mismatch repair proteins and interpretation of immunohistochemical results in colorectal cancer and endometrial cancer. Pathol Res Pract. 2023;248:154647. Epub 20230702. [CrossRef] [PubMed]
- Committee HaSC. Clearing the Backlog Caused by the Pandemic. HC; 2021. p. 43.
- Aldridge J. obot RCoP. Written evidence submitted by the Royal College of Pathologists (CBP0011) 2021. Available from: https://committees.parliament.uk/writtenevidence/38399/html/.
Figure 1.
Concordance between NCL_MSI and original IHC/MSI results from both cohorts. (a) Ohio. (b) Manchester. X axis - concordance of NCL MSI score obtained with the CRC trained 24 marker panel. Y axis – NCL MSI assay score (CRC trained 24 marker panel). Sample colour indicates MMR status by IHC.
Figure 1.
Concordance between NCL_MSI and original IHC/MSI results from both cohorts. (a) Ohio. (b) Manchester. X axis - concordance of NCL MSI score obtained with the CRC trained 24 marker panel. Y axis – NCL MSI assay score (CRC trained 24 marker panel). Sample colour indicates MMR status by IHC.
| Cohort | Ohio | Manchester | ||||
|---|---|---|---|---|---|---|
| Dataset | Train | Val | Merged | Train | Val | Merged |
| IHC Result (MMRd/MMRp) | (45/51) | (52/48) | (97/99) | (42/38) | (51/34) | (93/72) |
| A. Original Analyses | ||||||
| Concordance MSI v IHC | 95% | 97% | 96% | 73% | 82% | 78% |
| Sensitivity MSI v IHC | 96% | 94% | 95% | 57% | 71% | 65% |
| Specificity MSI v IHC | 94% | 100% | 97% | 89% | 100% | 94% |
| B. NCL 24 Marker Panel | ||||||
| Concordance NCL_MSI v MSI MSMSIMSI_MSI) | 97% | 98% | 97% | 83% | 89% | 86% |
| Concordance NCL_MSI v IHC | 94% | 95% | 94% | 85% | 84% | 84% |
| Sensitivity NCL_MSI v IHC | 93% | 92% | 93% | 76% | 76% | 76% |
| Specificity NCL_MSI v IHC | 94% | 98% | 96% | 95% | 94% | 94% |
| % Ohio (n/total) | % Man (n/total) | |||
|---|---|---|---|---|
| MMRd | 49% | (97/196) | 56% | (93/165) |
| MSI-H | 48% | (95/196) | 39% | (64/165) |
| Concordance | 96% | (188/196) | 78% | (129/165) |
Figure 2.
Promoter methylation and assay concordance within sporadic tumours showing loss of MLH1 protein expression by IHC.
Figure 2.
Promoter methylation and assay concordance within sporadic tumours showing loss of MLH1 protein expression by IHC.
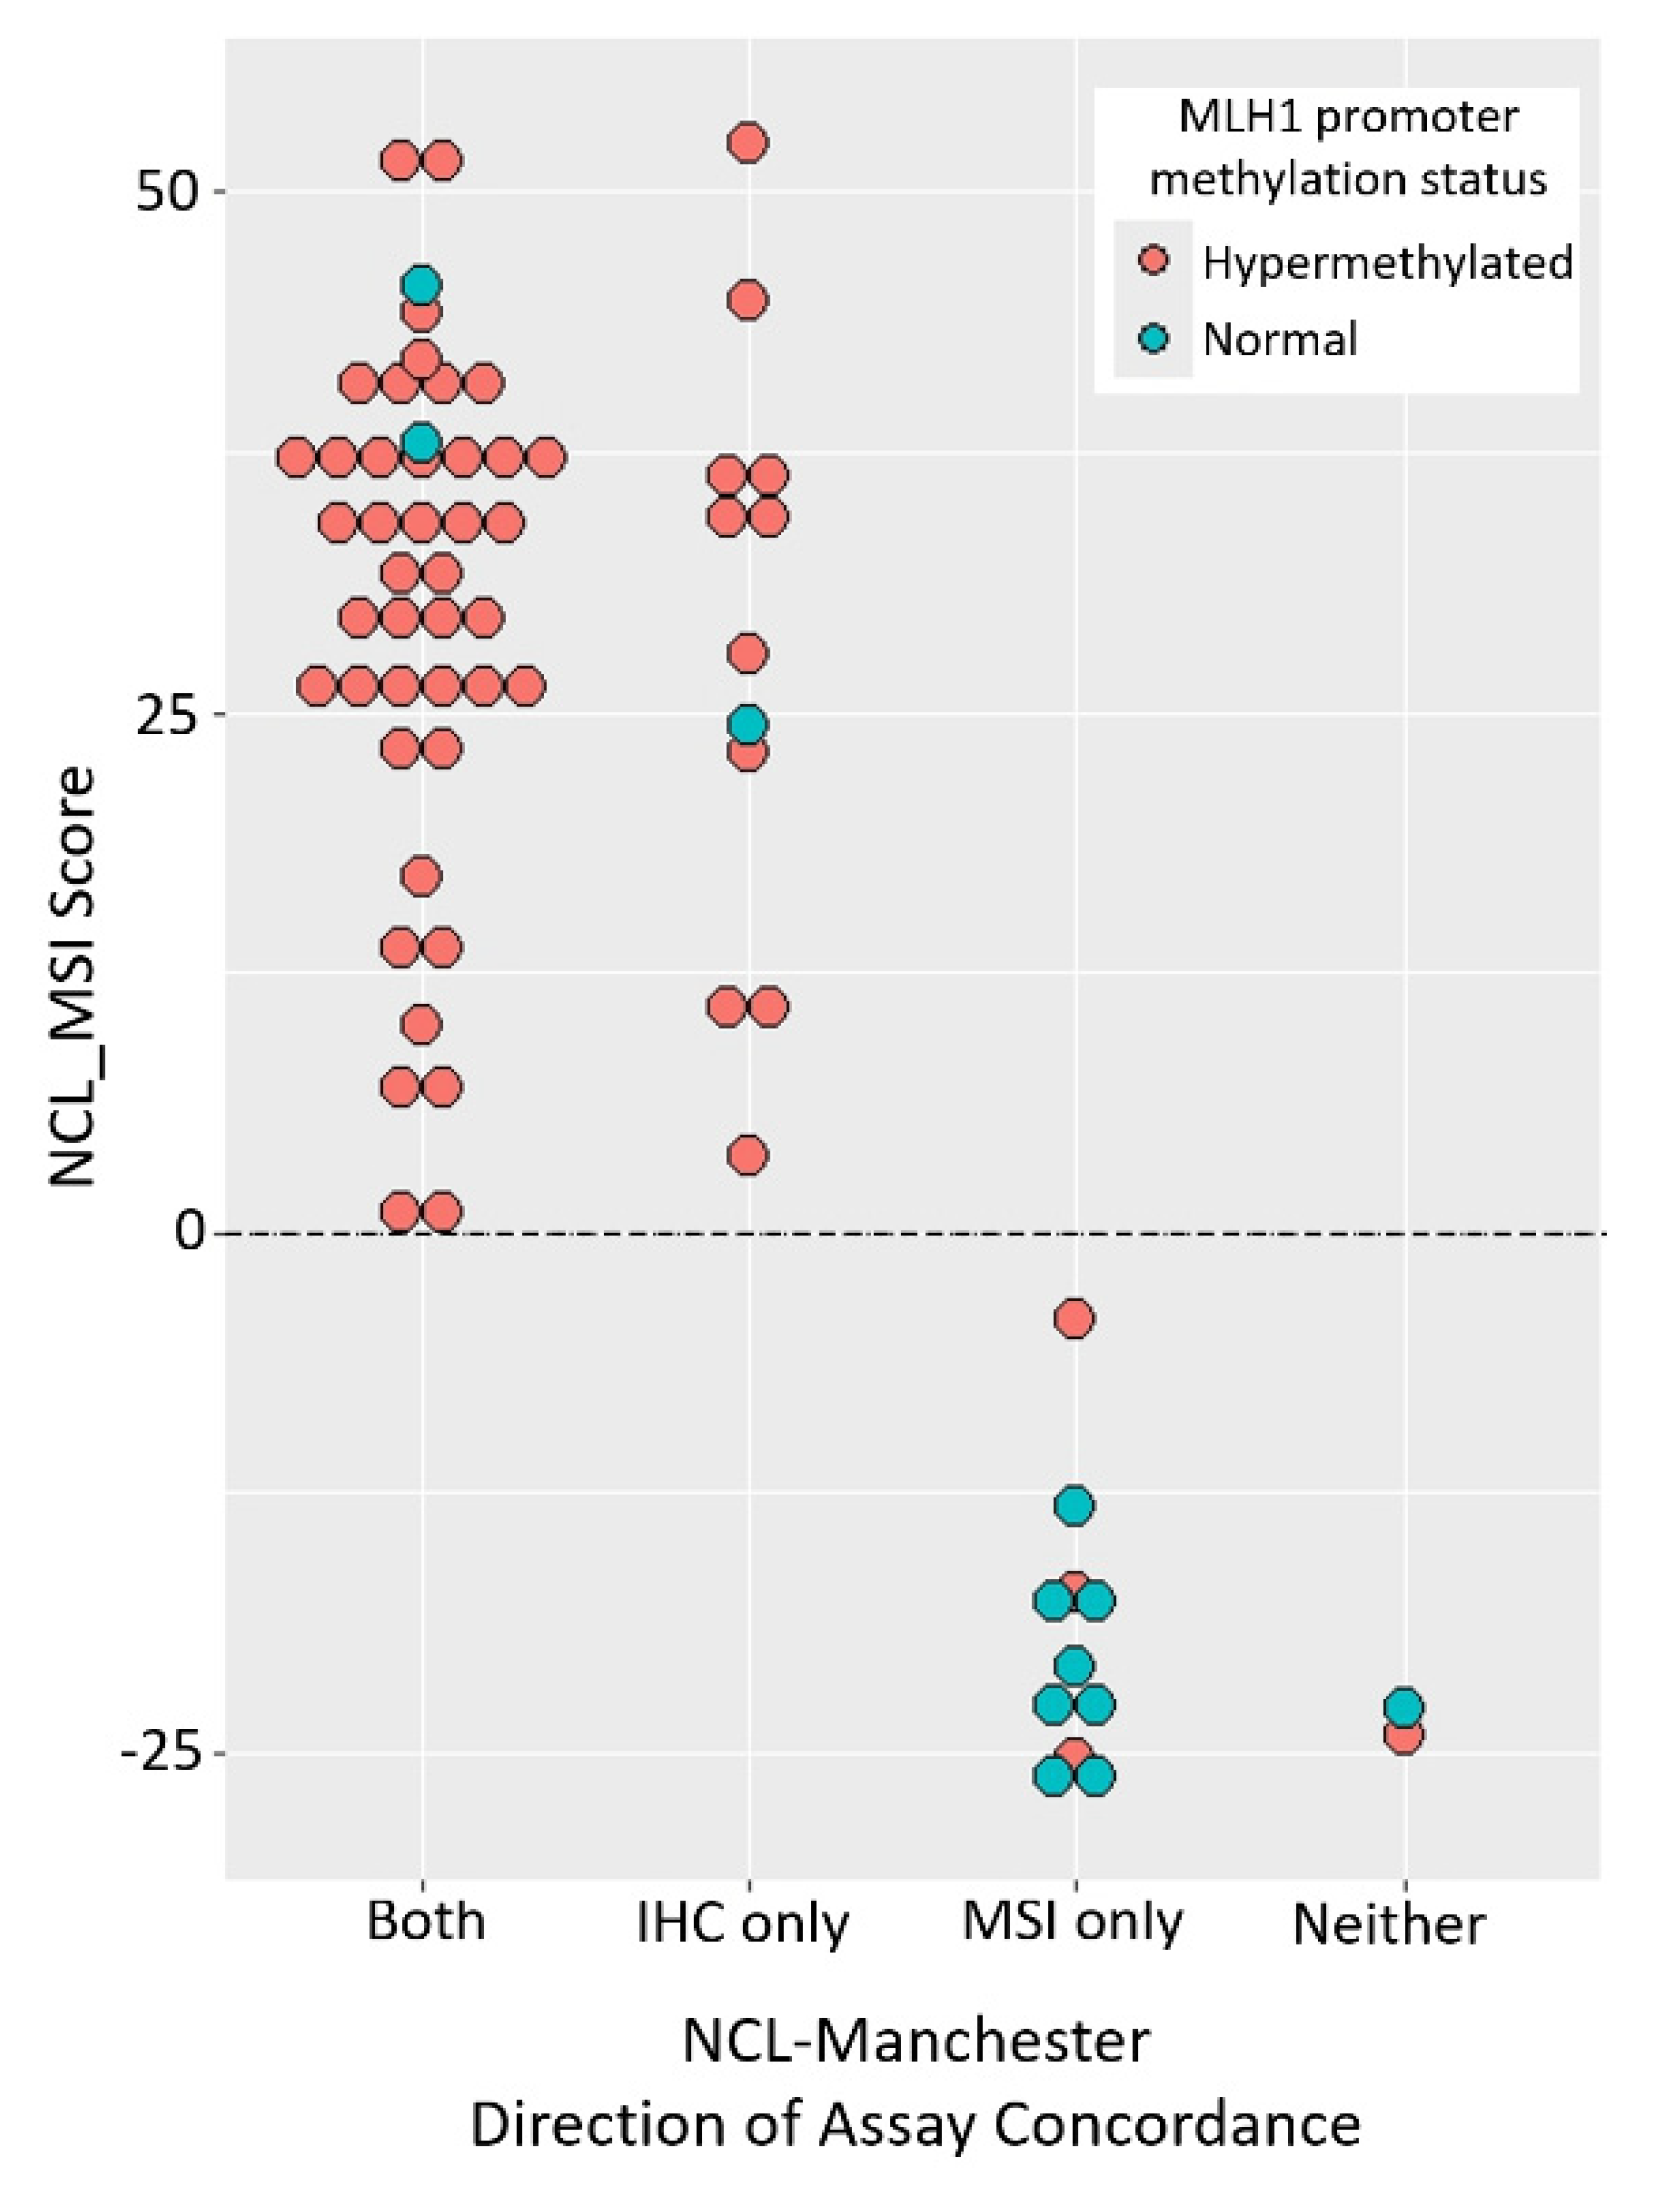
Figure 3.
Magnitude of MSI signal in tumours with germline MMR defects. (a) Median VAFs for each marker in ECs with germline defects. Frequencies are normalised to the median for sporadic ECs, for both the Manchester and Ohio Cohorts. Markers from both the 24 and 56 marker panels were analysed. (b) Median VAFs for each marker in CRCs with germline defects. Median VAFs from an independent MSI marker panel (see methods) are shown for a cohort of 35 LS CRCs (see methods). Frequencies are normalised relative to median VAFs from 56 unselected CRCs.
| Sample | Cohort | IHC Loss | Promega MSI | NCL_MSI Score | NCL_MSI Status | Indicates Germline Testing IHC Promega NCL | ||
|---|---|---|---|---|---|---|---|---|
| ECT176 | OT | MSH6 | MSI-H | 13.1 | MSI-H | Y | Y | Y |
| ECT184 | OT | MSH2/MSH6 | MSI-H | 15.7 | MSI-H | Y | Y | Y |
| ECV69 | OV | MSH6 | MSI-H | 17.7 | MSI-H | Y | Y | Y |
| ECV100 | OV | MSH2/MSH6 | MSI-H | 16.9 | MSI-H | Y | Y | Y |
| ECT192 | OV | No Loss | MSI-H | 39.2 | MSI-H | N | Y | Y |
| ECT102 | OV | MSH6 | MSS | -1.1 | MSS | Y | N | N |
| PET256 | MV | MLH1/PMS2 | MSI-H | 10.2 | MSI-H | Y | Y | Y |
| PET16 | MT | MLH1/PMS2 | MSI-H | 37.2 | MSI-H | Y | Y | Y |
| PET61 | MV | MSH6/MSH2 | MSI-H | 45.7 | MSI-H | Y | Y | Y |
| PET215 | MV | MSH6 | MSI-H | 26.2 | MSI-H | Y | Y | Y |
| PET173 | MV | PMS2 | MSI-H | 28.2 | MSI-H | Y | Y | Y |
| PET213 | MV | MSH6 | MSI-H | 30.3 | MSI-H | Y | Y | Y |
| PET255 | MT | MSH6 | MSS | 11.4 | MSI-H | Y | N | Y |
| PET31 | MT | MSH6 | MSS | -19.1 | MSS | Y | N | N |
| PET128 | MT | MSH6 | MSI-L | -24.6 | MSS | Y | N | N |
| 165BRC | MT | MSH6/MSH2 | MSS | 53.0 | MSI-H | Y | N | Y |
| 882BRC | MT | PMS2 | MSS | -15.6 | MSS | Y | N | N |
| PET241 | MV | MSH6 | MSI-H | -14.8 | MSS | Y | Y | N |
| PRE011 | MV | MSH6 | MSS | -21.0 | MSS | Y | N | N |
| PET96 | MV | MSH6 | MSS | -20.0 | MSS | Y | N | N |
Figure 4.
Magnitude of MSI signal in tumours with isolated MSH6 loss. (a) ECs with isolated loss of MSH6 expression and loss of both MSH2 and MSH6. Median VAF for each marker in ECs with loss of MSH6 only (n=11 and 16), or loss of MSH6 and MSH2 (n=13 and 7), are shown normalised to the median for MMRd samples with no MSH6 involvement by IHC (n=74 and 85). Markers from both the 24 and 56 marker panels were analysed. Samples with MSH6 loss have lower VAFs (p=1.7x10⁻¹² Man, 6.1x10⁻¹⁵ Ohio), samples with MSH2 and MSH6 loss have higher VAFs (p=2.1x10⁻¹⁶ Man, 3.8x10⁻³ Ohio). (b). CRCs from LS patients with known MSH6 defects. Median VAF from an independent MSI marker panel (see methods) in LS derived CRCs with MSH6 defects are shown normalised to the median for LS samples with defects in other MMR genes.
| Sample | Cohort | IHC Loss | Promega MSI | NCL_MSI Score | NCL_MSI Status | Indicates Germline Testing IHC Promega NCL | ||
|---|---|---|---|---|---|---|---|---|
| ECT176 | OT | MSH6 | MSI-H | 13.1 | MSI-H | Y | Y | Y |
| ECT184 | OT | MSH2/MSH6 | MSI-H | 15.7 | MSI-H | Y | Y | Y |
| ECV69 | OV | MSH6 | MSI-H | 17.7 | MSI-H | Y | Y | Y |
| ECV100 | OV | MSH2/MSH6 | MSI-H | 16.9 | MSI-H | Y | Y | Y |
| ECT192 | OV | No Loss | MSI-H | 39.2 | MSI-H | N | Y | Y |
| ECT102 | OV | MSH6 | MSS | -1.1 | MSS | Y | N | N |
| PET256 | MV | MLH1/PMS2 | MSI-H | 10.2 | MSI-H | Y | Y | Y |
| PET16 | MT | MLH1/PMS2 | MSI-H | 37.2 | MSI-H | Y | Y | Y |
| PET61 | MV | MSH6/MSH2 | MSI-H | 45.7 | MSI-H | Y | Y | Y |
| PET215 | MV | MSH6 | MSI-H | 26.2 | MSI-H | Y | Y | Y |
| PET173 | MV | PMS2 | MSI-H | 28.2 | MSI-H | Y | Y | Y |
| PET213 | MV | MSH6 | MSI-H | 30.3 | MSI-H | Y | Y | Y |
| PET255 | MT | MSH6 | MSS | 11.4 | MSI-H | Y | N | Y |
| PET31 | MT | MSH6 | MSS | -19.1 | MSS | Y | N | N |
| PET128 | MT | MSH6 | MSI-L | -24.6 | MSS | Y | N | N |
| 165BRC | MT | MSH6/MSH2 | MSS | 53.0 | MSI-H | Y | N | Y |
| 882BRC | MT | PMS2 | MSS | -15.6 | MSS | Y | N | N |
| PET241 | MV | MSH6 | MSI-H | -14.8 | MSS | Y | Y | N |
| PRE011 | MV | MSH6 | MSS | -21.0 | MSS | Y | N | N |
| PET96 | MV | MSH6 | MSS | -20.0 | MSS | Y | N | N |

Table 1.
Overview of original IHC and MSI assay results in cohorts analysed. Overall concordance between assays is shown (Man = Manchester).
Table 1.
Overview of original IHC and MSI assay results in cohorts analysed. Overall concordance between assays is shown (Man = Manchester).
| % Ohio (n/total) | % Man (n/total) | |||
|---|---|---|---|---|
| MMRd | 49% | (97/196) | 56% | (93/165) |
| MSI-H | 48% | (95/196) | 39% | (64/165) |
| Concordance | 96% | (188/196) | 78% | (129/165) |
Table 2.
Summary of Original and 24 marker CRC trained NCL_MSI assay results. Concordance between all assays is shown, together with sensitivity and specificity of both MSI assays relative to IHC in training (Train), validation (Val), and merged datasets. Numbers of MMRd/MMRp samples are shown in parenthesis.
| Cohort | Ohio | Manchester | ||||
|---|---|---|---|---|---|---|
| Dataset | Train | Val | Merged | Train | Val | Merged |
| IHC Result (MMRd/MMRp) | (45/51) | (52/48) | (97/99) | (42/38) | (51/34) | (93/72) |
| A. Original Analyses | ||||||
| Concordance MSI v IHC | 95% | 97% | 96% | 73% | 82% | 78% |
| Sensitivity MSI v IHC | 96% | 94% | 95% | 57% | 71% | 65% |
| Specificity MSI v IHC | 94% | 100% | 97% | 89% | 100% | 94% |
| B. NCL 24 Marker Panel | ||||||
| Concordance NCL_MSI v MSI MSMSIMSI_MSI) | 97% | 98% | 97% | 83% | 89% | 86% |
| Concordance NCL_MSI v IHC | 94% | 95% | 94% | 85% | 84% | 84% |
| Sensitivity NCL_MSI v IHC | 93% | 92% | 93% | 76% | 76% | 76% |
| Specificity NCL_MSI v IHC | 94% | 98% | 96% | 95% | 94% | 94% |
Table 3.
Tumours with known pathogenic germline MMR gene mutations. Results of IHC and MSI assays are shown. Cohorts - O/M=Ohio/Manchester, T/V=Training/Validation; Indicates Germline Testing = Assay identified MMRd/MSI in tumour.
Table 3.
Tumours with known pathogenic germline MMR gene mutations. Results of IHC and MSI assays are shown. Cohorts - O/M=Ohio/Manchester, T/V=Training/Validation; Indicates Germline Testing = Assay identified MMRd/MSI in tumour.
| Sample | Cohort | IHC Loss | Promega MSI | NCL_MSI Score | NCL_MSI Status | Indicates Germline Testing IHC Promega NCL | ||
|---|---|---|---|---|---|---|---|---|
| ECT176 | OT | MSH6 | MSI-H | 13.1 | MSI-H | Y | Y | Y |
| ECT184 | OT | MSH2/MSH6 | MSI-H | 15.7 | MSI-H | Y | Y | Y |
| ECV69 | OV | MSH6 | MSI-H | 17.7 | MSI-H | Y | Y | Y |
| ECV100 | OV | MSH2/MSH6 | MSI-H | 16.9 | MSI-H | Y | Y | Y |
| ECT192 | OV | No Loss | MSI-H | 39.2 | MSI-H | N | Y | Y |
| ECT102 | OV | MSH6 | MSS | -1.1 | MSS | Y | N | N |
| PET256 | MV | MLH1/PMS2 | MSI-H | 10.2 | MSI-H | Y | Y | Y |
| PET16 | MT | MLH1/PMS2 | MSI-H | 37.2 | MSI-H | Y | Y | Y |
| PET61 | MV | MSH6/MSH2 | MSI-H | 45.7 | MSI-H | Y | Y | Y |
| PET215 | MV | MSH6 | MSI-H | 26.2 | MSI-H | Y | Y | Y |
| PET173 | MV | PMS2 | MSI-H | 28.2 | MSI-H | Y | Y | Y |
| PET213 | MV | MSH6 | MSI-H | 30.3 | MSI-H | Y | Y | Y |
| PET255 | MT | MSH6 | MSS | 11.4 | MSI-H | Y | N | Y |
| PET31 | MT | MSH6 | MSS | -19.1 | MSS | Y | N | N |
| PET128 | MT | MSH6 | MSI-L | -24.6 | MSS | Y | N | N |
| 165BRC | MT | MSH6/MSH2 | MSS | 53.0 | MSI-H | Y | N | Y |
| 882BRC | MT | PMS2 | MSS | -15.6 | MSS | Y | N | N |
| PET241 | MV | MSH6 | MSI-H | -14.8 | MSS | Y | Y | N |
| PRE011 | MV | MSH6 | MSS | -21.0 | MSS | Y | N | N |
| PET96 | MV | MSH6 | MSS | -20.0 | MSS | Y | N | N |
Disclaimer/Publisher’s Note: The statements, opinions and data contained in all publications are solely those of the individual author(s) and contributor(s) and not of MDPI and/or the editor(s). MDPI and/or the editor(s) disclaim responsibility for any injury to people or property resulting from any ideas, methods, instructions or products referred to in the content. |
© 2024 by the authors. Licensee MDPI, Basel, Switzerland. This article is an open access article distributed under the terms and conditions of the Creative Commons Attribution (CC BY) license (http://creativecommons.org/licenses/by/4.0/).
Copyright: This open access article is published under a Creative Commons CC BY 4.0 license, which permit the free download, distribution, and reuse, provided that the author and preprint are cited in any reuse.


