
Submitted:
08 October 2024
Posted:
08 October 2024
You are already at the latest version
Abstract
Background: Wideband tympanometry (WBT) has the potential to distinguish various mechanical middle ear and inner ear pathologies noninvasively. This study investigated the diagnostic value of WBT in the diagnosis of enlarged vestibular aqueduct (EVA). Methods: The absorbance and resonance frequency (RF) of patients with EVA (40 ears, 25 patients) and matched population controls (39 ears, 28 subjects) were compared, alongside receiver operating characteristic (ROC) analysis. Correlations between VA width and RF were also examined. Results: Patients with EVA had higher absorbance at low frequencies (226–917 Hz) and lower absorbance at high frequencies (2,520–4,896 Hz) compared to controls. The RF of the EVA group was significantly lower versus controls (751 [391–1,165] vs. 933 [628–1,346] Hz). ROC analysis revealed area under the curve values of 0.771 and 0.801 respectively, for absorbance and RF. RF had a sensitivity, specificity, positive predictive value, and negative predictive value of 74.4%, 82.5%, 76.7%, and 80.6%, respectively, for diagnosing EVA. In the EVA group, the VA midpoint width (r = −0.334) and VA petrous width (r = −0.402) both significantly correlated with RF. Conclusion: Our findings support the utility of WBT for diagnosing EVA, with RF as the optimal index used.
Keywords:
wideband tympanometry
; enlarged vestibular aqueduct
; diagnosis
; ROC analysis
; absorbance
; resonance frequency
; temporal bone computed tomography
1. Introduction
Tympanometry using low tone stimulation is widely used as a noninvasive, simple, and inexpensive instrument for diagnosing middle ear disease [1]. Due to its high sensitivity, the usefulness of tympanometry using high-pitched sounds has become clinically recognized [1]. Wideband tympanometry (WBT) has a wider stimulation frequency range (226–8,000 Hz) and can provide more detailed information about the condition of the middle and inner ear in terms of acoustic energy absorption at different frequencies and different pressures. The results of WBT measurements are expressed as wideband reflectance (WBR) or wideband absorbance (WBA) [2]. While WAR is defined as the ratio of the energy incident on the ear canal to the energy reflected from the eardrum, WBA represents the part of the incident energy that is absorbed by the middle ear. Both WBA and WBR range from 0 to 1, with WBA being equal to 1-WBR.
The pressure of the cerebrospinal fluid is transmitted to the endolymph through the endolymphatic sac, and to the perilymph through the cochlear aqueduct [3]. Thus, when the cerebrospinal fluid pressure increases, both the endolymphatic and perilymphatic pressures increase accordingly. An increase in cerebrospinal fluid pressure causes an increase in cochlear pressure, which in turn increases acoustic impedance in the tympanic membrane and the middle ear conductive system [4,5]. Furthermore, an experimental report by Murakami et al. has shown that an increase in inner ear pressure causes a decrease in stapes vibration and tympanic membrane vibration. Thus, the noninvasive measurement of middle ear transfer function using WBT can be used to determine the condition of the inner ear indirectly. The recent emergence of WBT has demonstrated its effectivity in diagnosing inner ear diseases that affect inner ear pressure, such as superior semicircular canal dehiscence syndrome (SSCD) [6] and Meniere’s disease [7].
An enlarged vestibular aqueduct (EVA) is the most common inner ear anomaly causing congenital sensorineural hearing loss, which is characterized by an air-bone gap in low frequencies with fluctuating and progressive hearing loss [8,9]. There is increased perilymphatic pressure during cochlear implantation, and a negative summating potential suggests the presence of endolymphatic hydrops [10,11]. This may push the stapes up from the inside and restrict its movement [12]. Such anatomical abnormalities that allow communication between the inner ear fluid space and the cranial cavity are called third window lesions, and similar disorders such as SSCD have been reported. Thus, increased inner ear pressure also affects the middle ear conductive system. The characteristics of EVA in WBT have been reported [13,14], and previous reports have shown that patients with EVA have increased absorbance in low frequency and decreased absorbance in high frequency [13]. However, the diagnostic utility of the WBT remains unclear. In this report, we compared patients with EVA with a distribution-matched control group to evaluate the usefulness of WBT in diagnosing EVA.
2. Materials and Methods
2.1. Subjects
WBT was performed from June 2019 to April 2022 for patients with EVA (EVA group) and normal control subjects (control group) in the Department of Otorhinolaryngology, Head and Neck Surgery of the University of the Ryukyus, Japan and in the Department of Otorhinolaryngology, Head and Neck Surgery of Miyazaki University, Japan.
The inclusion criteria for both groups are described in Table 1. The inclusion criteria for the control group are as follows: (1) no history of ear diseases; (2) no acute or chronic upper respiratory inflammation; (3) normal findings on pretest otoscopic examination using oto-microscopy; (4) normal type-A 226 Hz tympanometry (peak pressure between 50 and +50 daPa with a single peak with the static admittance values of 0.3–1.7 mmho) [15,16]; and (5) normal audiometric thresholds (≤25 dBHL from 500 to 2000 Hz; air-bone gap ≤10dB from 500 to 2000Hz). The inclusion criteria for the EVA group included criteria (1) to (4) in the control group as shown earlier, plus a radiological diagnosis of EVA (i.e., VA with a diameter of >1.5 mm at the midpoint). This study was conducted with approval from the ethics committee of the University of Miyazaki (registration number: O-0617) and University of the Ryukyus (registration number: 1582).
2.2. Image Evaluation
EVA was diagnosed via temporal bone computed tomography (CT) in all patients, specifically ultrahigh-resolution CT (Aquilion PrecisionVR; Canon Medical Systems, Tochigi, Japan) with a 0.25-mm slice thickness or high-resolution CT (Aquilion One; Canon Medical Systems, Tochigi, Japan) with a 0.5-mm slice thickness. EVA was defined as a VA with a diameter of >1.5 mm at the midpoint between the common crus of the semicircular canal and the external aperture of the VA on CT [17].
The VA width was measured using two different methods (Figure 1) [18]. The VA midpoint width was defined as the part of the VA in the petrous bone located half the distance from its origin in the labyrinth to its aperture in the epidural space (Figure 1A). The VA opercular width was measured in the same plane as the endolymph sac depths by drawing a line from the opercular edge anterolaterally to form a 90° angle with the posterior wall of the petrous bone (Figure 1B) [18,19]. VA was measured by two neuro-otologists (GA and NN). Interobserver variability at the two measurement points was investigated.
2.3. Measurement of WBT
The Titan® (IMP440 version 3.4, Interacoustics, Denmark) was used to measure the power absorbed in the ear canal (frequency range, 226–8,000 Hz; pressure sweep, −300–+200 daPa; rate, 100 daPa/s). Power absorbance was defined as a ratio of absorbed power over the incident power, ranging from 0–1. A power absorbance of 0 and 1, respectively, means that all sound energy has been reflected back or absorbed by the middle ear system [20]. A probe validity check was performed using the built-in 2-cc cavity of the Titan cradle. A suitable ear tip was carefully selected to ensure a proper fit and good seal of the ear canal. WBT was measured three times alternately to obtain reliable results. Intraclass correlation coefficients were used to evaluate the liability of the triplicate data in all participants; subjects with intraclass correlation coefficients <0.7 were excluded. All participants were instructed to remain quiet and still during the entire duration of the measurements.
2.4. Hearing Assesment
Otoscopic examination and hearing tests were performed on the day before WBT in all participants. Hearing level was determined using auditory steady-state response, auditory brainstem response, conditioned orientated response, or pure tone audiogram depending on the subject’s ability. Hearing level was defined as the average of the hearing threshold at 0.5, 1.0, and 2.0 kHz.
2.5. Statistics
The WBA under peak pressure and resonance frequency (RF) were compared between both groups. The Shapiro–Wilk test was used to check the normality of WBA values at each frequency from 226 to 8,000 Hz and RF. Since the data was not normally distributed (p < 0.05), the Wilcoxon rank sum test was used to compare the WBA and RF values between groups. Receiver operating characteristic (ROC) analysis was used to determine the usefulness of WBT for diagnosing EVA. Statistical analyses were performed using IBM SPSS Statistics version 28.0.1.0 (IBM Corp., Armonk, NY, USA), with P < 0.05 considered statistically significant.
3. Results
WBT was used to evaluate a total of 79 ears: 40 ears in 25 patients (19 male ears, 20 female ears) in the EVA group and 39 ears in 28 subjects (17 male ears, 22 female ears) in the control group. The median age at WBT tended to be higher in the EVA group versus the control group (14 [4–49] vs. 12 [4–48] years; Mann–Whitney, U = 754.000, z = −0.256, p = 0.798). The demographic data is presented in Table 2.
3.1. Comparison of Absorbance
The mean absorbance under peak pressure of the EVA group was significantly higher at frequencies around 226–917 Hz (p < 0.05, Mann–Whitney U) and significantly lower at frequencies around 2,520–4,896 Hz (p < 0.05, Mann–Whitney U) compared to the control group (Figure 2).
3.2. Comparison of RF
The mean RF was 751 (391–1,165) Hz and 933 (628–1,346) Hz in the EVA and control groups, respectively. The mean RF in EVA patients was significantly lower than that of controls (U = 296.500, z = −4.741, p < 0.001, Mann–Whitney U) (Figure 3).
3.2. ROC analysis for absorbance and RF
ROC curve analysis was used to evaluate the usefulness of absorbance and RF in diagnosing EVA. Among the frequencies at which significant differences in absorbance were observed (i.e., 226–917 Hz and 2,520–4,896 Hz), the most significant difference (p < 0.001) was found in the ranges of 408–794 Hz and 2997–4,362 Hz. Thus, using ROC curve analysis, we evaluated the ability of WBT to discriminate between EVA patients and controls in the frequency ranges of 226–917 Hz and 2,520–4,896 Hz. The ROC curve analysis yielded a maximum area under the curve (AUC) of 0.771 (95% confidence interval, 0.670–0.871) (Figure 4A). The maximum sum of specificity and sensitivity was observed at 3,776 Hz, with an absorbance of 0.782. WBT had a sensitivity, specificity, positive predictive value, and negative predictive value of 69.2%, 77.8%, 77.5%, and 69.2%, respectively, for detecting EVA.
ROC curve analysis was used to evaluate RF, yielding an AUC of 0.810 (95% confidence interval, 0.712–0.907). The maximum sum of specificity and sensitivity was observed at an RF of 888 Hz (Figure 4B). RF had a sensitivity, specificity, positive predictive value, and negative predictive value of 74.4%, 82.5%, 76.7%, and 80.6%, respectively, for detecting EVA.
3.5. Correlation between EVA Size and RF
The mean VA midpoint and porous widths were 2.96 and 2.79 mm, respectively, in the EVA group. Both VA midpoint and porous widths demonstrated good interobserver agreement (interobserver variability, 0.926 and 0.921, respectively), with higher agreement in the former. In the EVA group, significant correlations were found between the VA midpoint width and RF (Spearman, p = 0.035, r = −0.334), as well as between the VA porous width and RF (Spearman, p = 0.01, r = −0.402) (Figure 5).
4. Discussion
WBT has the potential to distinguish various mechanical middle ear and inner ear pathologies noninvasively. To date, A previous study reported the usefulness of WBT in diagnosing inner ear disease such as SSCD [6] and Meniere’s disease [7].
EVA is an auditory–vestibular disorder caused by abnormal exposure of the inner ear to the surrounding structures, known as third window [21]. Normally, the inner ear cavity, which is surrounded by the bones of the otic capsule and filled with fluid, is connected to surrounding anatomical structures such as the oval window and round window (i.e., the first and second windows, respectively). Meanwhile, other means of exposure of the inner ear to surrounding structures are known as third window; these include the cochlear aqueduct, which connects the scala tympani of the cochlea with the posterior fossa, and the VA, which connects the vestibule with posterior fossa [22]. Normally, the third windows are anatomically thin tubes that have high impedance and block sound flow, and thus the third windows are thought to have a little effect on hearing [23]. Conversely, the EVA and SSCD act as a pathological third window, which expose the inner ear to the surrounding structures, thus affecting sound transmission in the inner ear and causing hearing loss [21]. Hearing loss due to the presence of a third window often presents as mixed hearing loss, with an air-bone gap in low frequencies and severe high-frequency hearing loss that is fluctuating and progressive [24]. Nevertheless, the exact mechanism of conductive hearing loss in EVA patients remains unclear. Third window such as the EVA could possibly shunt acoustic energy outside the cochlea, redirecting it away from the inner ear, thus reducing sound pressure. The third window also reduces impedance in the scala vestibuli, which increases the pressure difference between the scala vestibuli and scala tympani on either side of the basilar membrane of the cochlea, improving bone conduction. This is in line with previous studies, which state that many patients with third window suffer from conductive hearing loss due to an increase in the bone conduction threshold [24,25]. Thus, regarding the effect of EVA on sound conduction, it is necessary to consider the following: (1) increased stiffness because of the transmission of cerebrospinal fluid pressure to the inner ear via the EVA, leading to increased inner ear pressure and restricted mobility of the stapes, and (2) decreased impedance due to increased mass of the VA and endolymphatic sac.
Third window is thought to affect the absorbance of acoustic energy. In SSCD, which has a third window like EVA, increased absorbance has been reported at low frequencies [26,27]. Similarly, this study identified increased absorbance in the EVA group at low frequencies (226–917 Hz) compared to controls. This is thought to be related to the decrease in impedance due to the increased mass of the VA and endolymphatic sac. Similar results have been reported in patients with endolymphatic hydrops, with absorbance at low frequencies (560–600 Hz) being higher in ears with severe endolymphatic hydrops versus those with mild or no endolymphatic hydrops [28]. It is thought that the presence of an EVA creates a sound energy shunt from the inner ear to the posterior fossa, and that the increased volume of the endolymphatic sac and duct [29] reduces inner ear impedance, resulting in increased absorption at a low frequency range [30].
The EVA group had significantly lower absorbance than controls at low frequencies around 2,520–4,896 Hz, as indicated by the frequency-absorption curve at peak pressure. Stiffness and mass are factors that affect sound transmission in the middle ear. While, stiffness having a significant effect on the transmission efficiency of low frequency sound, mass having a significant effect on the transmission efficiency of high frequency sound [13]. High-frequency sound has a short wavelength, and an increased inner ear volume caused by EVA leads to a decrease in the transmission of high-frequency sound [31]. This could explain the lower absorbance of EVA at a high-frequency range versus the control group.
Similar to absorbance, RF is also determined by mass and stiffness in the middle ear and inner ear. Mass and stiffness are determined by several factors: the middle ear sound conductive system, volume of the middle ear, air pressure, tonus of the middle ear muscles, and mechanical immittance of the cochlea [30]. An increase in RF can by caused by a decrease in mass or an increase in stiffness and vice-versa. No abnormal findings of the middle ear or ossicles have been reported among EVA patients, except for EVA-associated with other syndromic causes of hearing loss such as branchio-oto-renal syndrome and Waardenburg syndrome [12]. In this report, patients with abnormal findings on tympanic membrane examination, tympanometry using 226 Hz, and CT imaging were excluded, and thus the changes in ABS and RF observed in EVA patients are likely influenced by EVA-associated changes in mass and stiffness. As an effect of EVA, abnormally high perilymph pulsation is often observed clinically in cases of cochlear implant surgery among patients with EVA [11,13,32], which suggests an increased inner ear pressure due to continuous transmission of cerebrospinal fluid pressure to the cochlea via the EVA. From the perspective of middle ear impedance, the increase in inner ear pressure restricts the movement of the stapes [4], and the increasing impedance causes the RF to shift to higher frequencies [30,33]. From the perspective of cochlear impedance, the presence of an EVA reduces cochlear impedance by forming a sound energy shunt from the cochlea to the posterior fossa and increasing the volume of the endolymphatic sac and duct [29,30]. Therefore, the larger the VA size, the greater the decrease in RF [30]. The EVA group had lower RF than the control group, this is likely because the decrease in cochlear impedance due to increased mass had a greater effect versus the increase in ossicular stiffness due to increased inner ear pressure.
The correlations between VA width and RF were examined. The correlation coefficient between VA midpoint width and RF was −0.334, while that between VA porous width and RF was −0.402; these are considered weak. In this report, the diameter of the VA, rather than its volume, was used to indicate the degree of enlargement because it is difficult to distinguish between the enlarged endolymphatic sac, the surrounding cerebrospinal fluid, and blood vessels on CT. As a result, the degree of vestibular aqueduct enlargement could not be evaluated accurately, which can explain the weak correlation between VA size and RF.
ROC analysis was used to determine the usefulness of absorbance and RF in diagnosing EVA, yielding AUC values of 0.782 and 0.801, respectively. Absorbance at 3,776 Hz and RF both had moderate or higher diagnostic values, suggesting that RF may be more useful for diagnosis than absorbance. While inner ear malformations account for approximately 20% of all congenital hearing loss, which is often detected in infancy [32,34], EVA is the most common inner ear malformation associated with hearing loss [35,36]. However, some inner ear malformations, such as EVA, may be missed on newborn hearing screening, leading to a delayed diagnosis [37]. EVA can be diagnosed using CT or magnetic resonance imaging, these can be challenging for infants, especially considering the tolerance of examination (i.e., need for sedation), radiation exposure, examination time, and cost. Conversely, WBT does not require sedation and can be measured quickly and easily. Thus, WBT may be useful as a screening tool or diagnostic aid in newborn hearing screening and infant health checkups.
Our study has several limitations. First, the small sample size of this study may have limited its ability to provide WAI normative data for patients with EVA. Therefore, studies with a larger sample size are needed. Second, collecting population-based normative data is crucial for the standardization of WBA because its patterns are influenced by ethnicity, gender, and age [38]. To address this, we matched subjects by ethnicity, gender, and age between both groups, but nevertheless, these results are only directly applicable for Japanese populations. Third, data on younger age groups is needed to diagnose EVA earlier using WBT.
5. Conclusions
Compared to controls, patients with EVA had higher absorbance in the low frequency range and lower absorbance in the high-frequency range, which is consistent with previous reports. The optimal index for diagnosing EVA using WBT was RF, with an AUC of 0.801 on ROC analysis. RF also had a sensitivity, specificity, positive predictive value, and negative predictive value of 74.4%, 82.5%, 76.7%, and 80.6%, respectively. These results suggest that WBT may be useful for diagnosing EVA.
Author Contributions
Data curation, Akira Ganaha, Nao Nojiri, Takeshi Nakamura, Teruyuki Higa and Shunsuke Kondo; Formal analysis, Akira Ganaha, Nao Nojiri and Takeshi Nakamura; Methodology, Akira Ganaha and Takeshi Nakamura; Project administration, Akira Ganaha; Supervision, Akira Ganaha; Writing–original draft, Akira Ganaha; Writing–review & editing, Akira Ganaha.
Funding
This work was supported by the Japan Society for the Promotion of Science (JSPS) KAKENHI Grant Number JP20K18288.
Institutional Review Board Statement
Investigations were performed according to the Declaration of Helsinki. Our research protocol was approved by the Ethics Review Boards of the University of Miyazaki (registration number: O-0617, Approval Date: December 4, 2019) and University of the Ryukyus (registration number: 1582, Approval Date: April 6, 2020).
Informed Consent Statement
Informed consent was obtained in the form of opt-out on the website. Those who rejected were excluded.
Data Availability Statement
All collected and analyzed data in this study are presented in this published article.
Acknowledgments
We thank all the individuals who participated in this study. We are grateful to T. Yuji from the University of Miyazaki and K. Yoza from University of the Ryukyus for their assistance in this study.
Conflicts of Interest
The authors have no conflicts of interest to disclose.
References
- Holte, L.; Margolis, R.H.; Cavanaugh, R.M. Jr. Developmental changes in multifrequency tympanograms. Audiology 1991, 30, 1–24. [Google Scholar] [CrossRef] [PubMed]
- Aithal, S.; Kei, J.; Driscoll, C. Wideband absorbance in young infants (0-6 months): a cross-sectional study. J. Am. Acad. Audiol. 2014, 25, 471–481. [Google Scholar] [CrossRef] [PubMed]
- Carlborg, B.I.; Farmer, J.C. Jr. Transmission of cerebrospinal fluid pressure via the cochlear aqueduct and endolymphatic sac. Am. J. Otolaryngol. 1983, 4, 273–282. [Google Scholar] [CrossRef] [PubMed]
- Murakami, S.; Gyo, K.; Goode, R.L. Effect of increased inner ear pressure on middle ear mechanics. Otolaryngol. Head Neck Surg. 1998, 118, 703–708. [Google Scholar] [PubMed]
- Macrae, J.H. Effects of body position on the auditory system. J. Speech Hear. Res. 1972, 15, 330–339. [Google Scholar] [CrossRef]
- Demir, E.; Afacan, N.N.; Celiker, M.; Celiker, F.B.; İnecikli, M.F.; Terzi, S.; Dursun, E. Can wideband tympanometry be used as a screening test for superior semicircular canal dehiscence? Clin. Exp. Otorhinolaryngol. 2019, 12, 249–254. [Google Scholar] [CrossRef]
- Ishizu, K.; Tamae, A.; Kubo, K.; Yoshida, T.; Matsumoto, N.; Yasui, T.; Nakagawa, T. Diagnosis and following up of Ménière’s disease using multifrequency tympanometry-Cutoff values and temporal changes in measurements. Auris Nasus Larynx 2018, 45, 81–87. [Google Scholar] [CrossRef]
- Nakashima, T.; Ueda, H.; Furuhashi, A.; Sato, E.; Asahi, K.; Naganawa, S.; Beppu, R. Air-bone gap and resonant frequency in large vestibular aqueduct syndrome. Am. J. Otol. 2000, 21, 671–674. [Google Scholar]
- Ota, I.; Sakagami, M.; Kitahara, T. The third mobile window effects in otology/ neurotology. J. Int. Adv. Otol. 2021, 17, 156–161. [Google Scholar] [CrossRef]
- Emmett, J.R. The large vestibular aqueduct syndrome. Am. J. Otol. 1985, 6, 387–415. [Google Scholar]
- Govaerts, P.J.; Casselman, J.; Daemers, K.; De Ceulaer, G.; Somers, T.; Offeciers, F.E. Audiological findings in large vestibular aqueduct syndrome. Int. J. Pediatr. Otorhinolaryngol. 1999, 51, 157–164. [Google Scholar] [CrossRef] [PubMed]
- Mimura, T.; Sato, E.; Sugiura, M.; Yoshino, T.; Naganawa, S.; Nakashima, T. Hearing loss in patients with enlarged vestibular aqueduct: air-bone gap and audiological Bing test. Int. J. Audiol. 2005, 44, 466–469. [Google Scholar] [CrossRef] [PubMed]
- Zhang, L.; Wang, J.; Grais, E.M.; Li, Y.; Zhao, F. Three-dimensional wideband absorbance immittance findings in young adults with large vestibular aqueduct syndrome. Laryngoscope Investig. Otolaryngol. 2023, 8, 236–244. [Google Scholar] [CrossRef] [PubMed]
- Li, A.; Du, H.; Gao, J.; Xu, Y.; Zhao, N.; Gao, S.; Xing, Y.; Qian, X.; Gao, X.; Yang, Y. Characteristics of large vestibular aqueduct syndrome in wideband acoustic immittance. Front. Neurosci. 2023, 17, 1185033. [Google Scholar] [CrossRef]
- BSA. Recommended procedure tympanometry. Br Soc. Audiol. 2013, 1–20. [Google Scholar]
- Jerger, J.; Jerger, S.; Mauldin, L. Studies in impedance audiometry. I. Normal and sensorineural ears. Arch. Otolaryngol. 1972, 96, 513–523. [Google Scholar] [CrossRef]
- Valvassori, G.E.; Clemis, J.D. The large vestibular aqueduct syndrome. Laryngoscope 1978, 88, 723–728. [Google Scholar] [CrossRef]
- Vijayasekaran, S.; Halsted, M.J.; Boston, M.; Meinzen-Derr, J.; Bardo, D.M.; Greinwald, J.; Benton, C. When is the vestibular aqueduct enlarged? A statistical analysis of the normative distribution of vestibular aqueduct size. A.J.N.R. Am. J. Neuroradiol. 2007, 28, 1133–1138. [Google Scholar] [CrossRef]
- Seo, Y.J.; Kim, J.; Choi, J.Y. Correlation of vestibular aqueduct size with air-bone gap in enlarged vestibular aqueduct syndrome. Laryngoscope 2016, 126, 1633–1638. [Google Scholar] [CrossRef]
- Hunter, L.L.; Shahnaz, N. Acoustic Immittance Measures: Basic and Advanced Practice; Plural Publishing: San Diego, (CA), USA, 2014. [Google Scholar]
- Minor, L.B.; Solomon, D.; Zinreich, J.S.; Zee, D.S. Sound- and/or pressure-induced vertigo due to bone dehiscence of the superior semicircular canal. Arch. Otolaryngol. Head Neck Surg. 1998, 124, 249–258. [Google Scholar] [CrossRef]
- Tonndorf, J.; Tabor, J.R. Closure of the cochlear windows: its effect upon air- and bone-conduction. Ann. Otol. Rhinol. Laryngol. 1962, 71, 5–29. [Google Scholar] [CrossRef] [PubMed]
- Gopen, Q.; Rosowski, J.J.; Merchant, S.N. Anatomy of the normal human cochlear aqueduct with functional implications. Hear. Res. 1997, 107, 9–22. [Google Scholar] [CrossRef] [PubMed]
- Levenson, M.J.; Parisier, S.C.; Jacobs, M.; Edelstein, D.R. The large vestibular aqueduct syndrome in children. A review of 12 cases and the description of a new clinical entity. Arch. Otolaryngol. Head Neck Surg. 1989, 115, 54–58. [Google Scholar] [CrossRef] [PubMed]
- Merchant, S.N.; Rosowski, J.J. Conductive hearing loss caused by third-window lesions of the inner ear. Otol. Neurotol. 2008, 29, 282–289. [Google Scholar] [CrossRef] [PubMed]
- Nakajima, H.H.; Rosowski, J.J.; Shahnaz, N.; Voss, S.E. Assessment of ear disorders using power reflectance. Ear Hear. 2013, 34, 48S–53S. [Google Scholar] [CrossRef]
- Rosowski, J.J.; Stenfelt, S.; Lilly, D. An overview of wideband immittance measurements techniques and terminology: you say absorbance, I say reflectance. Ear Hear. 2013, 34, 9S–16S. [Google Scholar] [CrossRef]
- Kobayashi, M.; Yoshida, T.; Sugimoto, S.; Shimono, M.; Teranishi, M.; Naganawa, S.; Sone, M. Effects of endolymphatic hydrops on acoustic energy absorbance. Acta Otolaryngol. 2020, 140, 626–631. [Google Scholar] [CrossRef]
- Sone, M.; Yoshida, T.; Morimoto, K.; Teranishi, M.; Nakashima, T.; Naganawa, S. Endolymphatic hydrops in superior canal dehiscence and large vestibular aqueduct syndromes. Laryngoscope 2016, 126, 1446–1450. [Google Scholar] [CrossRef]
- Sato, E.; Nakashima, T.; Lilly, D.J.; Fausti, S.A.; Ueda, H.; Misawa, H.; Uchida, Y.; Furuhashi, A.; Asahi, K.; Naganawa, S. Tympanometric findings in patients with enlarged vestibular aqueducts. Laryngoscope 2002, 112, 1642–1646. [Google Scholar] [CrossRef]
- Sundgaard, J.V.; Värendh, M.; Nordström, F.; Kamide, Y.; Tanaka, C.; Harte, J.; Paulsen, R.R.; Christensen, A.N.; Bray, P.; Laugesen, S. Inter-rater reliability of the diagnosis of otitis media based on otoscopic images and wideband tympanometry measurements. Int. J. Pediatr. Otorhinolaryngol. 2022, 153, 111034. [Google Scholar] [CrossRef]
- Sennaroglu, L. Histopathology of inner ear malformations: do we have enough evidence to explain pathophysiology? Cochlear Implants Int. 2016, 17, 3–20. [Google Scholar] [CrossRef] [PubMed]
- Bilgen, C.; Kirkim, G.; Kirazli, T. Middle ear impedance measurements in large vestibular aqueduct syndrome. Auris Nasus Larynx 2009, 36, 263–268. [Google Scholar] [CrossRef] [PubMed]
- Jackler, R.K.; De La Cruz, A. The large vestibular aqueduct syndrome. Laryngoscope 1989, 99, 1238–1242. [Google Scholar] [CrossRef]
- Berrettini, S.; Forli, F.; Bogazzi, F.; Neri, E.; Salvatori, L.; Casani, A.P.; Franceschini, S.S. Large vestibular aqueduct syndrome: audiological, radiological, clinical, and genetic features. Am. J. Otolaryngol. 2005, 26, 363–371. [Google Scholar] [CrossRef] [PubMed]
- Ideura, M.; Nishio, S.Y.; Moteki, H.; Takumi, Y.; Miyagawa, M.; Sato, T.; Kobayashi, Y.; Ohyama, K.; Oda, K.; Matsui, T.; Ito, T.; Suzumura, H.; Nagai, K.; Izumi, S.; Nishiyama, N.; Komori, M.; Kumakawa, K.; Takeda, H.; Kishimoto, Y.; Iwasaki, S.; Furutate, S.; Ishikawa, K.; Fujioka, M.; Nakanishi, H.; Nakayama, J.; Horie, R.; Ohta, Y.; Naito, Y.; Kakudo, M.; Sakaguchi, H.; Kataoka, Y.; Sugahara, K.; Hato, N.; Nakagawa, T.; Tsuchihashi, N.; Kanda, Y.; Kihara, C.; Tono, T.; Miyanohara, I.; Ganaha, A.; Usami, S.I. Comprehensive analysis of syndromic hearing loss patients in Japan. Sci. Rep. 2019, 9, 11976. [Google Scholar] [CrossRef]
- Perry, J.; Sher, E.; Kawai, K.; Redfield, S.; Sun, T.; Kenna, M. Newborn hearing screening results in patients with enlarged vestibular aqueduct. Laryngoscope 2023, 133, 2786–2791. [Google Scholar] [CrossRef]
- Shahnaz, N.; Feeney, M.P.; Schairer, K.S. Wideband acoustic immittance normative data: ethnicity, gender, aging, and instrumentation. Ear Hear. 2013, 34, 27S–35S. [Google Scholar] [CrossRef]
Figure 1.
Measuring the VA midpoint and porous width in axial computed tomography images. The VA midpoint width was measured at the half the distance from VA fundus to its external pore (A). The VA porous width was measured from the opercular margins to the spots on the posterior temporal bone walls whose surface was perpendicular to the measurement lines (B). Tangents (black lines) to these spots are shown to illustrate the right angle relationships.
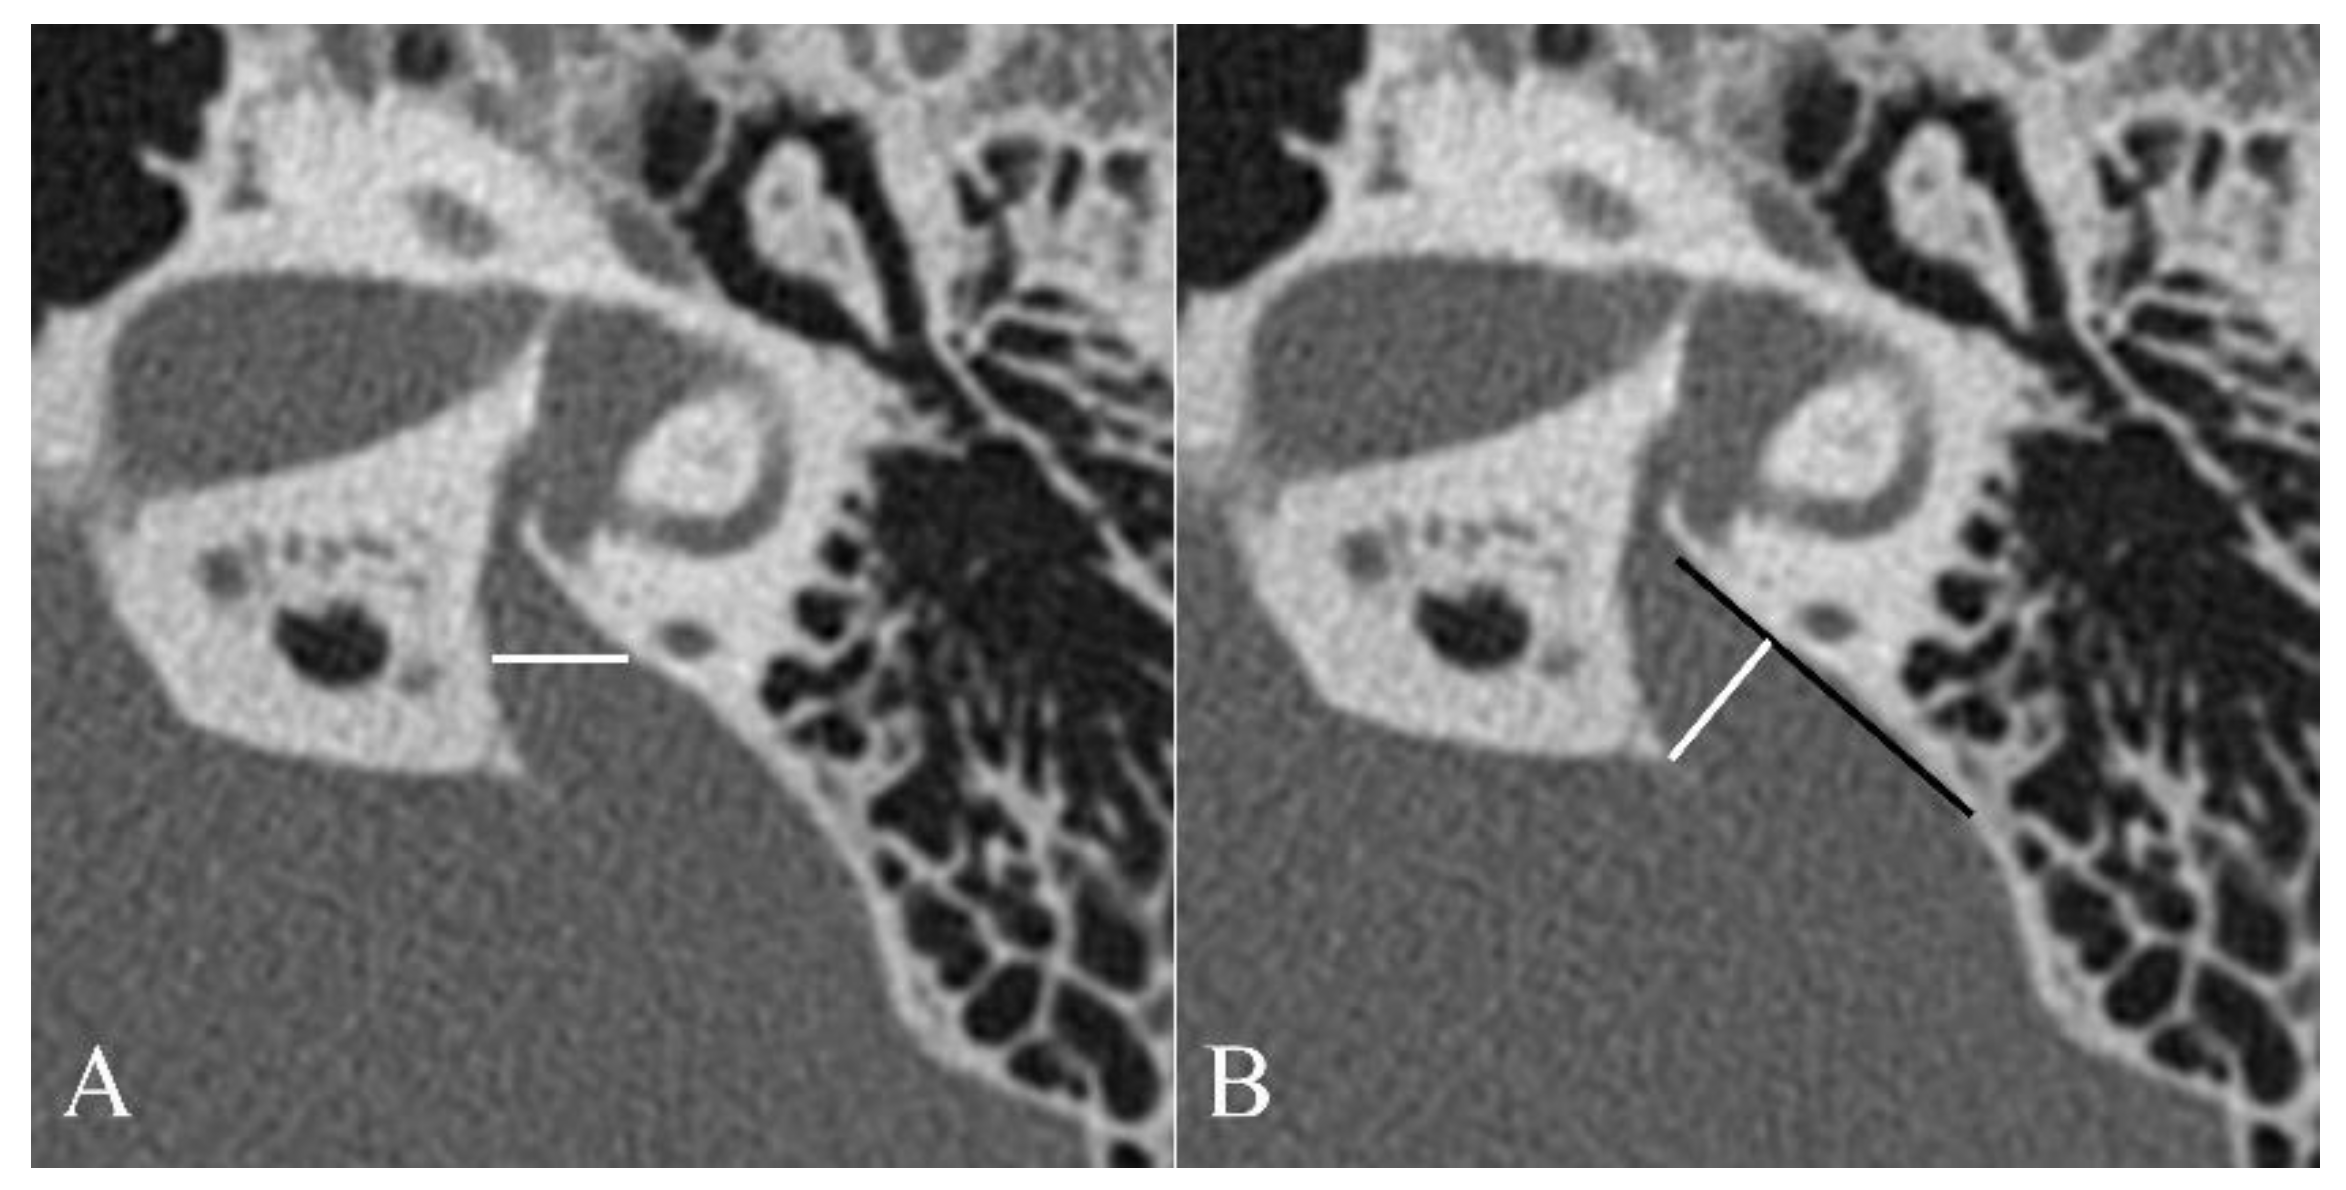
Figure 2.
Mean absorbance curves at peak pressure against frequency group.Error bars represent ±1 standard deviation from the mean.
Figure 2.
Mean absorbance curves at peak pressure against frequency group.Error bars represent ±1 standard deviation from the mean.
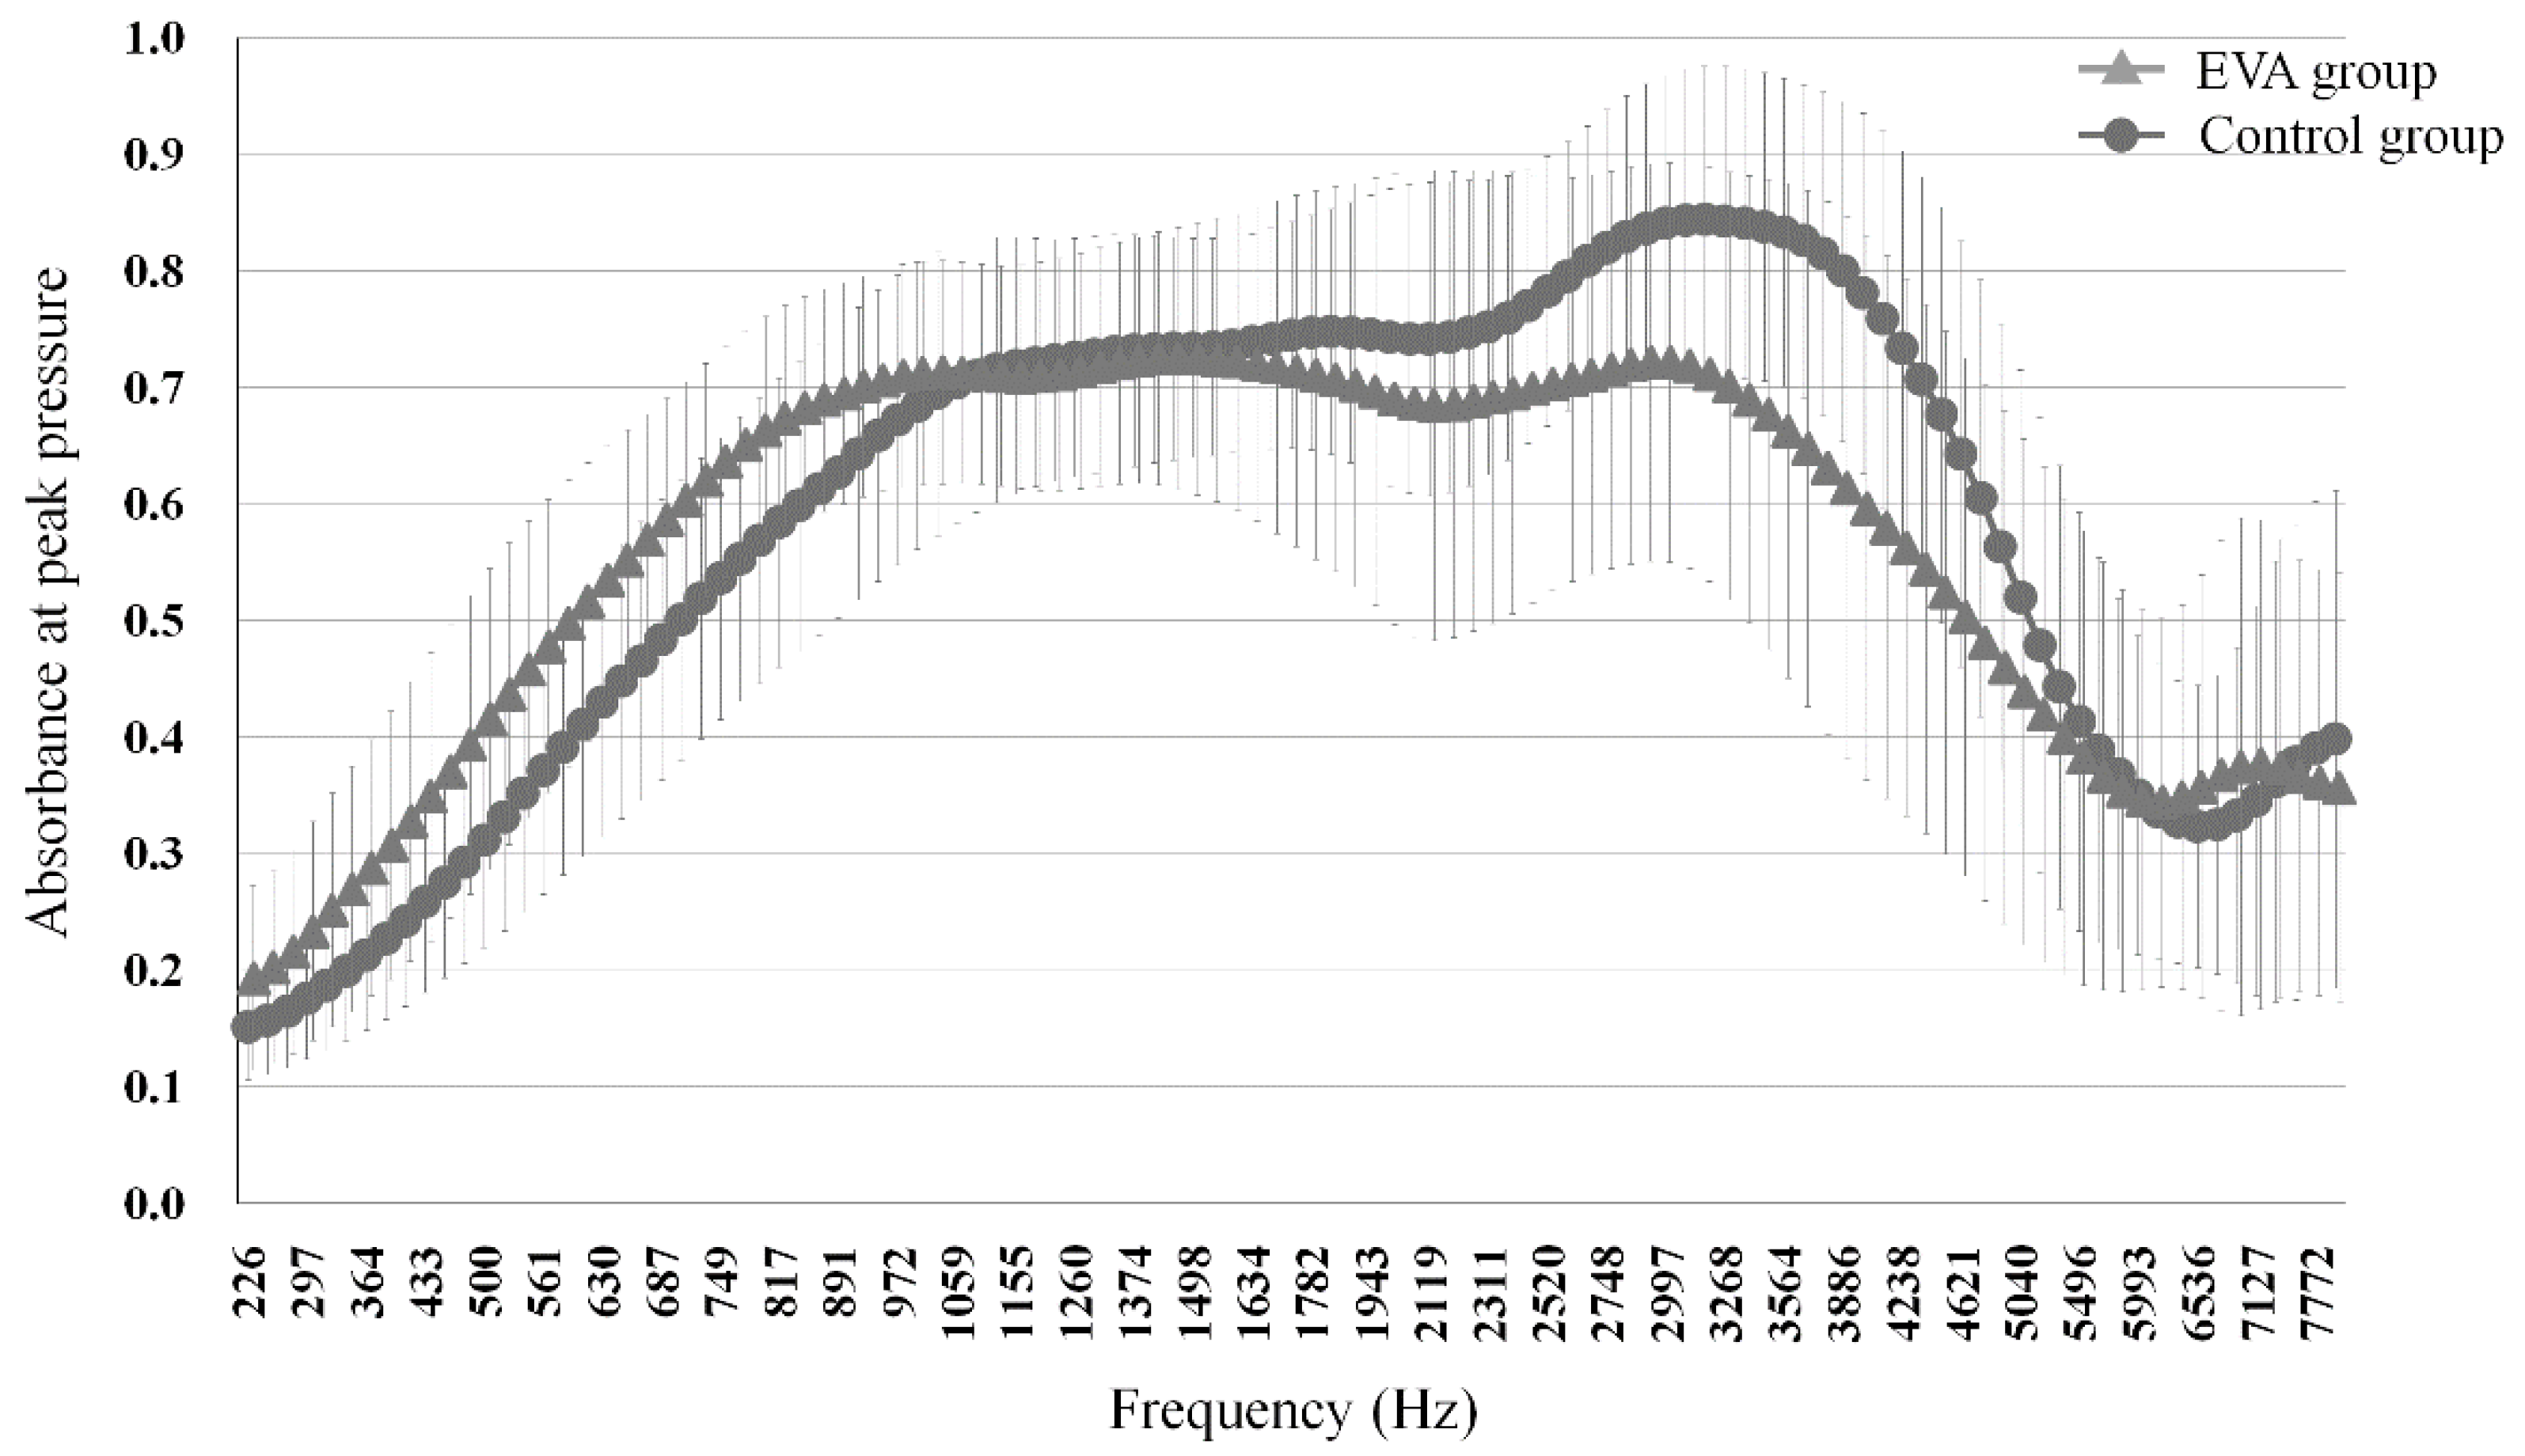
Figure 3.
Comparison of RF between control group and EVA group.Mean RF was significantly lower in the EVA group versus the control group.
Figure 3.
Comparison of RF between control group and EVA group.Mean RF was significantly lower in the EVA group versus the control group.
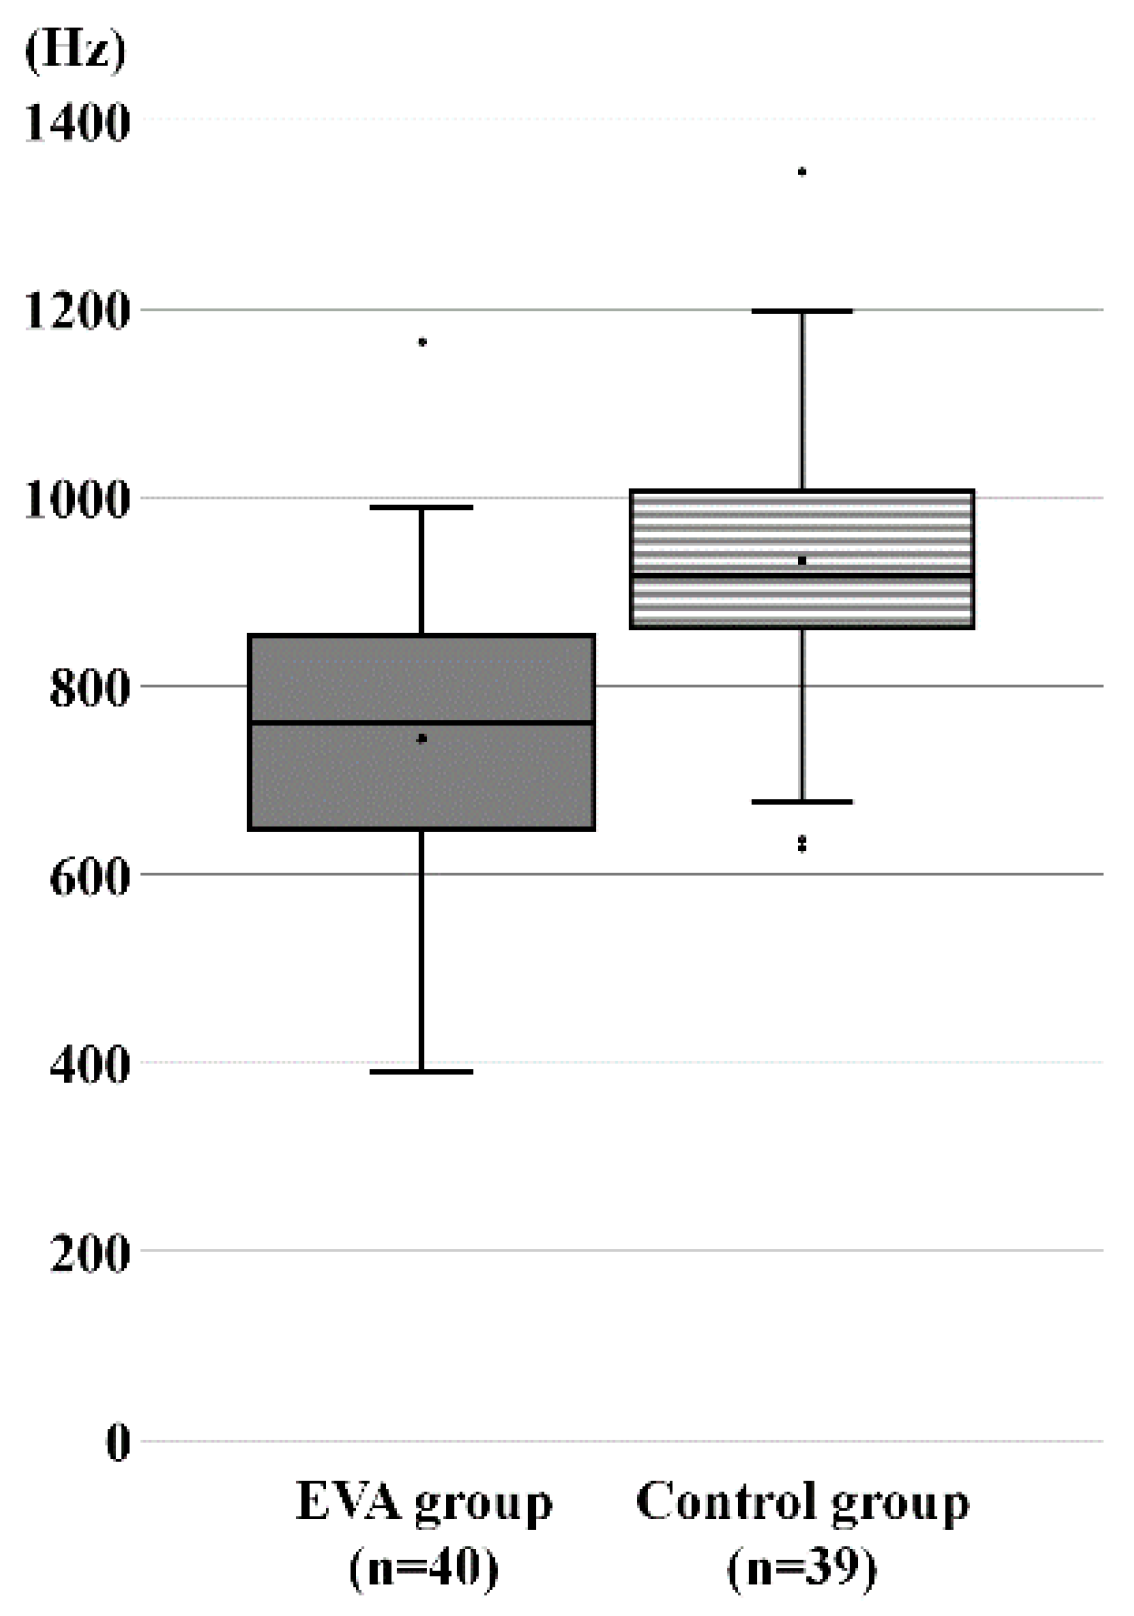
Figure 4.
Receiver operating characteristic analysis for absorbance at 3,776 Hz (A). Area under the curve, 0.771 (95% confidence interval, 0.670–0.871). ROC analysis for RF in control and EVA patients (B). AUC, 0.801 (95% confidence interval, 0.712–0.907).
Figure 4.
Receiver operating characteristic analysis for absorbance at 3,776 Hz (A). Area under the curve, 0.771 (95% confidence interval, 0.670–0.871). ROC analysis for RF in control and EVA patients (B). AUC, 0.801 (95% confidence interval, 0.712–0.907).
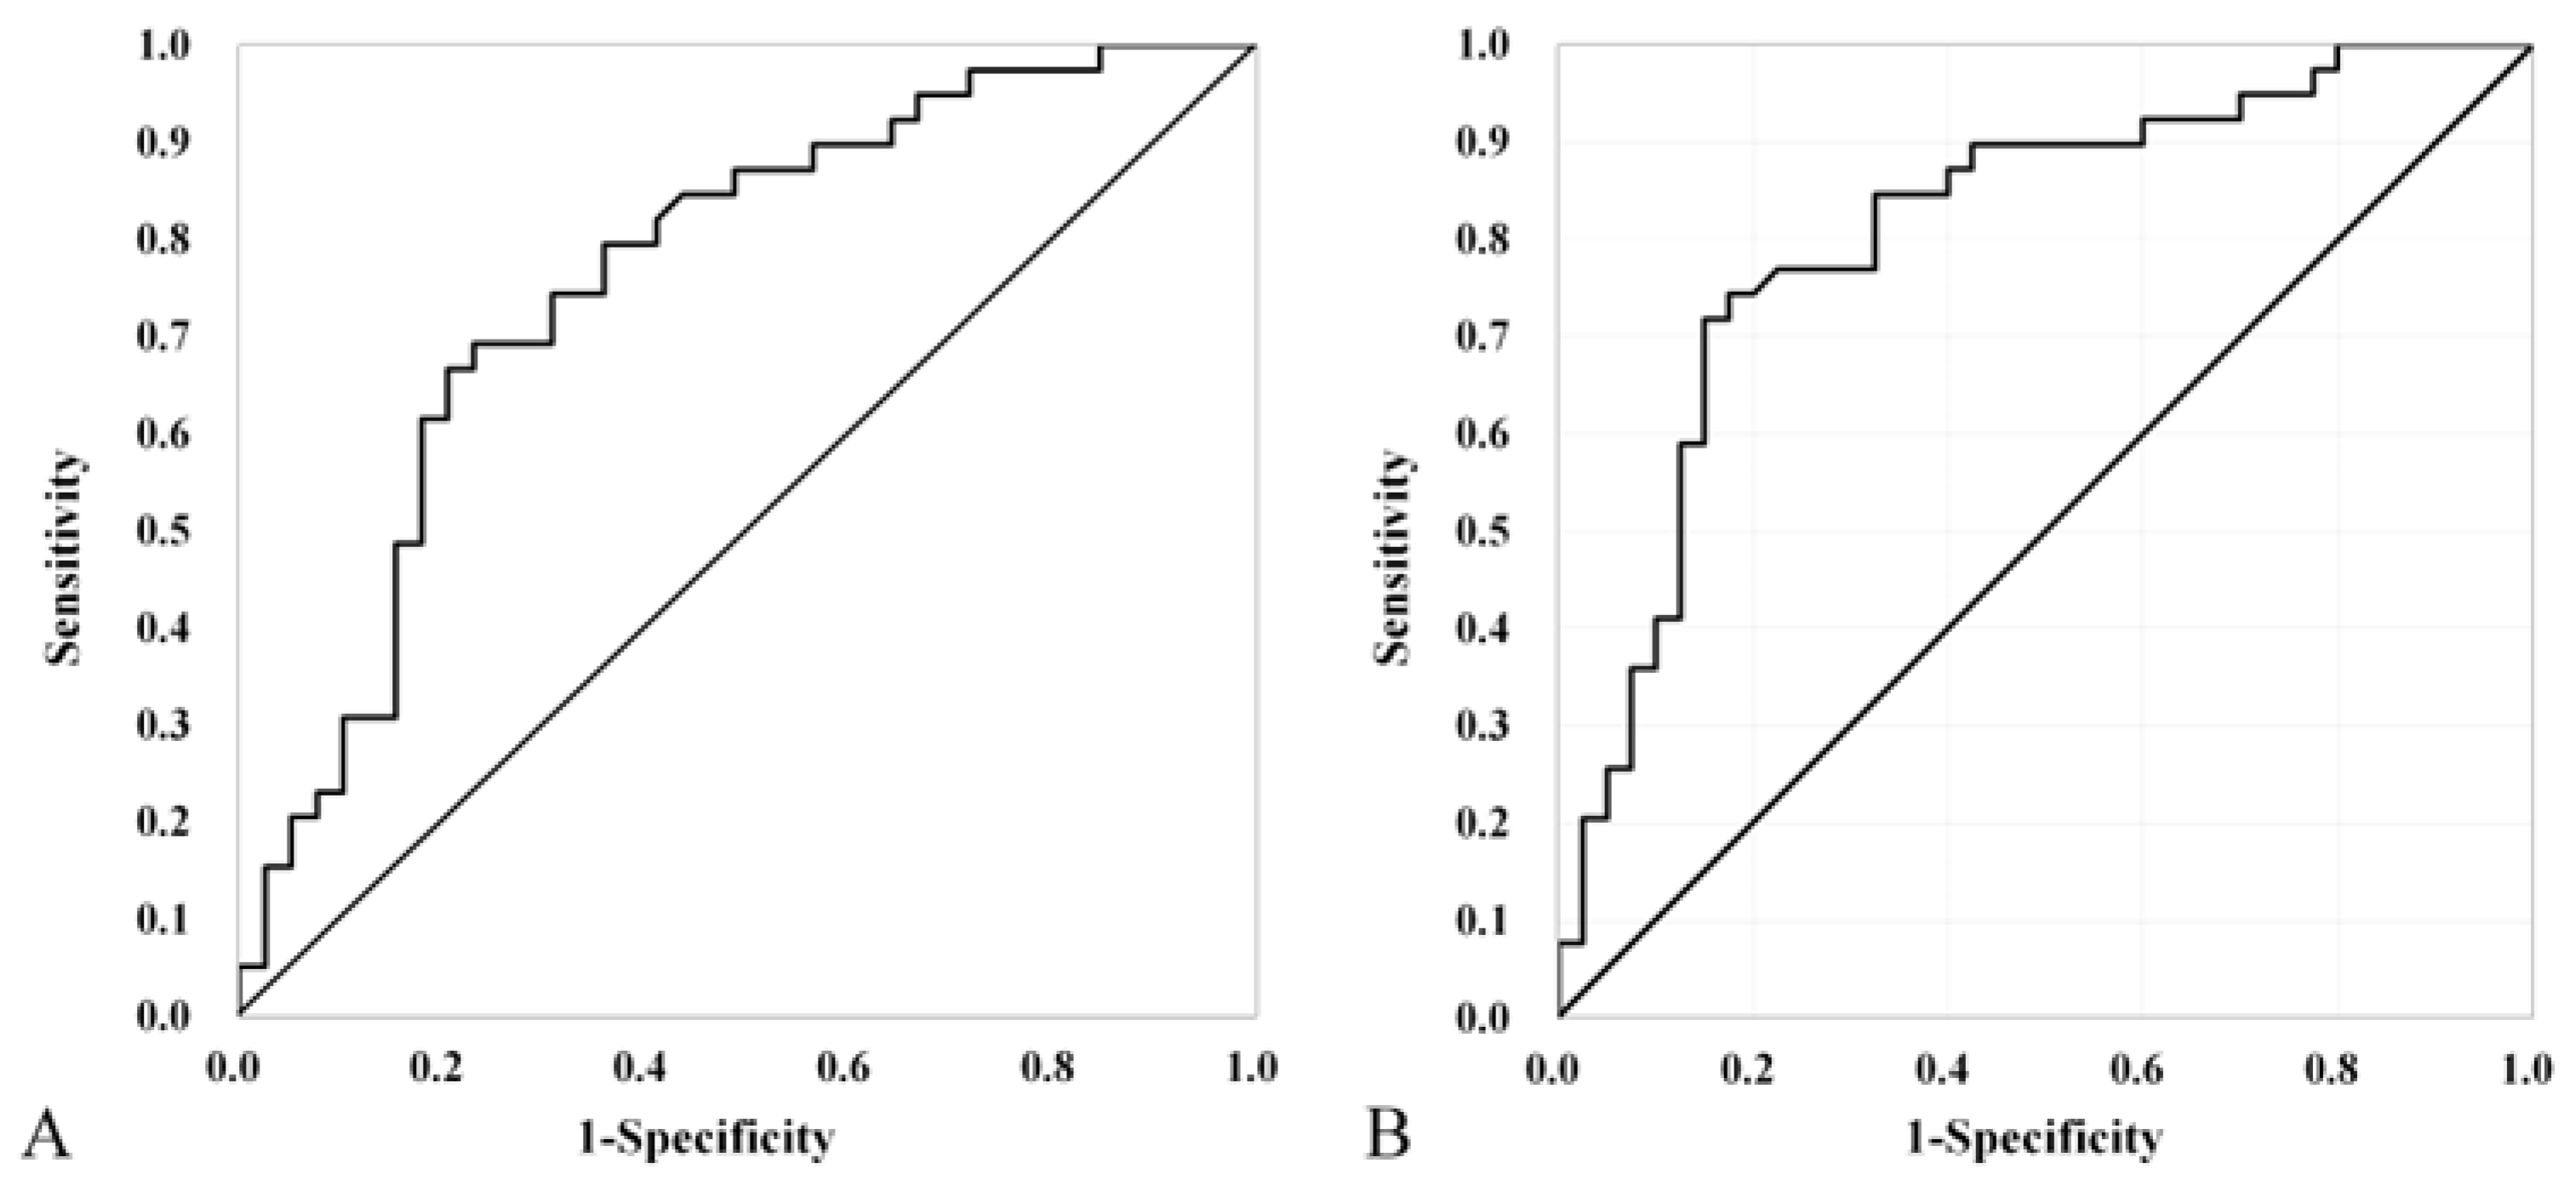
Figure 5.
Correlations of resonance frequency with (A) the VA midpoint width (r = −0.334); and (B) the VA porous width (r = −0.402). The line represents the best-fit regression line.
Figure 5.
Correlations of resonance frequency with (A) the VA midpoint width (r = −0.334); and (B) the VA porous width (r = −0.402). The line represents the best-fit regression line.
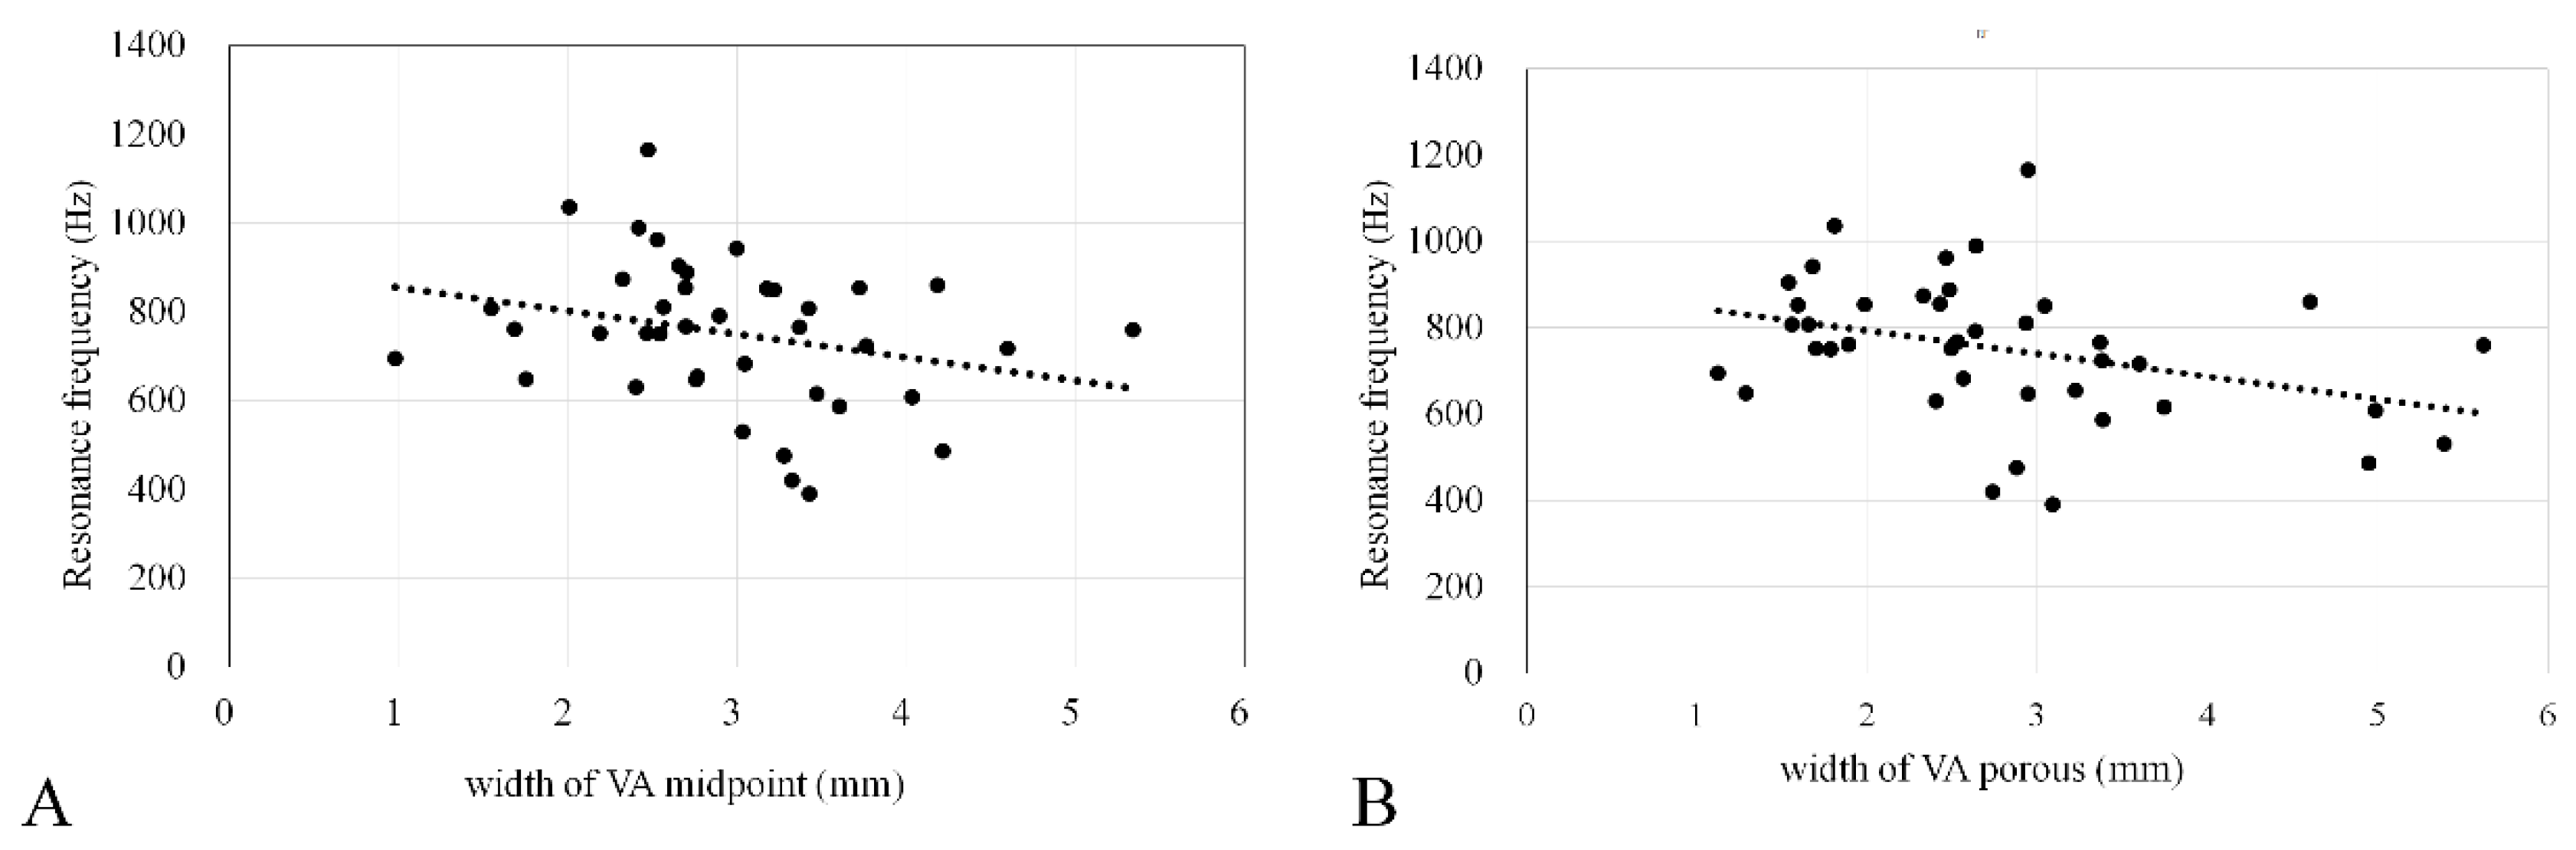

Table 1.
Inclusion criteria.
| Control group | |
| 1 | No history of acquired ear diseases |
| 2 | No acute or chronic upper respiratory inflammation |
| 3 | Normal findings on pretest otoscopic examination |
| 4 | Type-A tympanometry |
| 5 | Normal hearing level (≤25 dBHL from 500 to 2000Hz, air-bone gap ≤10 dB from 500 to 2000 Hz) |
| Enlarged vestibular aqueduct (EVA) group | |
| 1 | Patients who meet criteria 1–4 in the control group |
| 2 | VA with a diameter of >1.5 mm at the midpoint |
Table 2.
Demographic data.
| EVA group | Control group | p-value | ||
| Number of subjects | 25 | 28 | ||
| Number of ears | 40 | 39 | ||
| Sex | ||||
| Male | 21 (52.5%) | 23 (59%) | 0.361 | |
| Female | 19 (47.5%) | 16 (41%) | ||
| Side of WBT | ||||
| Right | 19 (%) | 21 (%) | 0.651 | |
| Left | 21 (%) | 18 (%) | ||
| Age at WBT (years) | 14 (4–49) | 12 (4–48) | 0.822 | |
| Hearing level (dB) | 80 ± 22.2 | 9.0 ± 4.0 | <0.001 | |
WBT: wideband tympanometry.
Disclaimer/Publisher’s Note: The statements, opinions and data contained in all publications are solely those of the individual author(s) and contributor(s) and not of MDPI and/or the editor(s). MDPI and/or the editor(s) disclaim responsibility for any injury to people or property resulting from any ideas, methods, instructions or products referred to in the content. |
© 2024 by the authors. Licensee MDPI, Basel, Switzerland. This article is an open access article distributed under the terms and conditions of the Creative Commons Attribution (CC BY) license (http://creativecommons.org/licenses/by/4.0/).
Copyright: This open access article is published under a Creative Commons CC BY 4.0 license, which permit the free download, distribution, and reuse, provided that the author and preprint are cited in any reuse.


