1. Introduction
The proper function of the mitral valve leaflet is essential for maintaining unidirectional blood flow through the heart. The valve consists of four main components: the annulus, anterior and posterior leaflets, papillary muscles and chordae tendineae [
1]. The chordae tendineae connect the leaflets to the papillary muscles [
2,
3] and are classified based on their size and where they attach to the leaflet [
4,
5]. The thinnest marginal chordae attach to the free edge of the leaflet, while the intermediately-sized basal chordae attach directly to the ventricular surface of the leaflet [
5]. The thickest strut chordae attach near the midline of the leaflet around the 4 o’clock and 8 o’clock positions [
4,
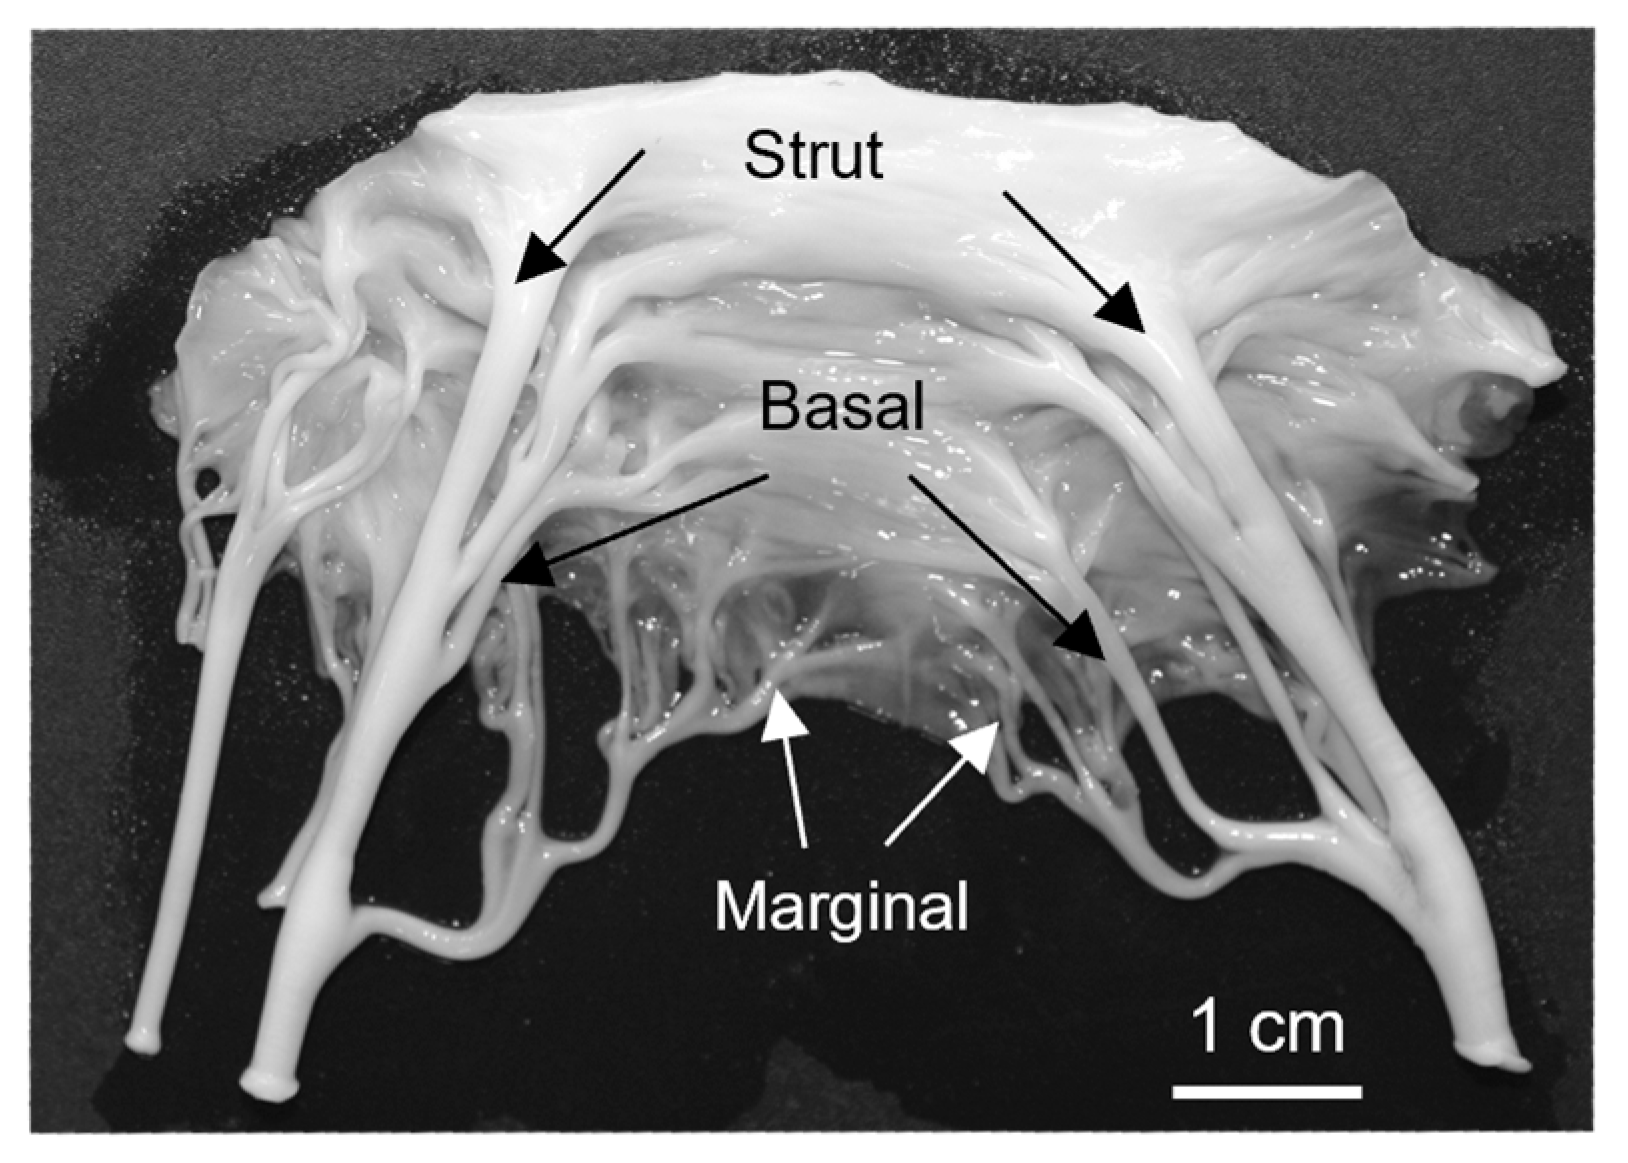
5]. Chordae tendineae exhibit a branching pattern, with a single chord from the papillary muscle bifurcating into thinner strands and creating a fan-like network of attachments into the leaflet (
Figure 1). The chordae tendineae prevent prolapse of the leaflet into the atrium by transferring tension from the leaflet to the papillary muscles [
2,
3], with most of this tension borne by the strut chordae [
6].
Chordae tendineae are tendinous tissues comprised of collagen, elastin, proteoglycans and valvular interstitial cells. The exterior of the chordae tendineae is lined by a layer of endothelial cells underneath which is a layer of elastin interwoven with a small amount of loosely bound fibrous collagen [
7]. The inner core is composed of tightly bundled fibrous collagen, which makes up 60% of the chordae dry weight and contributes to the impressive tensile strength of these structures [
8,
9].
Important as they are for mitral valve function, there remains no comprehensive explanation of how chordae tendineae form and bifurcate during fetal development. What has confounded chordal development work is that this process appears to be species-dependent. In rats and mice, anterior leaflet chordae tendineae do not bifurcate until after birth [
10,
11,
12,
13,
14]. Specifically, in rats branched chordae do not appear until approximately seven days after birth [
10]. Mice possess one to two chordae tendineae attachments during late gestation [
11,
14] that bifurcate to an average of fifteen attachments after birth [
12]. The lack of branched chordae during rodent gestation may be due to the small valve orifice and low ventricular pressures [
10] – such that the primordial leaflet alone can provide adequate valve closure. As the valve orifice expands and ventricular pressure increases after birth, the chordae tendineae bifurcate into multiple attachment sites providing extra support to the leaflet and preventing prolapse [
10,
11].
By contrast, in large mammals, such as pigs [
15], humans [
16,
17], and cattle [
18], chordae tendineae form and bifurcate
during gestation. In humans, branched chordae tendineae are seen as early as ~89 days into gestation, before the anterior leaflet has fully delaminated from the underlying myocardium [
16,
17]. In our previous studies on cattle, the number of chordae attachments to the growing anterior leaflet increases throughout gestation. The number of chordae tendineae attachments is then fixed at birth, despite the continued growth of the leaflet post-partum [
18]. These observations suggest that there may be a programmed geometry and/or number of chordae tendineae attachments that are optimal for adult mitral valve function – this is reached by birth. Thus, it is important to study chordae formation during gestation in order to discover the underlying developmental mechanisms.
Some clues regarding the signalling mechanisms underlying chordae formation have come from genetic knockout studies in mice. The matricellular protein periostin appears necessary, as periostin knock-out mice do not develop branched chordae tendineae after birth [
12]. There appears to be a mechanical signalling component to chordae formation as filamin-A, a cytoskeletal protein, is also required. Mice lacking filamin-A possess two large chordae with no branching, similar to the phenotype of the mice lacking periostin [
19].
Yet, the question remains, how do the chordae form and bifurcate? Some of the first theories of chordae tendineae formation were drawn from serial sections of fetal human atrioventricular valves. In these models, it was hypothesized that the chordae are derived from myocardial tissue [
20,
21]. However, lineage tracing studies demonstrated that the chordae and leaflet are each derived from distinct populations of endocardial cells [
13]. Later studies in humans [
16], rats [
10], and chicks [
22] confirmed that chordae are derived from the endocardial tissues. The endocardial cushions are remodeled from a gelatinous cushion to a thinner sheet attached to the myocardium before delamination. Narrow slits or “gaps” in this tissue preceded the appearance of branched chordae tendineae [
16,
22]. It was initially proposed that gap formation was caused by apoptosis of leaflet cells, similar to the process underlying its delamination from the myocardium [
13]. This theory was later discredited as it was demonstrated that minimal apoptosis was occurring in these areas [
23,
24,
25].
The goal of the present study was to evaluate possible mechanisms of chordae formation in a large mammalian model (cattle) where chordae form during gestation. Like humans, cattle have a similar four-chambered heart structure, nine-month gestational period, substantial size, similar transvalvular pressures [
26] and mitral valve anatomy [
18]. Here we report the first comprehensive study of chordae tendineae formation in a large animal model. We observed a “transition zone” at the junction between the fetal mitral valve leaflet and chordae tendineae, featuring a proteoglycan-rich area with holes or “perforations” lined by MMP-1, MMP-2, and Ki-67 expressing endothelial cells. By late gestation, there is a differential remodeling of elastin and collagen, with elastic fibers accumulating circumferentially around the perforations, and collagen fibers aligning parallel to the chordae tendineae. We hypothesize that the transition zone region marks the origin of new chordae branching, where perforations form, direct ECM organization, and initiate the splitting of single chordae attachments into two.
2. Materials and Methods
2.1. Tissue Harvest and Anatomical Dimensions
Protocols for the harvesting of bovine tissues (
Bos taurus) were approved by the University Committee on Laboratory Animals at Dalhousie University. Fetal bovine hearts from both males and females were obtained from a local abattoir immediately following slaughter [
18]. To determine gestational age, the fetal crown to rump length was measured using the following equation [
27]:
Fetuses ranged in age from 68 days (9 cm fetal length) to 270 days (100 cm fetal length).
2.2. Histological Preparation
One-half of the mitral valve anterior leaflet with associated chordae tendineae was cut from fetal hearts in the second and third trimesters (91-270 days). However, for first trimester samples (0-90 days) the whole anterior leaflet and chordae were used due to their small size. Samples were fixed (10% buffered neutral formalin) for 7 days, embedded in paraffin, and sectioned into 4µm serial transverse sections. For immunohistochemistry, negative controls were run with each batch of staining but are not shown.
2.3. Movat Pentachrome Staining
Sections were stained with Russell-Movat Pentachrome Stain Kit (Statlab, Texas, USA) to determine the localization of ECM proteins using the manufacturer's instructions. This kit stains collagen yellow-orange, mature elastin dark purple, muscle tissue and blood cells red, glycosaminoglycans in blue-green and cell nuclei in dark red-purple. Movat-stained slides were imaged using a Pannoramic MIDI II and viewed with the Caseviewer software (3DHistech, Budapest, Hungary).
2.4. Picrosirius Red Staining
To examine collagen alignment in the transition zone, sections were stained with picrosirius red and hematoxylin. Images of picrosirius-red–stained sections were taken using a Nikon Eclipse E600 light microscope (Tokyo, Japan) (Nikon Instruments Inc., Melville, NY, USA) equipped with a polarizer and an AmScope 10MU1400 digital camera (AmScope, Irvine, CA, USA) to better visualize collagen.
2.5. CD31 Staining
Slides were subjected to heat induced epitope retrieval for 40 minutes with Tris-EDTA (pH = 9) at 95°C before a peroxide block for 5 minutes. Immunohistochemistry for CD31 was conducted on a Bond RX Automated IHC Stainer (Leica, Concord, ON, Canada), using CD31 rabbit polyclonal antibody (Abcam cat no ab28364;1:50 dilution) and Bond Polymer Refine Detection (Leica, cat no DS9800). Staining was carried out according to the manufacturer's protocol with some modifications. A tissue blocking step was added prior to the incubation in the antibody solution, by applying PowerVision IHC/ISH Super Blocking (Leica, cat no PV6122) to the tissues for 30 minutes. Incubation times for CD31 staining were changed as follows: primary antibody incubation was extended from 15 to 60 minutes, polymer solution incubation was extended from 8 to 12 minutes, and DAB incubation was extended from 10 to 20 minutes.
After peroxide blocking and tissue blocking steps, tissues were incubated in the antibody solution (CD31 diluted 1:50 in Bond Primary Antibody Diluent, Leica cat no AR9352) for 60 minutes followed by three washes with Bond Wash Solution (Leica cat no AR9590). Slides were then incubated in polymer solution (polymeric HRP-linker anti-rabbit IgG antibody conjugates) for 12 minutes and washed two times with Bond Wash Solution and a wash with purified water. This was followed by incubation with DAB for 20 minutes, three washes with purified water, and Haematoxylin counterstaining for 5 minutes. Slides were then dehydrated in a series of ethanol and coverslipped in a Spectra Workstation (Leica, Concord, ON, Canada). Slides were scanned using an Aperio XT Brightfield Whole Slide Scanner (Leica, Concord, ON, Canada) at 400 times magnification.
2.6. MMP-1 Staining
Slides were subjected to heat induced epitope retrieval for 40 minutes with Tris-EDTA (pH = 9) at 95°C before a peroxide block for 5 minutes. Immunohistochemistry for MMP-1 was conducted on a Bond RX Automated IHC Stainer (Leica, Concord, ON, Canada), using MMP-1 rabbit monoclonal antibody (Abcam cat no ab52631;1:40 dilution) and Bond Polymer Refine Detection (Leica, cat no DS9800). Staining was carried out according to the manufacturer's protocol except with increased incubation times for the primary antibody (from 15 to 60 minutes), polymer solution (from 8 to 12 minutes), and DAB (from 10 to 20 minutes). Tissues were incubated in the antibody solution (MMP-1 diluted 1:40 in Bond Primary Antibody Diluent, Leica cat no AR9352) for 60 minutes followed by three washes with Bond Wash Solution (Leica cat no AR9590). Slides were then incubated in polymer solution (polymeric HRP-linker anti-rabbit IgG antibody conjugates) for 12 minutes and washed two times with Bond Wash Solution and a wash with purified water. This was followed by incubation with DAB for 20 minutes, three washes with purified water, and Haematoxylin counterstaining for 5 minutes. Slides were then dehydrated, coverslipped, and scanned as described above.
2.7. MMP-2 Staining
Slides were subjected to heat-induced epitope retrieval for 30 minutes with Tris-EDTA (pH = 9) at 95°C before a peroxide block for 5 minutes. Immunohistochemistry for MMP-2 was conducted on a Bond RX Automated IHC Stainer (Leica, Concord, ON, Canada), using MMP-2 rabbit polyclonal antibody (Abcam cat no ab97779;1:200 dilution) and Bond Polymer Refine Detection (Leica, cat no DS9800). Staining was carried out according to the manufacturer's protocol, with a tissue blocking step added prior to the incubation in the antibody solution, by applying PowerVision IHC/ISH Super Blocking (Leica, cat no PV6122) to the tissues for 30 minutes. After peroxide blocking and tissue blocking steps, tissues were incubated in the antibody solution (MMP-2 diluted 1:200 in Bond Primary Antibody Diluent, Leica cat no AR9352) for 30 minutes followed by three washes with Bond Wash Solution (Leica cat no AR9590). Slides were then incubated in polymer solution (polymeric HRP-linker anti-rabbit IgG antibody conjugates) for 8 minutes, washed two times with Bond Wash Solution then washed with purified water. This was followed by incubation with DAB for 10 minutes, three washes with purified water, and Haematoxylin counterstaining for 5 minutes. Slides were then dehydrated, coverslipped and scanned as described above.
2.8. Ki-67 Staining
Slides were subjected to heat-induced epitope retrieval for 30 minutes with Tris-EDTA (pH = 9) at 95°C before a peroxide block for 5 minutes. Immunohistochemistry for Ki-67 was conducted on a Bond RX Automated IHC Stainer (Leica, Concord, ON, Canada), using Ki-67 rabbit monoclonal antibody (Abcam cat no ab16667;1:200 dilution) and Bond Polymer Refine Detection (Leica, cat no DS9800). Staining was carried out according to the manufacturer's protocol. Tissues were incubated in the antibody solution (Ki-67 diluted 1:200 in Bond Primary Antibody Diluent, Leica cat no AR9352) for 60 minutes followed by three washes with Bond Wash Solution (Leica cat no AR9590). Slides were then incubated in polymer solution (polymeric HRP-linker anti-rabbit IgG antibody conjugates) for 12 minutes, washed two times with Bond Wash Solution then washed with purified water. This was followed by incubation with DAB for 20 minutes, three washes with purified water, and Haematoxylin counterstaining for 5 minutes. Slides were then dehydrated, coverslipped, and scanned as described above.
2.9. Cell Density Measurement
The presence of Ki-67 positive nuclei was assessed in the anterior leaflet, the chordae tendineae, and the transition zone. Photo analysis grids with an area of 0.64mm2 were overlaid onto the image of the whole valve (taken at 1.5X). Three random grids were chosen per area for analysis, for a total of nine grids per valve. Grid areas were enhanced to a magnification of 13.6X for further analysis in ImageJ (National Institute of Health, Bethesda, MD, USA). The Cell Count plug-in feature in ImageJ was used to manually count and classify cell nuclei as either Ki-67 positive (which appear brown with DAB staining) or negative (appear purple/blue with hematoxylin counterstain). First, all cell nuclei in the image (positive and negatively stained cells) were selected and recorded under an arbitrary “Type 1 Counter”. Next, a second “Type 2 Counter” was used to count and record Ki-67 positive cells only. Both total cell number and Ki-67 positive cell numbers were normalized to the area of the grid (0.64mm2) to get total cell density and Ki-67 positive cell density respectively.
2.10. Microcomputed Tomography Preparation, Imaging, and Volume Rendering
Fetal valves for microcomputed tomography (micro-CT) imaging ranged in age from 125 days to 236 days gestation. The whole anterior leaflet, associated chordae tendineae and papillary muscle attachments were dissected and fixed with 4% paraformaldehyde overnight. Tissues were then placed into a solution of 10% Lugol’s iodine for 7 days in the dark. Following this, tissues were rinsed with distilled water and placed into a phosphate buffered saline solution at 4°C in the dark until imaging.
Micro-CT images were taken using the Bruker SkyScan 1276 Micro-CT (Bruker, Billerica, MA, USA). Leaflets were placed onto the carrier ventricular side facing up and scanned for 30 minutes with parameters optimized for ex vivo imaging (58 KV, 200µA, and voxel size of approximately 9 µm). Three-dimensional reconstruction and volume rendering were performed using Dragonfly 4.1 (Object Research Systems (ORS), Montreal, QC, Canada). 3D renderings were sliced through manually using the clipping tool and single 2D images were exported in Tag Image File Format (TIFF).
2.11. Perforation Measurement
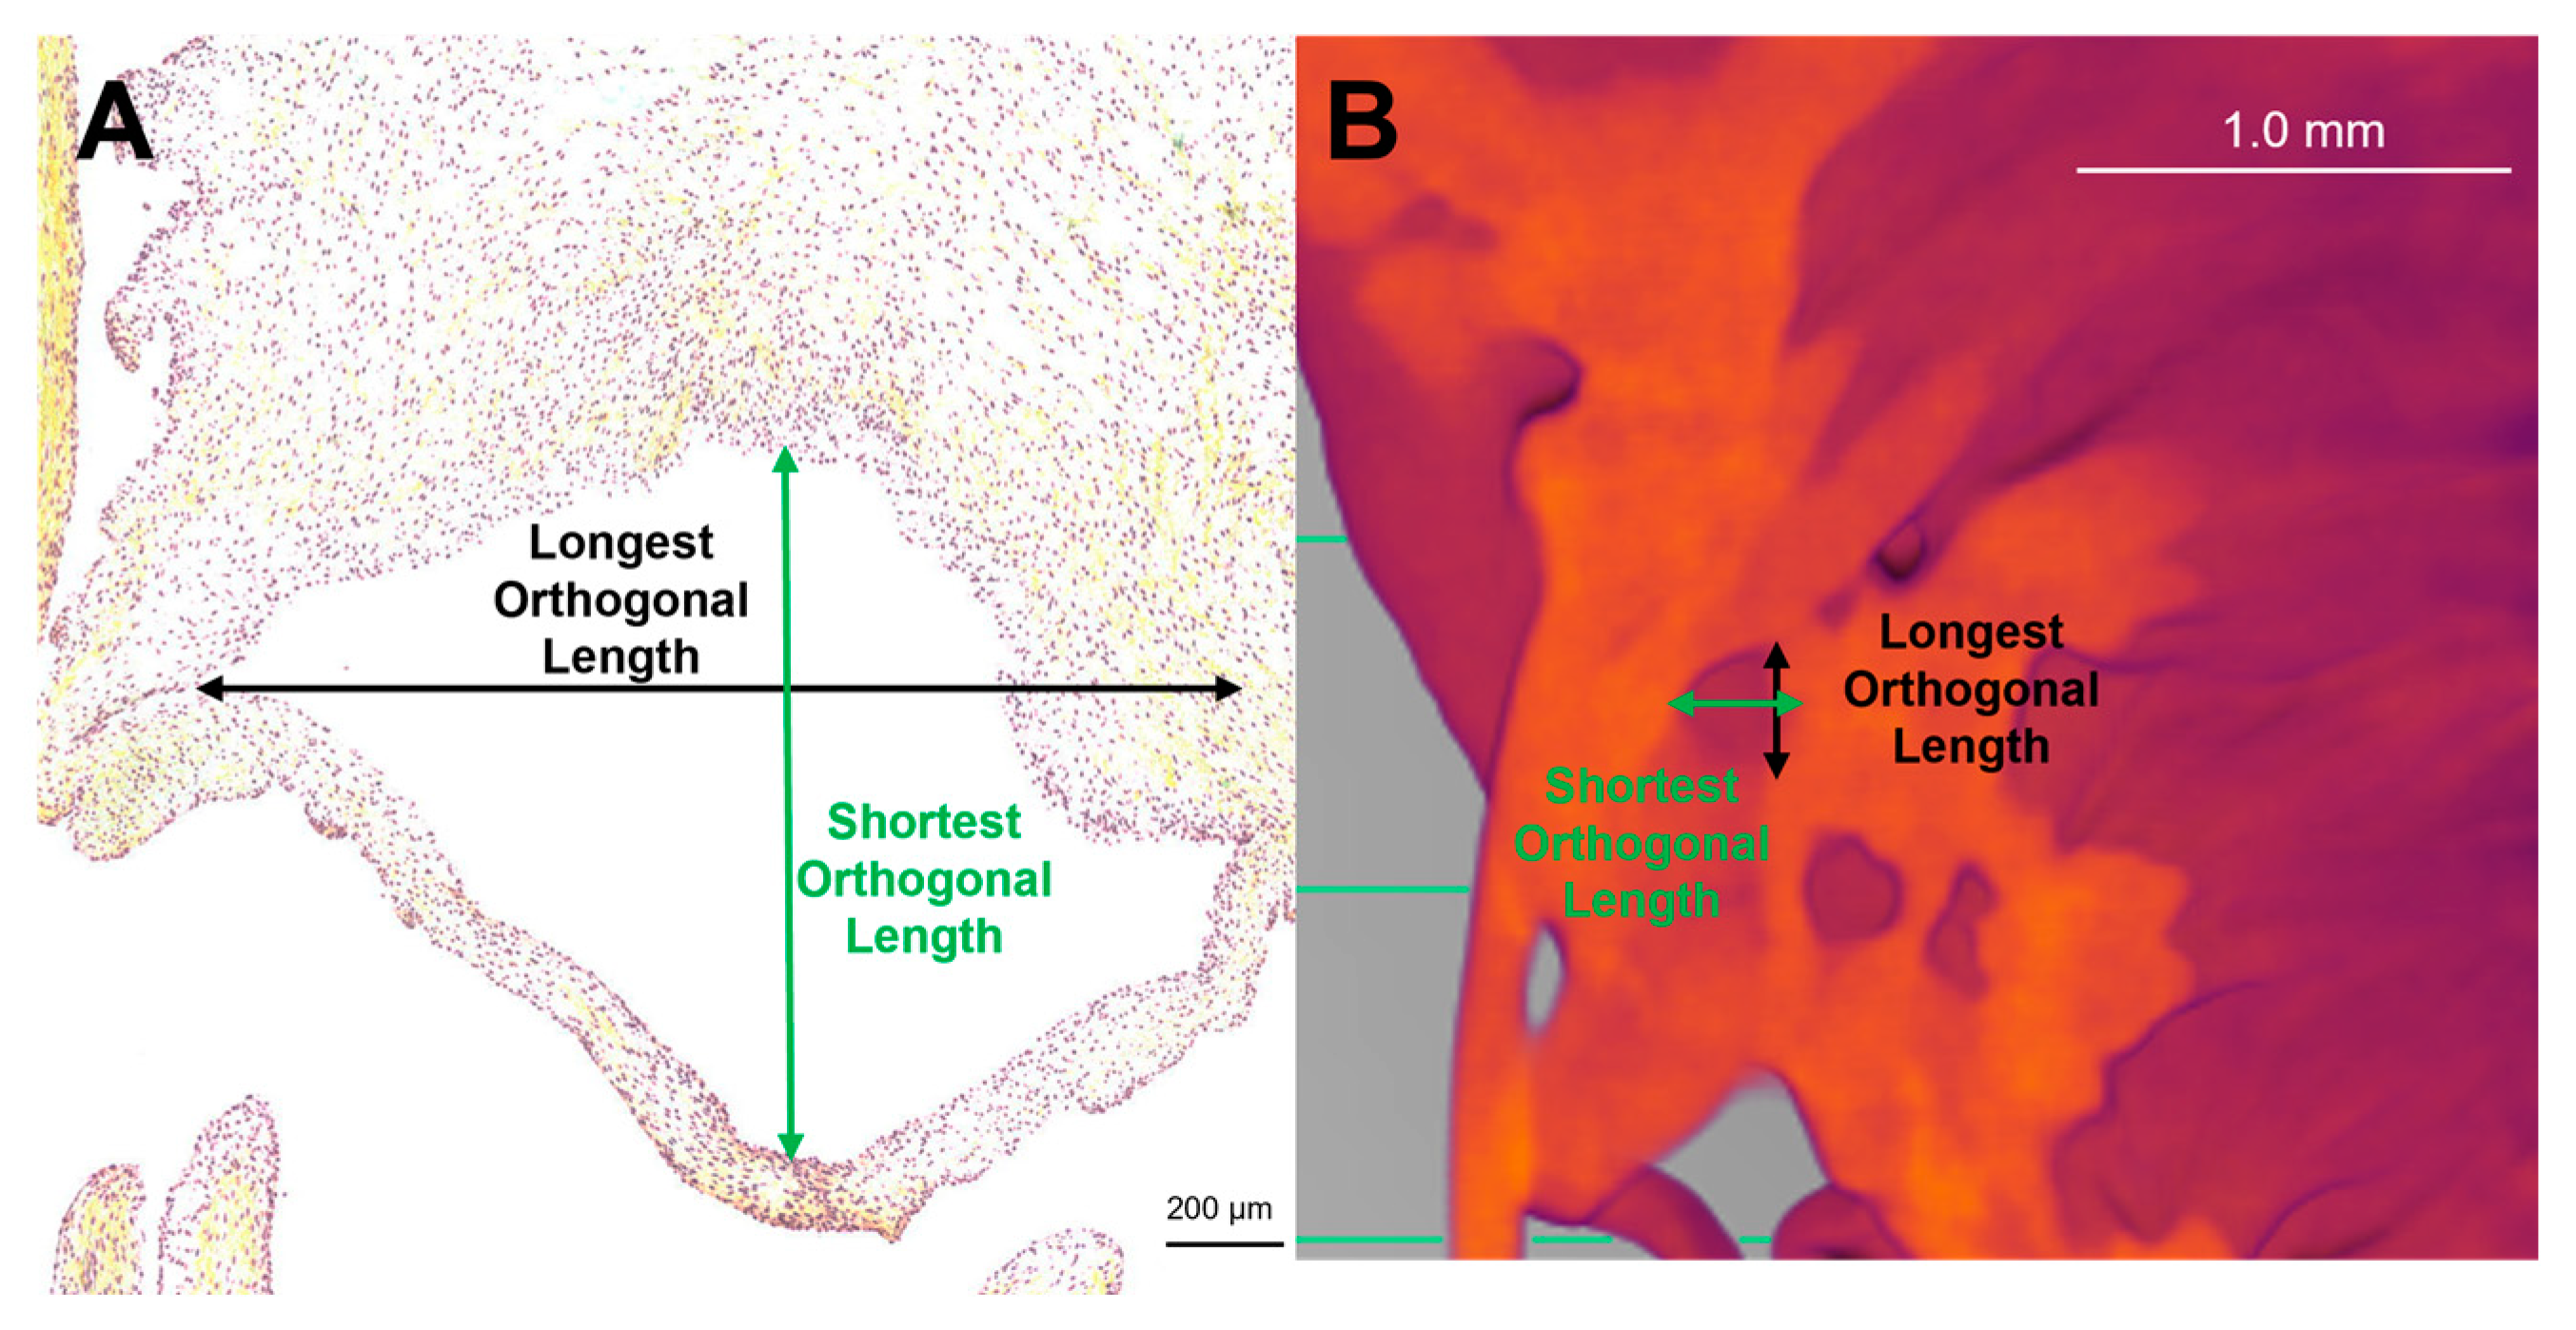
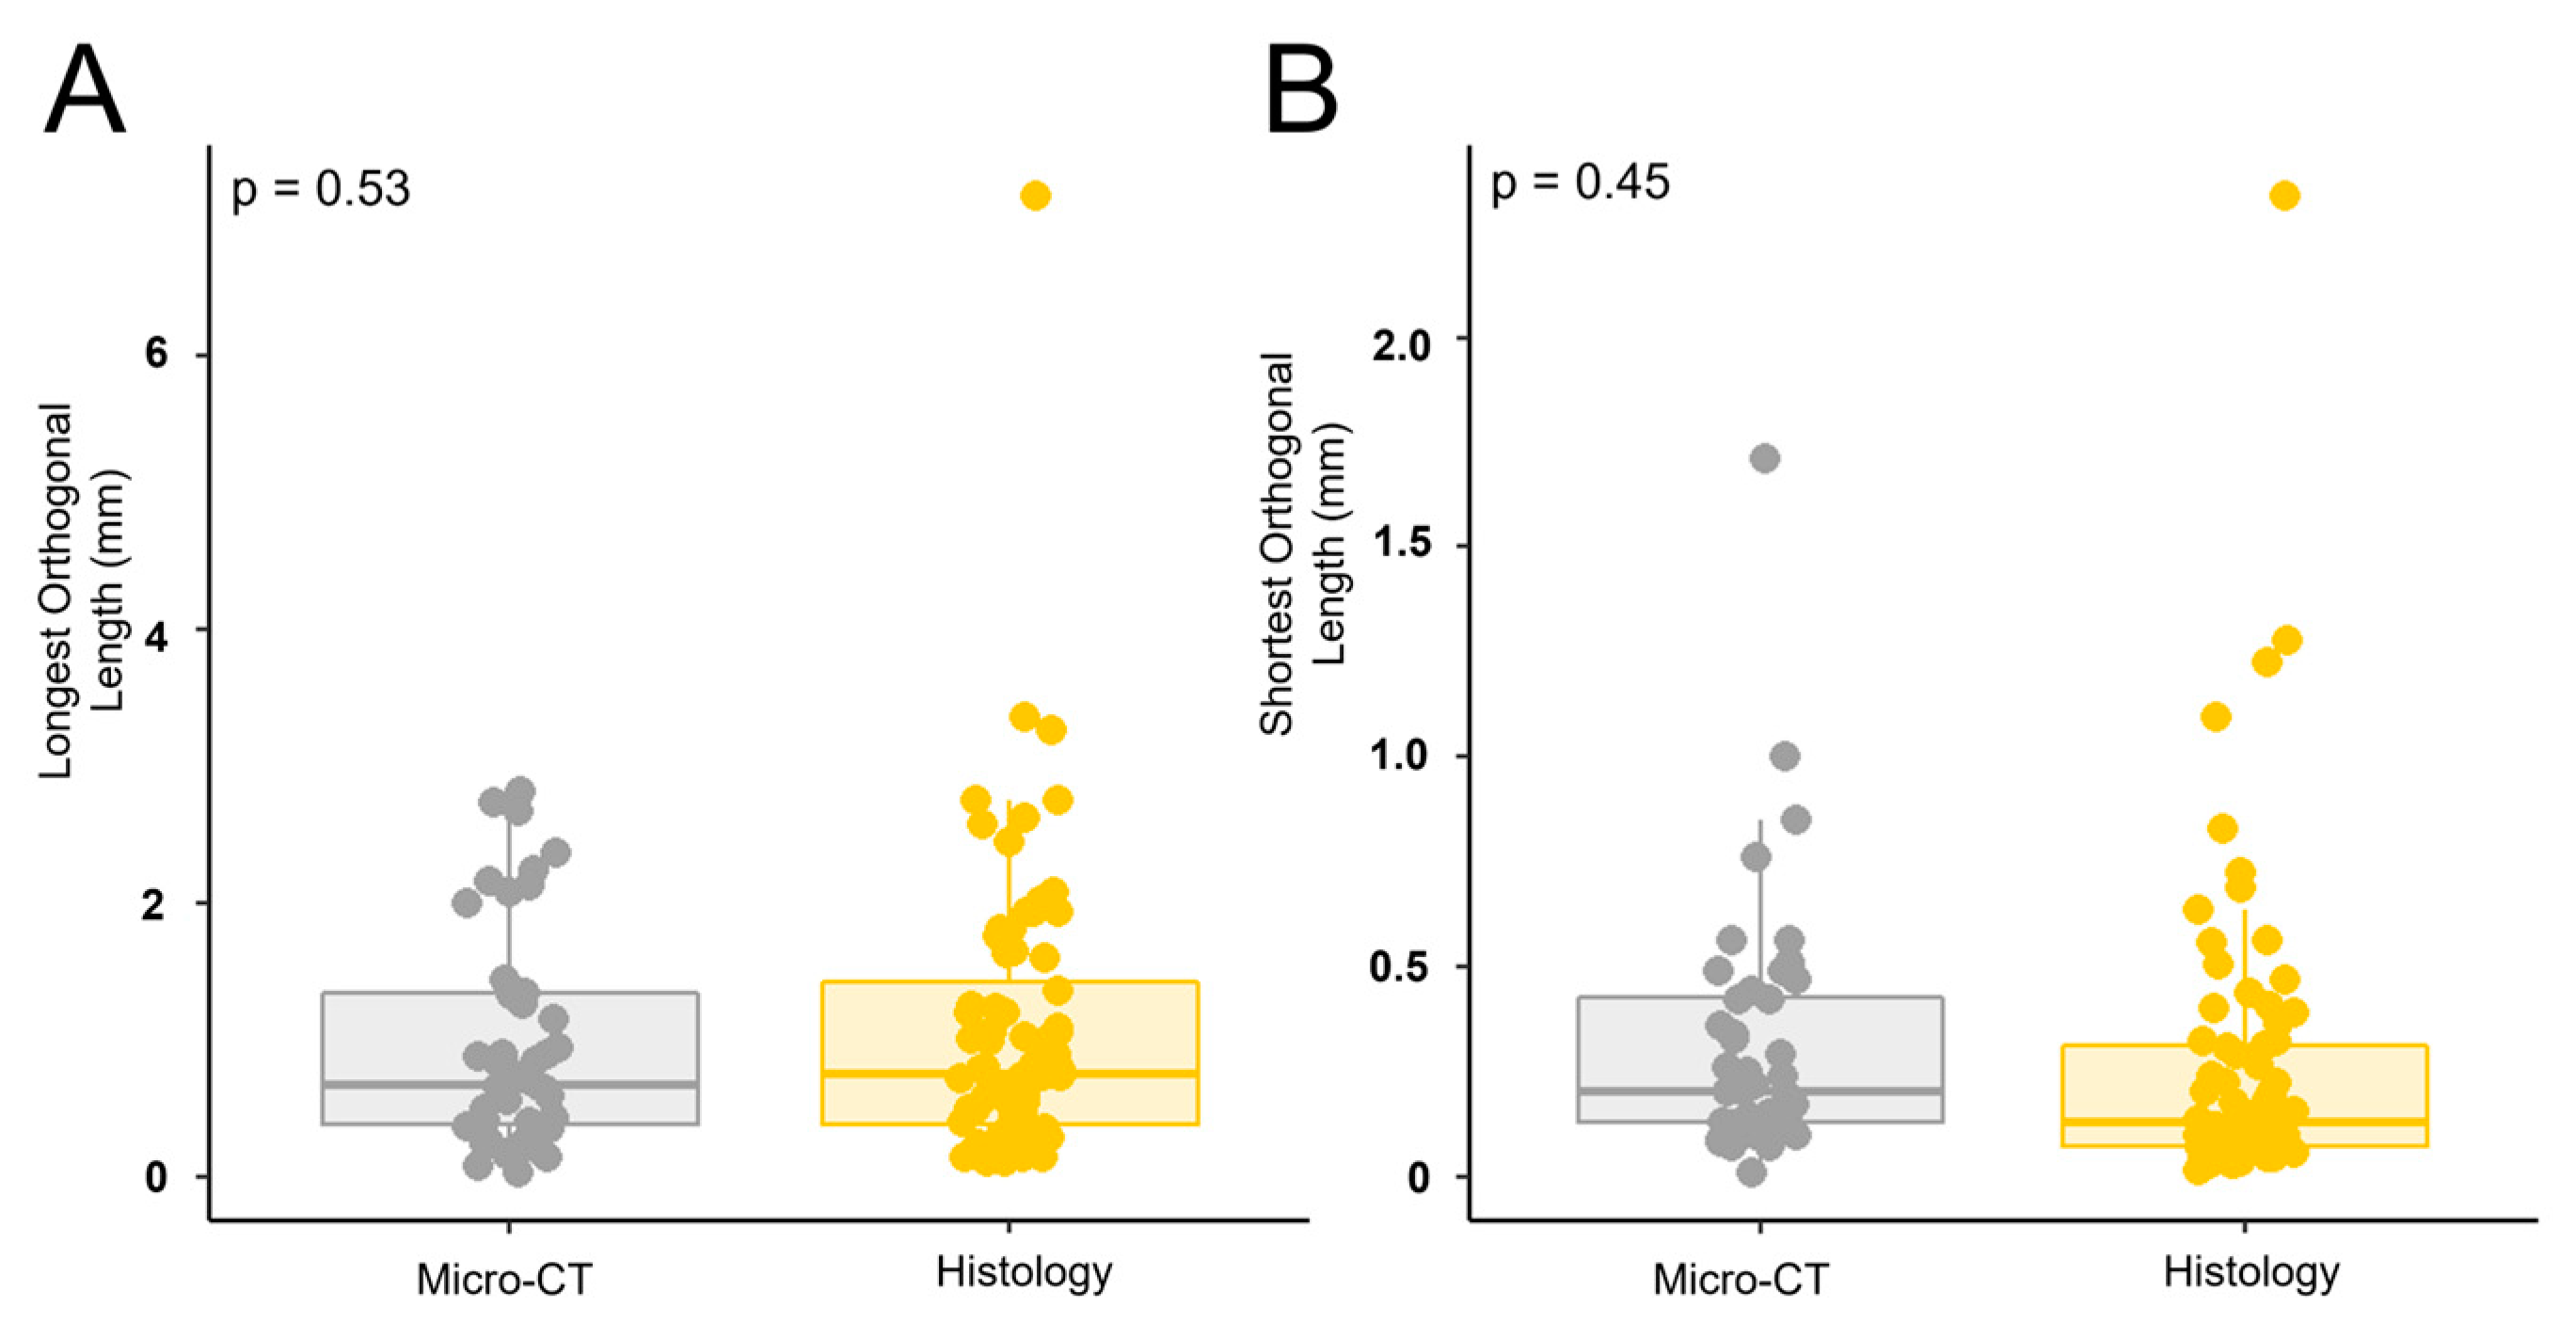
To determine if the perforations visualized within the transition zone in both histology and micro-CT were similar, the size of the perforations was compared. Images taken from both modalities were uploaded to ImageJ (ImageJ, National Institutes of Health, Bethesda, MD, USA) where the orthogonal dimensions of the perforations were measured since the perforations were not circular (
Figure 2). All visible perforations in an image were measured. For histology images, valves from a total of 13 animals ranging from 111 gestational days to 270 gestational days were measured. For micro-CT images, valves from a total of 5 animals ranging from 148 gestational days to 236 gestational days were measured.
2.12. Transmission Electron Microscopy
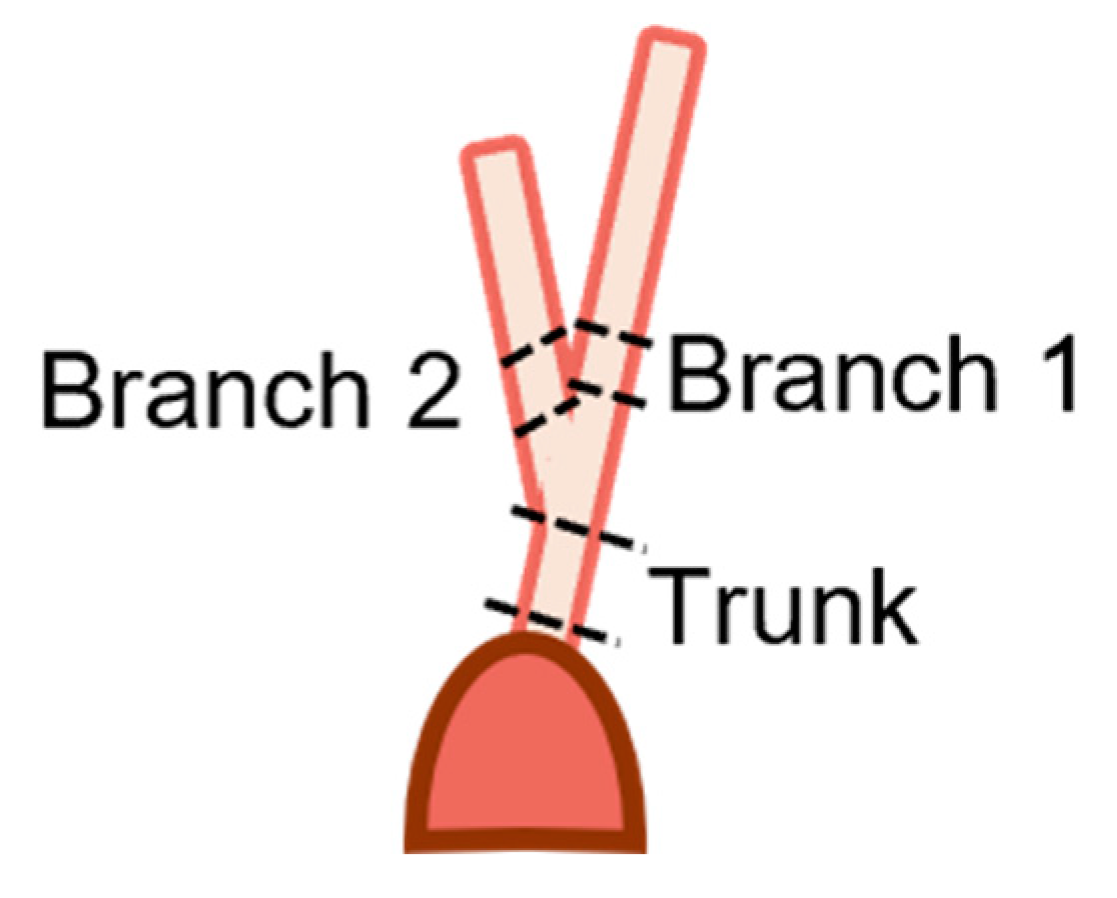
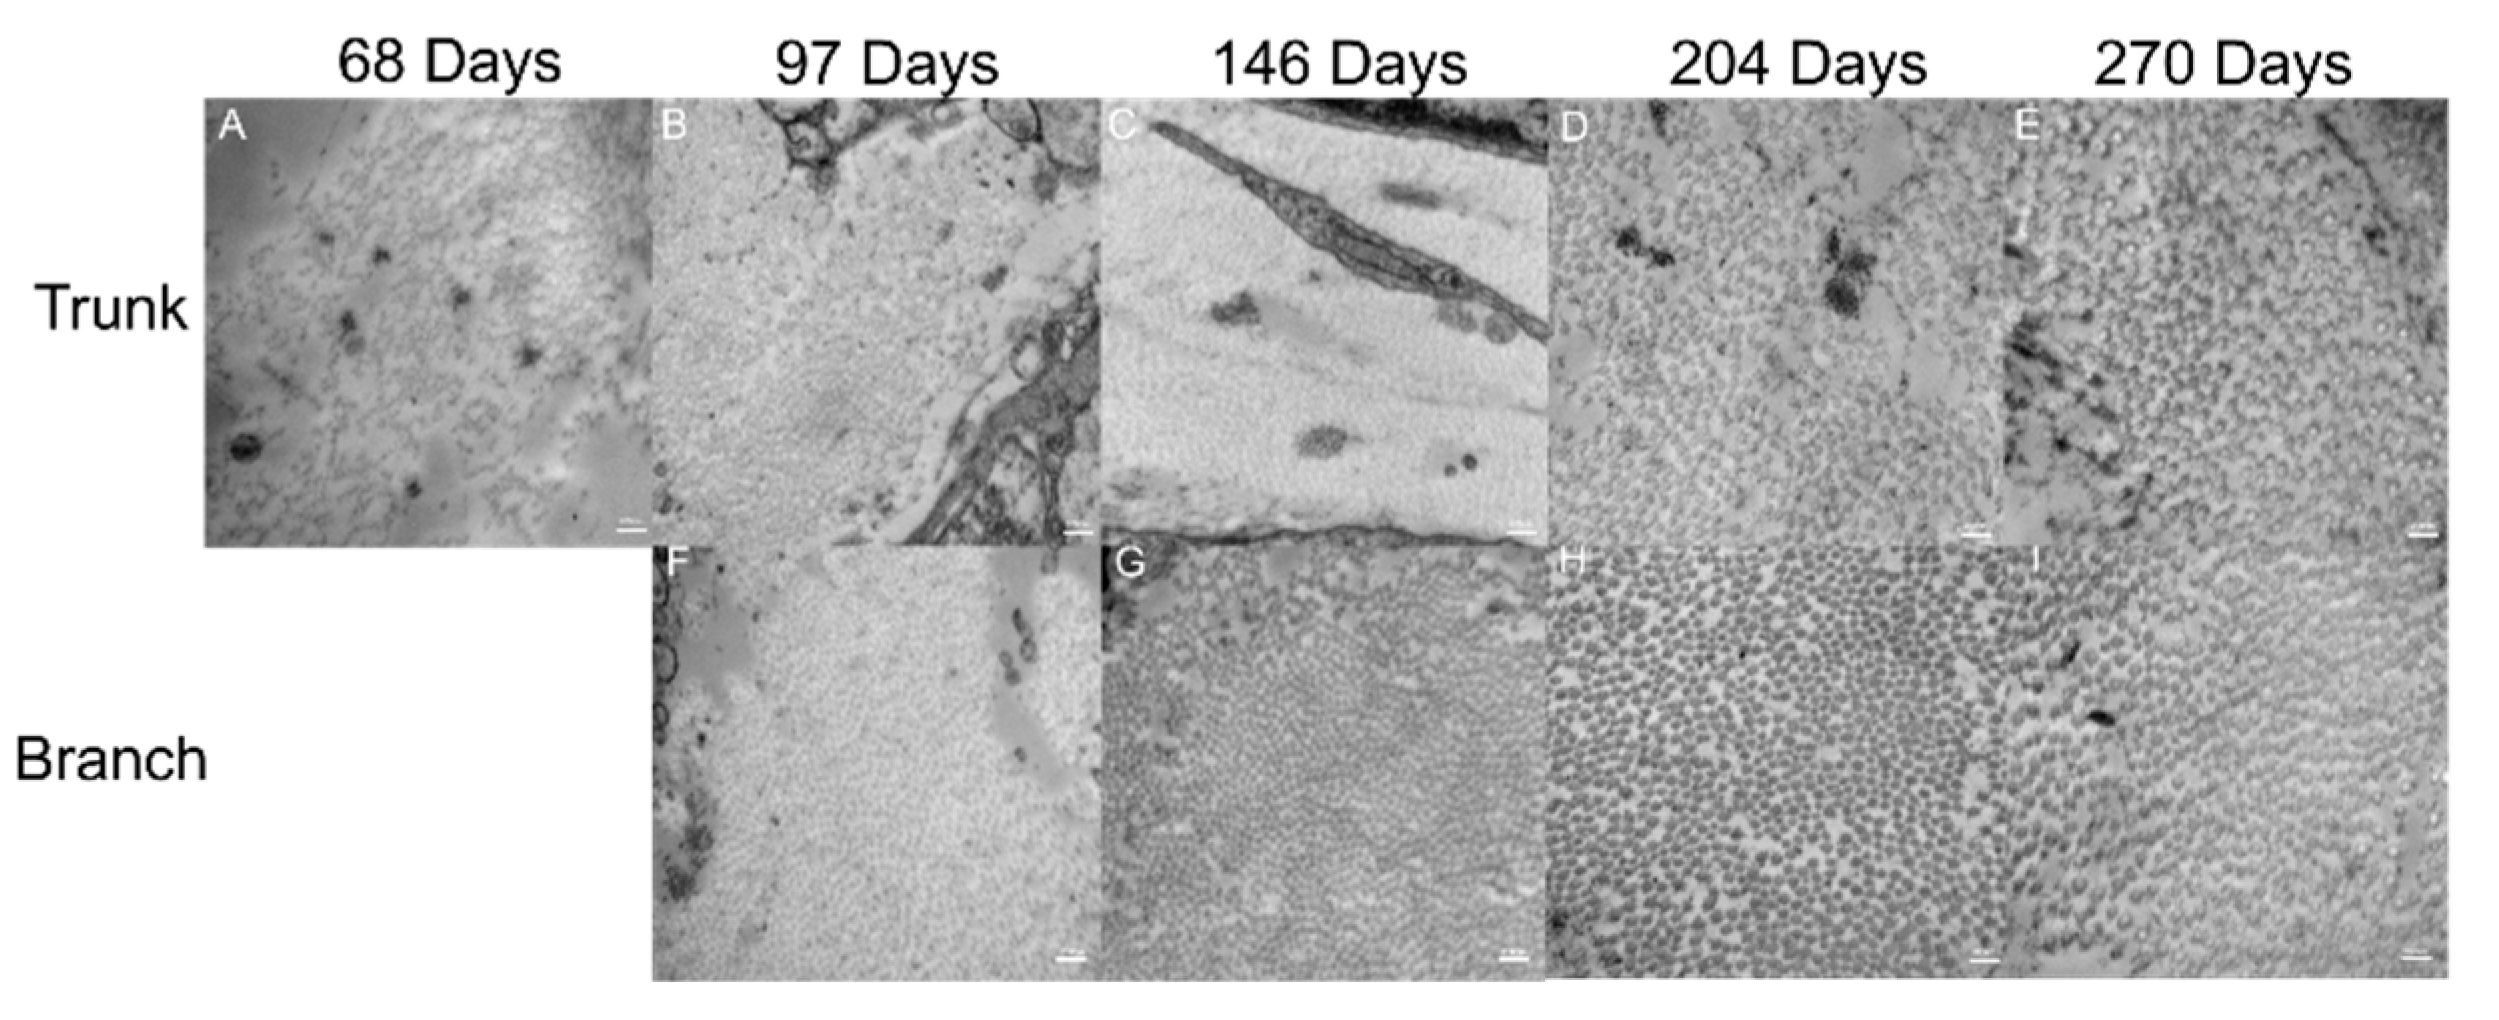
Fetal samples collected for transmission electron microscopy (TEM) imaging of collagen fibril diameters ranged from 68 to 270 days (full term). Trunk sections and both branches of the strut chordae were taken from the papillary muscle attachment to the first bifurcation (
Figure 3), with sample lengths varying depending on gestational age. Samples were rinsed in PBS three times before being fixed with 2.5 % glutaraldehyde solution (Electron Microscopy Sciences, Hatfield, PA, USA), diluted with 15 mL of 2.0M sodium cacodylate buffer (Electron Microscopy Sciences, Hatfield, PA, USA), and 15 mL of deionized water) overnight.
The following day, samples were taken to the Electron Microscopy Core Facility at Dalhousie University where the remainder of the preparation took place. After the initial fixation, samples were rinsed four times in 0.1 M sodium cacodylate buffer for 10 minutes each. Next, the samples were fixed again with 1% osmium tetroxide (Alfa Chemistry, Holbrook, NY, USA) for two hours and then rinsed in distilled water. The samples were then placed in 0.25% uranyl acetate (Fisher Scientific Company, Ottawa, ON, Canada) at 4°C and left overnight. Following this, samples were dehydrated in a graduated series of acetone: 50%, 70%, 95%, and 100%. Samples were then infiltrated with Epon Araldite Resin (Electron Microscopy Sciences, Hatfield, PA, USA), first with a 3:1 ratio of acetone (Fisher Scientific Company, Ottawa, ON, Canada) to resin for 3 hours, then a 1:3 ratio of acetone to resin overnight, and finally in 100% resin two times for 3 hours each. Samples were then embedded in the resin and heated in an oven at 60°C overnight. Sections of approximately 100nm thick were cut using a Reichert – Jung Ultracut E Ultramicrotome (Depew, NY, USA) with a diamond knife and placed on TEM copper grids (300 mesh). The grids were stained with 2% aqueous uranyl acetate, rinsed twice with distilled water, and then stained with lead citrate (TAAB Laboratories, Berks, UK). They were then rinsed one final time with distilled water and allowed to air dry.
2.13. Collagen Fibril Diameter Measurement
Samples were viewed using a JEOL JEM 1230 Transmission Electron Microscope (JEOL, Tokyo, Japan) at 80kV equipped with a Hamamatsu ORCA-HR digital camera (Hamamatsu Photonics, Shizuoka, Japan) and images were captured at 50,000 times magnification. For each section (trunk, branch 1, and branch 2), three of the TEM grids were assessed, and three images were taken per TEM grid for a total of nine images per section. Diameter measurements were made in ImageJ (ImageJ, National Institutes of Health, Bethesda, MD, USA) where an image analysis grid with an area of 7.04 x10
4 nm
2 was overlaid on the images. Then, only fibrils lying along the gridlines, possessing a circular shape and discernable outer boundaries were measured. Using the oval tool, the largest possible circle that did not extend outside the fibril's visible perimeter was fit to each fibril and the area of the circle was recorded. Fibril diameter was then calculated using the equation:
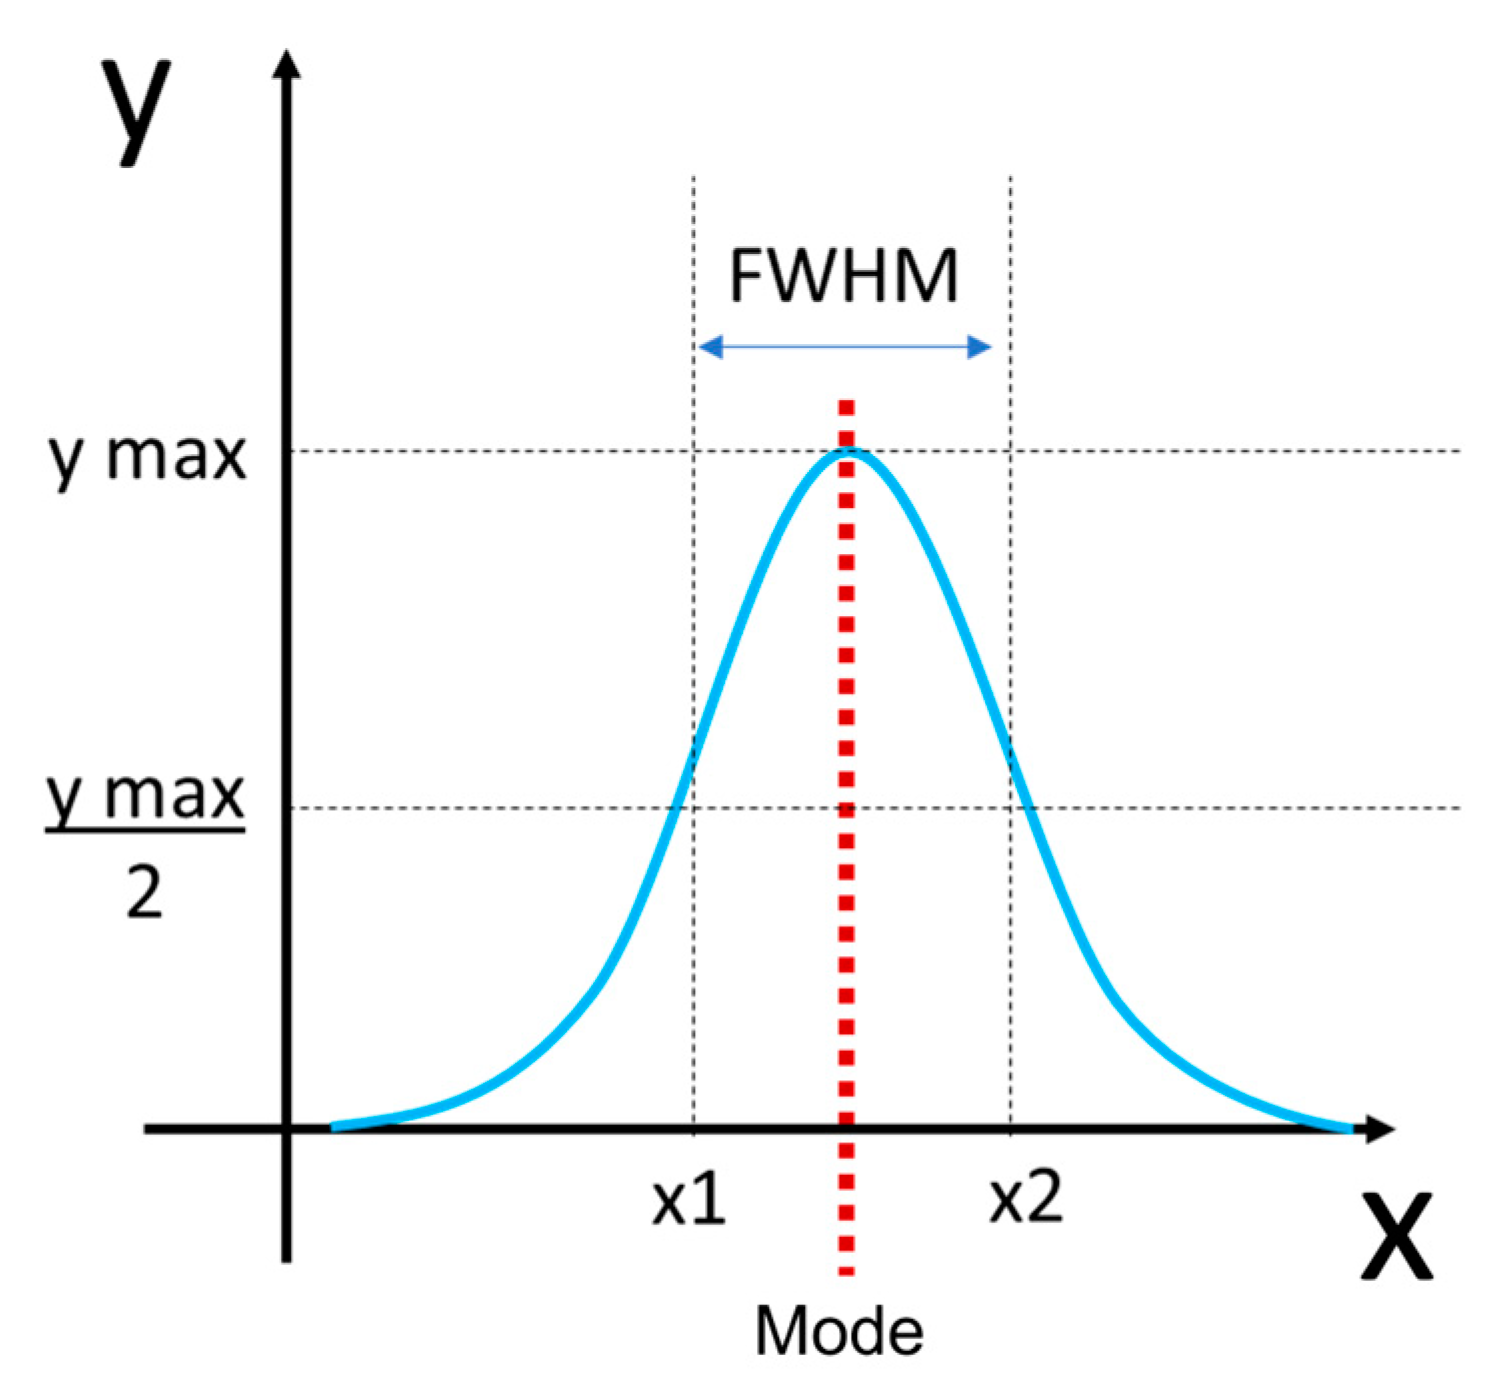
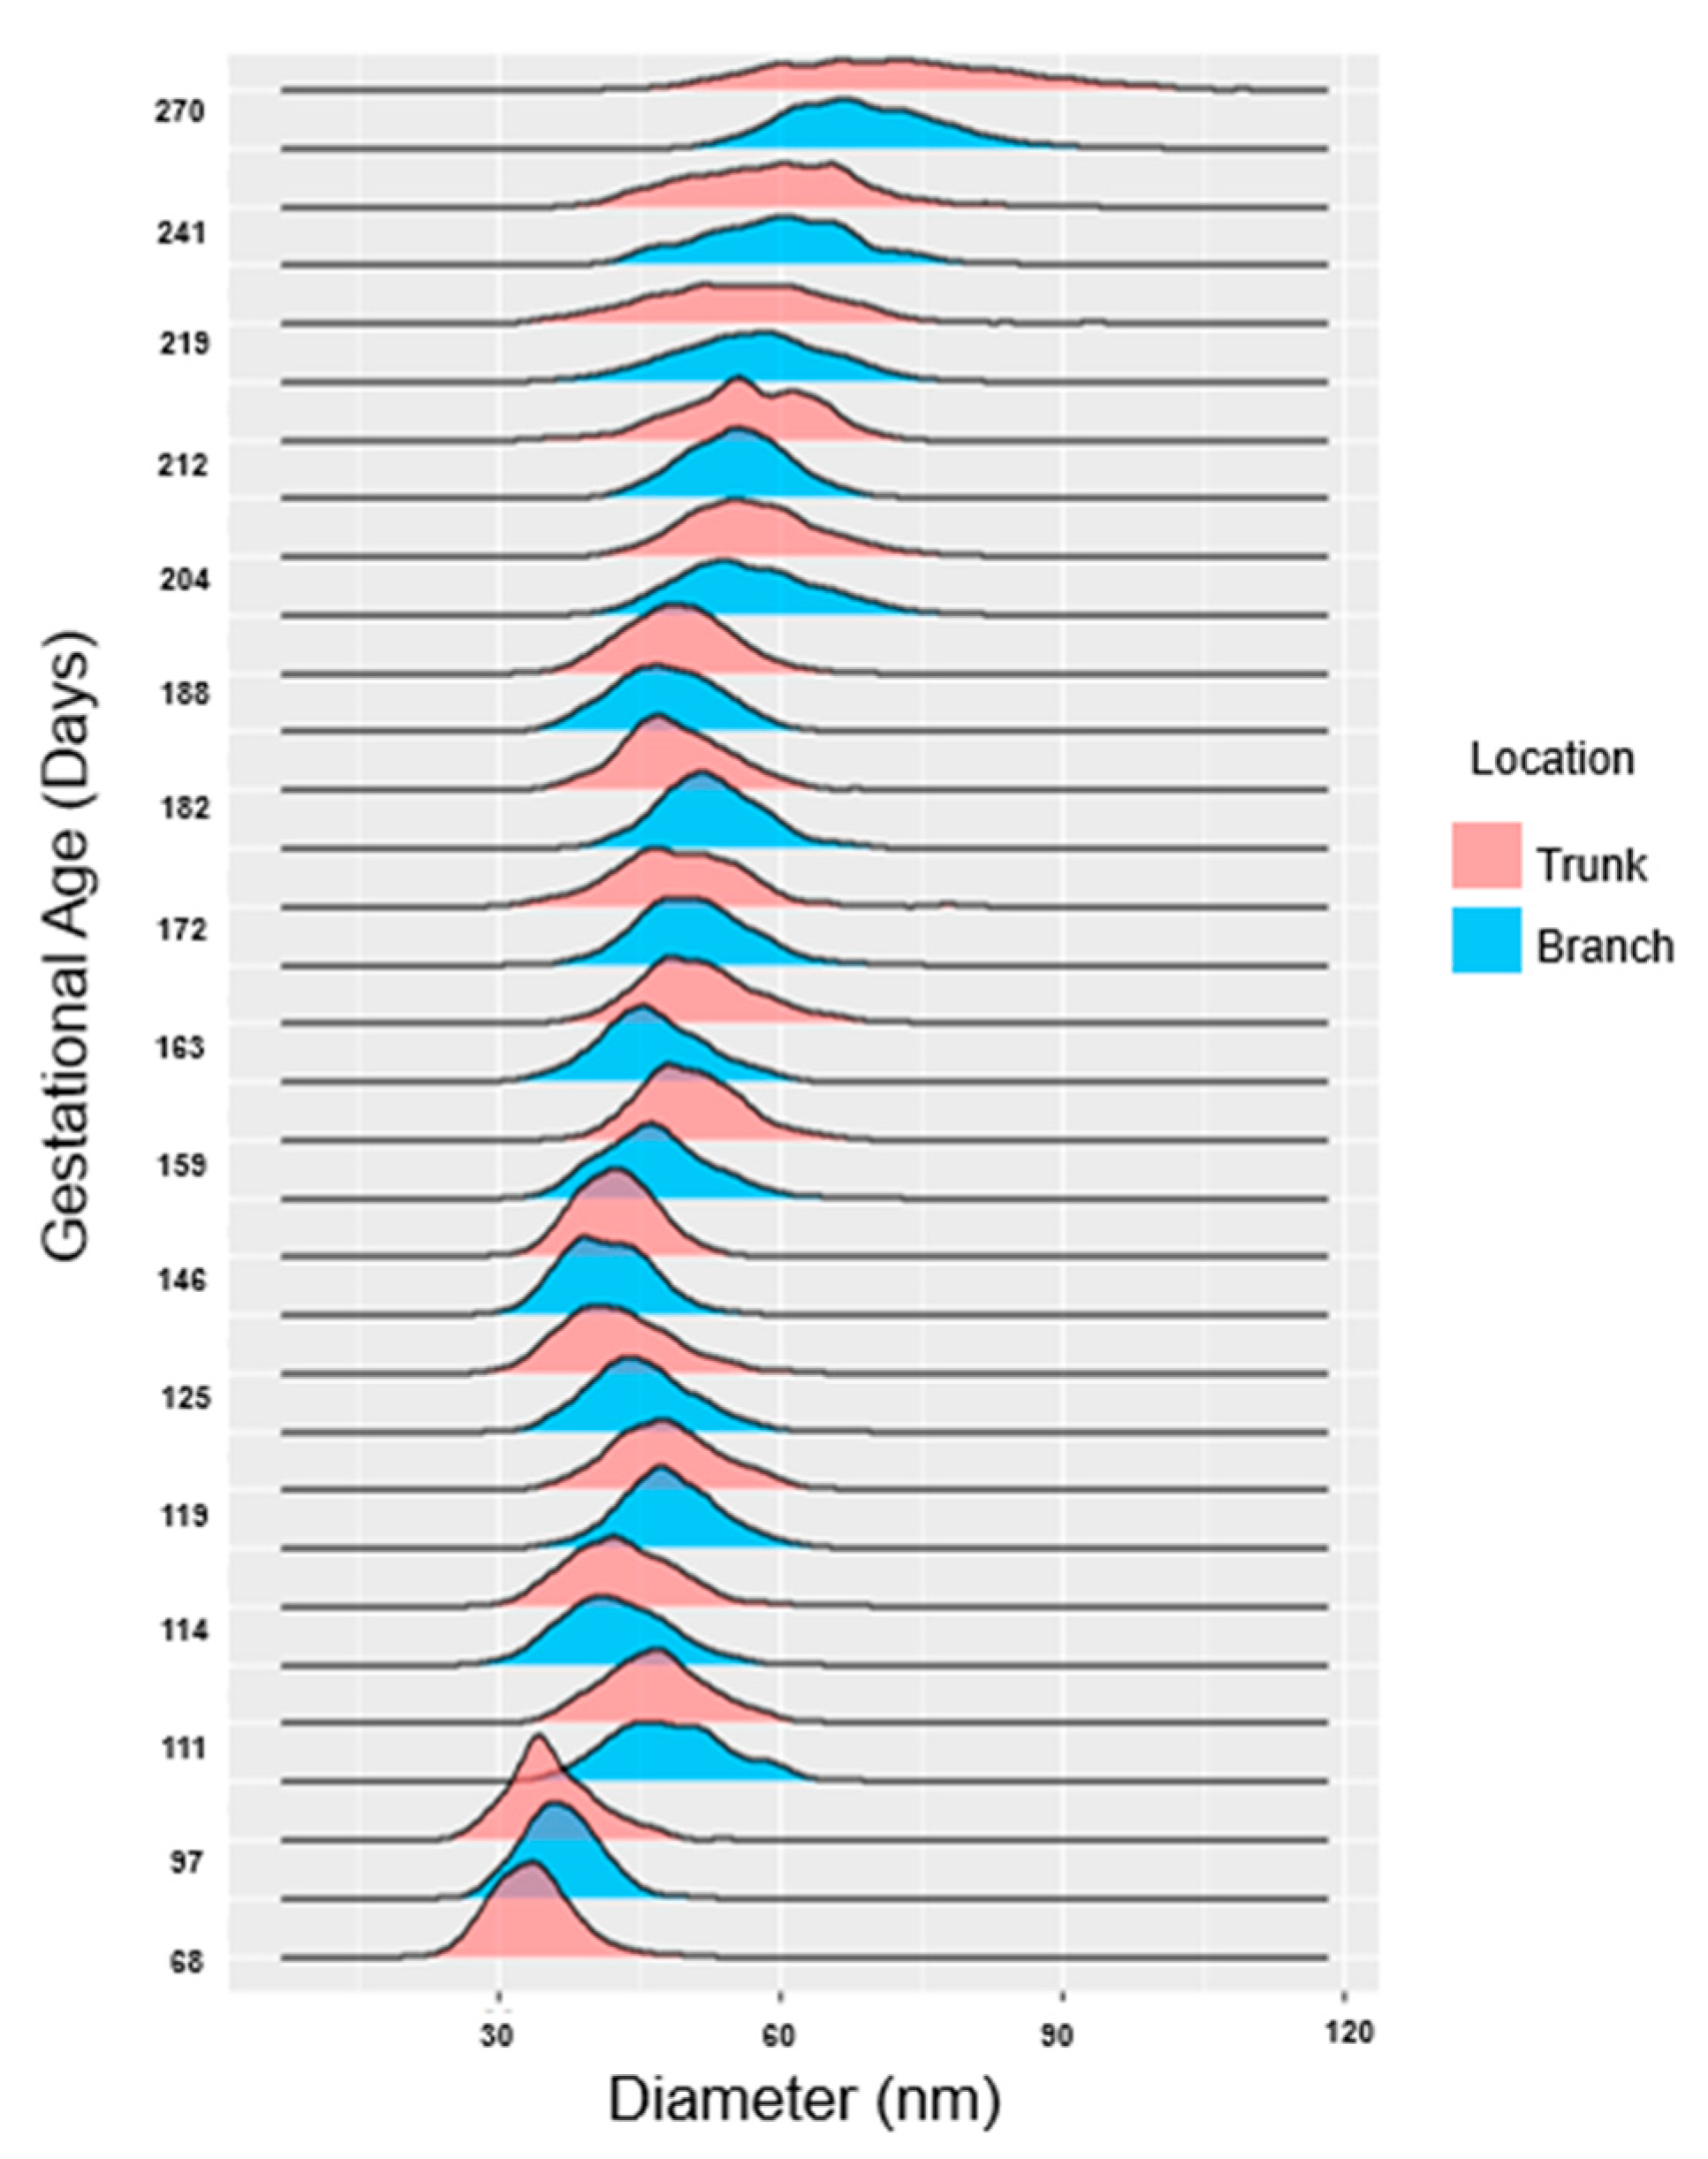
For each chordae section (trunk, branches), the fibril diameter histogram was produced and the mode and full width at half maximum (FWHM) determined (
Figure 4). Histograms between the two branches were merged as they were not significantly different.
2.14. Fibril Density
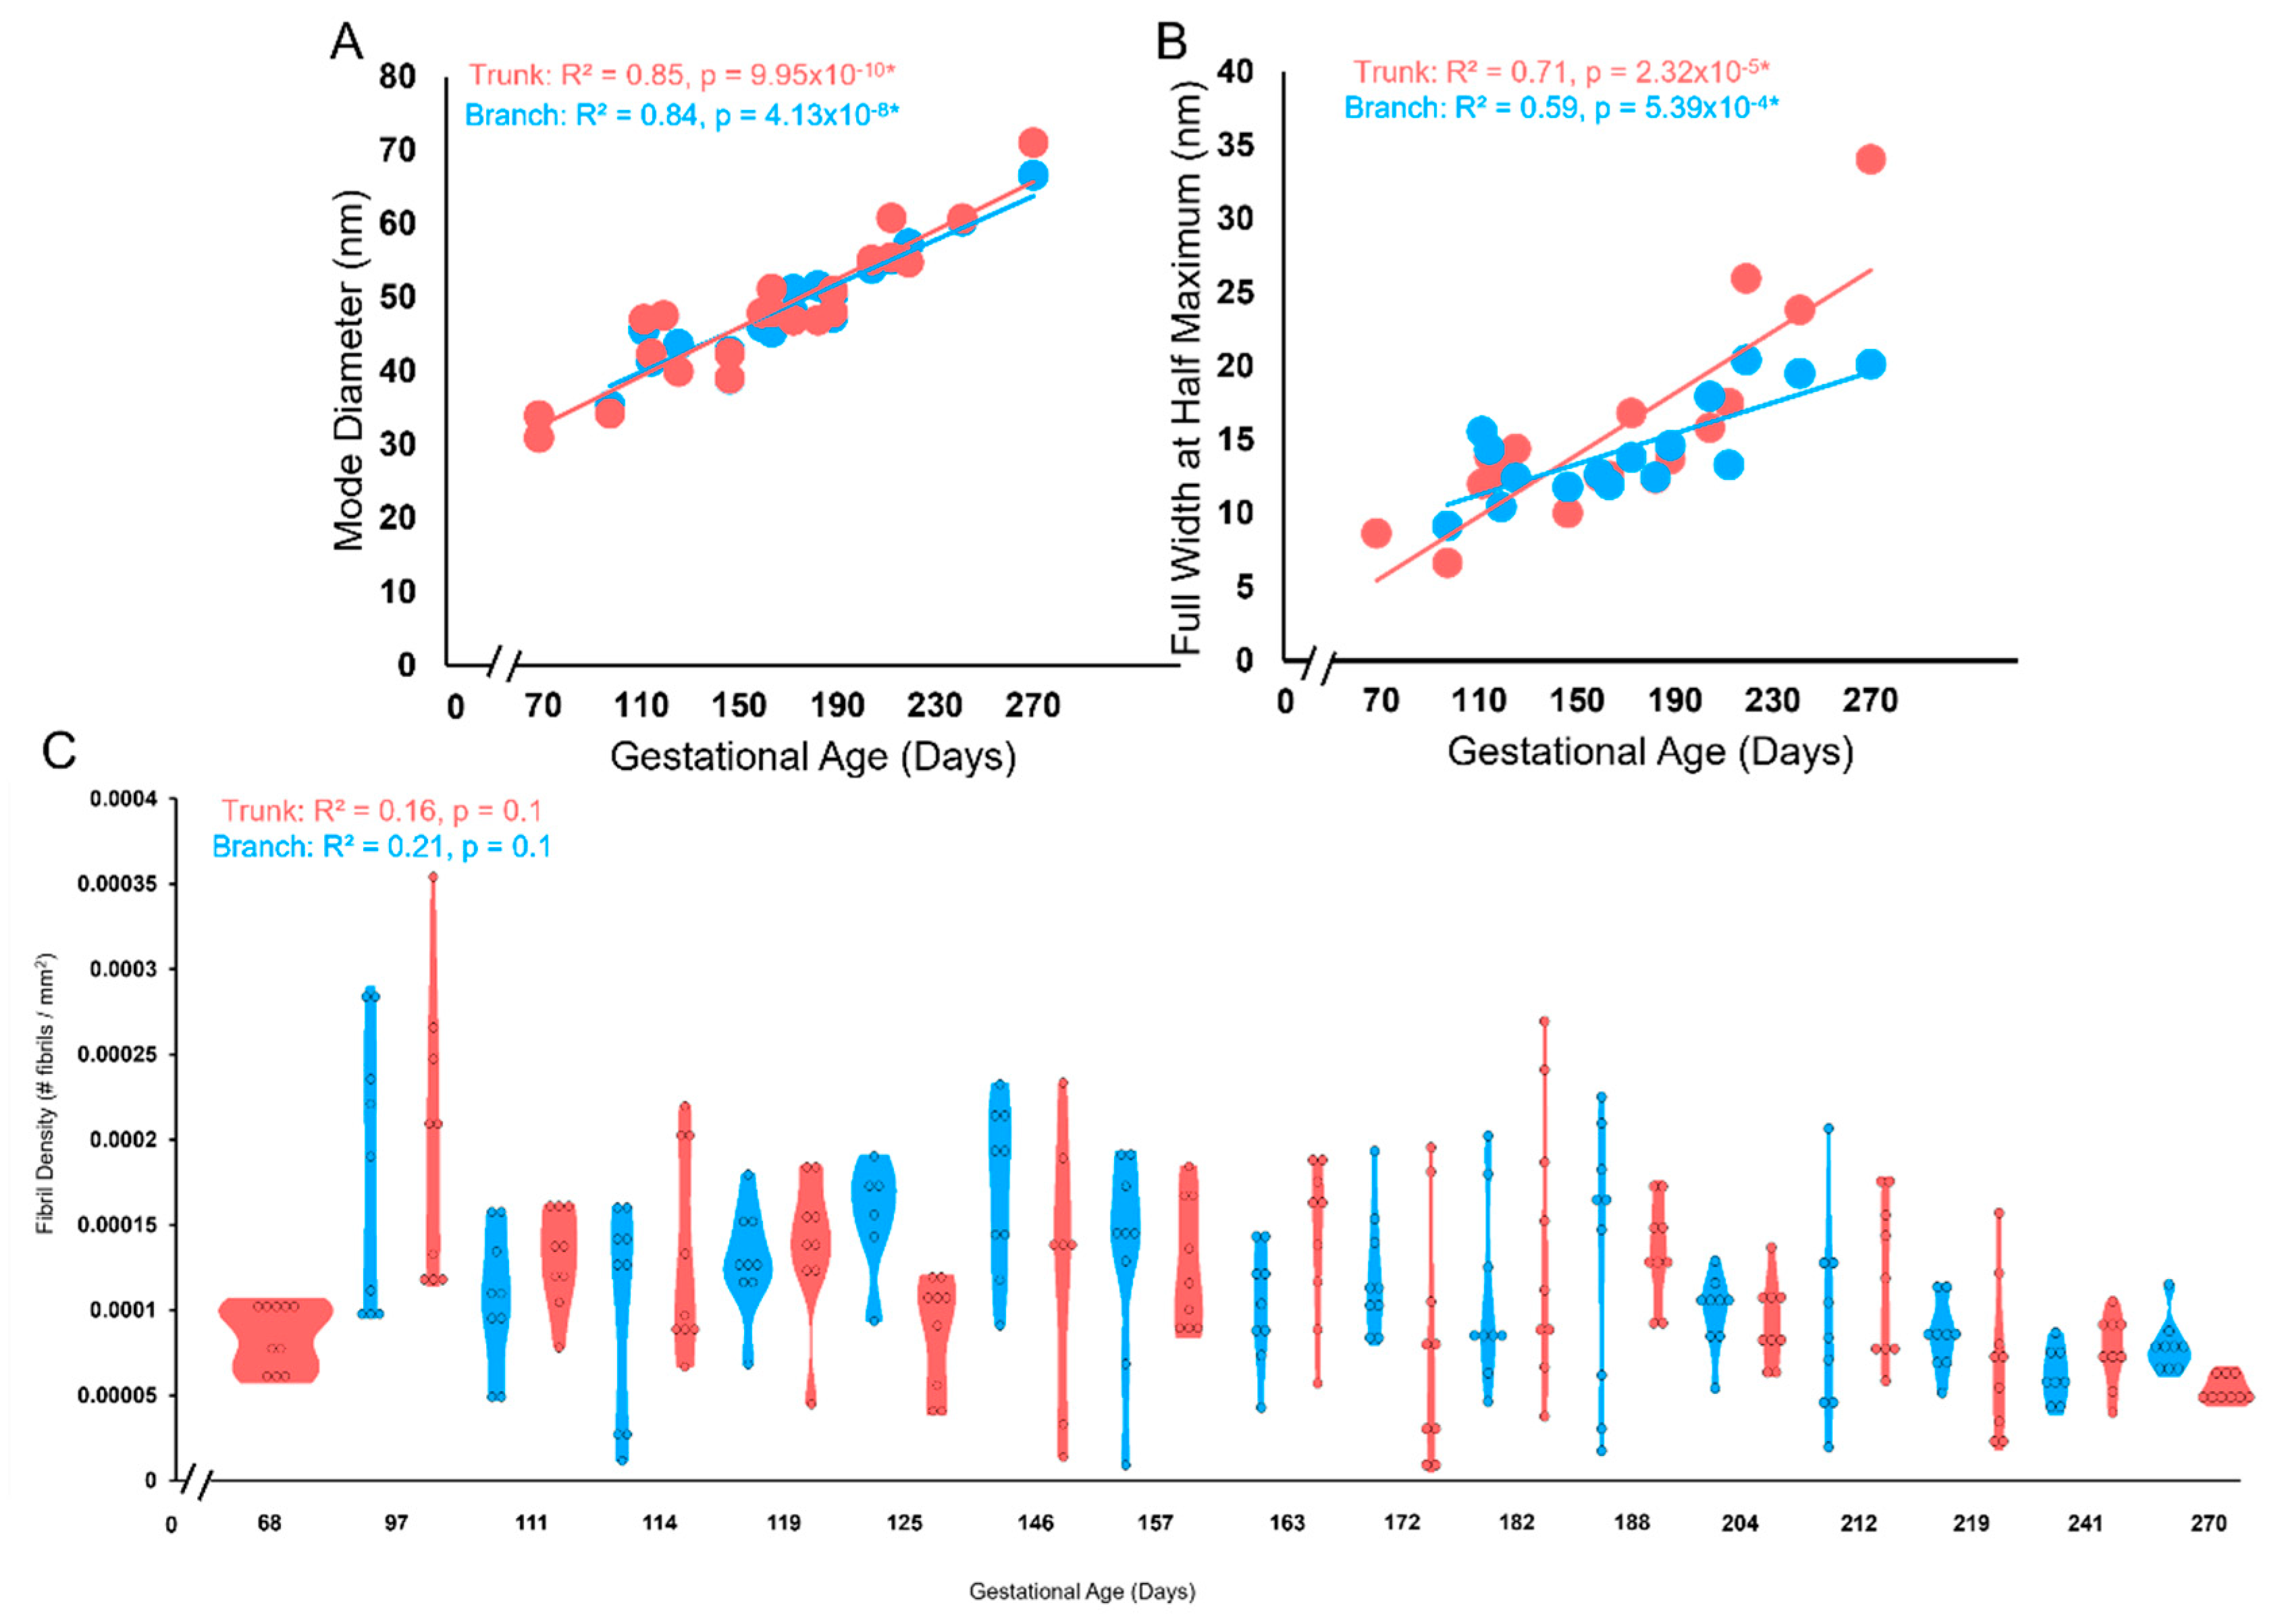
Fibril density was also measured in ImageJ (ImageJ, National Institutes of Health, Bethesda, MD, USA) from the same images used to measure diameter. The multi-point tool was used to count the number of fibrils in each image and total fibril number was normalized to total image area (7.97x10⁶ nm2) to give density.
2.15. Statistical Analysis
To compare the perforation size (longest and shortest orthogonal lengths) between light microscopy and TEM modalities a multivariate analysis of variance (MANOVA) was conducted. A significant difference was considered when p < 0.05.
From the distributions of collagen fibril diameters, modes were calculated in R [
28] using the modes function from the multimode package [
29]. To determine whether the distributions were unimodal or bimodal, Hartigan’s Diptest from the diptest package [
30] was used. Since there was no significant difference between the diameters of the two branch chordae, they were binned together for analysis. The FHWM were calculated in R using a custom-built function.
To assess the changes in each parameter during fetal development, data were plotted as a function of gestational age in days and fitted with a linear least-squares regression. Each data point represents
n = 1 animal. The regression was considered significant when
p < 0.05. To compare the rate of change within any single parameter during fetal development between trunk and branch chordae, the regression slopes were compared using an analysis of covariance (ANCOVA). Differences between the slopes were considered significant when
p < 0.05. All statistical analyses were conducted using R: specifically, the car package [
31], mvnormtest package [
32], DescTools package [
33], devtools package [
34], and ggplot2 package [
35].
4. Discussion
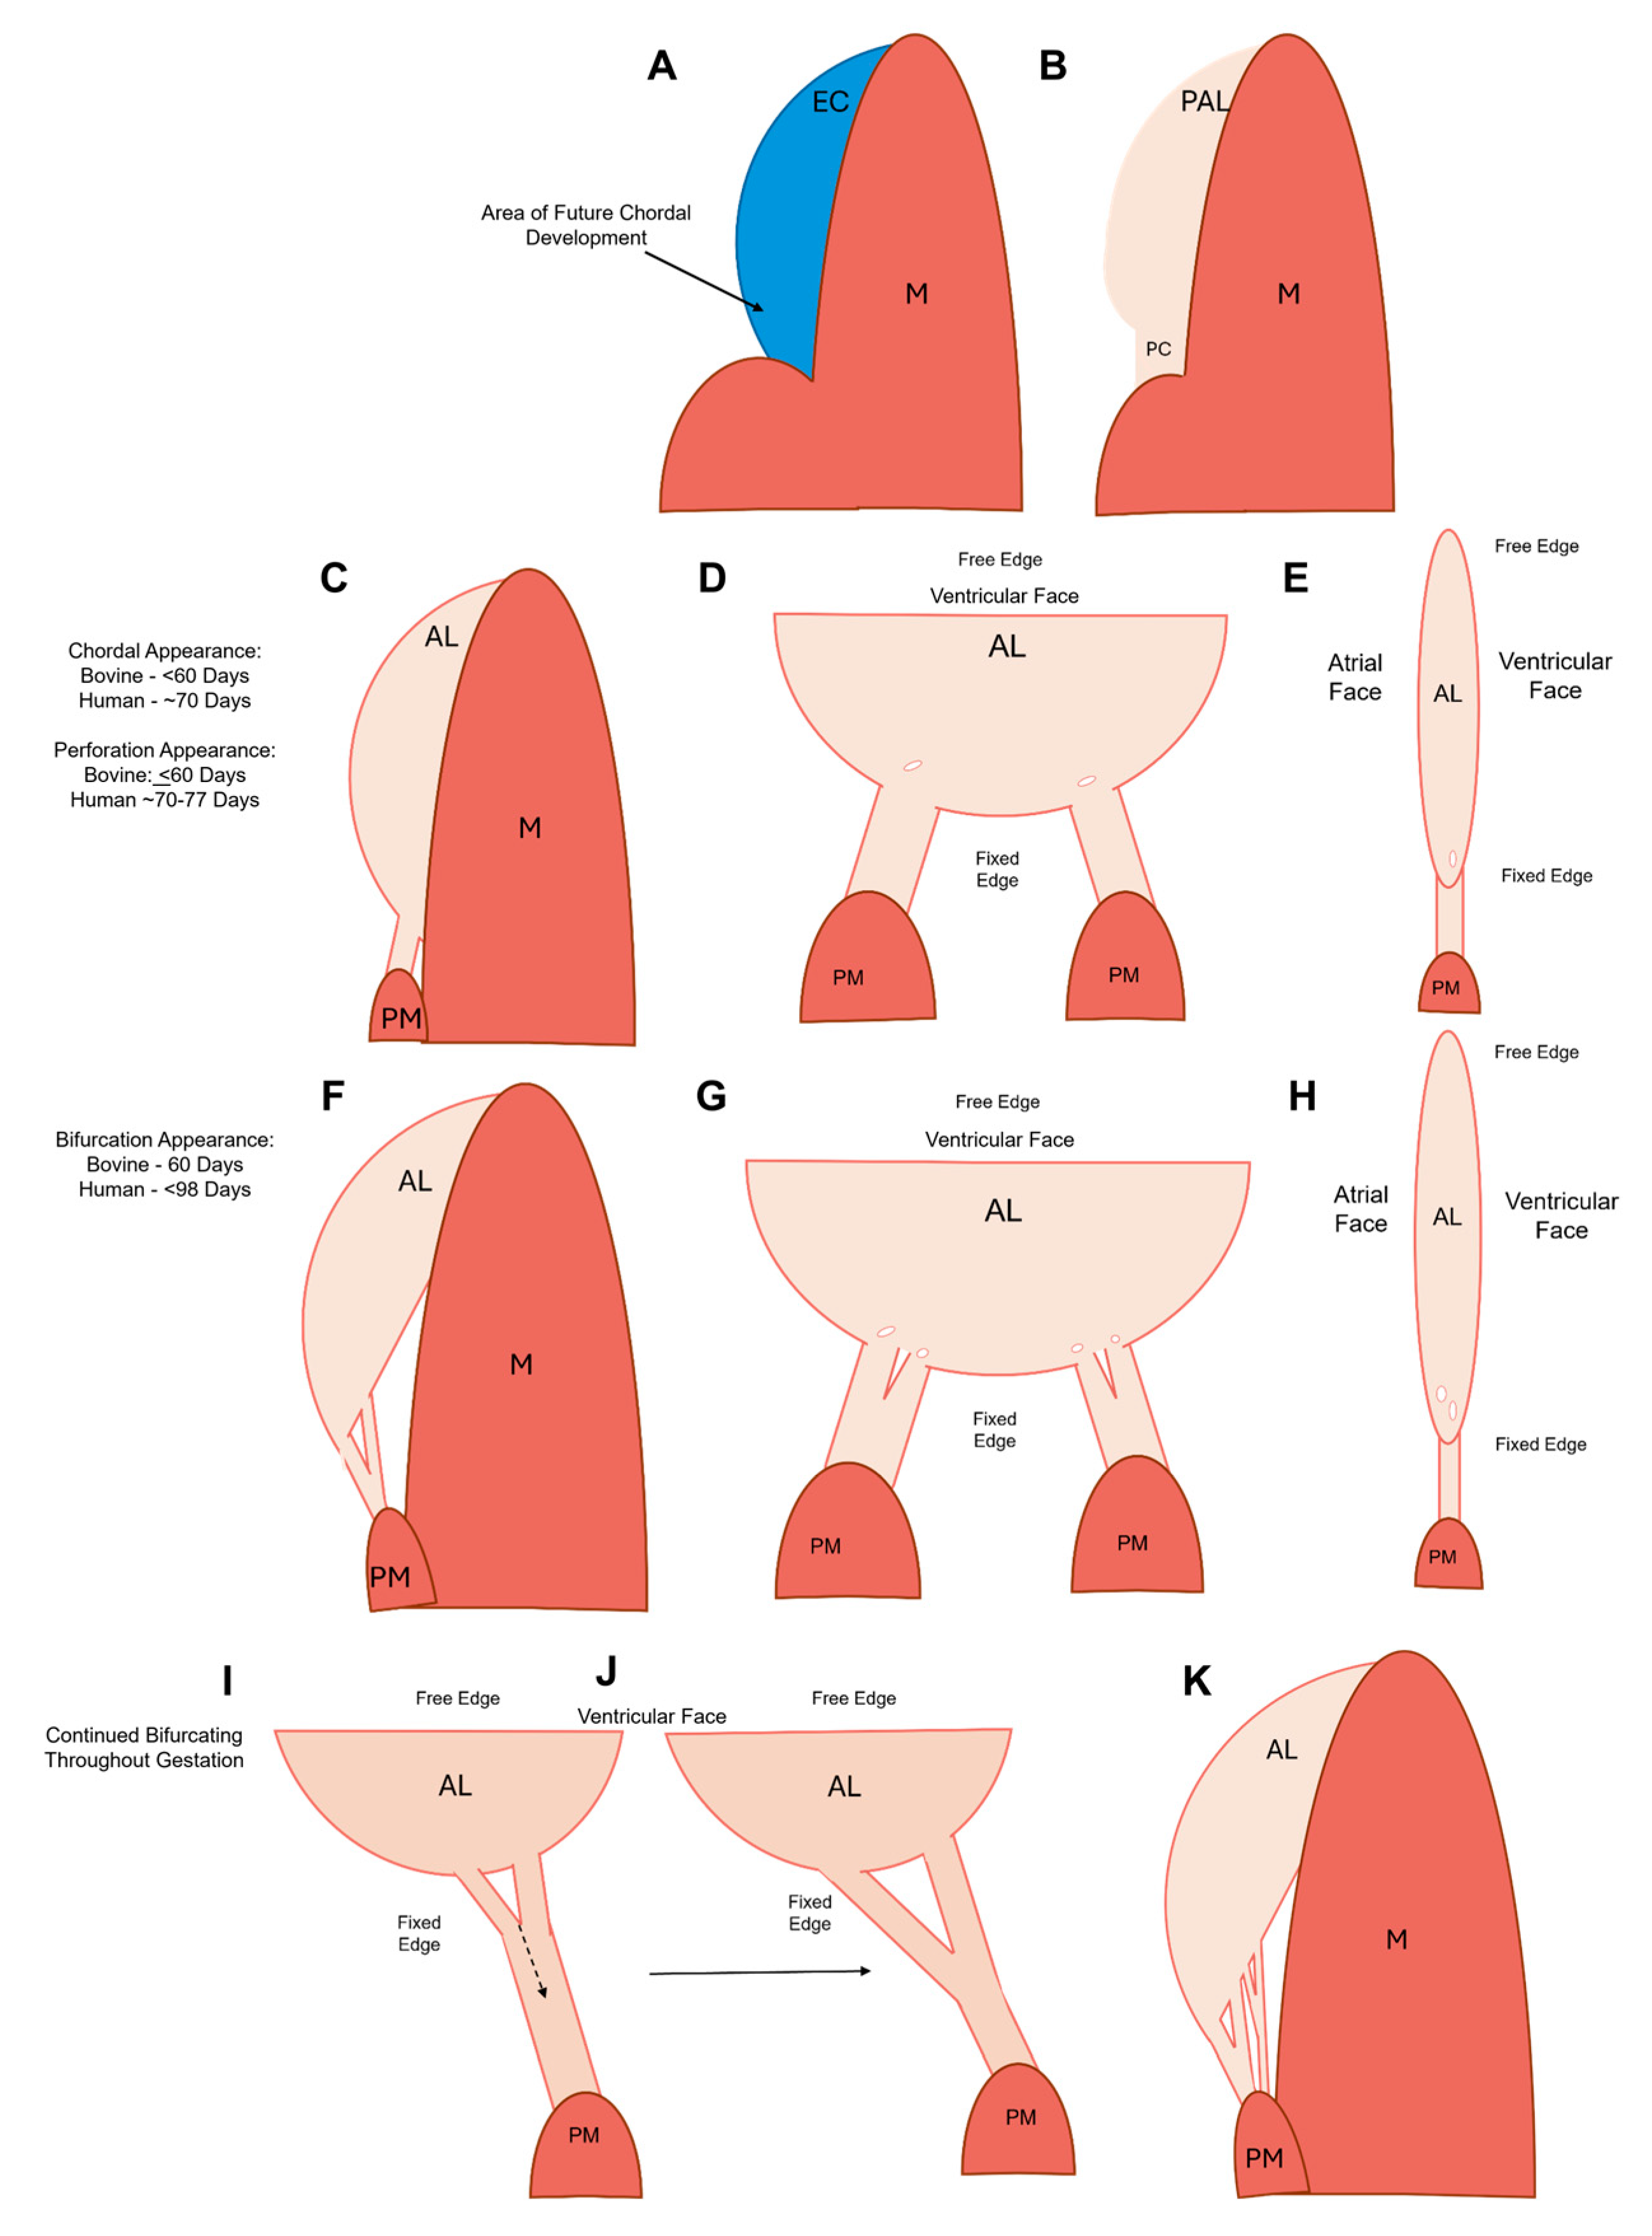
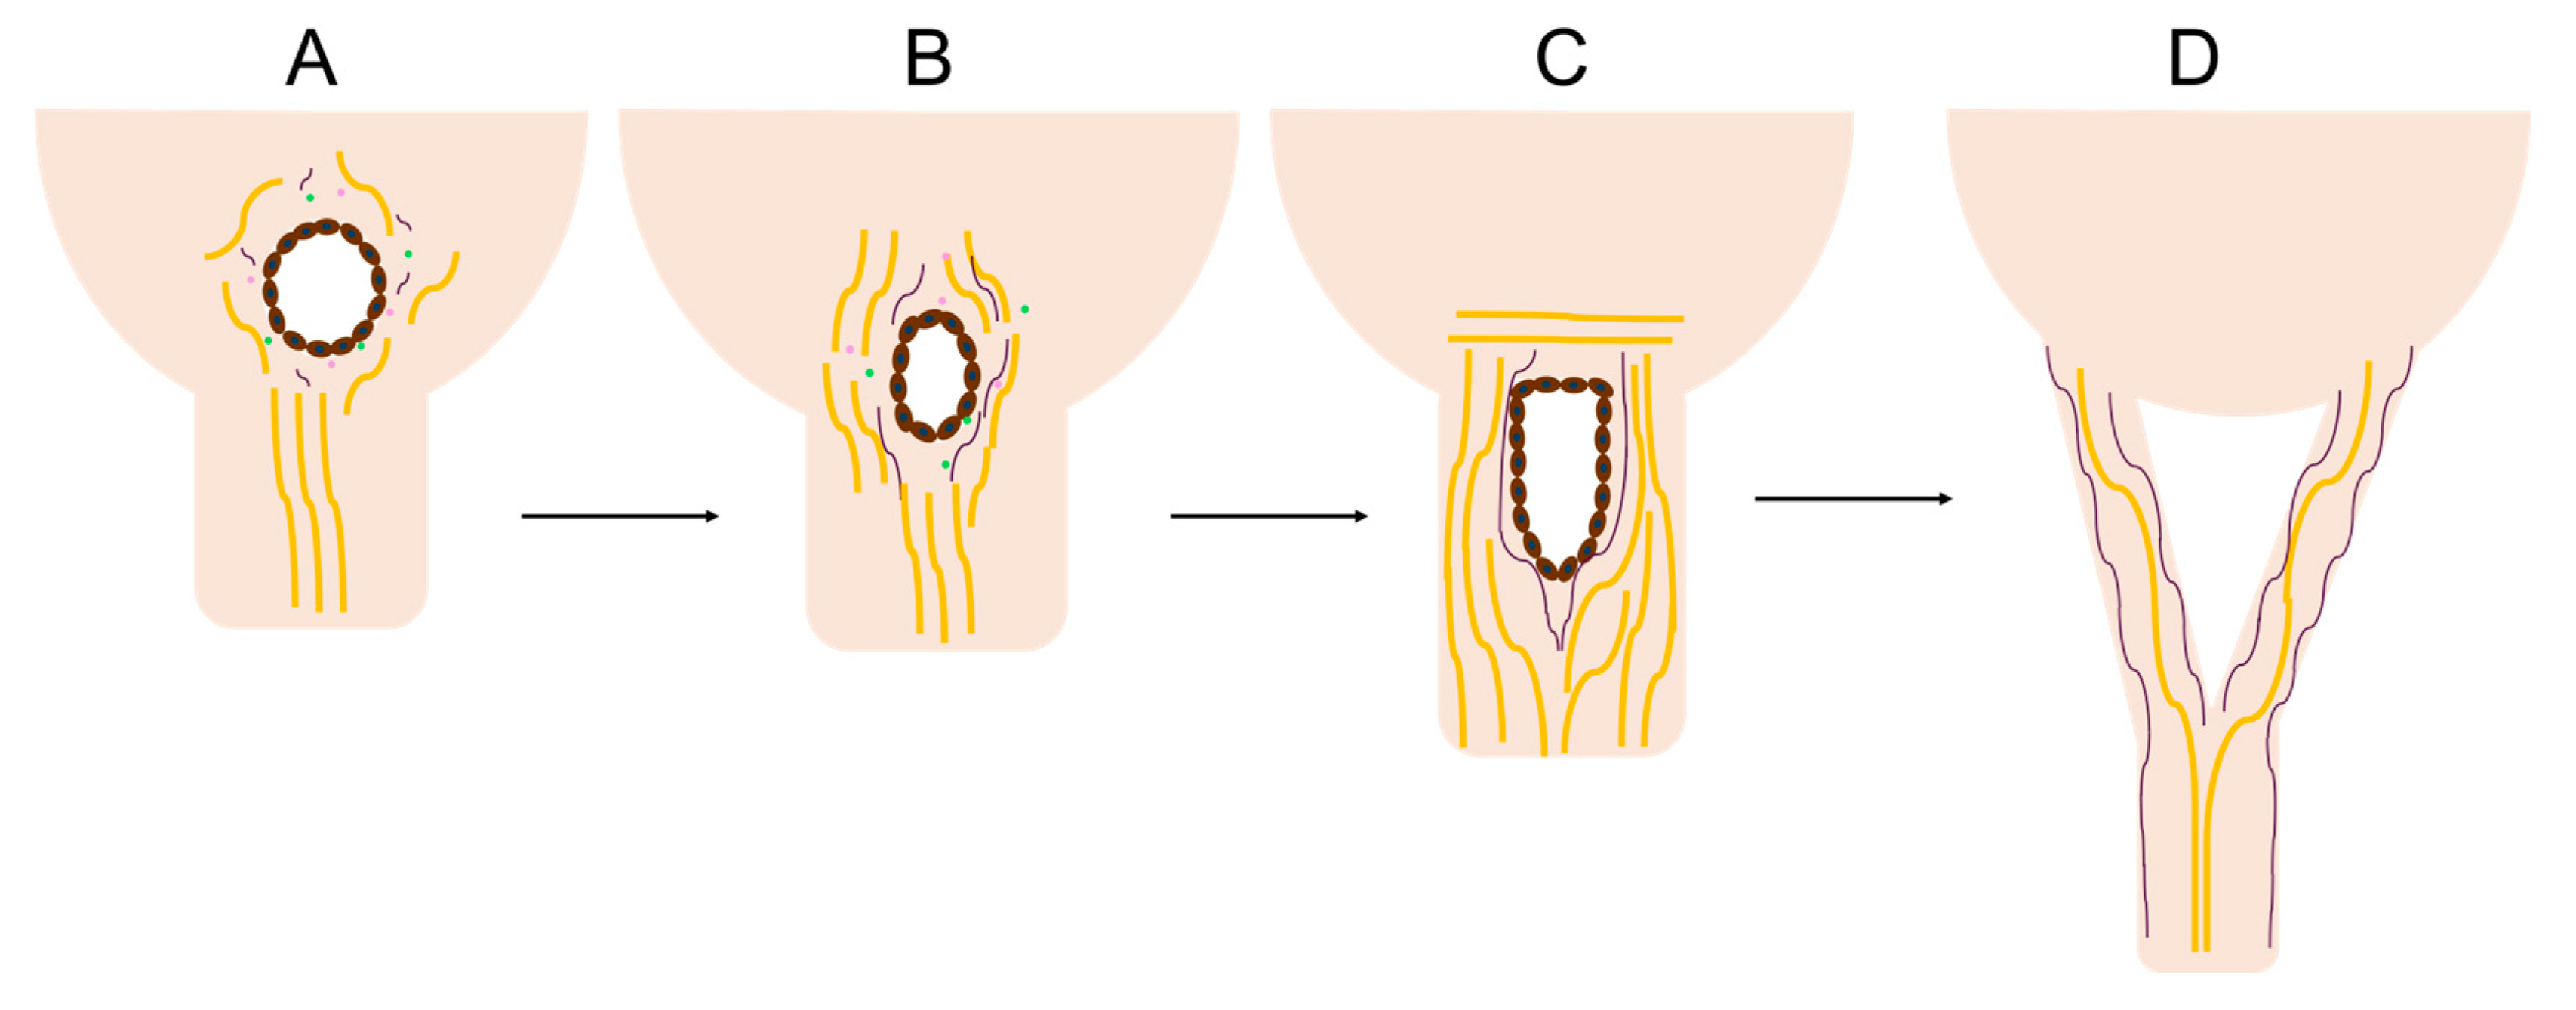
This study has revealed a unique region of cellular activity and ECM arrangement at the junction between the fetal mitral valve anterior leaflet and chordae tendineae. This “transition zone”, situated between collagen-dense areas of the leaflet and chordae, contains a region primarily composed of proteoglycans and features localized tissue thinning, endothelial cell-lined perforations, and clusters of proliferating endothelial cells. We hypothesize that this zone represents a region where chordae tendineae bifurcate during fetal development. In particular, perforations, created by localized MMP activity from endothelial cell clusters serve as a site for the initiation of a “split” of a single chordae attachment into two (
Figure 18A-C). The split propagates between collagen bundles into the pre-existing chordae trunk travelling towards the papillary muscle, creating two branches (
Figure 18D).
A similar perforated region has been noted in the developing mitral valve structures across different species including rats [
10], chicks [
22], and humans [
16,
17] - although much earlier in gestation – where the primordial anterior leaflet is connected directly to the papillary muscle. In rats (where chordae bifurcate postnatally), Masson’s trichrome staining demonstrated that this area was also comprised of predominantly proteoglycans with perforations in the tissue [
10]. Scanning electron microscopy in developing chicks revealed depressions in this region followed by perforations later in gestation [
22]. The authors suggested these depressions and perforations were lined with endothelial cells based on morphology [
22]. The present study confirms the endothelial identity of these transition zone cells. In early human mitral valve development, similar cell-lined perforations in the tissue were observed just above the papillary muscle [
16]. In each study, the authors note that these depressions and perforations in the tissue precede the development of branched chordae tendineae [
10,
16,
22]. Taken together the results from our study and the literature suggest that this perforated zone may be the area where new chordae tendineae branches are formed.
Using our observations and those from the literature, we can put together a more complete picture of chordae formation and bifurcation in a large animal model. Chordae formation begins in the post-fusion endocardial cushion with the specification of cells that will contribute to either leaflet or chordal development (
Figure 19A). These two populations display distinct cellular phenotypes and protein expression profiles [
14,
37]. In mice and chick models, leaflet-forming cells, responsive to bone morphogenetic protein 2 (BMP2), induce the expression of the cartilage markers sox9 and aggrecan, whereas chordae-forming cells, responsive to fibroblast growth factor 4 (FGF4), induce the expression of tendon markers scleraxis and tenascin [
37].
The first chordal tendon forms at the interface between the primordial leaflet and the papillary muscle in first trimester [
16] (
Figure 19B-C). In chicks [
22] and humans [
16,
17], the endocardial cells forming the chordae transform the cushion-papillary interface into a thinner sheet that becomes the first chordal tendon (
Figure 19B). This tendon remodels to attain its characteristic cylindrical shape (
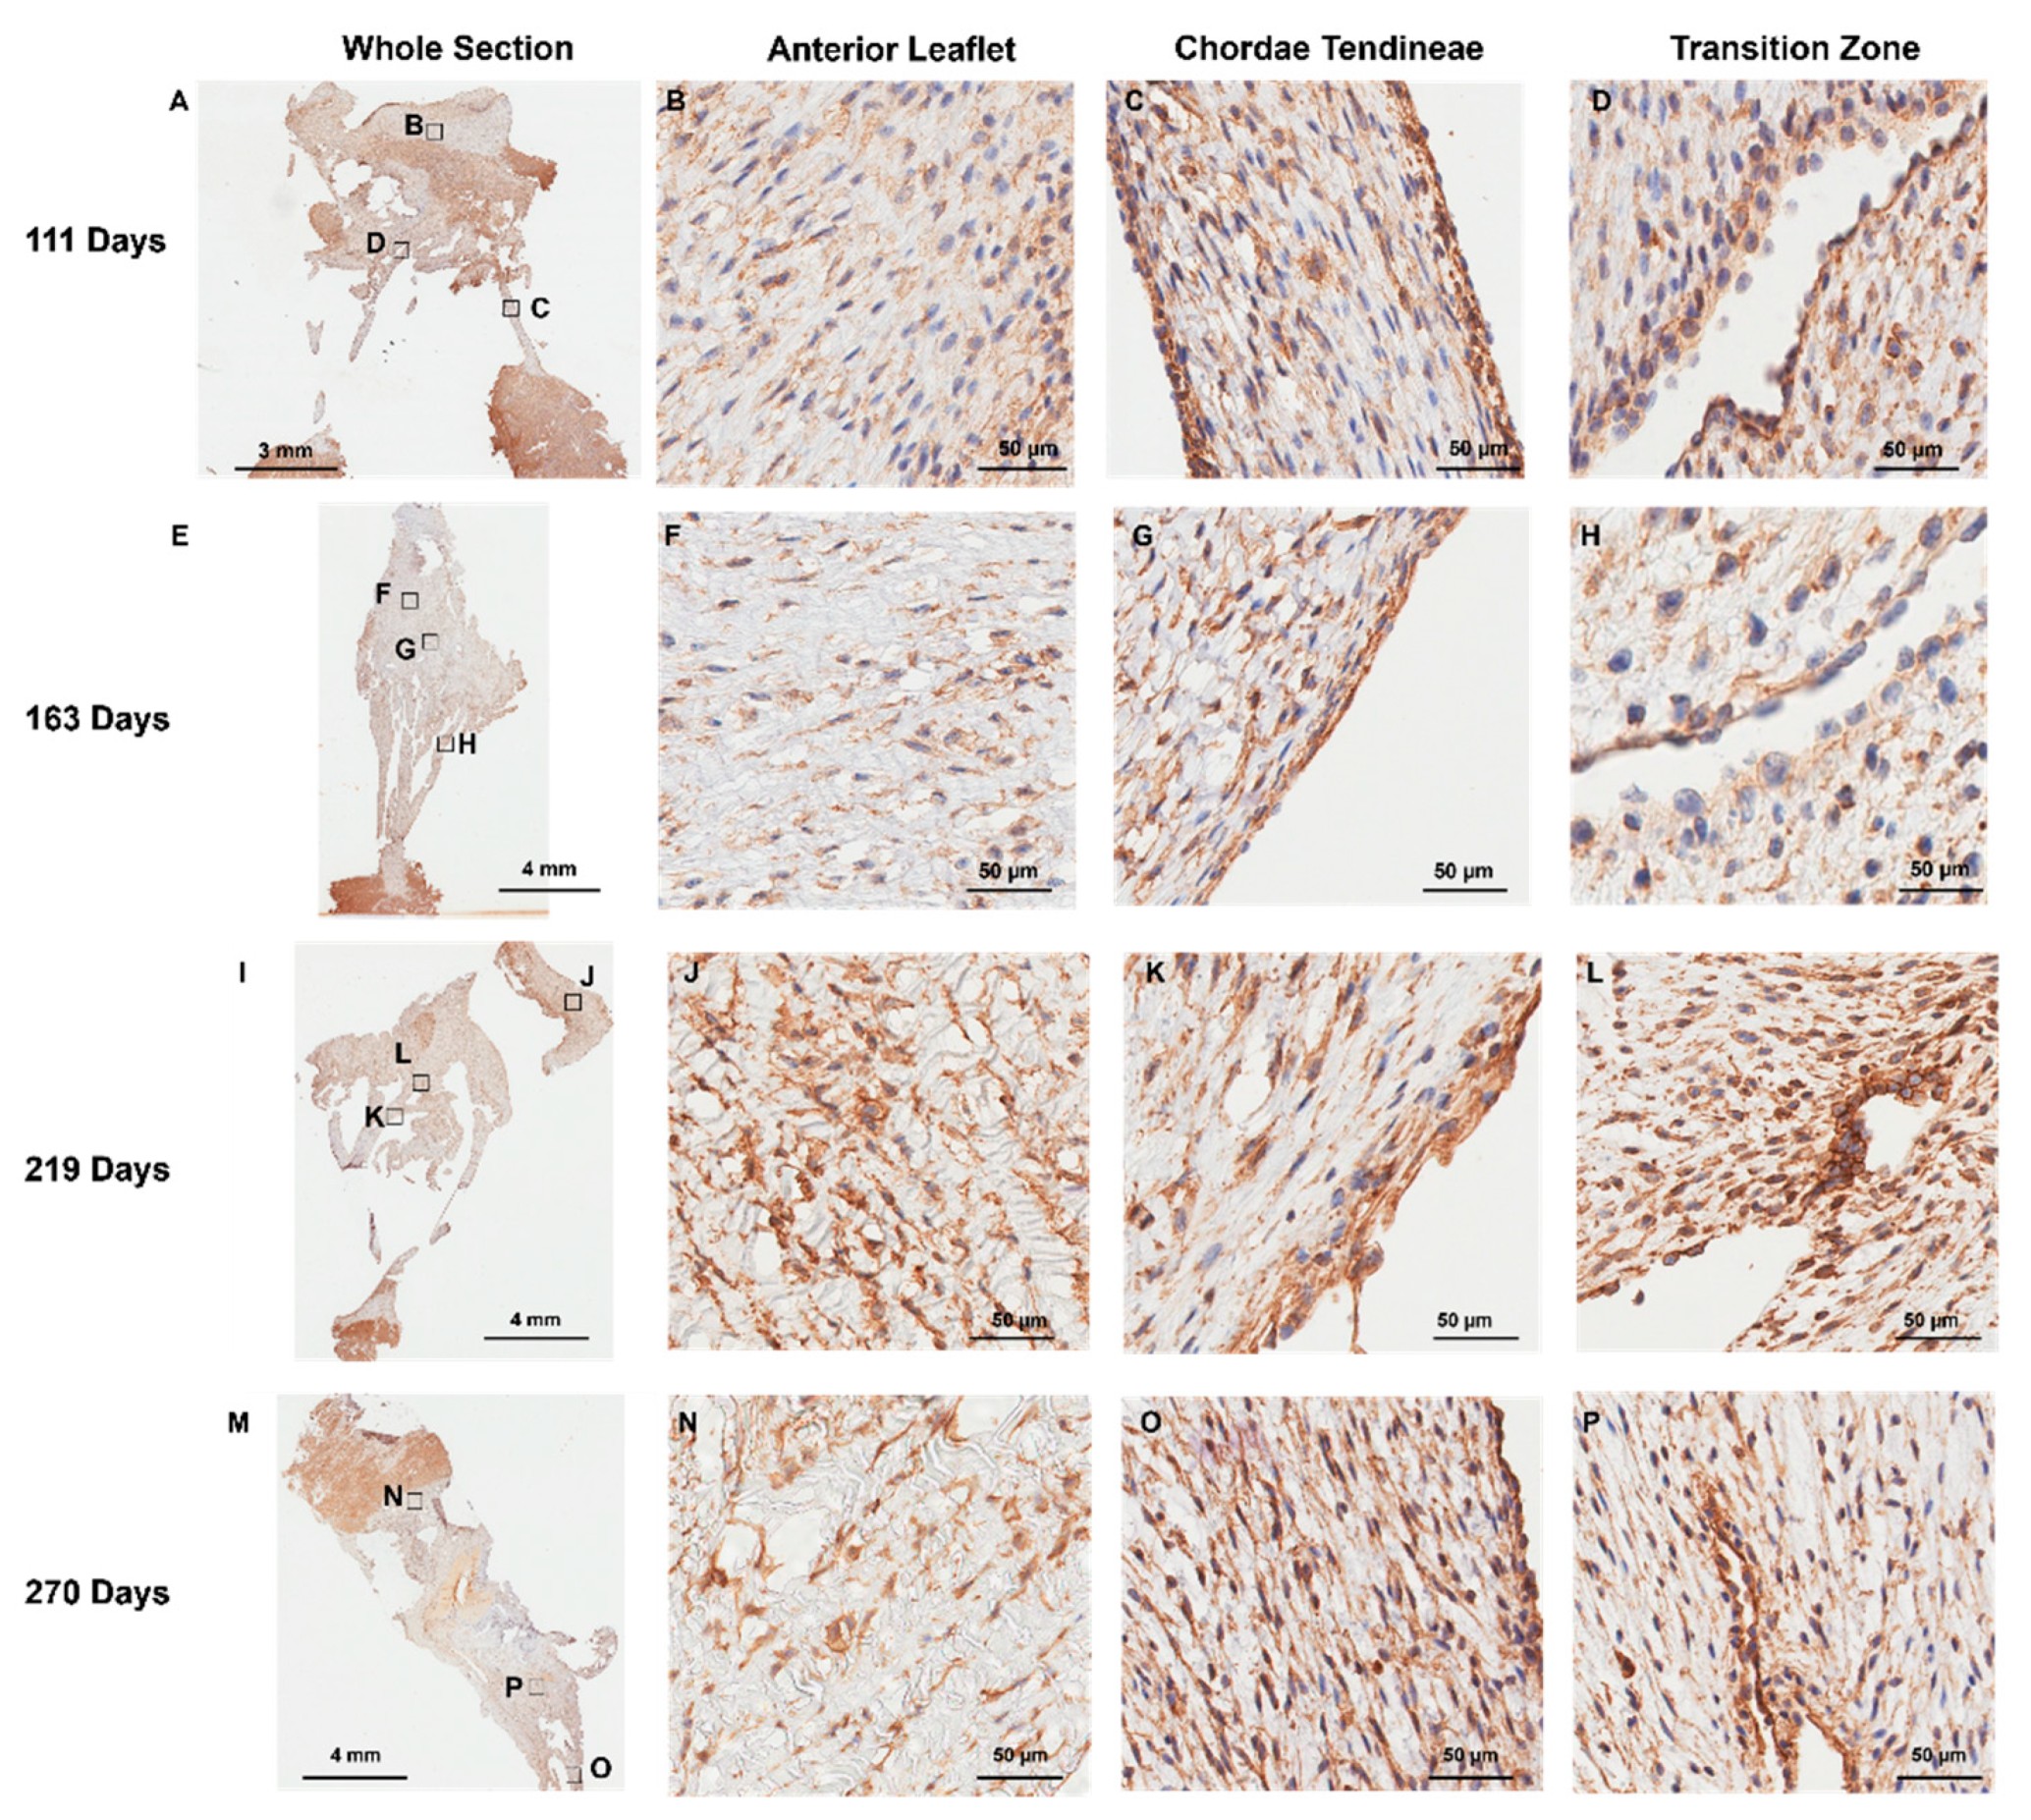
Figure 19C), likely via MMP-1 (see
Figure 8C, G, K, O) and MMP-2 (see
Figure 9C, G, K, and O) expression at the outer chordae surface that persists over gestation.
In the mid to late first trimester [
16,
17,
18], bifurcation starts with the first chordal tendon (
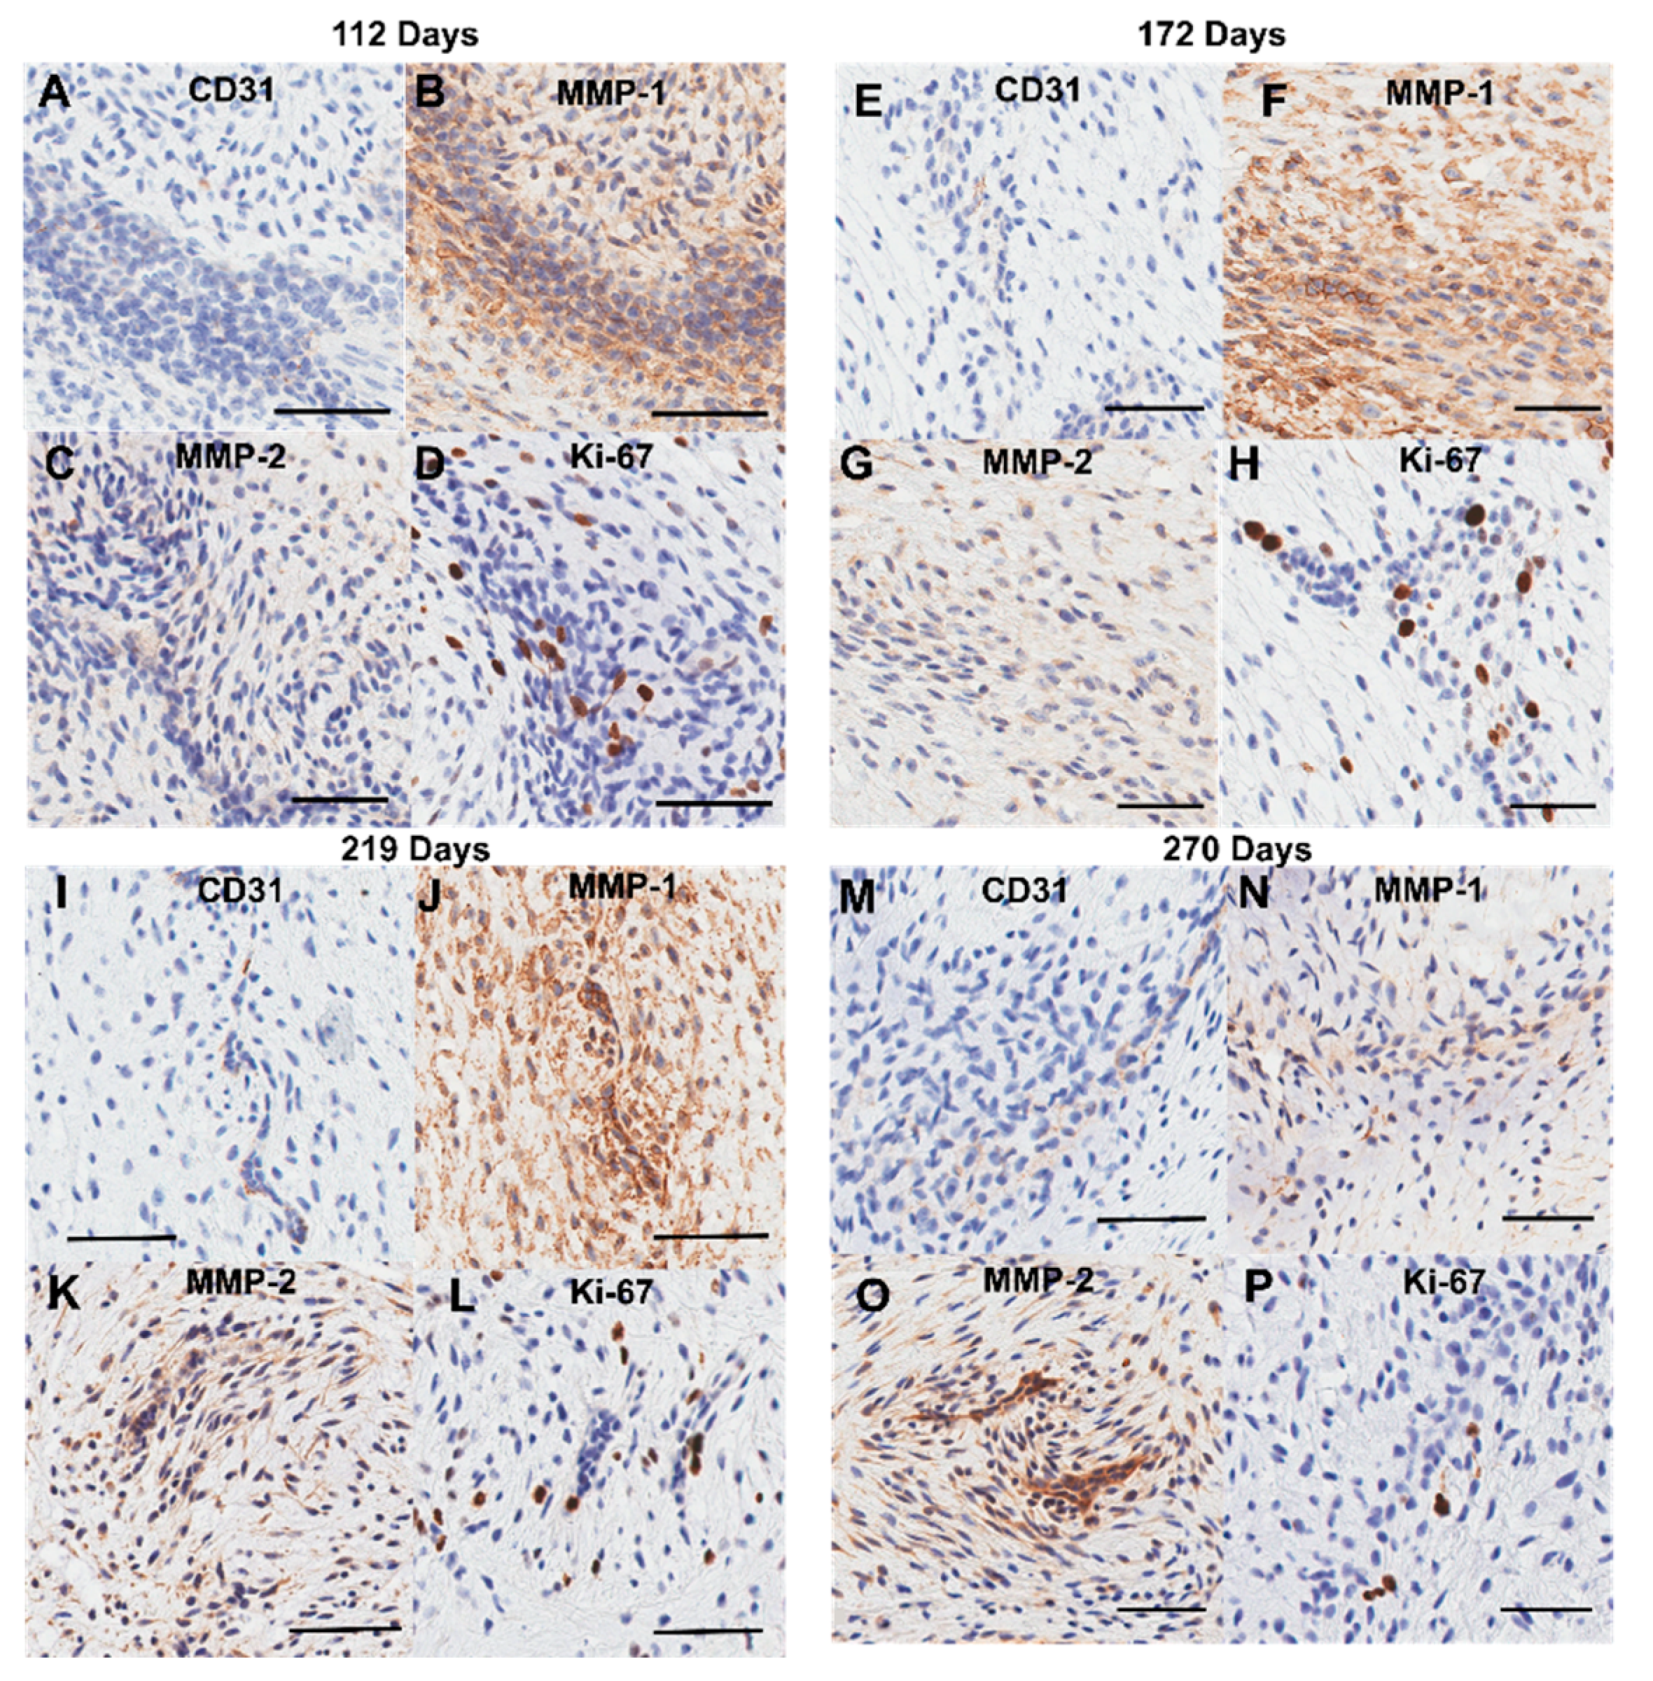
Figure 19D-E). Localized clusters of endothelial cells in the transition zone express MMP-1 (
Figure 12C, G, K, and O) and MMP-2 (see
Figure 12D, H, L, and P), degrading the collagen and proteoglycan substrate [
38], thinning the tissue and creating perforations. As gestation progresses, further bifurcations are created with the same process (
Figure 19 F-H).
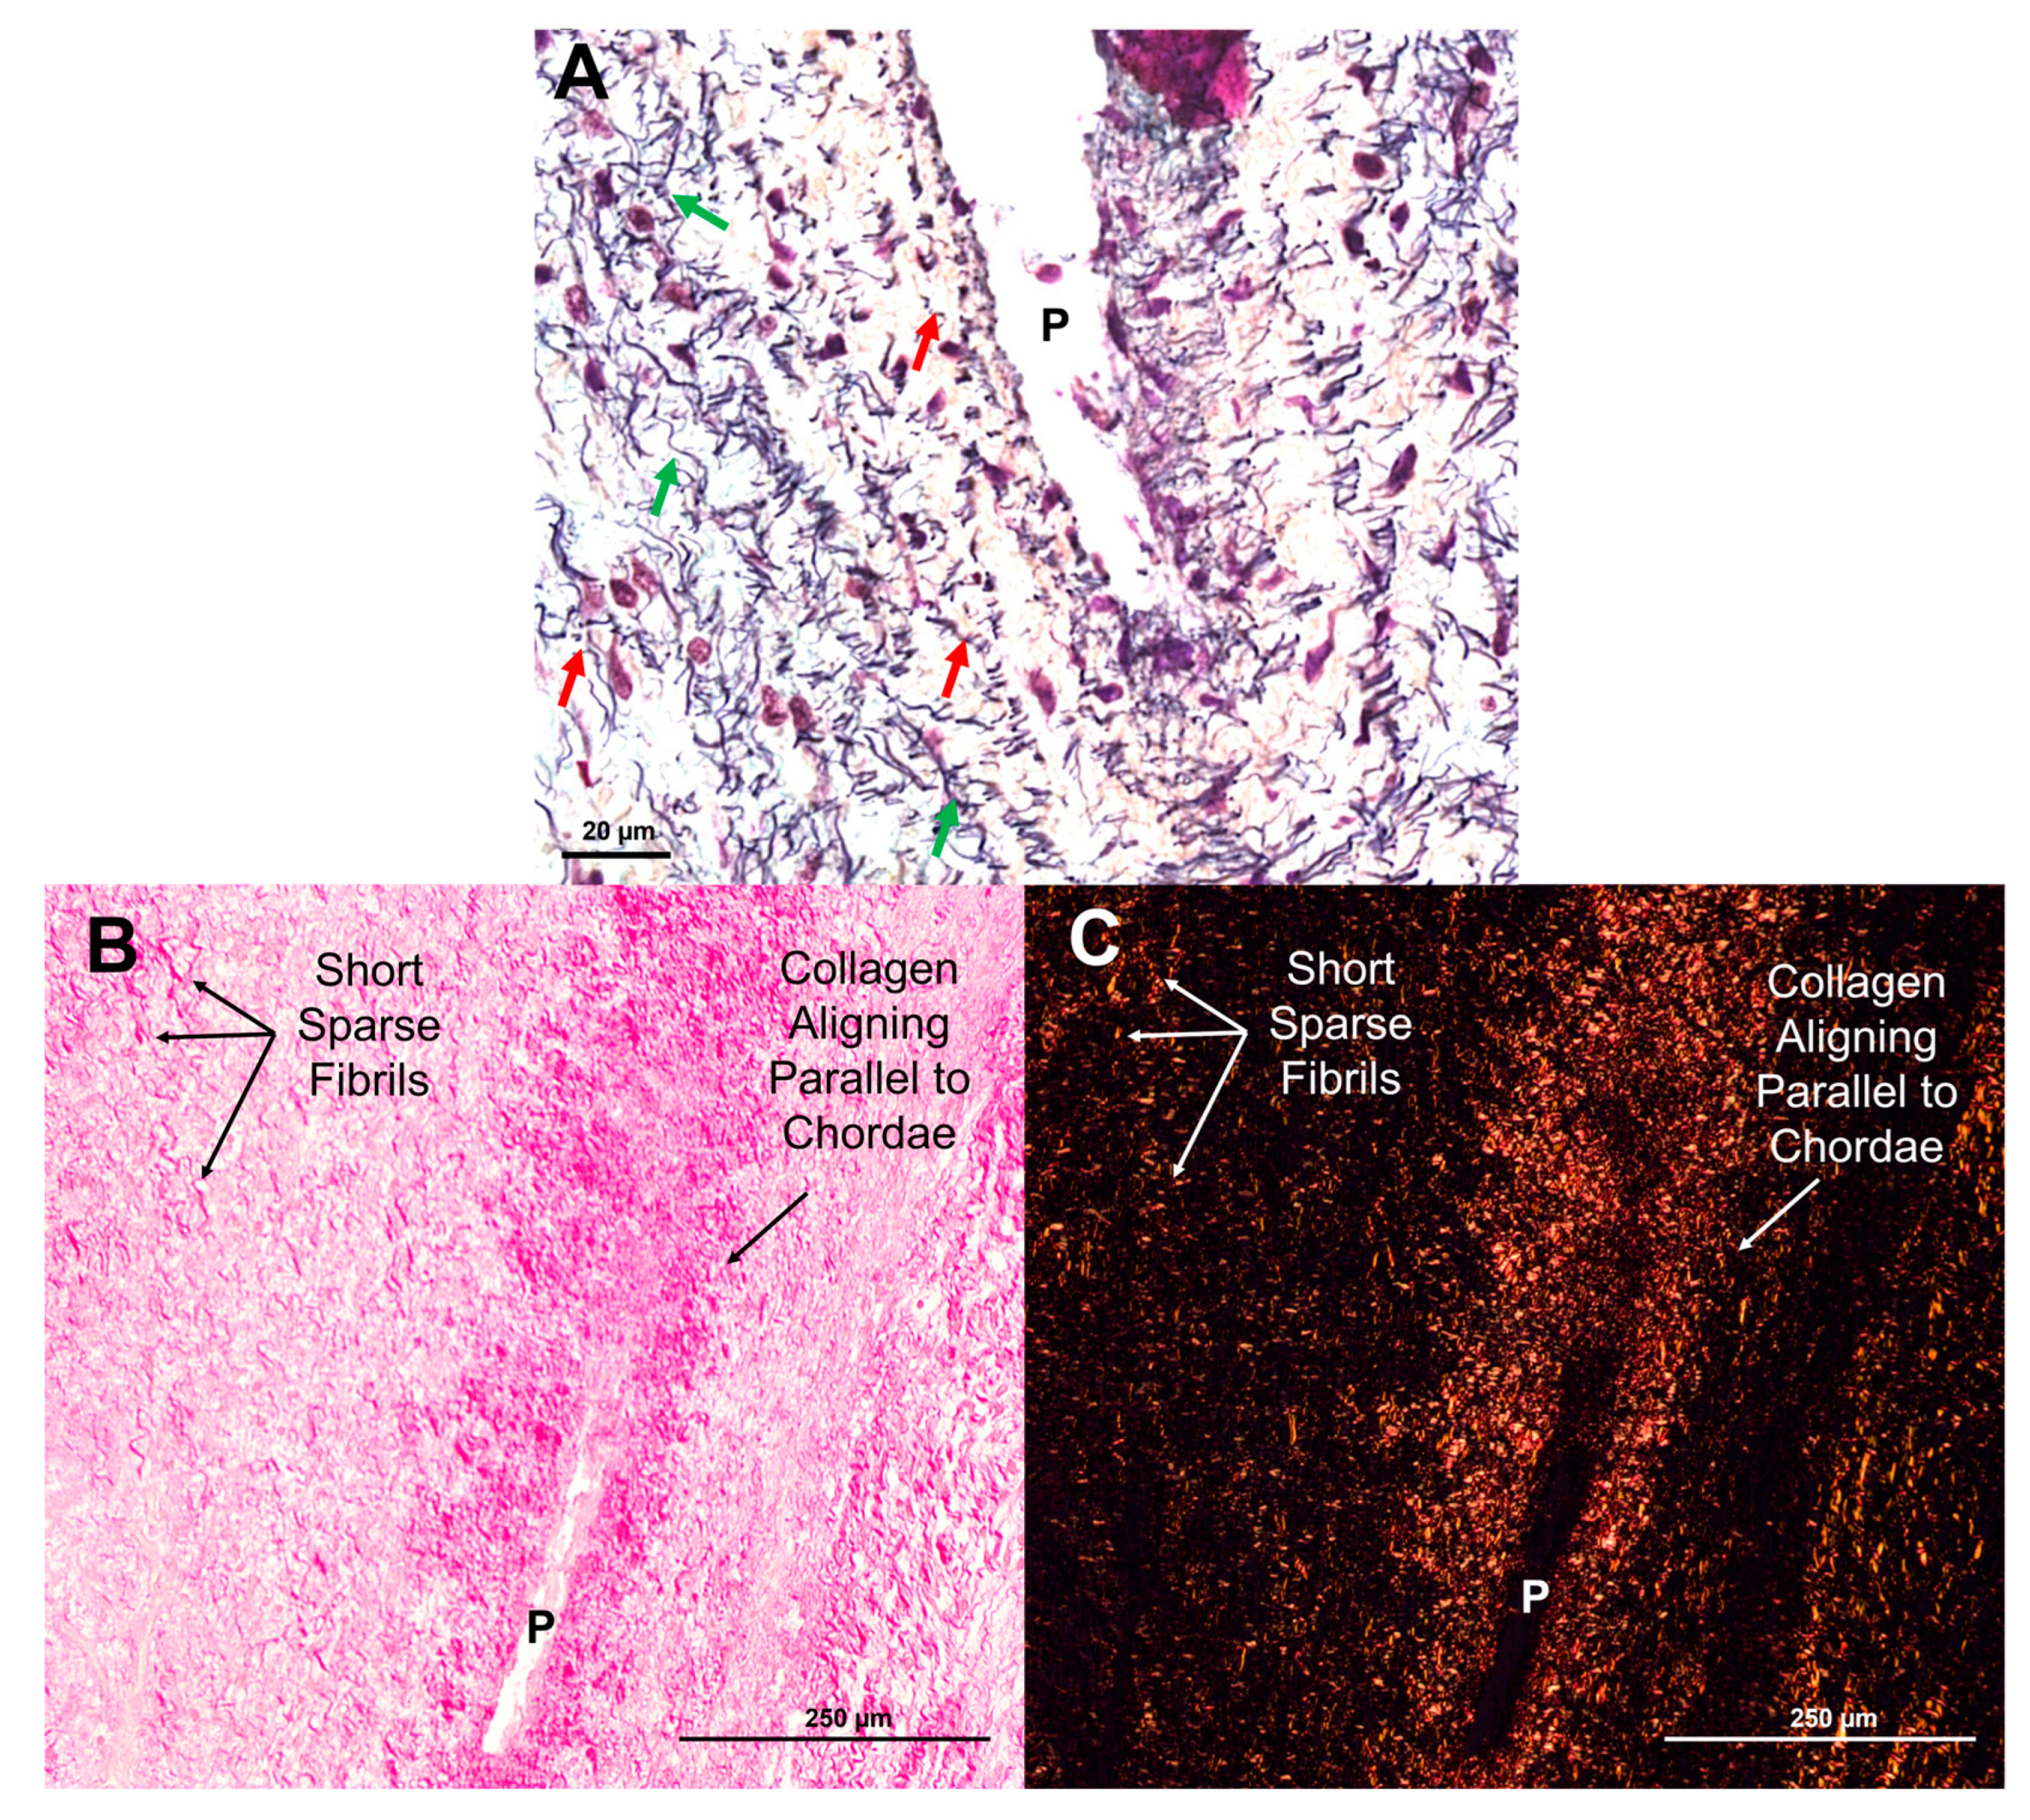
Transition zone collagen and elastic fibers, initially present as sparse, short fragments, begin to condense around the perforations (
Figure 6A-C,
Figure 18A-C) beginning around second trimester. Fibers then rotate into the radial direction of the valve towards the papillary muscle (
Figure 6A-C,
Figure 18B) where they will become incorporated into the newly-formed chordal branches (
Figure 18C-D). Collagen fibers become localized in the bulk of the new branches, with dense, nearly-continuous elastic fibers layers at their periphery (
Figure 18D). This is consistent with our earlier observation of the elastin “jacket” in fetal chordae becoming fully developed in late gestation [
18]. Endothelial cells within and around the perforations proliferate to provide new cells to line the outer edges of the newly-formed chordae branches (
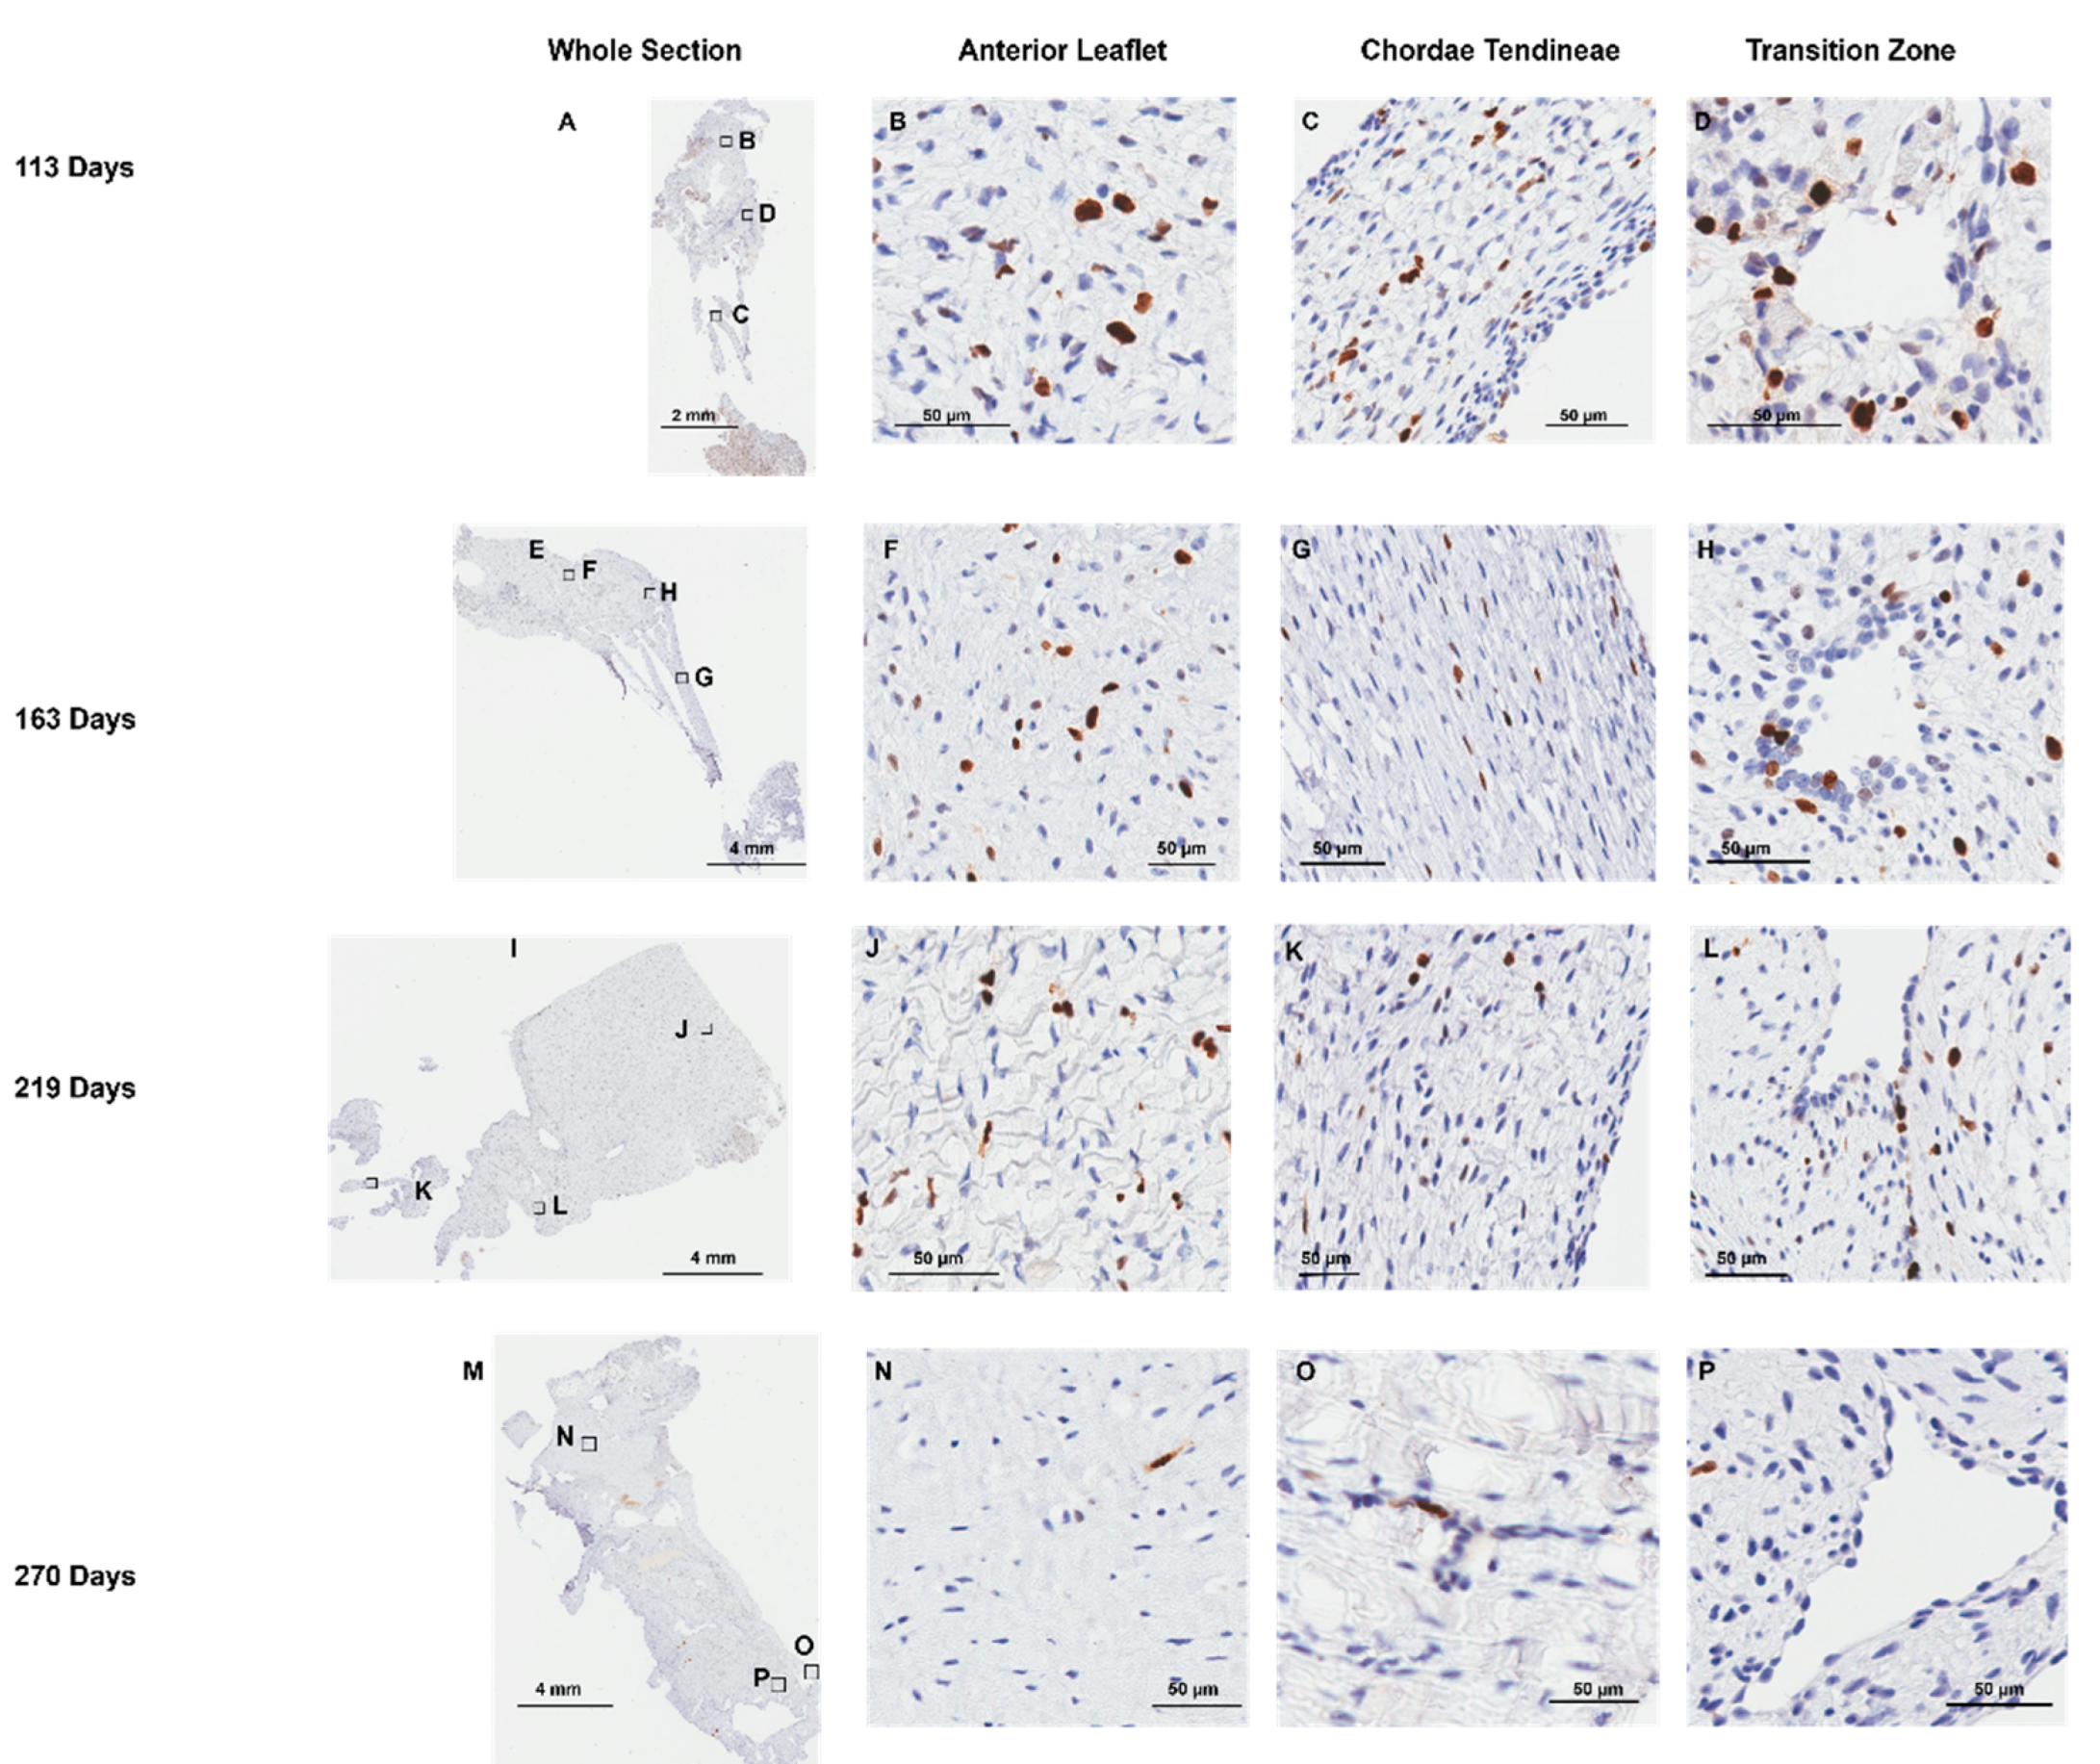
Figure 10D, H, and L).
The synthesis of elastic fibers in the transition zone may play important signaling roles in chordal branching. Elastin peptides have been shown to decrease endothelial cell proliferation [
39]. Therefore, as elastogenesis increases in the transition zone in late gestation, it may trigger a decrease in endothelial cell proliferation activity and an end to chordal branching. Indeed, by full term, endothelial cell proliferation has decreased with fewer Ki-67 expressing cells lining the perforations (
Figure 10P) and in the bulk of the transition zone tissue (
Figure 11B and
Figure 12P) suggesting that chordae bifurcation is slowing. This is in line with our previous work that suggests that the number of chordae attachments to the leaflet is set at birth [
18].
Mechanical loading plays several key roles in valvulogenesis [
40] and no doubt does the same in chordae tendineae bifurcation. For example, when filamin-A—a mechanosensory component of valvular endothelial cells—is knocked out in mice, chordae tendineae branching does not occur [
19]. The loss of mechanosensing abilities may disrupt the ability of the endothelial cells to create perforations and ultimately inhibit chordal branching. There may also be an interplay between mechanical loading and the transition zone perforations during chordae bifurcation. A hole in a tissue under tension concentrates stresses in the adjacent tissue, causing the hole to stretch more than tissue far from the defect [
41]. Elevated stress around the perforations may trigger the accumulation of collagen and elastic fibers in those regions (See
Figure 6). Indeed, a similar process occurs during arterial growth, where holes or “fenestrations” in the elastic lamellae are created via expression of MMP-2 [
42,
43]. Stress concentrations rapidly enlarge the fenestrae—contributing to the growth of the tissue—but also trigger the deposition of new elastic fibers around the hole circumference [
42]. Perforations in the developing mitral leaflet may also serve to concentrate stress, re-orient the ECM, and initiate the “split” of a single attachment into two branches.
We propose that the split propagates down a single chordal attachment via a cleavage plane—likely between major collagen bundles (
Figure 19I-J). This is supported by the similar populations of collagen fibrils in the trunk and the branch, suggesting that they were once one population of collagen fibrils that had been separated by a cleavage plane. Studies pulling apart branched and unbranched chordal tissues to mechanically induce splitting should be conducted to test this longitudinal splitting hypothesis.
Figure 1.
Representative image of an excised bovine anterior mitral valve. Arrows denote (in order from top to bottom) the strut, basal and marginal chordae.
Figure 1.
Representative image of an excised bovine anterior mitral valve. Arrows denote (in order from top to bottom) the strut, basal and marginal chordae.
Figure 2.
Methods for measuring perforation dimensions in the two modalities. Orthogonal dimensions (i.e. x and y dimensions) were taken as an approximation of perforation size. Representative image of these measurements in a Movat Pentachrome stained section from 219 gestational days (A). Representative image of these measurements in 2D still image from micro-CT from 163 gestational days (B). Note the scale bar varies between images.
Figure 3.
Diagram depicting location of samples for transmission electron microscopy. Trunk sections were taken from above the papillary muscle connection to just below the first bifurcation. Branch sections were taken from above the bifurcation to below their next bifurcation.
Figure 3.
Diagram depicting location of samples for transmission electron microscopy. Trunk sections were taken from above the papillary muscle connection to just below the first bifurcation. Branch sections were taken from above the bifurcation to below their next bifurcation.
Figure 4.
Determination of full width at half maximum (FWHM) and mode calculation from collagen fibril diameter distributions. FWHM was measured by first identifying the maximum value of the distribution (y max) then dividing that by 2 (y max/2). To find x1 and x2, the x value that corresponded with the maximum y value was defined. This was then used as threshold to find the minimum (x1) and maximum value (x2) of x that corresponded with y max/2. FWHM was calculated by then subtracting x2 minus x1 (blue double-sided arrow). The mode was defined as the most common value in the distribution (red dotted line).
Figure 5.
Representative images of the “transition zone” found between the collagenous portions of the mitral anterior leaflet and chordae tendineae throughout gestation. (A, D, G, and J) Overview of the “transition zone” in the anterior leaflet. Dashed boxes show where subsequent magnified panel images were taken from. (B, E, H, and K): Magnified images of the cell-lined perforations present in this area. (C) Magnified image of the “transition zone” demonstrating lack of elastic fiber presence at earlier timepoints. (F, I, and L) Magnified images showing the pattern of elastic fiber organization in this transition zone at later developmental stages. (A-C) valve in early second trimester (111 days into gestation). (D-F) third trimester (212 days into gestation). (G-I): third trimester (219 days into gestation). (J, K, and L) full term (270 days). * denotes chordae tendineae attachments. When in view, double sided black arrows denote circumferential collagen alignment in the anterior leaflet. The long axes of perforations were often in the direction of the chordae tendineae. (See
Figure 5 G, J and
Figure 6 B, C). Collagen is stained yellow-orange, elastic fibers dark purple, muscle tissue and blood cells red, glycosaminoglycans in blue-green and cell nuclei in dark red-purple. Scale bar varies per image.
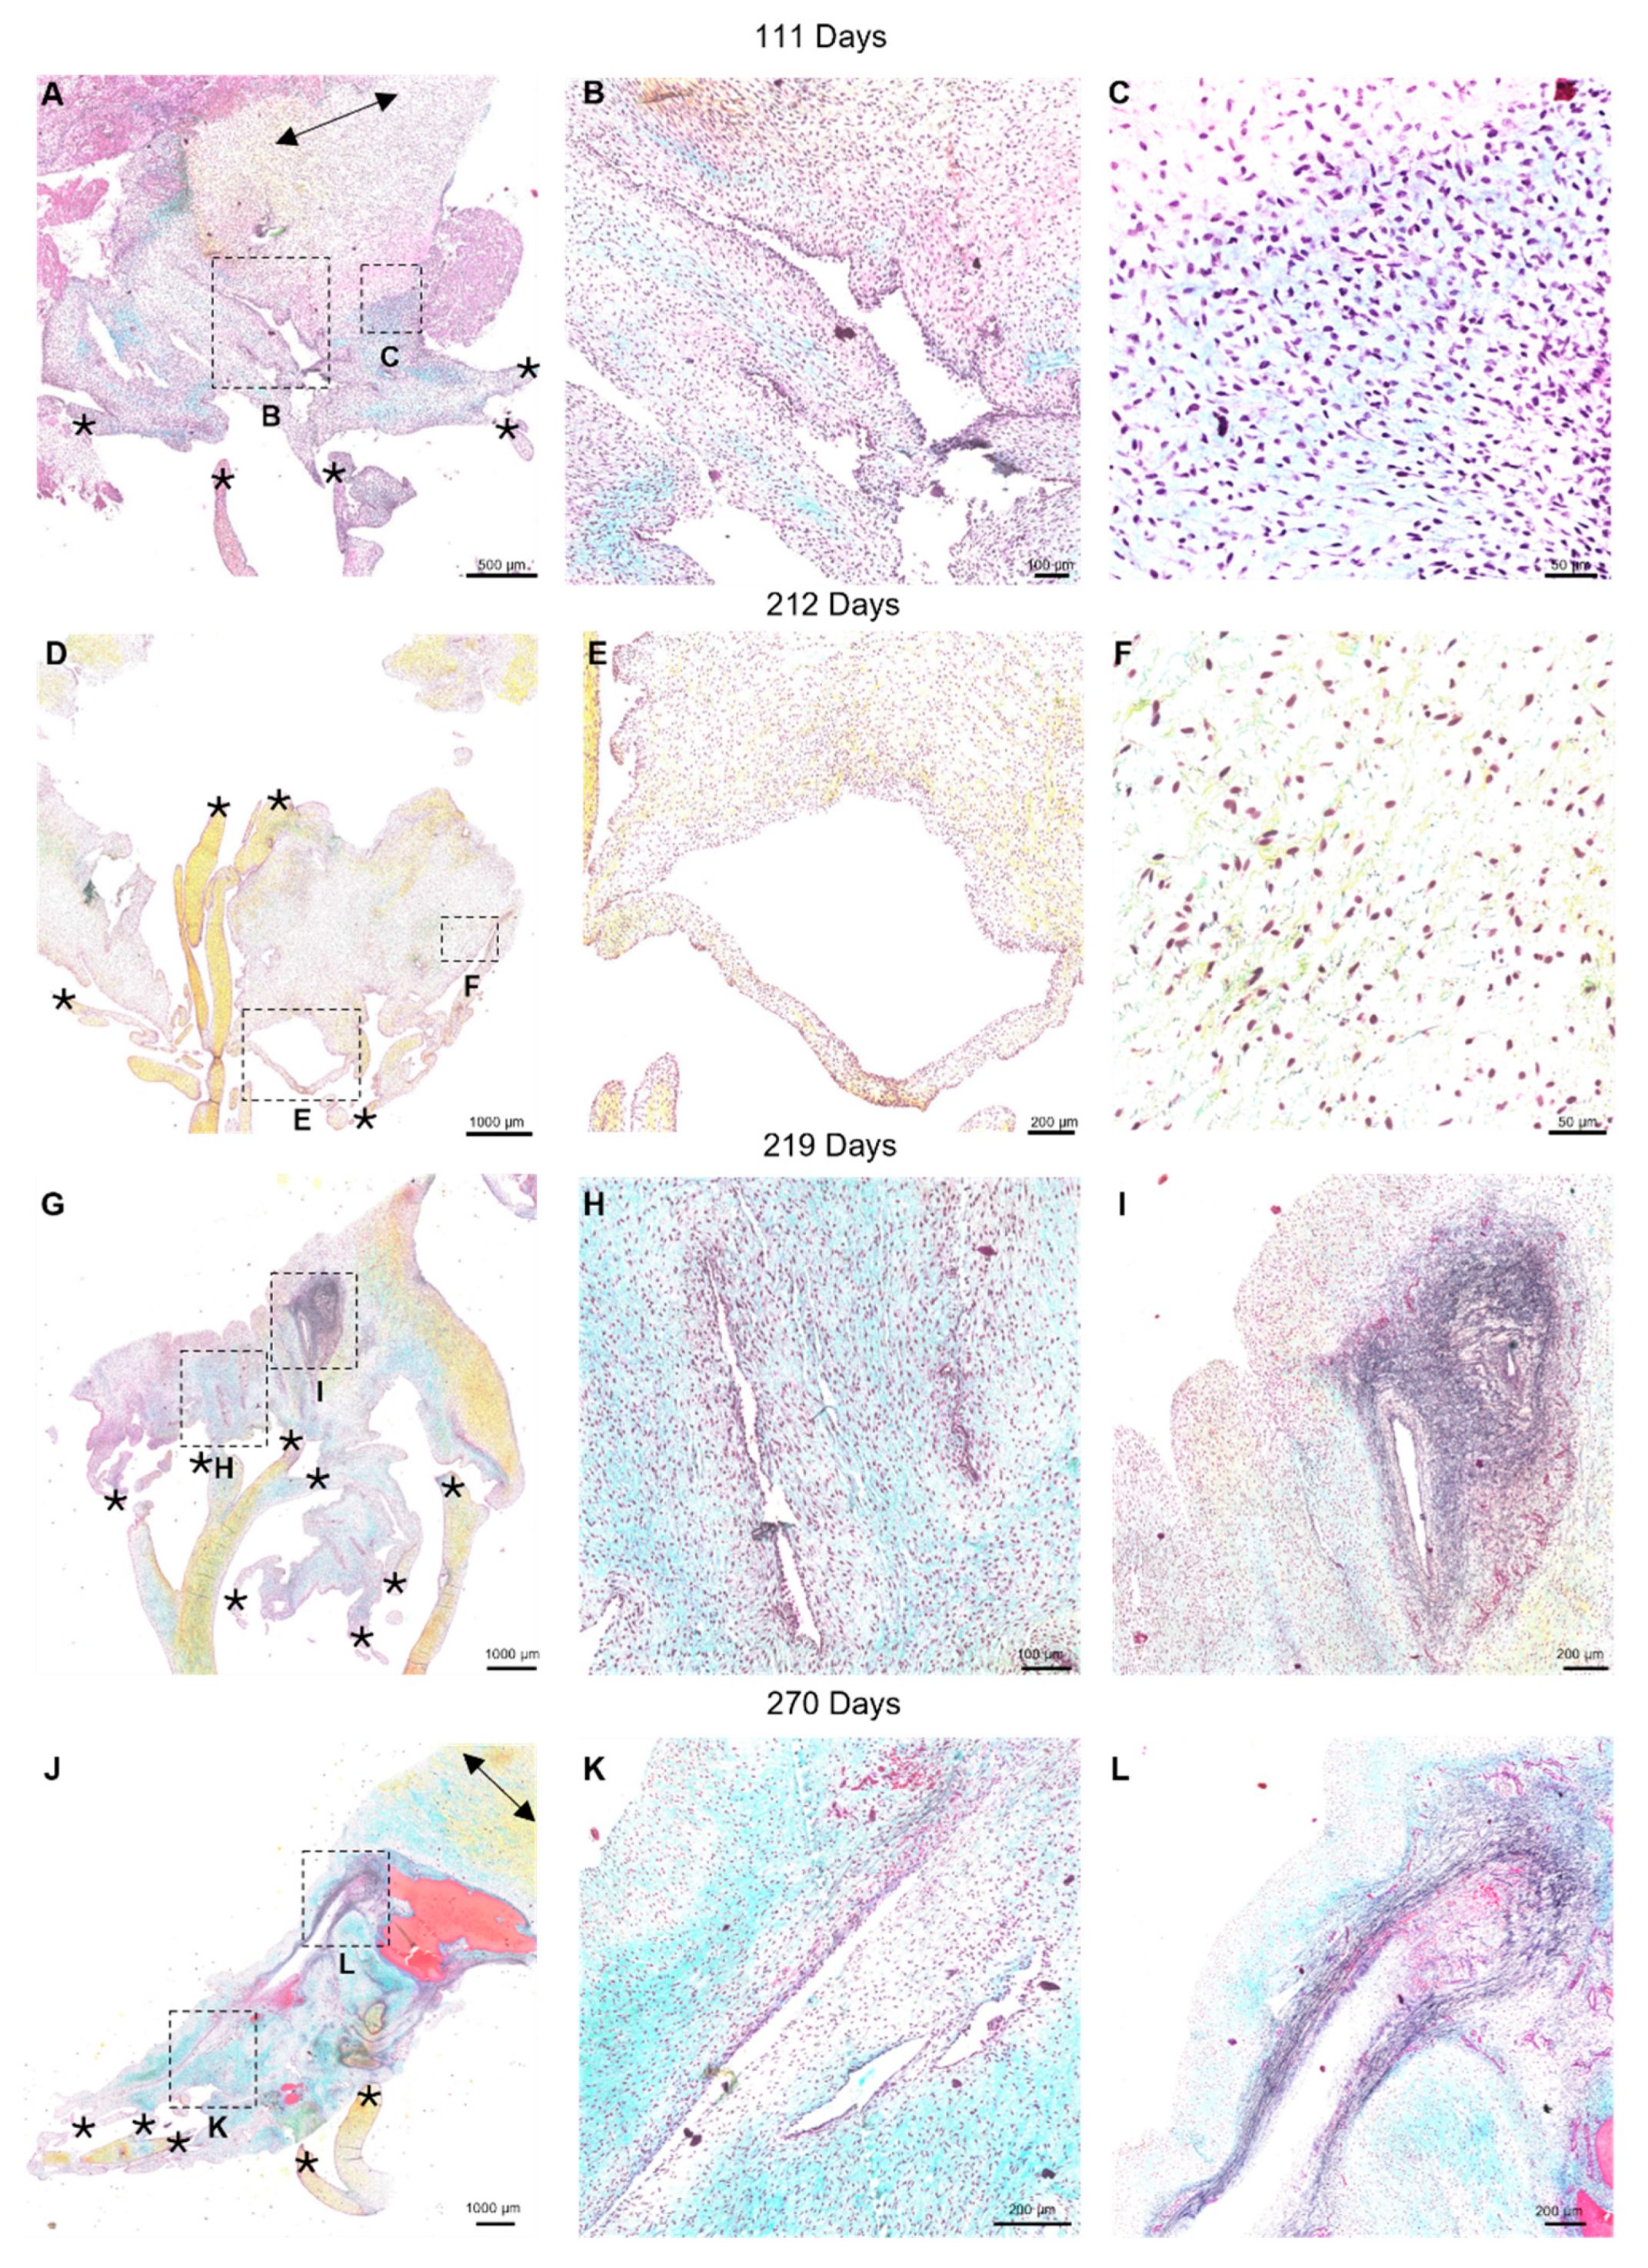
Figure 6.
Elastin and collagen fibers first appear as short, sparse fragments before beginning to align in parallel with the chordae. (A) Movat pentachrome stained section of a perforation (P) with short elastic fragments (red arrows) and longer fragments (green arrows) beginning to align around it. Image taken at 14X magnification using the Pannoramic MIDI II. (B and C) Picrosirius red and hematoxylin-stained sections of a perforation (P) with shorter sparse collagen fibrils and collagen beginning to align parallel to the chordae under brightfield (B) and polarized light (C). Images taken on a Nikon Eclipse E600 light microscope equipped with a polarizer and an AmScope 10MU1400 digital camera. All photos were taken from sections from the same third-trimester valve (219 days into gestation). Scale bar varies per image.
Figure 7.
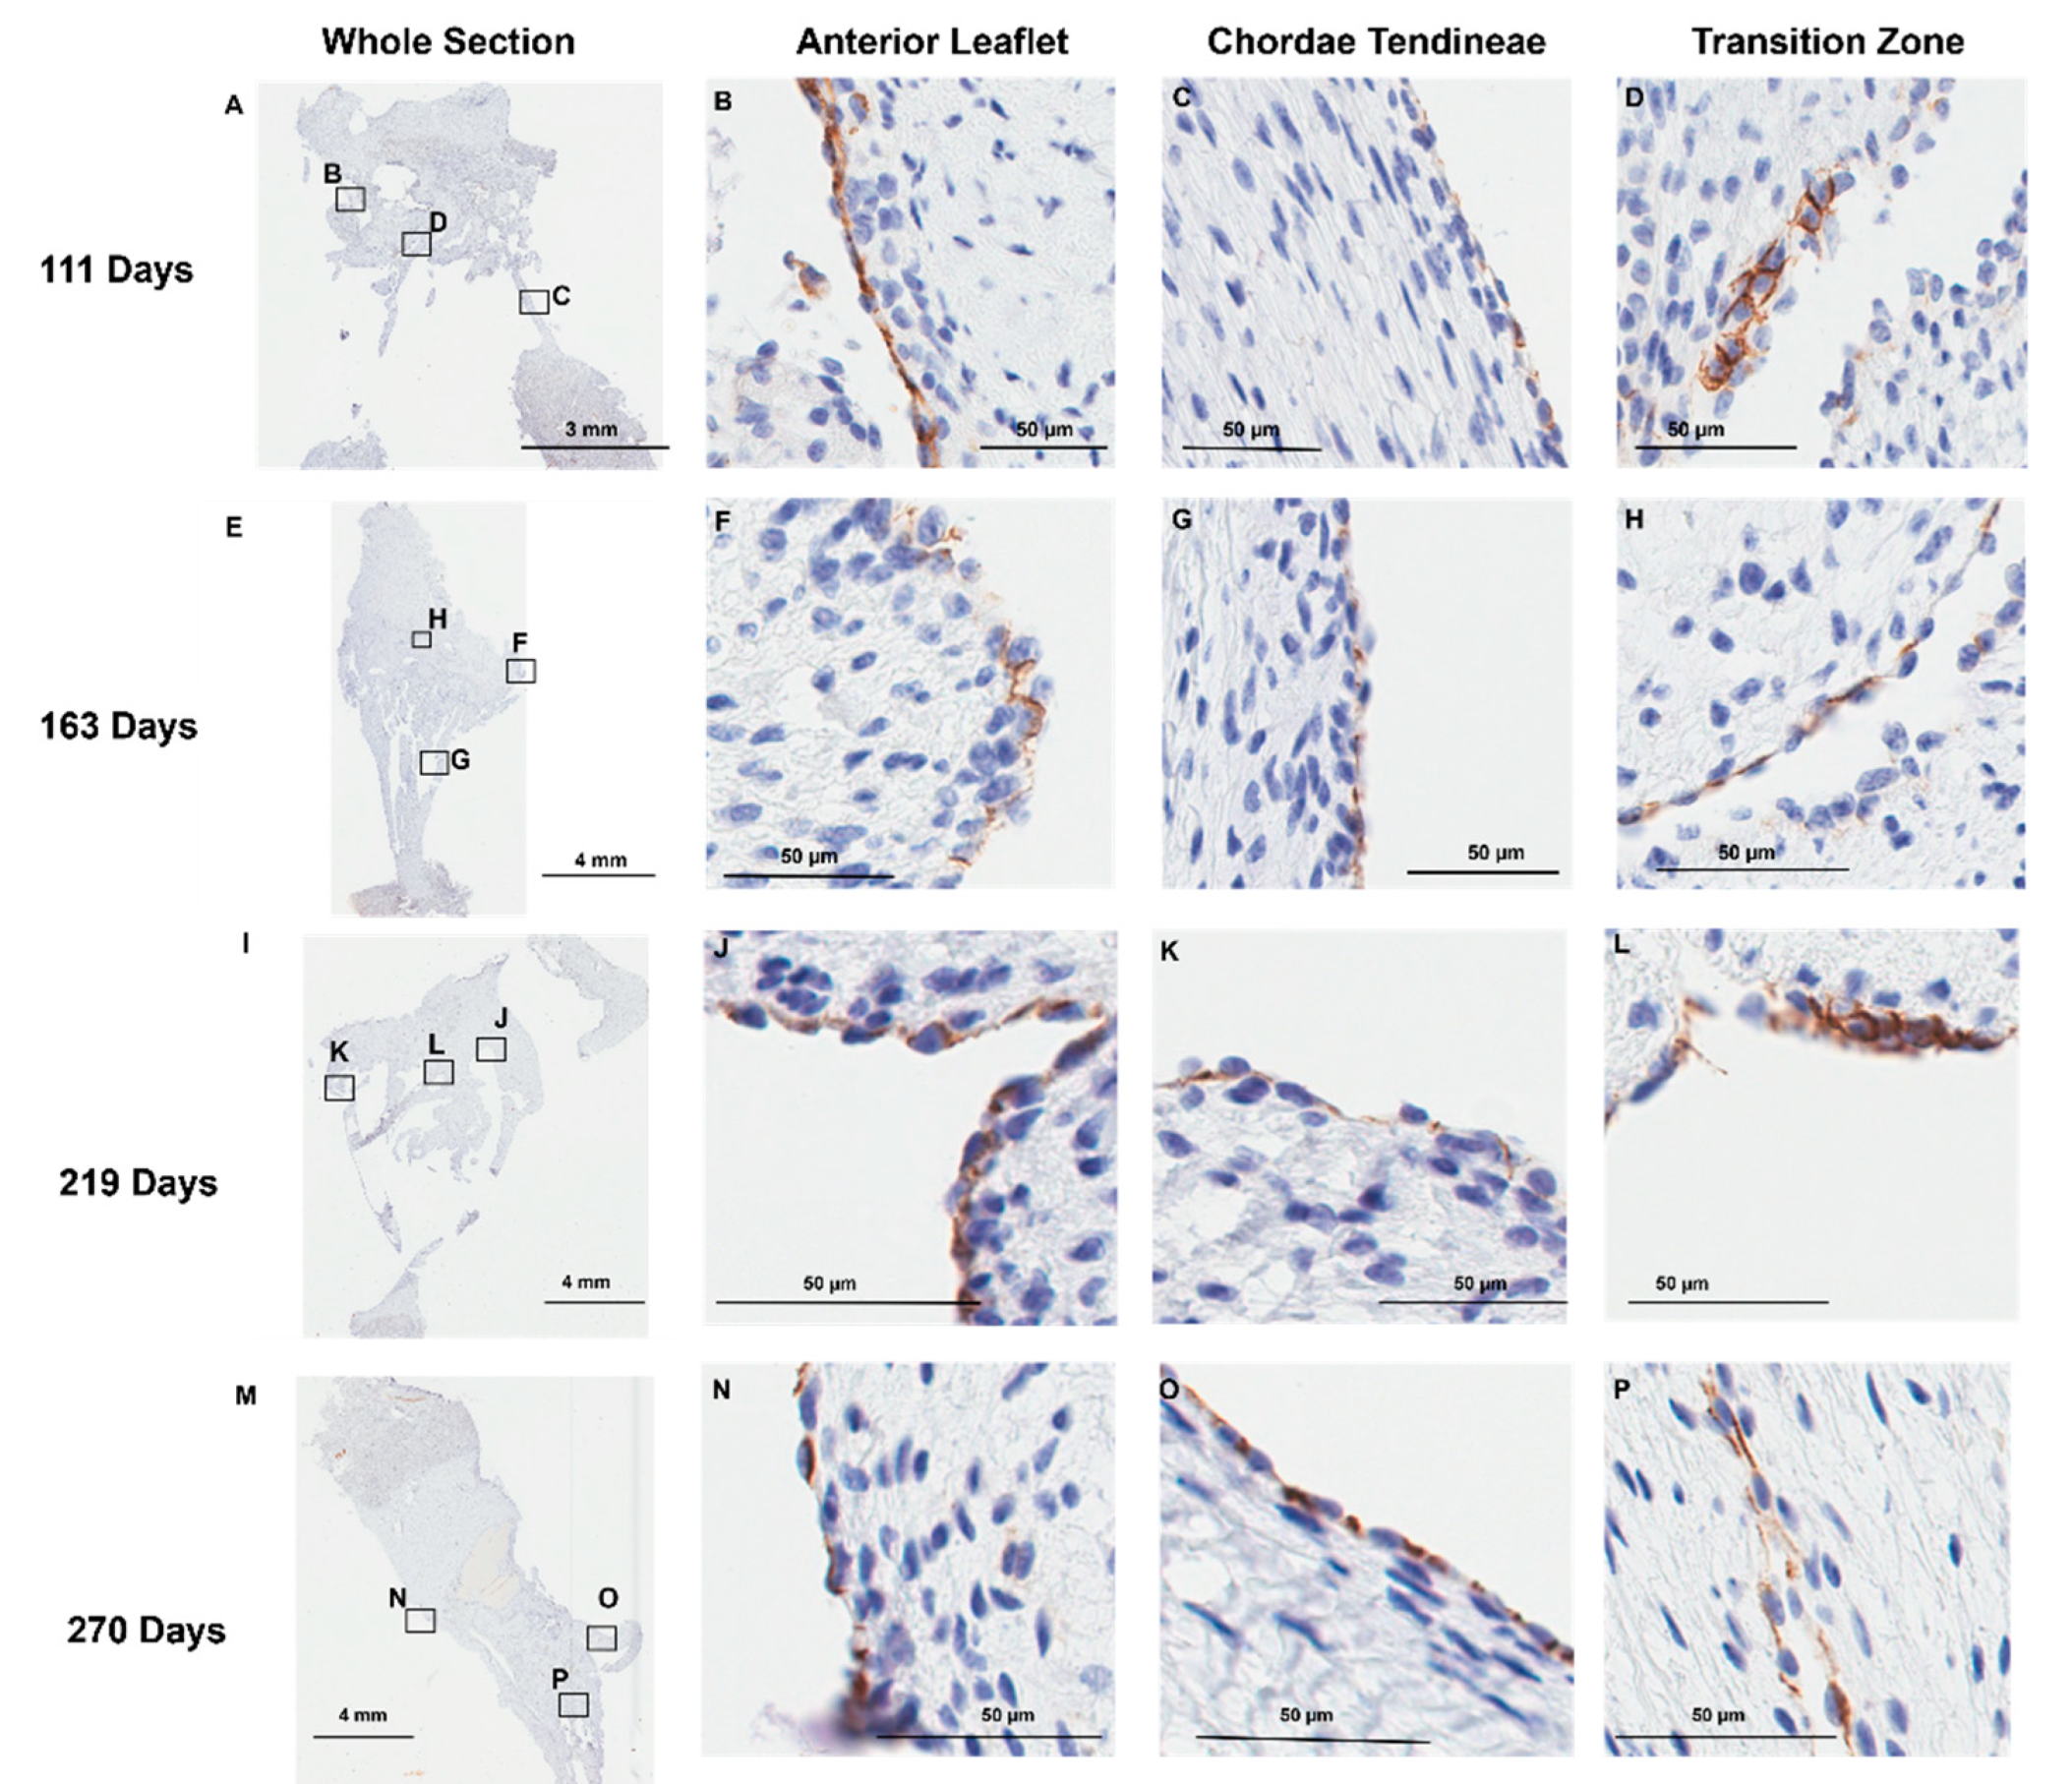
Representative images of CD-31 (endothelial cell marker) expression throughout the mitral valve anterior apparatus. (A, E, I, and M) Overview of the CD-31 stained sections. Boxes show where subsequent magnified panel images were taken from. (B, F, J, and N) Magnified images of the outer edge of the anterior leaflet showing CD-31 staining in the cells lining the leaflet. (C, G, K, and O) Magnified images of the outer edge of the chordae tendineae showing CD-31 staining in the cells lining them. (D, H, L, and P) Magnified images showing CD-31 staining in the cells lining the perforations in the transition zone. (A-D) Valve in early second trimester (111 days into gestation). (E-H) Late second trimester (163 days into gestation). (I-L) Third trimester (219 days into gestation). (M-P) Full term (270 days). CD-31 positive cell staining is shown in brown. Cell nuclei are stained blue. Scale bar varies per image.
Figure 8.
Representative images of MMP-1 expression throughout the mitral valve anterior apparatus. (A, E, I, and M) Overview of the MMP-1 stained sections. Boxes show where subsequent magnified panel images were taken from. (B, F, J and N) Magnified images of the body of the anterior leaflet showing diffuse MMP-1 staining throughout. (C, G, K, and O) Magnified images of the chordae tendineae showing diffuse MMP-1 staining within the chordae and dense expression in the outer chordal edges. (D, H, L, and P) Magnified images showing MMP-1 staining in the cells lining the perforations in the transition zone as well as the tissue around them. (A-D) Valve in early second trimester (111 days into gestation). (E-H) Late second trimester (163 days into gestation). (I-L) Third trimester (219 days into gestation). M-P: Full term (270 days). MMP-1 positive staining is shown in brown. Cell nuclei are stained blue. Scale bar varies per image.
Figure 9.
Representative images of MMP-2 expression throughout the mitral valve anterior apparatus. (A, E, I, and M) Overview of the MMP-2 stained sections. Boxes show where subsequent magnified panel images were taken from. (B, F, J, and N) Magnified images of the body of the anterior leaflet showing diffuse MMP-2 staining throughout. (C, G, K, and O) Magnified images of the chordae tendineae showing diffuse MMP-2 staining within the chordae and dense expression in the outer chordal edges. (D, H, L, and P) Magnified images showing MMP-2 staining in the cells lining the perforations in the transition zone as well as the tissue around them. (A-D) Valve in early second trimester (111 days into gestation). (E-H) Late second trimester (163 days into gestation). (I-L) Third trimester (219 days into gestation). (M-P) Full term (270 days). MMP-2 positive staining is shown in brown. Cell nuclei are stained blue. Scale bar varies per image. Note to preserve tissue integrity, the epitope retrieval time was reduced for MMP-2 staining therefore differences in intensity cannot be interpreted as differences in the levels of MMP expression between MMP-1 and MMP-2 sections.
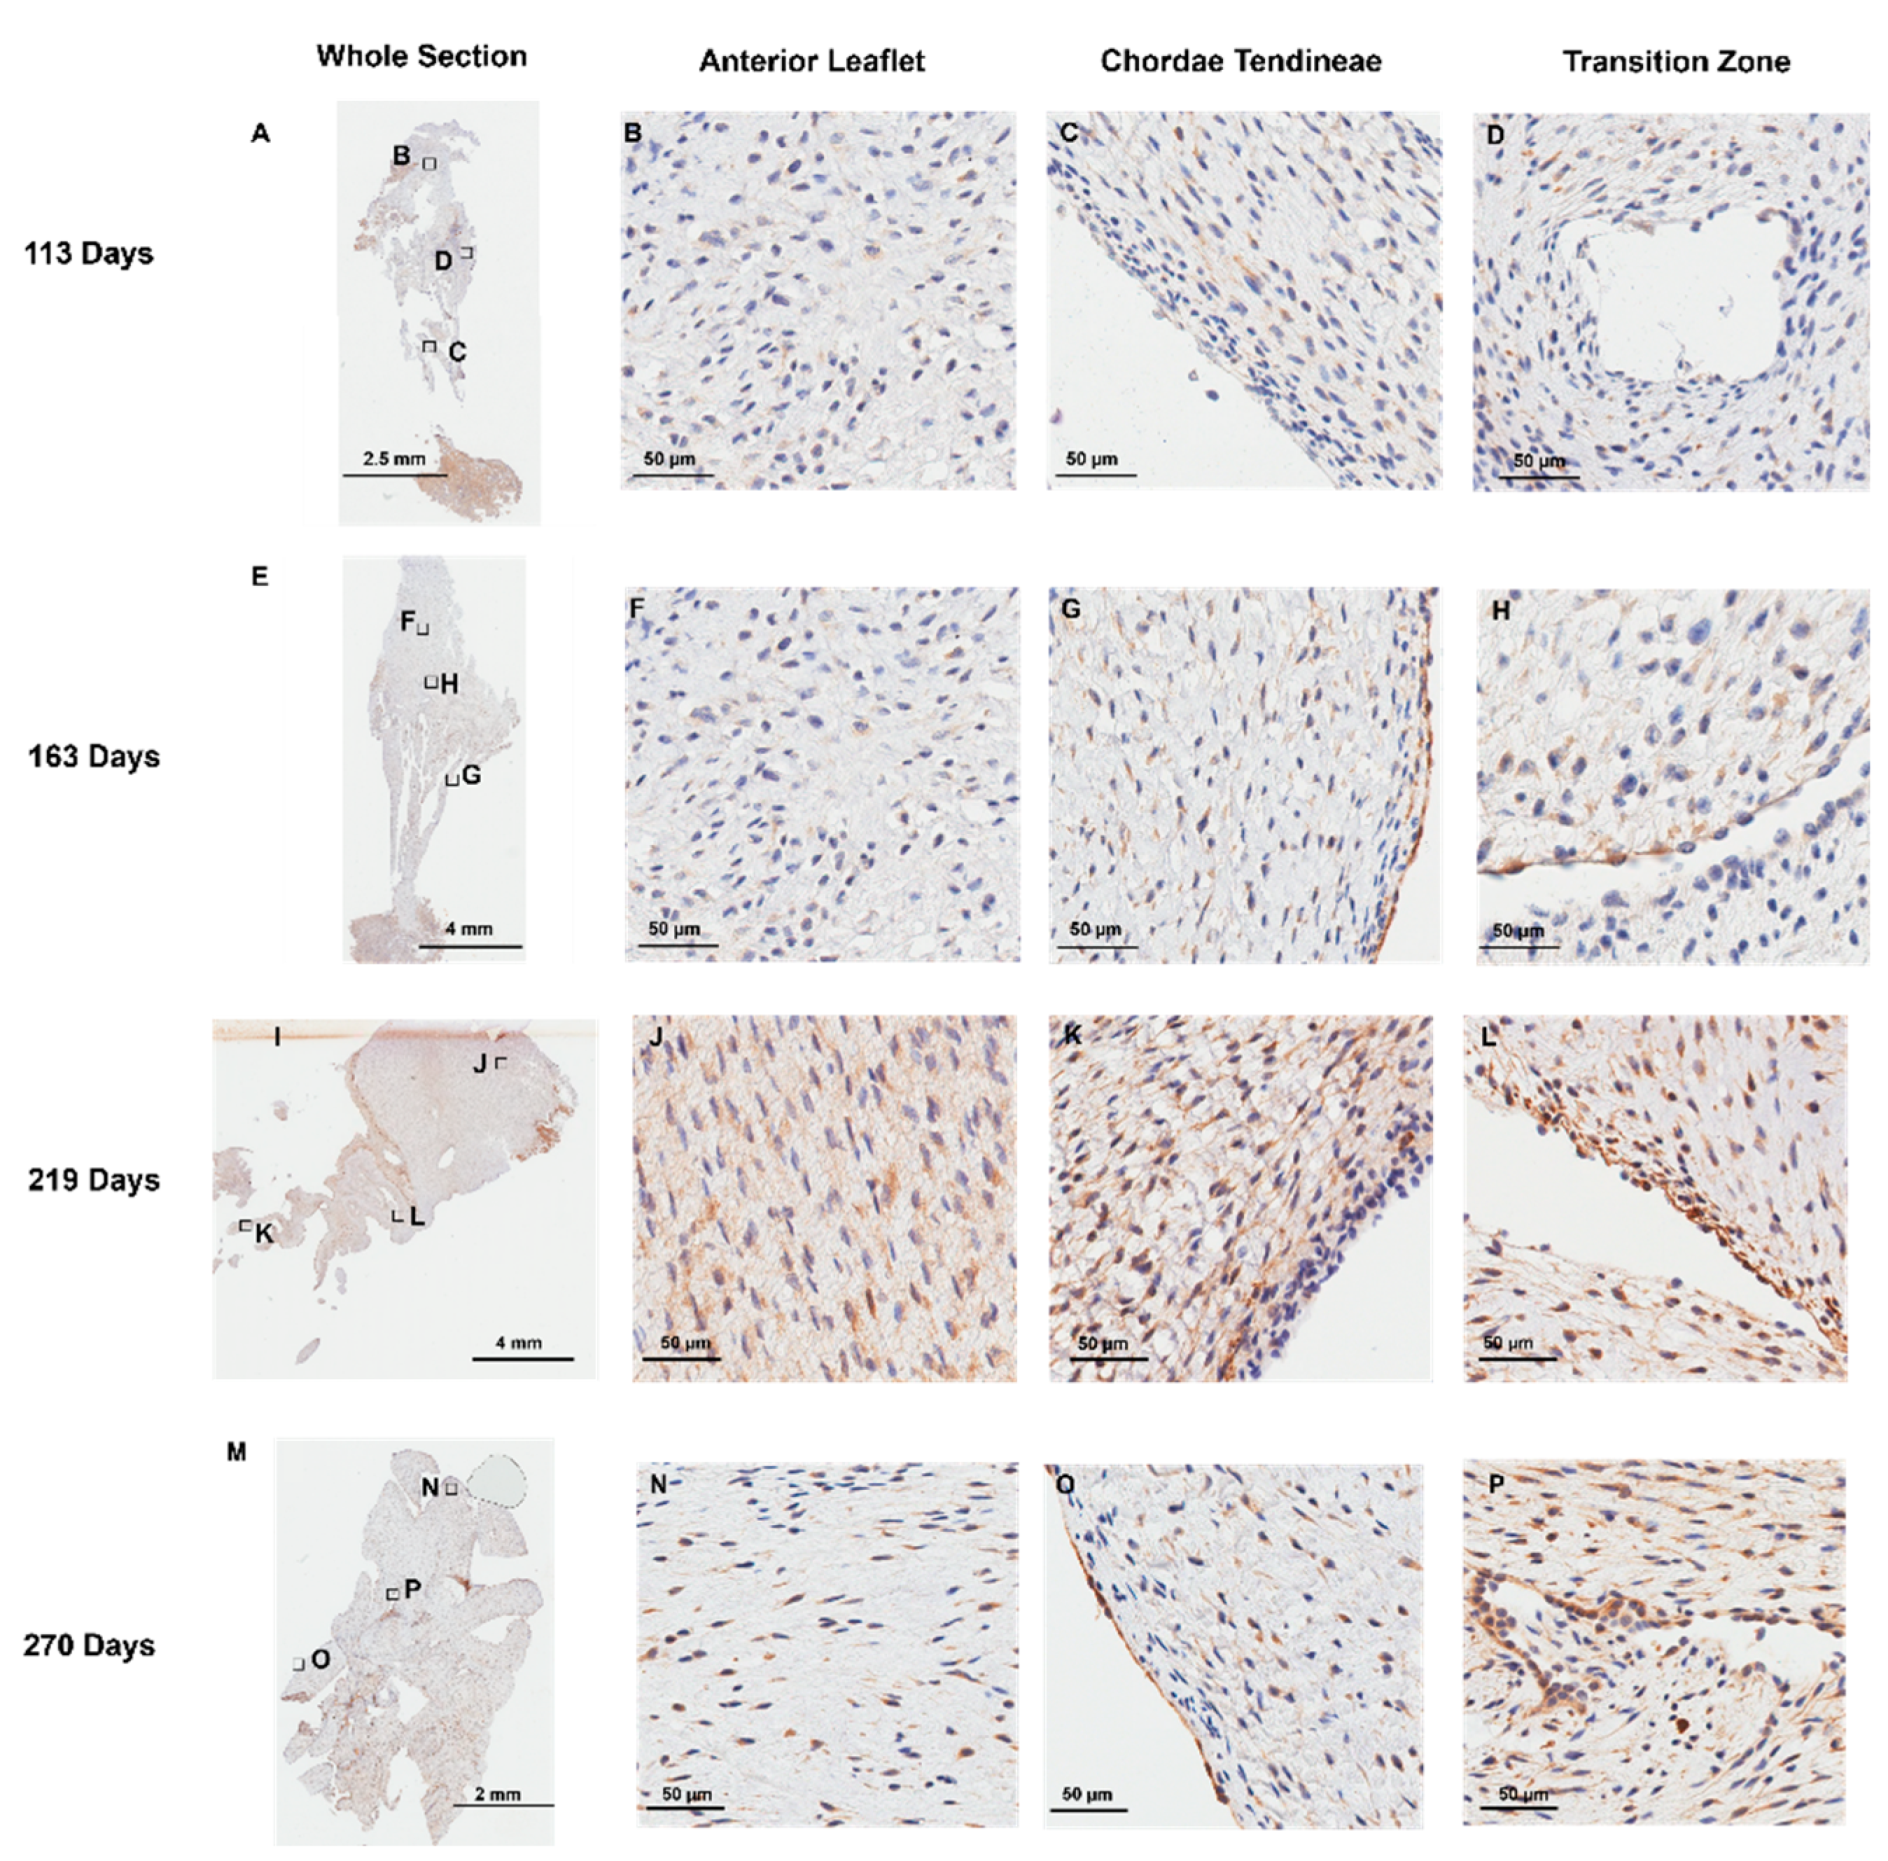
Figure 10.
Representative images of Ki-67 expression throughout the mitral valve anterior apparatus. (A, E, I, and M) Overview of the Ki-67 stained sections. Boxes show where subsequent magnified panel images were taken from. (B, F, J, and N) Magnified images of the body of the anterior leaflet showing Ki-67 positive cells. (C, G, K, and O) Magnified images of the chordae tendineae showing Ki-67 positive cells staining. (D, H, L, and P) Magnified images showing Ki-67 staining in the cells lining the perforations in the transition zone as well as in the tissue around them. (A-D): Valve in early second trimester (113 days into gestation). (E-H): Late second trimester (163 days into gestation). (I-L) Third trimester (219 days into gestation). (M-P) Full term (270 days). Ki-67 positive cells are shown in brown. Ki-67 negative cell nuclei are stained blue. Scale bar varies per image.
Figure 11.
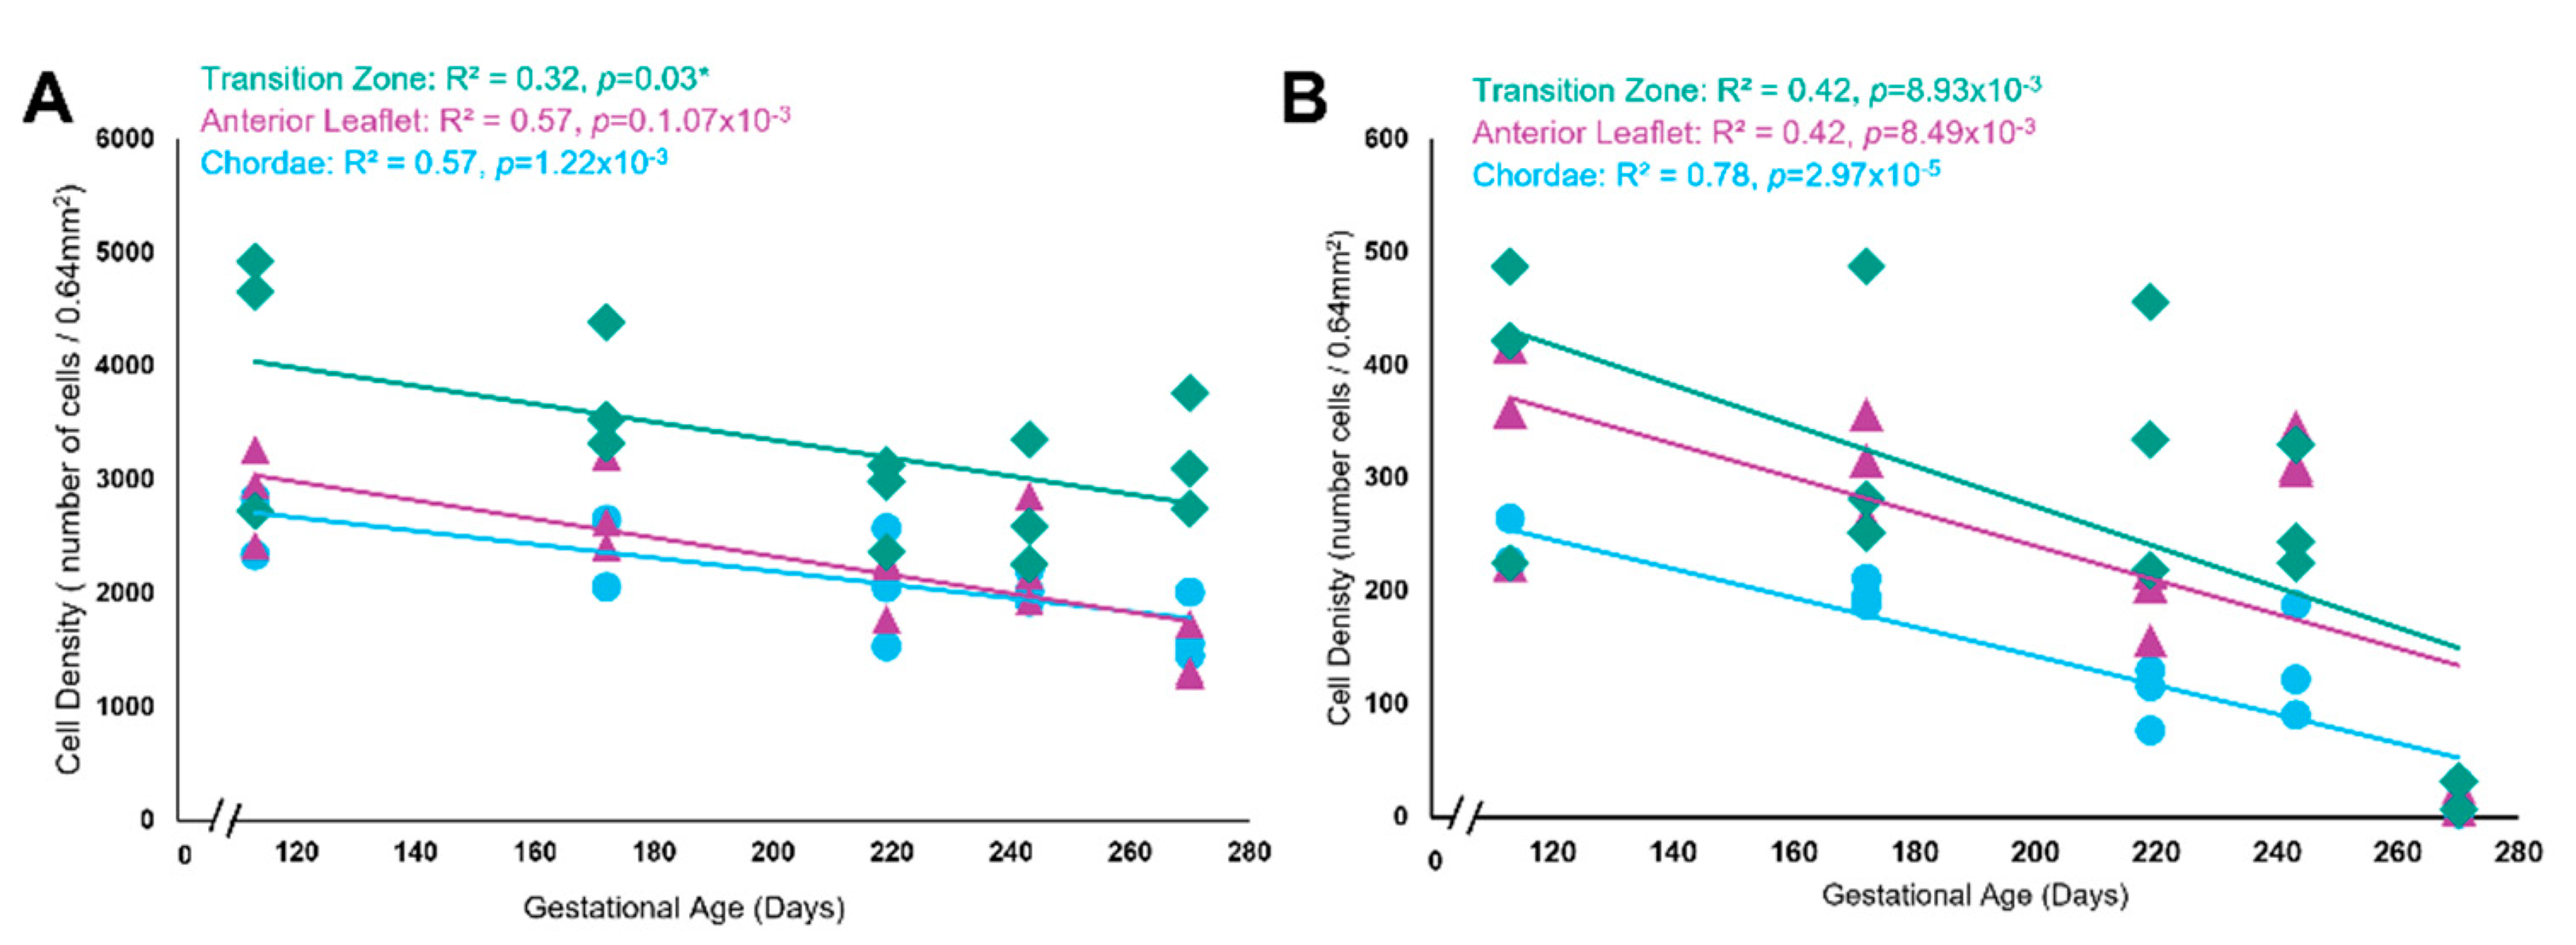
Both total cell density and total Ki-67 positive cell density decreased over time but were highest within the transition zone. (A) Total cell density (number of cells per 0.64mm2) in the anterior leaflet (purple triangles), the chordae tendineae (blue circles), and the transition zone (green diamonds) plotted as a function of gestational age, showing a significant correlation between these variables for each area. (B) Total Ki-67 positive cell density (number of cells per 0.64mm2) in the anterior leaflet (purple triangles), the chordae tendineae (blue circles), and the transition zone (green diamonds) plotted as a function of gestational age, showing a significant correlation between these variables for each area. Data is shown from five animals, from five gestational ages. For each animal, data is shown for the anterior leaflet, the transition zone, and chordae tendineae where three grids were analyzed at each region. Note the x-axis break on both graphs.
Figure 12.
Representative images of the cell clusters present within the transition zone throughout gestation. (A, E, I, and M) CD-31staining is present in cells within the clusters. (B, F, I, and N) MMP-1 staining is found within and around the cell clusters. (C, G, K, and O) MMP-2 staining is found within and around the cell clusters. (D, H, L, and P) Some cells within the clusters are positive for Ki-67 staining. (A-D) Valve in early second trimester (113 days into gestation). (E-H) Late second trimester (163 days into gestation). (I-L) Third trimester (219 days into gestation). (M-P) Full term (270 days). Positive marker staining is shown in brown. Cell nuclei are stained blue. Scale bar varies per image.
Figure 13.
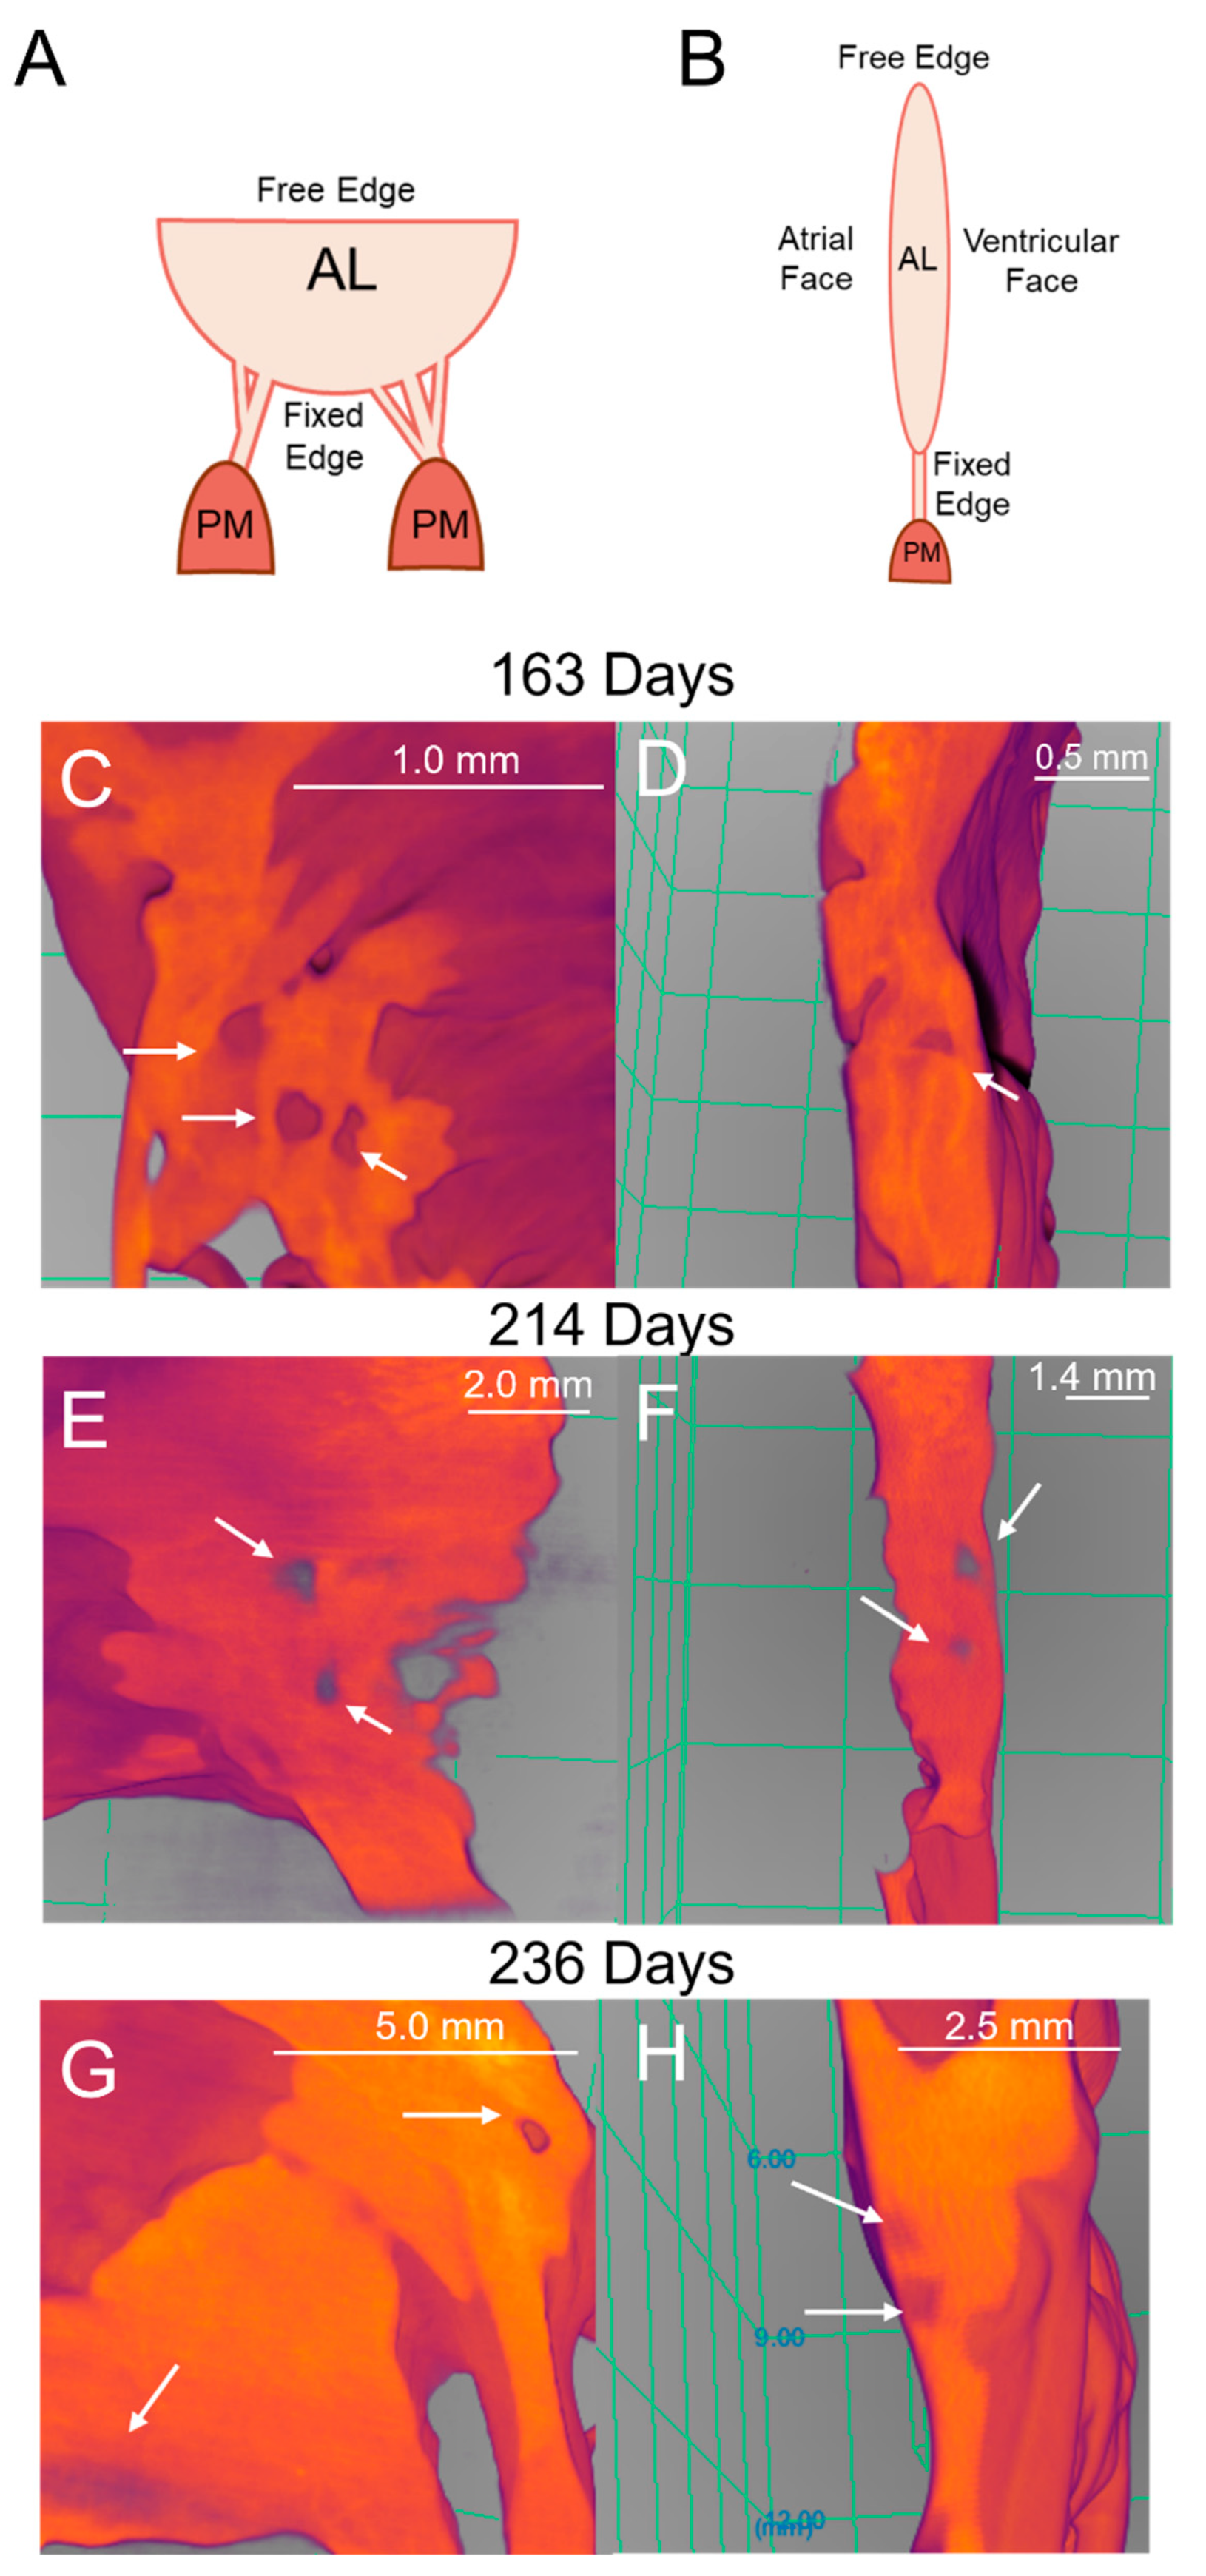
Similar perforations to those found in histology are present in micro-CT 3D renderings of the fetal mitral valve. (A) Diagram representing the orientation of the mitral valve in panels C, E and G where the view is of the ventricular face. (B) Diagram representing the orientation of the mitral valve in panels D, F and H where it is a side view of the mitral valve. (C and D) Late second trimester (163 days into gestation) ventricular view (C) and side view (D). (E and F) Third trimester (214 days into gestation) ventricular view (E) and side view (F). (G and H) Later third trimester (236 days into gestation) ventricular view (G) and side view (H). White arrows denote perforations, seen as distinct circular disruptions in the structure. Image colour is related to optical density where bright orange is denser tissue. Scale bar varies per image.
Figure 14.
Observed perforations possess similar dimensions between both imaging modalities. MANOVA analysis revealed that there was no difference in perforation dimensions. (A) Longest orthogonal length (B) Shortest orthogonal length. Each point represents n=1 perforation. The total sample size was n= 44 for micro-CT and n=56 for histology.
Figure 15.
Representative transmission electron microscopy images of the trunk (A-E) and branch chordae (F-I) over gestation. (A) First trimester (68 days into gestation), no discernable branches were apparent. (B and F) Early second trimester (97 days into gestation). (C and G) Mid second trimester (146 days into gestation). D and H: Early third trimester (204 days into gestation). (E and I) Full term (270 days into gestation). All images were taken at 50 000x magnification. Scale bar represents 200nm.
Figure 16.
Collagen fibril diameters increase over gestation with distributions alternating between unimodal and bimodal distributions in both the trunk and branch chordae. Collagen fibril diameters (in nm) are plotted as a histogram and binned by both gestational age in days as well as location (trunk in pink, branches in blue). Note at 68 days there were no discernable branch chordae so only the trunk is shown.
Figure 17.
The trunk and branch chordae exhibit similar increases in the collagen fibril diameter and FWHM with a constant collagen fibril density over gestation. (A) Mode diameter of the trunk (pink circles) and branches (blue circles) in nm plotted as a function of gestational age. (B) FWHM of the trunk (pink circles) and branches (blue circles) in nm plotted as a function of gestational age. There was no difference in the rate of increase between branches and trunk as measured by ANCOVA. (C) Violin plot of fibril density (number of fibrils per mm2) versus gestational age in days for either the trunk (pink) or branches (blue).
Figure 18.
Schematic depicting the stages of perforation development that splits a single attachment into two. (A) Perforations created by endothelial cell clusters possess an internal lining of endothelial cells (brown ovals with blue nuclei) that express MMP-1 (pink circles) and MMP-2 (green circles). Shorter collagen fibers (yellow) and elastic fiber fragments (purple) are found surrounding the perforation. (B) Collagen and elastic fibers begin to align in parallel with the chordae axis. (C) The cellular activity splits the single chordal attachment site into two, with collagen and elastic fibers aligning in parallel with the chordal axis. (D) The split continues to propagate longitudinally creating two new chordal branches.
Figure 19.
Schematic depicting the stages of chordae tendineae formation over gestation. (A) In the post-fusion endocardial cushion (EC), the area that will form the first chordal tendon is specified towards the papillary muscle connection. (B) After cushion remodelling the primordial anterior leaflet (PAL) possesses a more semi-lunar shape and the primordial chordae (PC) is a thin section of tissue connected to the PAL and the papillary muscle. (C) Sometime before 60 days in bovines (before ~ 70 days in humans) the PC has been remodelled into the first chordal tendons while the anterior leaflet (AL) remains connected to the underlying myocardium (M). (D) The ventricular face view at the same time point showing the first two chordae with perforations forming at their attachment points. (E) The side view at the same timepoint showing the perforation. (F) The first bifurcation appears at approximately 60 days in bovines (sometime before 98 days in humans) as the anterior leaflet has begun to delaminate from the underlying myocardium. (G) The ventricular face view at the same timepoint showing the first initial branches and subsequent perforation formation to further bifurcate the new branches. (H) The side view at the same time point showing subsequent perforation formation. (I-J) The initiated split from the perforations will continue to propagate longitudinally down the trunk toward the papillary muscle (PM). (K) The end result of fetal development is a fan-like network of attachments into the leaflet.
