1. Introduction
From many decades cobalt, nickel and iron are the most common elements for serving as base for superalloys [
1,
2]. The two first cited ones are more and more considered as critical or strategic [
3,
4] Decreasing their contents in a superalloy, by a limited replacement by elements such as iron and manganese, may be a solution to become less dependent on Co and Ni. Such change in the chemical composition, in presence of chromium to combat both hot oxidation and corrosion [
5,
6], may lead to the composition principle of the Cantor’s alloy [
7]. This equimolar Co-Ni-Fe-Mn-Cr alloy belongs to a family of quinary alloys [
8,
9,
10] which is one of the most known High Entropy Alloys (HEA) systems [
11]. The HEAs conceived on the Co-Ni-Fe-Mn-Cr system attract great attention by their interesting properties at cryogenic to moderate temperatures, but the observations reported concerning their behavior at temperatures up to 1000°C are seemingly inexistent till today. However one may mention recent successful attempts to improve high temperature strength by adding MC eutectic carbides to a equimolar base [
12]. In addition the behavior in oxidation of these MC–reinforced Cantor’s alloys at 1000°C and beyond was explored [
13]: this revealed severe problems of oxidation resistance at so high temperatures, attributed to particular roles of chromium and manganese together. Indeed, despite the presence of about 25 at.%Cr, the tested alloys, with or without MC carbides, oxidized rapidly and many kinds of oxides – involving principally Mn and Cr in various proportions and sometimes the other elements too – formed externally.
In order to observe how these oxides formed a series of samples of Cantor’s alloy (equimolar in Co, Ni, Fe, Mn and Cr) were exposed to air at 1000°C for several durations (up to 62 hours) and lead to better understand the successive steps of oxidation progress [
14]. In the present work, attention is focused on a Mn–impoverished Cr–enriched version of this quinary alloy for which a significantly improved oxidation resistance was recently revealed by thermogravimetry tests followed by post–mortem characterization [
15]. The oxidation products formed around these samples were different by comparison with the equimolar version but again constituted of various types of oxides. The aim of the present work is to proceed to oxidation of this CoNiFeMn
0.5Cr
1.5 alloy for several durations at 1000°C in order to observe the progression of oxidation by analyzing step by step the development of the complex oxide scale.
2. Materials and Methods
A 40g–weighing ingot was first synthesized by fusion using high frequency induction (50kW CELES furnace, operating parameters: 100 kHz, 3 to 5 A, up to 5 kV) in a pure Argon atmosphere. The initial charge contained small balls, flakes or rods of pure Co, Ni, Fe, Mn and Cr (Alfa Aesar, purity > 99.9%). The obtained chemical compositions were controlled on specimen especially prepared by cutting, embedding and polishing, using a JEOL 6010LA scanning electron microscope (SEM) and its energy dispersion spectrometer (EDS). A series of parallelepipeds, obtained by cutting, were ground using #1200–grit SiC papers. Their edges and corners were smoothed, with the same papers, for avoiding possible local overoxidation. After accurate measurement of their dimensions using a caliper (precision: +/-0.01mm) and after weighing with a micro–balance (precision: +/- 0.1 mg) each sample was placed in a nacelle (made of a refractory inert material) which was introduced in the hottest zone of a tubular resistive furnace (Carbolite).
After a 1.5h, 3h, 6h, 9h, 15h, 24h or 62h the nacelle was promptly removed from the furnace. After natural cooling down to ambient temperature, the oxidized alloy was carefully handled for the next operations. After a second weighing with the micro-balance, the oxidized sample was observed with the SEM (secondary electrons mode, SE and back scattered electrons modes, BSE) as well as subjected to EDS spot analysis and elemental mapping. Later, it was embedded in a resin rigidifying at ambient temperature, then transversally cut and grinded/polished. The obtained mirror–like cross–section allowed observing the external and internal oxides and performing EDS spot analyses and elemental mapping on oxides and in subsurface.
3. Results and discussion
3.1. Characteristics of the alloy subject of the study
After solidification and cooling down to laboratory temperature, a part of the ingot was metallographically prepared and characterized using the SEM and its EDS spectrometer. The alloy is obviously single–phased. Its chemical composition, as determined by several EDS full frame analysis, is close to the targeted one (
Table 1).
3.2. Mass evolution with time
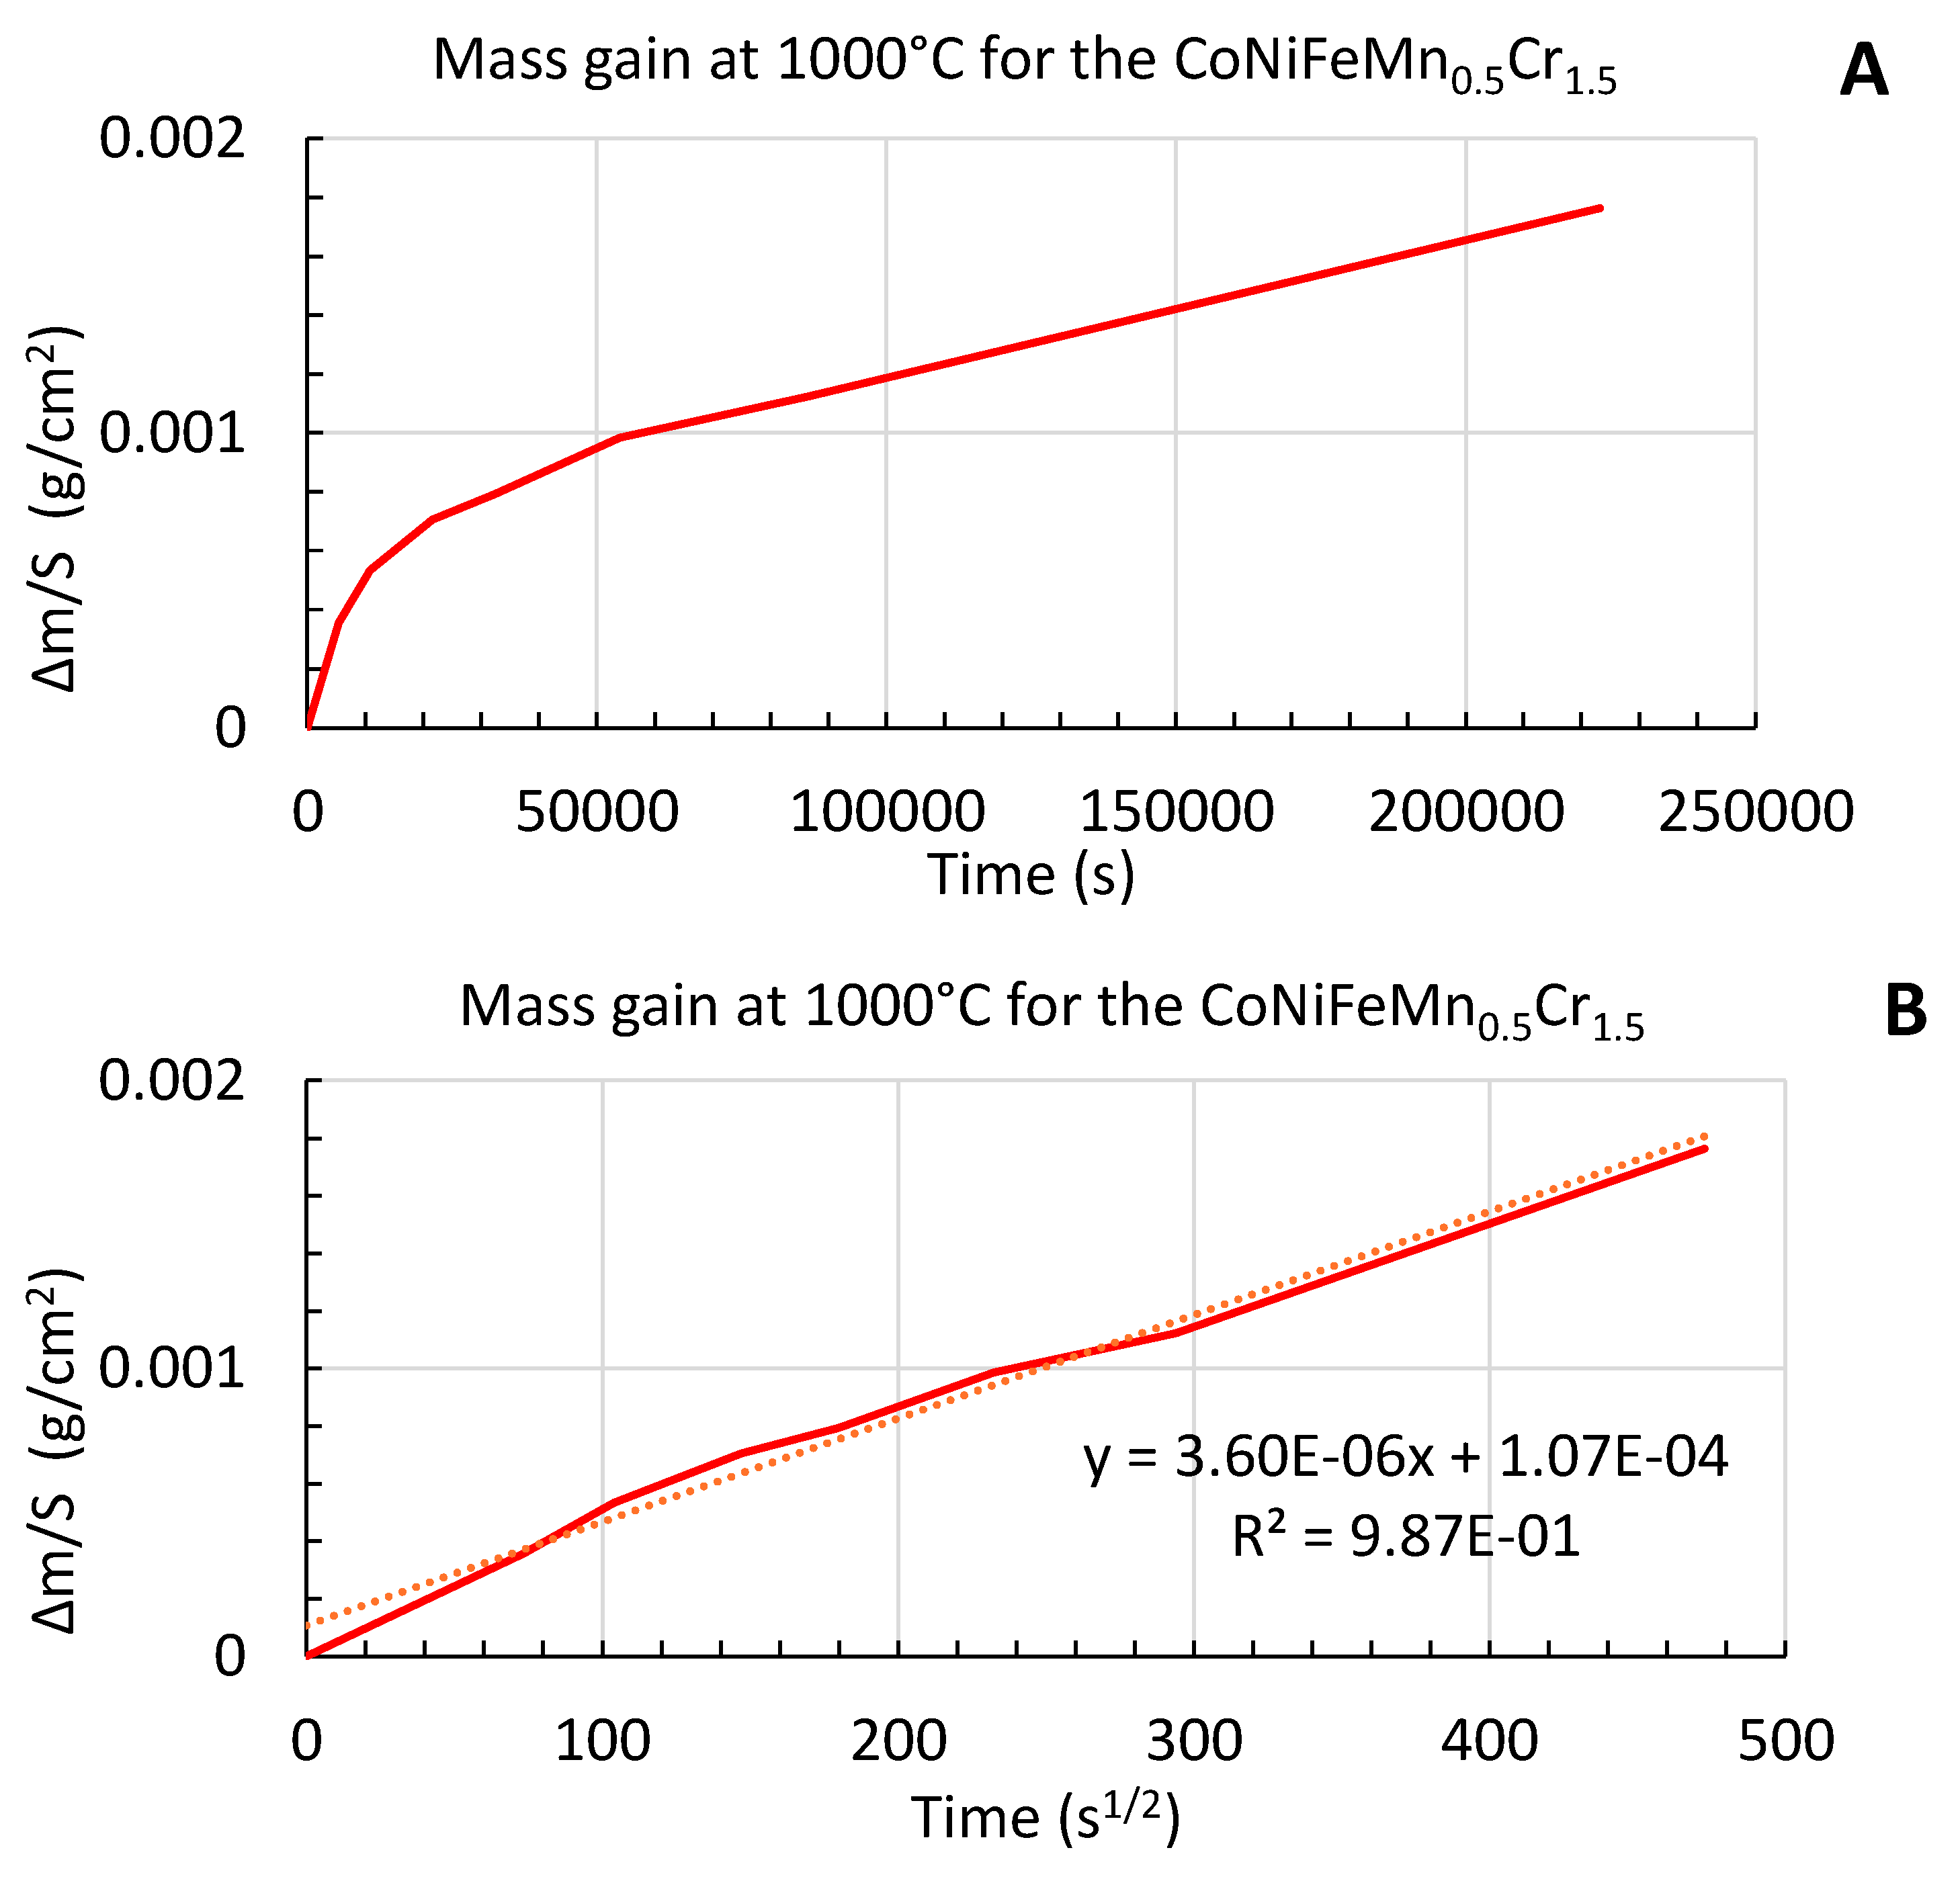
All samples were accurately weighed before and after exposure to hot air, this allowing quantifying the mass gain due to oxidation. The seven results (corresponding to 1.5h; 3h … and 62h) allow plotting, versus time and versus the square root of time, the progress in mass gain (
Figure 1); the mass gain appears as being parabolic (top) and the slope of the rather straight line obtained when plotting versus the square root of time (bottom) leads to a kinetic parabolic constant 6.5 × 10
-12 g
2 cm
-4 s
-1.
3.3. General appearance of the oxidized surfaces
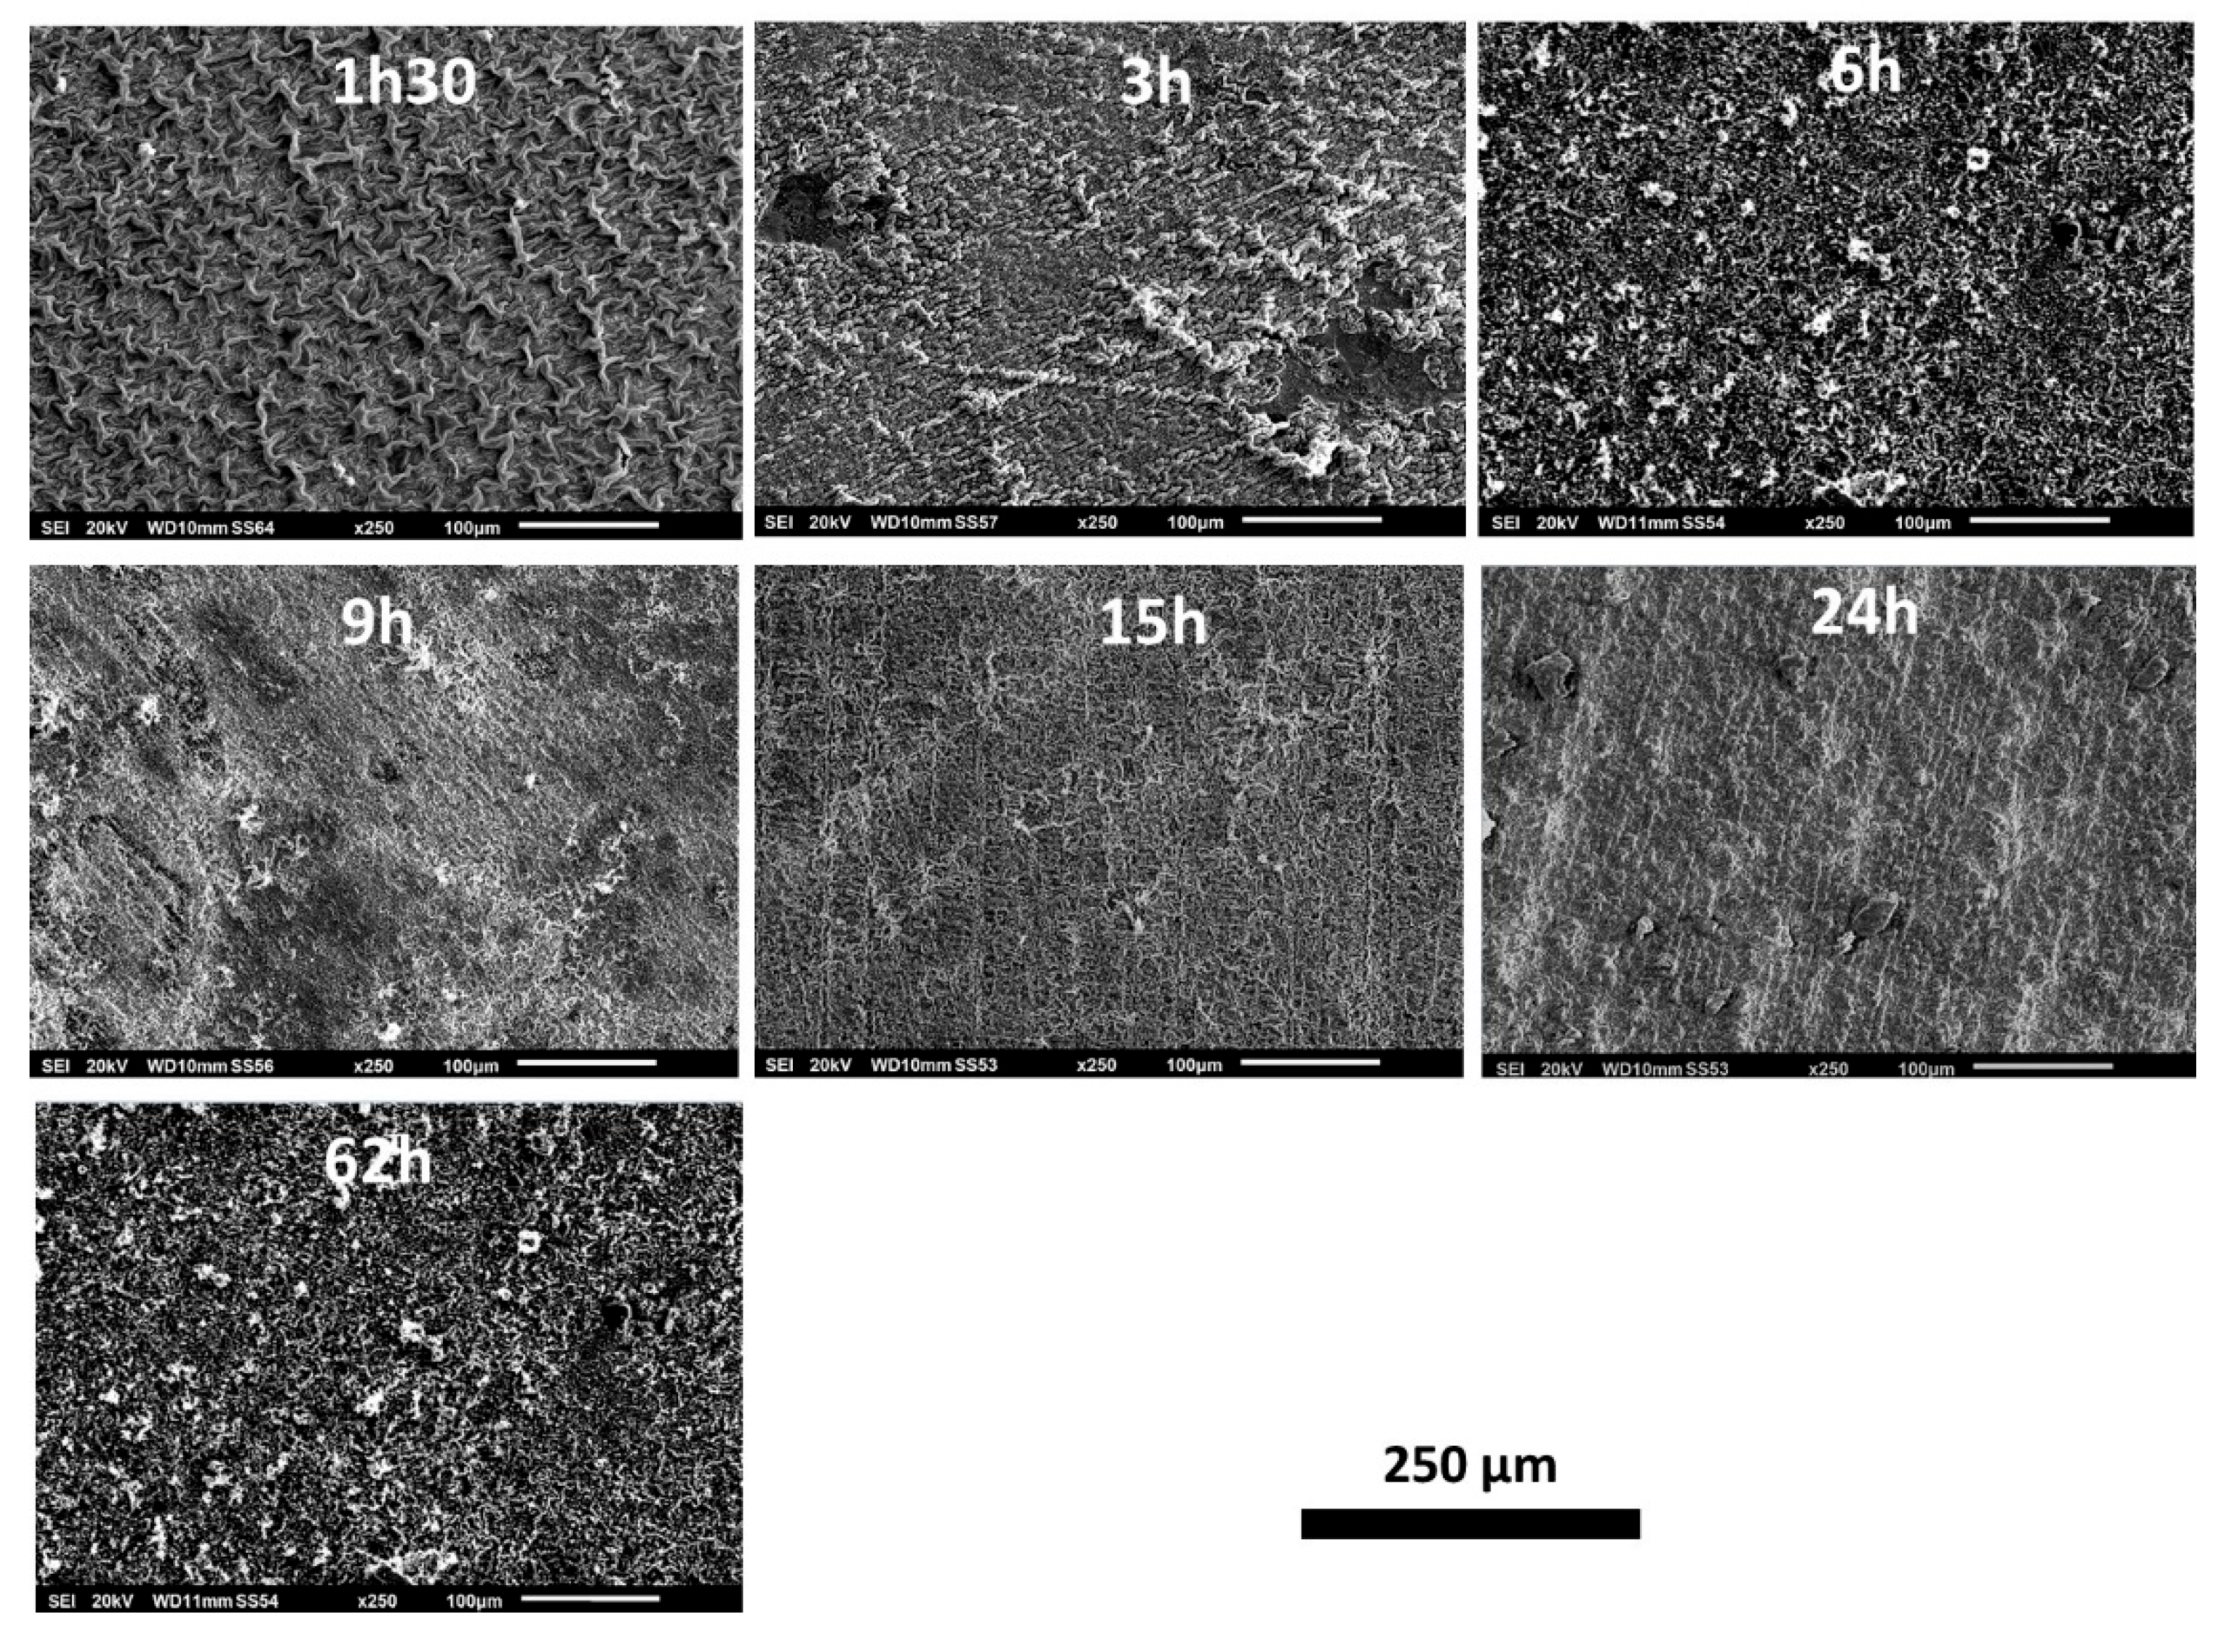
The outermost surfaces of the external oxide scales were examined and analyzed prior to cross–sectional metallographic preparation. The low magnification observation using the SEM in SE mode (
Figure 2) allows seeing how the morphology of the outermost oxide evolves with time at 1000°C. After only 1h30 of exposure the alloy is wholly covered by oxides. The scale is composed of coarse oxides appearing as filaments in relief over a more fine oxide structure. The double population of outermost coarse oxides and inner fine oxides is still present after 3h of exposure, the coarse oxides appearing less numerous and more coalesced. Later (15h) the external roughness of the scale is uniformly fine before new coarse oxides appear (24h, 62h).
3.4. Average composition of the external scales
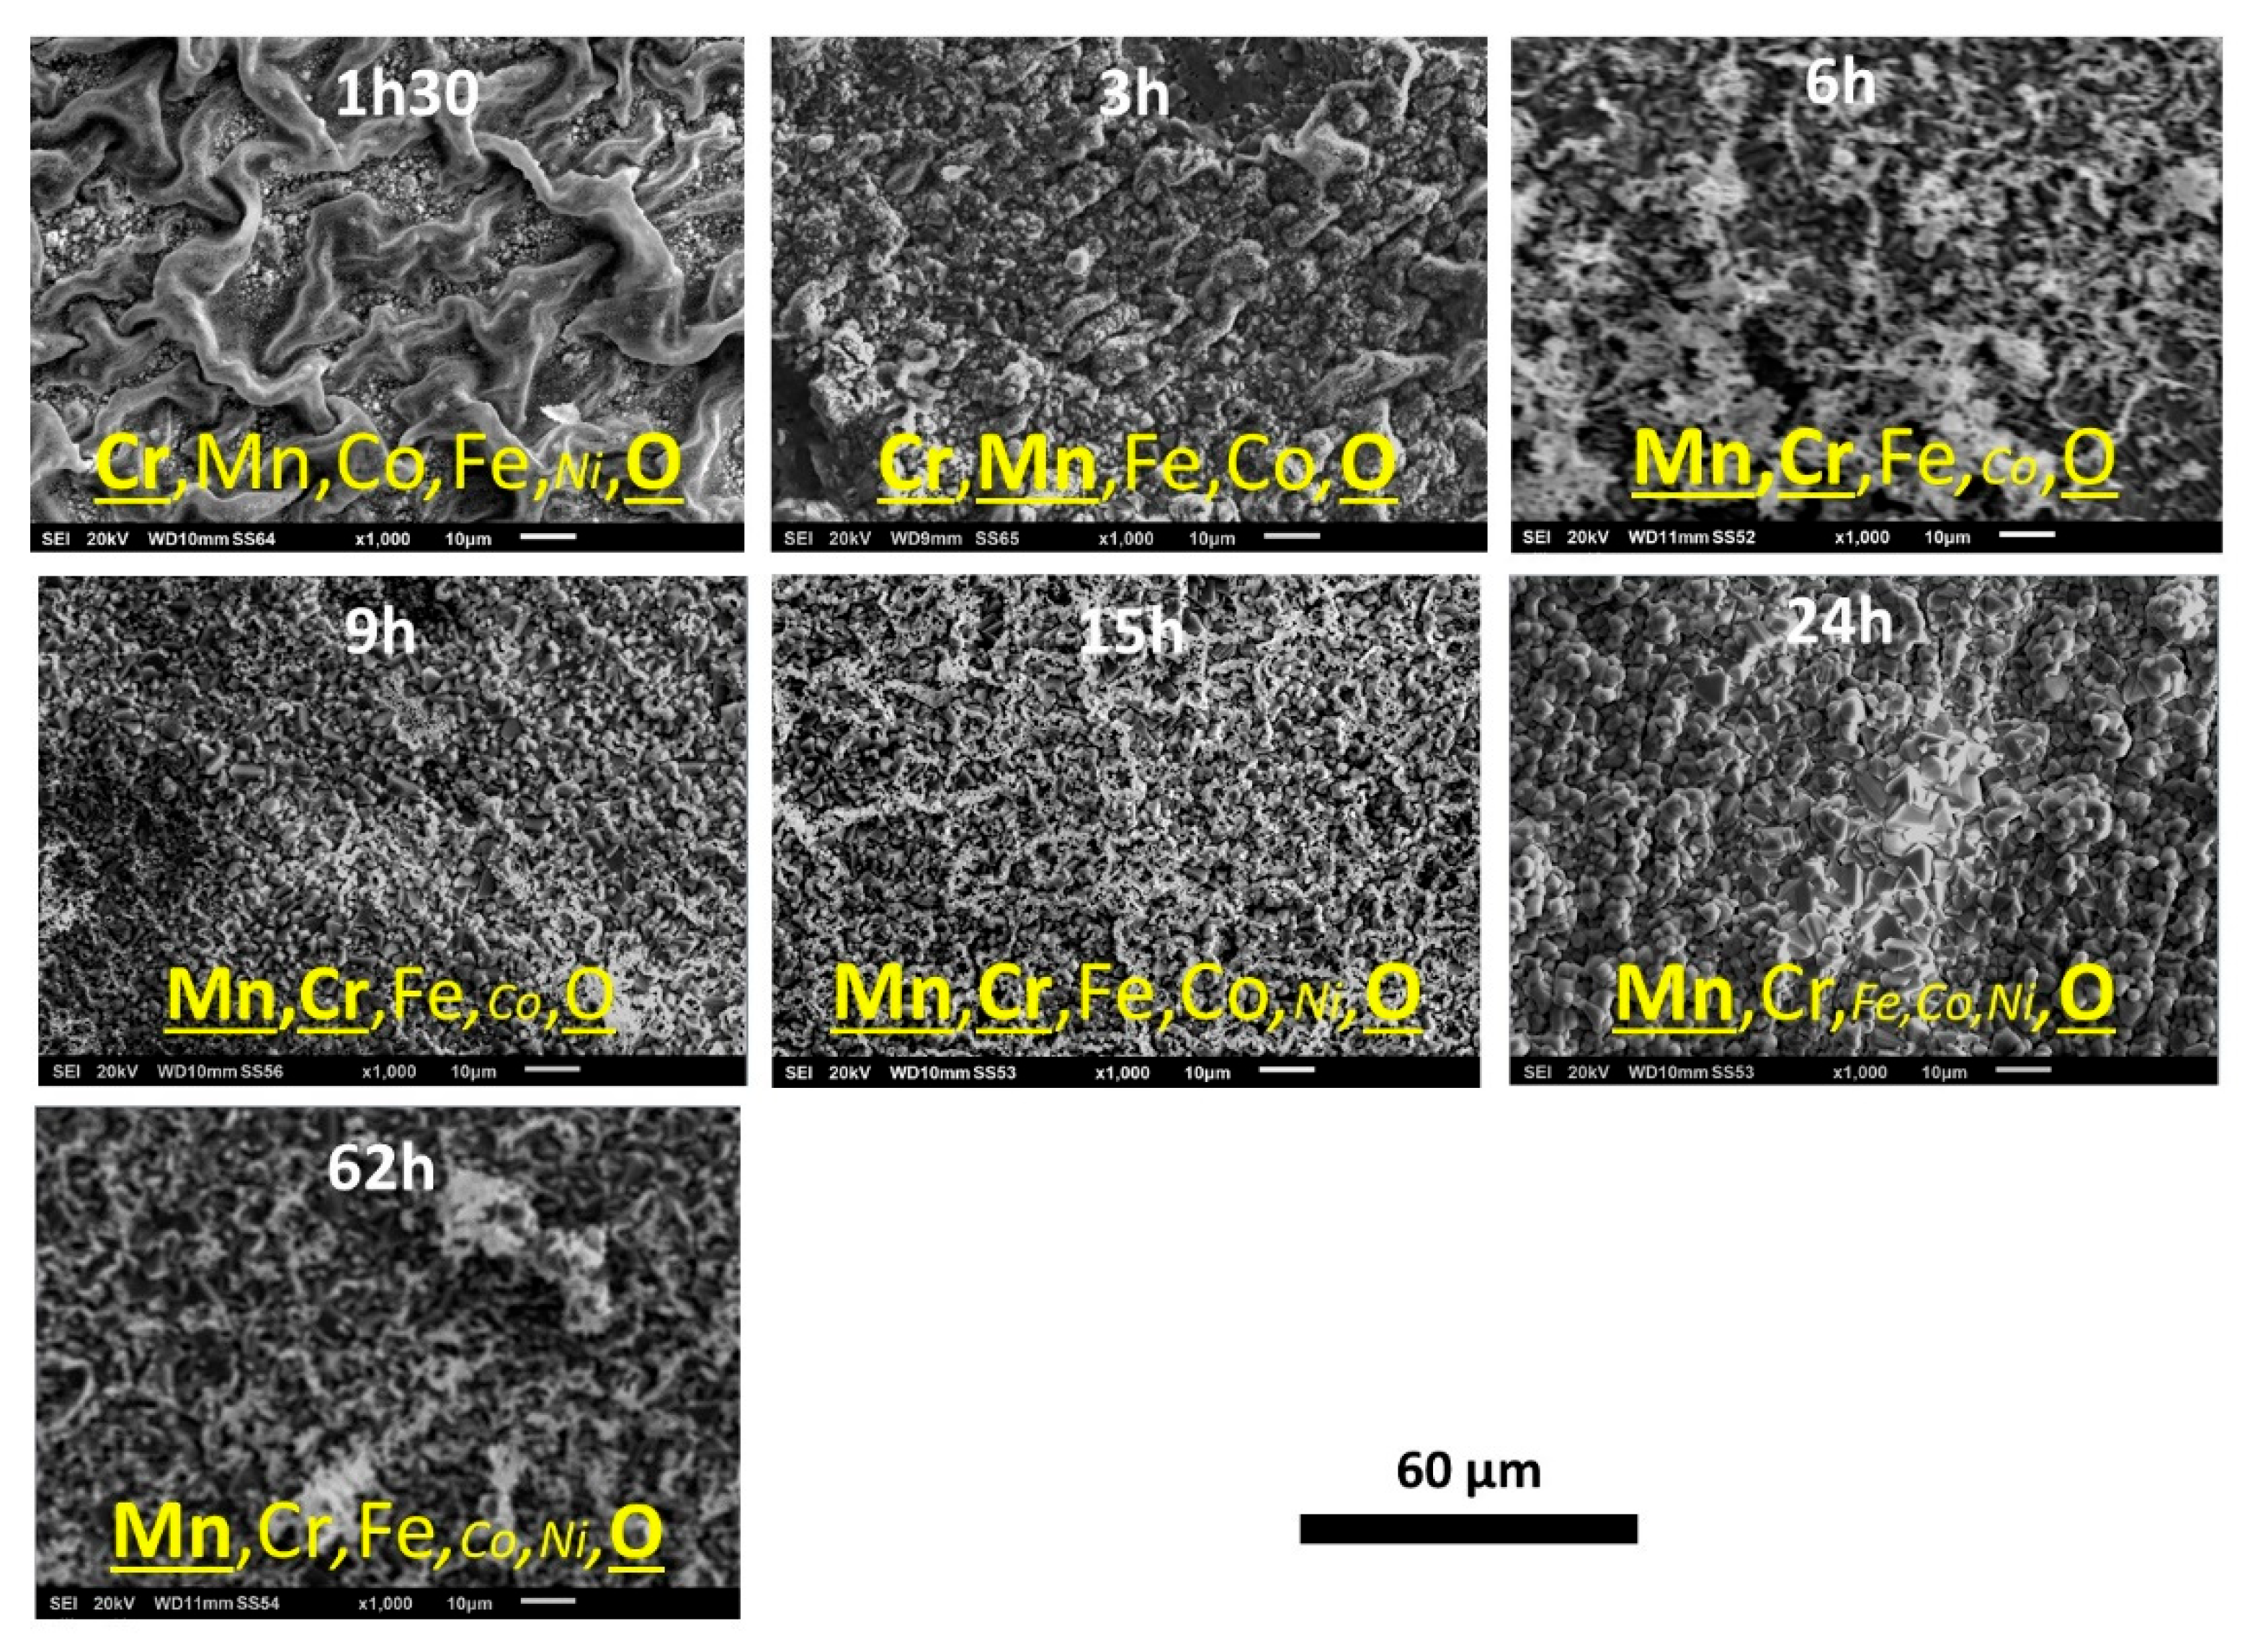
The outermost average compositions of the oxide scale assessed by EDS full frame analysis at ×1000 magnification (
Figure 3) suggests that the external oxides are complex, involving all the elements present in the alloy. Chromium is the main for 1h30, but Mn reaches the same level of importance as Cr (3h to 15h). For longer durations (24h and 62h) Mn becomes the most present oxidized metal. After Mn and Cr, one must notice that Fe and Co are also concerned by oxidation, for all times.
3.5. Elemental distribution on the outermost face of the oxide scale
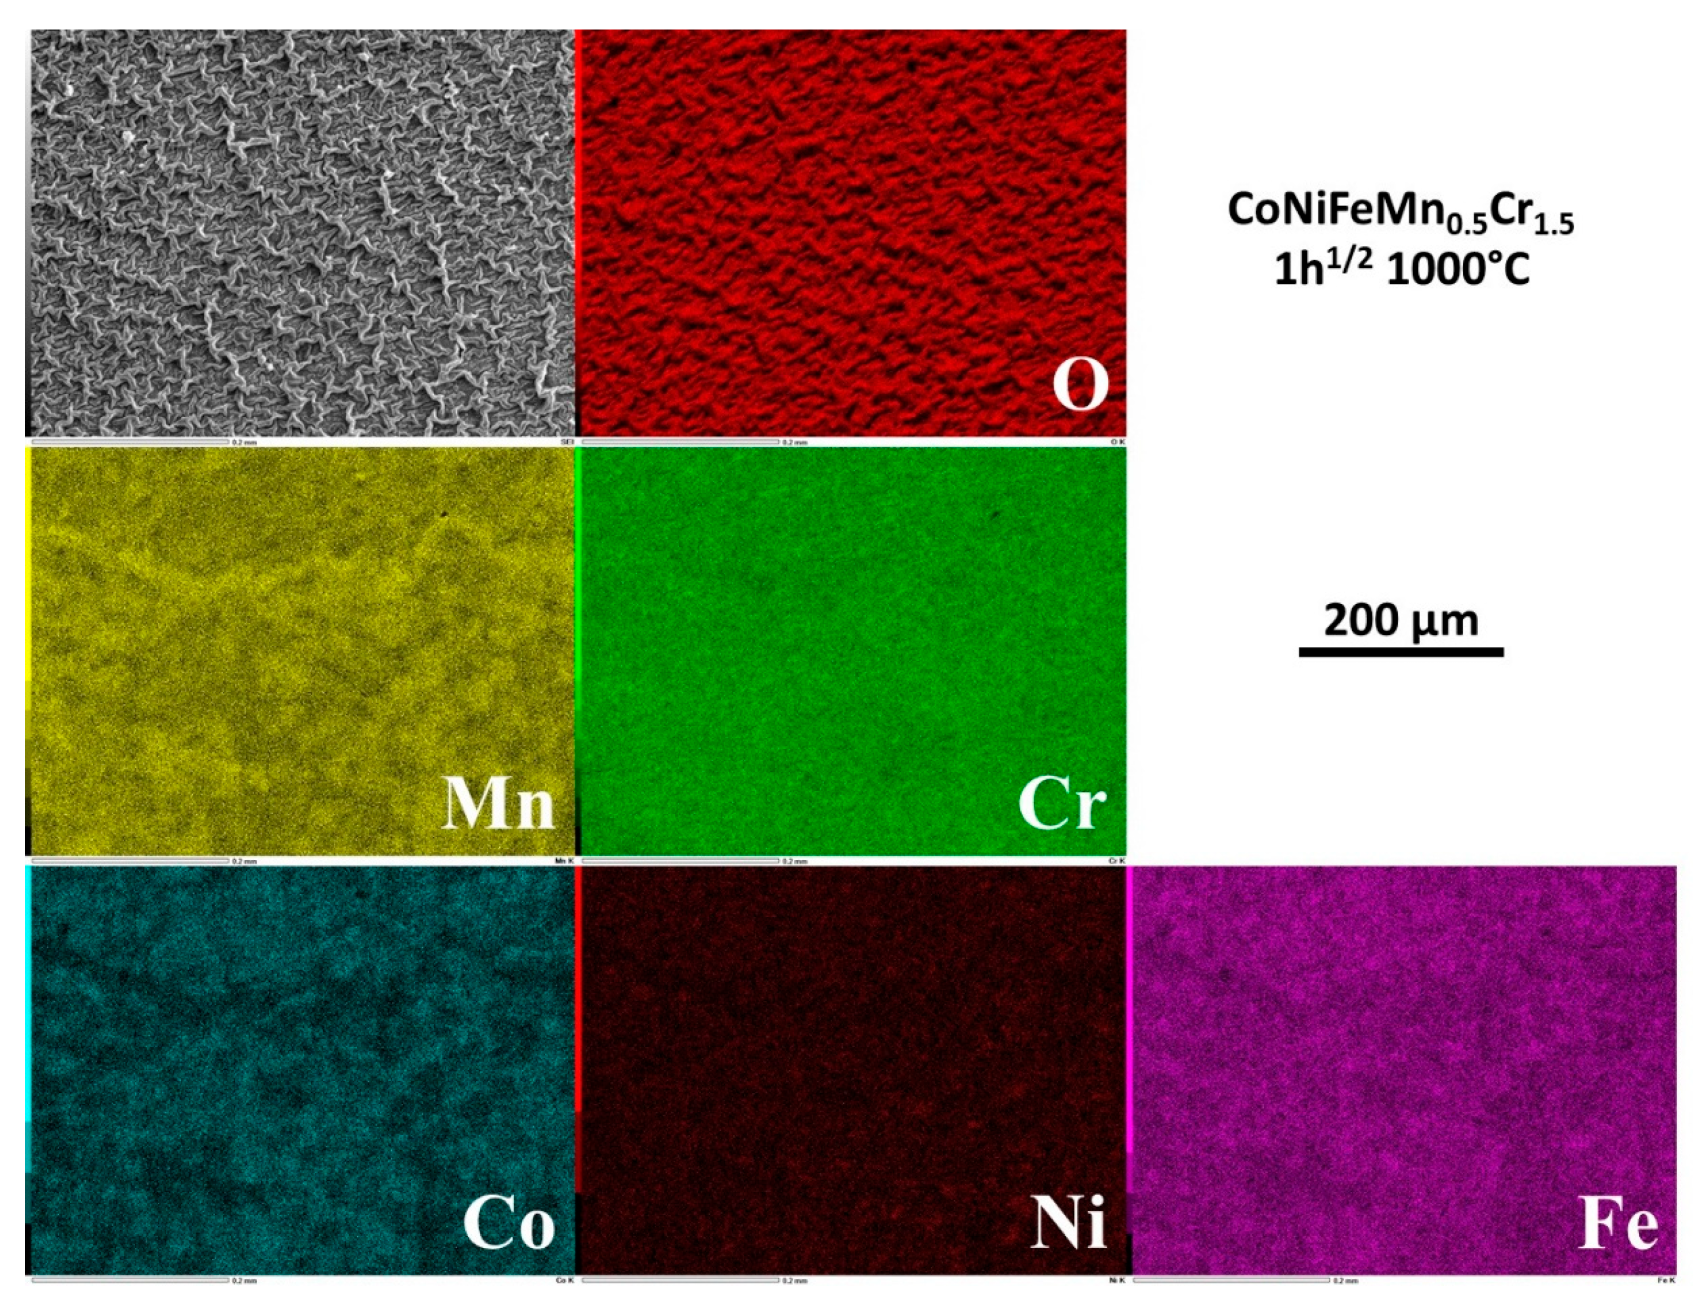
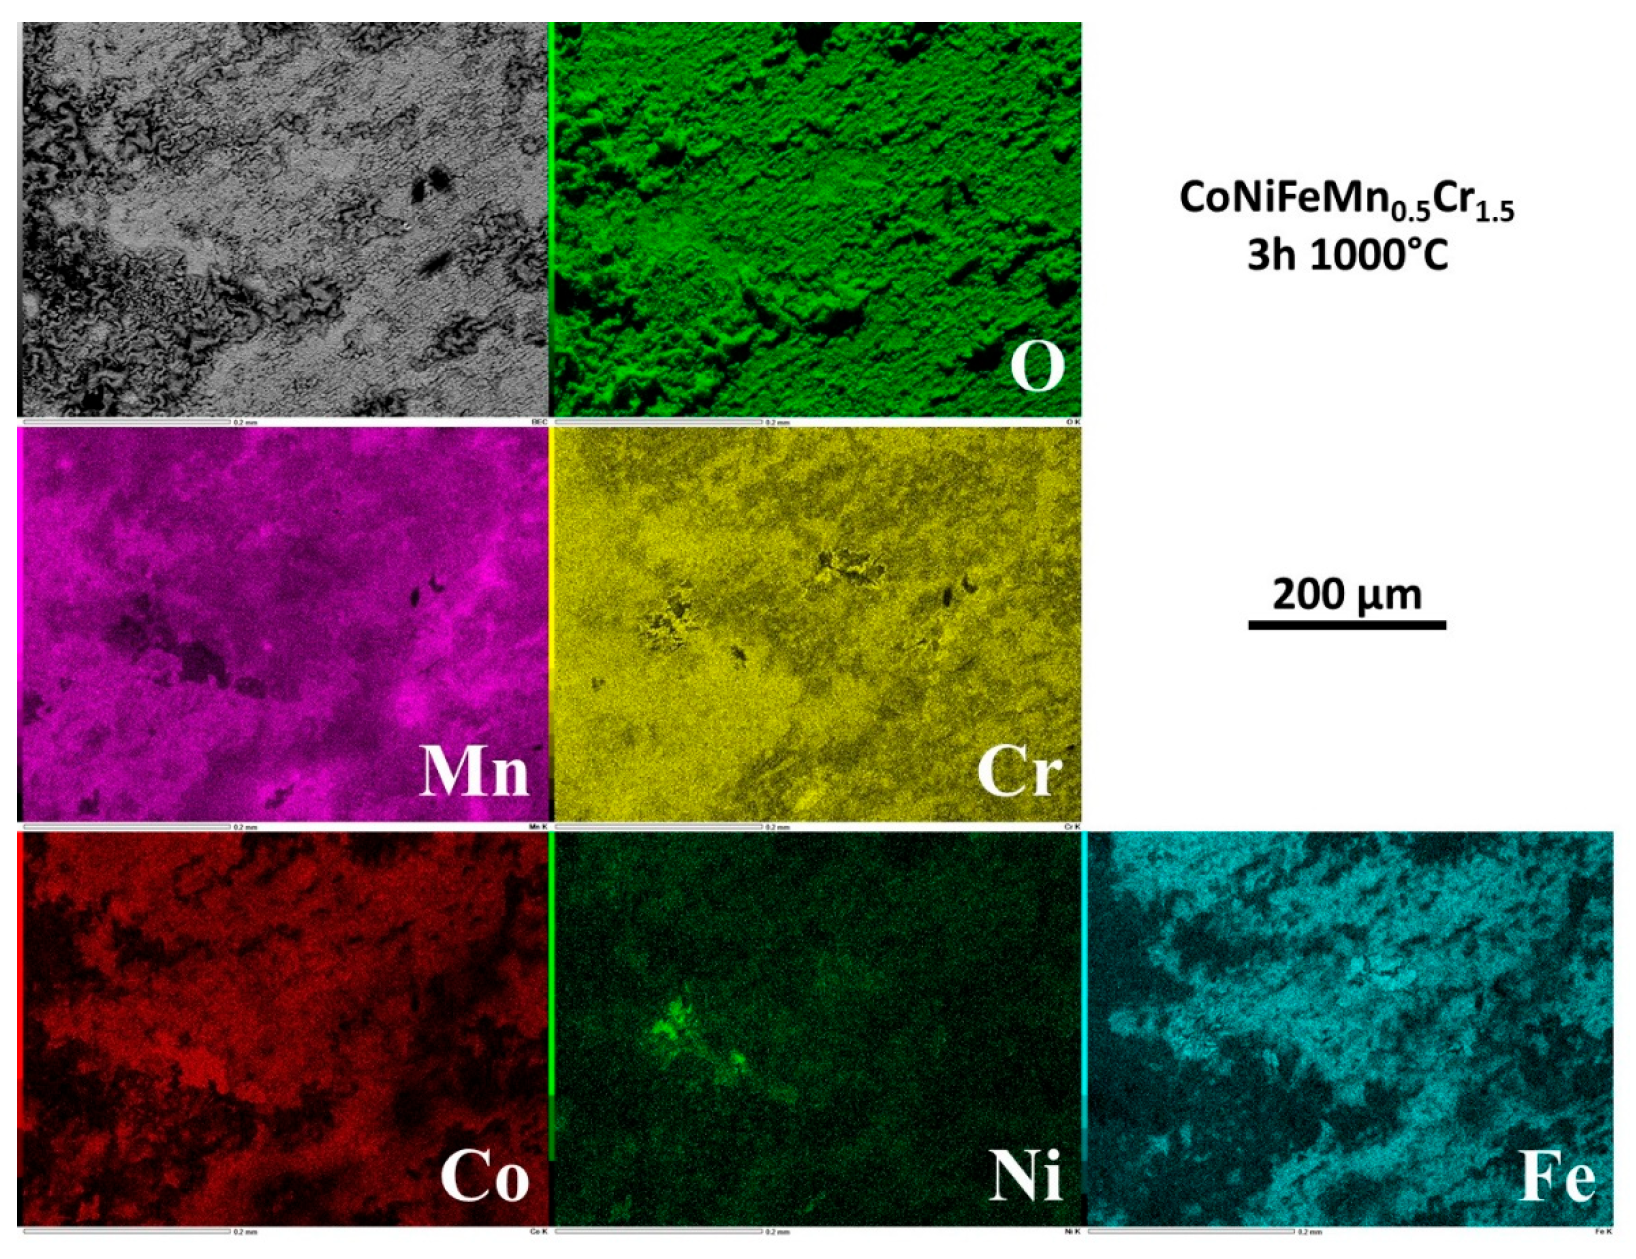
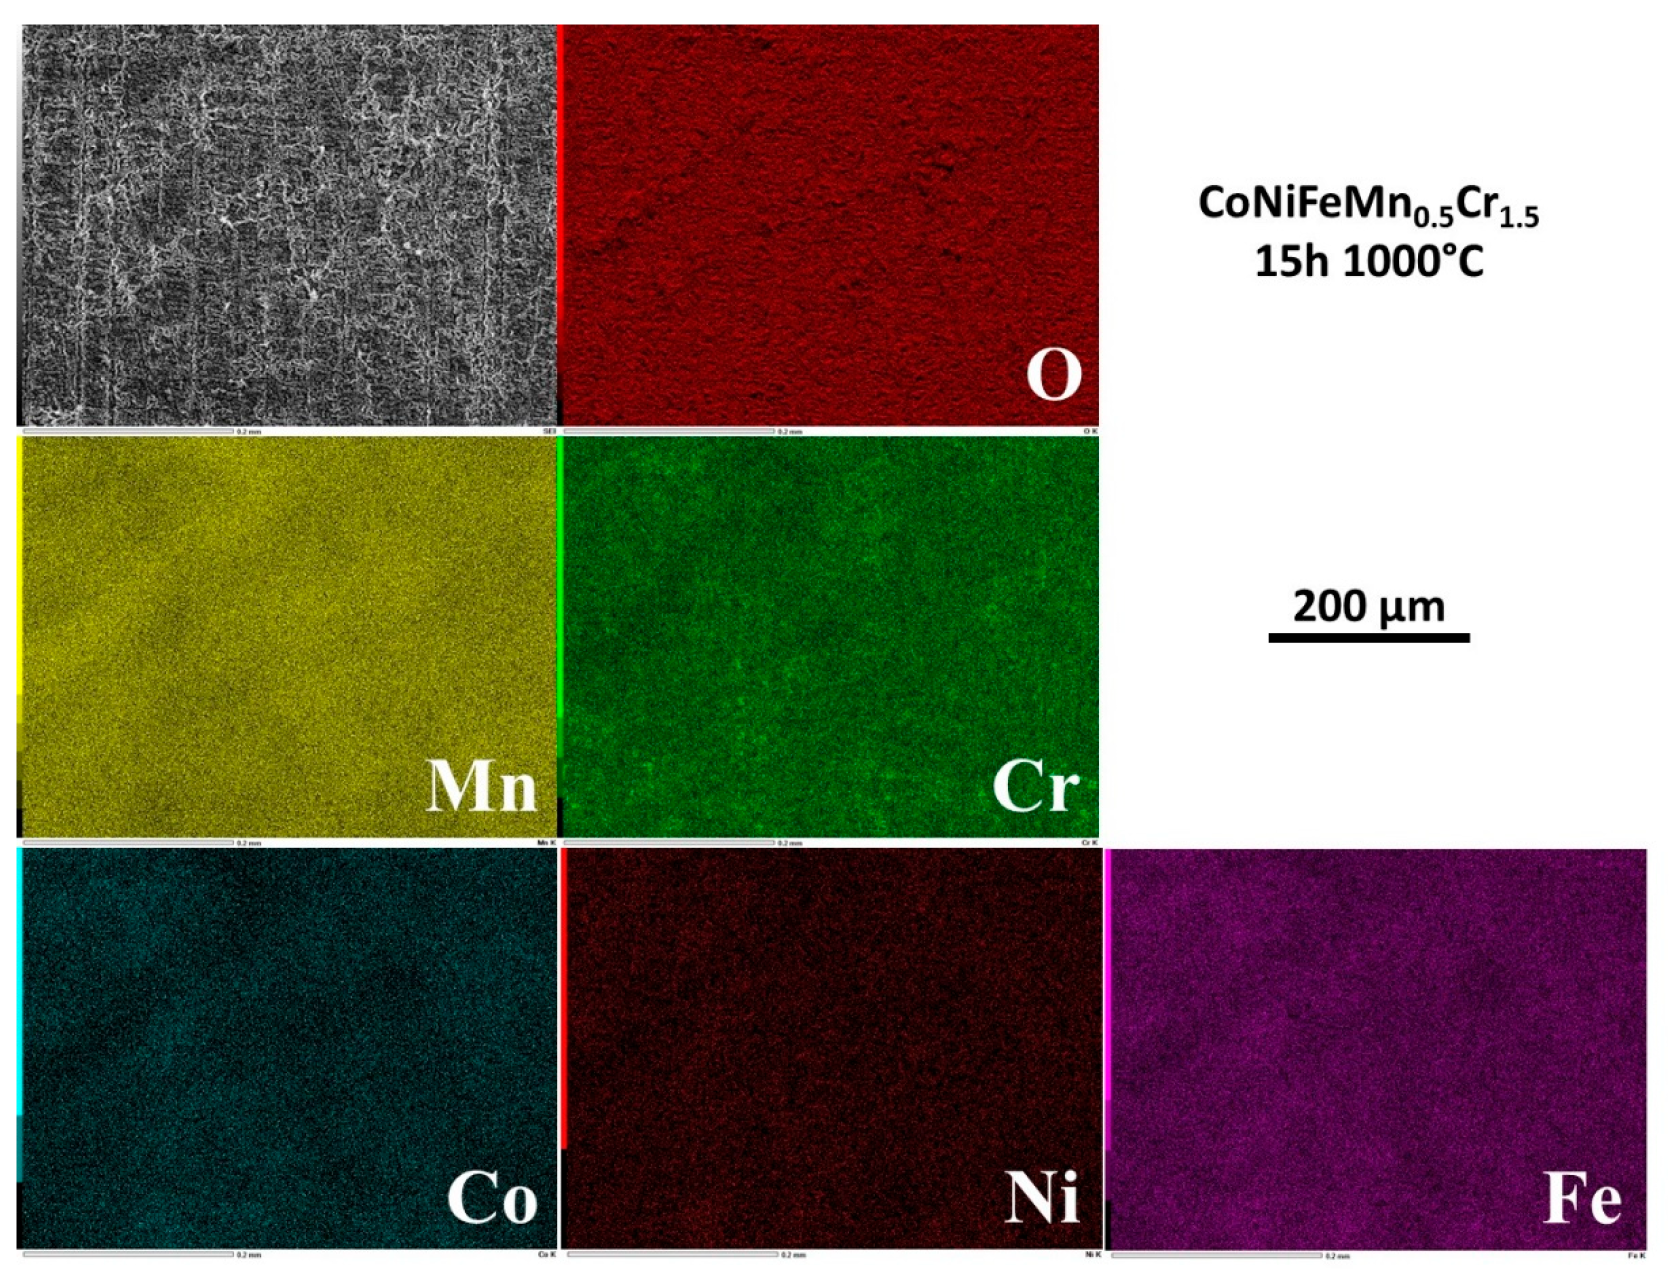
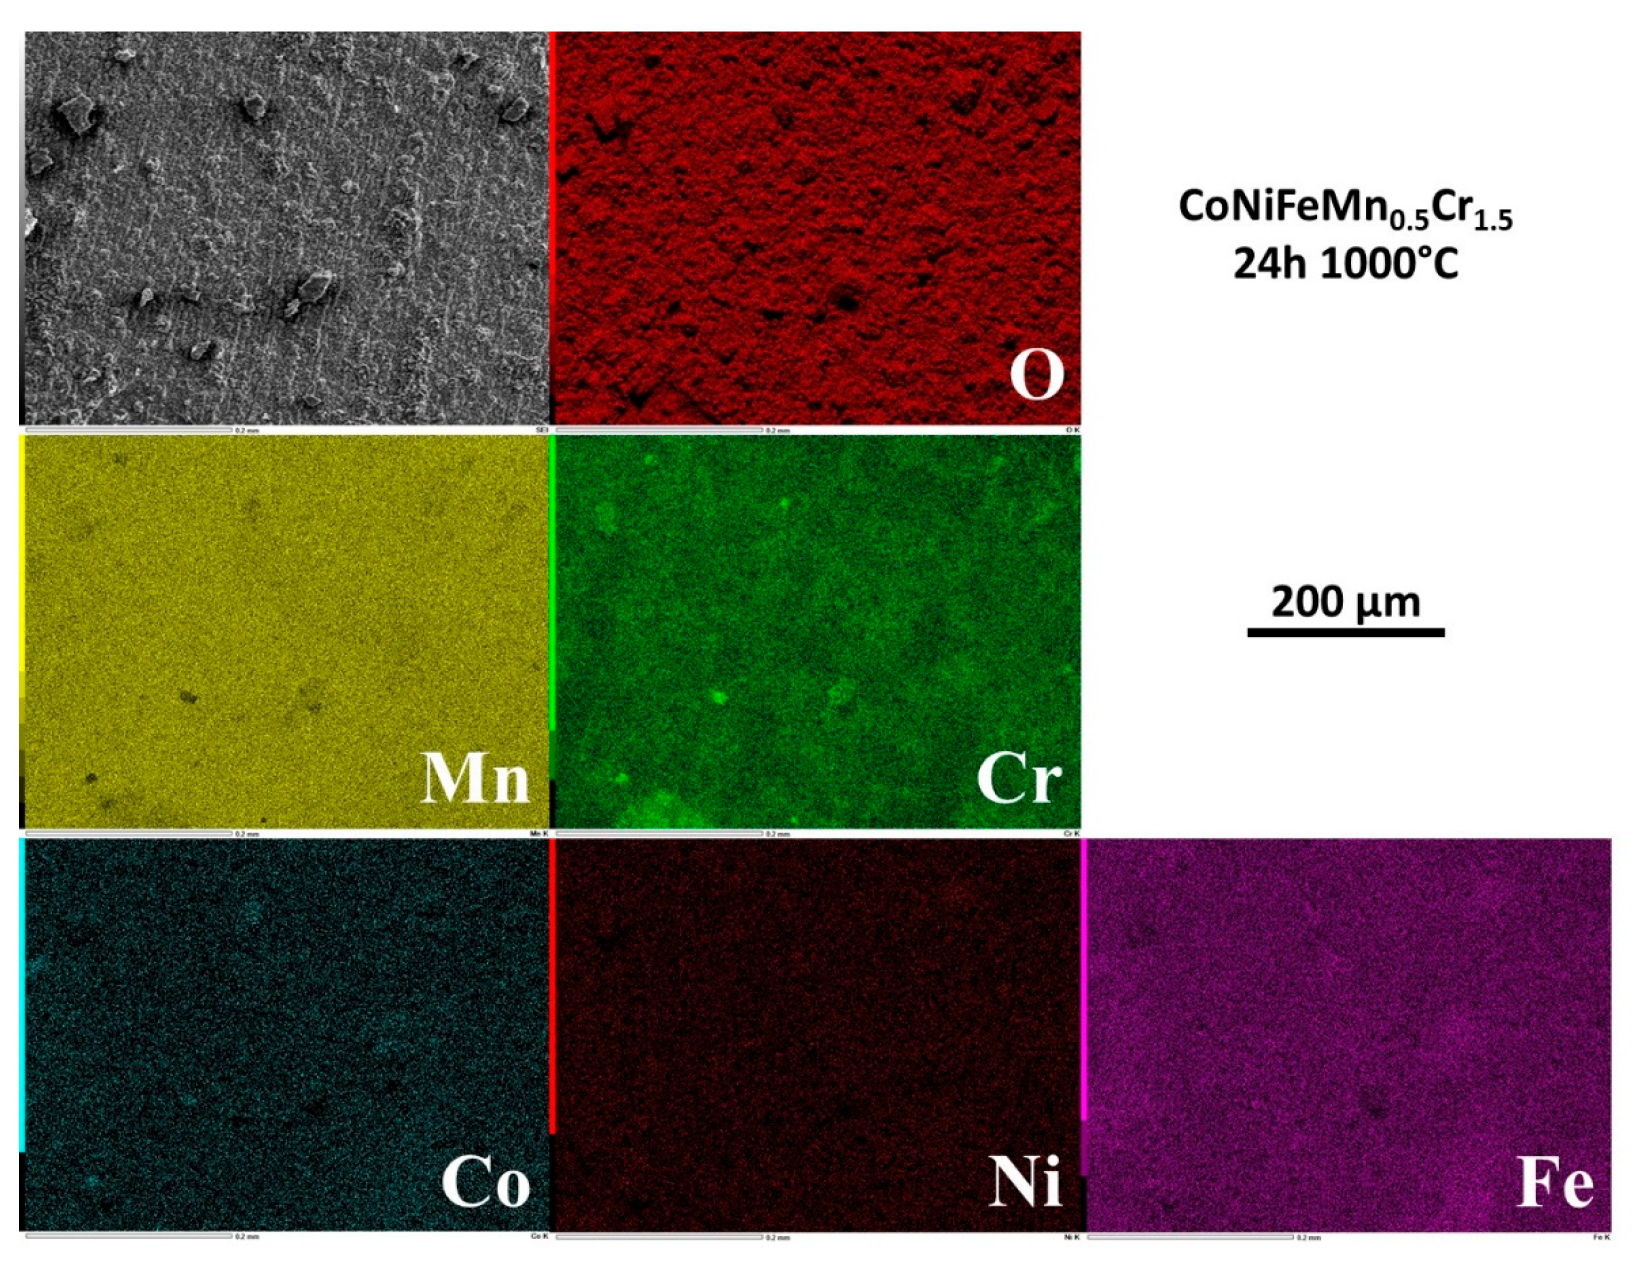
EDS elemental mapping was performed on the external face of the oxide scales. Selected results are presented in
Figure 4 for 1h30, in
Figure 5 for 3h, in
Figure 6 for 15h and in
Figure 7 for 24h.
After 1h30 of exposure the metals are heterogenously distributed in the external oxide, with scale zones rich in Mn and Cr and other scale zones seemingly made of a complex oxide involving Cr, Fe and Co, and also Ni but for a smaller part (
Figure 4). For 3h (
Figure 5) Mn and Cr are obviously involved in coarse oxides covering only by parts the surface which is elsewhere seemingly covered by thinner oxides concerning more Fe and Co. Rare small parts of surface present manganese oxides and other parts with high concentrations in Ni, Co and Fe suggest that the alloy is almost denuded locally. After 15h of exposure and later (
Figure 6 and
Figure 7), the chemical composition of the external face of the scales is more homogeneous. Manganese (homogeneous) and chromium (more heterogeneous) are the most present elements. The presence of Co and Fe is to be noticed here and there in combination with local high level of Cr, in correspondance with the coarsest oxides present in relief.
3.6. Cross–sectional observation and characterization of oxide scale and subsurface
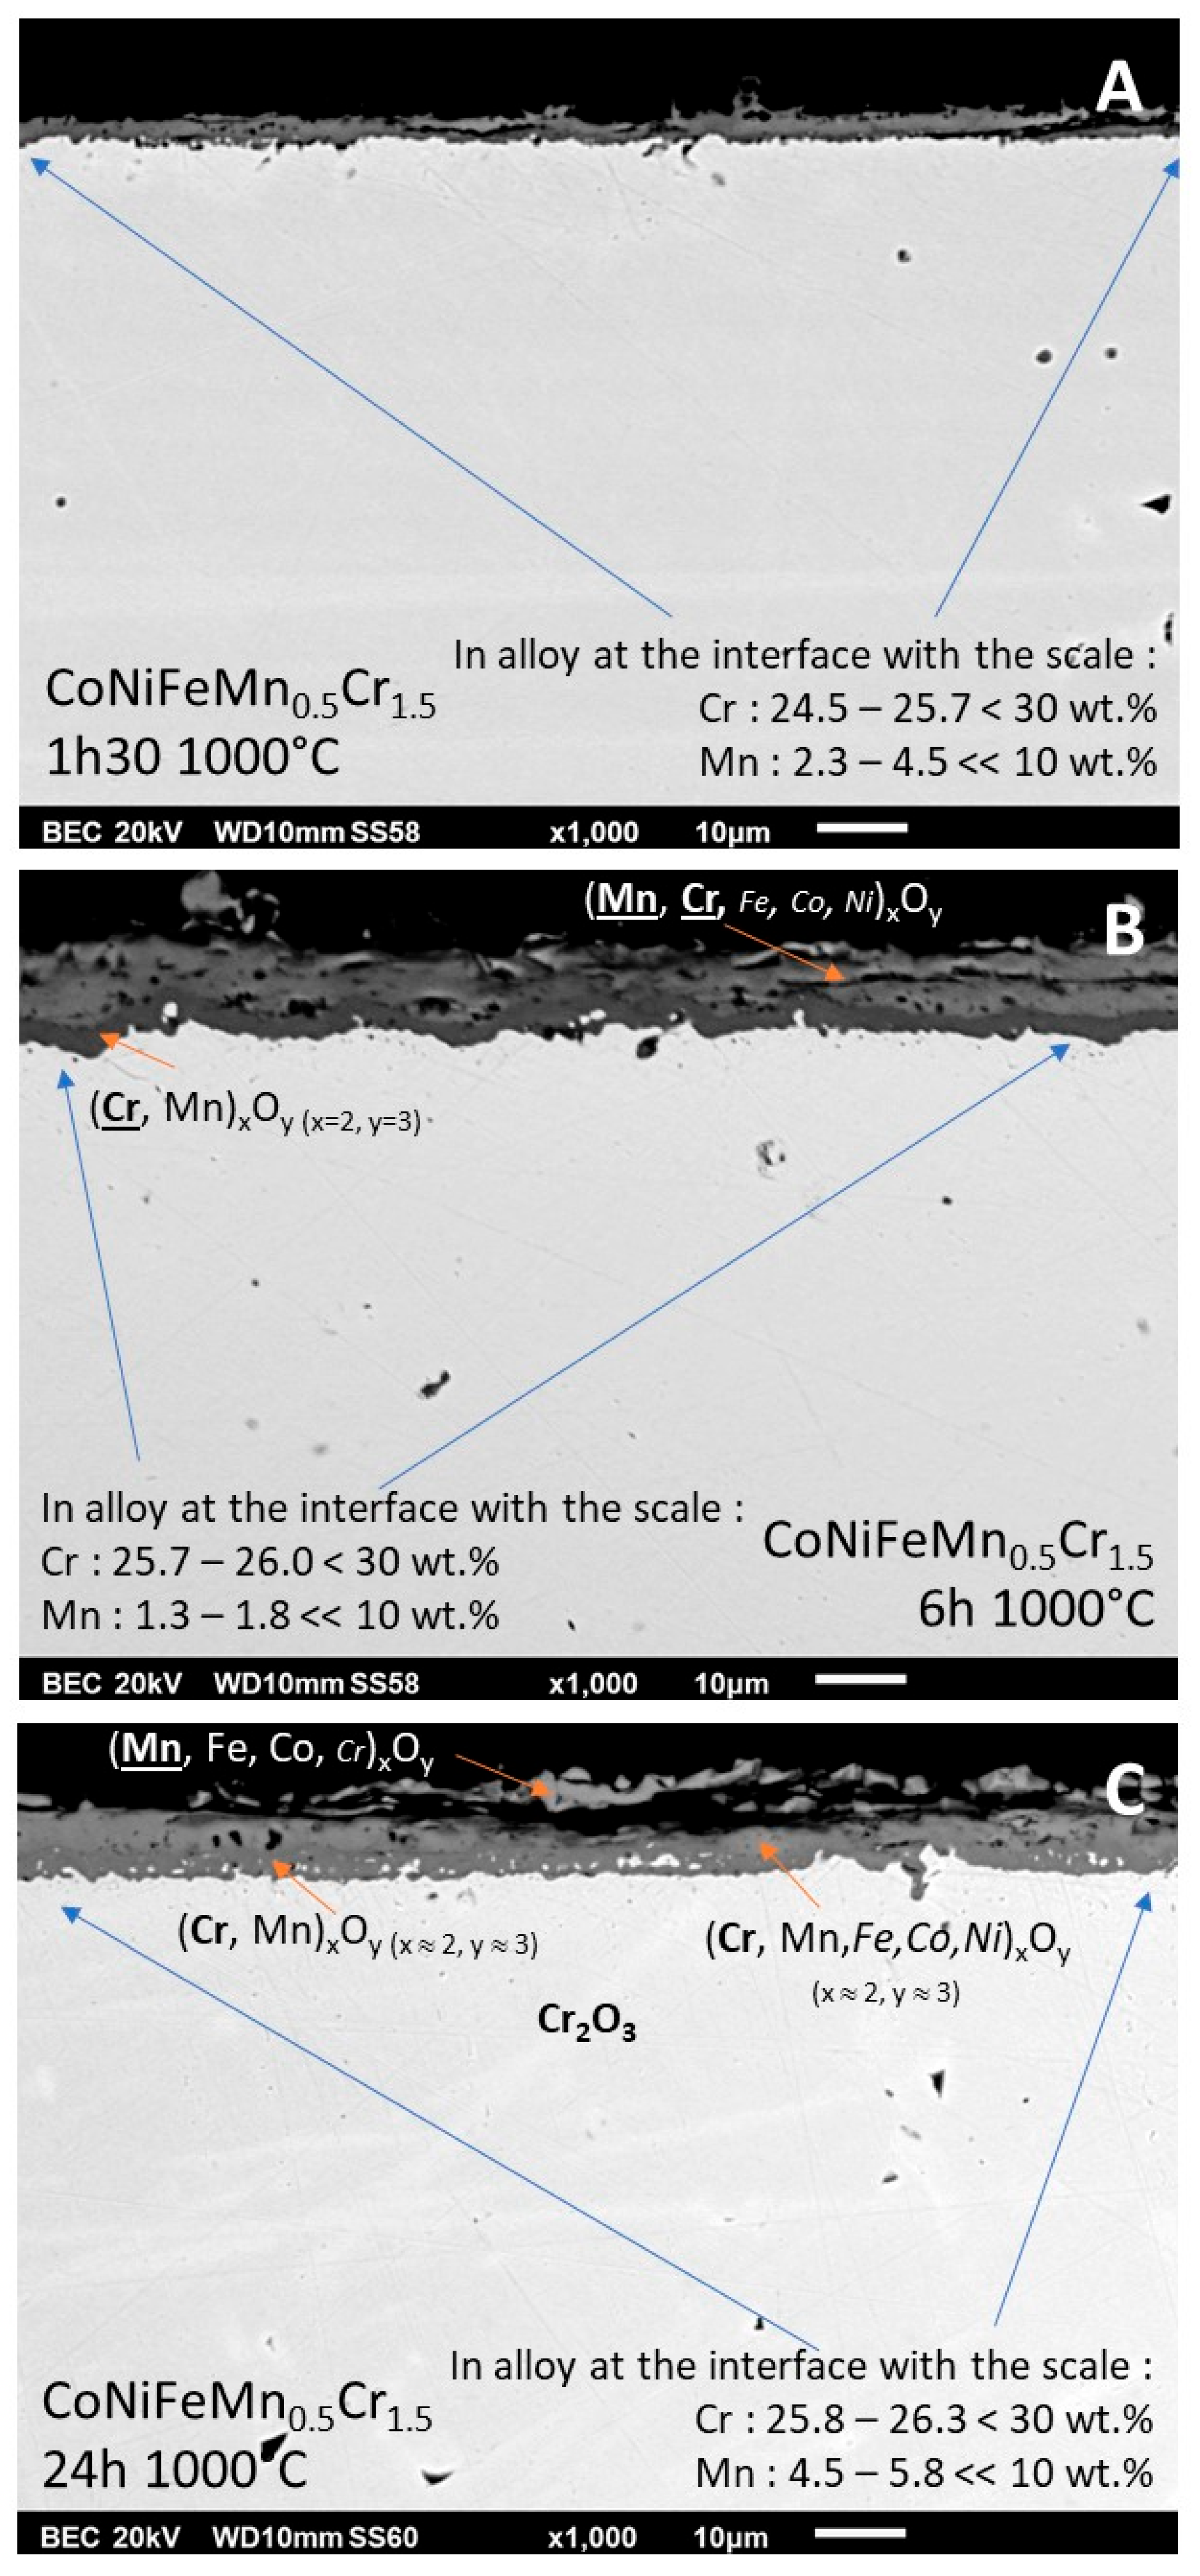
After cutting, surface preparation by grinding and polishing, the external oxide scale can be observed through its thickness, as well as the subsurface (
Figure 8). It was not possible to perform accurate EDS spot analysis in the too thin scale existing after 1h30. For longer exposure EDS spot analyses allowed accessing to data useful for the identification of the different oxides present: an outermost scale rich in Mn and Cr together (with also minor presence of the three other metals) and an innermost scale of oxide of mainly Cr but also of Mn, with the M
2O
3 stoichiometry of chromia. The particularly high involvment of Cr and Mn in the oxidation phenomena led to significant subsurface impoverishment in these two elements. Spot analyses performed in alloy very close to the interface with the oxide scale showed Cr and Mn contents decreased by comparison to the initial values (about 5 wt.% less for chromium, and from 5 to 8 wt.% less for manganese.
3.7. EDS elemental mapping over the zones affected by oxidation
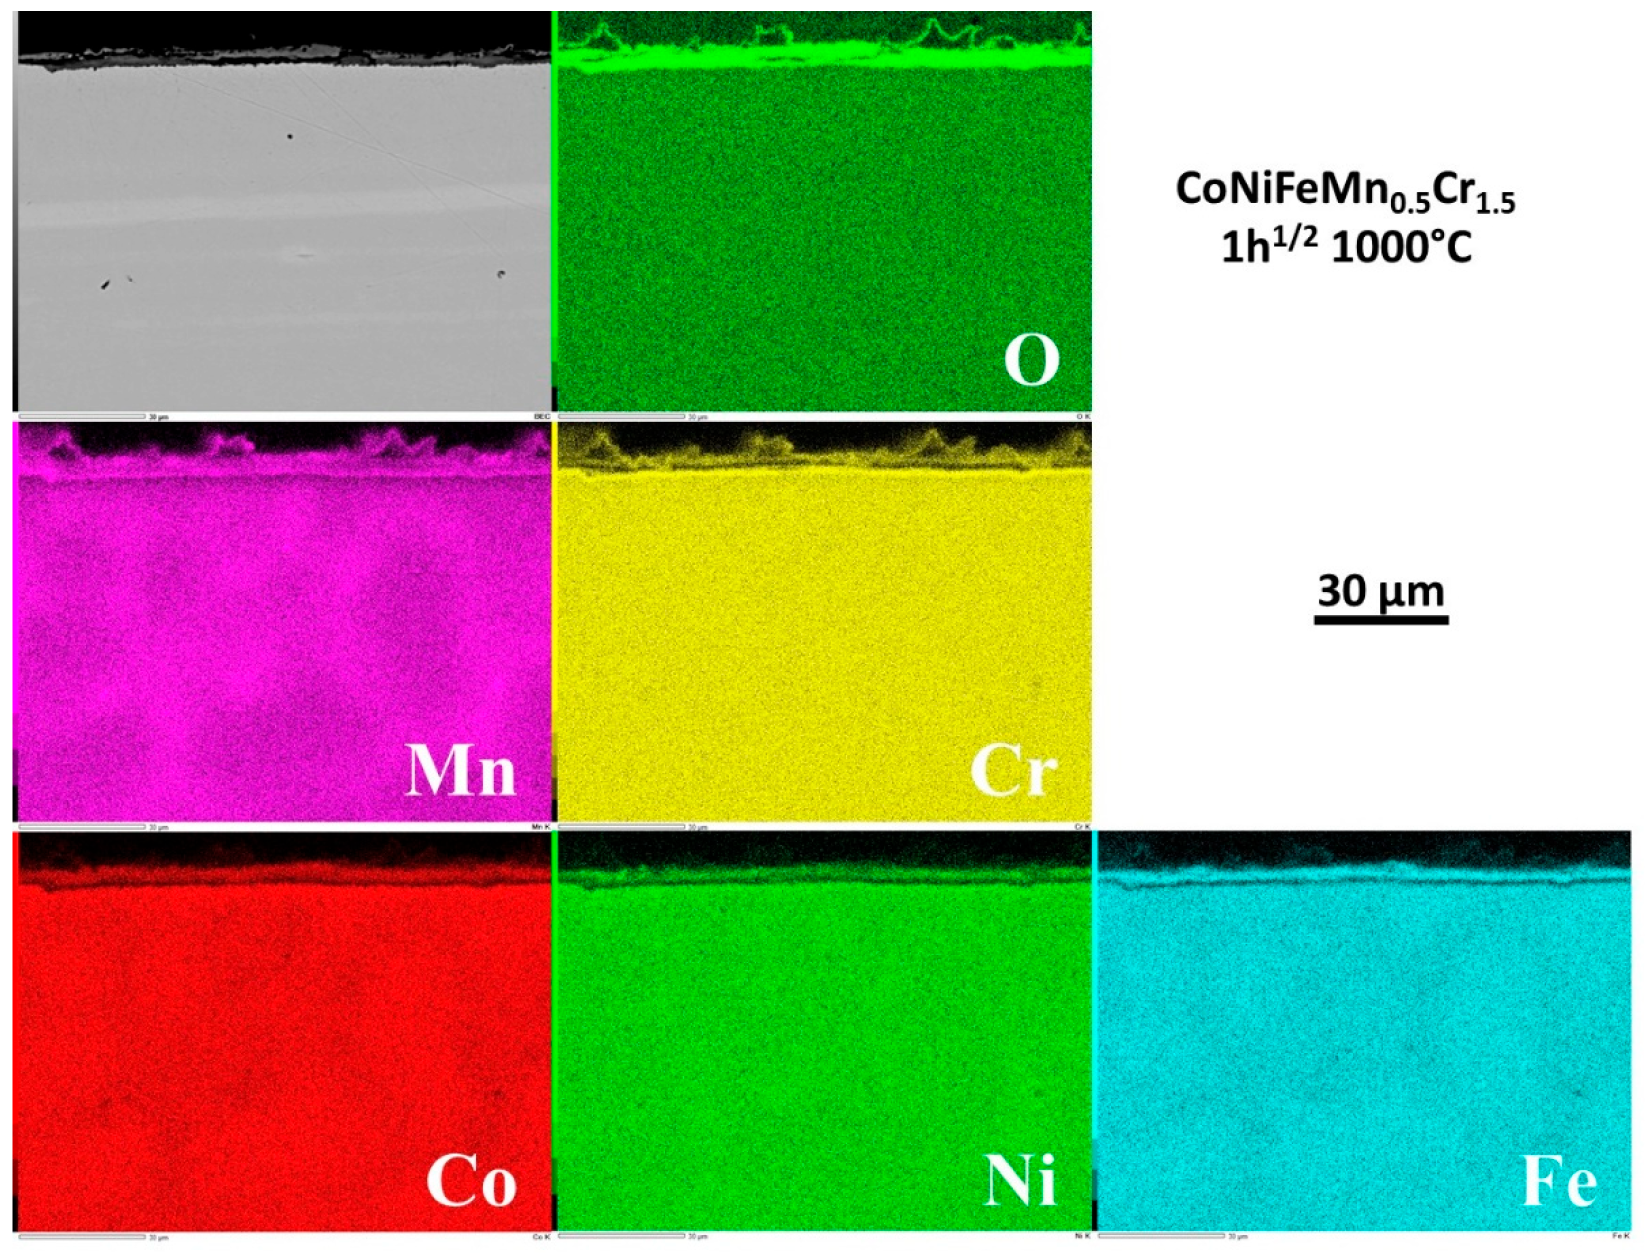
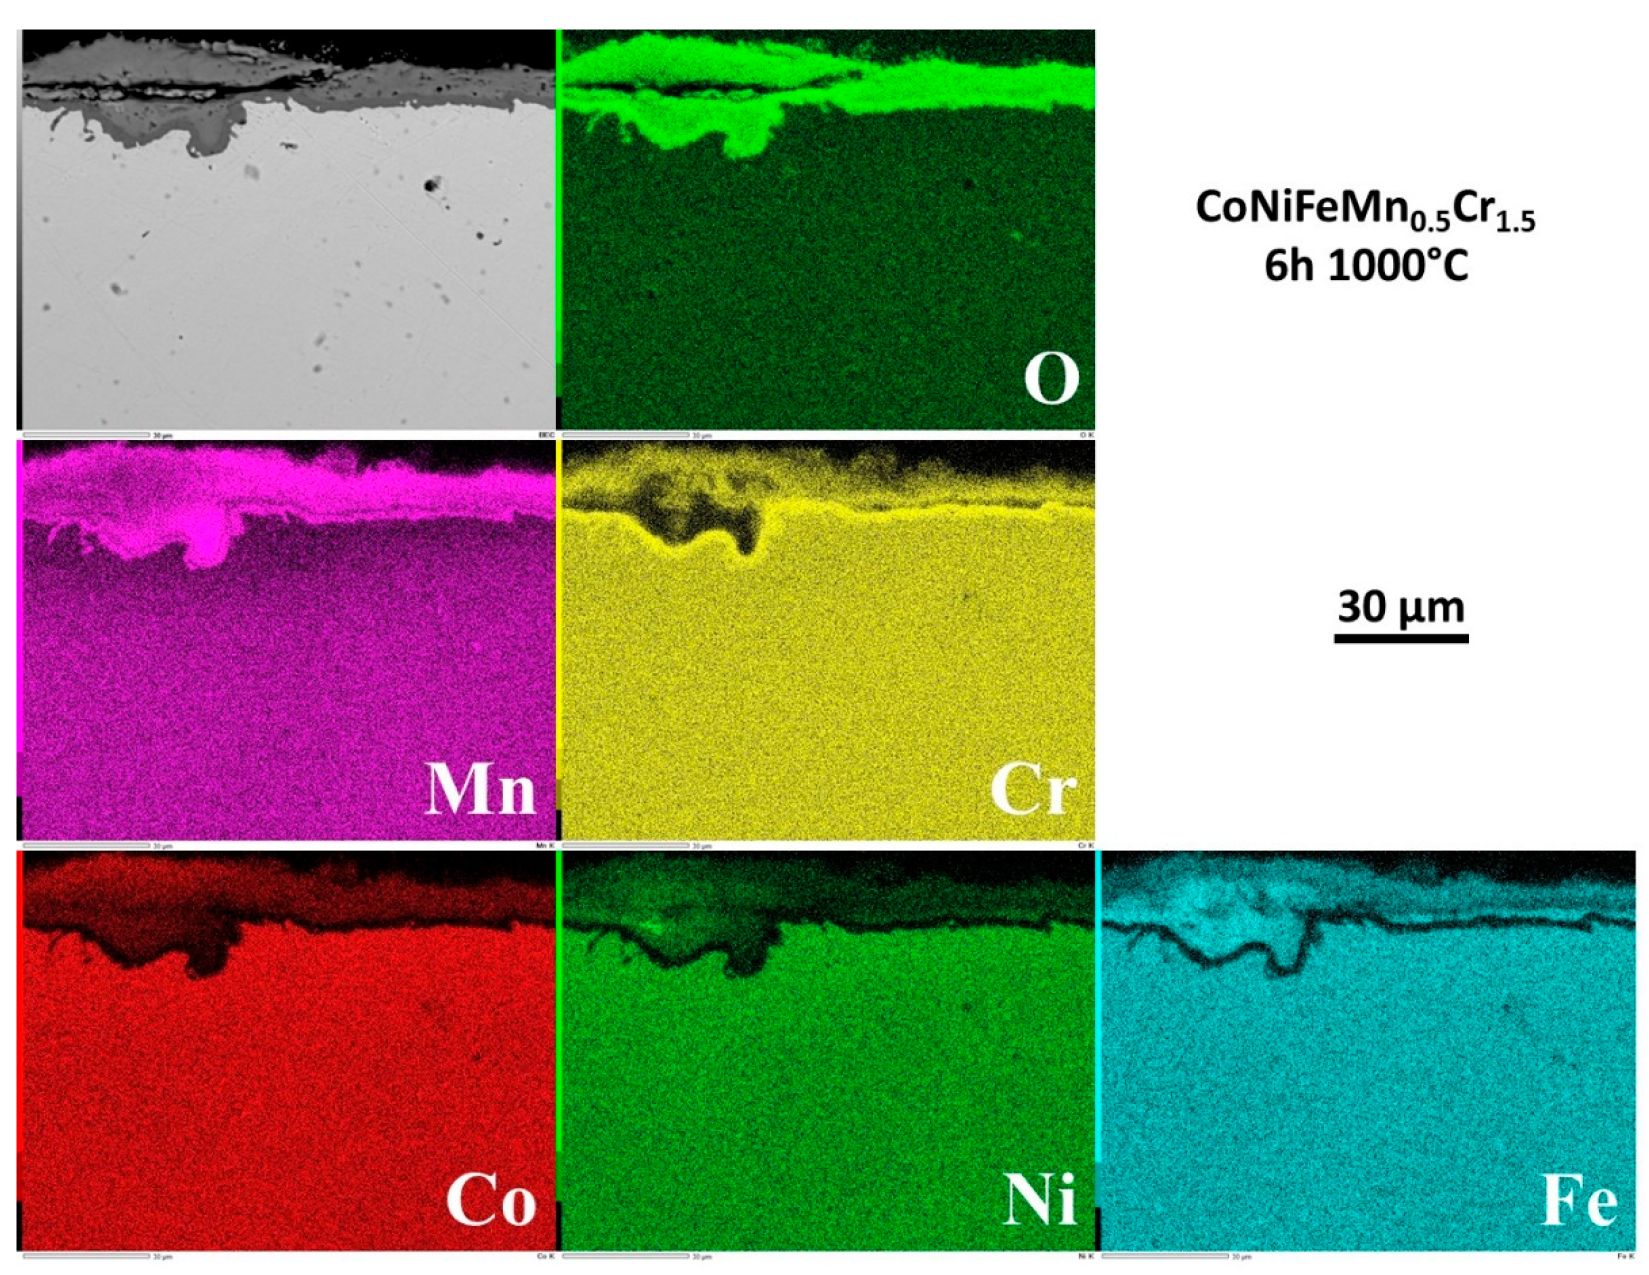
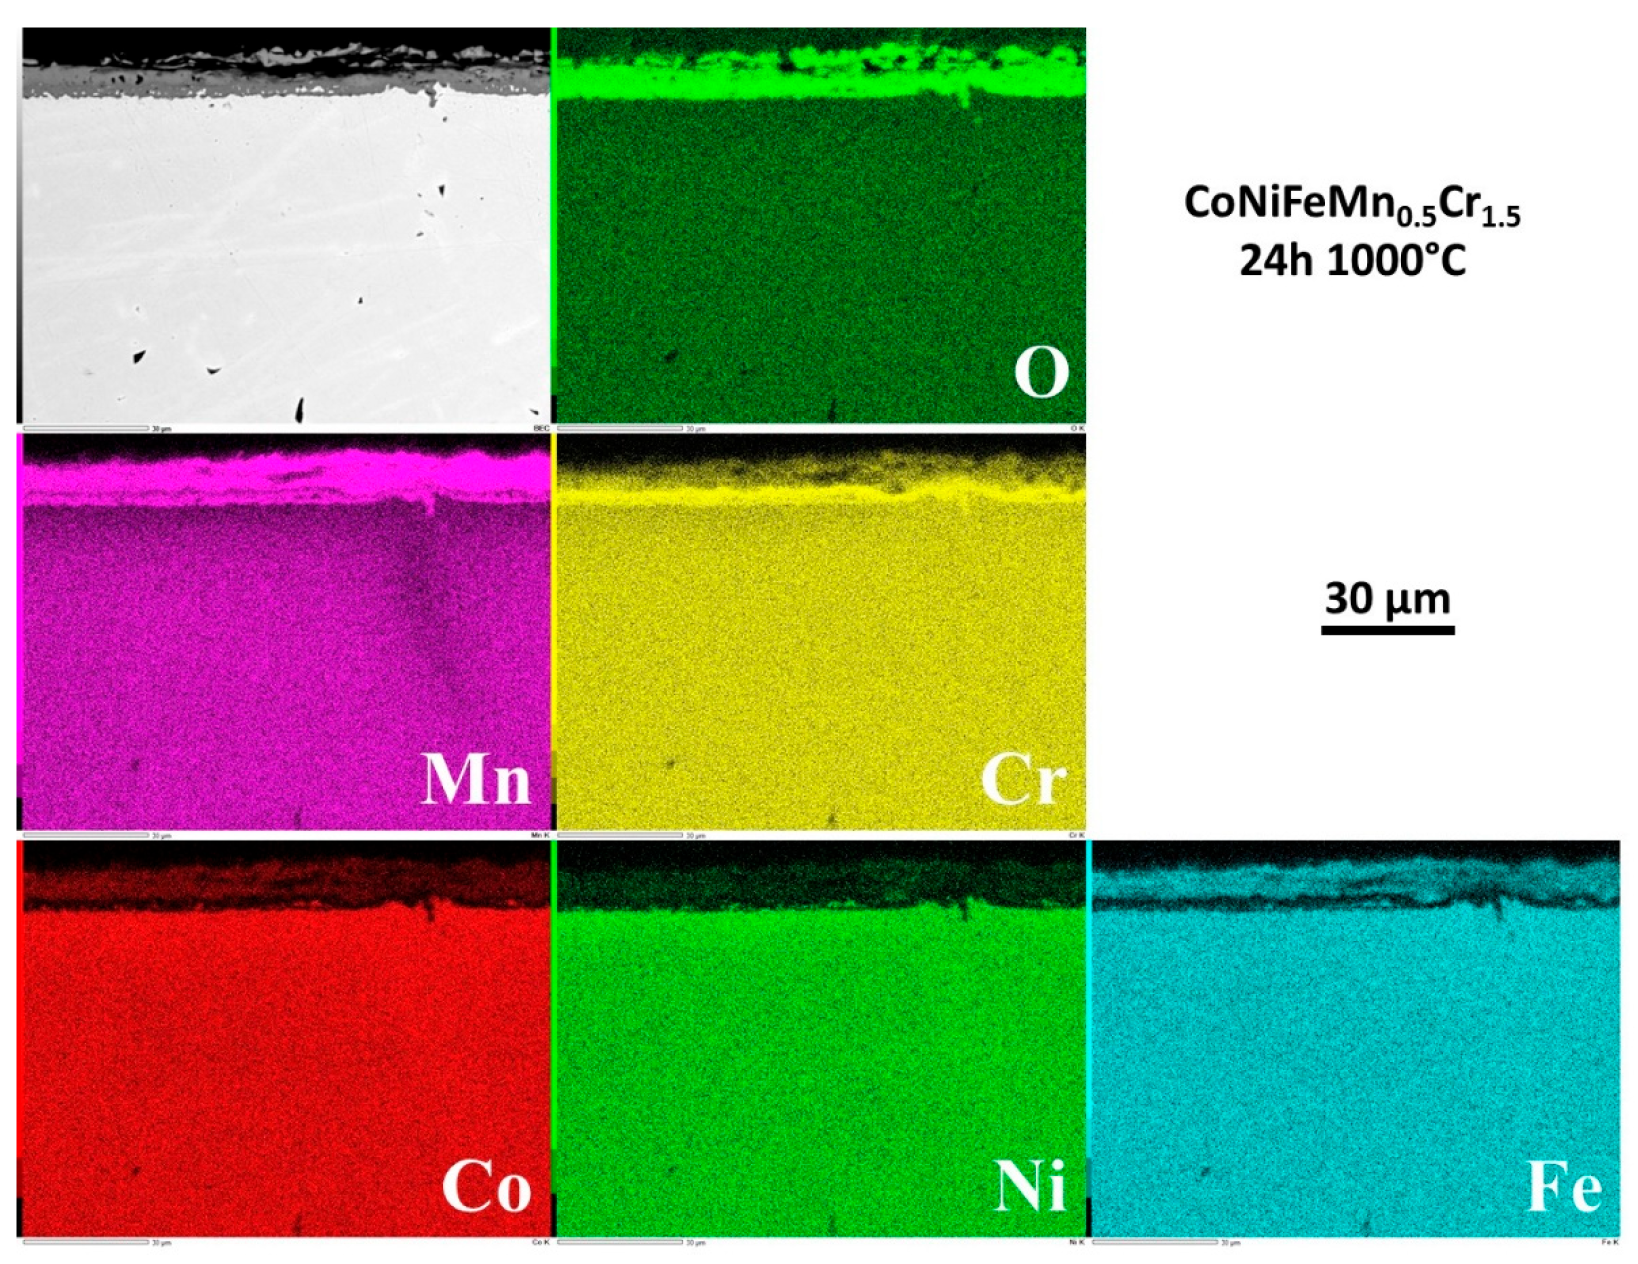
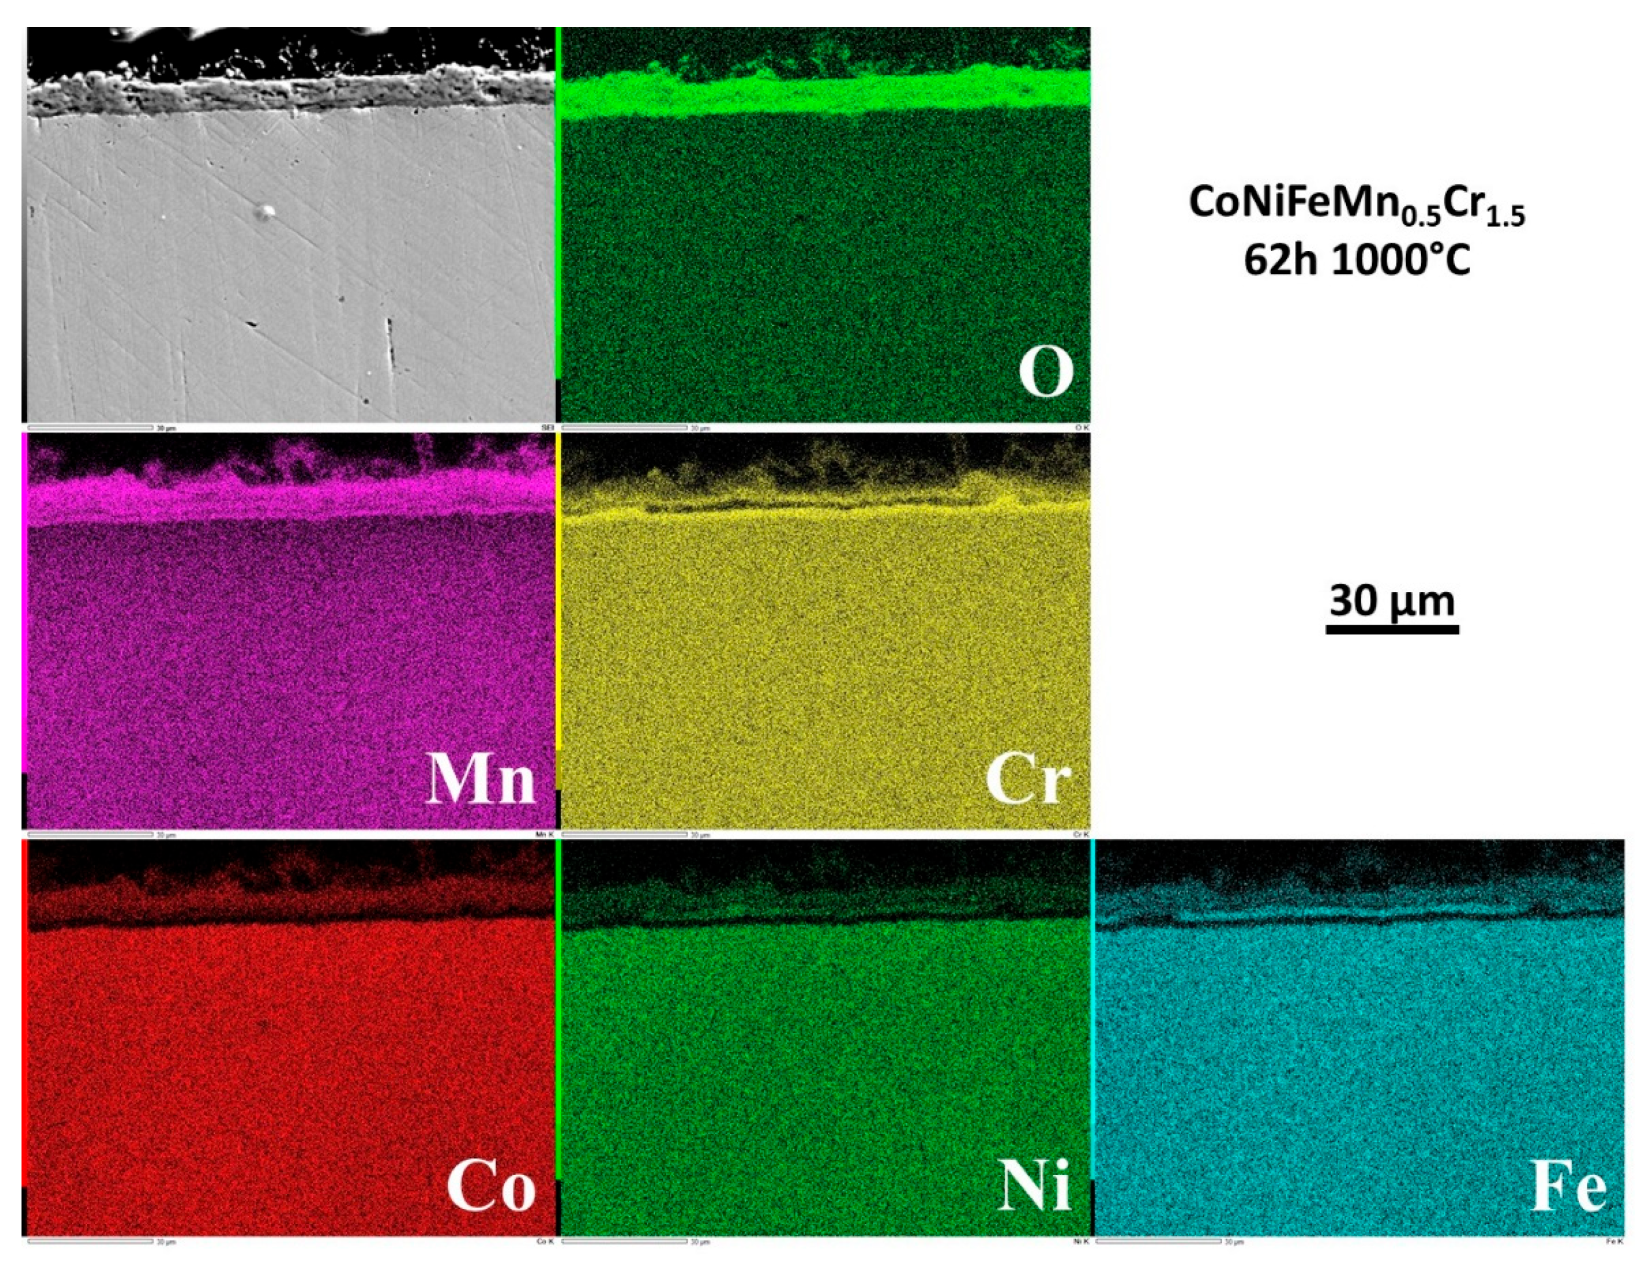
The repartition of the elements involved by oxidation was also investigated by EDS elemental cartography. Four examples of elemental maps are given in
Figure 9 for 1h30,
Figure 10 for 6h,
Figure 11 for 24h and
Figure 12 for 62h. This type of EDS result is qualitative but allows better understanding of how the oxide scale formed and how it progressed with time. One can see that all the elements present in the alloy took part to oxidation, in various proportions, but as soon as the sample started to oxidize. After only 1h30 (
Figure 9) the oxide scale was already continuous all around the sample, and constituted of superposed thin scales. From the outer side of the scale to the interface with alloy one encounters 1/ an outermost layer – plastically deformed during cooling at the test end – made of oxide of manganese mainly but with presence of Cr as minor specie, 2/ a middle layer containing all metals from the allloy (except Cr, curiously) and 3/ an internal layer of oxide of mainly Cr but containing also Mn. A little later (6h,
Figure 10) the scale has logically become thicker. Fe is present in the outermost Mn(Fe)
xO
y layer, the middle layer is mainly a Fe oxide (with presence of Cr and Co) and the innermost layer is still a Cr(Mn)
xO
y oxide but one can also find here local isolated Mn(Fe)
xO
y oxides. After 24h (
Figure 11) one observes an outermost oxide of Mn in which Fe, Co and a little quantity of Cr are present, an intermediate oxide of Mn and of Fe with presence of Cr, and an inner scale of oxide of Cr and Mn in similar proportions. This later oxide scale constitution stayed globally the same until reaching 62 hours of exposure (
Figure 12).
3.8. Internal changes in composition in the alloy
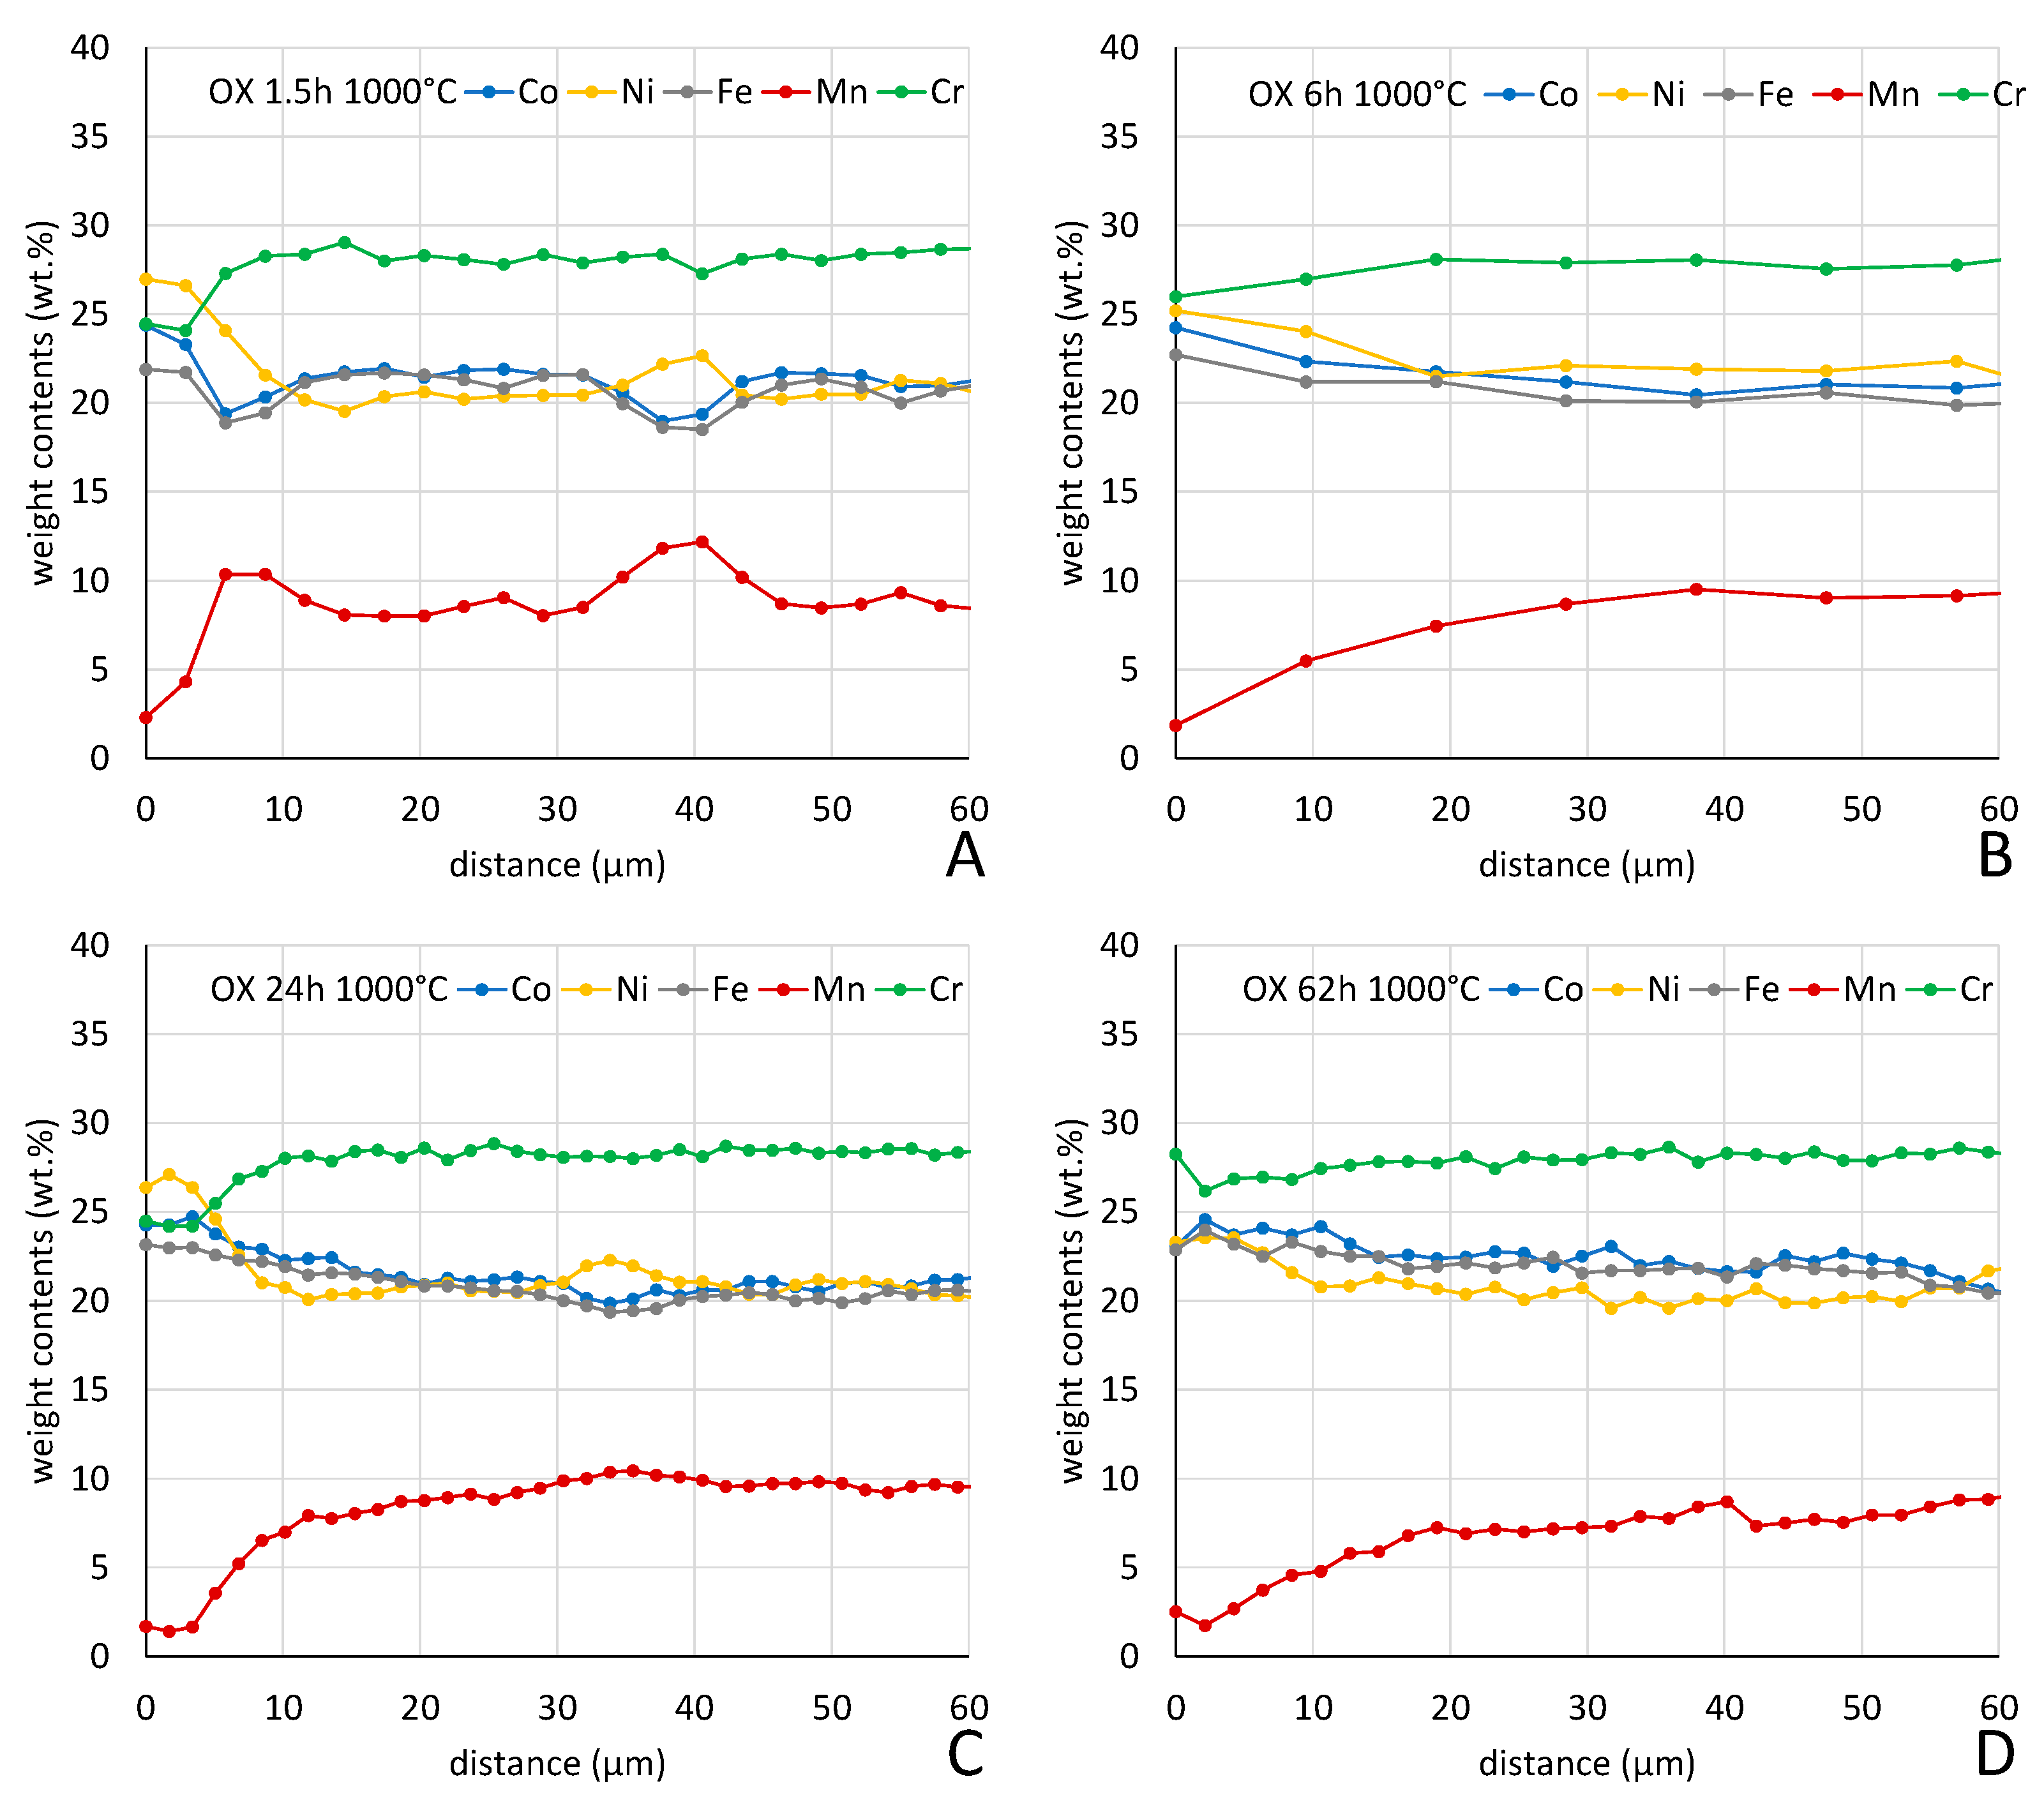
Examining the subsurface allows seeing that no internal oxidation occurred (SEM/BSE or EDS elemental maps). However the subsurface became more and more deteriorated in term of chemical composition. Indeed, the beginning of exposure at 1000°C led to an homogenization of the microstructure everywhere in the alloy (initial existence of Mn–segregated intergranular areas formed at the end of solidification), achieved before arriving at 6h of exposure.
But an impoverishment in both Mn and Cr developed from the interface with the external oxide scale. The Mn–and Cr–depleted depths increased with time. More quantitative information about this chemical evolution in subsurface can be found in
Figure 13 where one can the progress of the inwards extension of depletion.
3.9. Some commentaries
Carrying out oxidation tests on a series of samples of the alloy with interruption after different durations allowed better knowing how the oxidation products develop, which is not really possible by performing a single thermogravimetry run as recently done on this alloy [
15]. Investigating the composition and structure of oxides formed, step by step, led to discover that the multi–constituted oxide scale observed at the end of a long oxidation test existed in fact since the earliest hours of the test: after 1h30 Mn–rich oxides, Cr–rich oxides and oxides involving all the elements are all already present, as thin layers which will thicken thereafter with time. Without this information one may imagine other scenario such as the appearance of an oxide of Co, Ni and Fe during a couple of hours, followed by the formation of chromia, and later the formation of manganese oxide after one or two tens of hours. This simultaneous growth of all oxides, all covering entirely the sample surface, explains the possibility of a parabolic kinetic for mass gain, previously observed and found again here with seven values. Indeed, if chromia appears solely at the beginning or appears only after several tens of hours, this may lead to successive different regime and then mass gain kinetics. Here the mass gain kinetic was parabolic over the whole 62 hours and it was possible to determine the parabolic constant (Kp) at 1000°C: 6.5 × 10
-12 g
2 cm
-4 s
-1, which is logically higher than the one at 1000°C of a chromia–forming alloy, a Ni-30wt.%Cr model alloy for example (2.8 × 10
-12 g
2 cm
-4 s
-1 [
16]). Such complex mode of development and growth of the external scale does not permit to obtain a good protection against oxidation, this explaining the higher Kp value, and also the brittleness leading to the loss by parts of the external oxide here and there during handling for surface SEM examination and preparing cross–sections (with as consequence thicknesses lower than before metallographic preparation).
5. Conclusions
As soon as oxidation starts all the elements constituting the CoNiFeMn0.5Cr1.5 alloy take part to the phenomenon and the process goes on during the following tens of hours. In contrast with chromia–forming alloys for which several oxides also form initially (including CoO or NiO) but with a rapid switch to chromia only, manganese goes on accompanying chromium for the continuation of oxidation. This causes faster oxidation and possible problems of scale spallation due to the bad quality of some of the oxide layers (the one rich in Mn: presence of pores and small shrinkage defects) by comparison to the compact and adherent innermost chromia–like Cr–rich M2O3 oxide. To complete now this work for a deepened knowledge of the oxide scale development with its dependence on the Mn content, on the temperature and on the composition of the gaseous oxidant environment, this study will be soon extended by carrying out new tests.
Author Contributions
For research articles with several authors, a short paragraph specifying their individual contributions must be provided. The following statements should be used “Conceptualization, P.B.; methodology, P.B.; software, P.B.; validation, P.B.; formal analysis, L.A. and P.B.; investigation, L.A. and P.B.; resources, P.B.; data curation, P.B.; writing—original draft preparation, P.B.; writing—review and editing, P.B.; visualization, P.B.; supervision, P.B.; project administration, P.B.; funding acquisition, N/A. All authors have read and agreed to the published version of the manuscript.” Please turn to the CRediT taxonomy for the term explanation. Authorship must be limited to those who have contributed substantially to the work reported.
Funding
This research received no external funding.
Data Availability Statement
The data presented in this study are available in article.
Acknowledgments
The authors wish thanking Erwan Etienne and Lionel Aranda for their technical help, as well as Romin Chevalme, Yasmina El Hadad and Siouare Hammi, students in the same master of solids chemistry as the first author of this article.
Conflicts of Interest
The authors declare no conflict of interest.
References
- Sims, C.T.; Hagel, W.C. The Superalloys; Wiley-Interscience, New York, U.S.A., 1972.
- Donachie, M.S.; Donachie, S.J. Superalloys: A Technical Guide, 2nd ed.; ASM International: Materials Park, U.S.A, 2002. [Google Scholar]
- Ilyas, S.; Ranjan Srivastava, R.; et al. Recovery of critical metals from spent Li-ion batteries: Sequential leaching, precipitation, and cobalt-nickel separation using Cyphos IL104. Waste Management 2022, 154, 175–186. [Google Scholar] [CrossRef] [PubMed]
- Kriese, F.; Lassen, S.; et al. Recovery process for critical metals: selective adsorption of nickel(II) from cobalt(II) at acidic condition and elevated temperature. Adsorption Science & Technology 2023, 5334353. [Google Scholar]
- Kofstad, P. High temperature corrosion; Elsevier Applied Science, London, U.K., 1988.
- Young, D.J. High temperature oxidation and corrosion of metals; Elsevier Corrosion Series, Amsterdam, The Netherlands, 2008.
- Cantor, B. Multicomponent high-entropy Cantor alloys. Progress in Materials Science 2021, 120, 100754. [Google Scholar] [CrossRef]
- Bracq, G.; Laurent-Brocq, M.; et al. The fcc solid solution stability in the Co-Cr-Fe-Mn-Ni multi-component system. Acta Materialia 2017, 128, 327–336. [Google Scholar] [CrossRef]
- Kauffmann, A.; Stueber, M.; et al. Combinatorial exploration of the high entropy alloy system Co-Cr-Fe-Mn-Ni. Surface and Coatings Technology 2017, 325, 174–180. [Google Scholar] [CrossRef]
- Teramoto, T.; Yamada, K.; et al. Monocrystalline elastic constants and their temperature dependences for equi-atomic Cr-Mn-Fe-Co-Ni high-entropy alloy with the face-centered cubic structure. Journal of Alloys and Compounds 2019, 777, 1313–1318. [Google Scholar] [CrossRef]
- Ye, Y.F.; Wang, Q.; et al. High-entropy alloy: challenges and prospects. Materials Today 2016, 19, 349–362. [Google Scholar] [CrossRef]
- Berthod, P. Strengthening against Creep at Elevated Temperature of HEA Alloys of the CoNiFeMnCr Type Using MC-Carbides. In Supplemental proceedings of the TMS 2023, San Diego, U.S.A., 19–23 March 2023.
- Berthod, P. High Temperature Oxidation of CoNiFeMnCr High Entropy Alloys Reinforced by MC-Carbides. In Supplemental proceedings of the TMS 2023, San Diego, U.S.A., 19–23 March 2023.
- Amrouche, L.; Chevalme, R. et al. Metallographic follow-up of the oxidation progress with time of cast Cantor alloy at 1000°C. In Supplemental proceedings of the TMS 2025, Las Vegas, U.S.A., 23–27 March 2025. Accepted manuscript.
- Spaeter, P.; Gay, C.; et al. P. Oxidation Behavior at 1000 °C of Low-Mn High-Cr Cantor’s HEA-Based Alloys Strengthened or Not by MC Carbides. Corrosion and Materials Degradation 2023, 4, 528–541. [Google Scholar] [CrossRef]
- Berthod, P. Kinetics of High Temperature Oxidation and Chromia Volatilization for a Binary Ni–Cr Alloy. Oxidation of Metals 2005, 64, 235–252. [Google Scholar] [CrossRef]
Figure 1.
Progress in mass gain per surface unit area due to oxidation, versus time (A) and versus the square root of time (B).
Figure 1.
Progress in mass gain per surface unit area due to oxidation, versus time (A) and versus the square root of time (B).
Figure 2.
General appearance of the oxidized oxide scales developed over the seven samples (low magnification SEM micrographs, SE imaging mode).
Figure 2.
General appearance of the oxidized oxide scales developed over the seven samples (low magnification SEM micrographs, SE imaging mode).
Figure 3.
Details of the oxidized oxide scales developed over the seven samples (high magnification SEM micrographs, SE imaging mode).
Figure 3.
Details of the oxidized oxide scales developed over the seven samples (high magnification SEM micrographs, SE imaging mode).
Figure 4.
Elemental distribution detected by EDS on the outermost side of the external oxide scale formed after 1h30 of exposure.
Figure 4.
Elemental distribution detected by EDS on the outermost side of the external oxide scale formed after 1h30 of exposure.
Figure 5.
Elemental distribution detected by EDS on the outermost side of the external oxide scale formed after 3h of exposure.
Figure 5.
Elemental distribution detected by EDS on the outermost side of the external oxide scale formed after 3h of exposure.
Figure 6.
Elemental distribution detected by EDS on the outermost side of the external oxide scale formed after 15h of exposure.
Figure 6.
Elemental distribution detected by EDS on the outermost side of the external oxide scale formed after 15h of exposure.
Figure 7.
Elemental distribution detected by EDS on the outermost side of the external oxide scale formed after 24h of exposure.
Figure 7.
Elemental distribution detected by EDS on the outermost side of the external oxide scale formed after 24h of exposure.
Figure 8.
Cross–sectional view of the oxide scale and the subsurface of three of the oxidized samples (A: 1h30, B: 6h and C: 24h); EDS spot analysis results obtained in the different oxides; chemical composition in alloy close to the interface with the scale.
Figure 8.
Cross–sectional view of the oxide scale and the subsurface of three of the oxidized samples (A: 1h30, B: 6h and C: 24h); EDS spot analysis results obtained in the different oxides; chemical composition in alloy close to the interface with the scale.
Figure 9.
Elemental distribution in the external oxide and in the subsurface after 1h30 of exposure to air at 1000°C.
Figure 9.
Elemental distribution in the external oxide and in the subsurface after 1h30 of exposure to air at 1000°C.
Figure 10.
Elemental distribution in the external oxide and in the subsurface after 6h of exposure to air at 1000°C.
Figure 10.
Elemental distribution in the external oxide and in the subsurface after 6h of exposure to air at 1000°C.
Figure 11.
Elemental distribution in the external oxide and in the subsurface after 24h of exposure to air at 1000°C.
Figure 11.
Elemental distribution in the external oxide and in the subsurface after 24h of exposure to air at 1000°C.
Figure 12.
Elemental distribution in the external oxide and in the subsurface after 62h of exposure to air at 1000°C.
Figure 12.
Elemental distribution in the external oxide and in the subsurface after 62h of exposure to air at 1000°C.
Figure 13.
Concentration profiles in the subsurface of the alloys acquired inwards from the interface with the external oxide scale.
Figure 13.
Concentration profiles in the subsurface of the alloys acquired inwards from the interface with the external oxide scale.
Table 1.
Chemical compositions of the alloy elaborated for the study (determined from five ×250 full frame EDS analyses per alloy); weight contents in all elements and the corresponding atomic contents.
Table 1.
Chemical compositions of the alloy elaborated for the study (determined from five ×250 full frame EDS analyses per alloy); weight contents in all elements and the corresponding atomic contents.
| Content in… |
|
Co |
Ni |
Fe |
Mn |
Cr |
| wt.% |
Average |
20.0 |
20.5 |
19.8 |
8.3 |
31.3 |
| wt.% |
Std dev |
0.1 |
0.3 |
0.2 |
0.5 |
0.4 |
| at.% |
|
18.9 |
19.4 |
19.7 |
8.4 |
33.5 |
|
Disclaimer/Publisher’s Note: The statements, opinions and data contained in all publications are solely those of the individual author(s) and contributor(s) and not of MDPI and/or the editor(s). MDPI and/or the editor(s) disclaim responsibility for any injury to people or property resulting from any ideas, methods, instructions or products referred to in the content. |
© 2024 by the authors. Licensee MDPI, Basel, Switzerland. This article is an open access article distributed under the terms and conditions of the Creative Commons Attribution (CC BY) license (http://creativecommons.org/licenses/by/4.0/).
