1. Introduction
Post-transcriptional and translational machineries constitute two of the most important multi-protein assemblies for the time- and tissue-specific control of gene expression in eukaryotic cells. In this context, microRNAs (miRNAs/miRs) are being presented as one of the most well-known groups of small non-coding RNAs (ncRNAs), since they have been the main subject of many studies for years. These molecules are endogenous, non-coding, single-stranded RNAs, with a size of ~19-25 nucleotides, critically involved in post-transcriptional gene regulation [
1,
2,
3]. In humans, the majority of miRNA sequences are located within intronic regions of coding or non-coding RNA transcripts, whereas some miRNAs are encoded by exonic areas [
4].
Biogenesis of miRNA moieties takes place both in the nucleus and the cytoplasm. During canonical biogenesis, each miRNA is transcribed by the RNA Polymerase II (Pol II) as a primary miRNA (pri-miRNA) [
5,
6,
7,
8], which is, next, processed by the RNase III Drosha to generate a precursor miRNA (pre-miRNA) of ~70 nucleotides in length [
1,
9]. Following Drosha-derived processing, the Ran-GTP-dependent transporter Exportin-5 mediates the translocation of the produced pre-miRNA through the nuclear pore complex (NPC) [
10,
11,
12]. After its export to the cytoplasm, the pre-miRNA is further processed by the RISC (RNA-induced silencing complex) loading complex, composed of DICER, TRBP (transactivation response element RNA-binding protein) and PACT (protein activator of the interferon-induced protein kinase) proteins, which cleaves the pre-miRNA hairpins to generate the mature miRNA species [
1,
13,
14]. Once produced, mature miRNA is loaded onto RISC to direct post-transcriptional repression via sequence complementarity to target mRNA(s) [
3]. Downregulation of gene expression can be attained through either mRNA cleavage (and degradation) or mRNA translational repression, depending on whether the miRNA presents full or partial complementarity to the target mRNA sequence, respectively [
15,
16,
17,
18].
TRBP is a double-stranded RNA-binding protein, initially identified due to its ability to bind the HIV-1 TAR RNA and stimulate the expression of HIV-1 promoter in infected cells [
19,
20,
21]. It is a key component of RISC that, together with PACT, a TRBP paralog, can facilitate the DICER-mediated production of miRNA species [
22]. TRBP has been previously shown to stabilize DICER and enhance DICER-catalyzed miRNA-processing kinetics [
23], as well as DICER’s ability to recognize pre-miRNAs among other RNA species [
24,
25,
26]. In addition, TRBP is required for the loading of miRNA duplex onto AGO2 during RISC assembly, while it can also, indirectly, affect the selection of guide strand during mRISC formation, due to a shift of cleavage sites [
24,
25,
27,
28,
29].
Two major isoforms of the protein, TRBP1 and TRBP2, encoded by the
tarbp2 gene located on chromosome 12, coexist in human cells [
30,
31,
32,
33]. These two -splicing variant- proteins do not seem to contain major differences in their functionalities, although TRBP2 is presented slightly more active than TRBP1 in human cells [
30]. The three TRBP main domains, ordered from N- to C-terminus, are named as: (a) dsRBD1 and (b) dsRBD2, located in between 31-96 and 160-226 amino acid residues (aa), respectively, and (c) C4, positioned in between 298-366 aa [
19,
25,
34]. The two dsRBDs can bind dsRNAs, with dsRBD2 carrying stronger dsRNA-binding activity than dsRBD1, due to the presence of a KR-helix motif, a 15 aa peptide sequence within dsRBD2, which can bind dsRNA by itself [
34,
35,
36,
37]. C4, also called half dsRBD or dsRBD type B, has structural homologies with dsRBDs, but it does not bind RNA. In contrast, C4 domain mediates protein-protein interactions (PPIs) in an RNA-independent manner [
38,
39,
40]. Importantly, C4 has proved responsible for the TRBP-DICER and TRBP-PACT interactions, while a larger region (237-366 aa) encompassing C4, known as the “Medipal” region, has been previously identified for the TRBP-MERLIN interaction [
30,
40,
41,
42].
The present study aims to investigate the hitherto unknown, and likely miRNA-independent, functions and properties of the TRBP protein, particularly regarding its cell cycle-dependent regulation during cancer-cell division. Our novel findings of the mitosis-specific TRBP, but not PACT, downregulation in human cancer cells of diverse tissue origin, provide strong insights for the essential involvement of TRBP in the onset and progression of human malignancies, and highlight the TRBP protein as a new and promising biomarker for the efficient and successful prognosis, diagnosis and (radio-/chemo-)therapy of the disease.
2. Materials and Methods
Cell lines – Culture Conditions
NTHY-ori 3-1, TPC-1 and ARO cell lines were cultured in RPMI 1640 growth medium (61870-010, Gibco, Thermo Fisher Scientific, USA), while RT112, T24, TCCSUP, HCT116-p53+/+, HCT116-p53-/-, WM115, WM266-4, LX-2 and HepG2 cell lines were cultured in DMEM (41966-029, Gibco, Thermo Fisher Scientific, USA) in standard conditions (+37°C and 5% CO2). Medium was supplemented with 10% FBS (16000044, Gibco Thermo Fisher Scientific, USA), 1% penicillin/streptomycin (10378016, Gibco, Thermo Fisher Scientific, USA) and 1% L-glutamine (BEBP17-605E, Lonza, Belgium).
Immunofluorescence
Cells were cultured on 10 mm round coverslips and subsequently fixed in 4% paraformaldehyde (P6148, Sigma-Aldrich, St. Louis, MO, USA) solution, for 10 min, at room temperature. They were membrane-permeabilized by treatment with 0.1% Triton-X 100 (Sigma-Aldrich, St. Louis, MO, USA), followed by blocking with 5% BSA (fraction V), for 1 h. Next, cells were exposed to the anti-TRBP (ab180947, Abcam, Cambridge, UK), anti-PACT (13490, Cell Signaling Technology, Massachusetts, USA), anti-ATF4 (ab245, GenScript, New Jerssey, USA) and anti-α-Tubulin (3873, Cell Signaling Technology, Massachusetts, USA) primary antibodies, overnight, at +4°C. Finally, they were incubated with the Goat anti-Mouse IgG (H+L), Alexa Fluor™ 568 (A-11004, Invitrogen, Thermo Fisher Scientific, USA) and Donkey anti-Rabbit IgG (H+L), Alexa Fluor™ 488 (A-11004, Invitrogen, Thermo Fisher Scientific, USA) secondary antibodies, for 1 h, at room temperature. Vectashield® Mounting Medium with DAPI (Vector Laboratories Inc., California, USA) was used to visualize the nuclei at 405 nm excitation wavelength.
Transient Transfection
LX-2 cells were transiently transfected with the plasmid pcDNA-TRBP (15666, Addgene, UK), using Lipofectamine 2000 (11668027, Invitrogen, Thermo Fisher Scientific, USA), according to manufacturer’s instructions. Cells were collected 48 h post-transfection and processed for further assays.
Pharmacological Interventions – Inhibitors
LX-2 cells were treated with 1 μΜ TAK-981 (32741, Cayman Chemicals, Michigan, USA), 1 μM MLN-4924 (85923, Cell Signaling Technology, Massachusetts, USA), 1 μM Bortezomib (2204, Cell Signaling Technology, Massachusetts, USA), 100 μM U0126 (S1102, Selleckchem, Cologne, Germany), 50 μM SP600125 (S1460, Selleckchem, Cologne, Germany), 100 μM SB203580 (S1076, Selleckchem, Cologne, Germany) and 25 μM MK-2206 (S1078, Selleckchem, Cologne, Germany), for 24 h, and with 0.4 μg/μL Demecolcine (D7385, Sigma-Aldrich, St. Louis, MO, USA), for 6 h, and, then, they were collected, for further assays. DMSO (A3672, Sigma-Aldrich, St. Louis, MO, USA) was used as control (to exclude “solvent effect”).
Cell-Cycle Analysis – Flow Cytometry (FACS)
The variation in the expression levels of TRBP protein at different phases of the cell cycle was evaluated, and quantified, after anti-TRBP-FITC and Propidium Iodide (PI) staining. Briefly, human urothelial bladder cancer cells (T24) were cultured, for 24 h, in the absence or presence of 5 μg/mL Brefeldin A (BFA; Applichem GmbH, Darmstadt, Germany). After harvesting, cells were washed, fixed in 70% ethanol, for 30 min, at -20°C and, next, incubated with the primary antibody anti-TRBP (3 μg/mL), for 30 min, at +4°C. After washing, cells were incubated, for another 30 min, at +4°C, in the dark, with the anti-Rabbit IgG, FITC-labeled, secondary antibody (3 μg/mL). Ribonuclease A (RNase A; 100 μg/mL; Merck, Darmstadt, Germany) was added, to ensure PI-staining only of DNA, for 30 min, at +37oC. Cells were further stained with PI (25 μg/mL) (Biolegend, San Diego, CA, USA), for 15 min, at room temperature, in the dark. Analysis was performed on a BD FACSCelesta™ Flow Cytometer (BD Biosciences, Heidelberg, Germany), using the FACSDiva™ software (BD Biosciences, Heidelberg, Germany).
Quantitative PCR (qPCR)
Total RNA, from transiently transfected LX-2 cells, was extracted using peqGOLD TriFast (30-2010, VWR Life Science, Belgium) and cDNA was, next, synthesized using the PrimeScript RT Reagent Kit with gDNA Eraser (RR047A, TaKaRa Bio, Japan), according to manufacturers’ recommendations. cDNA was amplified in duplicates, on a Roche Light Cycler 96 System. Relative gene expression was calculated, using the 2-ΔCt method. Expression of the TRBP gene was normalized by the reference gene GAPDH.
Mitotic-Cell Rate Quantification
Transiently transfected and inhibitor-treated LX-2 cells were collected, and, subsequently, observed in a Confocal Laser Scanning Microscope (CLSM), after their exposure to the Vectashield® Mounting Medium with DAPI (Vector Laboratories Inc., California, USA), followed by random-field photography and cell counting. Each experiment was repeated 3 times and approximately 300 cells per experiment were counted.
Protein Molecular Modeling
All structures were pre-processed for docking, engaging the Protein Preparation Wizard of Schrödinger Maestro suite [
43]. Experimental structures were retrieved from PDB REDO [
44]. Proteins lacking experimental structural data (e.g., TRBP2 or PACT) were retrieved from AlphaFoldDB [
45]. Predicted structures were further refined with locPREFMD [
46]. TRBP1 structure derived from TRBP2 structure, by truncating the first loop. Machaon’s API method [
47] was employed to extract the secondary structures and conduct pairwise alignments. Alignments were visualized via use of the Biotite Python package, with a coloring matrix suited for 2D alignments. Each structure was docked independently of each other, using the DRBM1 (dsRBD1), DRBM2 (dsRBD2) and DRBM3 (C4) domains of the TRBP2 protein. Docking tests were conducted with the ClusPro web server [
48] and assessed with the Prodigy web server [
49], to predict the dissociation constants of each complex. In the case of Tubulin A1A, docking was constrained to the exposed residues of its bound form in the cytoskeleton network with other Tubulin-family members. PDB 6WSL includes monomers of Tubulin A1A and Tubulin B3 in a complex, and PDBsum [
50] was applied to determine the interacting residues of the Tubulin A1A monomers in the complex. The residue positions were combined, discarding the duplicate positions, and were given as repulsion area for the constrained docking. Two docking operations were conducted for each structure-domain pair, alternating the rigid molecule/flexible ligand roles, as supported by ClusPro. 68 docking operations were carried out and evaluated, in total: [11 proteins x 3 domains x 2 alternative docking roles] and [1 domain x 2 alternative docking roles]. Dockings were selected by their lowest predicted dissociation constants (K
d). A K
d heatmap plot was produced, using the Seaborn Python package. Lowest values are presented with darker tone, referring to stronger association dynamics.
Statistical Analysis
All statistical analyses were conducted using the IBM SPSS version 26 and the obtained results were presented as mean ± SSD (Sample Standard Deviation). Significance was evaluated using Student’s t-test.
3. Results
The two TRBP1 and TRBP2 proteins are almost identical to each other, and they only differ in the presence of a 21 aa sequence, located specifically at the N-terminal end of TRBP2, a consequence of two adjacent-promoter activities that control the alternative synthesis of
TRBP1 (TRBP2-202) and
TRBP2 (TRBP2-201) mRNA transcripts, with
TRBP2 first exon encoding for the additional 21 aa peptide (
Suppl. Figs. 1A and
B) [
19,
21,
33,
41]. Therefore, the two proteins do not seem to have major differences in their properties, although TRBP2 is being presented with slightly stronger activities than TRBP1 in human cells [
30]. Taken together, it is their primary-, secondary-, tertiary- and motif-based structure, extremely, high identities (
Suppl. Figs. 1B-
E) that enable us to consider TRBP1 and TRBP2 as TRBP, which is the reasonably integrated protein term for the present study.
3.1. TRBP-Protein Levels Increase during Cell-Cycle Progression: A G2/M-Enriched Accumulation
To assess TRBP levels during the different phases of cell cycle, we performed flow cytometry analysis of T24 human urothelial bladder-cancer cells (malignancy grade III; p53
ΔY126), stained with anti-TRBP antibody and PI. The protein-secretion inhibitor Brefeldin A (BFA) was used for comparison (
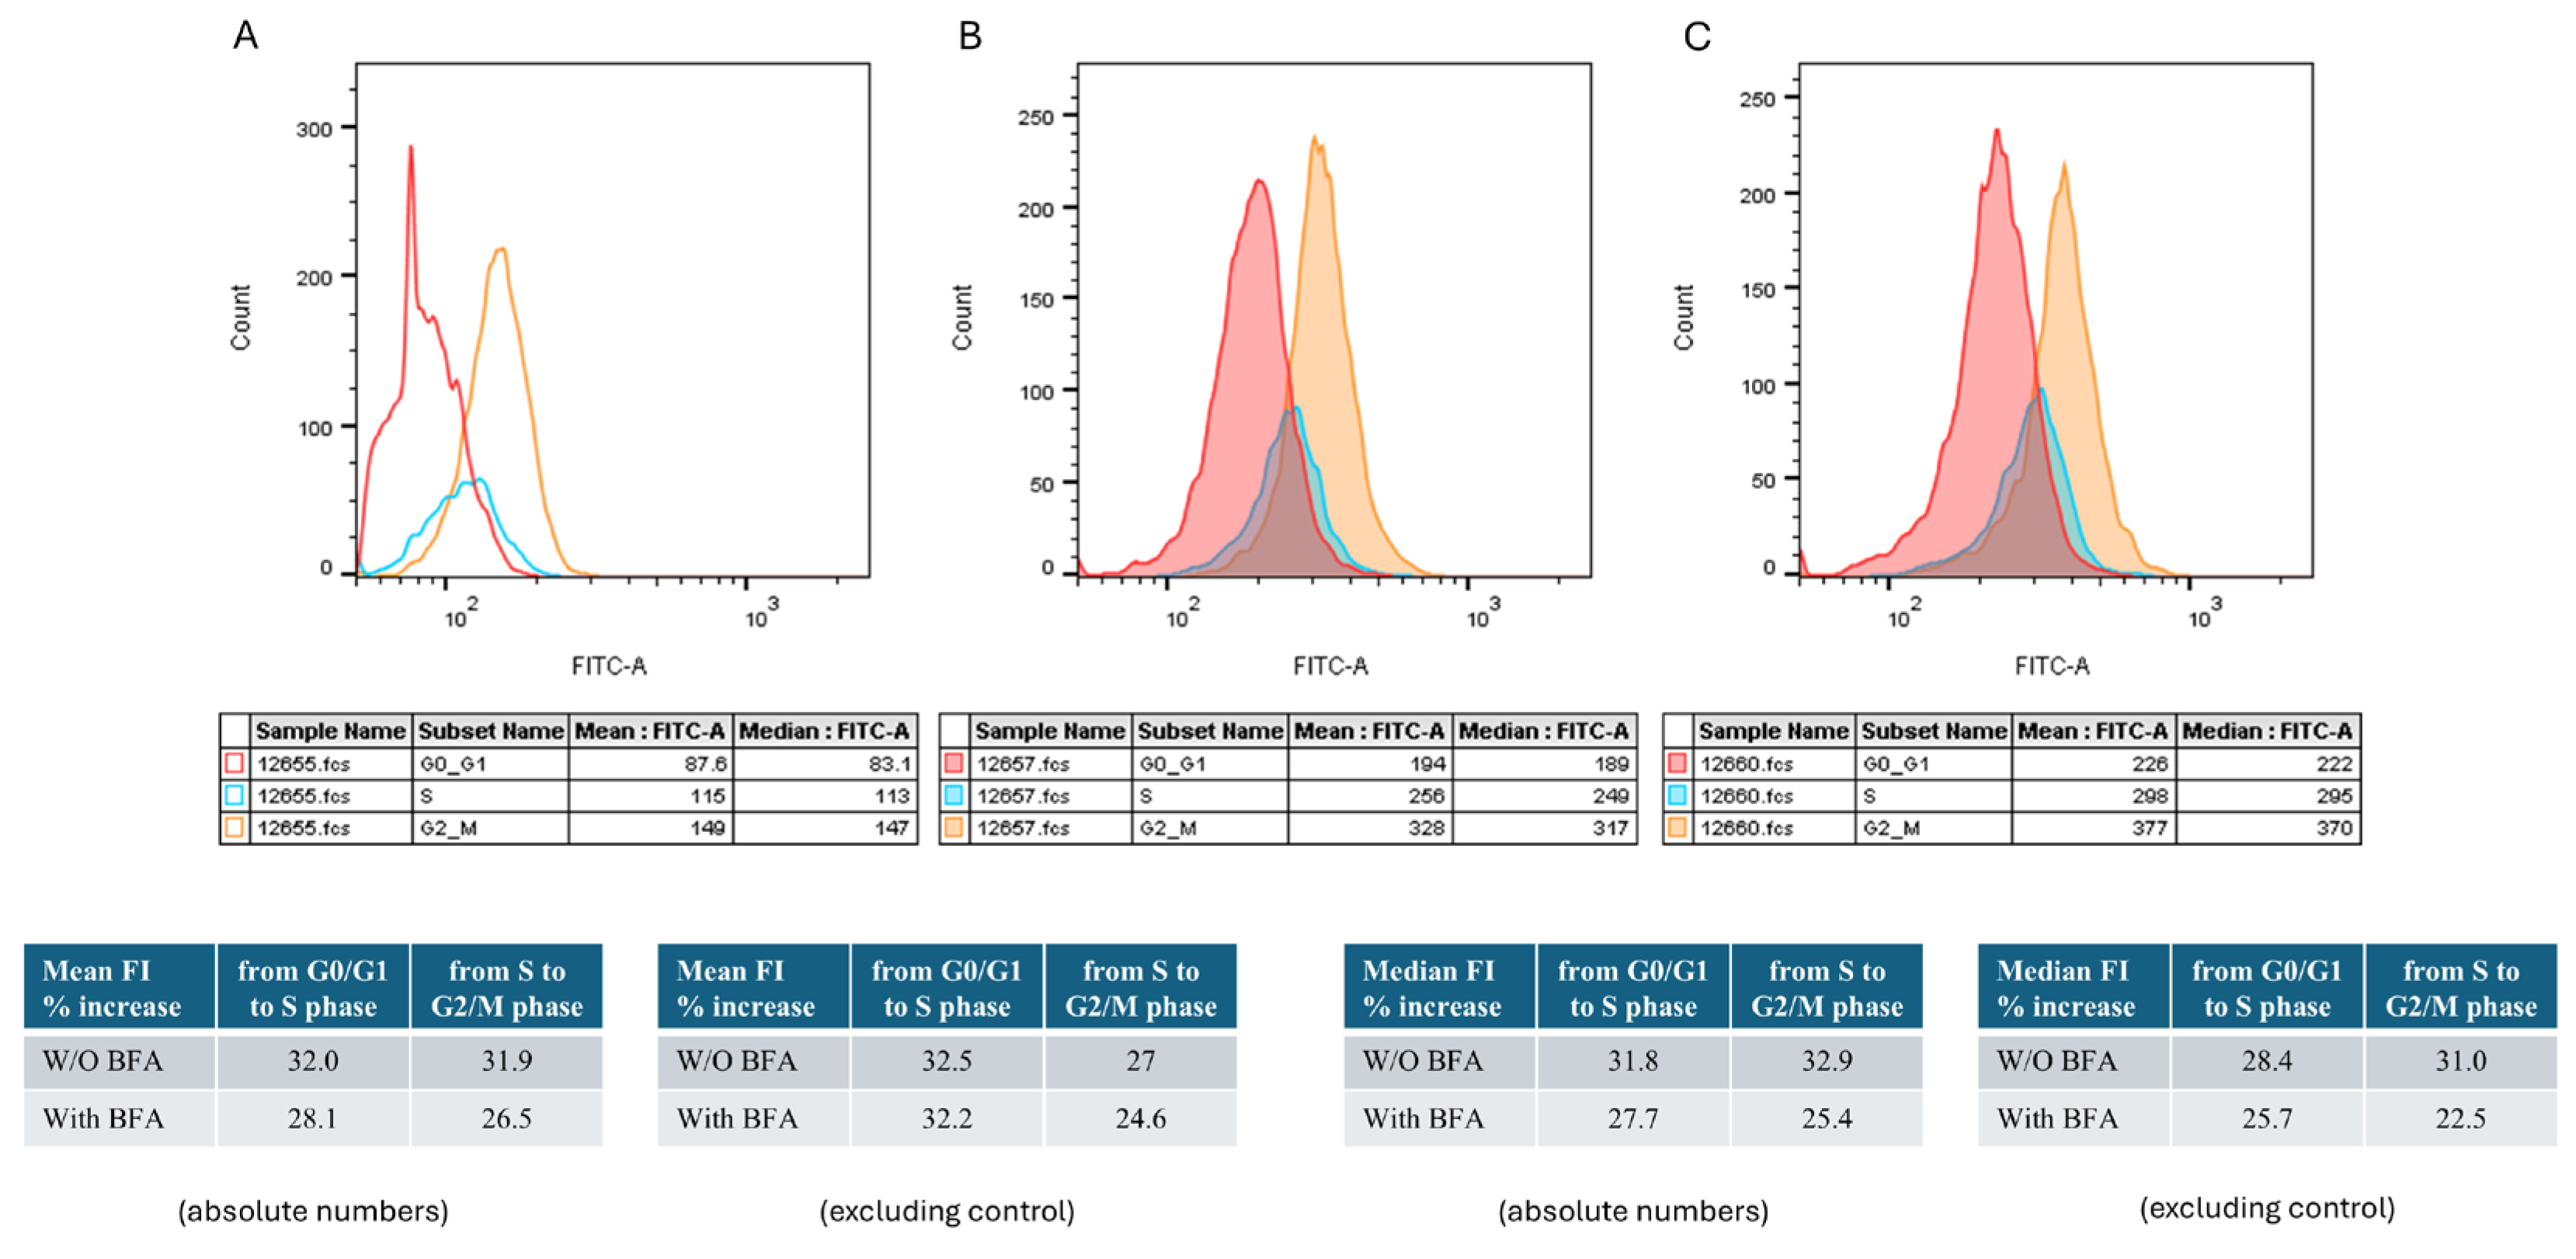
Figure 1). To identify the FITC-positive cells in each of interphase stages, the gating strategy depicted in
Supplementary Figure S2 was used. The mean fluorescence intensity (MFI) of T24 cells showed a gradual increase from G0/G1, through S, to G2/M (194 vs 256 vs 328, respectively) (
Figure 1B). Pre-treatment of T24 cells with BFA did not significantly alter MFI values, which similarly increased during cell-cycle progression (226, 298 and 377, for G0/G1, S and G2/M, respectively) (
Figure 1C). Upon exclusion of the background signal (
Figure 1A), the MFI (%) increase from G0/G1 to S was 32.5% and from S to G2/M was 27%, for T24 cells being cultured in the absence of BFA. Interestingly, the respective (% MFI) values (G0/G1-S and S-G2/M), for the pre-treated with BFA (T24) cells, were measured as 32.2% and 24.6%, respectively, thereby indicating that TRBP is not transported extra-cellularly, in urothelial-carcinoma settings.
3.2. Interphase-Specific Nuclear Accumulation of the TRBP Protein in Human Thyroid Cells
Since TRBP presents the highest level of protein accumulation at the G2/M phase of (T24) cell cycle (
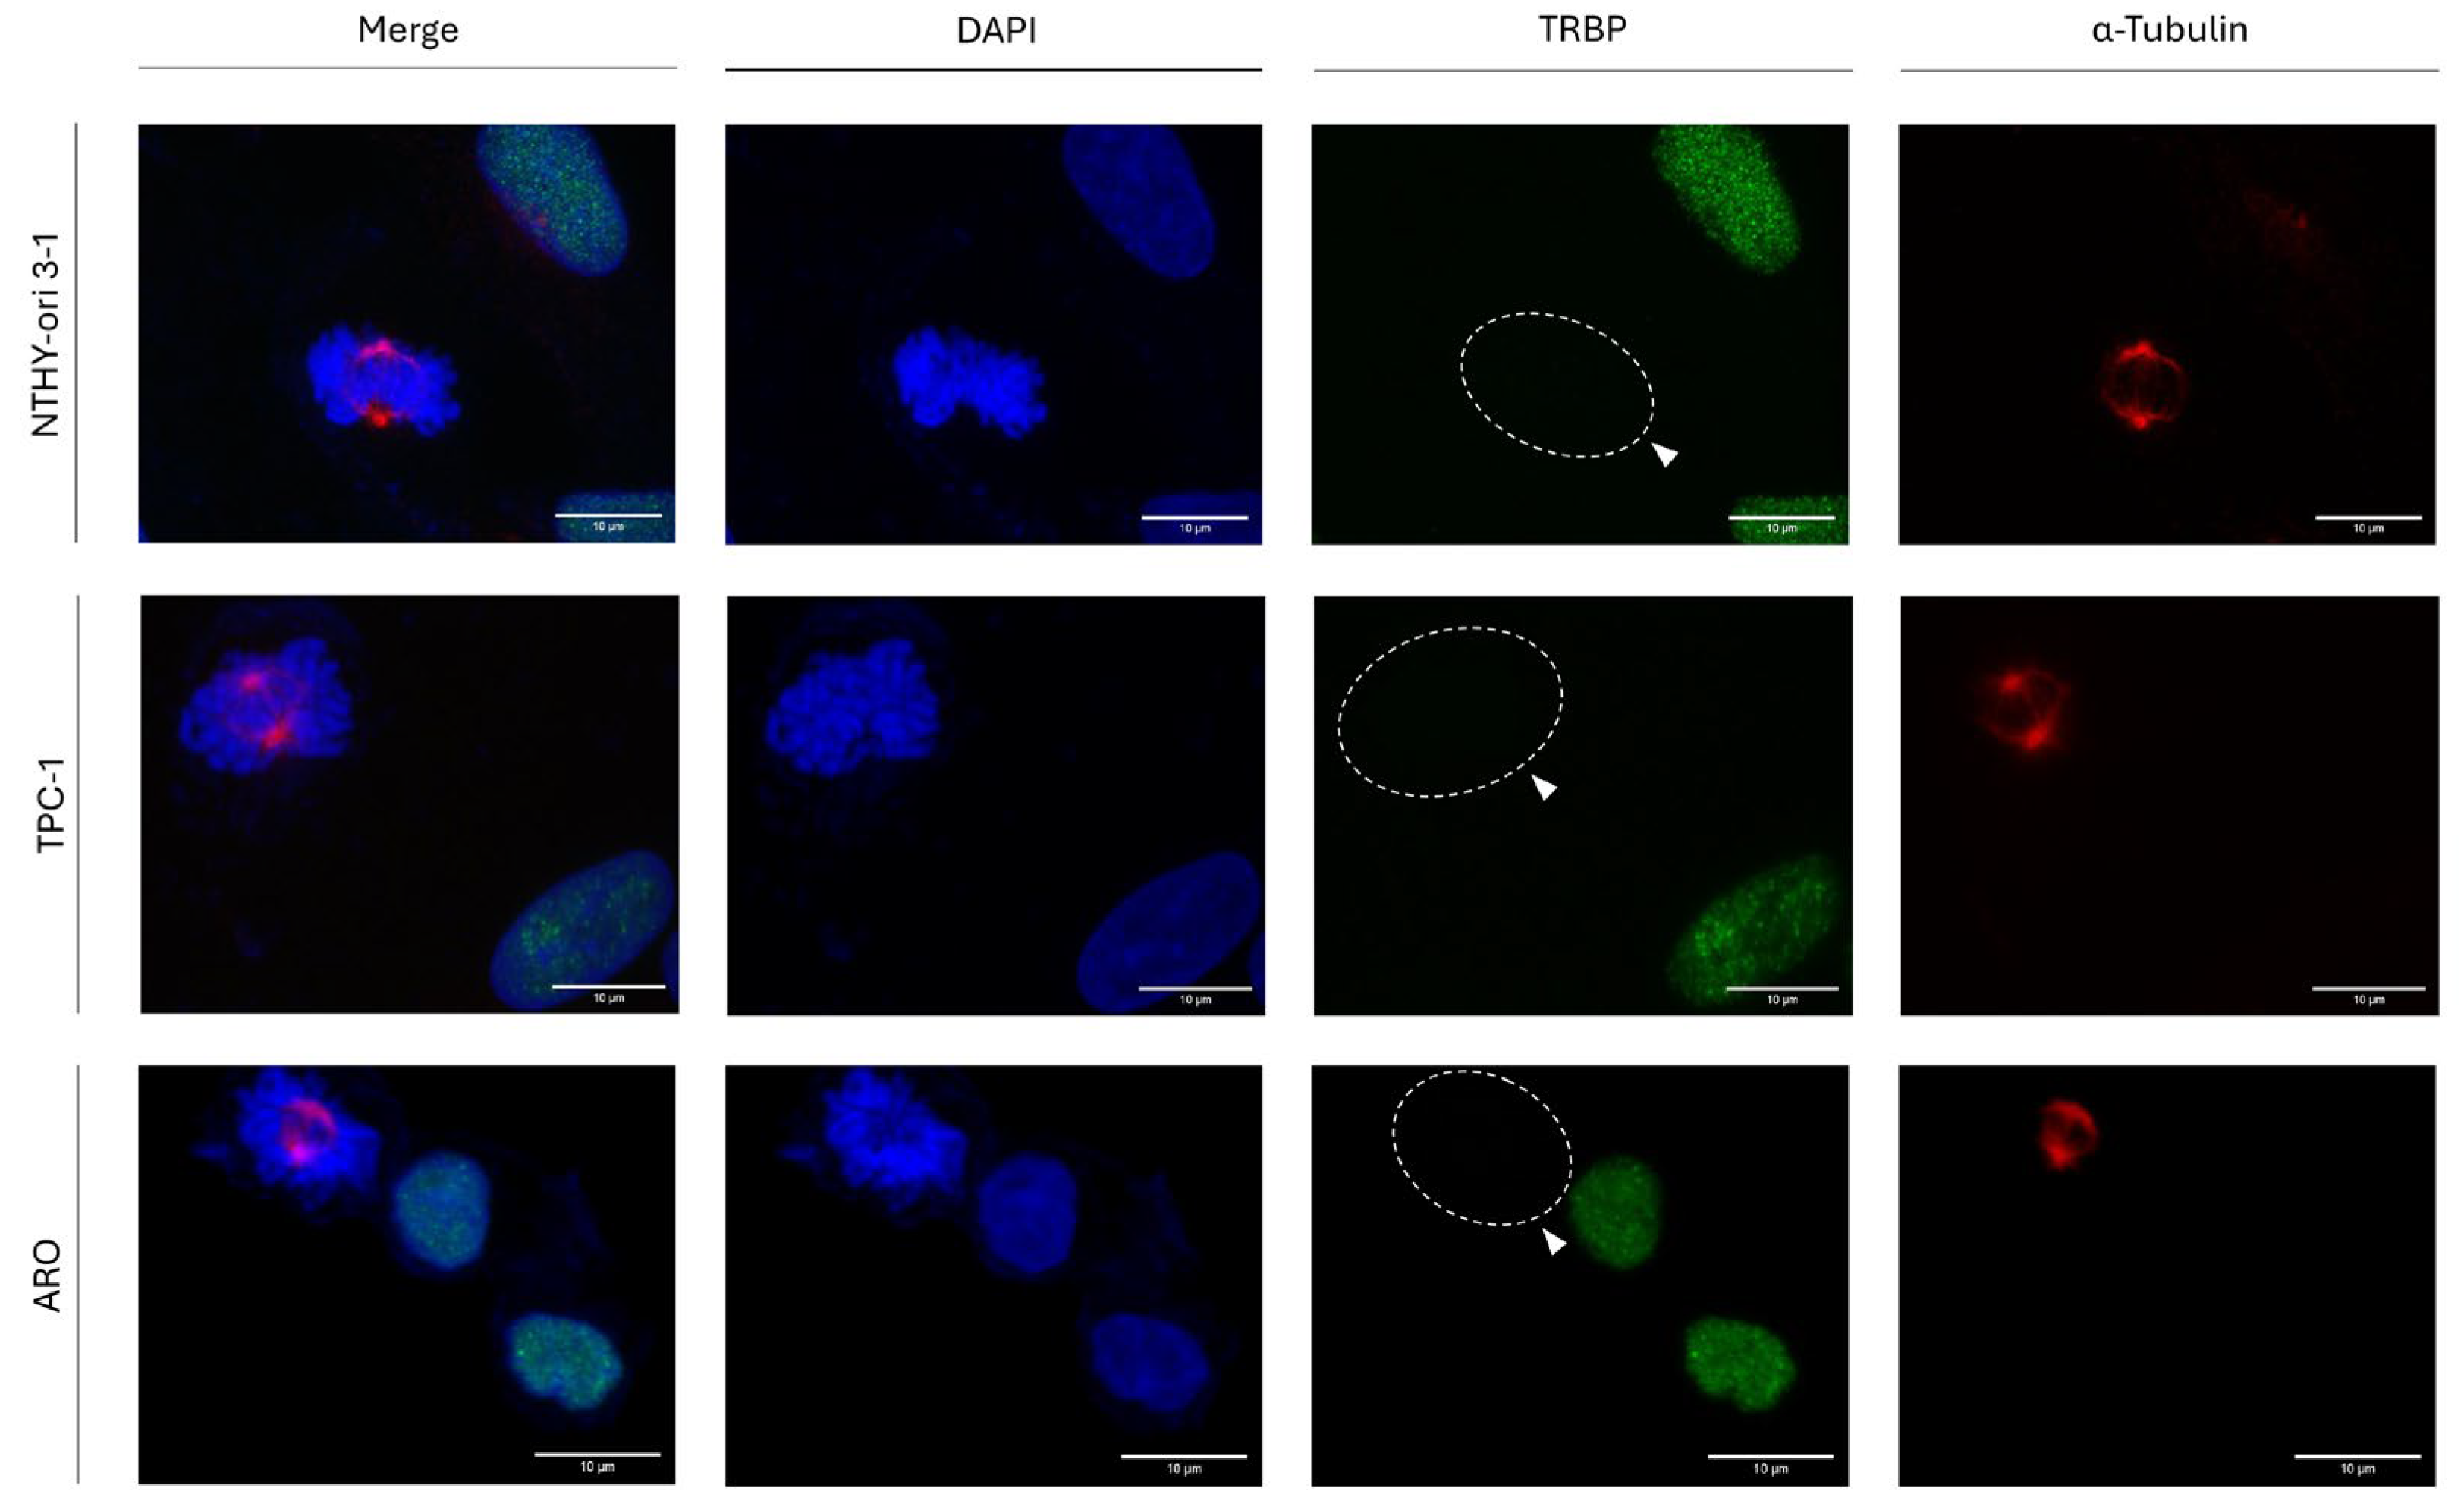
Figure 1), we, next, examined its (TRBP) immunofluorescence-facilitated detection, during interphase and mitosis, attempting to distinguish TRBP’s accumulation profiles in between G2 and M cell-cycle phases. Hence, we thoroughly investigated its protein expression, distribution and accumulation, during both interphase and mitosis, in three different human thyroid cell lines (
Figure 2). Surprisingly, a complete absence of TRBP immunodetection during cell division, and specifically mitosis (determined by α-Tubulin/Microtubules immunostaining and mitotic-spindle formation), was observed in all the examined cells of: (a) the normal thyroid-cell line NTHY-ori 3-1 (human thyroid follicular-epithelial cells), and (b) the thyroid-cancer cell lines TPC-1 (human papillary-thyroid carcinoma) and ARO (human thyroid-anaplastic carcinoma), herein, used. Strikingly, in contrast to mitotic cells, interphase cells were characterized by strong TRBP nuclear signals (
Figure 2).
These results indicate a novel, regulatory, role of TRBP in cell-cycle progression. It is the remarkably reduced expression of the protein (TRBP) that seems harmful for the successful implementation and completion of thyroid-cell mitosis, regardless of the immortalized (NTHY-ori 3-1) or oncogenic (TPC-1 and ARO) cellular backgrounds.
3.3. Mitosis-Dependent Downregulation of TRBP Expression in Human Urothelial Bladder-Cancer Cells
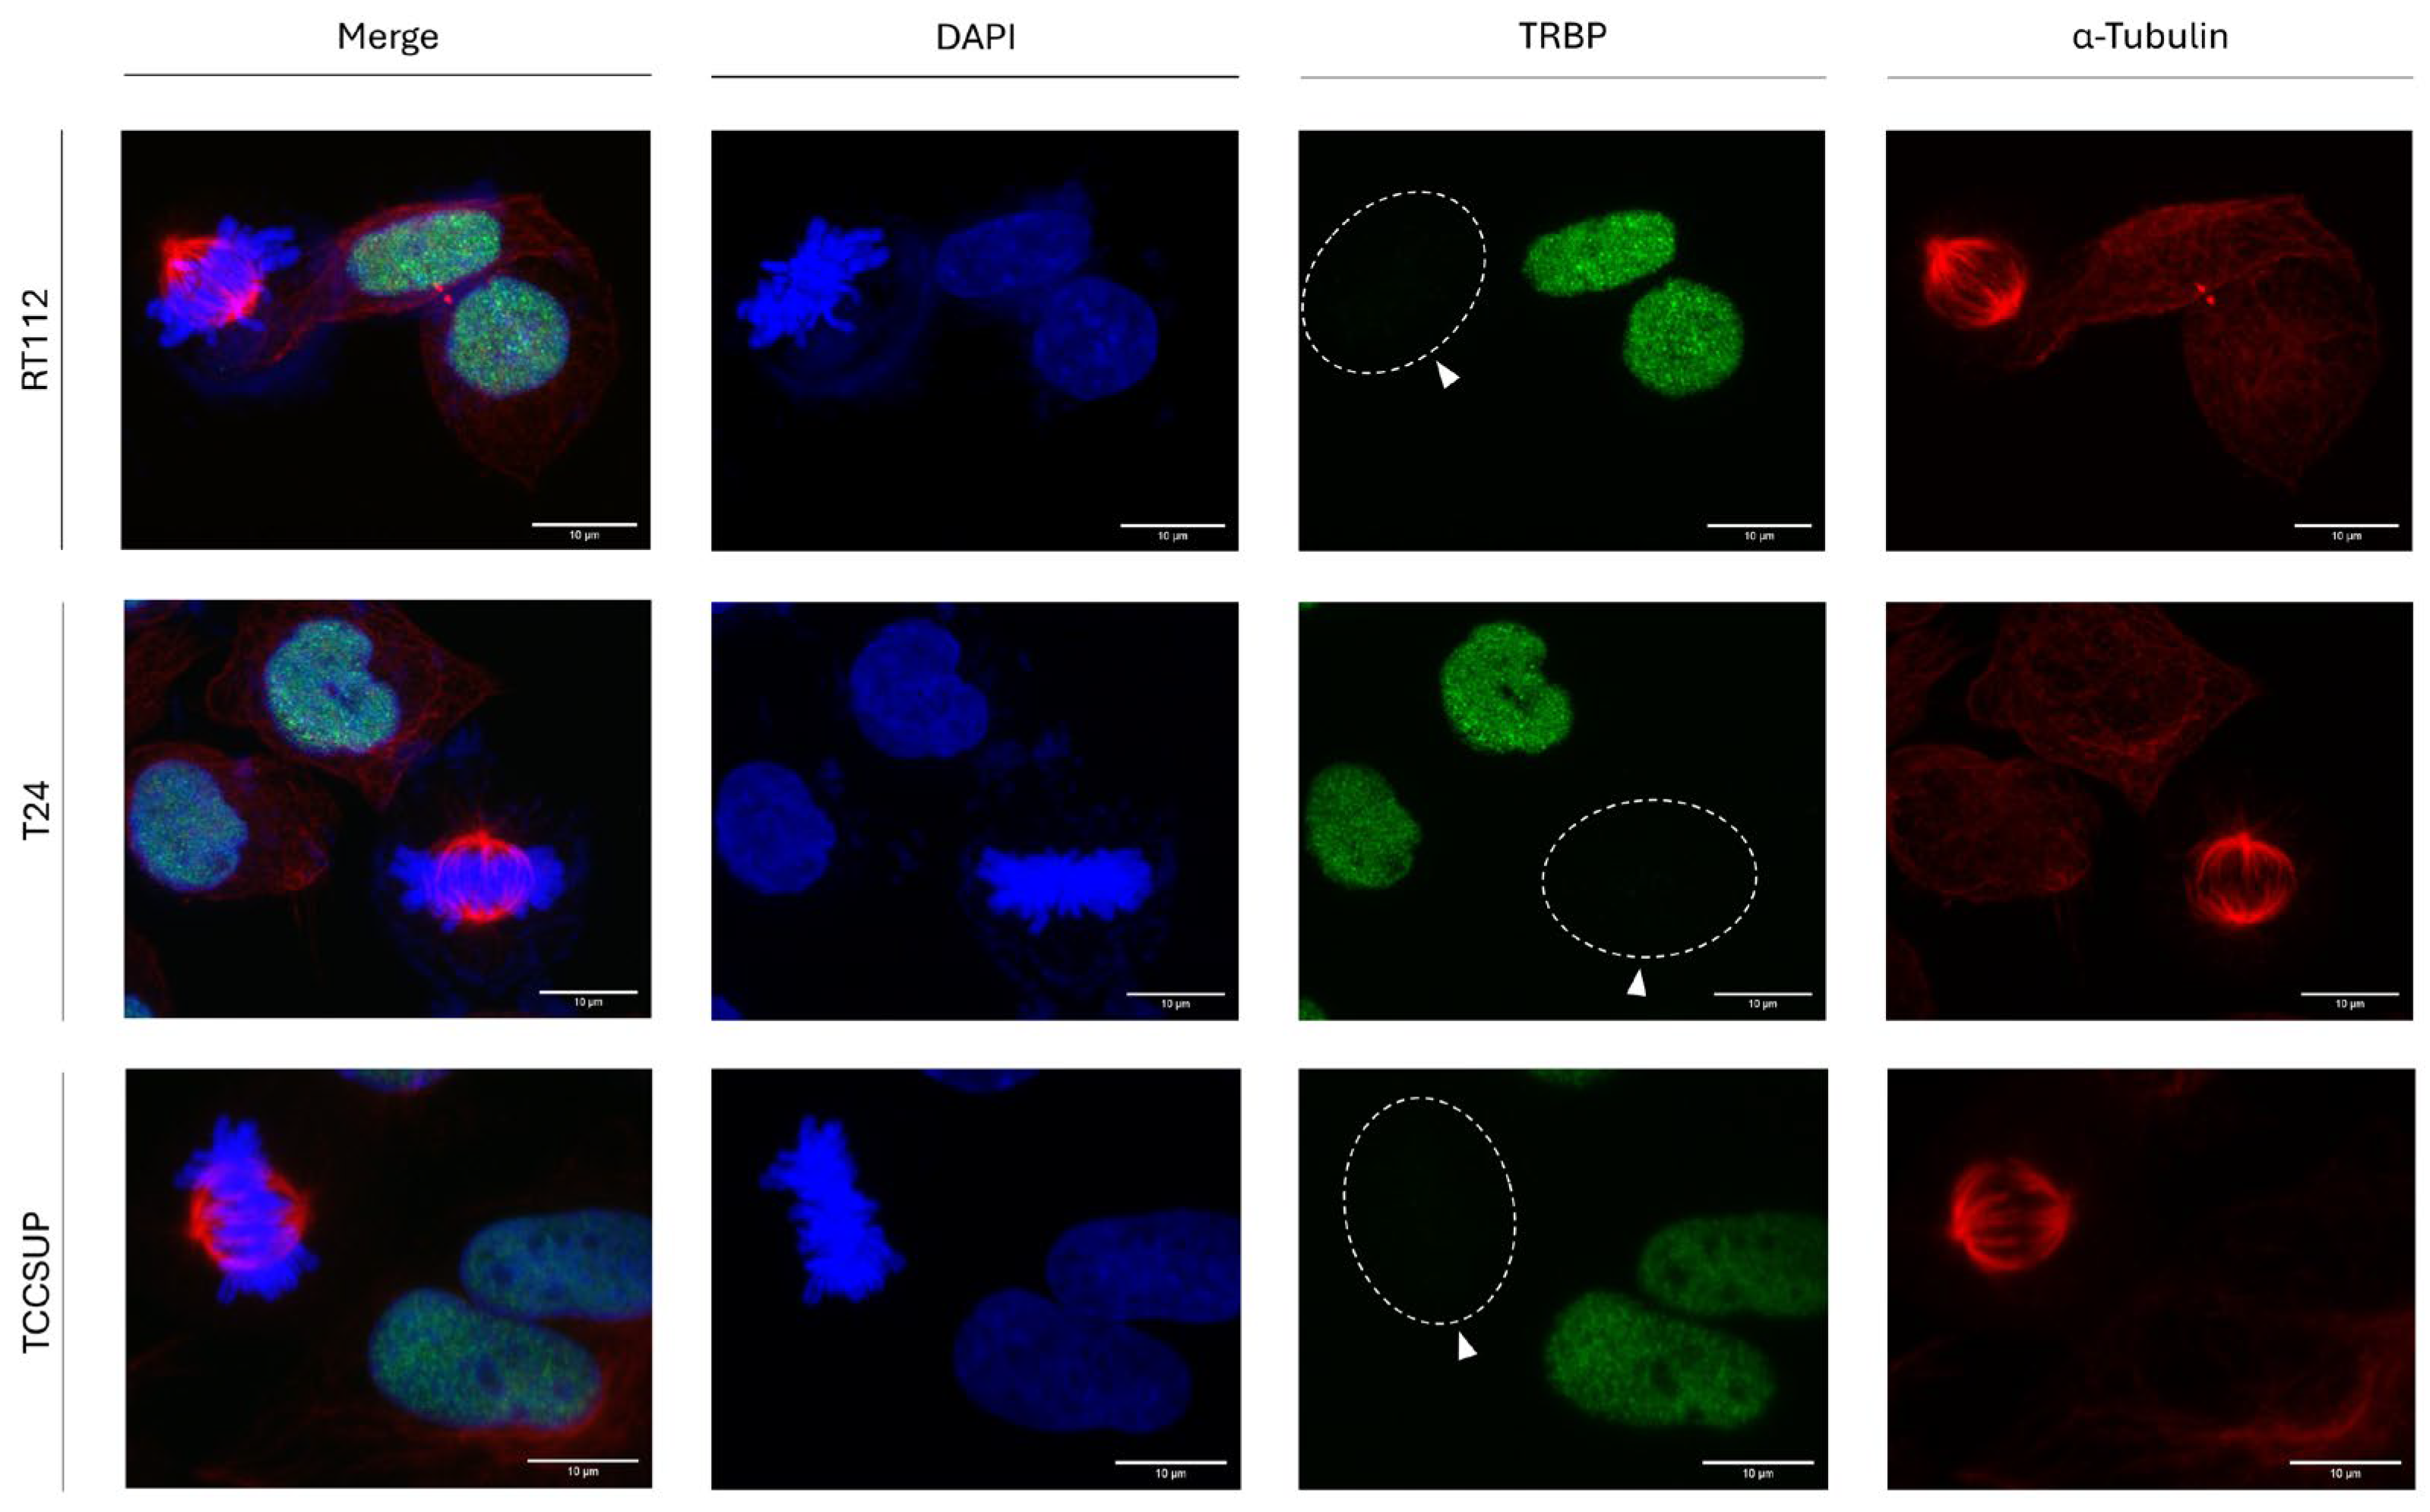
To investigate whether mitosis-dependent downregulation of TRBP is specific for thyroid -cancer- cells, we, next, examined its (TRBP) protein-expression profiles in the three human urothelial bladder-cancer cell lines (a) RT112 (malignancy grade I/II), (b) T24 (malignancy grade III) and (c) TCCSUP (malignancy grade IV). Most importantly, it proved that TRBP immunodetection follows the same pattern, just like in thyroid cells, for all the three different bladder-cancer cell lines, herein, studied, with TRBP-protein expression being completely missing from mitotic cells, but readily detected in interphase bladder-cancer cell nuclei, for all analyzed cells (
Figure 3). Our findings not only demonstrate the universality of this novel phenomenon, but, also, dictate the functionality of a common molecular mechanism that can act independently of the malignancy grade and tumor-tissue origin, thus strongly supporting the essential contribution of TRBP, as a negative regulator, to -successful- mitosis implementation, in bladder-carcinoma environments.
3.4. p53-Protein Activity Is Not Required for TRBP Downregulation during Mitosis in Human Colon-Cancer Cells
Considering that, in contrast to RT112, T24 cells carry a loss-of-function mutation in the
TP53-gene locus (p53
ΔΥ126) [
51], we, next, reasoned that the tumor-suppressor protein p53 may not get involved in the TRBP regulation during cell division. To further examine our argument in a setting that, besides a
TP53 -detrimental- deletion, does not contain additional genetic lesions, we, next, used the human colon-cancer cell line HCT116-p53
-/- that lacks
TP53-gene activity, to check TRBP-expression profile, during mitosis, in the absence of p53 protein, with the parental HCT116-p53
+/+ counterpart colon-cancer cells that express the wild-type p53-protein form being used as suitable control. Both HCT116-p53
-/- and HCT116-p53
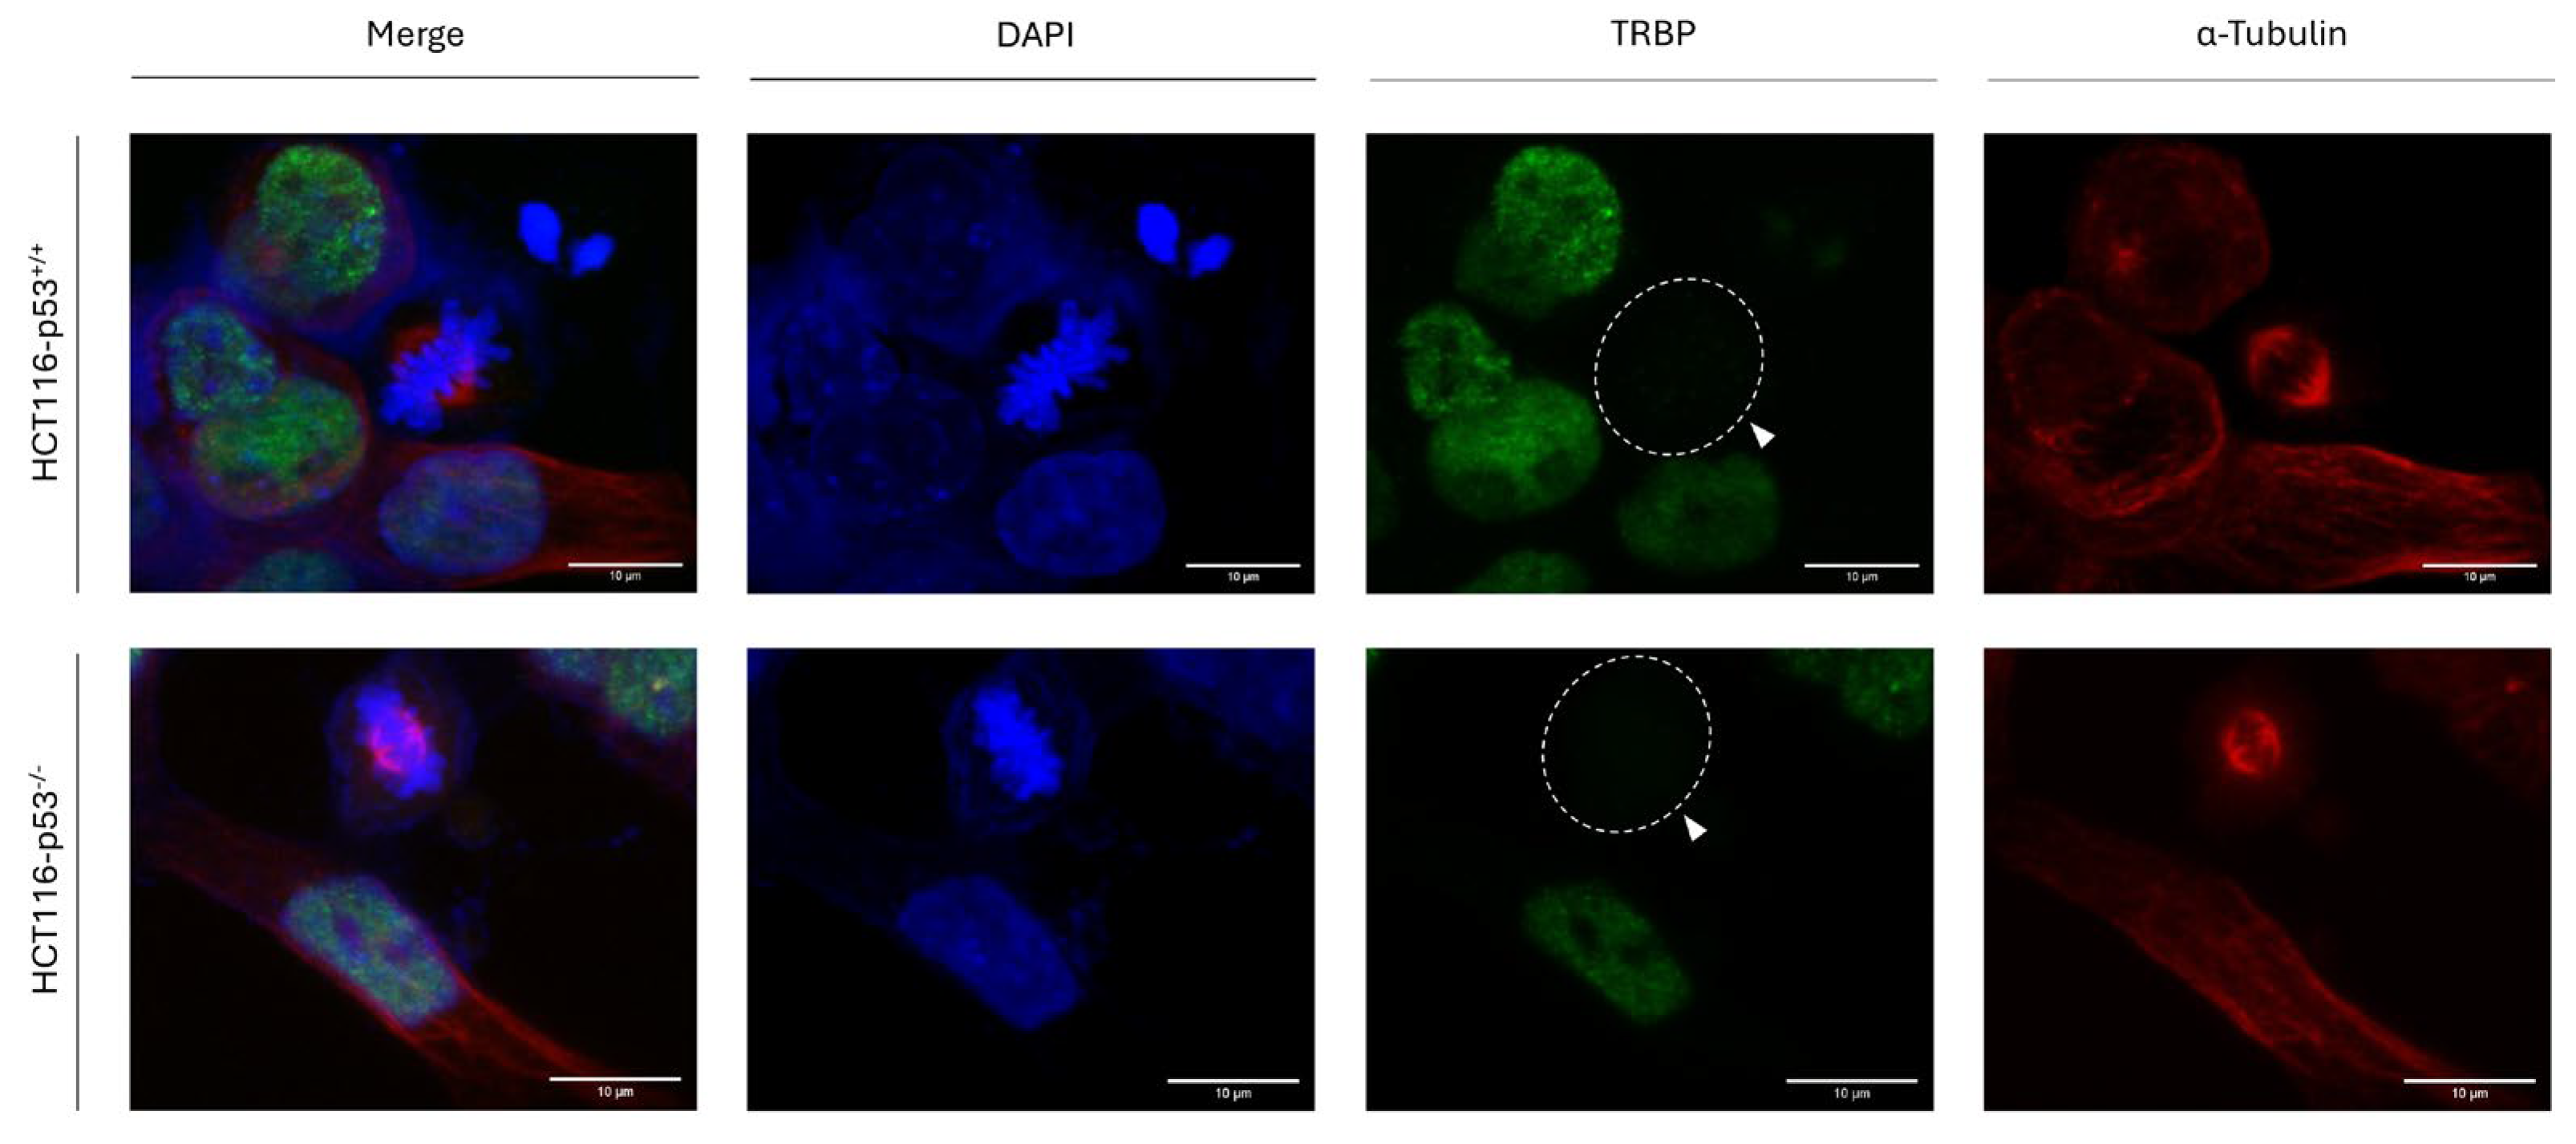
+/+ cell types were characterized by the disappearance of TRBP immunofluorescence-mediated (TRBP-negative) detection exclusively in mitotic cells, with all interphase cells exhibiting strong nuclear (TRBP-positive) signals (
Figure 4). Our results clearly unveil a p53-independent mechanism of TRBP downregulation during mitosis, which seems to act for bladder- and colon-carcinomas in highly similar fashions, and regardless of the tumor-tissue origins.
3.5. Metastasis-Independent Control of TRBP Elimination during Human Melanoma-Cell Division
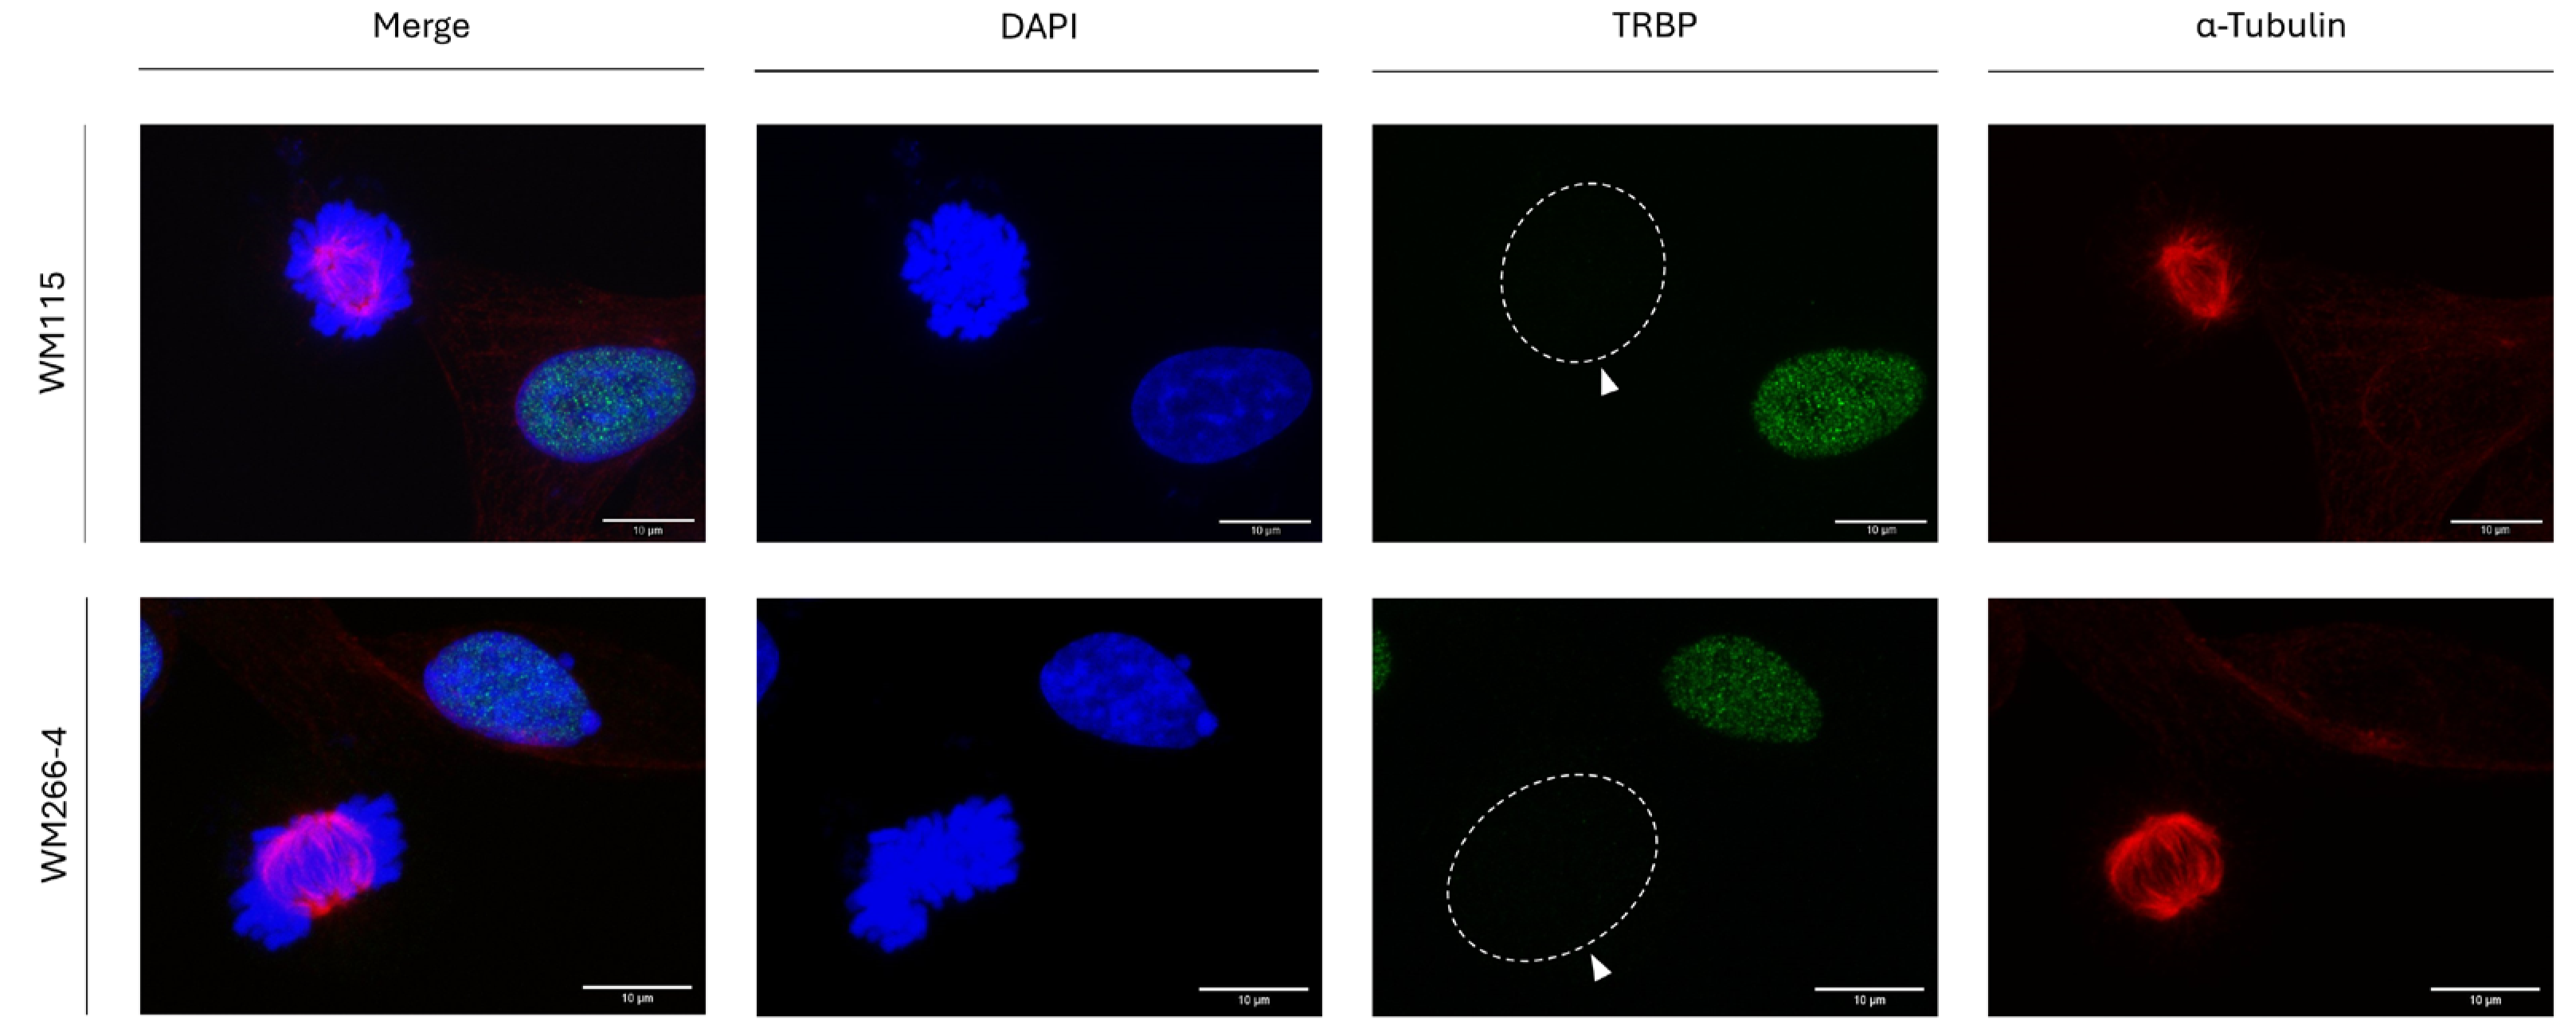
Given that RT112 and T24 cells also differ in their metastatic features, with T24 presenting tumor xenograft-emanated strong metastatic activities in SCID (severe combined immunodeficient) mice (data not shown; manuscript in preparation), metastasis-controlling programs do not seem to be critically involved in TRBP elimination during mitosis. To further expand and strengthen our rationale, we, next, analyzed the TRBP protein-expression profiles in pre-metastatic (WM115) and metastatic (WM266-4) human melanoma cells, both having been derived from the same patient (thus, excluding a plethora of genetic variations, polymorphisms and metastasis-irrelevant mutations). Since WM115 and WM266-4 human melanoma-cell lines are both characterized by the lack of TRBP detection in all mitotic cells, and by the simultaneous TRBP presence in all interphase-cell nuclei examined (
Figure 5), metastasis-dependent mechanisms must play non-essential, or dispensable/redundant, roles in mitosis-specific TRBP elimination in human melanoma (and urothelial-bladder carcinoma;
Figure 3) settings.
3.6. Oncogenesis-Independent loss of TRBP Immunodetection in Human Hepatic Cells Undergoing Mitosis
To examine the oncogenicity-network independence of TRBP-protein loss in a cellular system other than thyroid-cell mitosis (
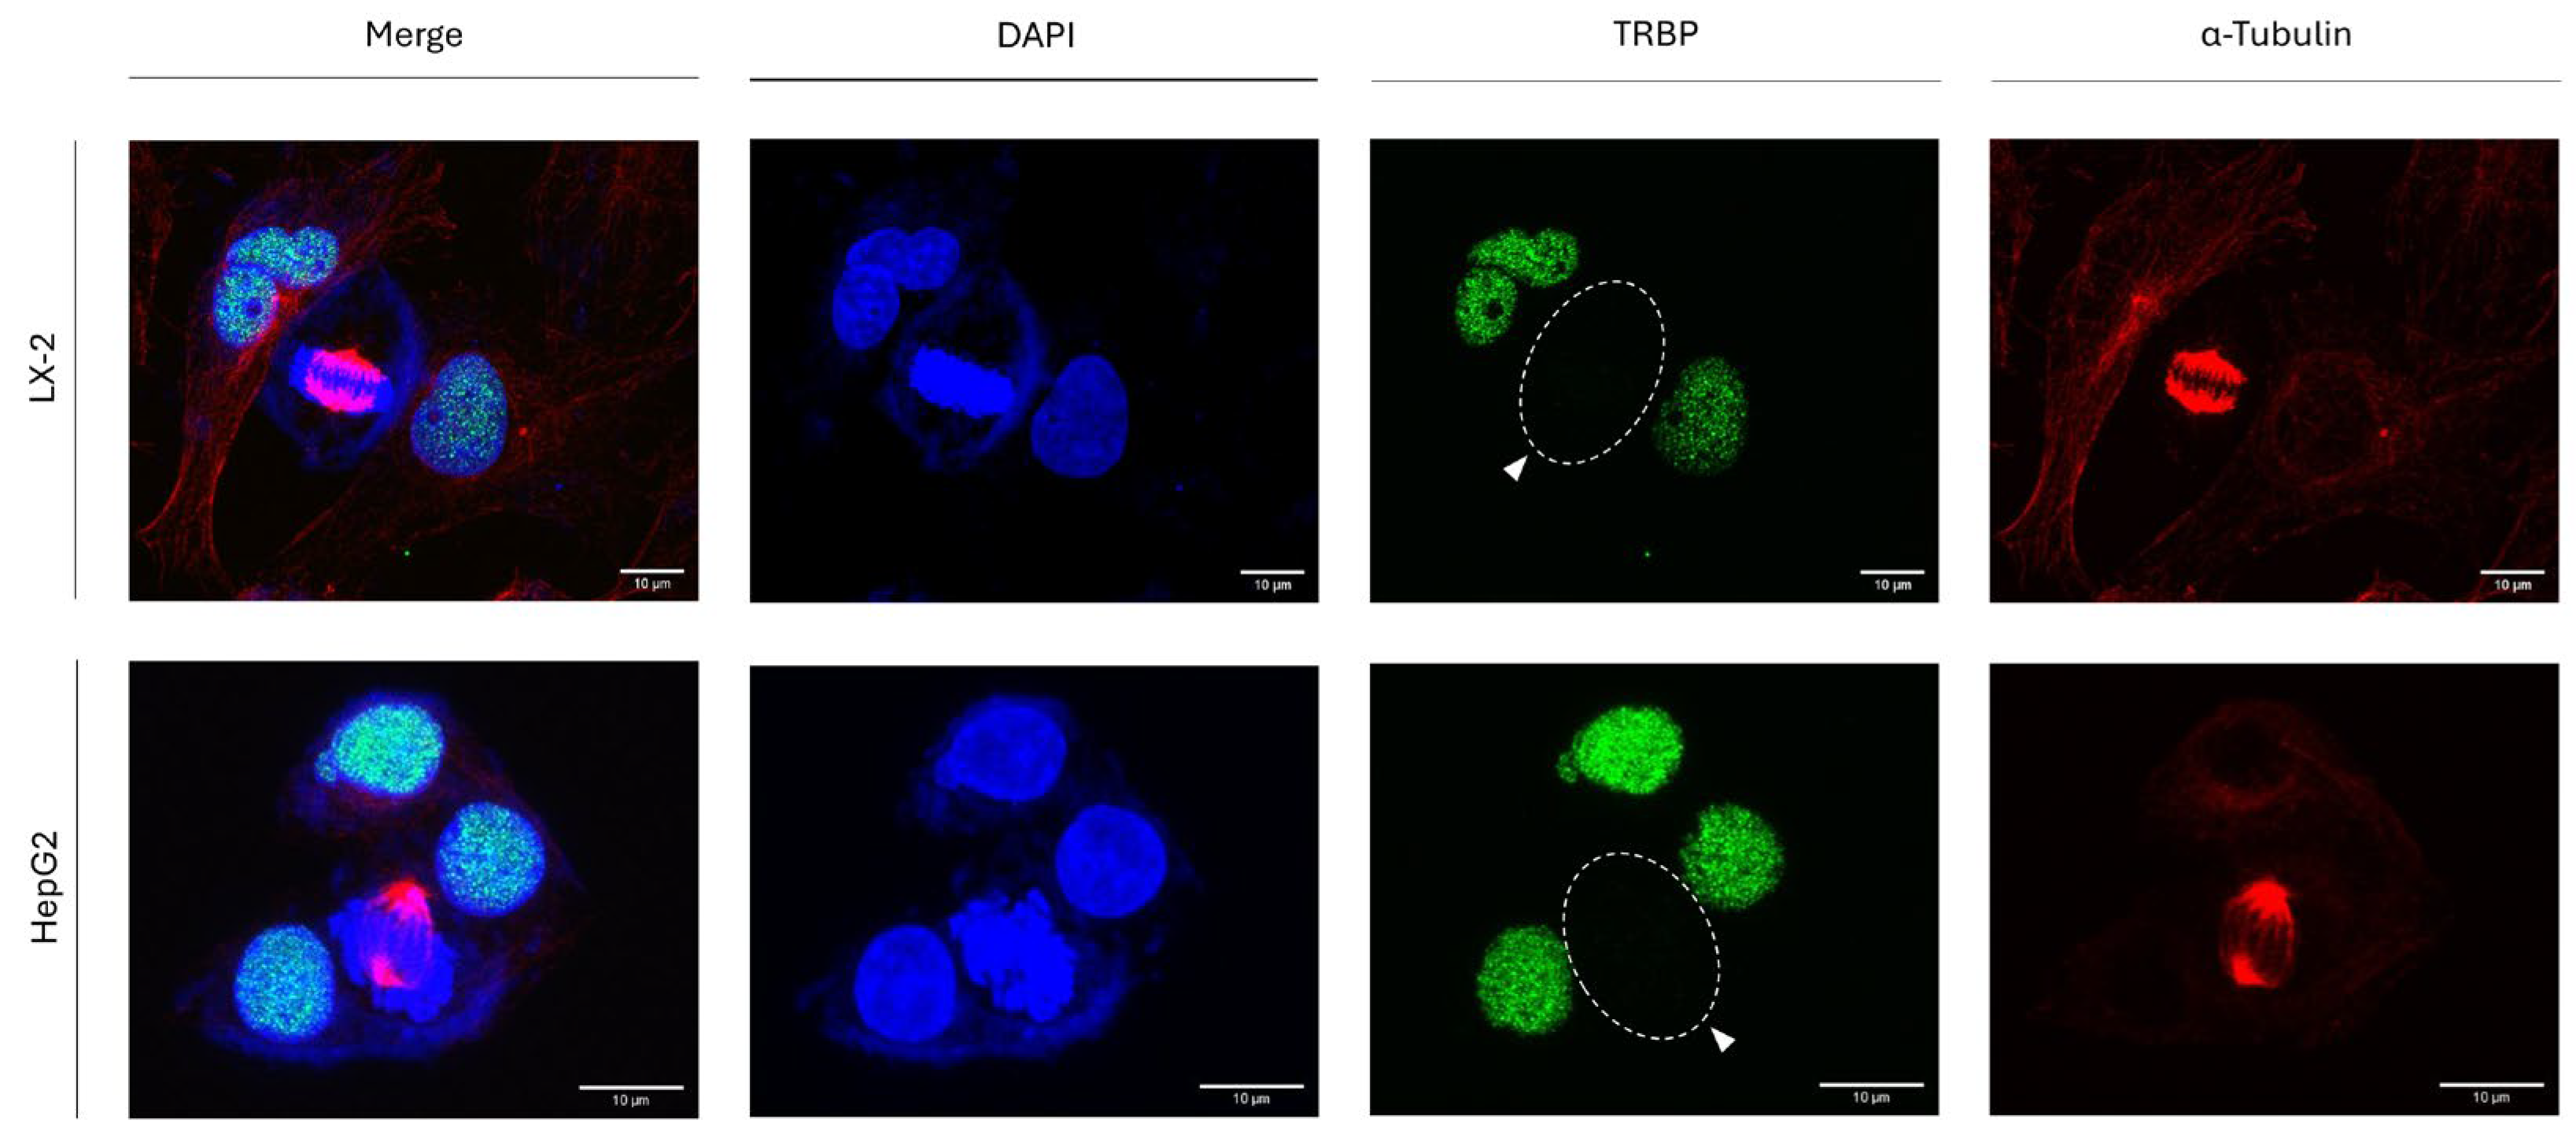
Figure 2), we, next, investigated the TRBP-expression patterns in human hepatic-stellate (LX-2) and human hepatocellular-carcinoma (HepG2) cells, during cell division. Similarly to human thyroid cells (
Figure 2), both LX-2 and HepG2 human hepatic cells are presented with simultaneous profiles of mitosis-specific TRBP loss and interphase-exclusive TRBP accumulation in the nuclear compartment of all analyzed cells (
Figure 6). Taken together, it seems that both thyroid and hepatic cells engage indistinguishable mechanisms (a) to strongly retain TRBP in the nucleus during interphase and (b) to specifically eliminate TRBP in mitosis-subjected cells, following oncogenesis-independent patterns. It is neither the oncogenic -mutational- signature(s) nor the tumor-tissue origin(s) that can control the universality of TRBP-loss phenotype in human cells undergoing mitosis.
3.7. Mitotic Phase-Dependent Control of TRBP Downregulation in LX-2 Hepatic Cells
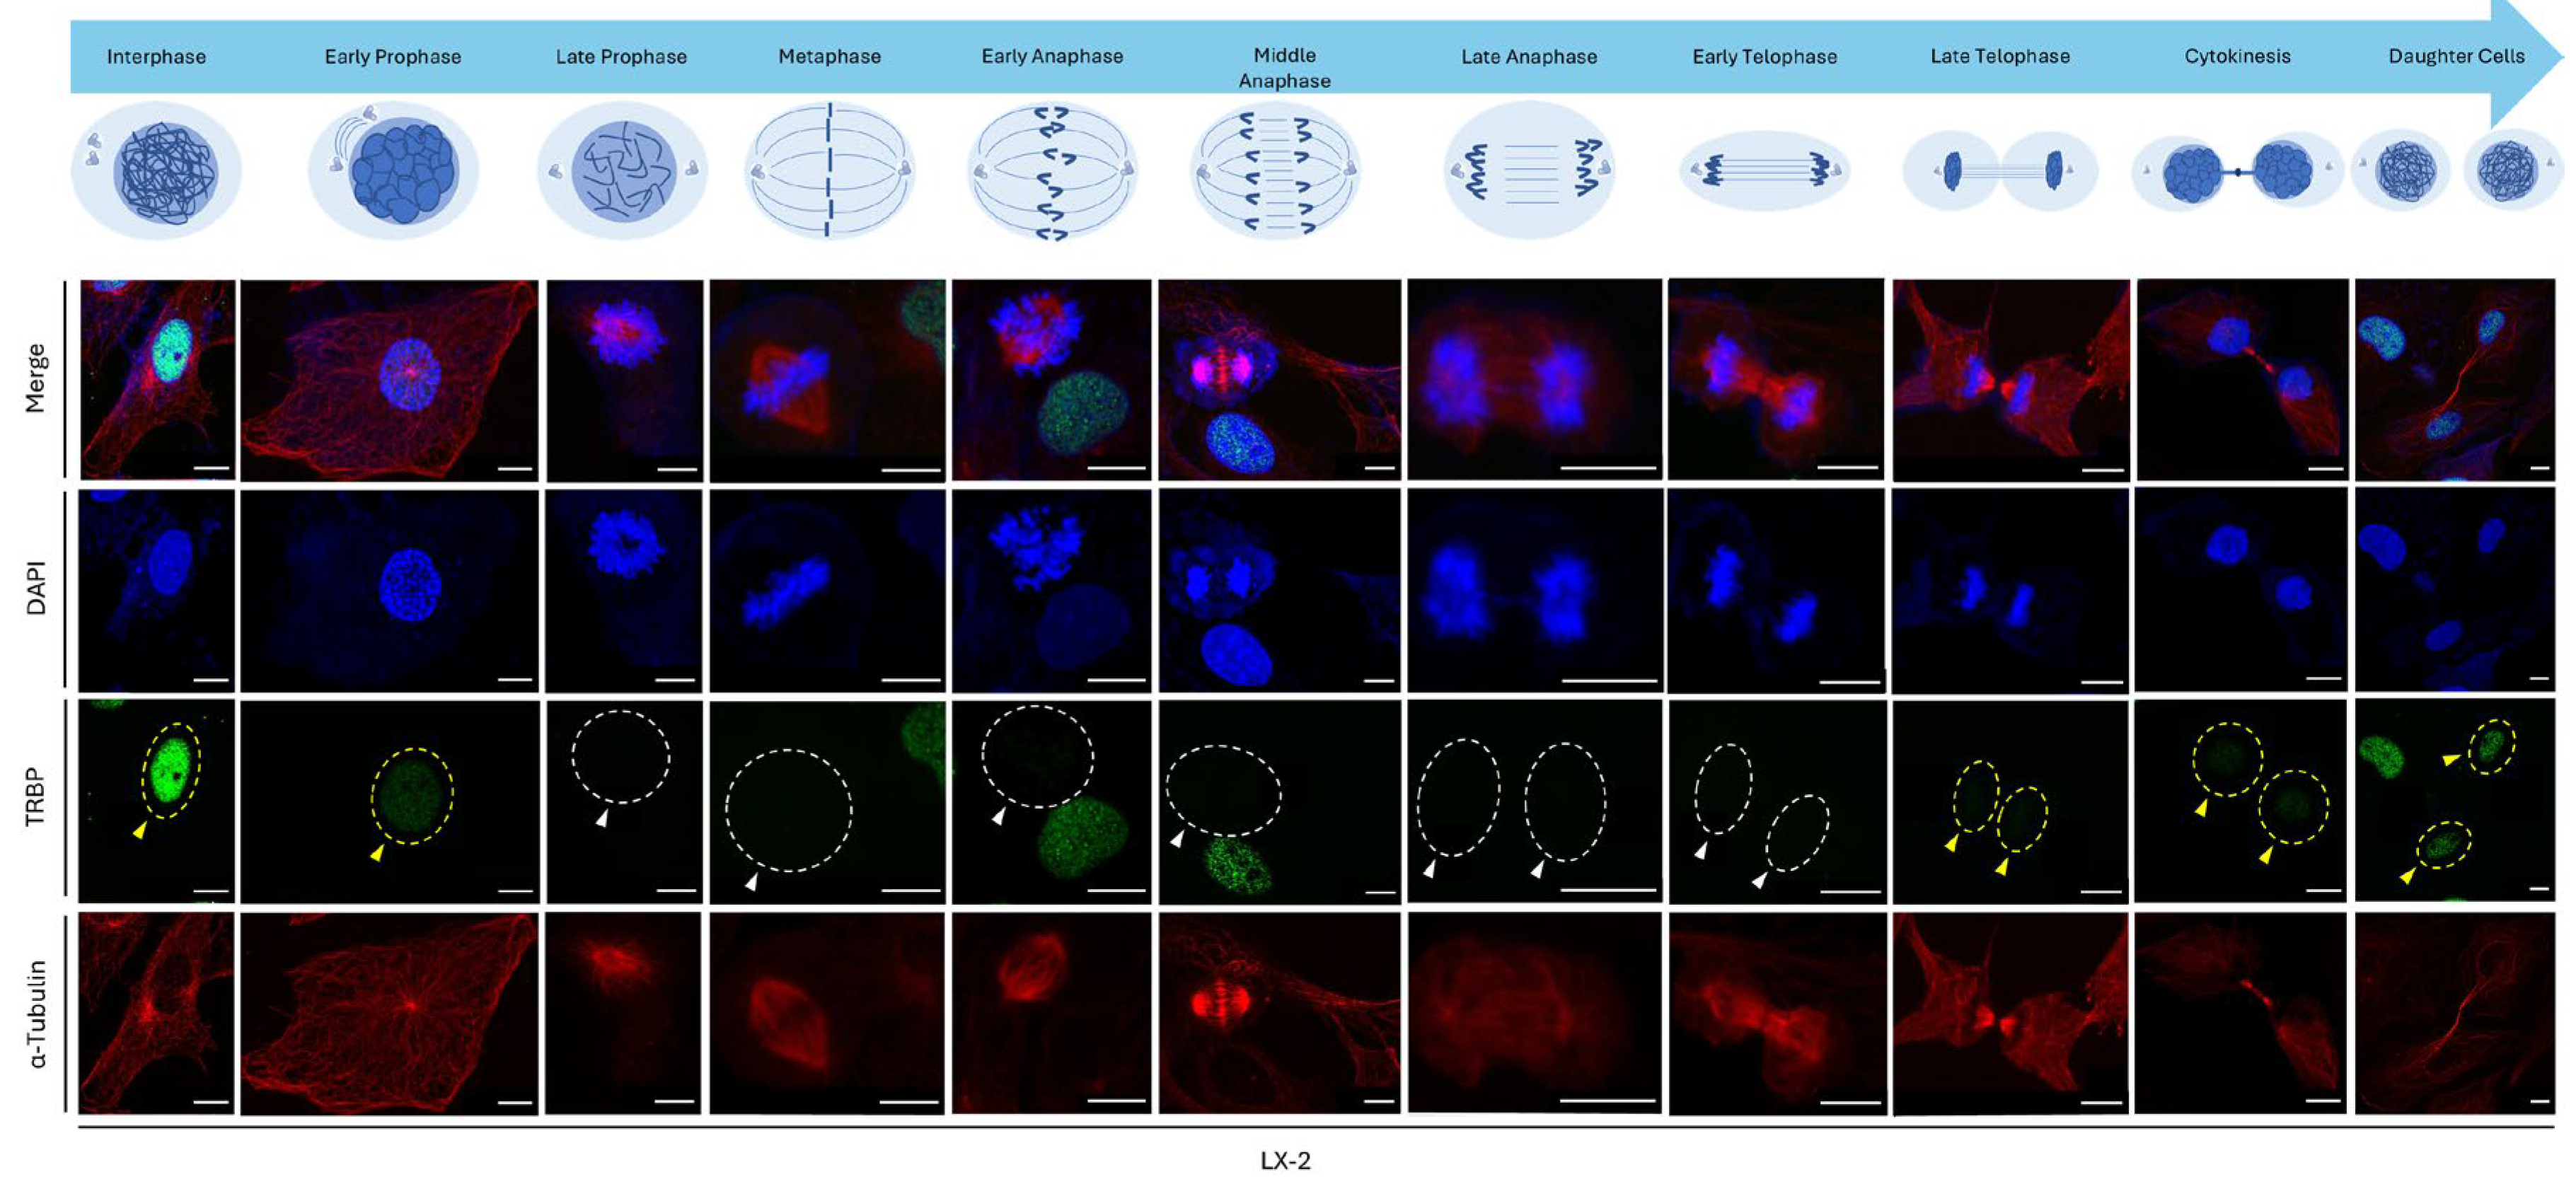
Given the major alteration (loss) of immunofluorescence-facilitated TRBP-expression imaging during mitosis, we further examined TRBP-immunodetection profiles at each individual stage of the mitotic process; namely, from interphase and early prophase to late telophase, cytokinesis, and daughter-cell stages. Remarkably, LX-2 hepatic cells showed strong TRBP signal in the interphase nucleus, which was significantly reduced at the early-prophase stage and completely lost at late prophase (
Figure 7). TRBP nuclear staining was eliminated from late-prophase to early-telophase (including metaphase, early anaphase, middle anaphase, and late anaphase) stages, while its (TRBP) signal was gradually captured again from late telophase to cytokinesis and daughter-cell stages that marked the completion of mitosis (
Figure 7). Of note, the TRBP-nuclear signal was fully recovered during formation of the -two- daughter cells, which defined the completion of (LX-2) hepatic-cell division (
Figure 7). This tight control for the TRBP loss during mitosis could be recognized in all the examined LX-2 hepatic cells, rendering TRBP a, novel, negative regulator for mitotic apparatus, and cell-proliferation and -growth machineries.
3.8. Hepatic and Colon-Cancer Cells Express PACT Protein during Both Interphase and Mitosis Stages
Since PACT (a) constitutes a TRBP paralog, (b) presents remarkable similarities in its primary, secondary (2D) and tertiary (3D) structures to the TRBP respective ones (including in silico motifs) (
Suppl. Figs. S1A-E), (c) interacts with TRBP, (d) belongs to the RISC-loading complex and (e) facilitates the DICER-mediated production of miRNAs [
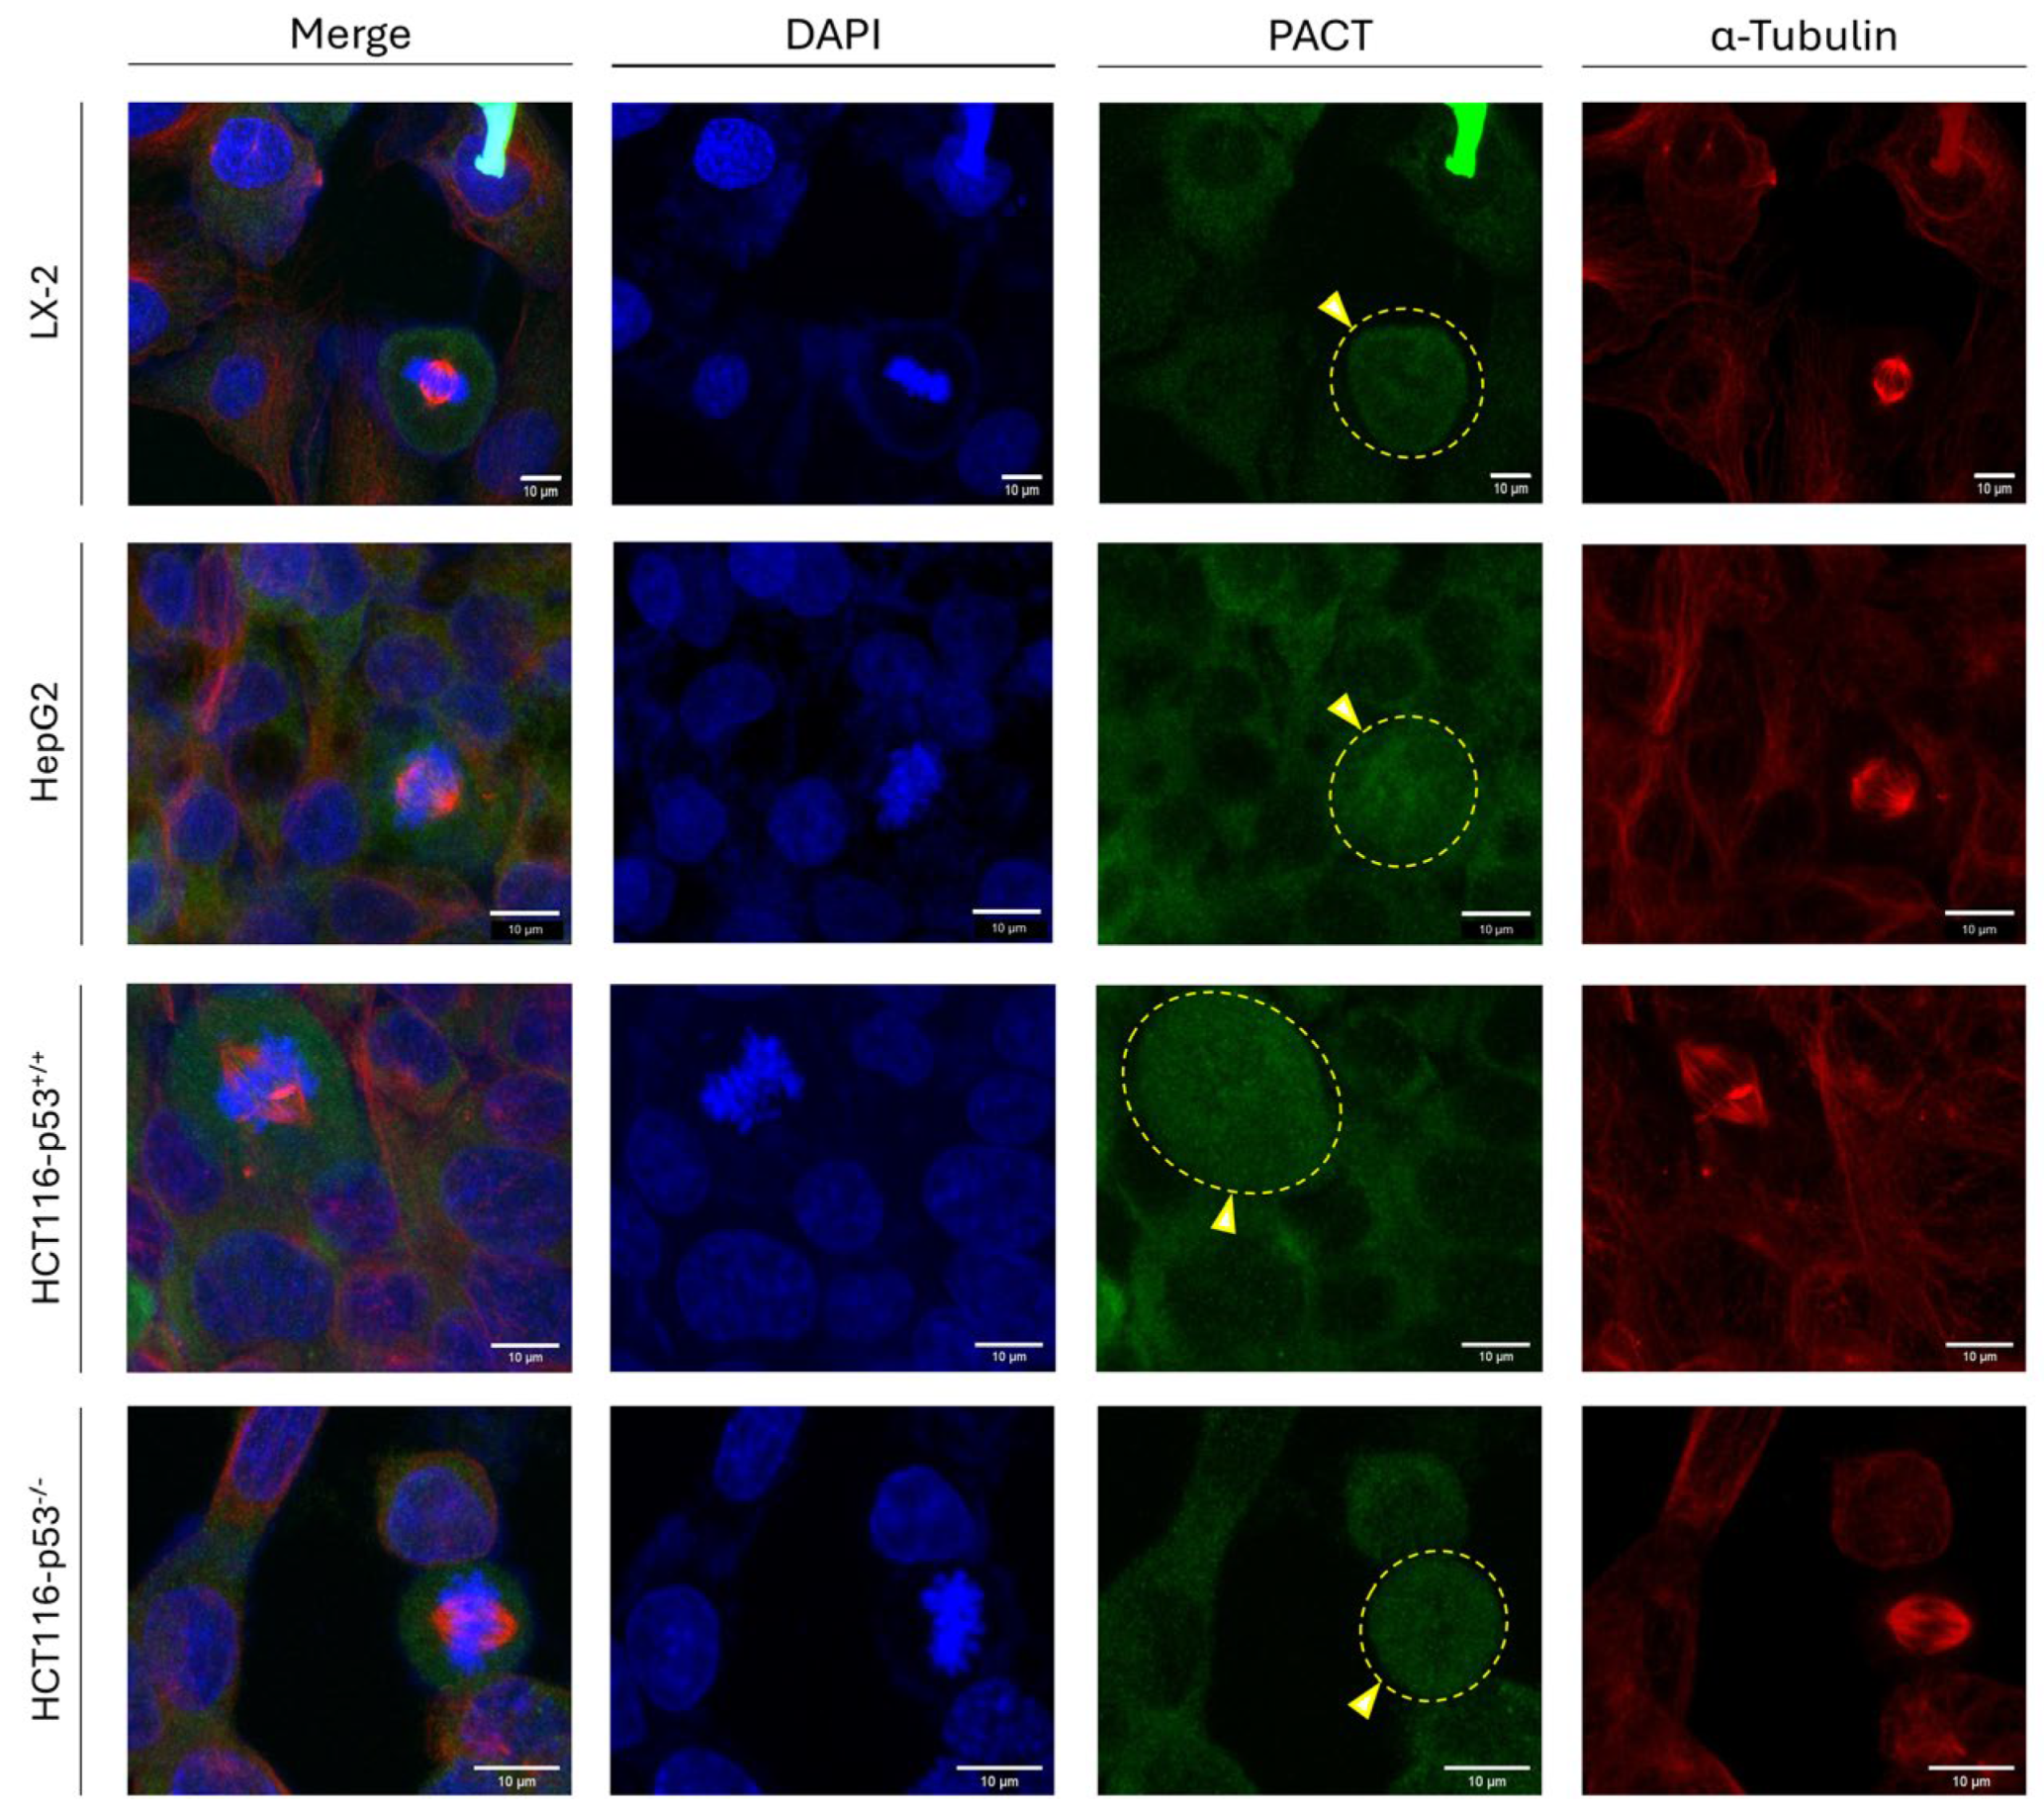
22], we, next, investigated the PACT-specific expression profiles in cells undergoing mitosis, or residing at the interphase stage of their cell cycle. Strikingly, at interphase, hepatic (LX-2 and HepG2) and colon-cancer (HCT116-p53
+/+ and HCT116-p53
-/-) (human) cell lines were characterized by a mainly cytoplasmic pattern (absence of nuclear staining) of PACT distribution, while, at mitosis, PACT maintained its strong, albeit diffuse, immunodetection signal that was being dispersed throughout all the mitotic cells, examined (
Figure 8). The obtained phenotypes remained unaffected either by the oncogenic status (LX-2 versus HepG2) or by the p53-mutational signature (HCT116-p53
+/+ versus HCT116-p53
-/-), for both hepatic and colon-cancer cells, herein, used (
Figure 8).
Taken together, it seems that, in contrast to TRBP, PACT protein retains its immunofluorescence-derived detection pattern (strong and dispersed expression, throughout the cell) unharmed, during mitosis, thus indicating the ability of PACT to function independently of TRBP at the mitotic stage. Given that TRBP, but not PACT, is exclusively compartmentalized in the nucleus at interphase and is lost at mitosis, whereas PACT seems to be strongly distributed both in the cytoplasm and the nucleus at mitosis (and not in the nucleus at interphase), PACT and TRBP may operate reversely to each other, with TRBP inhibiting and PACT promoting, RNAi-independent, mitotic activities.
3.9. Overexpression of TRBP Protein Cannot Rescue Its Mitosis-Specific Loss in LX-2 Dividing Cells
Next, we considered if the increased expression levels of TRBP protein may have an impact on its loss from the nuclear compartment during mitosis. Therefore, we transiently transfected LX-2 cells with the pcDNA-TRBP construct (using Lipofectamine 2000) to overexpress TRBP, with LX-2 treated only with Lipofectamine and the empty vector being used as control. 48 h post-transfection, cells were carefully collected and immediately processed for immunofluorescence imaging. Results showed that overexpression (~650x) of TRBP (
Figure 9A and
B) did not alter its expression profile in dividing cells, as the protein was missing from both control and TRBP-overexpressing cells undergoing mitosis (
Figure 9C). Nevertheless, the overexpression of TRBP proved to critically affect the proliferation rate, as it significantly increased the number of dividing cells (
Figure 9D). Intriguingly, the -mean- percentage of mitotic cell number in the case of TRBP overexpression was ~10.3%, compared to ~7.7% of the control, an increase that dictates the propensity of upregulated TRBP to cause late-interphase/early-mitosis enhanced activities. Altogether, we suggest that TRBP upregulation may promote the entry to early mitosis, whereas TRBP downregulation (and loss) is likely required for the progression from early to late mitosis, and, finally, for the successful entry to the early-interphase stage of the next cell cycle.
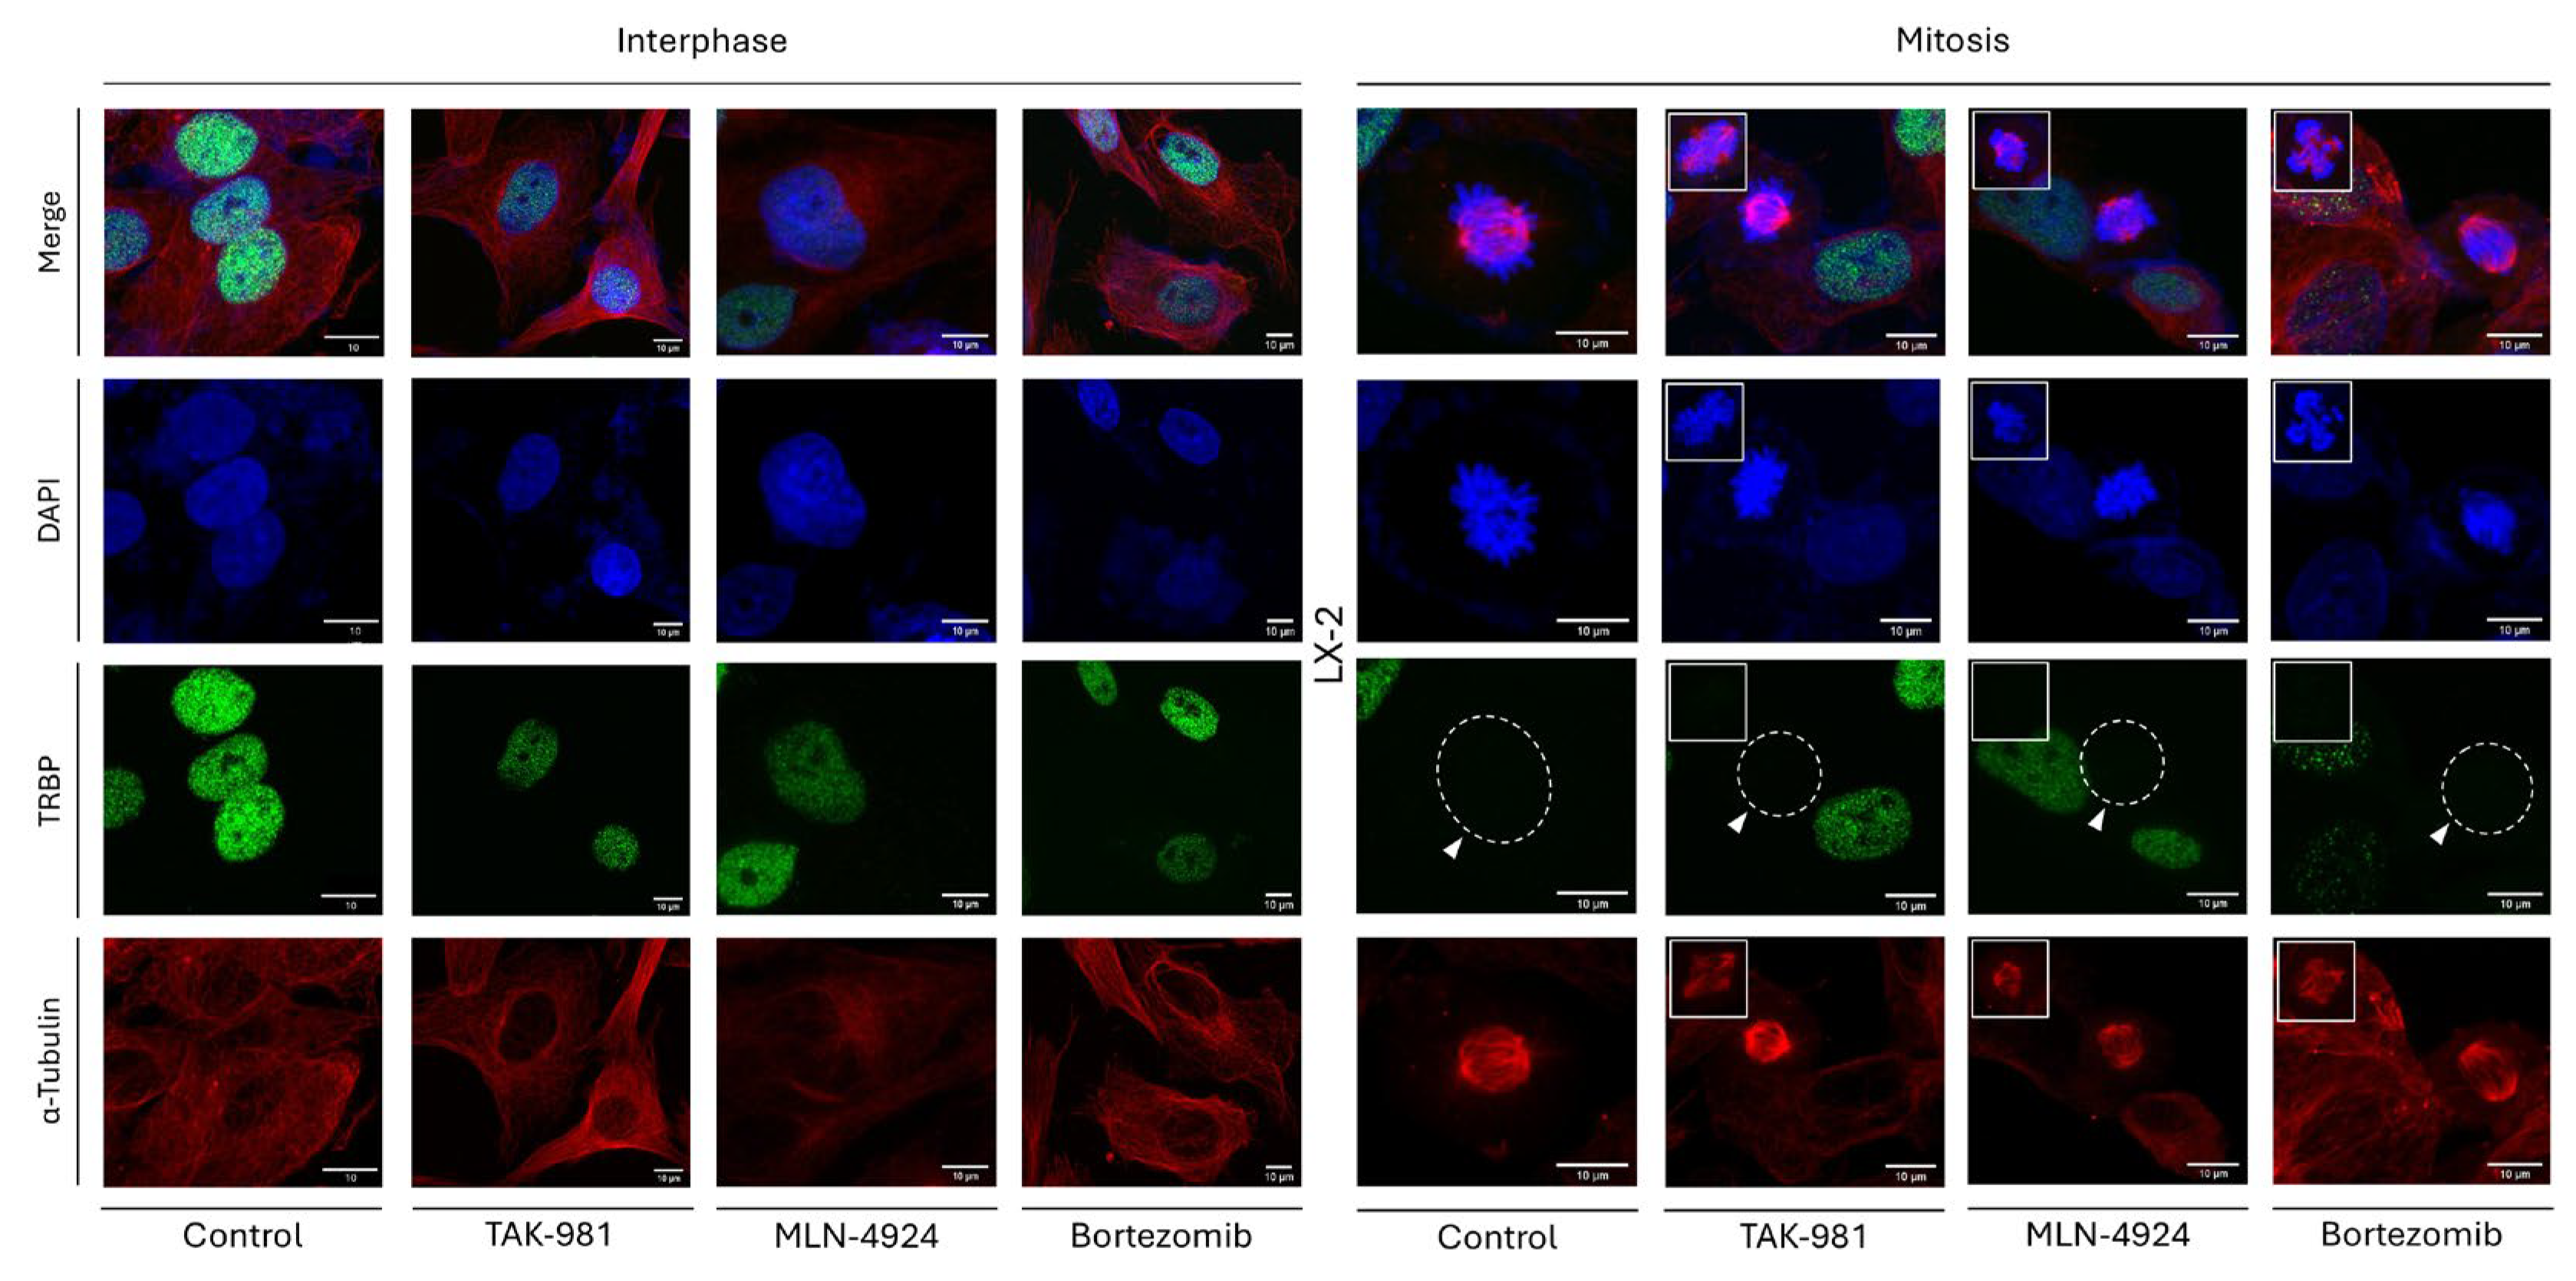
3.10. Dispensable Roles of SUMOylation-, NEDDylation- and Proteasome-Dependent Pathways in the Mitosis-Specific Loss of TRBP-Immunodetection Profile in LX-2 Hepatic Cells
To unveil the molecular mechanism that orchestrates the loss of TRBP expression during mitosis, we reasoned to chemically target, essential for cell viability, post-translational modification (PTM) processes, with SUMOylation, NEDDylation and Ubiquitination being characteristic examples. Hence, the three different inhibitors TAK-981, MLN-4924 and Bortezomib, which can specifically target the SUMOylation-, NEDDylation- and Proteasome-dependent [and, thus, the Ubiquitin-Proteasome System (UPS)] activities, respectively, were, herein, used. LX-2 hepatic cells were exposed to each one of these inhibitors (1 μΜ) at a time, for 24 h, and, subsequently, processed for immunofluorescence assays. LX-2 cells being treated with DMSO (1 μΜ, 24 h) only were used as suitable control. Importantly, none of the three inhibitors proved able to cause any alteration in the TRBP-immunodetection profile during cell division, compared to control settings, as the interphase-specific TRBP nuclear-compartmentalization signal is missing from the LX-2 dividing cells undergoing mitosis, independently of the presence or absence of each respective inhibitor (TAK-981, MLN-4924 and Bortezomib), herein, examined (
Figure 10).
Similarly, PACT distribution and expression were shown to remain unaffected in LX-2 cells being exposed to TAK-981, MLN-4924 or Bortezomib inhibitors, respectively, since PACT protein exhibited a pattern of cytoplasmic compartmentalization during interphase, and a dispersed, in both the cytoplasm and nucleus, pattern at the mitosis stage, regardless of the presence or absence of each inhibitor (Suppl. Fig. S3). Of note, the nuclear detection of ATF4 transcription factor exclusively in the inhibitor-treated LX-2 cells (Suppl. Fig. S4) indicated the activation of ATF4-signaling branch, which belongs to the endoplasmic reticulum (ER)-stress network, in response to TAK-981, MLN-4924 or Bortezomib inhibitor administration, thereby confirming inhibitors’ efficacies to induce (LX-2) hepatic-cell responses and pathologies. Furthermore, the impact of each inhibitor on cell proliferation was examined by measuring the percentage of mitotic-cell number in the presence or absence of inhibitor (TAK-981, MLN-4924 or Bortezomib). Interestingly, targeted inhibition of SUMOylation-, NEDDylation- or Proteasome-dependent processes seemed to alter proliferation rates, with mitotic-cell percentage changing from ~11.6% (control: absence of inhibitor) to ~14.7% (TAK-981), ~7.3% (MLN-4924) and ~9.9% (Bortezomib) (Suppl. Fig. S5), further corroborating each inhibitor’s proficiency to trigger cell-division disturbances in (LX-2) hepatic-cell environments.
Taken together, we, herein, reveal that SUMOylation-, NEDDylation- and Proteasome-dependent mechanisms are not essential, or play redundant/dispensable, roles in the mitosis-specific loss of TRBP-immunodetection and -expression profiles. However, their inhibition is presented with significant perturbations in mitotic-cell rate, thus indicating the critical contribution of SUMOylation, NEDDylation or Ubiquitination (UPS) pathways to hepatic cell-cycle regulation, in a TRBP-independent manner.
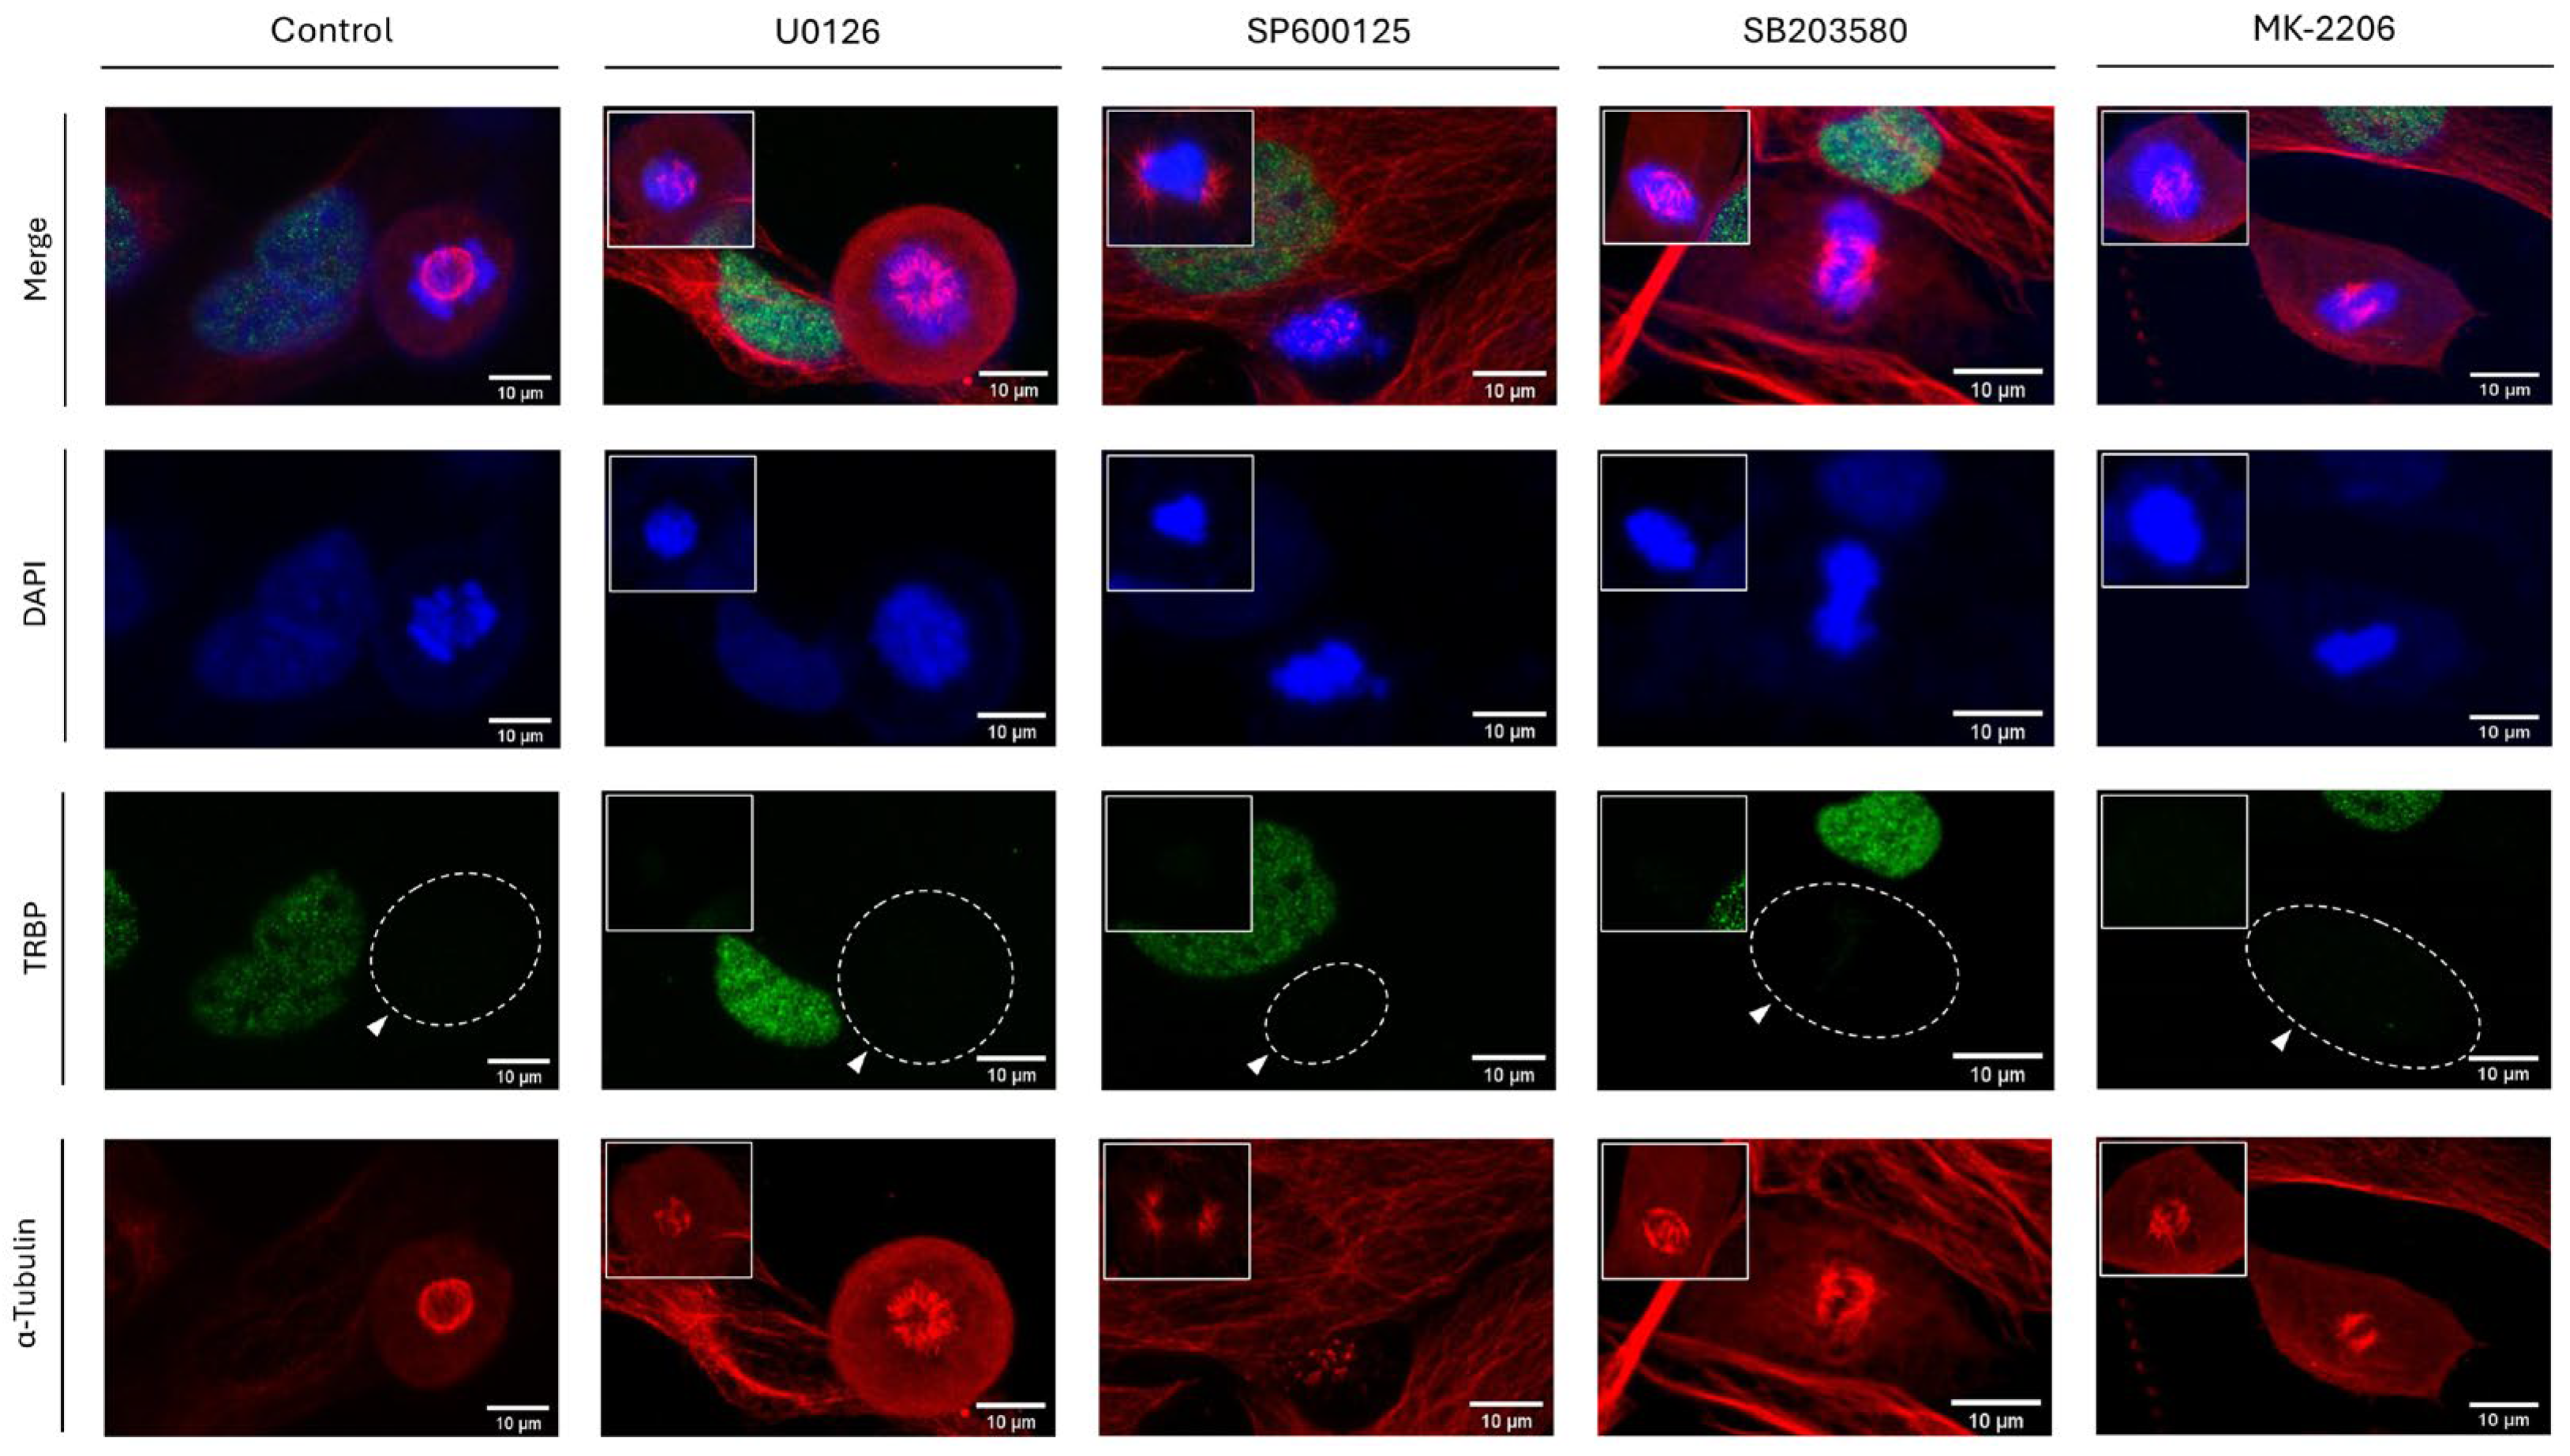
3.11. ERK-, JNK-, p38 MAPK- and AKT-Signaling Activities Are Not Required for TRBP Downregulation during Mitosis in LX-2 Dividing Cells
Given that protein phosphorylation is considered as a fundamental and widespread type of PTM in mammalian cells, we, next, aimed at chemically inhibiting critical kinase-family members, with ERKs, JNKs, p38 MAPK and AKTs being representative examples. Therefore, to investigate if TRBP could be subjected to protein phosphorylation during interphase and/or mitosis, MEK1/2 (they signal upstream of their ERK1/2 bona fide substrates), JNK1/2/3, p38 MAPK and AKT1/2/3 serine/threonine protein kinases were chemically targeted and functionally inhibited by exposure of LX-2 (hepatic) cells to the respective protein-kinase inhibitors U0126 (100 μM; MEK1/2), SP600125 (50 μM; JNK1/2/3), SB203580 (100 μM; p38 MAPK) and MK-2206 (25 μM; AKT1/2/3), all being used at clinically relevant doses (for 24 h) able to cause notable pathologies (e.g., Apoptotic features) in LX-2-treated cells [Suppl. Fig. S6 (inserts) and data not shown]. LX-2 hepatic cells having been exposed to the appropriate DMSO concentrations, for 24 h, served as controls.
Similar to SUMOylation, NEDDylation and Proteasome-activity inhibition (
Figure 10), administration of U0126, SP600125, SB203580 or MK-2206 inhibitors in LX-2 dividing cells proved unable to change the immunostaining-mediated TRBP-expression patterns, which were characterized by TRBP compartmentalization in the nucleus at the interphase stage, and by TRBP-detection loss during mitosis, either in the presence or in the absence of each inhibitor (U0126, SP600125, SB203580 and MK-2206), herein, used (
Figure 11). Likewise, not any inhibitor-induced alteration could be recognized for PACT compartmentalization, since the protein was detected mainly in the cytoplasm at the interphase, while it was dispersed all over each (LX-2) cell at mitosis, regardless of respective inhibitor’s actions (
Suppl. Fig. S6). Altogether, it seems that none of the MEK-ERK-, JNK-, p38 MAPK- and AKT-signaling axes can essentially control TRBP downregulation (loss) during mitosis, although a signaling-redundancy process among them cannot be excluded.
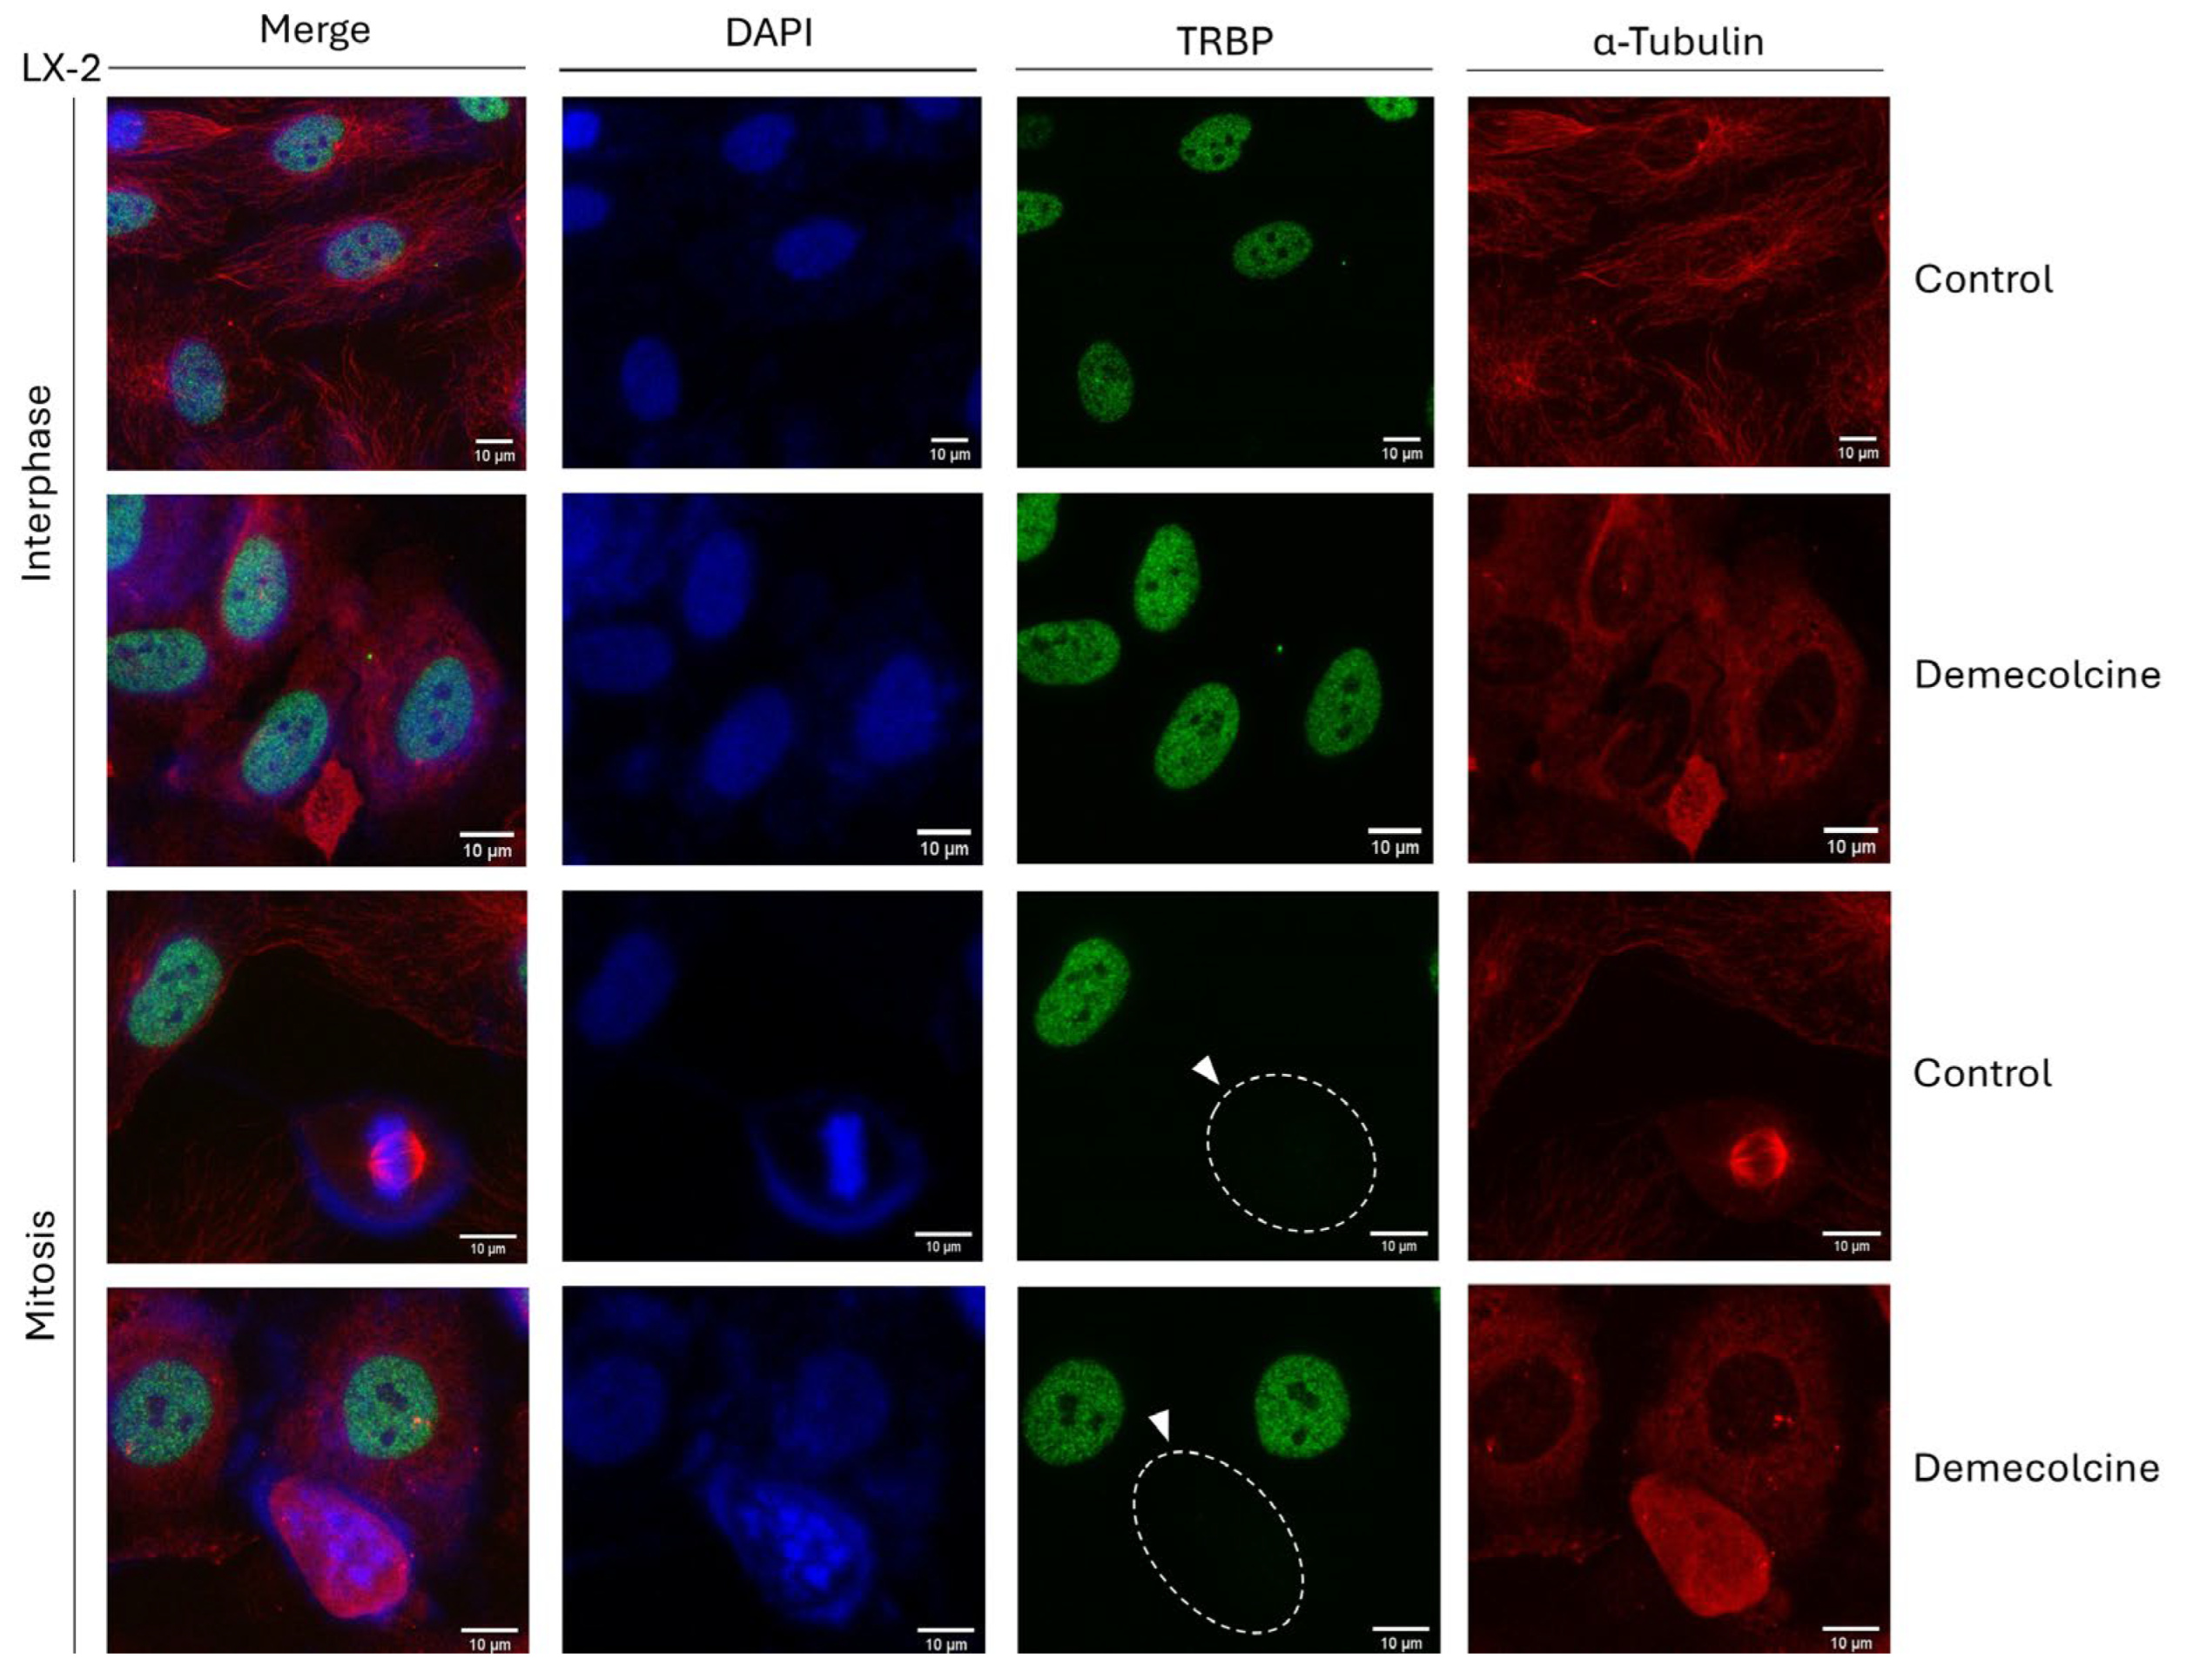
3.12. Microtubule-Network Disruption Cannot Affect TRBP-Expression Profile during Mitosis in LX-2 Hepatic Cells
Since the loss of TRBP protein is observed exclusively at the mitosis stage of cell cycle, which is typified by a dramatic re-organization of the microtubule-based cytoskeleton, to timely assemble the mitotic spindle, we, next, reasoned to chemically disrupt the microtubule-network integrity, seeking for alterations in TRBP’s immunodetection profiles, during cell division. Thereby, LX-2 dividing cells were exposed to Demecolcine (0.4 μg/μL), a specific inhibitor of microtubule polymerization, for 6 h, and cells were, subsequently, processed for immunofluorescence-facilitated imaging of TRBP-protein expression and distribution. Interestingly, despite the Demecolcine-induced disruption of microtubule-dependent cytoskeleton (
Figure 12 and
Suppl. Fig. S7), TRBP could retain its interphase-specific nuclear compartmentalization, which was completely lost at the mitosis stage, in the presence of Demecolcine, exhibiting remarkably similar phenotypes to the control (DMSO only) settings (
Figure 12). Of note, Demecolcine did not seem to have an effect on PACT’s protein expression and distribution, either at the interphase (cytoplasmic pattern) or at the mitosis (dispersed pattern) stage of the LX-2 dividing cells (
Suppl. Fig. S7). Taken together, it is, herein, revealed that TRBP protein does not depend on microtubule-cytoskeleton integrity and mitotic-spindle formation, for its mitosis-specific loss during (LX-2) hepatic-cell division, proliferation, and growth.
3.13. Mapping of the Cell Compartment-Specific TRBP Molecular Interactome in Human-Disease Settings
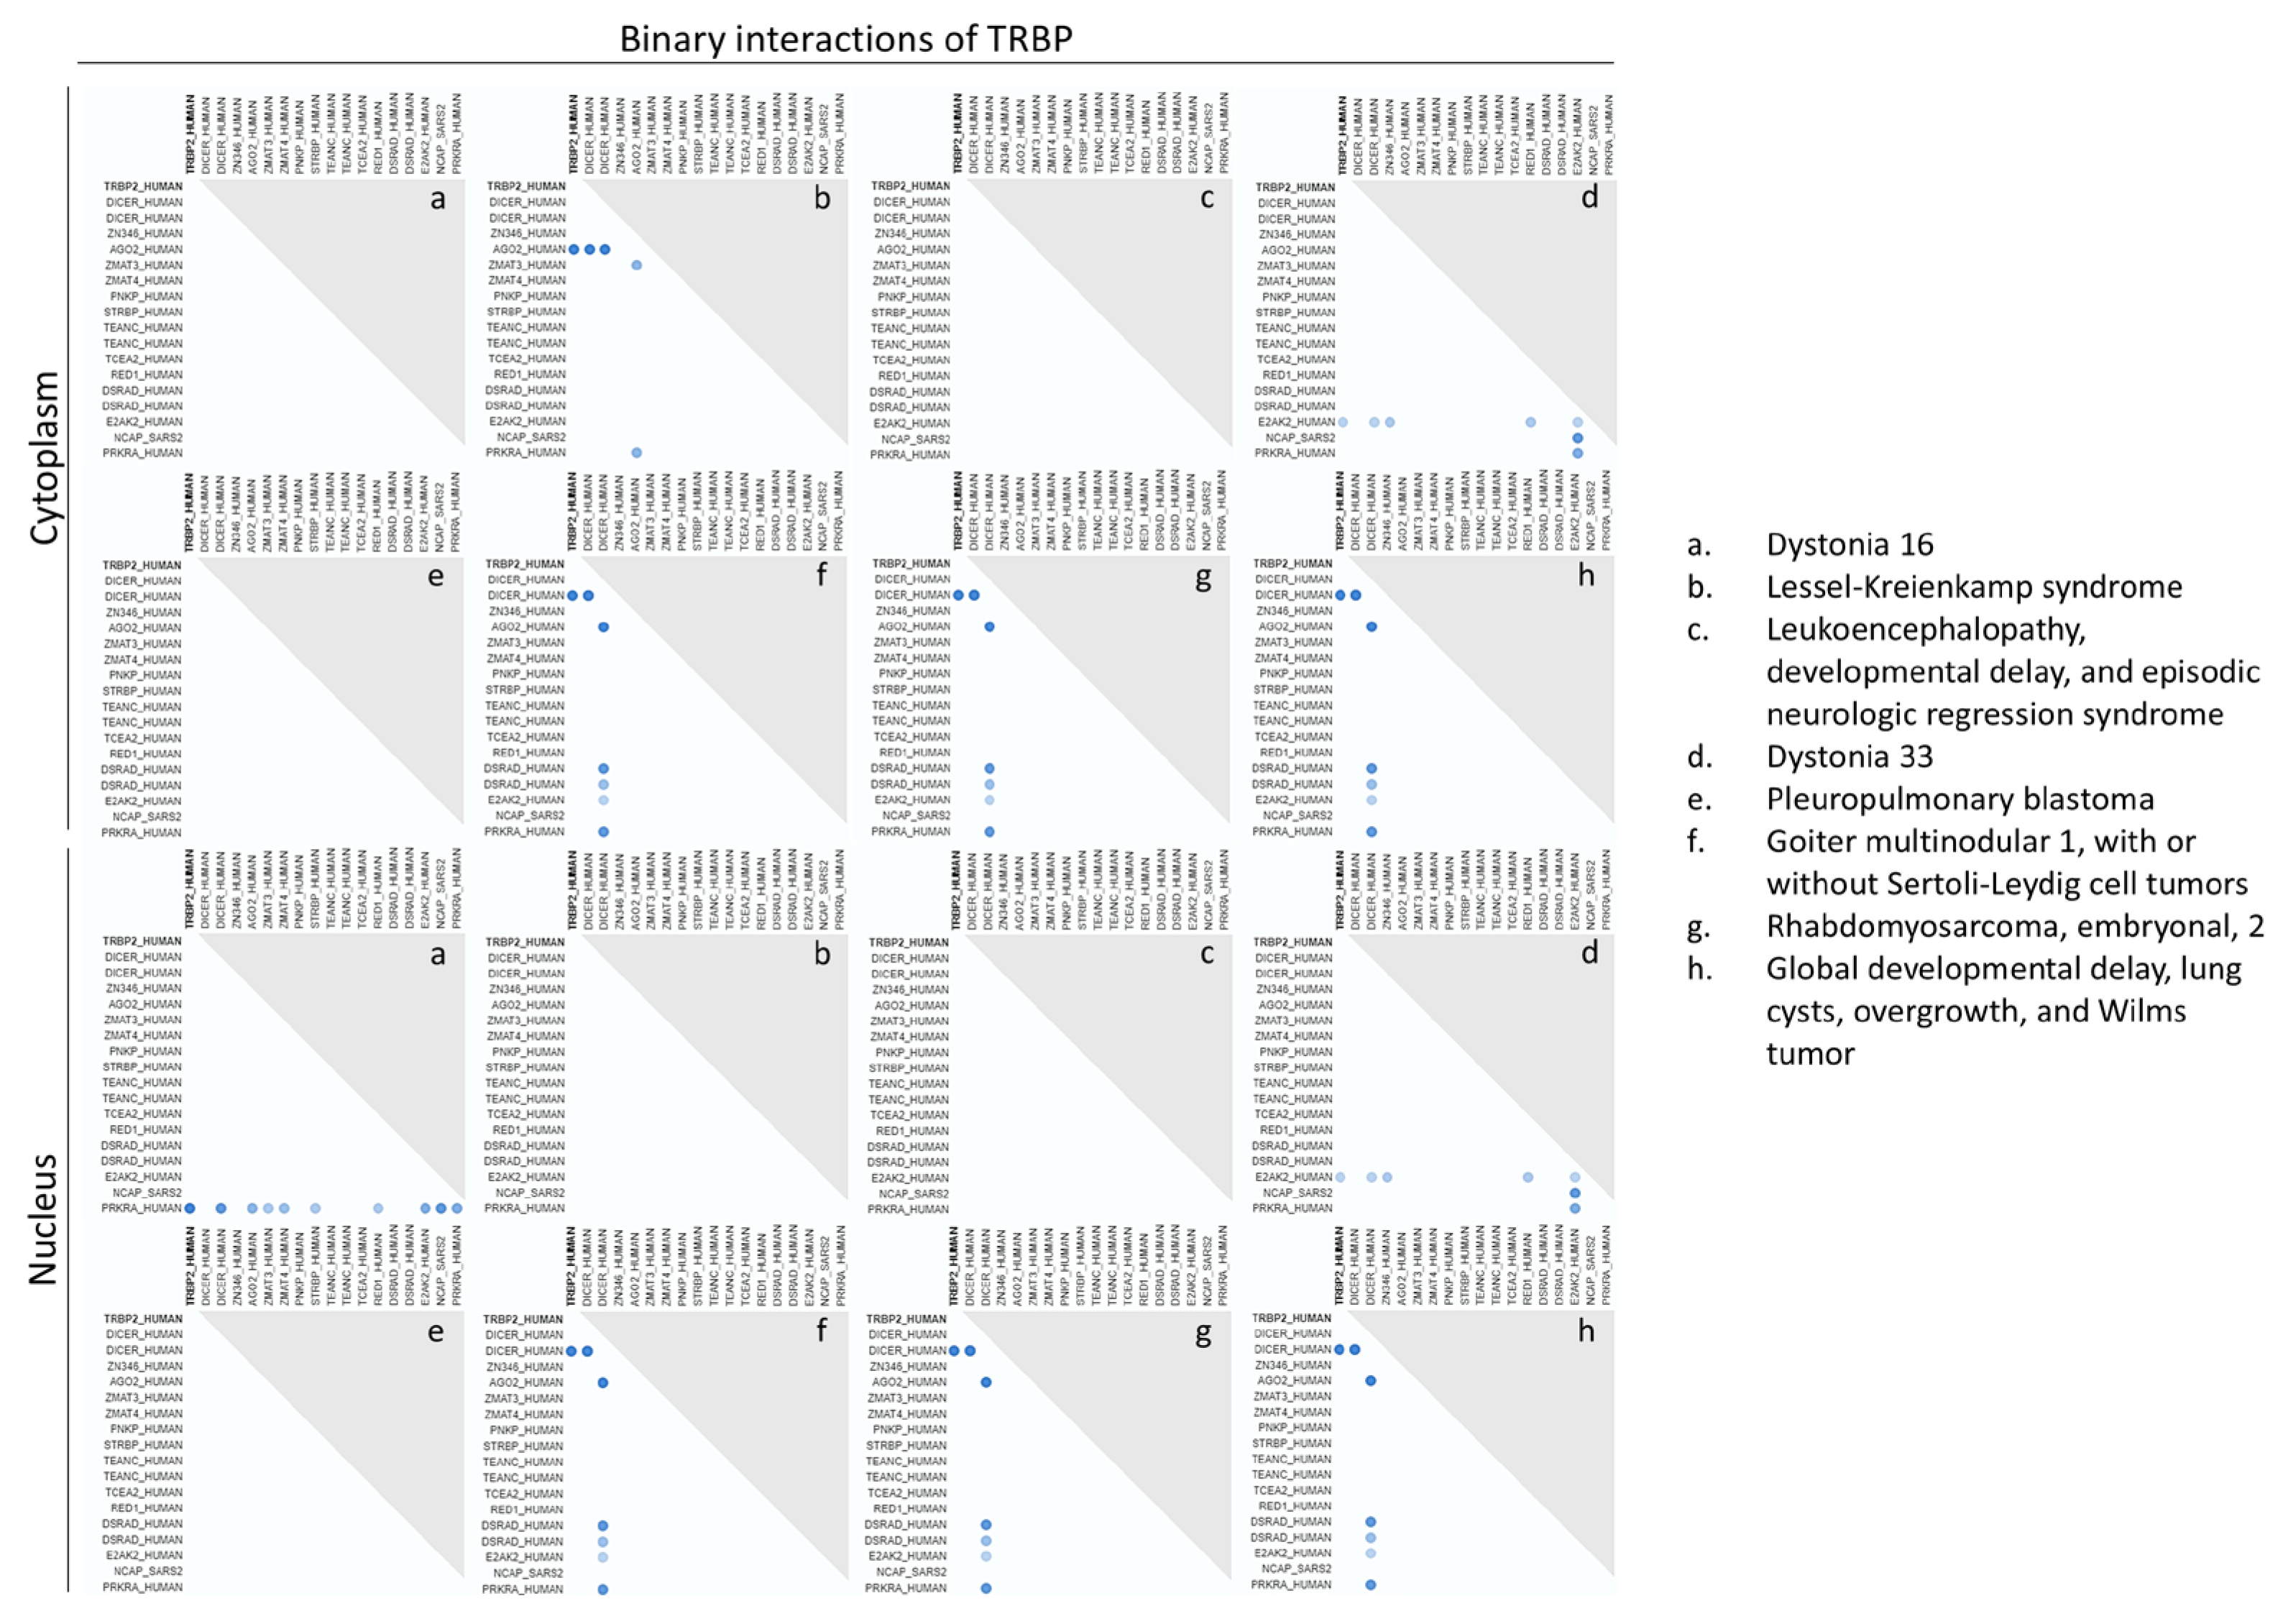
In an effort to mechanistically comprehend TRBP’s role in cell-division control, we in silico analyzed the binary interactions of TRBP protein in different sub-cellular compartments and diverse human pathologies. Disease-specific patterns of TRBP interactions could be, herein, recognized, with DICER being unveiled as the major TRBP partner (
Figure 13). Remarkably, different sub-cellular compartments were presented to accommodate distinct TRBP interactomes, as it was clearly demonstrated by the identification of TRBP2-AGO2 interaction in the cytoplasm, but not in the nucleus, of Lessel-Kreienkamp (syndrome) cells. Reversely, a TRBP2-PRKRA/PACT interaction could be detected in the nucleus, but not in the cytoplasm, of Dystonia 16 (disorder) cells (
Figure 13). Regarding PACT (PRKRA), a disease-dependent interaction in between TRBP2 and DICER proteins was in silico described both in the cytoplasm and the nucleus, while PACT was presented with significantly enriched -nuclear and cytoplasmic- interactome profiles, as compared to the TRBP2 respective ones, in Dystonia 16 cells, likely rendering PACT a druggable target for disease’s therapy (
Suppl. Fig. S8). In accordance, a P222L mutation in the exon 7 of
PRKRA gene has been previously associated with a young-onset dystonia-parkinsonism disorder [
52]. Furthermore, a PACT molecular interactome was detected in the cytoplasm, but not in the nucleus, of Leukoencephalopathy (disease) cells (
Suppl. Fig. S8), with the assembly of PACT-E2AK2/PKR complex justifying the capacity of PACT to activate E2AK2/PKR protein kinase, as previously reported, specifically in the cytoplasm, during cell division. Importantly, Dystonia 16 cells were characterized by the presence of PACT and by the simultaneous absence of TRBP2 binary interactions in the cytoplasm, while Lessel-Kreienkamp cells were typified by similar -respective- patterns in the nucleus, strongly suggesting their (TRBP versus PACT) opposite functionalities in cell-cycle regulation mechanisms. Of note, PACT interactome was shown to contain a larger number of components than the TRBP2 one in Dystonia 16 cell nucleus, with the pathogenic cytoplasm lacking TRBP2 binary interactions, although being simultaneously enhanced with PACT respective ones.
Altogether, we strongly support the operation of a TRBP/PACT-dependent dynamic interactome that can adjust its constituents in a cell compartment- and pathology-specific fashion, to critically control cell proliferation and growth, in human health and disease.
4. Discussion
TRBP protein is a key component of the RISC-loading complex, and it can have a strong effect on gene-expression regulation and cell fate via RNAi-mechanism control. Nevertheless, TRBP has proved to be essentially involved in other molecular processes, as well. Hence, a well-characterized function of TRBP is the inhibition of interferon-inducible double-stranded RNA-activated protein kinase (E2AK2/PKR). E2AK2/PKR is a ubiquitously expressed Serine/Threonine Kinase activated by dsRNAs [
53,
54,
55]. Upon binding to dsRNAs, E2AK2/PKR undergoes dimerization and auto-phosphorylation, resulting in translation inhibition by phosphorylating the α subunit of eukaryotic Initiation Factor 2 (eIF-2A) [
25,
53]. TRBP can form a heterodimer with E2AK2/PKR in an RNA-independent manner, preventing its auto-phosphorylation and activation, and promoting cell survival [
24,
25,
56,
57].
Furthermore, several studies indicate that TRBP plays an important role in diverse biological processes, including organism development, normal cell growth and tissue pathology, such as cancer. During development, TRBP critically contributes to spermatogenesis and growth control, as TRBP loss causes morphological abnormalities, such as reduced body size and oligospermia in mice [
21,
35,
58], while it also has an impact on neural stem-cell characteristics during brain development, via activating the Notch signaling pathway in a DICER- and RNA-independent manner [
59]. Notably, it has been demonstrated that TRBP can regulate angiogenesis, hypoxia-stress response and chemoresistance in cancer [
60,
61,
62]. Interestingly, novel, non-canonical and direct roles for TRBP in gene-expression regulation have emerged, as well. TRBP can act as a
trans factor that binds directly dsRNAs via specific structural
cis-regulatory RNA elements, termed TRBP-binding structural elements (TBSE), in the 3΄-UTR of transcripts, and destabilizes them [
61,
63,
64]. Moreover, TRBP binding to pre-mRNAs into the nucleus leads to increased intron retention and degradation of these aberrant transcripts by the nuclear exosome [
65].
Our results further extend these studies, given that the tight regulation of TRBP-protein compartmentalization and expression seems to act as a major determinant of normal cell proliferation and growth. Apparently, TRBP levels are crucial for cell-cycle control, as it has been, herein, shown by Flow-Cytometry analysis, and by protein’s immunophenotypic loss or modification during mitosis that has proved mechanistically indispensable and cancer type-wise universal. Importantly, TRBP overexpression increased the LX-2 proliferation rate, thus dictating its cell-growth promoting activity and subsequent presumable oncogenicity, with TRBP elimination at mitosis being absolutely required for the correct implementation of cell division, regardless of the initial protein levels during interphase. Taken together, TRBP, due to its major contribution to cell division, must be subjected to strong regulatory mechanisms that can operate regardless of tissue, malignancy-grade, metastatic and molecular-signature (mutational) profiles of tumor cells.
Due to the multi-functionality of TRBP protein, its aberrant expression can lead to cell-cycle dysfunction and, consequently, human pathology [
19]. Hence, tight regulation of TRBP protein levels is required for normal cell division, proliferation and growth. A common mechanism of TRBP regulation acts via proteasomal degradation that is being facilitated by Merlin. Merlin protein localizes at the membrane cytoskeleton during interphase and interacts with several proteins, inhibiting critical growth-signal pathways [
40,
66,
67]. Among others, TRBP has been found as a novel protein directly interacting with Merlin through the 237-366 and 288-595 amino acid (aa) domains, located at their C-terminal ends, respectively [
40,
68]. Merlin binds to TRBP and promotes its Ubiquitination, thereby targeting TRBP to the proteasome for proteolytic degradation and elimination [
35,
40,
60,
68].
Another mechanism controlling TRBP protein levels is SUMOylation. SUMO (Small Ubiquitin-related Modifier), a class of ~10 kDa polypeptide, is a reversible protein modifier, which can be conjugated with several substrates by reversible covalence [
69,
70,
71,
72]. SUMOylation is involved in protein stability, activity and localization, nuclear transport, transcriptional regulation, and signal transduction [
71,
73,
74,
75]. It has been previously reported that TRBP is SUMOylated at Lysine 52 (K52), increasing the gene-silencing efficiency of miRNAs via recruiting AGO2, but not influencing their biogenesis [
69,
70]. Most importantly, TRBP SUMOylation enhances protein’s stability, as it can reduce TRBP poly-Ubiquitination and prevent its degradation [
69].
Ubc9 protein is an essential component of SUMOylation, since it not only provides activated SUMO, but it is also involved in the selection of many SUMO targets [
71]. This specific selection is usually based on the recognition by Ubc9 of a consensus motif (“ΨKXE”; Ψ: a bulky aliphatic residue, typically L/I/V) in the target protein [
76,
77]. Surprisingly, by examining the TRBP2 protein sequence, the “ΨKXE” motif (“LKAE”) was indeed identified at the 51-54 aa position (
https://www.ensembl.org/Homo_sapiens; Transcript: ENST00000266987.7 TARBP2-201), which prompted us to, next, proceed to constrained docking in between Ubc9 and a “LKAE” motif-containing area of the TRBP2 protein. In addition, we carried out docking tests in between Ubc9 and each different domain of TRBP2, one -potential- interaction at a time. Remarkably, using this motif area, the two proteins proved to in silico interact to each other via a number of critical residues, while it seems that there are also alternative binding sites in all three TRBP domains (DRBM1-DRBM3) (
Suppl. Figs. S9 and
S10), which could potentially function regulatory.
Given the involvement of SUMOylation and Ubiquitin-Proteasome (UP) sub-routines in TRBP regulation, we considered the possibility that TRBP immunofluorescence-profile loss during mitosis might implicate these two mechanisms. Furthermore, we also examined the importance of one more regulatory process, called NEDDylation, whose functional correlation with TRBP remains still elusive. NEDDylation pathway uses the Ubiquitin-like protein NEDD8, which is essential for the enzymatic activity of a subclass of Ubiquitin E3 Ligases, the Cullin-RING Ligases (CRLs), through conjugation to the Cullin scaffold [
78,
79]. Therefore, NEDDylation can regulate the Ubiquitination and degradation rate of proteins whose Ubiquitination depends on CRLs, several of which have been found to control normal cellular function, while some of them have been associated with cancer development [
78,
79]. However, chemical inhibition of the three pathways does not seem to have an impact on TRBP immunophenotype, with mitotic cells lacking TRBP immunodetection either in the presence or absence of each inhibitor. Furthermore, measurements of mitotic-cell (percentage) numbers indicate that the three pathways (Ubiquitination, SUMOylation and NEDDylation) can affect cell division in a TRBP-independent manner, since their ability to alter dynamics of mitosis, when they are inhibited, cannot be coupled with the re-appearance of TRBP immunofluorescence profile at the mitotic stage of cell cycle. Most importantly, if we presume that SUMOylation inhibition causes reduced TRBP protein levels, whereas Ubiquitination-Proteasome System (UPS) or NEDDylation inhibition may result in opposite effects, then cell-proliferation rate should decrease and increase, respectively, according to our finding that TRBP overexpression leads to increased proliferation, which is not actually observed in the present study. Altogether, we can conclude that TRBP protein during cell division is not subjected to any degradation process, but probably the protein undergoes some other modifications, such as Serine/Threonine Phosphorylation.
Phosphorylation on critical aa residues could effectively regulate TRBP functions, as well. Recent reports have shown that TRBP is phosphorylated by two MAP Kinases (MAPKs), the ERK(1/2) and JNK(1/2/3) ones, in response to oxidative stress or/and during mitosis [
24,
80]. Specifically, ERK-mediated phosphorylation of TRBP protein enhances growth-promoting miRNA production by increasing RISC stability, as the phosphorylation leads to a stronger interaction in between TRBP and DICER [
25,
81]. On the other hand, JNK-mediated phosphorylation of TRBP affects its interaction with PKR and, consequently, PKR activation [
25,
80,
81]. Interestingly, phosphorylation of TRBP by ERKs seems to enhance its SUMOylation (a process discussed above), also indirectly affecting stability of the protein [
69]. However, neither ERKs and JUNKs, nor p38 MAPK and AKT(1/2/3) Serine/Threonine Kinases can decisively act on TRBP immunophenotype during cell division, and especially mitosis, since their chemical inhibition proved unable to restore the mitosis-specific loss of TRBP immunodetection, herein described for the first time.
Employment of an in silico approach seems to essentially contribute to a better understanding of the TRBP -novel- functionalities in cell-cycle control. Docking tests of TRBP2 protein with major cell-cycle regulators revealed significant interaction potentials with Cyclin-A1 and CDK2 proteins, as well as the Cyclin-E1 protein, while its (TRBP2) binding to the Ubc9 protein, albeit with comparatively lower “docking values” (
Suppl. Fig. S11), strongly suggested a new role for the TRBP-Ubc9 complex (besides TRBP SUMOylation) in mitosis dynamics. Since Cyclin-A1 acts as a key cell-cycle regulator, necessary for the entry into S and M phases, and can form a complex (among others) with CDK2 Kinase, enhancing its interaction with critical substrates [
82,
83], TRBP protein may serve as a, novel, important target for phosphorylation by the -activated- CDK2 Kinase, and this phosphorylation may function catalytically in cell-cycle progression and cell division. Cyclin-E1 is, also, a fundamental cell-cycle regulator, which is required for the entry into S phase and can form a complex with CDK2, as well [
84]. The increased levels of this complex at the G1/S transition phase are in line with the increased contents of TRBP protein at the same stage being observed by our Flow-Cytometry analysis, strongly supporting their mechanistic correlation during cell cycle.
To the same direction, and searching for recorded interactors of TRBP and PACT proteins (
Suppl. Tables S1 and S2), we distinguished KIF2A (Kinesin Family Member 2A), a plus end-directed Microtubule-dependent motor with de-polymerization activity [
85], and IQGAP2 (IQ Motif Containing GTPase Activating Protein 2), a Ras GTPase-activating protein [
86], as unique TRBP interactors of presumably major importance (
Suppl. Table S3). Docking tests unveiled the significant potential (low Dissociation Constant) for strong interactions in between the components of both TRBP2-KIF2A and TRBP2-IQGAP2 complexes (
Suppl. Fig. S11). Given the pivotal role of KIF2A in mitotic-spindle formation and normal spindle dynamics during mitosis [
85,
87], together with the involvement of IQGAP2 in the regulation of cell morphology and motility, and cancer development [
86], the presumable interactions of TRBP2 with KIF2A and IQGAP2 proteins further support our current molecular model for the negative control of TRBP on KIF2A and IQGAP2 activities, during cell division, and specific stages of tumor initiation, progression and metastasis. Altogether, it is the loss of TRBP protein that releases KIF2A and IQGAP2 functionalities during mitosis of dividing cells.
Regarding Protein-Protein Interactions (PPIs), they constitute a dynamic network that can change according to the phase of cell cycle and the need of cell. Disruption in any PPI profile may result in pathological conditions and development of human diseases. Indeed, by observing a wide range of human pathologies, we can detect critical changes in TRBP and PACT interactions, both among diseases and in between sub-cellular compartments (e.g., cytoplasm versus nucleus) (
Figure 13 and
Suppl. Fig. S8). Remarkably, both TRBP and PACT proteins were, herein, in silico shown to interact with the DICER protein, regardless of the examined sub-cellular compartment (cytoplasm versus nucleus), in Goiter multinodular 1, Rhabdomyosarcoma, embryonal, 2 and Wilms tumor diseases being related to DICER1 syndrome [
88,
89,
90,
91], while they also interact with the AGO2 protein in Lessel-Kreienkamp syndrome (howbeit, in distinct sub-cellular compartments), a neuro-developmental disorder related to
AGO2 gene mutations [
92]. Of note, TRBP and PACT can interact with AGO2 only in the cytoplasm and the nucleus, respectively, thus emphasizing the importance of each interaction in health and disease. This is also the case for Dystonia 16, a disorder caused by
PACT/PRKRA gene mutations [
93], with TRBP losing its ability to interact with PACT in the cytoplasm (retained in the nucleus), but with PACT gaining several interactors, including TRBP, both in the cytoplasm and the nucleus, as well.
Taken all together, TRBP is, herein, highlighted as an important regulator of the cell cycle, following an expression pattern similar to the ones of known cell-cycle regulators. Its interaction with such type of major regulatory proteins could be an issue of fundamental importance for normal cell division and growth. Notably, it seems that the roles of TRBP in a cell are not limited to the RNAi mechanism, but are rather extended to diverse processes, and, thus, its tight regulation is vital for cell function and fate. Given the number of mutations or aberrant expression patterns of TRBP that have been previously associated with human pathologies, such as Cardiomyopathy, ADHD (Attention Deficit Hyperactivity Disorder), Alzheimer’s Disease [
94,
95,
96] and Cancer [
97,
98,
99,
100,
101,
102], together with its (TRBP), herein, described, for the first time, new role(s) in mitosis of dividing cells, TRBP protein is likely rendered a promising prognostic, diagnostic and therapeutic -druggable- biomarker for various human diseases, with the further investigation of its mitosis-controlling mechanism(s) most probably opening new therapeutic windows for diverse malignancies, either at the primary or at the metastatic stage(s).
Figure 1.
Variation of TRBP-protein levels in T24 cells at the cell-cycle phases. Histograms showing fluorescence distribution of the FITC-conjugated anti-TRBP antibody in each phase of the cell cycle (A) under control conditions (PI staining), (B) after antibody and PI staining, and (C) after Brefeldin A pre-treatment, and antibody and PI staining. Values in Tables show Mean Fluorescence Intensity (MFI) (Mean FITC-A) from one representative experiment out of three performed.
Figure 2.
TRBP-expression profiles at the interphase and mitosis of thyroid cells. Immunofluorescence images of NTHY-ori 3-1, TPC-1 and ARO cells, investigating for TRBP expression and distribution patterns in both interphase and mitotic cells. In cells undergoing mitosis, lack of TRBP-protein immunodetection is observed (white arrows). Green color: TRBP; Red color: α-Tubulin; Blue color: Nucleus (DAPI). Scale bars: 10 μm.
Figure 3.
Downregulation of TRBP-protein expression in urothelial bladder-cancer cells during mitosis. Immunofluorescence images of RT112, T24 and TCCSUP cells, searching for TRBP expression and distribution profiles in both interphase and mitotic cells. In dividing cells, absence of TRBP immunostaining is detected at the mitosis stage (white arrows). Green color: TRBP; Red color: α-Tubulin; Blue color: Nucleus (DAPI). Scale bars: 10 μm.
Figure 4.
p53-independent downregulation of TRBP protein in colon carcinoma-dividing cells. Immunofluorescence images of HCT116 colon-cancer cells, seeking for TRBP expression and distribution profiles either in the presence (HCT116-p53+/+) or in the absence (HCT116-p53-/-) of the wild-type p53 protein form. In both cases, TRBP elimination from dividing cells, during mitosis, is identified (white arrows). Green color: TRBP; Red color: α-Tubulin; Blue color: Nucleus (DAPI). Scale bars: 10 μm.
Figure 5.
Metastasis-independent TRBP downregulation during melanoma-cell division. Immunofluorescence images of pre-metastatic WM115 and metastatic WM266-4 melanoma cells, exploring for TRBP expression and compartmentalization patterns in both interphase and mitotic cells. Lack of TRBP immunodetection profiles in mitotic cells of both cell lines is observed (white arrows). Green color: TRBP; Red color: α-Tubulin; Blue color: Nucleus (DAPI). Scale bars: 10 μm.
Figure 6.
Oncogenesis-independent control of TRBP expression in hepatic cells undergoing mitosis. Immunofluorescence images of LX-2 and HepG2 cells, directly reflecting TRBP expression and distribution patterns in human hepatic cells. In dividing cells, loss of TRBP protein is detected during mitosis (white arrows). Green color: TRBP; Red color: α-Tubulin; Blue color: Nucleus (DAPI). Scale bars: 10 μm.
Figure 7.
Cell cycle-dependent regulation of TRBP-protein expression and compartmentalization in hepatic cells. Immunofluorescence images of LX-2 hepatic cells, unveiling TRBP expression and distribution patterns at different stages of mitosis. The presence (yellow arrows) or the absence (white arrows) of the TRBP-protein immunodetection can be distinguished at each stage of the cell-division process. Green color: TRBP; Red color: α-Tubulin; Blue color: Nucleus (DAPI). Scale bars: 10 μm.
Figure 8.
PACT protein-expression profiling at the interphase and mitosis of dividing cells. Immunofluorescence images of LX-2, HepG2 and HCT116 cells, investigating for PACT expression and distribution in both interphase and mitotic cells. PACT-immunodetection pattern is found diffused in the cytoplasm, whereas it maintains an intense signal during mitosis (yellow arrows) in all the examined cell lines, regardless of the malignant phenotype (LX-2 versus HepG2), or the absence of the wild-type p53 protein (HCT116-p53+/+ versus HCT116-p53-/-). Green color: PACT; Red color: α-Tubulin; Blue color: Nucleus (DAPI). Scale bars: 10 μm.
Figure 9.
Overexpression of TRBP protein in LX-2 hepatic cells cannot rescue its mitosis-specific loss. (A) Histogram presenting the relative expression levels of TRBP gene in TRBP transiently transfected LX-2 cells (pcDNA-TRBP), as compared to control cells (pcDNA). (B) Amplification curves (in duplicates) showing the increase in fluorescence over the qPCR cycles for TRBP and GAPDH (reference gene) mRNAs in TRBP-overexpressing and control LX-2 cells. (C) Immunofluorescence images of LX-2 cells -transiently- overexpressing the TRBP protein, searching for TRBP expression in both interphase and mitotic cells, 48 h post-transfection. TRBP has been lost during mitosis in both overexpressing (pcDNA-TRBP) and control (pcDNA3.1(+)) cells (white arrows). Green color: TRBP; Red color: α-Tubulin; Blue color: Nucleus (DAPI). Scale bars: 10 μm. (D) Box-plot presenting the percentage of mitotic-cell numbers (%) in TRBP-overexpressing LX-2 cells (pcDNA-TRBP), as compared to control (pcDNA) cells (*: p<0,05).
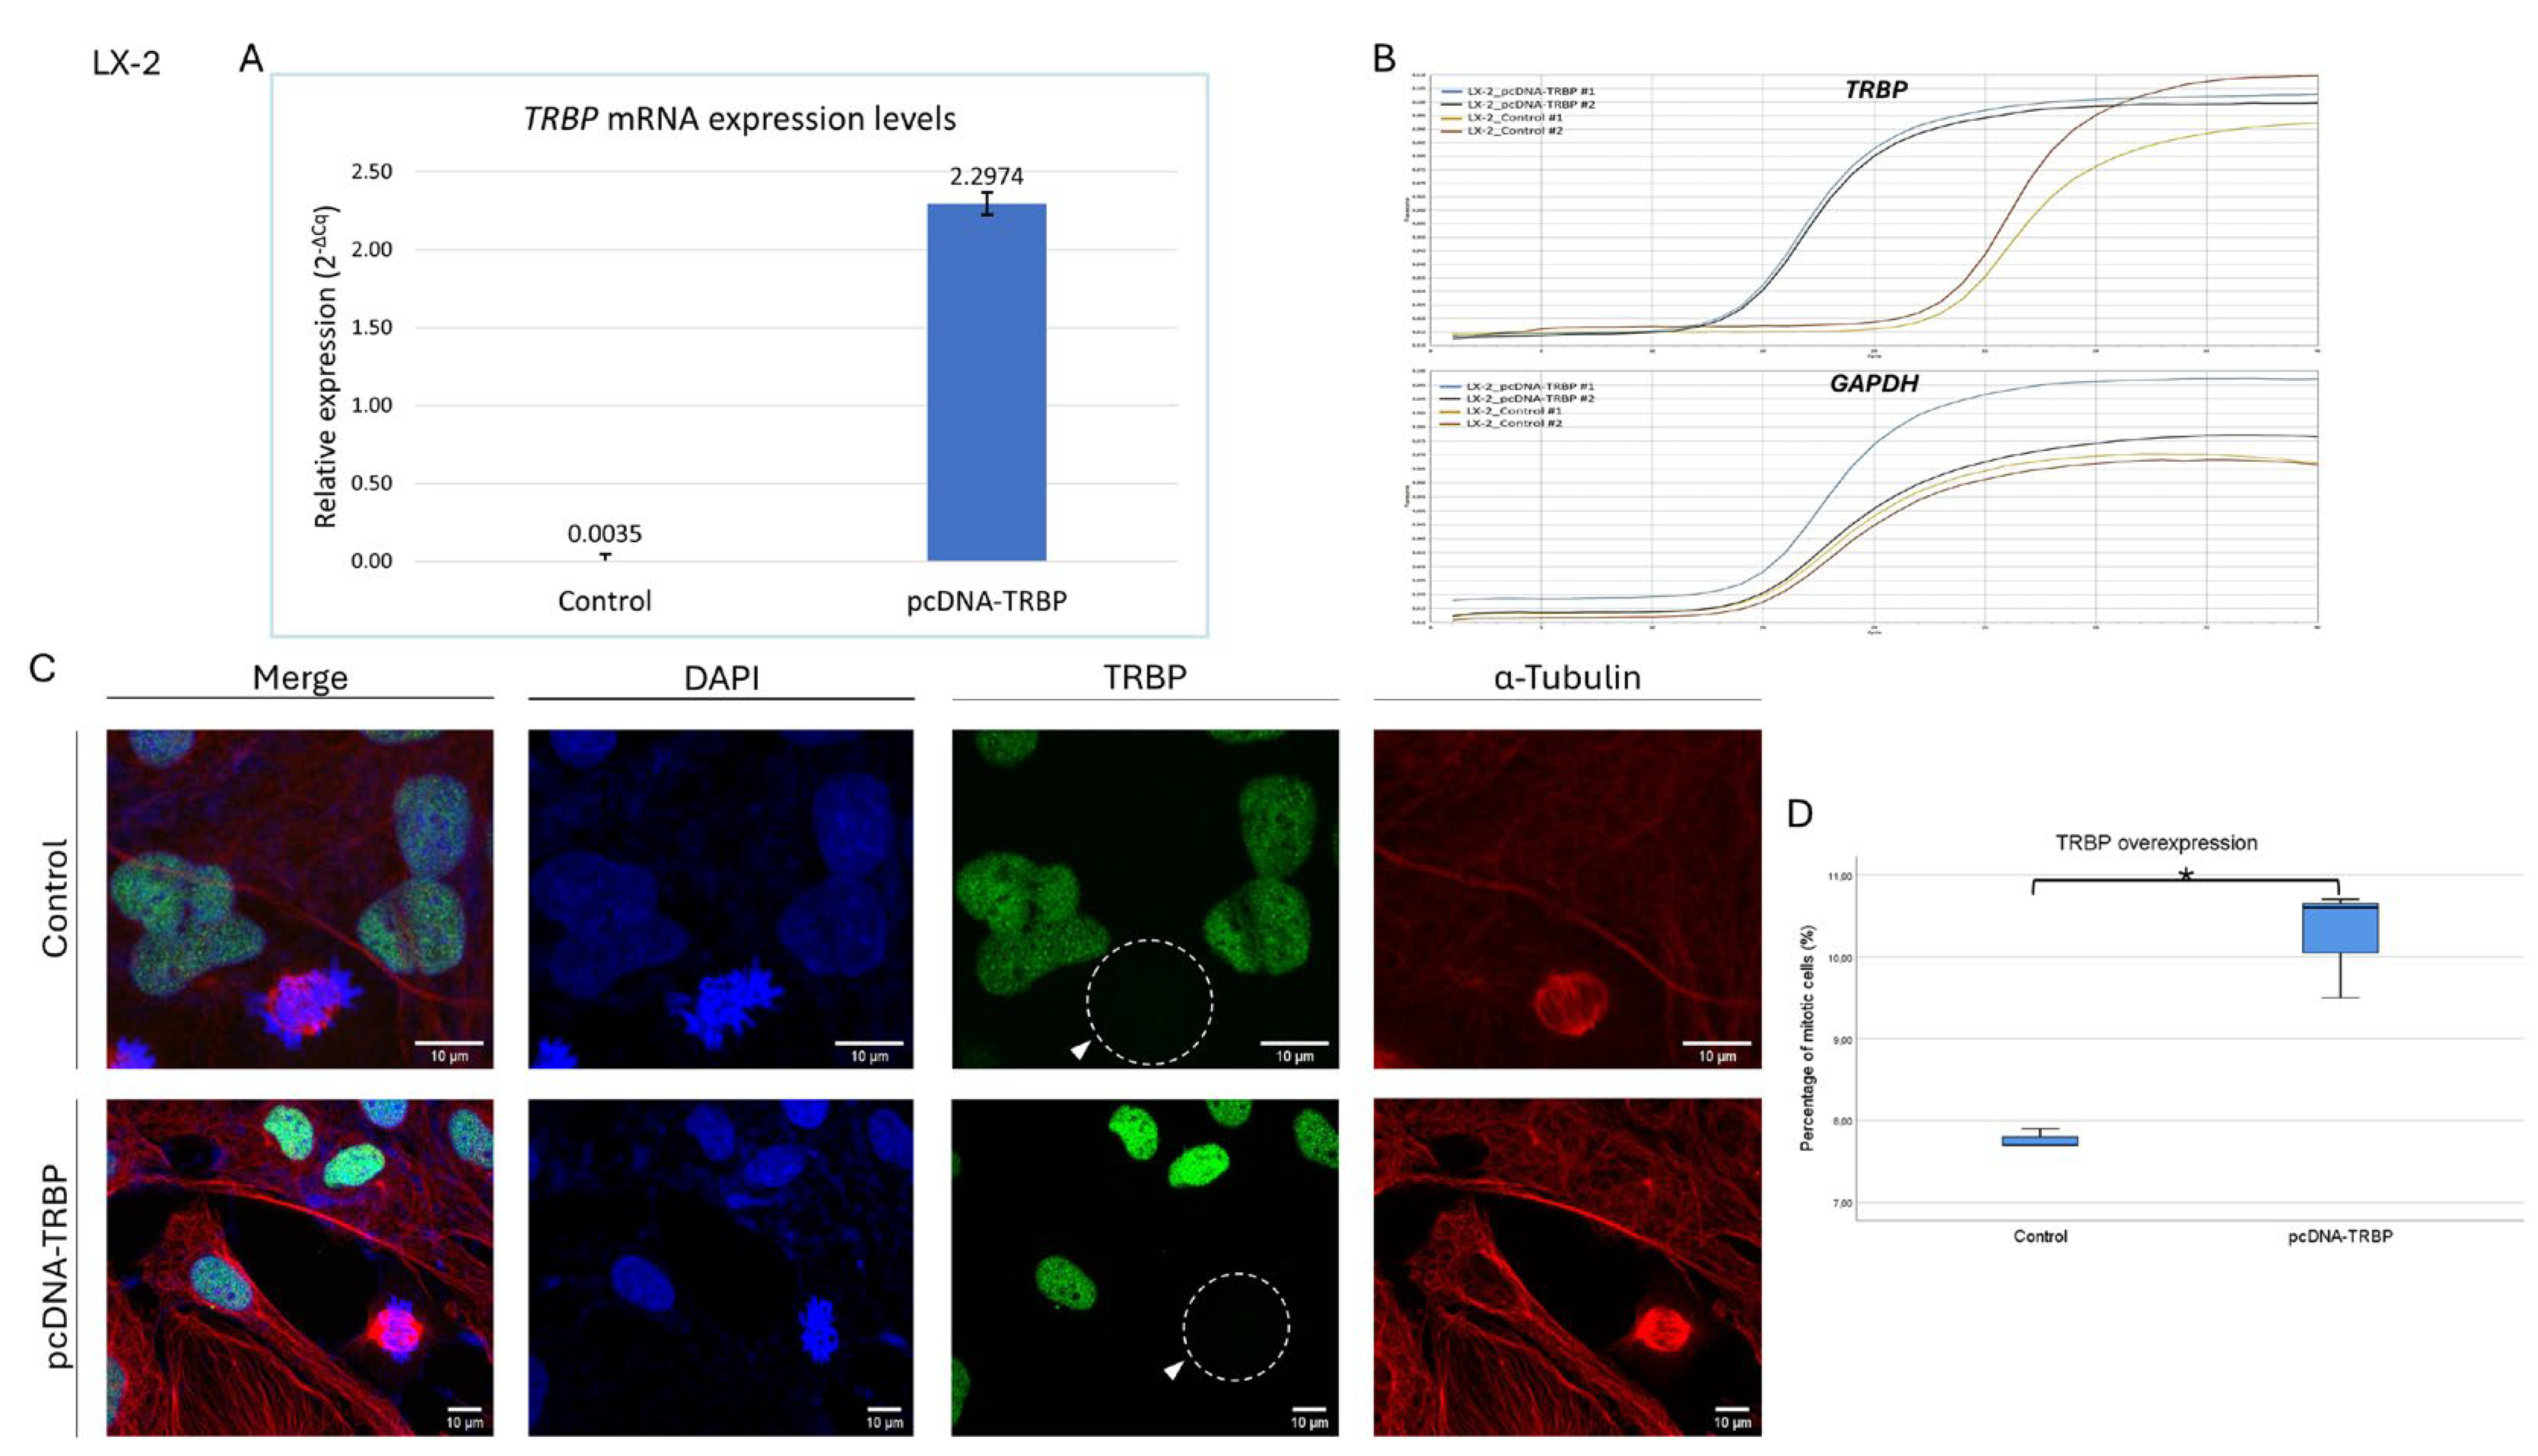
Figure 10.
Chemical inhibition of SUMOylation-, NEDDylation- and Proteasome-dependent machineries cannot alter the TRBP-immunostaining patterns in LX-2 hepatic cells. Immunofluorescence images of LX-2 cells, seeking for TRBP expression in interphase (left panels) and mitotic (right panels) cells, 24 h after the administration of 1 μM TAK-981 (SUMOylation inhibitor), MLN-4924 (NEDDylation inhibitor) and Bortezomib (Proteasome inhibitor), chemically synthesized, compounds. TRBP-immunodetection profile is lost (white arrows) only in the dividing cells, undergoing mitosis, in contrast to the interphase cells. LX-2 cells treated with 1 μM DMSO were used as control. Green color: TRBP; Red color: α-Tubulin; Blue color: Nucleus (DAPI). Scale bars: 10 μm. Inserts indicate aberrant mitoses being derived from each inhibitor’s pathogenic actions.
Figure 11.
Chemical inhibition of major signaling pathways cannot rescue the TRBP protein-specific loss during mitosis in LX-2 dividing cell. Immunofluorescence images of LX-2 cells, exploring for TRBP-immunostaining patterns in interphase and mitotic cells, 24 h after the administration of 100 μM U0126 [MEK1/2 (ERK1/2) inhibitor], 50 μM SP600125 (JNK1/2/3 inhibitor), 100 μM SB203580 (p38 MAPK inhibitor) and 25 μM MK-2206 (AKT1/2/3 inhibitor). DMSO was used as control condition. TRBP protein-immunodetection pattern is missing (white arrows) only in the dividing cells, undergoing mitosis, in contrast to the interphase cells. Green color: TRBP; Red color: α-Tubulin; Blue color: Nucleus (DAPI). Scale bars: 10 μm. Inserts denote aberrant-mitosis incidents, indicating the -pathogenic- efficacy of each chemical inhibitor.
Figure 12.
Microtubule-network disruption cannot restore the mitosis-specific lack of TRBP-immunodetection pattern in LX-2 hepatic cells. Immunofluorescence images of LX-2 cells, investigating for TRBP expression, after 6 h treatment with the Microtubule-polymerization inhibitor Demecolcine (0.4 μg/μL), in interphase (upper panels) and mitotic (lower panels) cells. TRBP protein is missing from mitotic cells (white arrows), both in treated (Demecolcine) and control (DMSO) conditions, in contrast to interphase cells. Green color: TRBP; Red color: α-Tubulin; Blue color: Nucleus (DAPI). Scale bars: 10 μm.
Figure 13.
Cell compartment-specific TRBP interactome in human diseases. Dot-plots graphically displaying major binary interactions of TRBP protein in different sub-cellular compartments, and especially cytoplasm (upper panels) and nucleus (lower panels), in diverse human diseases, including cancer (e.g., Wilms tumor) (a-h).
