Submitted:
05 October 2024
Posted:
09 October 2024
You are already at the latest version
Abstract

Keywords:
1. Introduction
2. Results
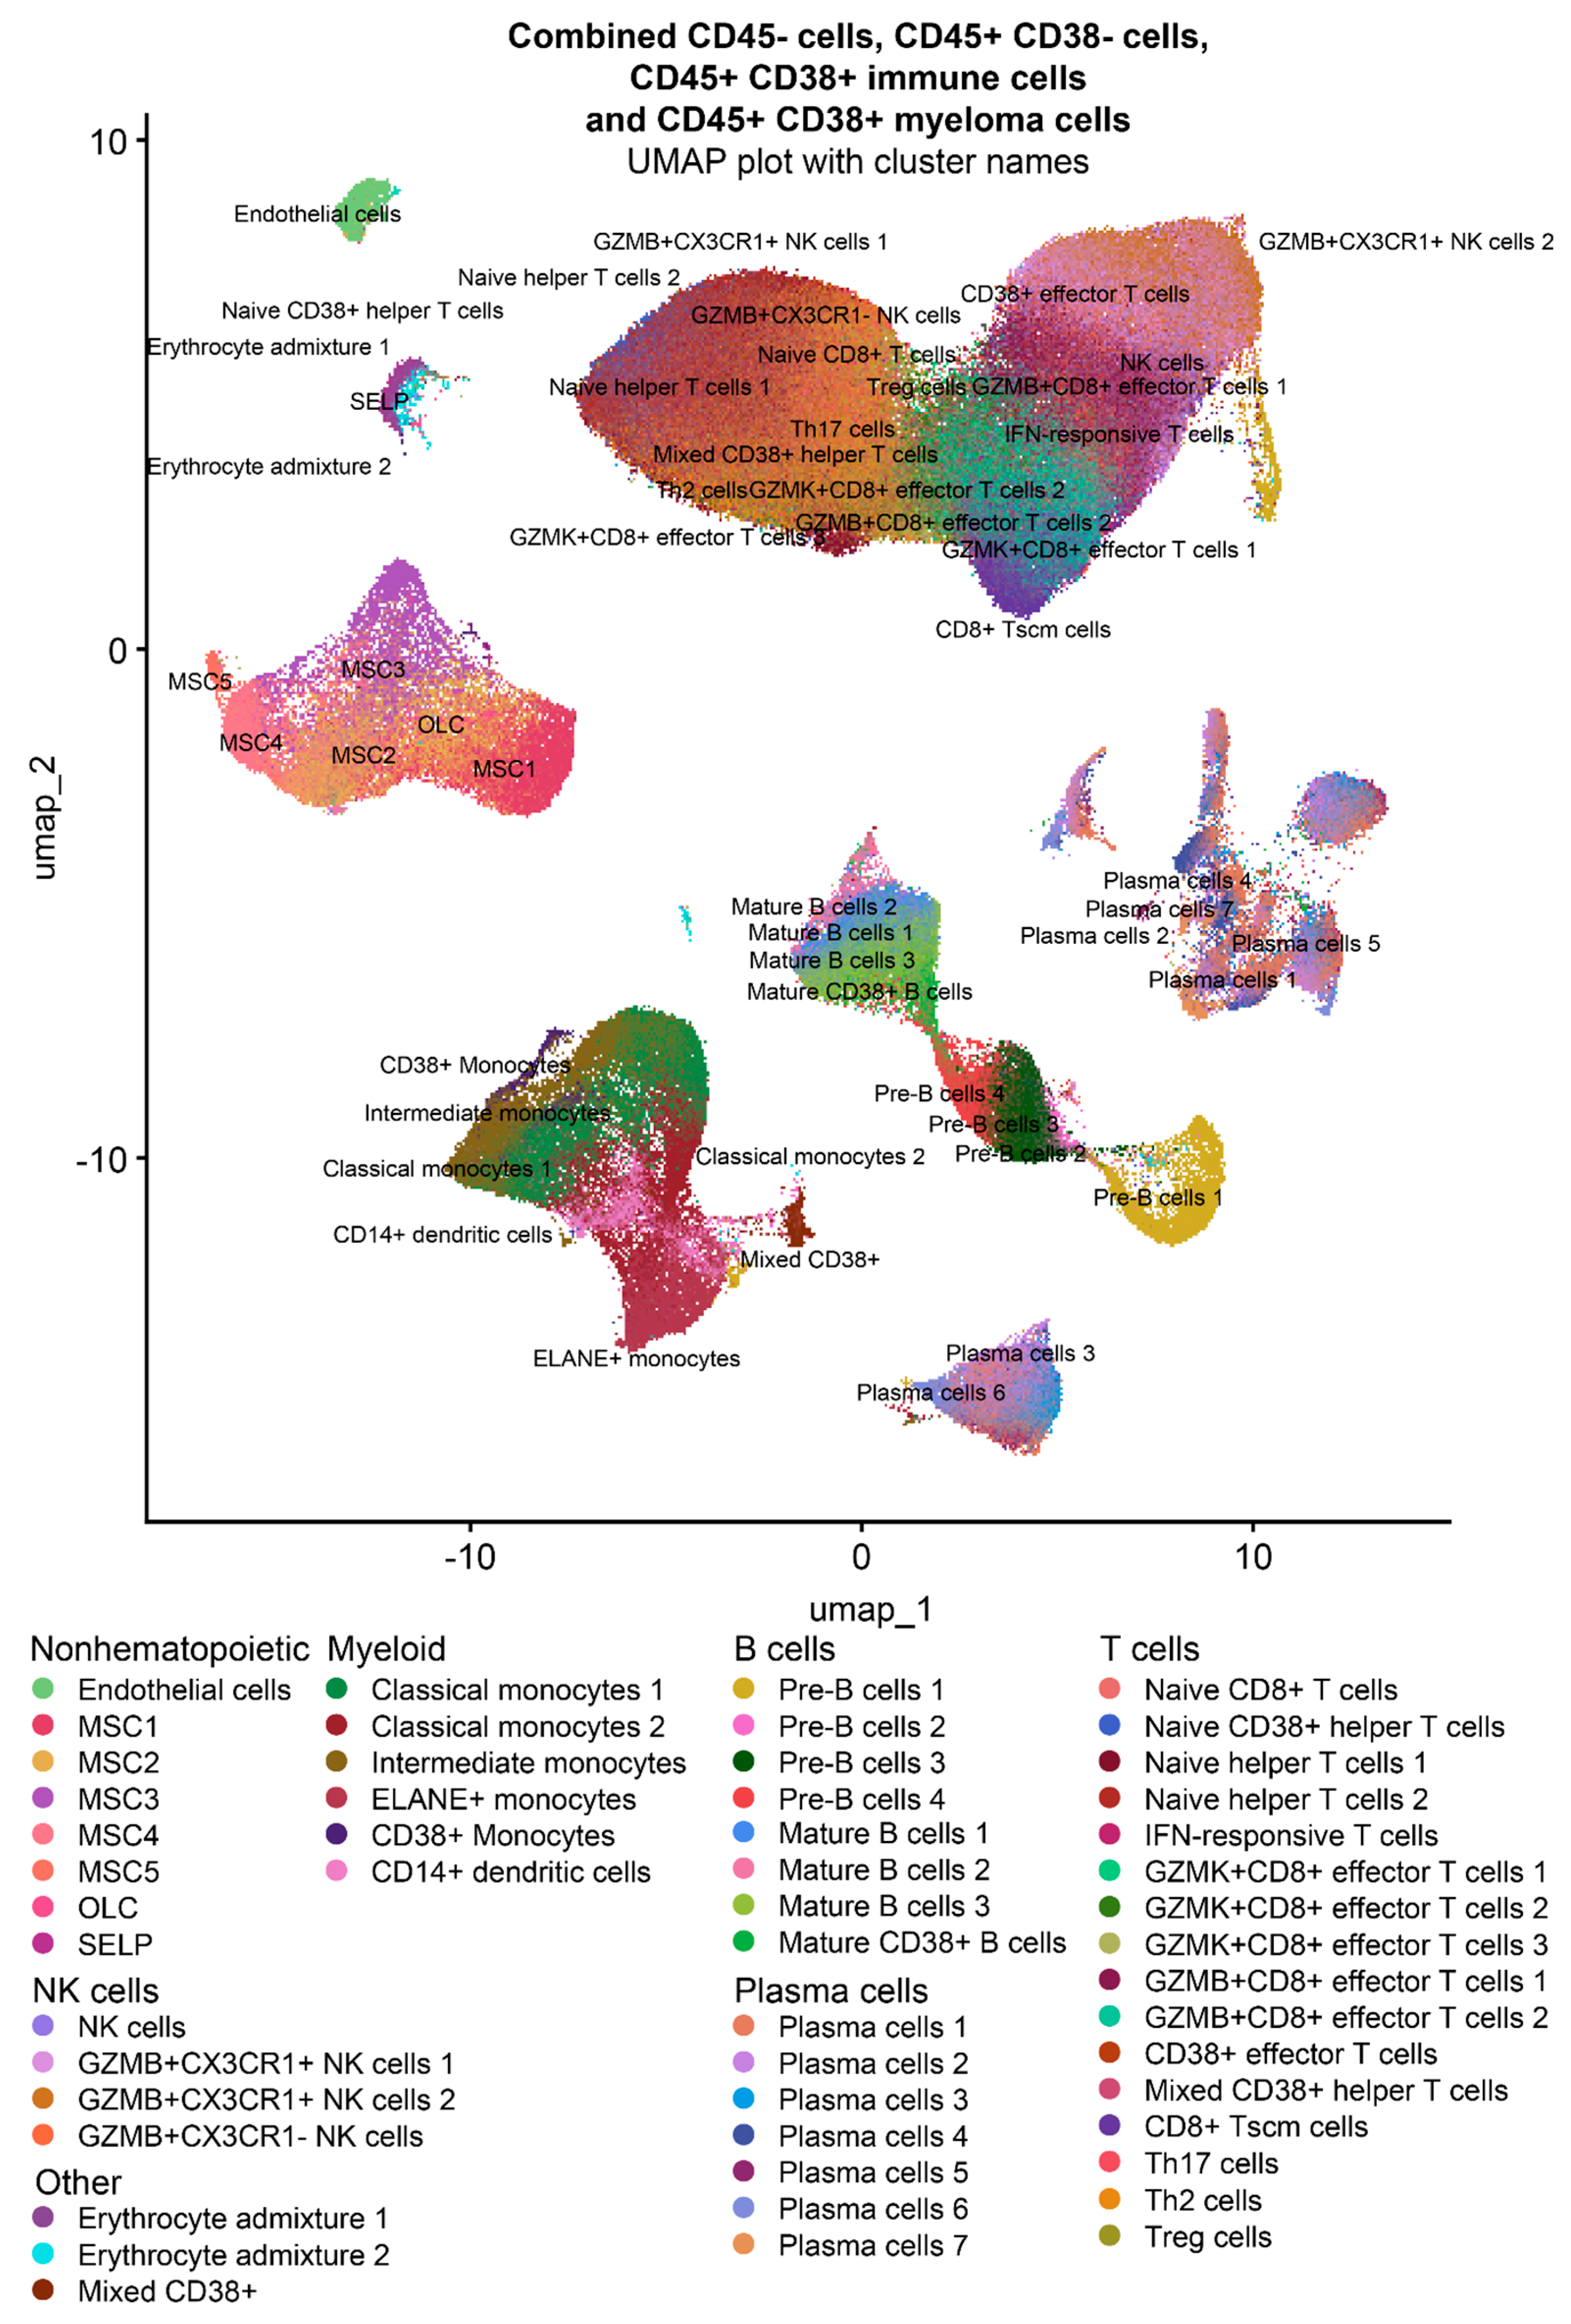
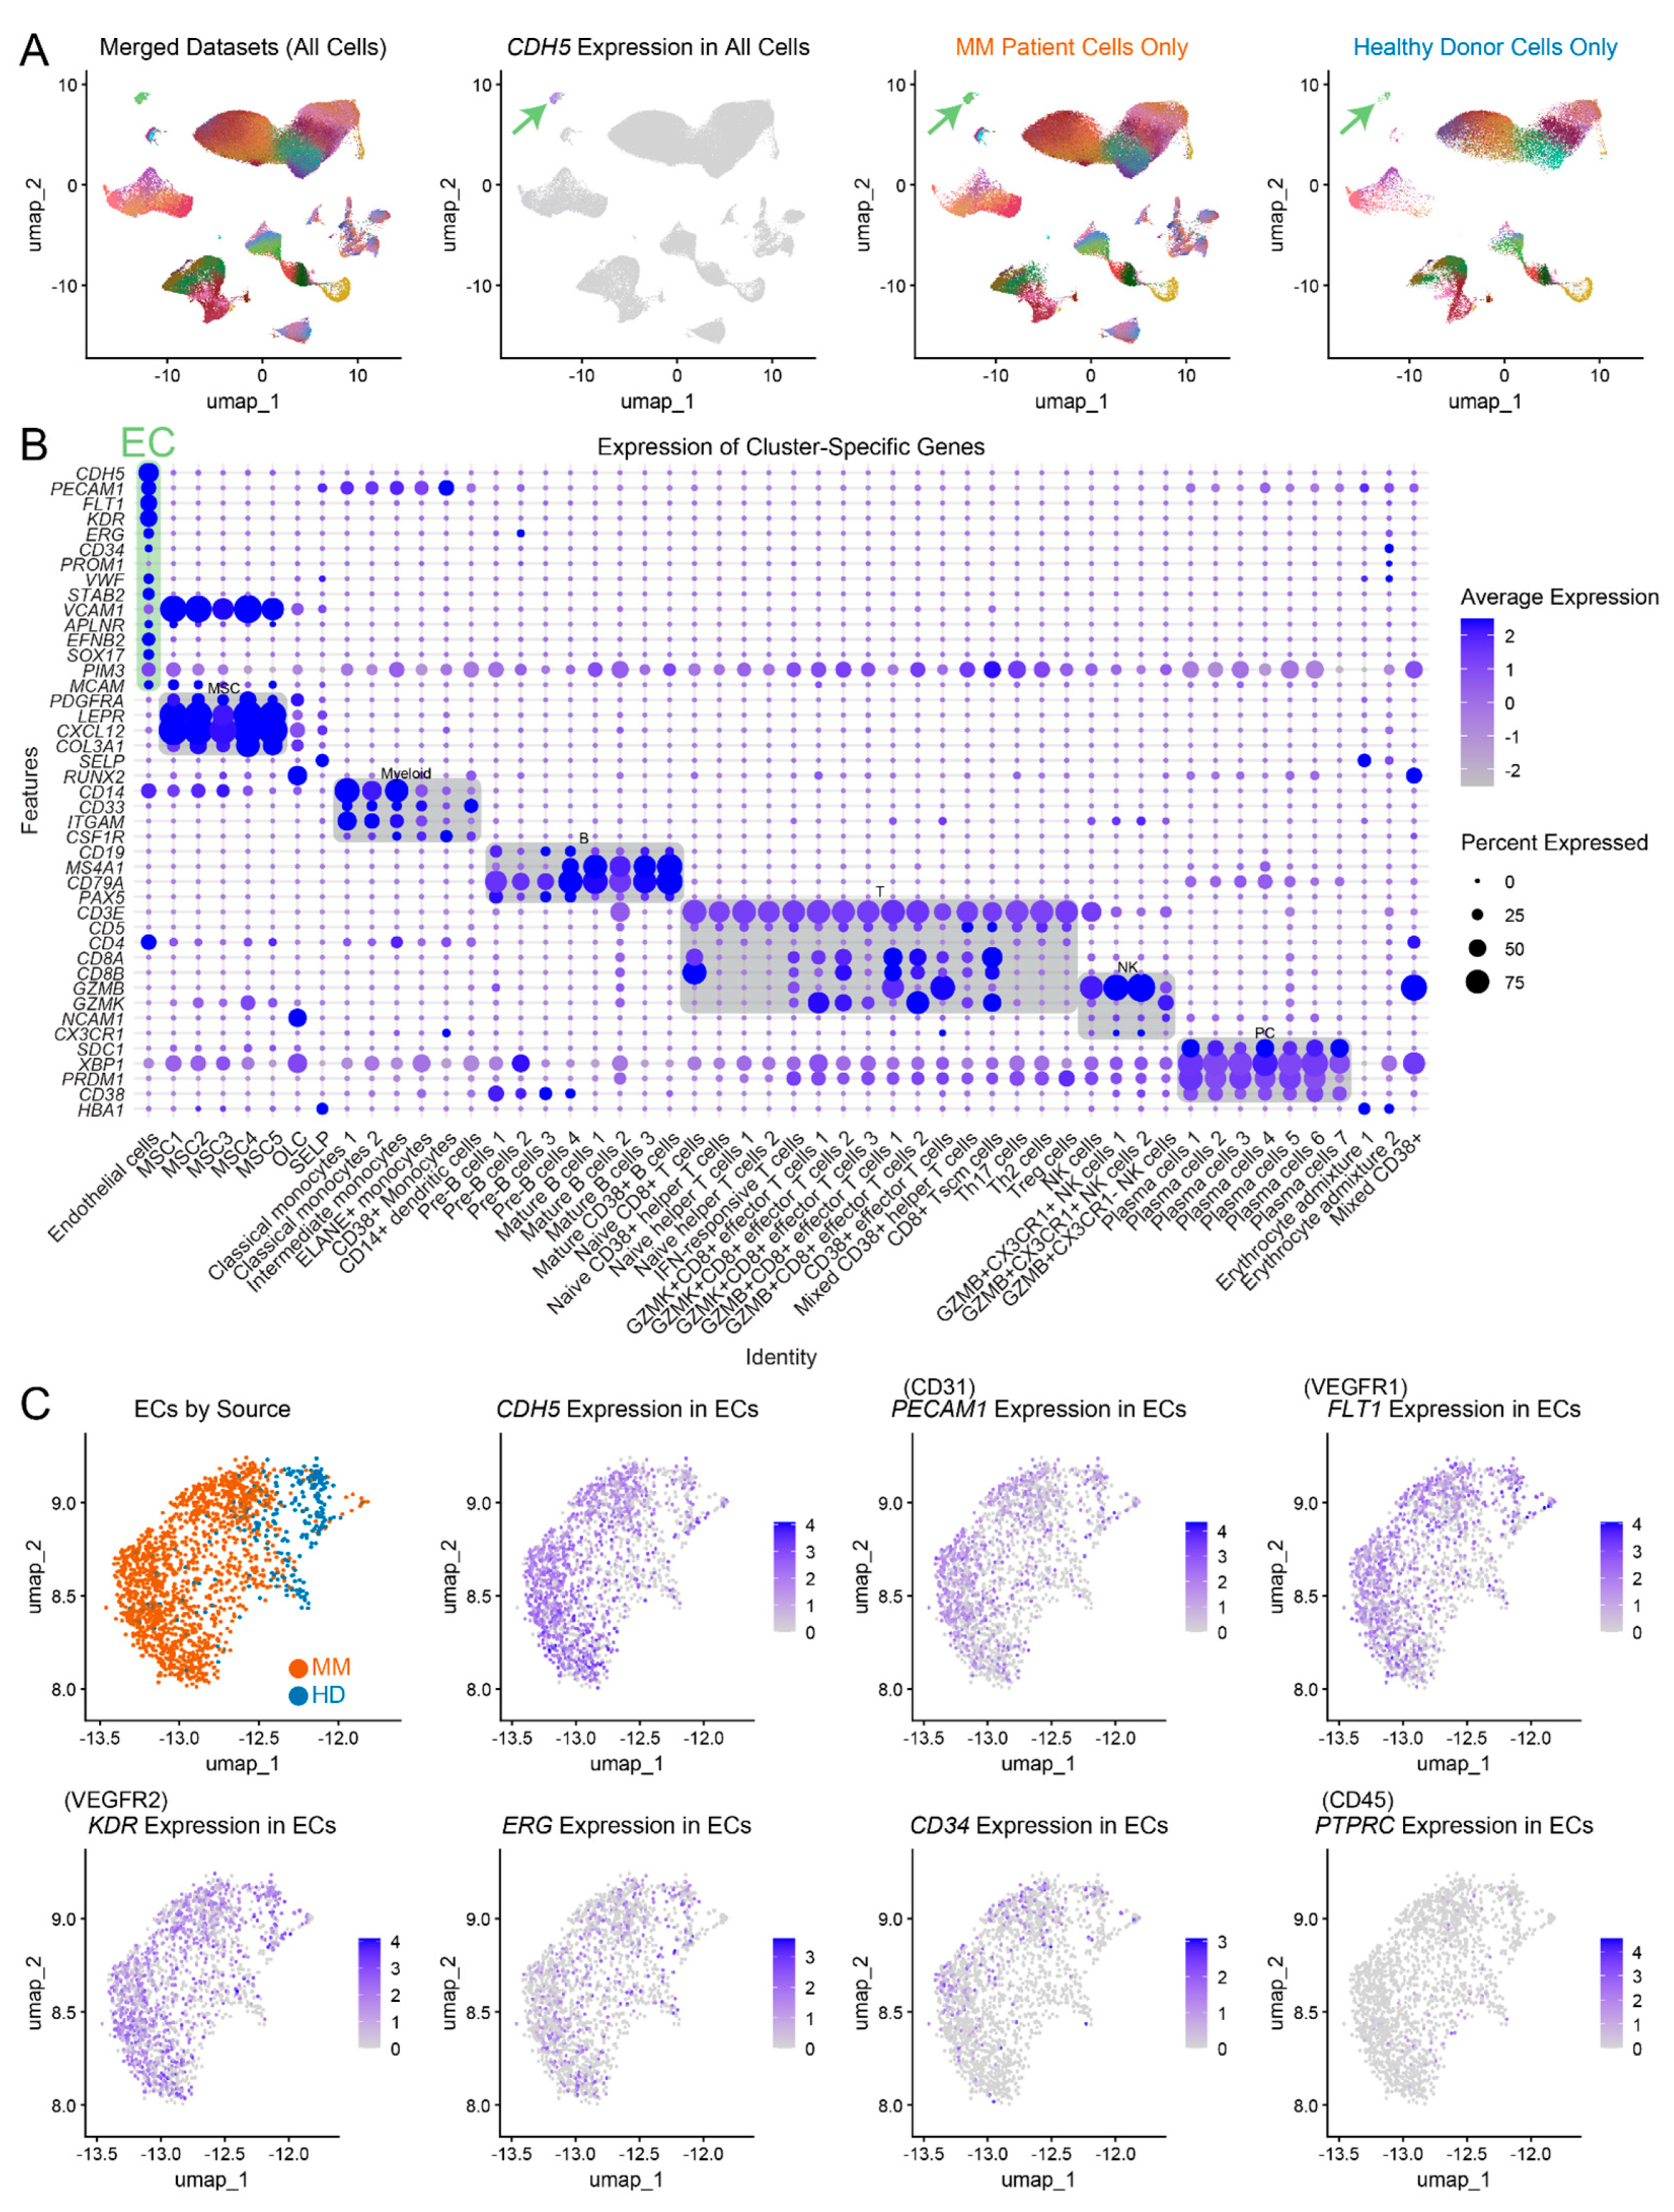
2.1. Single-cell RNAseq-based characterization of MM and HD ECs
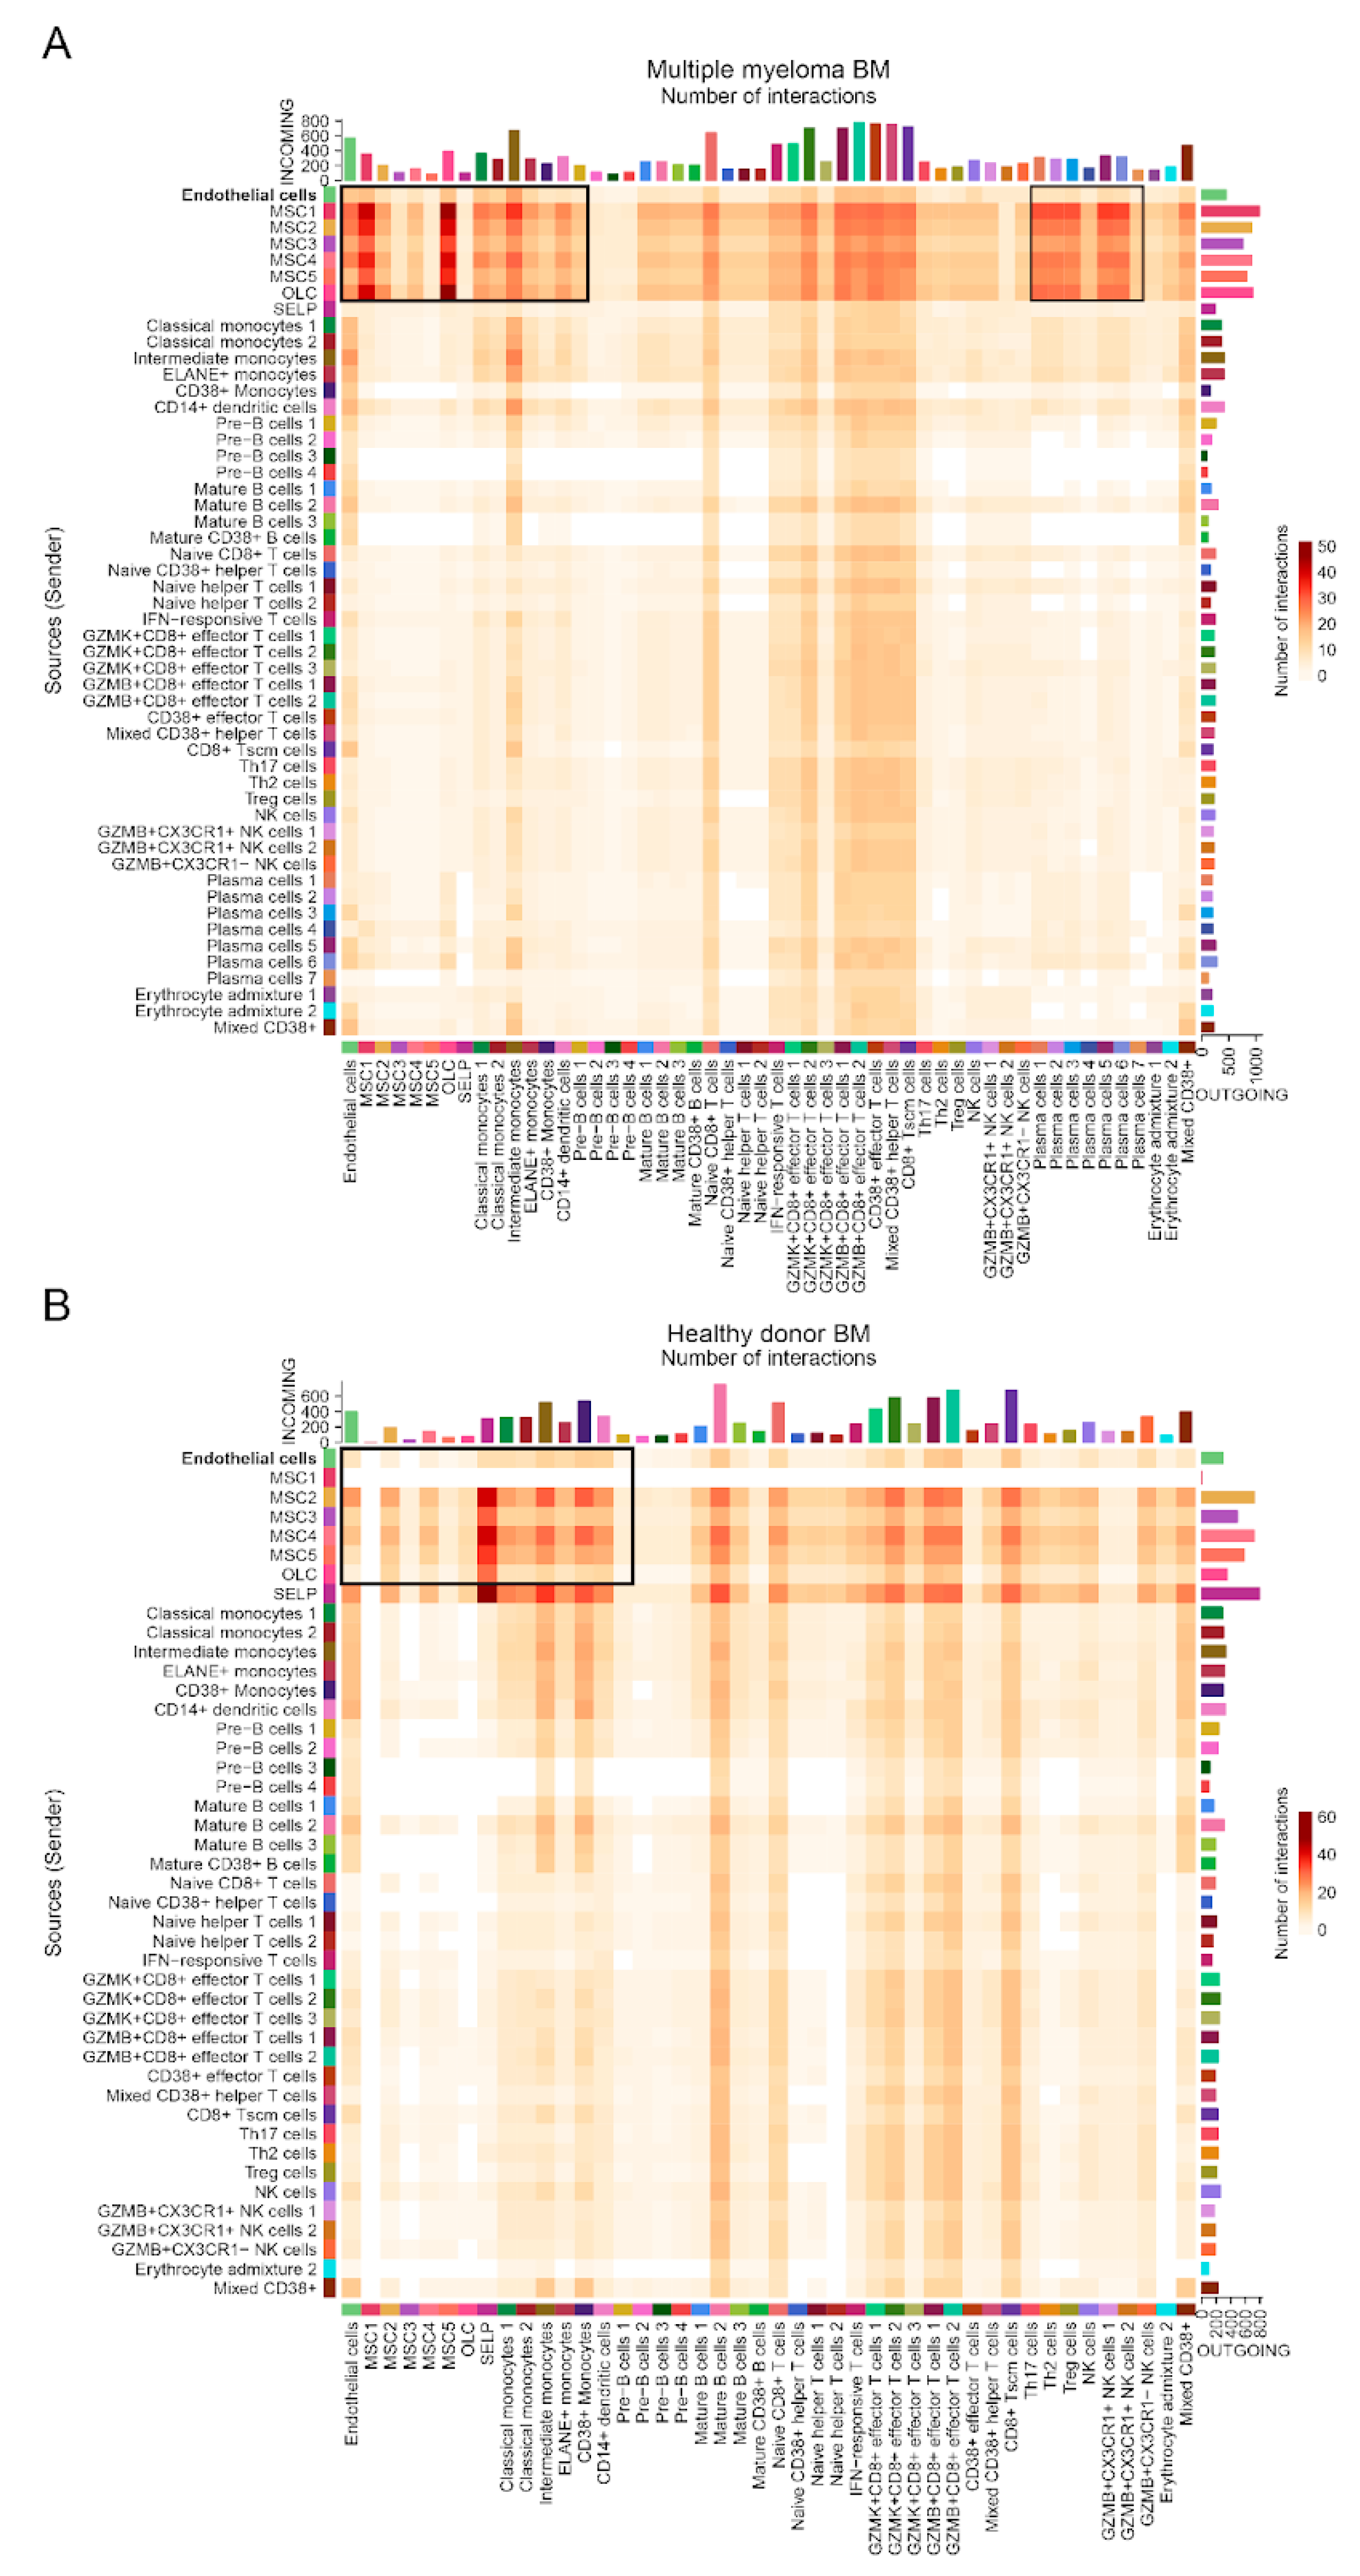
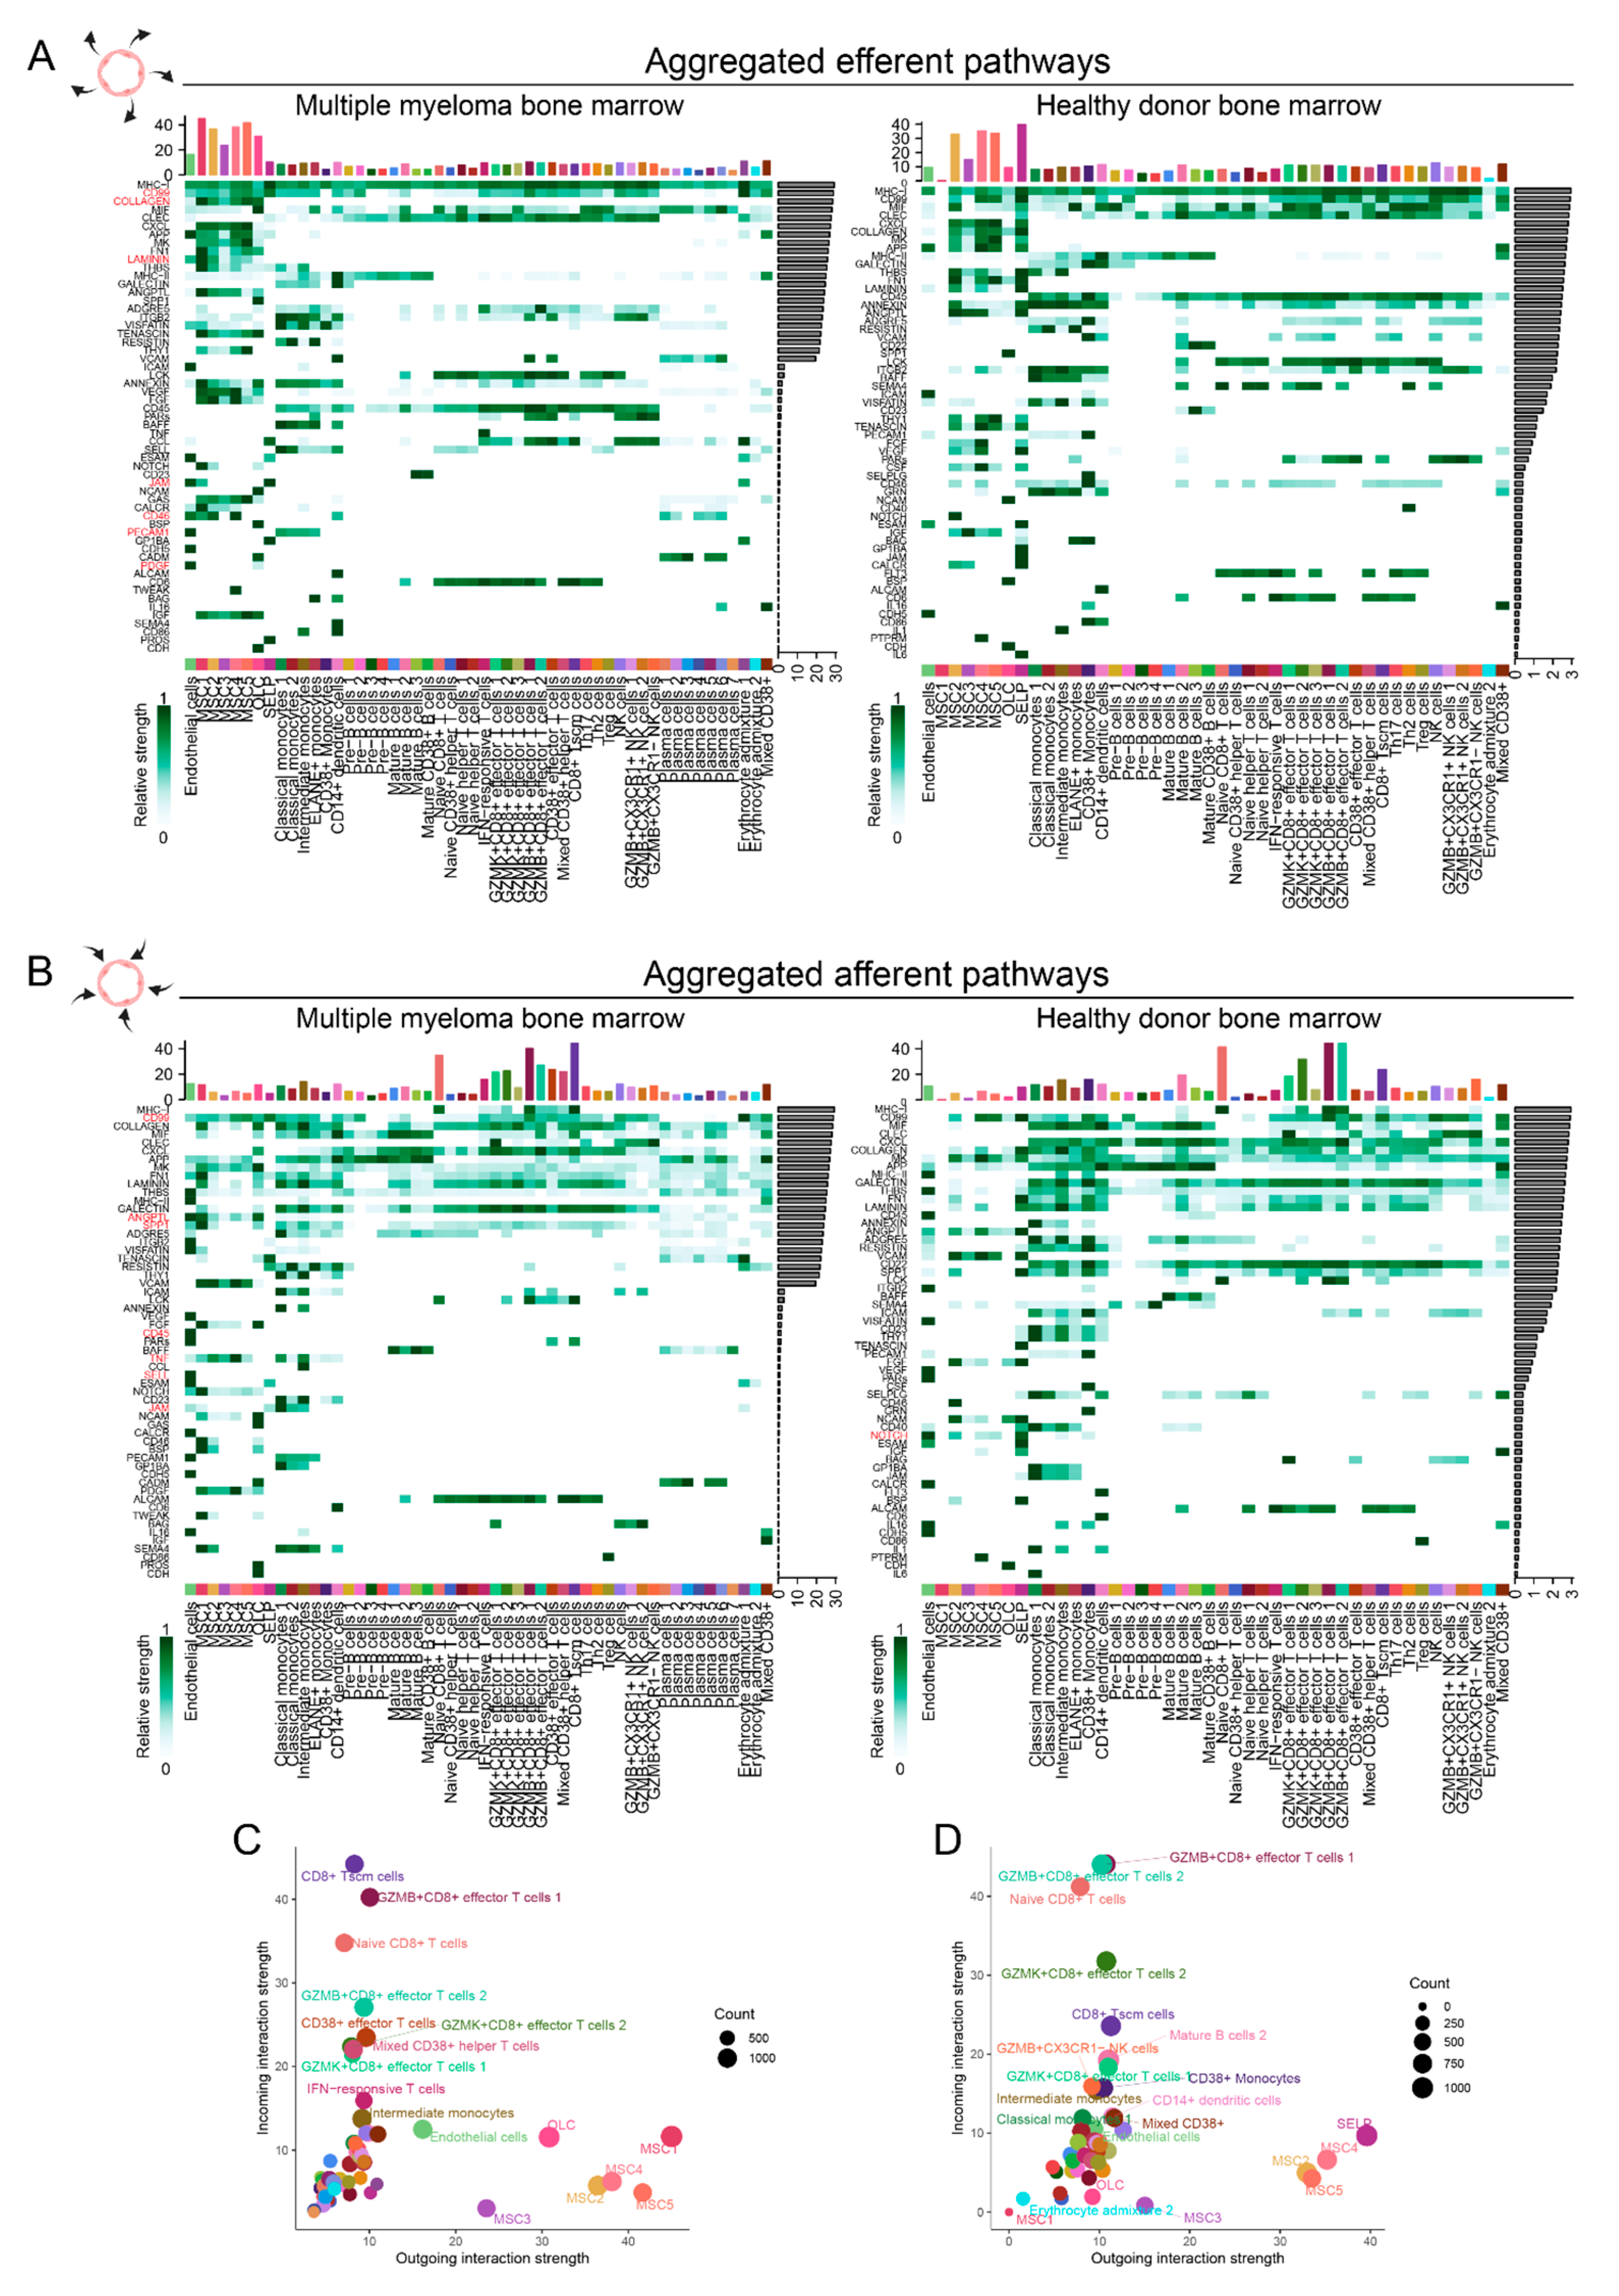
2.2. Single-cell RNAseq-based characterization of cell-cell interactions in MM and HD ECs
2.3. Isolation and ex vivo characterization of ECs from MM patients
3. Discussion
4. Materials and Methods
Data acquisition and preprocessing
Single-cell RNA-seq data processing and analysis
Gene Set Enrichment Analysis
Cell-cell communication analysis
Isolation and culture of endothelial cells from bone marrow samples
Endothelial cell characterization
Gene expression validation
Statistical analysis
Supplementary Materials
Author Contributions
Funding
Institutional Review Board Statement
Informed Consent Statement
Data Availability Statement
Acknowledgments
Conflicts of Interest
Appendix A
| Gene symbol | Oligonucleotide sequences |
|---|---|
| PTPRC | F: ACCACAAGTTTACTAACGCAAGT R: TTTGAGGGGGATTCCAGGTAAT |
| PECAM1 | F: AACAGTGTTGACATGAAGAGCC R: TGTAAAACAGCACGTCATCCTT |
| CD34 | F: CTACAACACCTAGTACCCTTGGA R: GGTGAACACTGTGCTGATTACA |
| KDR | F: GGCCCAATAATCAGAGTGGCA R: CCAGTGTCATTTCCGATCACTTT |
| PROM1 | F: AGTCGGAAACTGGCAGATAGC R: GGTAGTGTTGTACTGGGCCAAT |
| CDH5 | F: TTGGAACCAGATGCACATTGAT R: TCTTGCGACTCACGCTTGAC |
| STAB2 | F: GTGCCCGGATGGTTACACC R: CTTCCTACAAATATGGCGGCAT |
| VCAM1 | F: GGGAAGATGGTCGTGATCCTT R: TCTGGGGTGGTCTCGATTTTA |
| APLNR | F: CTCTGGACCGTGTTTCGGAG R: GGTACGTGTAGGTAGCCCACA |
| EFNB2 | F: TATGCAGAACTGCGATTTCCAA R: TGGGTATAGTACCAGTCCTTGTC |
| SOX17 | F: GTGGACCGCACGGAATTTG R: GGAGATTCACACCGGAGTCA |
| FLT1 | F: TTTGCCTGAAATGGTGAGTAAGG R: TGGTTTGCTTGAGCTGTGTTC |
| VIM | F: GACGCCATCAACACCGAGTT R: CTTTGTCGTTGGTTAGCTGGT |
| STC1 | F: GTGGCGGCTCAAAACTCAG R: GTGGAGCACCTCCGAATGG |
| YWHAZ | F: AGGAGATTACTACCGTTACTTGGC R: AGCTTCTTGGTATGCTTGTTGTG |
| ACTB | F: CATGTACGTTGCTATCCAGGC R: CTCCTTAATGTCACGCACGAT |
| RNA18S | F: CGTCTGCCCTATCAACTTTG R: TGCCTTCCTTGGATGTGGTAG |
References
- García-Ortiz, A.; Rodríguez-García, Y.; Encinas, J.; Maroto-Martín, E.; Castellano, E.; Teixidó, J.; Martínez-López, J. The Role of Tumor Microenvironment in Multiple Myeloma Development and Progression. Cancers 2021, 13, 217. [Google Scholar] [CrossRef] [PubMed]
- Zhu, D.; Wang, Z.; Zhao, J.-J.; Calimeri, T.; Meng, J.; Hideshima, T.; Fulciniti, M.; Kang, Y.; Ficarro, S.B.; Tai, Y.-T.; et al. The Cyclophilin A–CD147 Complex Promotes the Proliferation and Homing of Multiple Myeloma Cells. Nat. Med. 2015, 21, 572–580. [Google Scholar] [CrossRef] [PubMed]
- Moschetta, M.; Mishima, Y.; Kawano, Y.; Manier, S.; Paiva, B.; Palomera, L.; Aljawai, Y.; Calcinotto, A.; Unitt, C.; Sahin, I.; et al. Targeting Vasculogenesis to Prevent Progression in Multiple Myeloma. Leukemia 2016, 30, 1103–1115. [Google Scholar] [CrossRef] [PubMed]
- Ferrucci, A.; Moschetta, M.; Frassanito, M.A.; Berardi, S.; Catacchio, I.; Ria, R.; Racanelli, V.; Caivano, A.; Solimando, A.G.; Vergara, D.; et al. A HGF/cMET Autocrine Loop Is Operative in Multiple Myeloma Bone Marrow Endothelial Cells and May Represent a Novel Therapeutic Target. Clin. Cancer Res. 2014, 20, 5796–5807. [Google Scholar] [CrossRef]
- De Jong, M.M.E.; Kellermayer, Z.; Papazian, N.; Tahri, S.; Hofste Op Bruinink, D.; Hoogenboezem, R.; Sanders, M.A.; Van De Woestijne, P.C.; Bos, P.K.; Khandanpour, C.; et al. The Multiple Myeloma Microenvironment Is Defined by an Inflammatory Stromal Cell Landscape. Nat. Immunol. 2021, 22, 769–780. [Google Scholar] [CrossRef]
- Zavidij, O.; Haradhvala, N.J.; Mouhieddine, T.H.; Sklavenitis-Pistofidis, R.; Cai, S.; Reidy, M.; Rahmat, M.; Flaifel, A.; Ferland, B.; Su, N.K.; et al. Single-Cell RNA Sequencing Reveals Compromised Immune Microenvironment in Precursor Stages of Multiple Myeloma. Nat. Cancer 2020, 1, 493–506. [Google Scholar] [CrossRef]
- Alexandrakis, M.G.; Passam, F.J.; Ganotakis, E.; Dafnis, E.; Dambaki, C.; Konsolas, J.; Kyriakou, D.S.; Stathopoulos, E. Bone Marrow Microvascular Density and Angiogenic Growth Factors in Multiple Myeloma. Clin. Chem. Lab. Med. 2004, 42, 1122–1126. [Google Scholar] [CrossRef]
- Garbicz, F.; Debek, S.; Szumera-Ciećkiewicz, A.; Barankiewicz, J.; Komar, D.; Pawlak, M.; Matrejek, A.; Stuehmer, T.; Salomon-Perzynski, A.; Malenda, A.; et al. Super-Enhancer-Driven PIM Kinase Upregulation in Multiple Myeloma Maintains the Plasma Cell-Specific Oncogenic and Microenvironmental Circuits, and Can Be Efficiently Targeted By the Pan-PIM Inhibitor MEN1703. Blood 2022, 140, 4189–4190. [Google Scholar] [CrossRef]
- Garbicz, F.; Szumera-Ciećkiewicz, A.; Barankiewicz, J.; Komar, D.; Pawlak, M.; Dębek, S.; Matrejek, A.; Stuehmer, T.; Salomon-Perzynski, A.; Malenda, A.; et al. PIM Kinase Inhibition Decreases the Proangiogenic Properties of Multiple Myeloma Cells and Affects the Metabolic State of the Vascular Endothelium. Blood 2020, 136, 16–17. [Google Scholar] [CrossRef]
- Campanelli, R.; Abbà, C.; Carolei, A.; Catarsi, P.; Barosi, G.; Massa, M.; Rosti, V. Cells Coexpressing Both Myeloid and Endothelial Markers Are Detectable in the Spleen and Bone Marrow of Patients with Primary Myelofibrosis. Exp. Hematol. 2022, 116, 26–29. [Google Scholar] [CrossRef]
- Jia, J.; Ye, T.; Cui, P.; Hua, Q.; Zeng, H.; Zhao, D. AP-1 Transcription Factor Mediates VEGF-Induced Endothelial Cell Migration and Proliferation. Microvasc. Res. 2016, 105, 103–108. [Google Scholar] [CrossRef] [PubMed]
- Cohen, B.; Tempelhof, H.; Raz, T.; Oren, R.; Nicenboim, J.; Bochner, F.; Even, R.; Jelinski, A.; Eilam, R.; Ben-Dor, S.; et al. BACH Family Members Regulate Angiogenesis and Lymphangiogenesis by Modulating VEGFC Expression. Life Sci. Alliance 2020, 3, e202000666. [Google Scholar] [CrossRef] [PubMed]
- Zhou, Y.; Zhou, B.; Pache, L.; Chang, M.; Khodabakhshi, A.H.; Tanaseichuk, O.; Benner, C.; Chanda, S.K. Metascape Provides a Biologist-Oriented Resource for the Analysis of Systems-Level Datasets. Nat. Commun. 2019, 10, 1523. [Google Scholar] [CrossRef] [PubMed]
- Thiery, J.P.; Acloque, H.; Huang, R.Y.J.; Nieto, M.A. Epithelial-Mesenchymal Transitions in Development and Disease. Cell 2009, 139, 871–890. [Google Scholar] [CrossRef]
- Huber, M.A.; Kraut, N.; Beug, H. Molecular Requirements for Epithelial–Mesenchymal Transition during Tumor Progression. Curr. Opin. Cell Biol. 2005, 17, 548–558. [Google Scholar] [CrossRef]
- Yamazaki, K.; Masugi, Y.; Effendi, K.; Tsujikawa, H.; Hiraoka, N.; Kitago, M.; Shinoda, M.; Itano, O.; Tanabe, M.; Kitagawa, Y.; et al. Upregulated SMAD3 Promotes Epithelial–Mesenchymal Transition and Predicts Poor Prognosis in Pancreatic Ductal Adenocarcinoma. Lab. Invest. 2014, 94, 683–691. [Google Scholar] [CrossRef]
- Cowling, V.H.; Cole, M.D. E-Cadherin Repression Contributes to c-Myc-Induced Epithelial Cell Transformation. Oncogene 2007, 26, 3582–3586. [Google Scholar] [CrossRef]
- Abaurrea, A.; Araujo, A.M.; Caffarel, M.M. The Role of the IL-6 Cytokine Family in Epithelial–Mesenchymal Plasticity in Cancer Progression. Int. J. Mol. Sci. 2021, 22, 8334. [Google Scholar] [CrossRef]
- Song, J.; Qian, Y.; Evers, M.; Nielsen, C.M.; Chen, X. Cancer Stem Cell Formation Induced and Regulated by Extracellular ATP and Stanniocalcin-1 in Human Lung Cancer Cells and Tumors. Int. J. Mol. Sci. 2022, 23, 14770. [Google Scholar] [CrossRef]
- Polo-Generelo, S.; Rodríguez-Mateo, C.; Torres, B.; Pintor-Tortolero, J.; Guerrero-Martínez, J.A.; König, J.; Vázquez, J.; Bonzón-Kulichenco, E.; Padillo-Ruiz, J.; de la Portilla, F.; et al. Serpine1 mRNA Confers Mesenchymal Characteristics to the Cell and Promotes CD8+ T Cells Exclusion from Colon Adenocarcinomas. Cell Death Discov. 2024, 10, 1–14. [Google Scholar] [CrossRef]
- Swaminathan, B.; Youn, S.-W.; Naiche, L.A.; Du, J.; Villa, S.R.; Metz, J.B.; Feng, H.; Zhang, C.; Kopan, R.; Sims, P.A.; et al. Endothelial Notch Signaling Directly Regulates the Small GTPase RND1 to Facilitate Notch Suppression of Endothelial Migration. Sci. Rep. 2022, 12, 1655. [Google Scholar] [CrossRef] [PubMed]
- Vokes, S.A.; Yatskievych, T.A.; Heimark, R.L.; McMahon, J.; McMahon, A.P.; Antin, P.B.; Krieg, P.A. Hedgehog Signaling Is Essential for Endothelial Tube Formation during Vasculogenesis. Development 2004, 131, 4371–4380. [Google Scholar] [CrossRef] [PubMed]
- Zhu, Z.; He, X.; Johnson, C.; Stoops, J.; Eaker, A.E.; Stoffer, D.S.; Bell, A.; Zarnegar, R.; DeFrances, M.C. PI3K Is Negatively Regulated by PIK3IP1, a Novel P110 Interacting Protein. Biochem. Biophys. Res. Commun. 2007, 358, 66–72. [Google Scholar] [CrossRef] [PubMed]
- Bestepe, F.; Ghanem, G.F.; Fritsche, C.M.; Weston, J.; Sahay, S.; Mauro, A.K.; Sahu, P.; Tas, S.M.; Ruemmele, B.; Persing, S.; et al. MicroRNA-409-3p/BTG2 Signaling Axis Improves Impaired Angiogenesis and Wound Healing in Obese Mice. FASEB J. 2024, 38, e23459. [Google Scholar] [CrossRef]
- Medina, R.J.; O’Neill, C.L.; Humphreys, M.W.; Gardiner, T.A.; Stitt, A.W. Outgrowth Endothelial Cells: Characterization and Their Potential for Reversing Ischemic Retinopathy. Invest. Ophthalmol. Vis. Sci. 2010, 51, 5906–5913. [Google Scholar] [CrossRef]
- Hur, J.; Yoon, C.-H.; Kim, H.-S.; Choi, J.-H.; Kang, H.-J.; Hwang, K.-K.; Oh, B.-H.; Lee, M.-M.; Park, Y.-B. Characterization of Two Types of Endothelial Progenitor Cells and Their Different Contributions to Neovasculogenesis. Arterioscler. Thromb. Vasc. Biol. 2004, 24, 288–293. [Google Scholar] [CrossRef]
- Eggermann, J.; Kliche, S.; Jarmy, G.; Hoffmann, K.; Mayr-Beyrle, U.; Debatin, K.M.; Waltenberger, J.; Beltinger, C. Endothelial Progenitor Cell Culture and Differentiation in Vitro: A Methodological Comparison Using Human Umbilical Cord Blood. Cardiovasc. Res. 2003, 58, 478–486. [Google Scholar] [CrossRef]
- Kaplan, R.N.; Riba, R.D.; Zacharoulis, S.; Bramley, A.H.; Vincent, L.; Costa, C.; MacDonald, D.D.; Jin, D.K.; Shido, K.; Kerns, S.A.; et al. VEGFR1-Positive Haematopoietic Bone Marrow Progenitors Initiate the Pre-Metastatic Niche. Nature 2005, 438, 820–827. [Google Scholar] [CrossRef]
- Werner, N.; Kosiol, S.; Schiegl, T.; Ahlers, P.; Walenta, K.; Link, A.; Böhm, M.; Nickenig, G. Circulating Endothelial Progenitor Cells and Cardiovascular Outcomes. N. Engl. J. Med. 2005, 353, 999–1007. [Google Scholar] [CrossRef]
- Iga, T.; Kobayashi, H.; Kusumoto, D.; Sanosaka, T.; Fujita, N.; Tai-Nagara, I.; Ando, T.; Takahashi, T.; Matsuo, K.; Hozumi, K.; et al. Spatial Heterogeneity of Bone Marrow Endothelial Cells Unveils a Distinct Subtype in the Epiphysis. Nat. Cell Biol. 2023, 25, 1415–1425. [Google Scholar] [CrossRef]
- Bid, H.K.; Phelps, D.A.; Xaio, L.; Guttridge, D.C.; Lin, J.; London, C.; Baker, L.H.; Mo, X.; Houghton, P.J. The Bromodomain BET Inhibitor JQ1 Suppresses Tumor Angiogenesis in Models of Childhood Sarcoma. Mol. Cancer Ther. 2016, 15, 1018–1028. [Google Scholar] [CrossRef] [PubMed]
- Kalna, V.; Yang, Y.; Peghaire, C.R.; Frudd, K.; Hannah, R.; Shah, A.V.; Osuna Almagro, L.; Boyle, J.J.; Göttgens, B.; Ferrer, J.; et al. The Transcription Factor ERG Regulates Super-Enhancers Associated With an Endothelial-Specific Gene Expression Program. Circ. Res. 2019, 124, 1337–1349. [Google Scholar] [CrossRef] [PubMed]
- Chapuy, B.; McKeown, M.R.; Lin, C.Y.; Monti, S.; Roemer, M.G.M.; Qi, J.; Rahl, P.B.; Sun, H.H.; Yeda, K.T.; Doench, J.G.; et al. Discovery and Characterization of Super-Enhancer-Associated Dependencies in Diffuse Large B Cell Lymphoma. Cancer Cell 2013, 24, 777–790. [Google Scholar] [CrossRef] [PubMed]
- Bhutani, M.; Turkbey, B.; Tan, E.; Kemp, T.J.; Pinto, L.A.; Berg, A.R.; Korde, N.; Minter, A.R.; Weiss, B.M.; Mena, E.; et al. Bone Marrow Angiogenesis in Myeloma and Its Precursor Disease: A Prospective Clinical Trial. Leukemia 2014, 28, 413–416. [Google Scholar] [CrossRef]
- Piera-Velazquez, S.; Jimenez, S.A. Endothelial to Mesenchymal Transition: Role in Physiology and in the Pathogenesis of Human Diseases. Physiol. Rev. 2019, 99, 1281–1324. [Google Scholar] [CrossRef]
- Berardi, S.; Caivano, A.; Ria, R.; Nico, B.; Savino, R.; Terracciano, R.; De Tullio, G.; Ferrucci, A.; De Luisi, A.; Moschetta, M.; et al. Four Proteins Governing Overangiogenic Endothelial Cell Phenotype in Patients with Multiple Myeloma Are Plausible Therapeutic Targets. Oncogene 2012, 31, 2258–2269. [Google Scholar] [CrossRef]
- Arnulf, B.; Lecourt, S.; Soulier, J.; Ternaux, B.; Lacassagne, M.-N.; Crinquette, A.; Dessoly, J.; Sciaini, A.-K.; Benbunan, M.; Chomienne, C.; et al. Phenotypic and Functional Characterization of Bone Marrow Mesenchymal Stem Cells Derived from Patients with Multiple Myeloma. Leukemia 2007, 21, 158–163. [Google Scholar] [CrossRef]
- André, T.; Meuleman, N.; Stamatopoulos, B.; De Bruyn, C.; Pieters, K.; Bron, D.; Lagneaux, L. Evidences of Early Senescence in Multiple Myeloma Bone Marrow Mesenchymal Stromal Cells. PloS One 2013, 8, e59756. [Google Scholar] [CrossRef]
- Garderet, L.; Mazurier, C.; Chapel, A.; Ernou, I.; Boutin, L.; Holy, X.; Gorin, N.C.; Lopez, M.; Doucet, C.; Lataillade, J.-J. Mesenchymal Stem Cell Abnormalities in Patients with Multiple Myeloma. Leuk. Lymphoma 2007, 48, 2032–2041. [Google Scholar] [CrossRef]
- Zdzisińska, B.; Bojarska-Junak, A.; Dmoszyńska, A.; Kandefer-Szerszeń, M. Abnormal Cytokine Production by Bone Marrow Stromal Cells of Multiple Myeloma Patients in Response to RPMI8226 Myeloma Cells. Arch. Immunol. Ther. Exp. (Warsz.) 2008, 56, 207–221. [Google Scholar] [CrossRef]
- Boareto, M.; Jolly, M.K.; Goldman, A.; Pietilä, M.; Mani, S.A.; Sengupta, S.; Ben-Jacob, E.; Levine, H.; Onuchic, J.N. Notch-Jagged Signalling Can Give Rise to Clusters of Cells Exhibiting a Hybrid Epithelial/Mesenchymal Phenotype. J. R. Soc. Interface 2016, 13, 20151106. [Google Scholar] [CrossRef] [PubMed]
- Palano, M.T.; Giannandrea, D.; Platonova, N.; Gaudenzi, G.; Falleni, M.; Tosi, D.; Lesma, E.; Citro, V.; Colombo, M.; Saltarella, I.; et al. Jagged Ligands Enhance the Pro-Angiogenic Activity of Multiple Myeloma Cells. Cancers 2020, 12, 2600. [Google Scholar] [CrossRef] [PubMed]
- White, D.; Kassim, A.; Bhaskar, B.; Yi, J.; Wamstad, K.; Paton, V.E. Results from AMBER, a Randomized Phase 2 Study of Bevacizumab and Bortezomib versus Bortezomib in Relapsed or Refractory Multiple Myeloma: Results From AMBER. Cancer 2013, 119, 339–347. [Google Scholar] [CrossRef]
- Pérez, L.; Muñoz-Durango, N.; Riedel, C.A.; Echeverría, C.; Kalergis, A.M.; Cabello-Verrugio, C.; Simon, F. Endothelial-to-Mesenchymal Transition: Cytokine-Mediated Pathways That Determine Endothelial Fibrosis under Inflammatory Conditions. Cytokine Growth Factor Rev. 2017, 33, 41–54. [Google Scholar] [CrossRef]
- Filippakopoulos, P.; Qi, J.; Picaud, S.; Shen, Y.; Smith, W.B.; Fedorov, O.; Morse, E.M.; Keates, T.; Hickman, T.T.; Felletar, I.; et al. Selective Inhibition of BET Bromodomains. Nature 2010, 468, 1067–1073. [Google Scholar] [CrossRef] [PubMed]
- Shafran, J.S.; Jafari, N.; Casey, A.N.; Győrffy, B.; Denis, G.V. BRD4 Regulates Key Transcription Factors That Drive Epithelial-Mesenchymal Transition in Castration-Resistant Prostate Cancer. Prostate Cancer Prostatic Dis. 2021, 24, 268–277. [Google Scholar] [CrossRef] [PubMed]
- Khan, A.O.; Rodriguez-Romera, A.; Reyat, J.S.; Olijnik, A.-A.; Colombo, M.; Wang, G.; Wen, W.X.; Sousos, N.; Murphy, L.C.; Grygielska, B.; et al. Human Bone Marrow Organoids for Disease Modeling, Discovery, and Validation of Therapeutic Targets in Hematologic Malignancies. Cancer Discov. 2023, 13, 364–385. [Google Scholar] [CrossRef]
- Winkler, W.; Farré Díaz, C.; Blanc, E.; Napieczynska, H.; Langner, P.; Werner, M.; Walter, B.; Wollert-Wulf, B.; Yasuda, T.; Heuser, A.; et al. Mouse Models of Human Multiple Myeloma Subgroups. Proc. Natl. Acad. Sci. 2023, 120, e2219439120. [Google Scholar] [CrossRef]
- Carrasco, D.R.; Sukhdeo, K.; Protopopova, M.; Sinha, R.; Enos, M.; Carrasco, D.E.; Zheng, M.; Mani, M.; Henderson, J.; Pinkus, G.S.; et al. The Differentiation and Stress Response Factor XBP-1 Drives Multiple Myeloma Pathogenesis. Cancer Cell 2007, 11, 349–360. [Google Scholar] [CrossRef]
- Maura, F.; Coffey, D.G.; Stein, C.K.; Braggio, E.; Ziccheddu, B.; Sharik, M.E.; Du, M.T.; Tafoya Alvarado, Y.; Shi, C.-X.; Zhu, Y.X.; et al. The Genomic Landscape of Vk*MYC Myeloma Highlights Shared Pathways of Transformation between Mice and Humans. Nat. Commun. 2024, 15, 3844. [Google Scholar] [CrossRef]
- Butler, A.; Hoffman, P.; Smibert, P.; Papalexi, E.; Satija, R. Integrating Single-Cell Transcriptomic Data across Different Conditions, Technologies, and Species. Nat. Biotechnol. 2018, 36, 411–420. [Google Scholar] [CrossRef] [PubMed]
- Korotkevich, G.; Sukhov, V.; Budin, N.; Shpak, B.; Artyomov, M.N.; Sergushichev, A. Fast Gene Set Enrichment Analysis 2021, 060012.
- Wu, T.; Hu, E.; Xu, S.; Chen, M.; Guo, P.; Dai, Z.; Feng, T.; Zhou, L.; Tang, W.; Zhan, L.; et al. clusterProfiler 4.0: A Universal Enrichment Tool for Interpreting Omics Data. The Innovation 2021, 2, 100141. [Google Scholar] [CrossRef] [PubMed]
- Jin, S.; Guerrero-Juarez, C.F.; Zhang, L.; Chang, I.; Ramos, R.; Kuan, C.-H.; Myung, P.; Plikus, M.V.; Nie, Q. Inference and Analysis of Cell-Cell Communication Using CellChat. Nat. Commun. 2021, 12, 1088. [Google Scholar] [CrossRef]
- Rood, P.M.; Calafat, J.; von dem Borne, A.E.; Gerritsen, W.R.; van der Schoot, C.E. Immortalisation of Human Bone Marrow Endothelial Cells: Characterisation of New Cell Lines. Eur. J. Clin. Invest. 2000, 30, 618–629. [Google Scholar] [CrossRef]
Disclaimer/Publisher’s Note: The statements, opinions and data contained in all publications are solely those of the individual author(s) and contributor(s) and not of MDPI and/or the editor(s). MDPI and/or the editor(s) disclaim responsibility for any injury to people or property resulting from any ideas, methods, instructions or products referred to in the content. |
© 2024 by the authors. Licensee MDPI, Basel, Switzerland. This article is an open access article distributed under the terms and conditions of the Creative Commons Attribution (CC BY) license (http://creativecommons.org/licenses/by/4.0/).


