Submitted:
08 October 2024
Posted:
09 October 2024
You are already at the latest version
Abstract
Keywords:
1. Introduction
2. Materials and Methods
2.1. Sea Surface Height Fields and Eddy Atlases
2.2. Eddy Amplitude Criterion
2.3. Eddy Tracking Parameters
2.4. Eddy Network Reconstruction
2.5. Co-Location with Argo data
3. Results
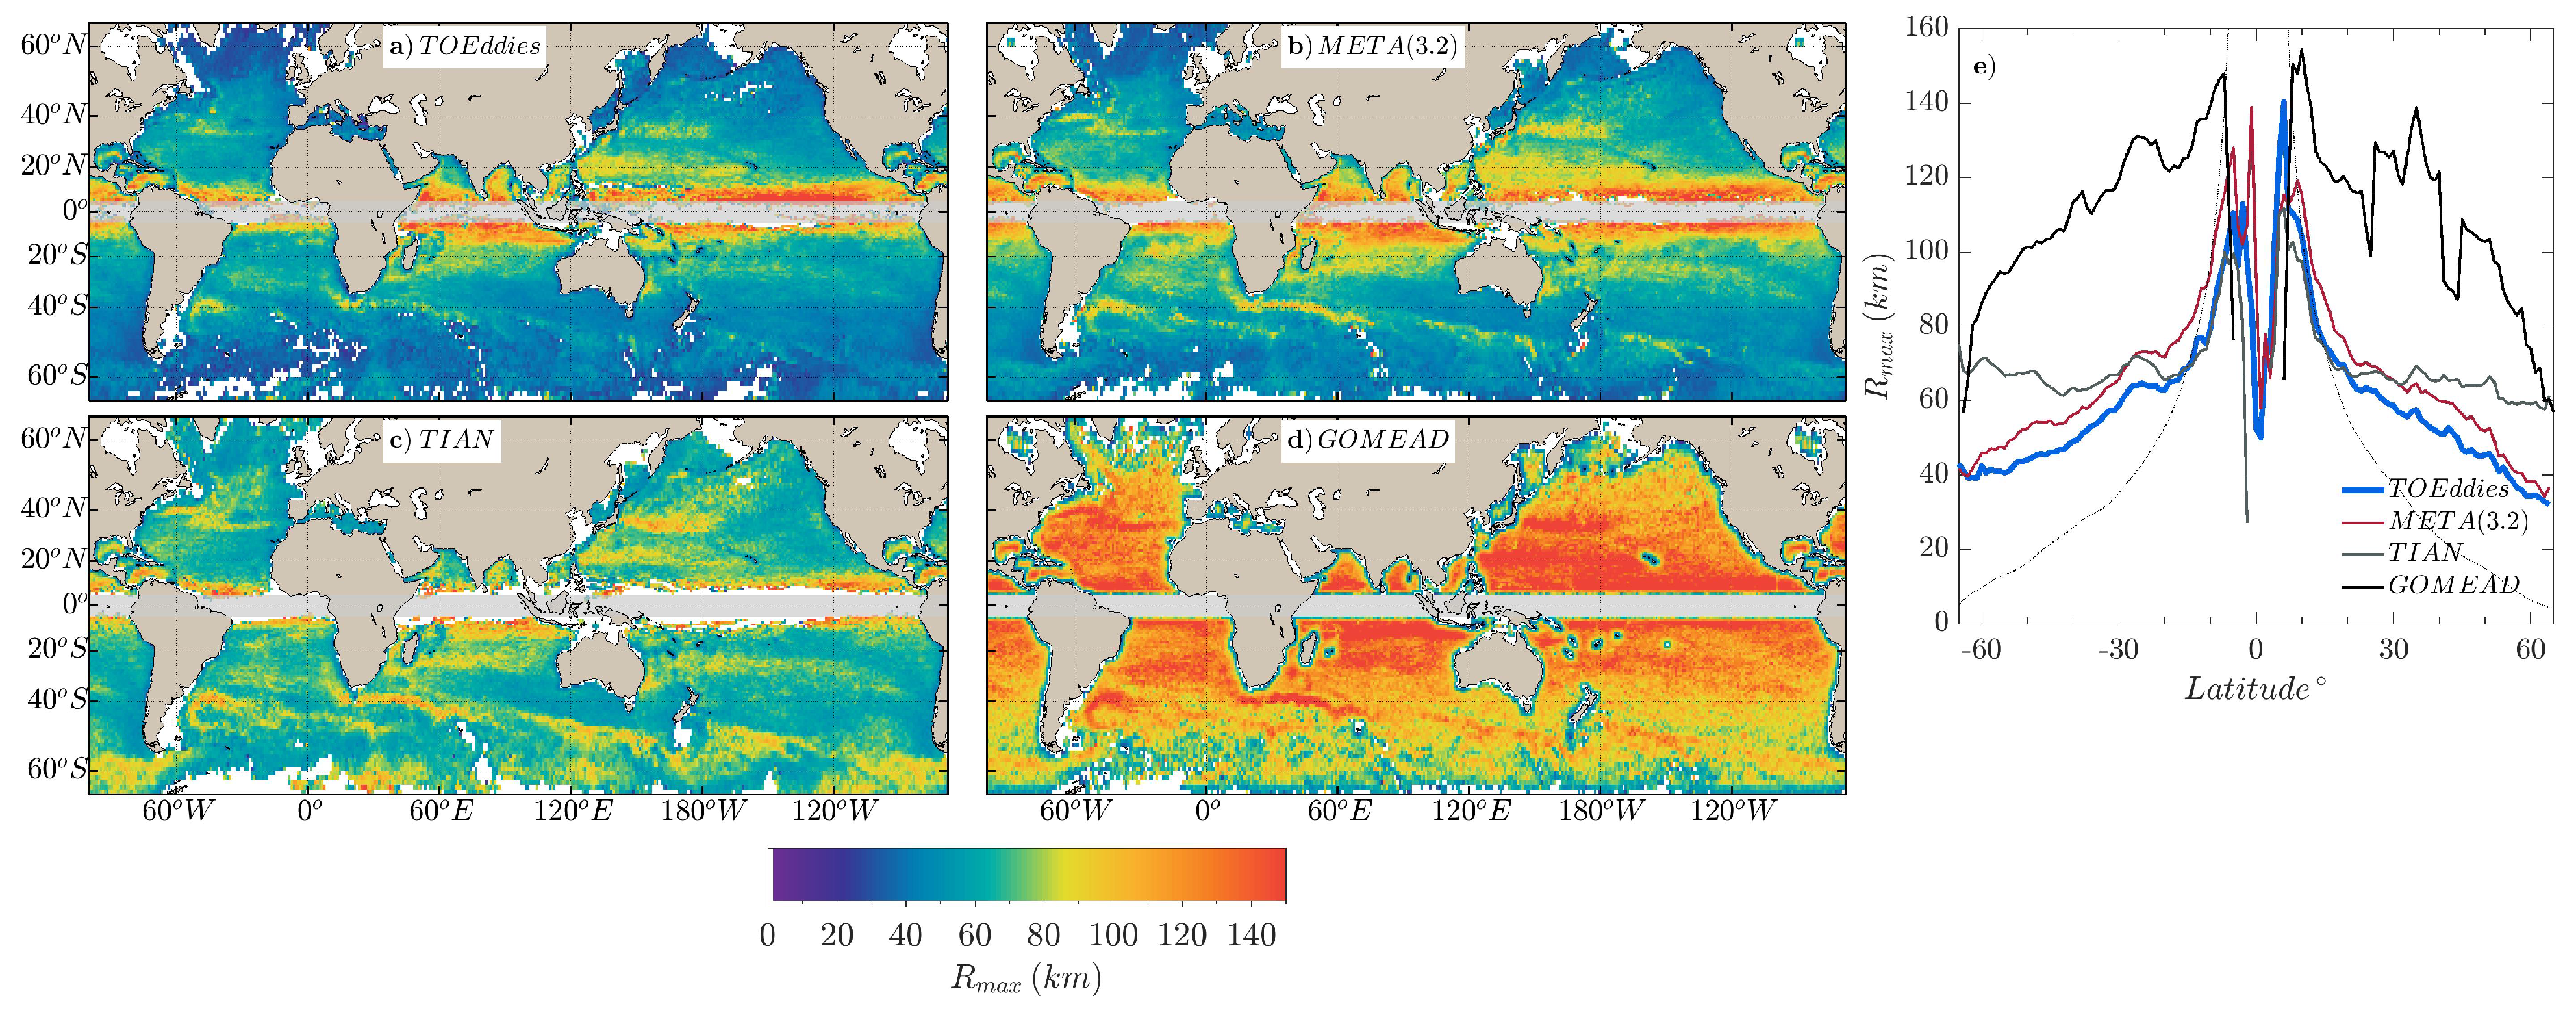
3.1. Statistical Description of Mesoscale Eddies
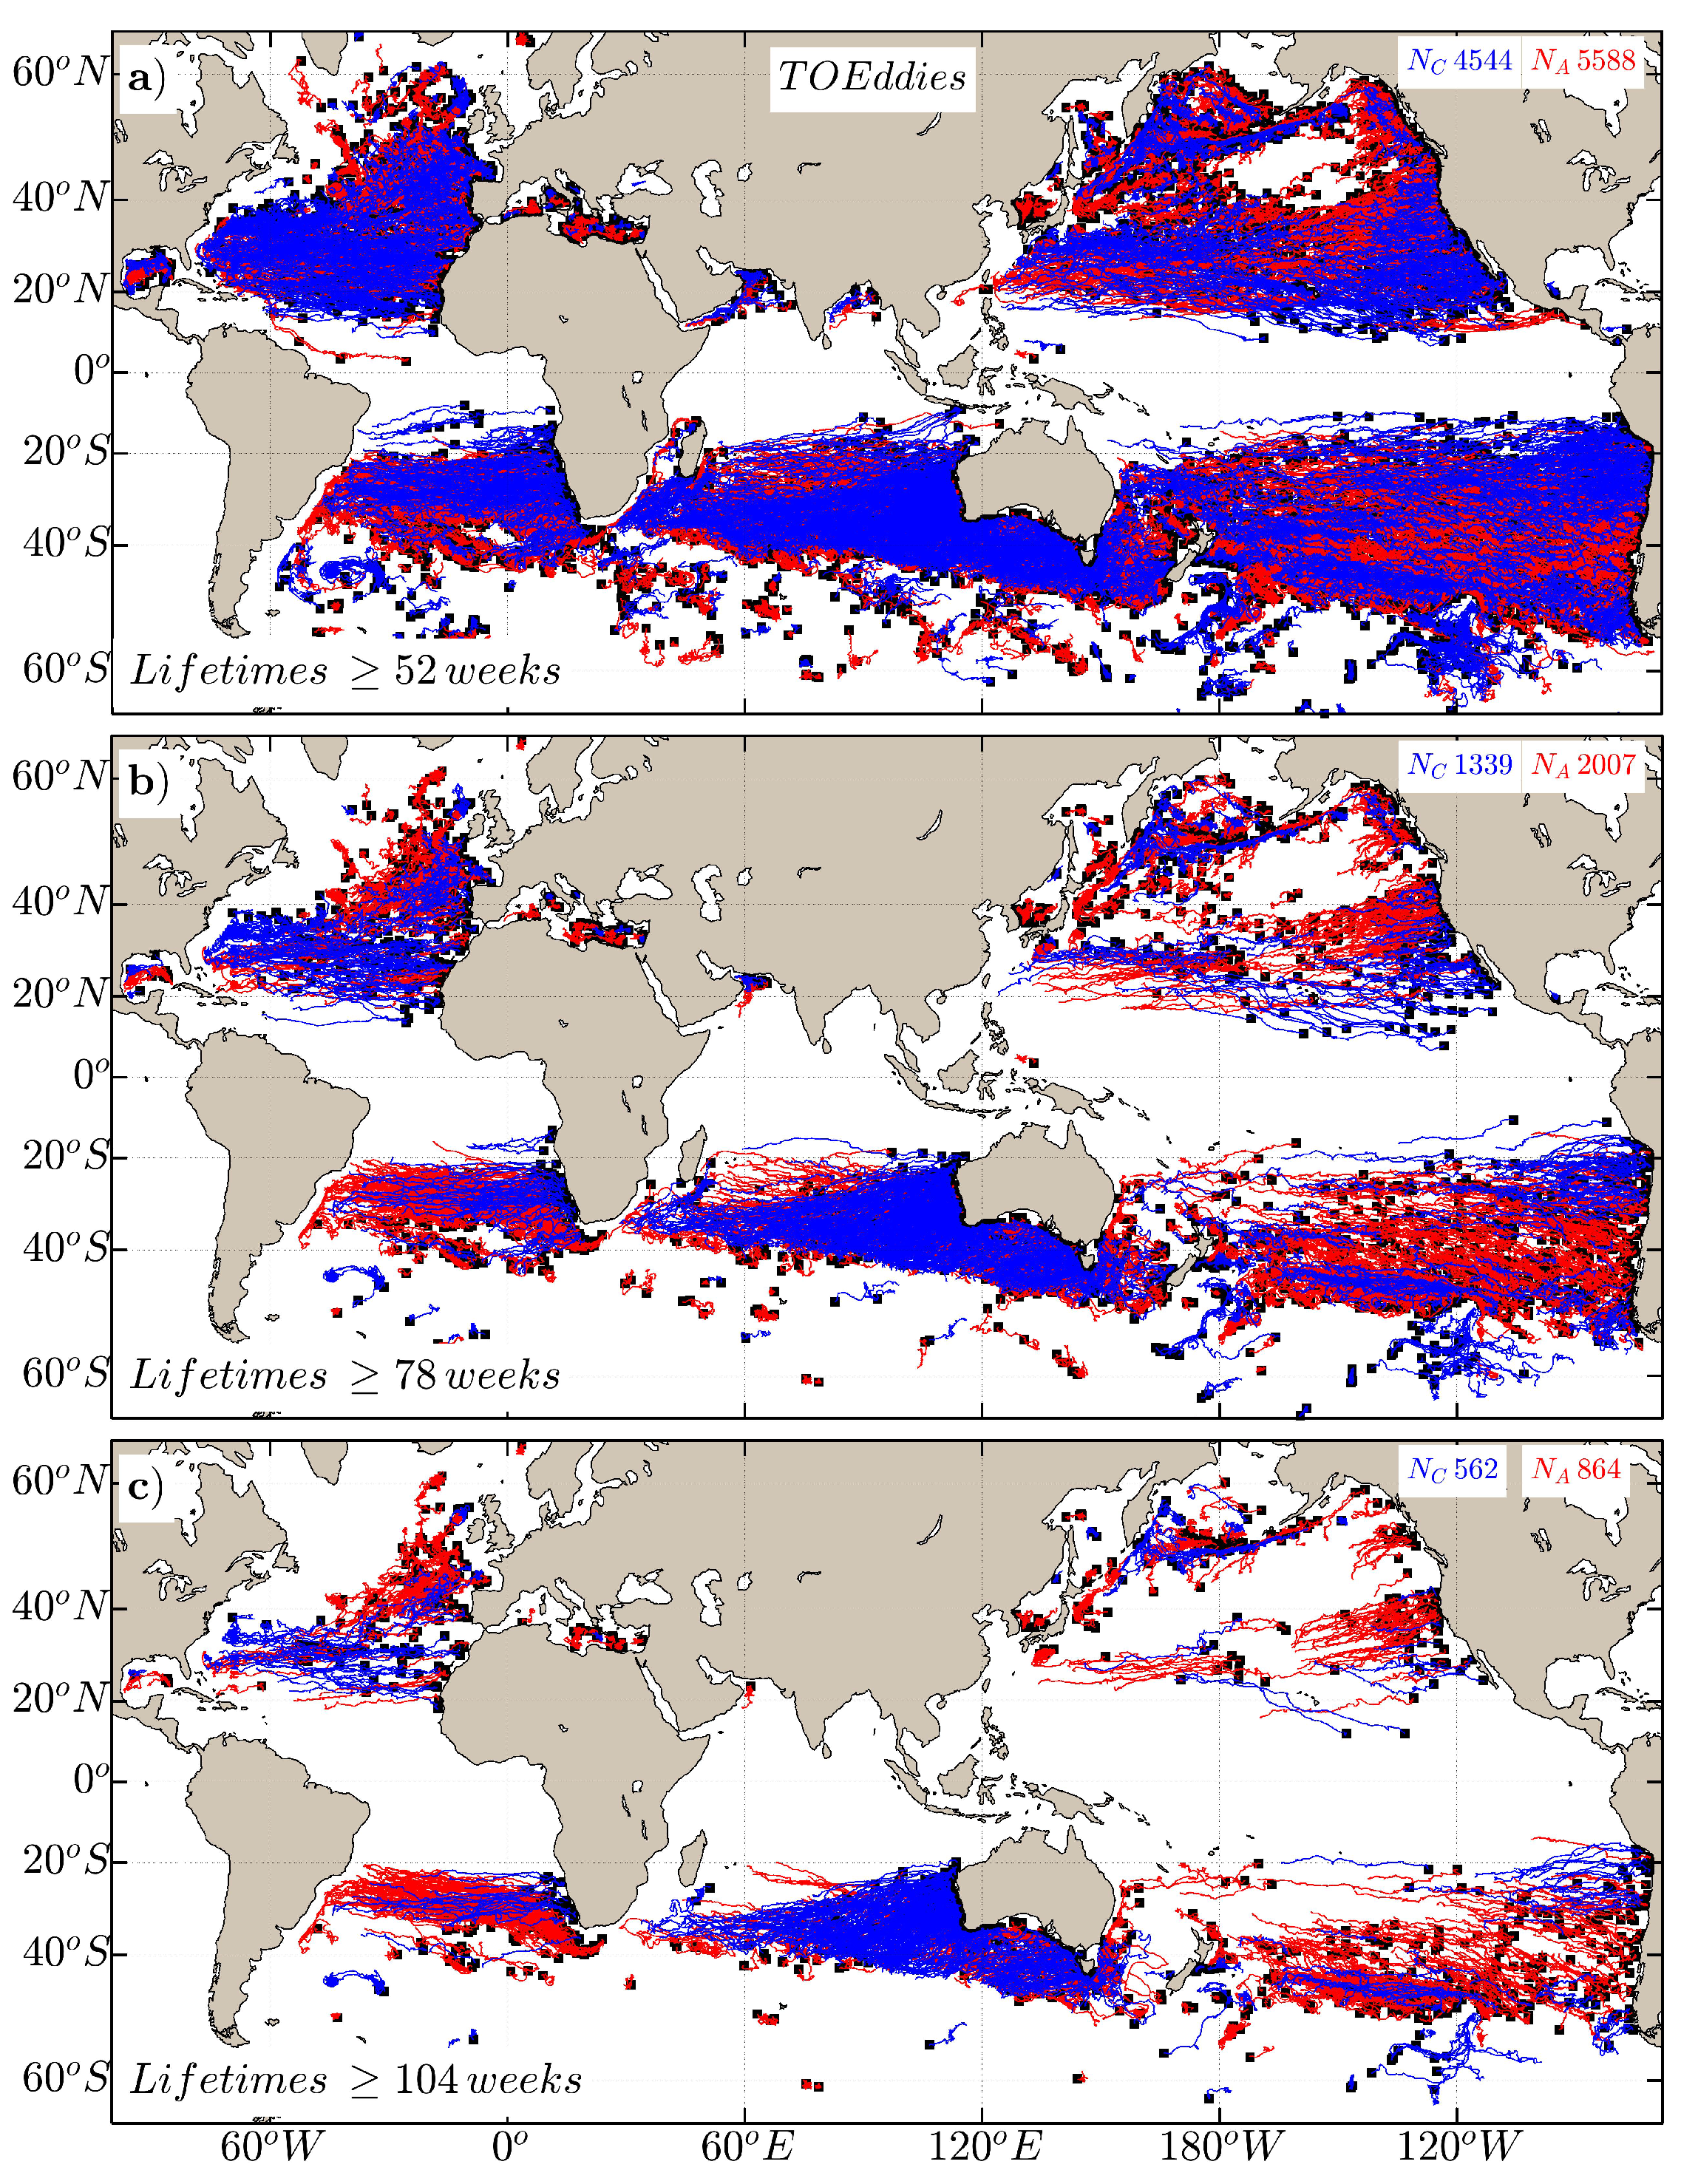
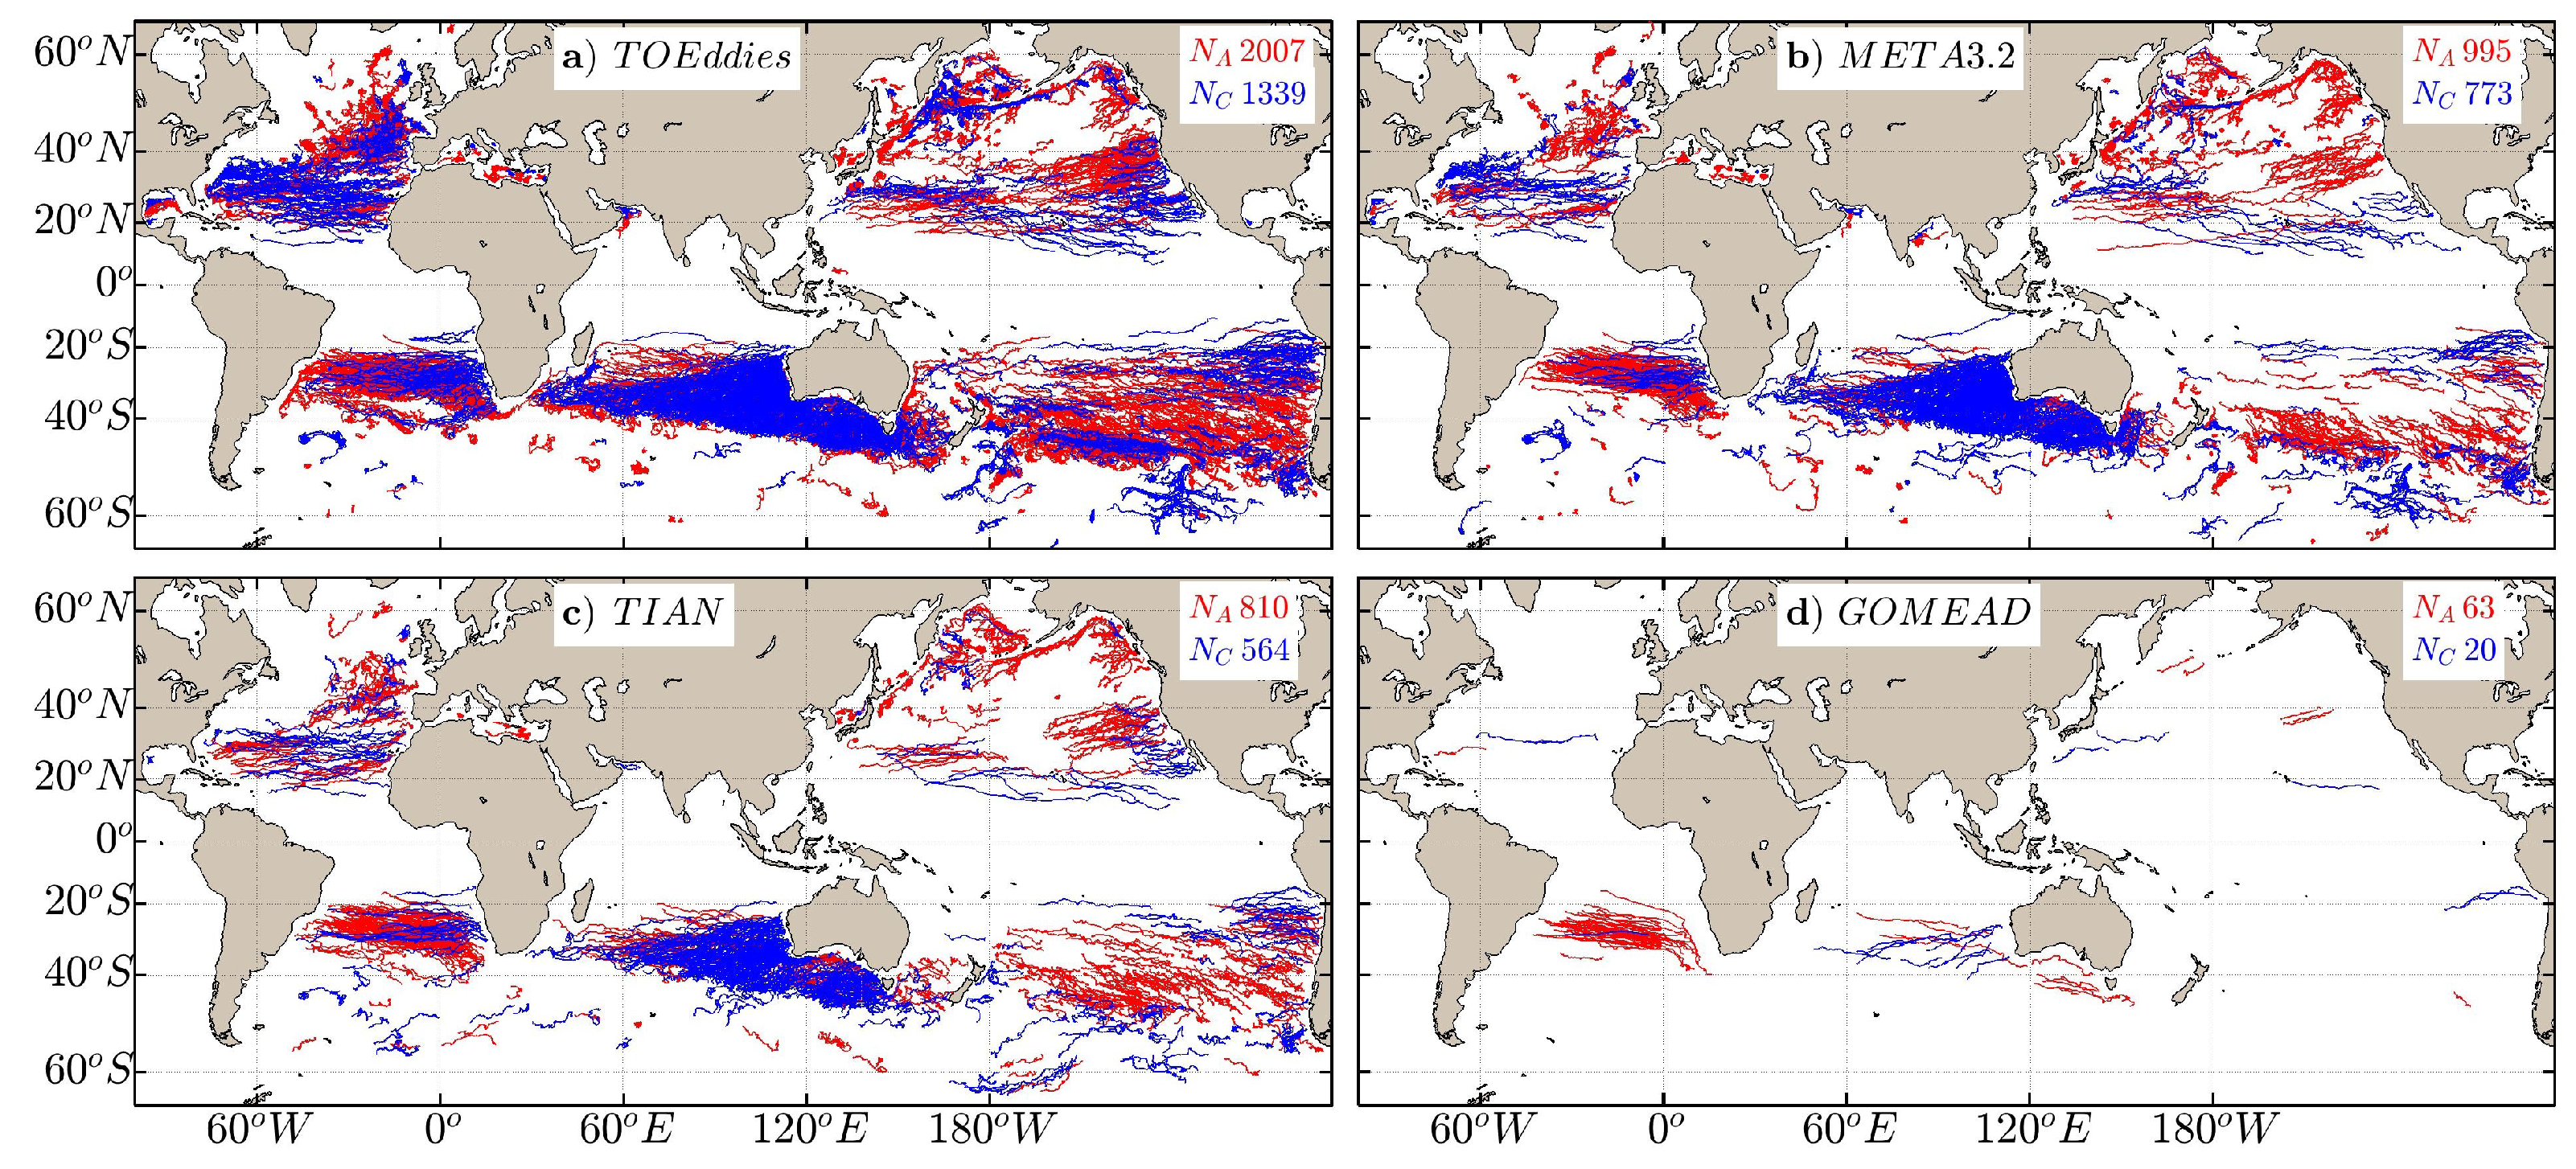
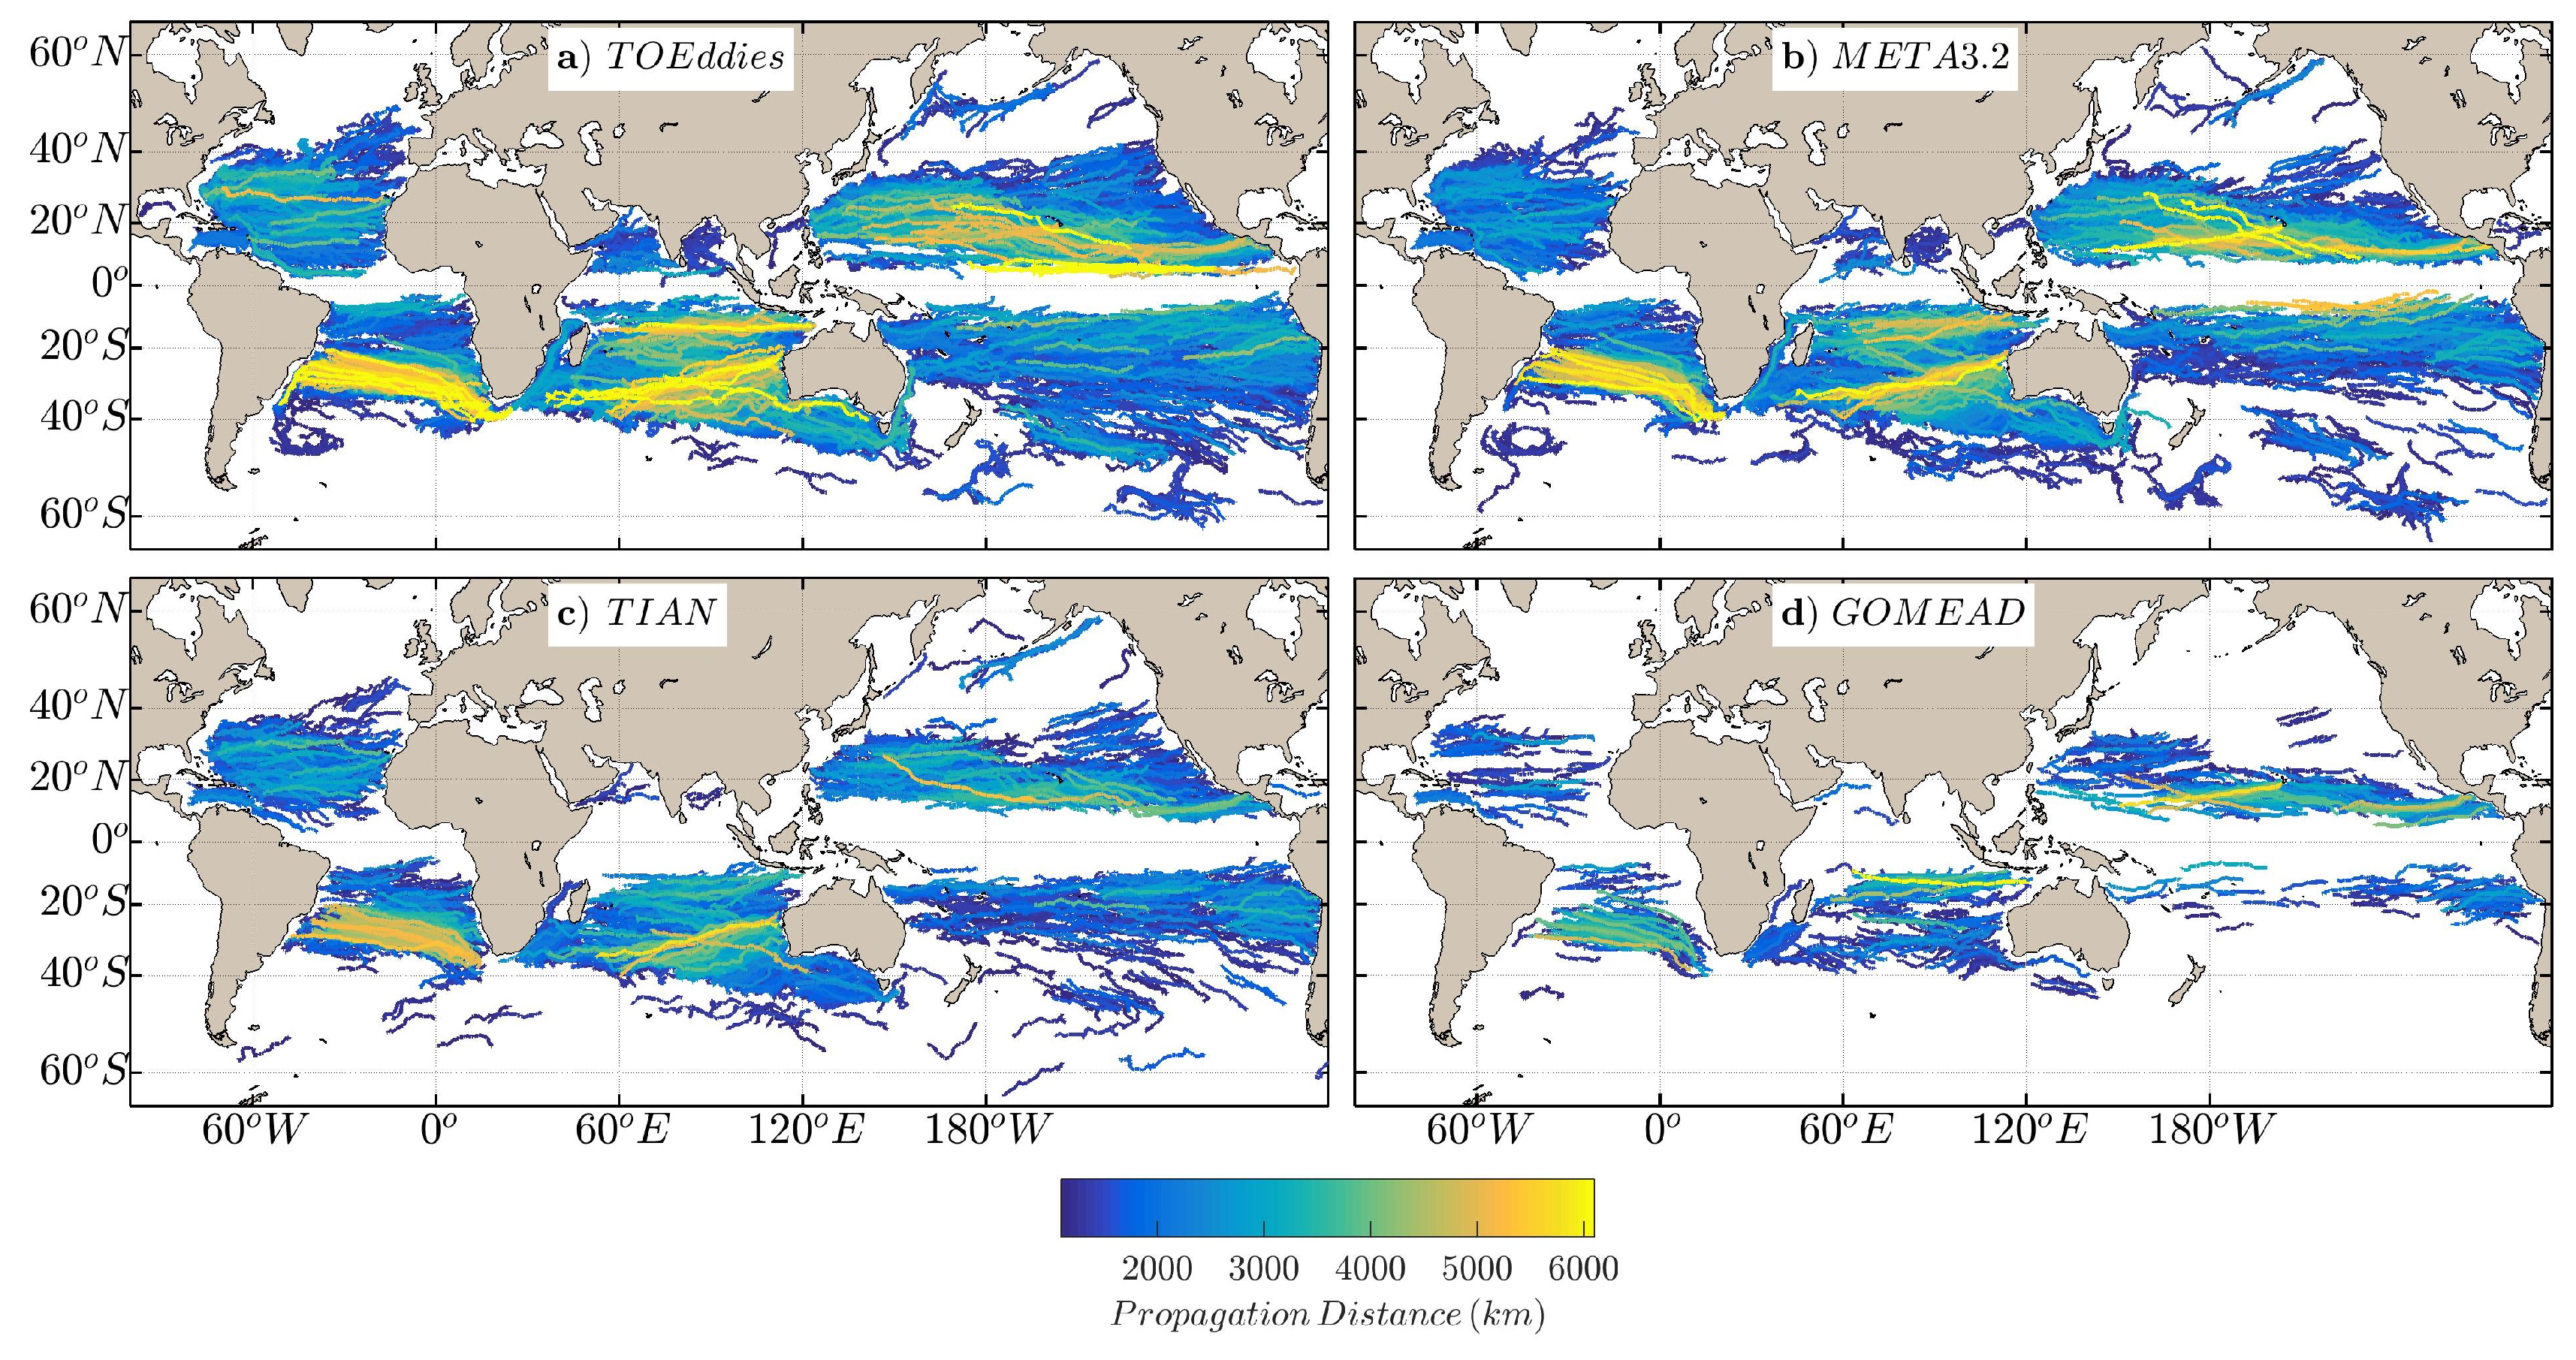
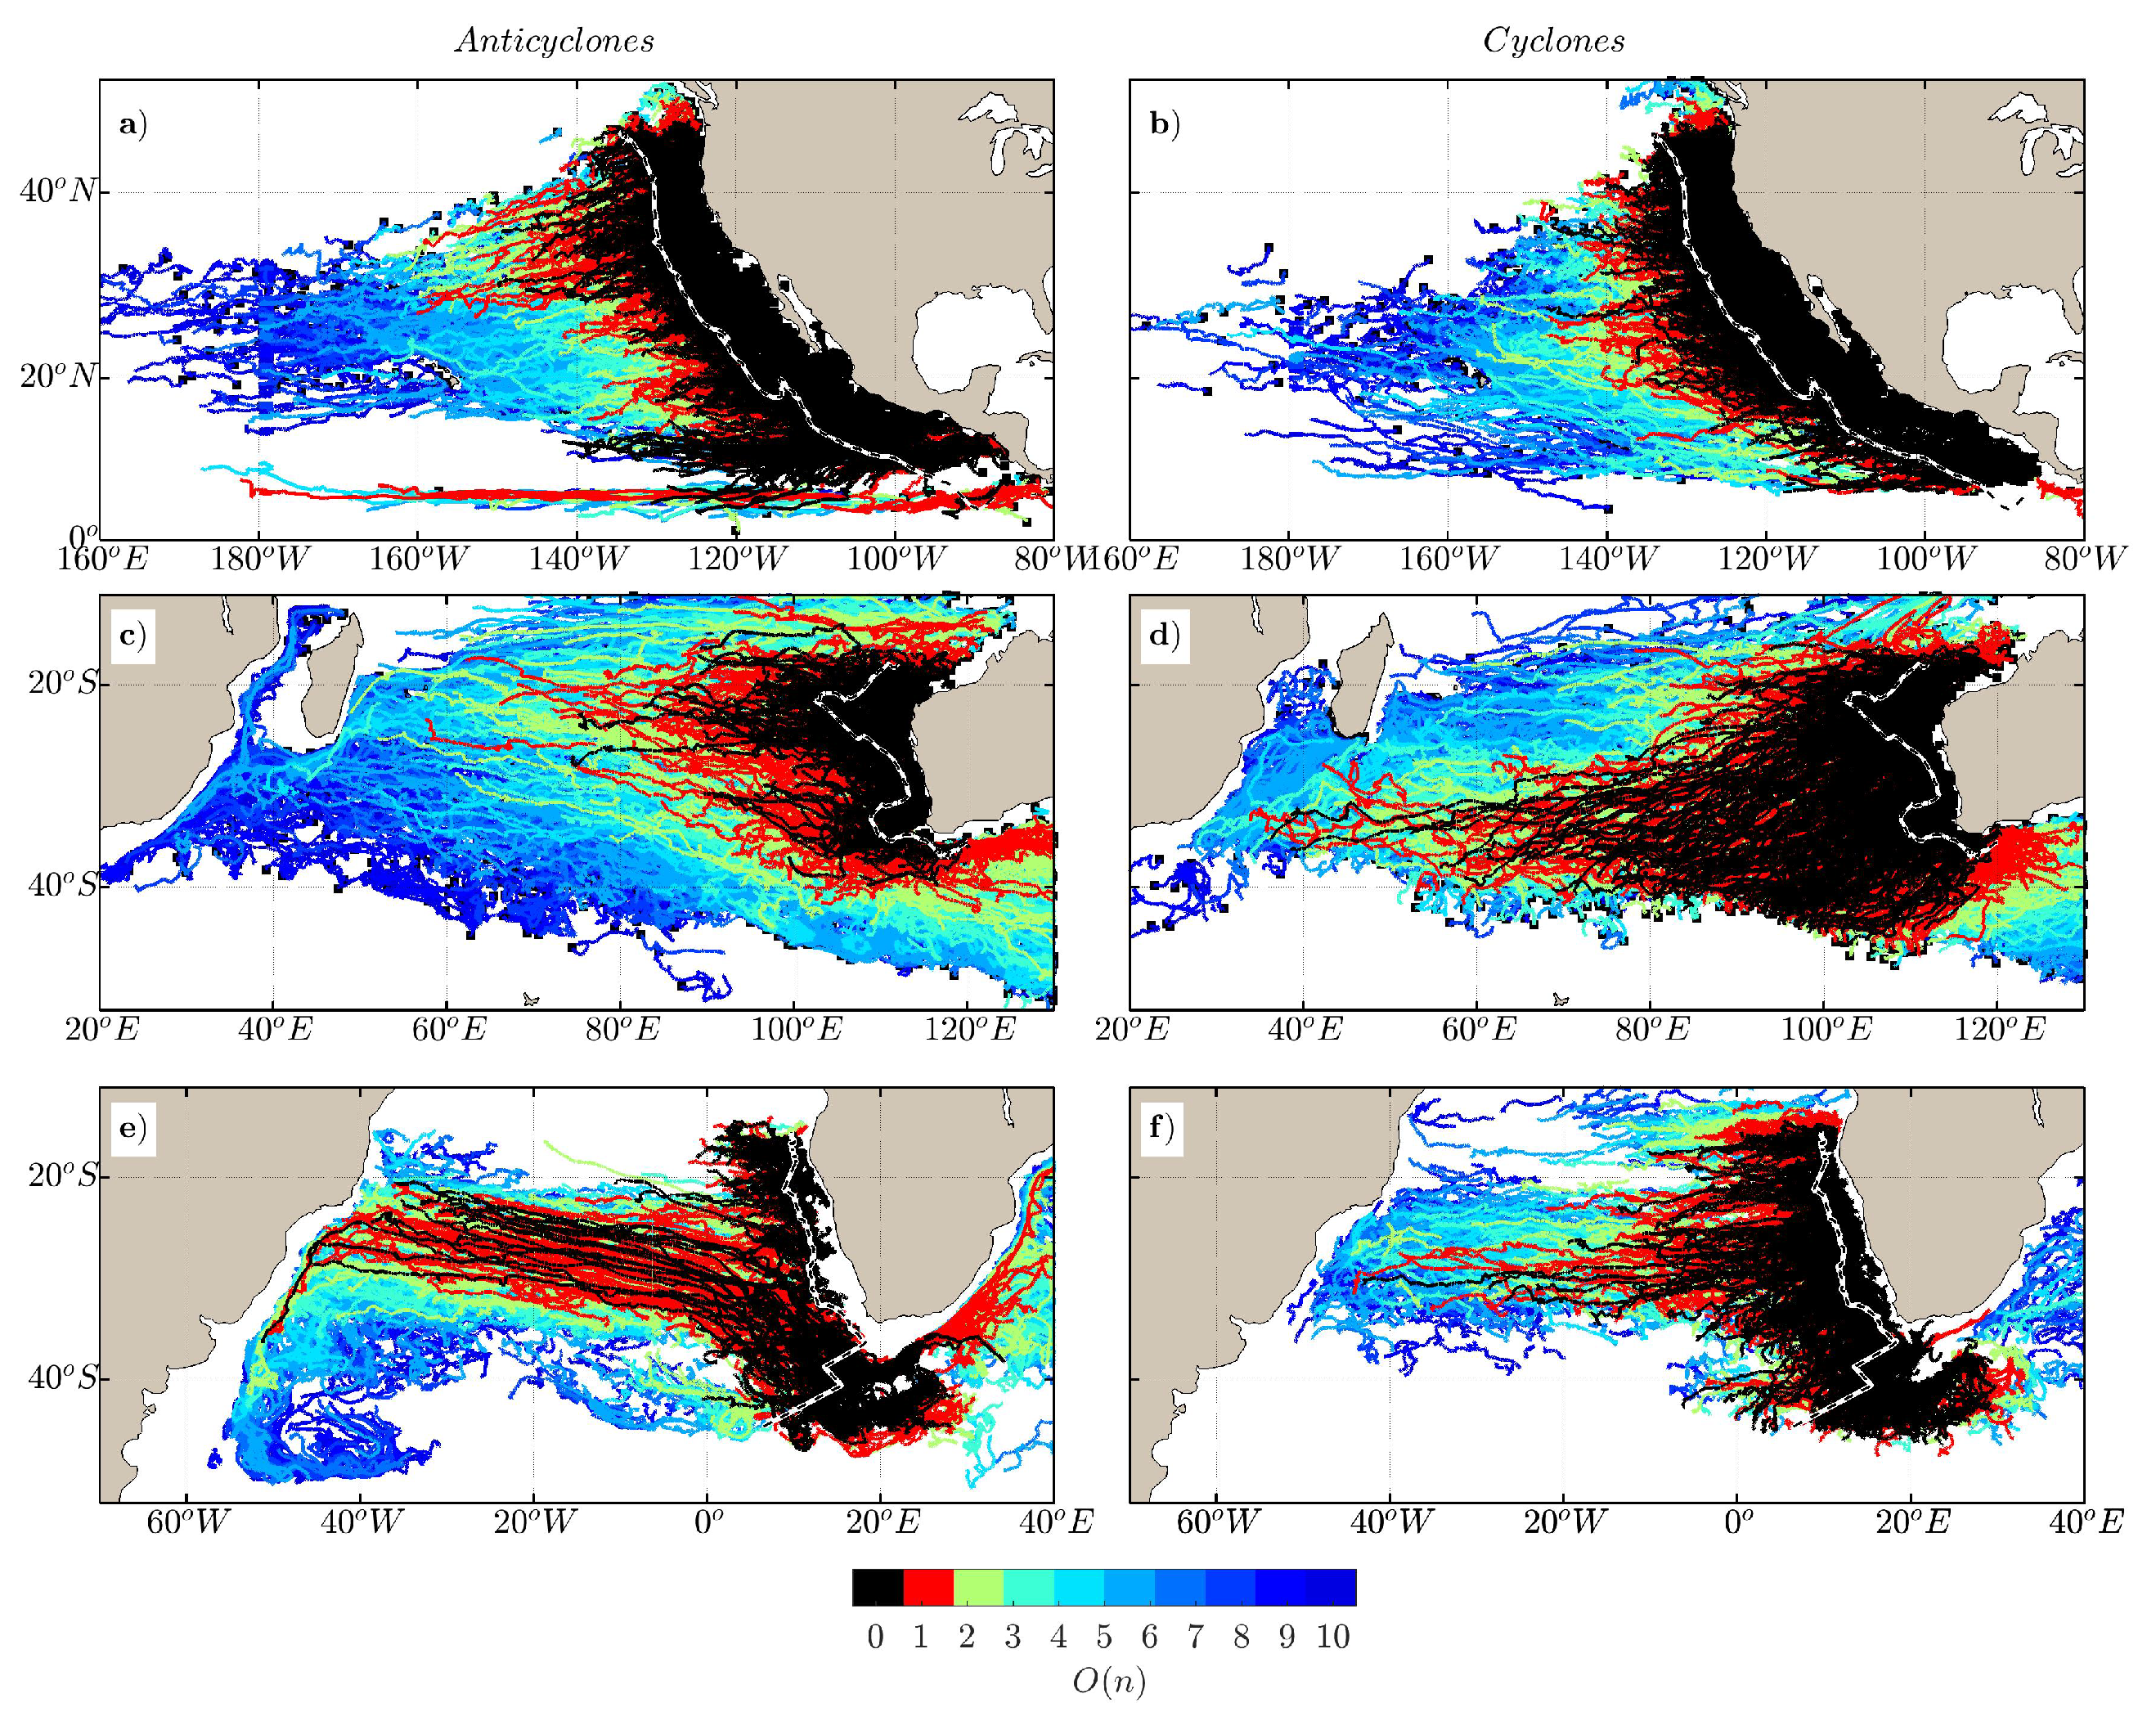
3.2. Characterization of Main Eddy Pathways
3.3. Characterization of Main Eddy Interactions
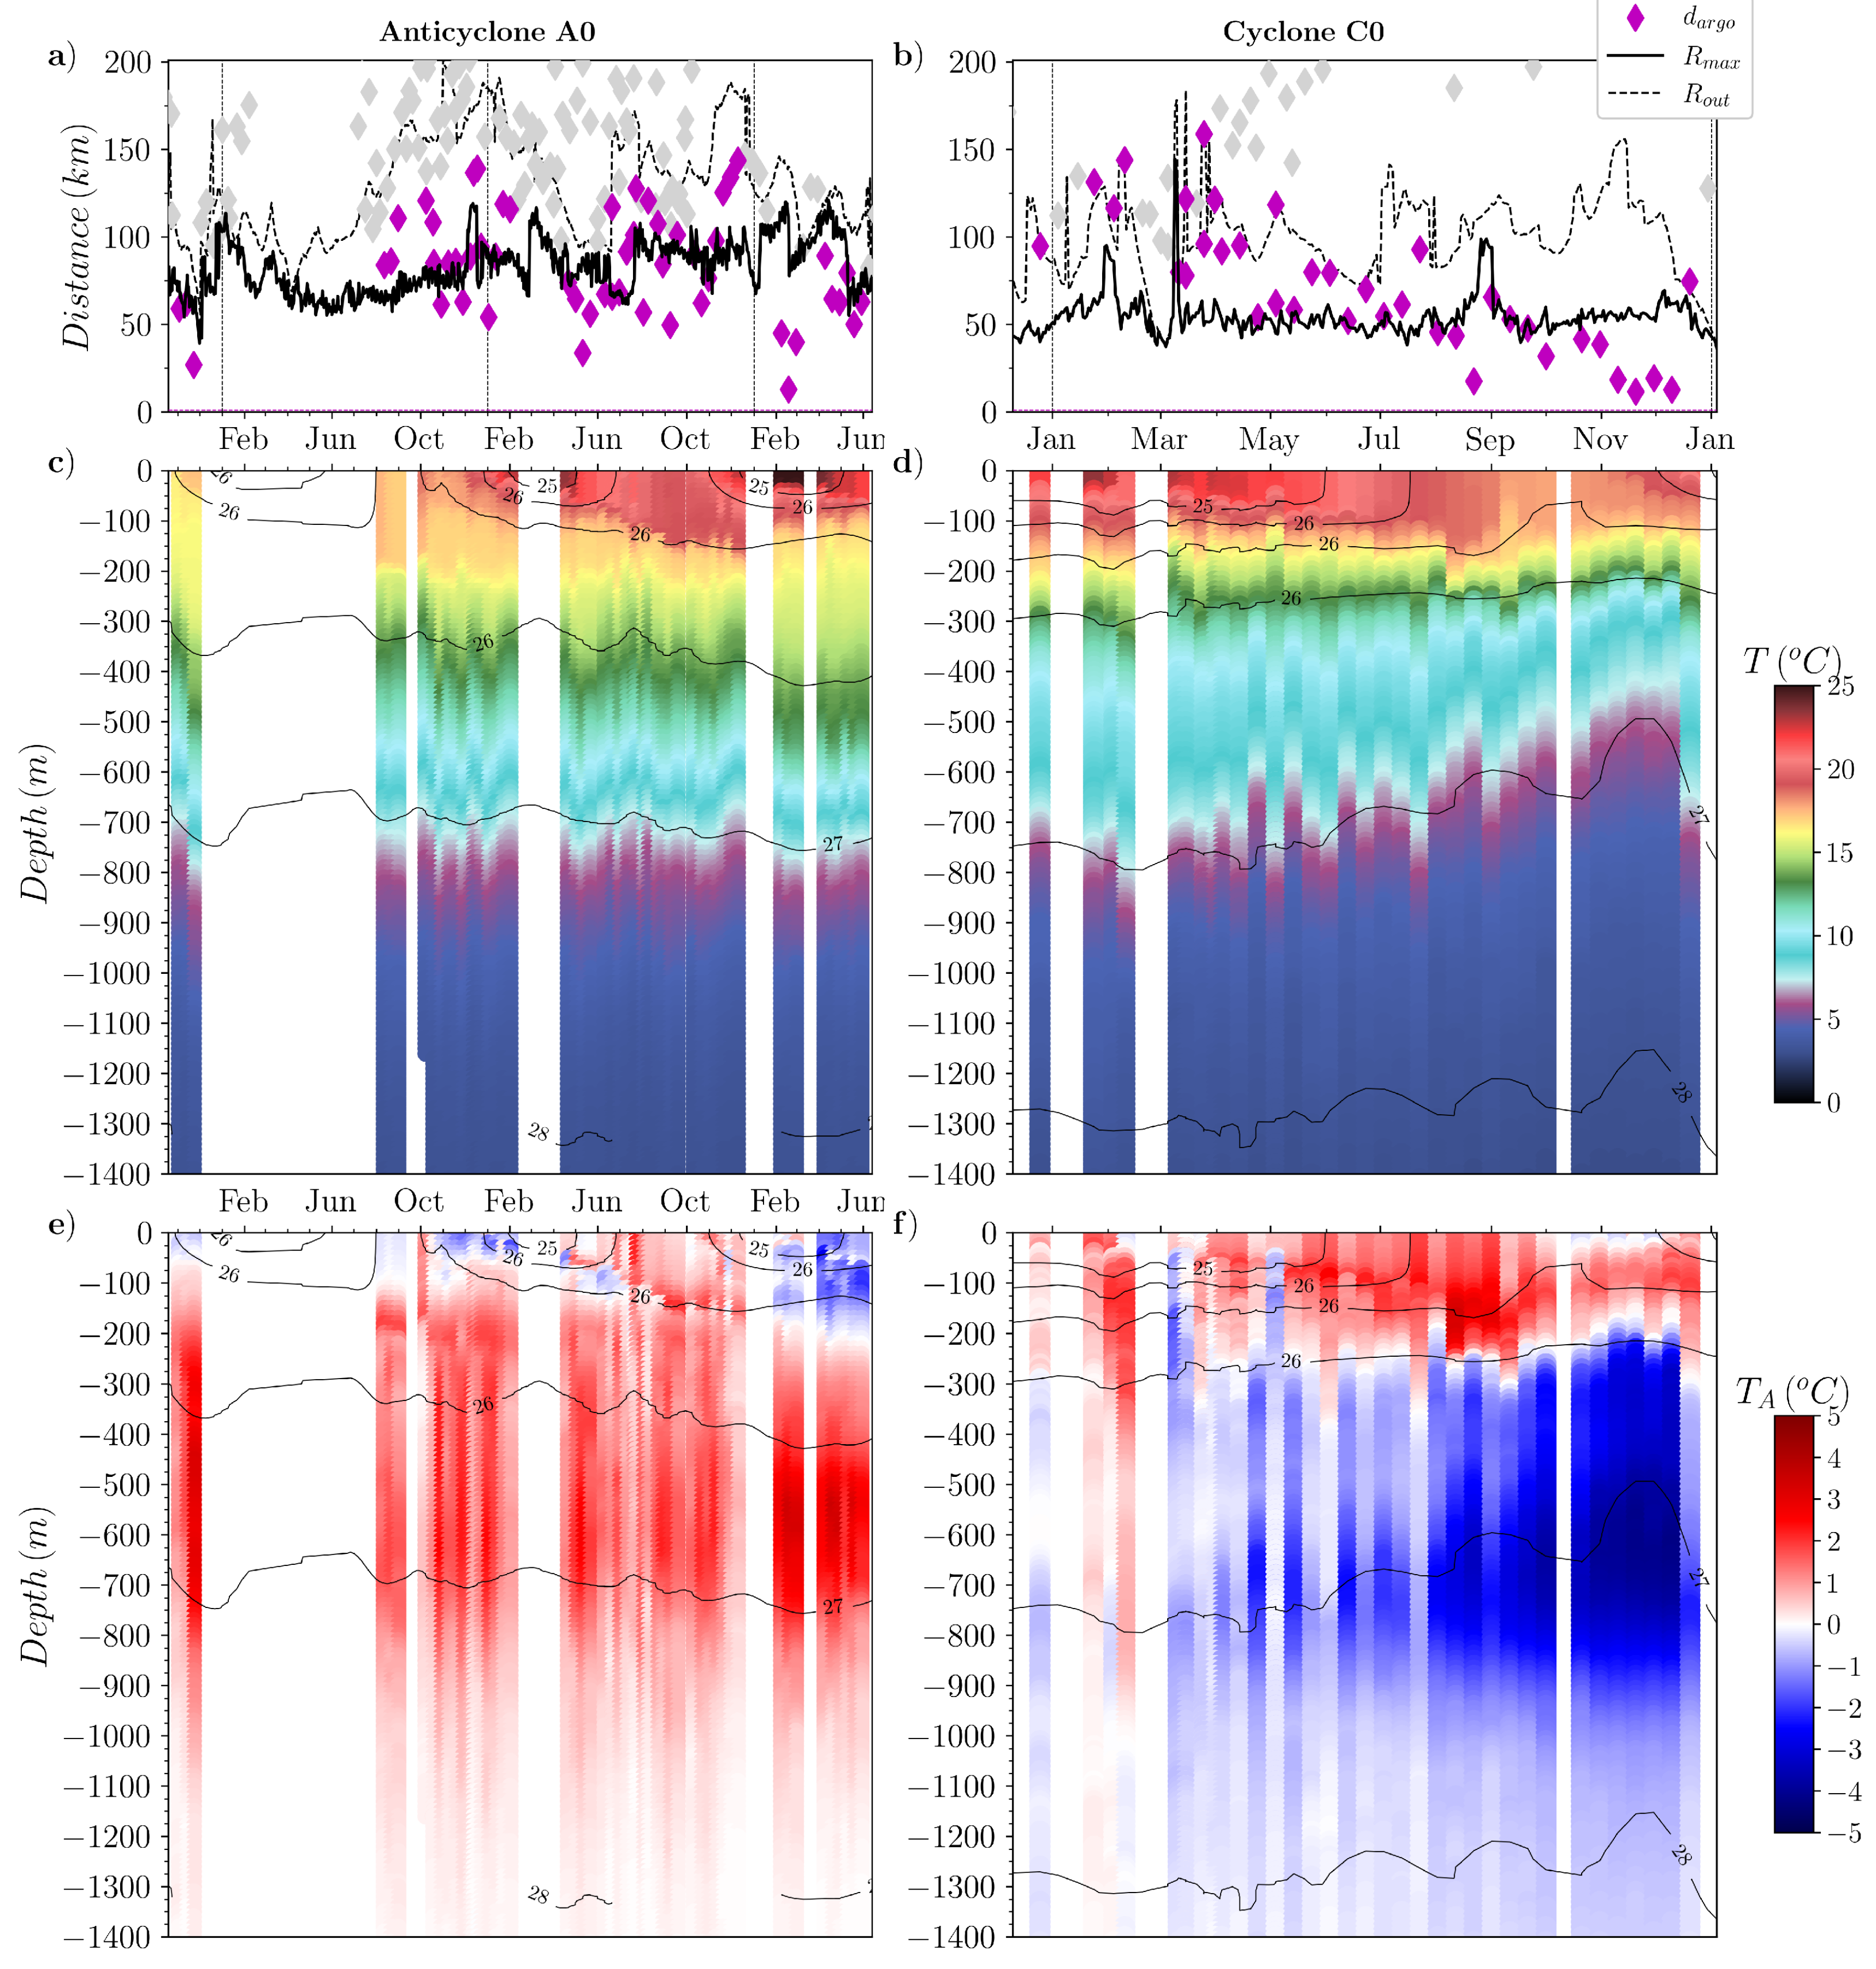
4. Conclusions
Supplementary Materials
Author Contributions
Funding
Data Availability Statement
Acknowledgments
Conflicts of Interest
Appendix A
Appendix A.1: TOEddies Eddy Detection
- C is a closed isoline of ADT.
- C contains extremum E.
- C does not contain any extremum of opposite sign.
- C has a minimum area of .
- The absolute value of the difference between the ADT level of C and the ADT of E is greater than 1 mm. This threshold difference is called the persistence parameter.
- C does not contain any extremum other than E with same sign as E and with an associated outermost contour ;
- No isoline exterior to C has the above properties.
Appendix A.2: TOEddies Eddy Tracking
References
- Laxenaire, R.; Speich, S.; Blanke, B.; Chaigneau, A.; Pegliasco, C.; Stegner, A. Anticyclonic Eddies Connecting the Western Boundaries of Indian and Atlantic Oceans. Journal of Geophysical Research: Oceans 2018, 123, 7651–7677. [Google Scholar] [CrossRef]
- Schütte, F.; Brandt, P.; Karstensen, J. Occurrence and characteristics of mesoscale eddies in the tropical northeastern Atlantic Ocean. Ocean Science 2016, 12, 663–685. [Google Scholar] [CrossRef]
- Schütte, F.; Karstensen, J.; Krahmann, G.; Hauss, H.; Fiedler, B.; Brandt, P.; Visbeck, M.; Körtzinger, A. Characterization of ’dead-zone’ eddies in the eastern tropical North Atlantic. Biogeosciences 2016, 13, 5865–5881. [Google Scholar] [CrossRef]
- Karstensen, J.; Schütte, F.; Pietri, A.; Krahmann, G.; Fiedler, B.; Grundle, D.; Hauss, H.; Körtzinger, A.; Lüscher, C.R.; Testor, P.; Vieira, N.; Visbeck, M. Upwelling and isolation in oxygen-depleted anticyclonic modewater eddies and implications for nitrate cycling. Biogeosciences 2017, 14, 2167–2181. [Google Scholar] [CrossRef]
- Laxenaire, R.; Speich, S.; Stegner, A. Evolution of the Thermohaline Structure of One Agulhas Ring Reconstructed from Satellite Altimetry and Argo Floats. Journal of Geophysical Research 2019, 124, 8969–9003. [Google Scholar] [CrossRef]
- Ioannou, A.; Stegner, A.; Le Vu, B.; Taupier-Letage, I.; Speich, S. Dynamical Evolution of Intense Ierapetra Eddies on a 22 Year Long Period. Journal of Geophysical Research: Oceans 2017, 122, 9276–9298. [Google Scholar] [CrossRef]
- Ioannou, A.; Speich, S.; Laxenaire, R. Characterizing Mesoscale Eddies of Eastern Upwelling Origins in the Atlantic Ocean and Their Role in Offshore Transport. Frontiers in Marine Science 2022, 9. [Google Scholar] [CrossRef]
- Nencioli, F.; Olmo, G.D.; Quartly, G.D. Agulhas Ring Transport Efficiency From Combined Satellite Altimetry and Argo Profiles. Journal of Geophysical Research: Oceans 2018, 123, 5874–5888. [Google Scholar] [CrossRef]
- Flierl, G.R. Particle motions in large-amplitude wave fields. Geophysical & Astrophysical Fluid Dynamics 1981, 18, 39–74. [Google Scholar] [CrossRef]
- Chelton, D.B.; Schlax, M.G.; Samelson, R.M. Global observations of nonlinear mesoscale eddies. Progress in Oceanography 2011, 91, 167–216. [Google Scholar] [CrossRef]
- Sato, O.T.; Polito, P.S. Observation of South Atlantic subtropical mode waters with Argo profiling float data. Journal of Geophysical Research: Oceans 2014, 119, 2860–2881. [Google Scholar] [CrossRef]
- McGillicuddy, D.J.; Anderson, L.A.; Bates, N.R.; Bibby, T.; Buesseler, K.O.; Carlson, C.A.; Davis, C.S.; Ewart, C.; Falkowski, P.G.; Goldthwait, S.A.; Hansell, D.A.; Jenkins, W.J.; Johnson, R.; Kosnyrev, V.K.; Ledwell, J.R.; Li, Q.P.; Siegel, D.A.; Steinberg, D.K. Eddy/Wind Interactions Stimulate Extraordinary Mid-Ocean Plankton Blooms. Science 2007, 316, 1021–1026. [Google Scholar] [CrossRef] [PubMed]
- Villar, E.; Farrant, G.K.; Follows, M.; Garczarek, L.; Speich, S.; Audic, S.; Bittner, L.; Blanke, B.; Brum, J.R.; Brunet, C.; Casotti, R.; Chase, A.; Dolan, J.R.; d’Ortenzio, F.; Gattuso, J.P.; Grima, N.; Guidi, L.; Hill, C.N.; Jahn, O.; Jamet, J.L.; Goff, H.L.; Lepoivre, C.; Malviya, S.; Pelletier, E.; Romagnan, J.B.; Roux, S.; Santini, S.; Scalco, E.; Schwenck, S.M.; Tanaka, A.; Testor, P.; Vannier, T.; Vincent, F.; Zingone, A.; Dimier, C.; Picheral, M.; Searson, S.; Kandels-Lewis, S.; Acinas, T.O.C.S.G.; Bork, P.; Boss, E.; de Vargas, C.; Gorsky, G.; Ogata, H.; Pesant, S.; Sullivan, M.B.; Sunagawa, S.; Wincker, P.; Karsenti, E.; Bowler, C.; Not, F.; Hingamp, P.; Iudicone, D. Ocean plankton. Environmental characteristics of Agulhas rings affect interocean plankton transport. Science 2015, 348, 1261447–1261447. [Google Scholar] [CrossRef] [PubMed]
- Dufois, F.; Hardman-Mountford, N.J.; Greenwood, J.; Richardson, A.J.; Feng, M.; Matear, R.J. Anticyclonic eddies are more productive than cyclonic eddies in subtropical gyres because of winter mixing. Science Advances 2016, 2, e1600282. [Google Scholar] [CrossRef]
- Cornec, M.; Laxenaire, R.; Speich, S.; Claustre, H. Impact of Mesoscale Eddies on Deep Chlorophyll Maxima. Geophysical Research Letters 2021, 48, e2021GL093470. [Google Scholar] [CrossRef]
- Cornec, M.; Claustre, H.; Mignot, A.; Guidi, L.; Lacour, L.; Poteau, A.; D’Ortenzio, F.; Gentili, B.; Schmechtig, C. Deep Chlorophyll Maxima in the Global Ocean: Occurrences, Drivers and Characteristics. Global Biogeochemical Cycles 2021, 35, e2020GB006759. [Google Scholar] [CrossRef]
- LeTraon, P.Y.; Nadal, F.; Ducet, N. An Improved Mapping Method of Multisatellite Altimeter Data. JOURNAL OF ATMOSPHERIC AND OCEANIC TECHNOLOGY 1998, 15, 522–533. [Google Scholar] [CrossRef]
- Amores, A.; Jordà, G.; Arsouze, T.; Le Sommer, J. Up to What Extent Can We Characterize Ocean Eddies Using Present-Day Gridded Altimetric Products? Journal of Geophysical Research: Oceans 2018, 123, 7220–7236. [Google Scholar] [CrossRef]
- Khachatrian, E.; Sandalyuk, N.; Lozou, P. Eddy Detection in the Marginal Ice Zone with Sentinel-1 Data Using YOLOv5. Remote Sensing 2023, 15, 2244. [Google Scholar] [CrossRef]
- Kozlov, I.E.; Atadzhanova, O.A. Eddies in the Marginal Ice Zone of Fram Strait and Svalbard from Spaceborne SAR Observations in Winter. Remote Sensing 2022, 14, 134. [Google Scholar] [CrossRef]
- Xia, L.; Chen, G.; Chen, X.; Ge, L.; Huang, B. Submesoscale oceanic eddy detection in SAR images using context and edge association network. Frontiers in Marine Science 2019, 9. [Google Scholar] [CrossRef]
- Manta, G.; Speich, S.; Karstensen, J.; Hummels, R.; Kersalé, M.; Laxenaire, R.; Piola, A.; Chidichimo, M.P.; Sato, O.T.; da Cunha, L.C.; Ansorge, I.; Lamont, T.; van den Berg, M.; Schuster, U.; Tanhua, T.; Kerr, R.; Guerrero, R.; Campos, E.; Meinen, C.S. The South Atlantic Meridional Overturning Circulation and Mesoscale Eddies in the First GO-SHIP Section at 34.5°S. Journal of Geophysical Research: Oceans 2021, 126, e2020JC016962. [Google Scholar] [CrossRef]
- Stevens, B.; Bony, S.; Farrell, D.; Ament, F.; Blyth, A.; Fairall, C.; Karstensen, J.; Quinn, P.K.; Speich, S.; Acquistapace, C.; Aemisegger, F.; Albright, A.L.; Bellenger, H.; Bodenschatz, E.; Caesar, K.A.; Chewitt-Lucas, R.; de Boer, G.; Delanoë, J.; Denby, L.; Ewald, F.; Fildier, B.; Forde, M.; George, G.; Gross, S.; Hagen, M.; Hausold, A.; Heywood, K.J.; Hirsch, L.; Jacob, M.; Jansen, F.; Kinne, S.; Klocke, D.; Kölling, T.; Konow, H.; Lothon, M.; Mohr, W.; Naumann, A.K.; Nuijens, L.; Olivier, L.; Pincus, R.; Pöhlker, M.; Reverdin, G.; Roberts, G.; Schnitt, S.; Schulz, H.; Siebesma, A.P.; Stephan, C.C.; Sullivan, P.; Touzé-Peiffer, L.; Vial, J.; Vogel, R.; Zuidema, P.; Alexander, N.; Alves, L.; Arixi, S.; Asmath, H.; Bagheri, G.; Baier, K.; Bailey, A.; Baranowski, D.; Baron, A.; Barrau, S.; Barrett, P.A.; Batier, F.; Behrendt, A.; Bendinger, A.; Beucher, F.; Bigorre, S.; Blades, E.; Blossey, P.; Bock, O.; Böing, S.; Bosser, P.; Bourras, D.; Bouruet Aubertot, P.; Bower, K.; Branellec, P.; Branger, H.; Brennek, M.; Brewer, A.; Brilouet, P.E.; Brügmann, B.; Buehler, S.A.; Burke, E.; Burton, R.; Calmer, R.; Canonici, J.C.; Carton, X.; Cato Jr., G.; Charles, J.A.; Chazette, P.; Chen, Y.; Chilinski, M.T.; Choularton, T.; Chuang, P.; Clarke, S.; Coe, H.; Cornet, C.; Coutris, P.; Couvreux, F.; Crewell, S.; Cronin, T.; Cui, Z.; Cuypers, Y.; Daley, A.; Damerell, G.M.; Dauhut, T.; Deneke, H.; Desbios, J.P.; Dörner, S.; Donner, S.; Douet, V.; Drushka, K.; Dütsch, M.; Ehrlich, A.; Emanuel, K.; Emmanouilidis, A.; Etienne, J.C.; Etienne-Leblanc, S.; Faure, G.; Feingold, G.; Ferrero, L.; Fix, A.; Flamant, C.; Flatau, P.J.; Foltz, G.R.; Forster, L.; Furtuna, I.; Gadian, A.; Galewsky, J.; Gallagher, M.; Gallimore, P.; Gaston, C.; Gentemann, C.; Geyskens, N.; Giez, A.; Gollop, J.; Gouirand, I.; Gourbeyre, C.; de Graaf, D.; de Groot, G.E.; Grosz, R.; Güttler, J.; Gutleben, M.; Hall, K.; Harris, G.; Helfer, K.C.; Henze, D.; Herbert, C.; Holanda, B.; Ibanez-Landeta, A.; Intrieri, J.; Iyer, S.; Julien, F.; Kalesse, H.; Kazil, J.; Kellman, A.; Kidane, A.T.; Kirchner, U.; Klingebiel, M.; Körner, M.; Kremper, L.A.; Kretzschmar, J.; Krüger, O.; Kumala, W.; Kurz, A.; L’Hégaret, P.; Labaste, M.; Lachlan-Cope, T.; Laing, A.; Landschützer, P.; Lang, T.; Lange, D.; Lange, I.; Laplace, C.; Lavik, G.; Laxenaire, R.; Le Bihan, C.; Leandro, M.; Lefevre, N.; Lena, M.; Lenschow, D.; Li, Q.; Lloyd, G.; Los, S.; Losi, N.; Lovell, O.; Luneau, C.; Makuch, P.; Malinowski, S.; Manta, G.; Marinou, E.; Marsden, N.; Masson, S.; Maury, N.; Mayer, B.; Mayers-Als, M.; Mazel, C.; McGeary, W.; McWilliams, J.C.; Mech, M.; Mehlmann, M.; Meroni, A.N.; Mieslinger, T.; Minikin, A.; Minnett, P.; Möller, G.; Morfa Avalos, Y.; Muller, C.; Musat, I.; Napoli, A.; Neuberger, A.; Noisel, C.; Noone, D.; Nordsiek, F.; Nowak, J.L.; Oswald, L.; Parker, D.J.; Peck, C.; Person, R.; Philippi, M.; Plueddemann, A.; Pöhlker, C.; Pörtge, V.; Pöschl, U.; Pologne, L.; Posyniak, M.; Prange, M.; Quiñones Meléndez, E.; Radtke, J.; Ramage, K.; Reimann, J.; Renault, L.; Reus, K.; Reyes, A.; Ribbe, J.; Ringel, M.; Ritschel, M.; Rocha, C.B.; Rochetin, N.; Röttenbacher, J.; Rollo, C.; Royer, H.; Sadoulet, P.; Saffin, L.; Sandiford, S.; Sandu, I.; Schäfer, M.; Schemann, V.; Schirmacher, I.; Schlenczek, O.; Schmidt, J.; Schröder, M.; Schwarzenboeck, A.; Sealy, A.; Senff, C.J.; Serikov, I.; Shohan, S.; Siddle, E.; Smirnov, A.; Späth, F.; Spooner, B.; Stolla, M.K.; Szkółka, W.; de Szoeke, S.P.; Tarot, S.; Tetoni, E.; Thompson, E.; Thomson, J.; Tomassini, L.; Totems, J.; Ubele, A.A.; Villiger, L.; von Arx, J.; Wagner, T.; Walther, A.; Webber, B.; Wendisch, M.; Whitehall, S.; Wiltshire, A.; Wing, A.A.; Wirth, M.; Wiskandt, J.; Wolf, K.; Worbes, L.; Wright, E.; Wulfmeyer, V.; Young, S.; Zhang, C.; Zhang, D.; Ziemen, F.; Zinner, T.; Zöger, M. EUREC4A. Earth System Science Data 2021, 13, 4067–4119. [Google Scholar] [CrossRef]
- Subirade, C.; L’Hégaret, P.; Speich, S.; Laxenaire, R.; Karstensen, J.; Carton, X. Combining an Eddy Detection Algorithm with In-Situ Measurements to Study North Brazil Current Rings. Remote Sensing 2023, 15, 1897. [Google Scholar] [CrossRef]
- Chelton, D.B.; Schlax, M.G.; Samelson, R.M.; de Szoeke, R.A. Global observations of large oceanic eddies. Geophysical Research Letters 2007, 34, L15606. [Google Scholar] [CrossRef]
- Schlax, M.G.; Chelton, D.B. The "growing method" of eddy identification and tracking in two and three dimensions. 2016. https://api.semanticscholar.org/CorpusID:53683135.
- Faghmous, J.H.; Frenger, I.; Yao, Y.; Warmka, R.; Lindell, A.; Kumar, V. A daily global mesoscale ocean eddy dataset from satellite altimetry. Scientific Data 2015, 2. [Google Scholar] [CrossRef]
- I, H.; Backeberg, B.; Penven, P.; Ansorge, I.; Reason, C.; Ullgren, J. Eddy properties in the Mozambique Channel: A comparison between observations and two numerical ocean circulation models. Deep-Sea Res. II 2014, 100, 38–53. [Google Scholar]
- Le Vu, B.; Stegner, A.; Arsouze, T. Angular Momentum Eddy Detection and Tracking Algorithm (AMEDA) and Its Application to Coastal Eddy Formation. Journal of Atmospheric and Oceanic Technology 2018, 35, 739–762. [Google Scholar] [CrossRef]
- Doglioli, A.; Blanke, B.; Speich, S.; Lapeyre, G. Tracking coherent structures in a regional ocean model with wavelet analysis: Application to Cape Basin Eddies. Journal of Geophysical Research 2007, 112. [Google Scholar] [CrossRef]
- Mason, E.; Pascual, A.; McWilliams, J.C. A New Sea Surface Height Based Code for Oceanic Mesoscale Eddy Tracking. Journal of Atmospheric and Oceanic Technology 2014, 31, 1181–1188. [Google Scholar] [CrossRef]
- Nencioli, F.; Dong, C.; Dickey, T.; Washburn, L.; McWilliams, J. A vector geometry-based eddy detection algorithm and its application to a high-resolution numerical model product and high-frequency radar surface velocities in the Southern California Bight. Journal of Atmos. Oceanic Technol. 2010, 27, 564–579. [Google Scholar] [CrossRef]
- Pegliasco, C.; Delepoulle, A.; Mason, E.; Morrow, R.; Faugère, Y.; Dibarboure, G. META3.1exp: a new global mesoscale eddy trajectory atlas derived from altimetry. Earth System Science Data 2022, 14, 1087–1107. [Google Scholar] [CrossRef]
- Mkhinini, N.; Coimbra, A.L.S.; Stegner, A.; Arsouze, T.; Taupier-Letage, I.; Béranger, K. Long-lived mesoscale eddies in the eastern Mediterranean Sea: Analysis of 20 years of AVISO geostrophic velocities. Journal of Geophysical Research: Oceans 2014, 119, 8603–8626. [Google Scholar] [CrossRef]
- Du, Y.; Yi, J.; Wu, D.; He, Z.; Wang, D.; Fuyuan, L. Mesoscale oceanic eddies in the South China Sea from 1992 to 2012: evolution processes and statistical analysis. Acta Oceanologica Sinica 2014, 33, 36–47. [Google Scholar] [CrossRef]
- Cui, W.; Wang, W.; Zhang, J.; Yang, J. Multicore structures and the splitting and merging of eddies in global oceans from satellite altimeter data. Ocean Science 2019, 15, 413–430. [Google Scholar] [CrossRef]
- Tian, F.; Wu, D.; Yuan, L.; Chen, G. Impacts of the efficiencies of identification and tracking algorithms on the statistical properties of global mesoscale eddies using merged altimeter data. International Journal of Remote Sensing 2019, 41, 2835–2860. [Google Scholar] [CrossRef]
- Dong, C.; Liu, L.; Nencioli, F.; Bethel, B.J.; Liu, Y.; Xu, G.; Ma, J.; Ji, J.; Sun, W.; Shan, H.; Lin, X.; Zou, B. The near-global ocean mesoscale eddy atmospheric-oceanic-biological interaction observational dataset. Scientific Data 2022, 9. [Google Scholar] [CrossRef]
- Escudier, R.; Mourre, B.; Juza, M.; Tinto, J. Subsurface circulation and mesoscale variability in the Algerian subbasin from altimeter-derived eddy trajectories. Journal of Geophysical Research: Oceans 2016, 121, 6310–6322. [Google Scholar] [CrossRef]
- Souza, J.M.A.; de Boyer Montégut, C.; Traon, P.Y.L. Comparison between three implementations of automatic identification algorithms for the quantification and characterization of mesoscale eddies in the South Atlantic Ocean. Ocean Science 2011, 7, 317–334. [Google Scholar] [CrossRef]
- Tao, X.; Yikai, Y. Three Mesoscale Eddy Detection and Tracking Methods: Assessment for the South China Sea. Journal of Atmospheric and Oceanic Technology 2021, 38, 243–258. [Google Scholar] [CrossRef]
- You, Z.; Liu, L.; Bethel, B.J.; Dong, C. Feature Comparison of Two Mesoscale Eddy Datasets Based on Satellite Altimeter Data. Remote Sensing 2022, 14, 116. [Google Scholar] [CrossRef]
- Meng, Y.; Liu, H.; Lin, P.; Ding, M.; Dong, C. Oceanic mesoscale eddy in the Kuroshio extension: Comparison of four datasets. Atmospheric and Oceanic Science Letters 2021, 14, 100011. [Google Scholar] [CrossRef]
- Lian, Z.; Sun, B.; Wei, Z.; Wang, Y.; Wang, X. Comparison of Eight Detection Algorithms for the Quantificationand Characterization of Mesoscale Eddies in the South China Sea. Journal of Atmospheric and Oceanic Technology 2019, 36, 1361–1380. [Google Scholar] [CrossRef]
- Laxenaire, R.; Speich, S.; Stegner, A. Agulhas Ring Heat Content and Transport in the South Atlantic Estimated by Combining Satellite Altimetry and Argo Profiling Floats Data. Journal of Geophysical Research: Oceans 2020, 125, e2019JC015511. [Google Scholar] [CrossRef]
- Chaigneau, A.; Gizolme, A.; Grados, C. Mesoscale eddies off Peru in altimeter records: Identification algorithms and eddy spatio-temporal patterns. Progress in Oceanography 2008, 79, 106–119. [Google Scholar] [CrossRef]
- Kersalé, M.; Lamont, T.; Speich, S.; Terre, T.; Laxenaire, R.; Roberts, M.J.; van den Berg, M.A.; Ansorge, I.J. Moored observations of mesoscale features in the Cape Basin: characteristics and local impacts on water mass distributions. Ocean Science 2018, 14, 923–945. [Google Scholar] [CrossRef]
- Capuano, T.A.; Speich, S.; Carton, X.; Laxenaire, R. Indo-Atlantic Exchange, Mesoscale Dynamics, and Antarctic Intermediate Water. Journal of Geophysical Research: Oceans 2018, 123, 1–22. [Google Scholar] [CrossRef]
- Foltz, G.R.; Brandt, P.; Richter, I.; Rodríguez-Fonseca, B.; Hernandez, F.; Dengler, M.; Rodrigues, R.R.; Schmidt, J.O.; Yu, L.; Lefevre, N.; Da Cunha, L.C.; McPhaden, M.J.; Araujo, M.; Karstensen, J.; Hahn, J.; Martín-Rey, M.; Patricola, C.M.; Poli, P.; Zuidema, P.; Hummels, R.; Perez, R.C.; Hatje, V.; Lübbecke, J.F.; Polo, I.; Lumpkin, R.; Bourlès, B.; Asuquo, F.E.; Lehodey, P.; Conchon, A.; Chang, P.; Dandin, P.; Schmid, C.; Sutton, A.; Giordani, H.; Xue, Y.; Illig, S.; Losada, T.; Grodsky, S.A.; Gasparin, F.; Lee, T.; Mohino, E.; Nobre, P.; Wanninkhof, R.; Keenlyside, N.; Garcon, V.; Sánchez-Gómez, E.; Nnamchi, H.C.; Drévillon, M.; Storto, A.; Remy, E.; Lazar, A.; Speich, S.; Goes, M.; Dorrington, T.; Johns, W.E.; Moum, J.N.; Robinson, C.; Perruche, C.; de Souza, R.B.; Gaye, A.T.; López-Parages, J.; Monerie, P.A.; Castellanos, P.; Benson, N.U.; Hounkonnou, M.N.; Duhá, J.T.; Laxenaire, R.; Reul, N. The Tropical Atlantic Observing System. Frontiers in Marine Science 2019, 6. [Google Scholar] [CrossRef]
- Shropshire, T.A.; Morey, S.L.; Chassignet, E.P.; Bozec, A.; Coles, V.J.; Landry, M.R.; Swalethorp, R.; Zapfe, G.; Stukel, M.R. Quantifying spatiotemporal variability in zooplankton dynamics in the Gulf of Mexico with a physical–biogeochemical model. Biogeosciences 2020, 17, 3385–3407. [Google Scholar] [CrossRef]
- Stephan, C.C.; Schnitt, S.; Schulz, H.; Bellenger, H.; de Szoeke, S.P.; Acquistapace, C.; Baier, K.; Dauhut, T.; Laxenaire, R.; Morfa-Avalos, Y.; Person, R.; Quiñones Meléndez, E.; Bagheri, G.; Böck, T.; Daley, A.; Güttler, J.; Helfer, K.C.; Los, S.A.; Neuberger, A.; Röttenbacher, J.; Raeke, A.; Ringel, M.; Ritschel, M.; Sadoulet, P.; Schirmacher, I.; Stolla, M.K.; Wright, E.; Charpentier, B.; Doerenbecher, A.; Wilson, R.; Jansen, F.; Kinne, S.; Reverdin, G.; Speich, S.; Bony, S.; Stevens, B. Ship- and island-based atmospheric soundings from the 2020 EUREC4A field campaign. Earth System Science Data 2021, 13, 491–514. [Google Scholar] [CrossRef]
- Chen, Y.; Speich, S.; Laxenaire, R. Formation and Transport of the South Atlantic Subtropical Mode Water in Eddy-Permitting Observations. Journal of Geophysical Research: Oceans 2021, 127. [Google Scholar] [CrossRef]
- Manta, G.; Speich, S.; Barreiro, M.; Trinchin, R.; de Mello, C.; Laxenaire, R.; Piola, A.R. Shelf Water Export at the Brazil-Malvinas Confluence Evidenced From Combined in situ and Satellite Observations. Frontiers in Marine Science 2022, 9. [Google Scholar] [CrossRef]
- Olivier, L.; Boutin, J.; Reverdin, G.; Lefèvre, N.; Landschützer, P.; Speich, S.; Karstensen, J.; Labaste, M.; Noisel, C.; Ritschel, M.; Steinhoff, T.; Wanninkhof, R. Wintertime process study of the North Brazil Current rings reveals the region as a larger sink for CO2 than expected. Biogeosciences 2022, 19, 2969–2988. [Google Scholar] [CrossRef]
- Baudena, A.; Laxenaire, R.; Catalano, C.; Claustre, H.; Ioannou, A.; Leymarie, E.; Picheral, M.; Poteau, A.; Speich, S.; Stemmann, L.; Kiko, R. A Lagrangian perspective on the carbon and oxygen budget of an oceanic eddy. 2023. [Google Scholar] [CrossRef]
- Speich, S. EUREC4A-OA. Cruise Report. 19 January – . Vessel : L’ATALANTE. Mission report, 2021. 19 February. [CrossRef]
- Olivier, L.; Reverdin, G.; Boutin, J.; Laxenaire, R.; Iudicone, D.; Pesant, S.; Calil, P.H.; Horstmann, J.; Couet, D.; Erta, J.; Huber, P.; Sarmento, H.; Freire, A.; Koch-Larrouy, A.; Vergely, J.L.; Rousselot, P.; Speich, S. Late summer northwestward Amazon plume pathway under the action of the North Brazil Current rings. Remote Sensing of Environment 2024, 307, 114165. [Google Scholar] [CrossRef]
- TARA. TARA Mission Microbiomes. https://fondationtaraocean.org/expedition/mission-microbiomes/.
- Ballarotta, M.; Ubelmann, C.; Pujol, M.I.; Taburet, G.; Fournier, F.; Legeais, J.F.; Faugere, Y.; Delepoulle, A.; Chelton, D.; Dibarboure, G.; Picot, N. On the resolutions of ocean altimetry maps. Ocean Science 2019. [Google Scholar] [CrossRef]
- Pegliasco, C.; Chaigneau, A.; Morrow, R.; Dumas, F. Detection and tracking of mesoscale eddies in the Mediterranean Sea: A comparison between the Sea Level Anomaly and the Absolute Dynamic Topography fields. Advances in Space Research 2020, 68, 401–419. [Google Scholar] [CrossRef]
- Lumpkin, R. Global characteristics of coherent vortices from surface drifter trajectories. Journal of Geophysical Research: Oceans 2016, 121, 1306–1321. [Google Scholar] [CrossRef]
- Pegliasco, C.; Chaigneau, A.; Morrow, R. Main eddy vertical structures observed in the four major Eastern Boundary Upwelling Systems. Journal of Geophysical Research: Oceans 2015, 120, 6008–6033. [Google Scholar] [CrossRef]
- Chelton, D.B.; deSzoeke, R.A.; Schlax, M.G.; Naggar, K.E.; Siwertz, N. Geographical Variability of the First Baroclinic Rossby Radius of Deformation. Journal of Physical Oceanography 1998, 28, 433–460. [Google Scholar] [CrossRef]
- Thompson, A.F.; Naveira Garabato, A.C. Equilibration of the Antarctic Circumpolar Current by Standing Meanders. Journal of Physical Oceanography 2014, 44, 1811–1828. [Google Scholar] [CrossRef]
- Peng, L.; Chen, G.; Guan, L.; Tian, F. Contrasting Westward and Eastward Propagating Mesoscale Eddies in the Global Ocean. IEEE Transactions on Geoscience and Remote Sensing 2022, 60, 1–10. [Google Scholar] [CrossRef]
- Lehahn, Y.; d’Ovidio, F.; Lévy, M.; Amitai, Y.; Heifetz, E. Long range transport of a quasi isolated chlorophyll patch by an Agulhas ring. Geophysical Research Letters 2011, 38. [Google Scholar] [CrossRef]
- Arhan, M.; Speich, S.; Messager, C.; Dencausse, G.; Fine, R.; Boye, M. Anticyclonic and cyclonic eddies of subtropical origin in the subantarctic zone south of Africa. Journal of Geophysical Research: Oceans 2011, 116. [Google Scholar] [CrossRef]
- Cushman-Roisin, B.; Tang, B.; Chassignet, E.P. Westward Motion of Mesoscale Eddies. Journal of Physical Oceanography 1990, 20, 758–768. [Google Scholar] [CrossRef]
- Morrow, R. Divergent pathways of cyclonic and anti-cyclonic ocean eddies. Geophysical Research Letters 2004, 31. [Google Scholar] [CrossRef]
- Poulin, F.; Flierl, G. The Nonlinear Evolution of Barotropically Unstable Jets. Journal of Physical Oceanography 2003, 33, 2173–2192. [Google Scholar] [CrossRef]
- Perret, G.; Dubos, T.; Stegner, A. How Large-Scale and Cyclogeostrophic Barotropic Instabilities Favor the Formation of Anticyclonic Vortices in the Ocean. Journal of Physical Oceanography 2011, 41, 303–328. [Google Scholar] [CrossRef]
- Ioannou, A.; Stegner, A.; Dubos, T.; Le Vu, B.; Speich, S. Generation and Intensification of Mesoscale Anticyclones by Orographic Wind Jets: The Case of Ierapetra Eddies Forced by the Etesians. Journal of Geophysical Research: Oceans 2020, 125, e2019JC015810. [Google Scholar] [CrossRef]
- Dilmahamod, A.F.; Karstensen, J.; Dietze, H.; Löptien, U.; Fennel, K. Generation mechanisms of mesoscale eddies in the Mauritanian Upwelling Region. Journal of Physical Oceanography 2021, 52, 161–182. [Google Scholar] [CrossRef]
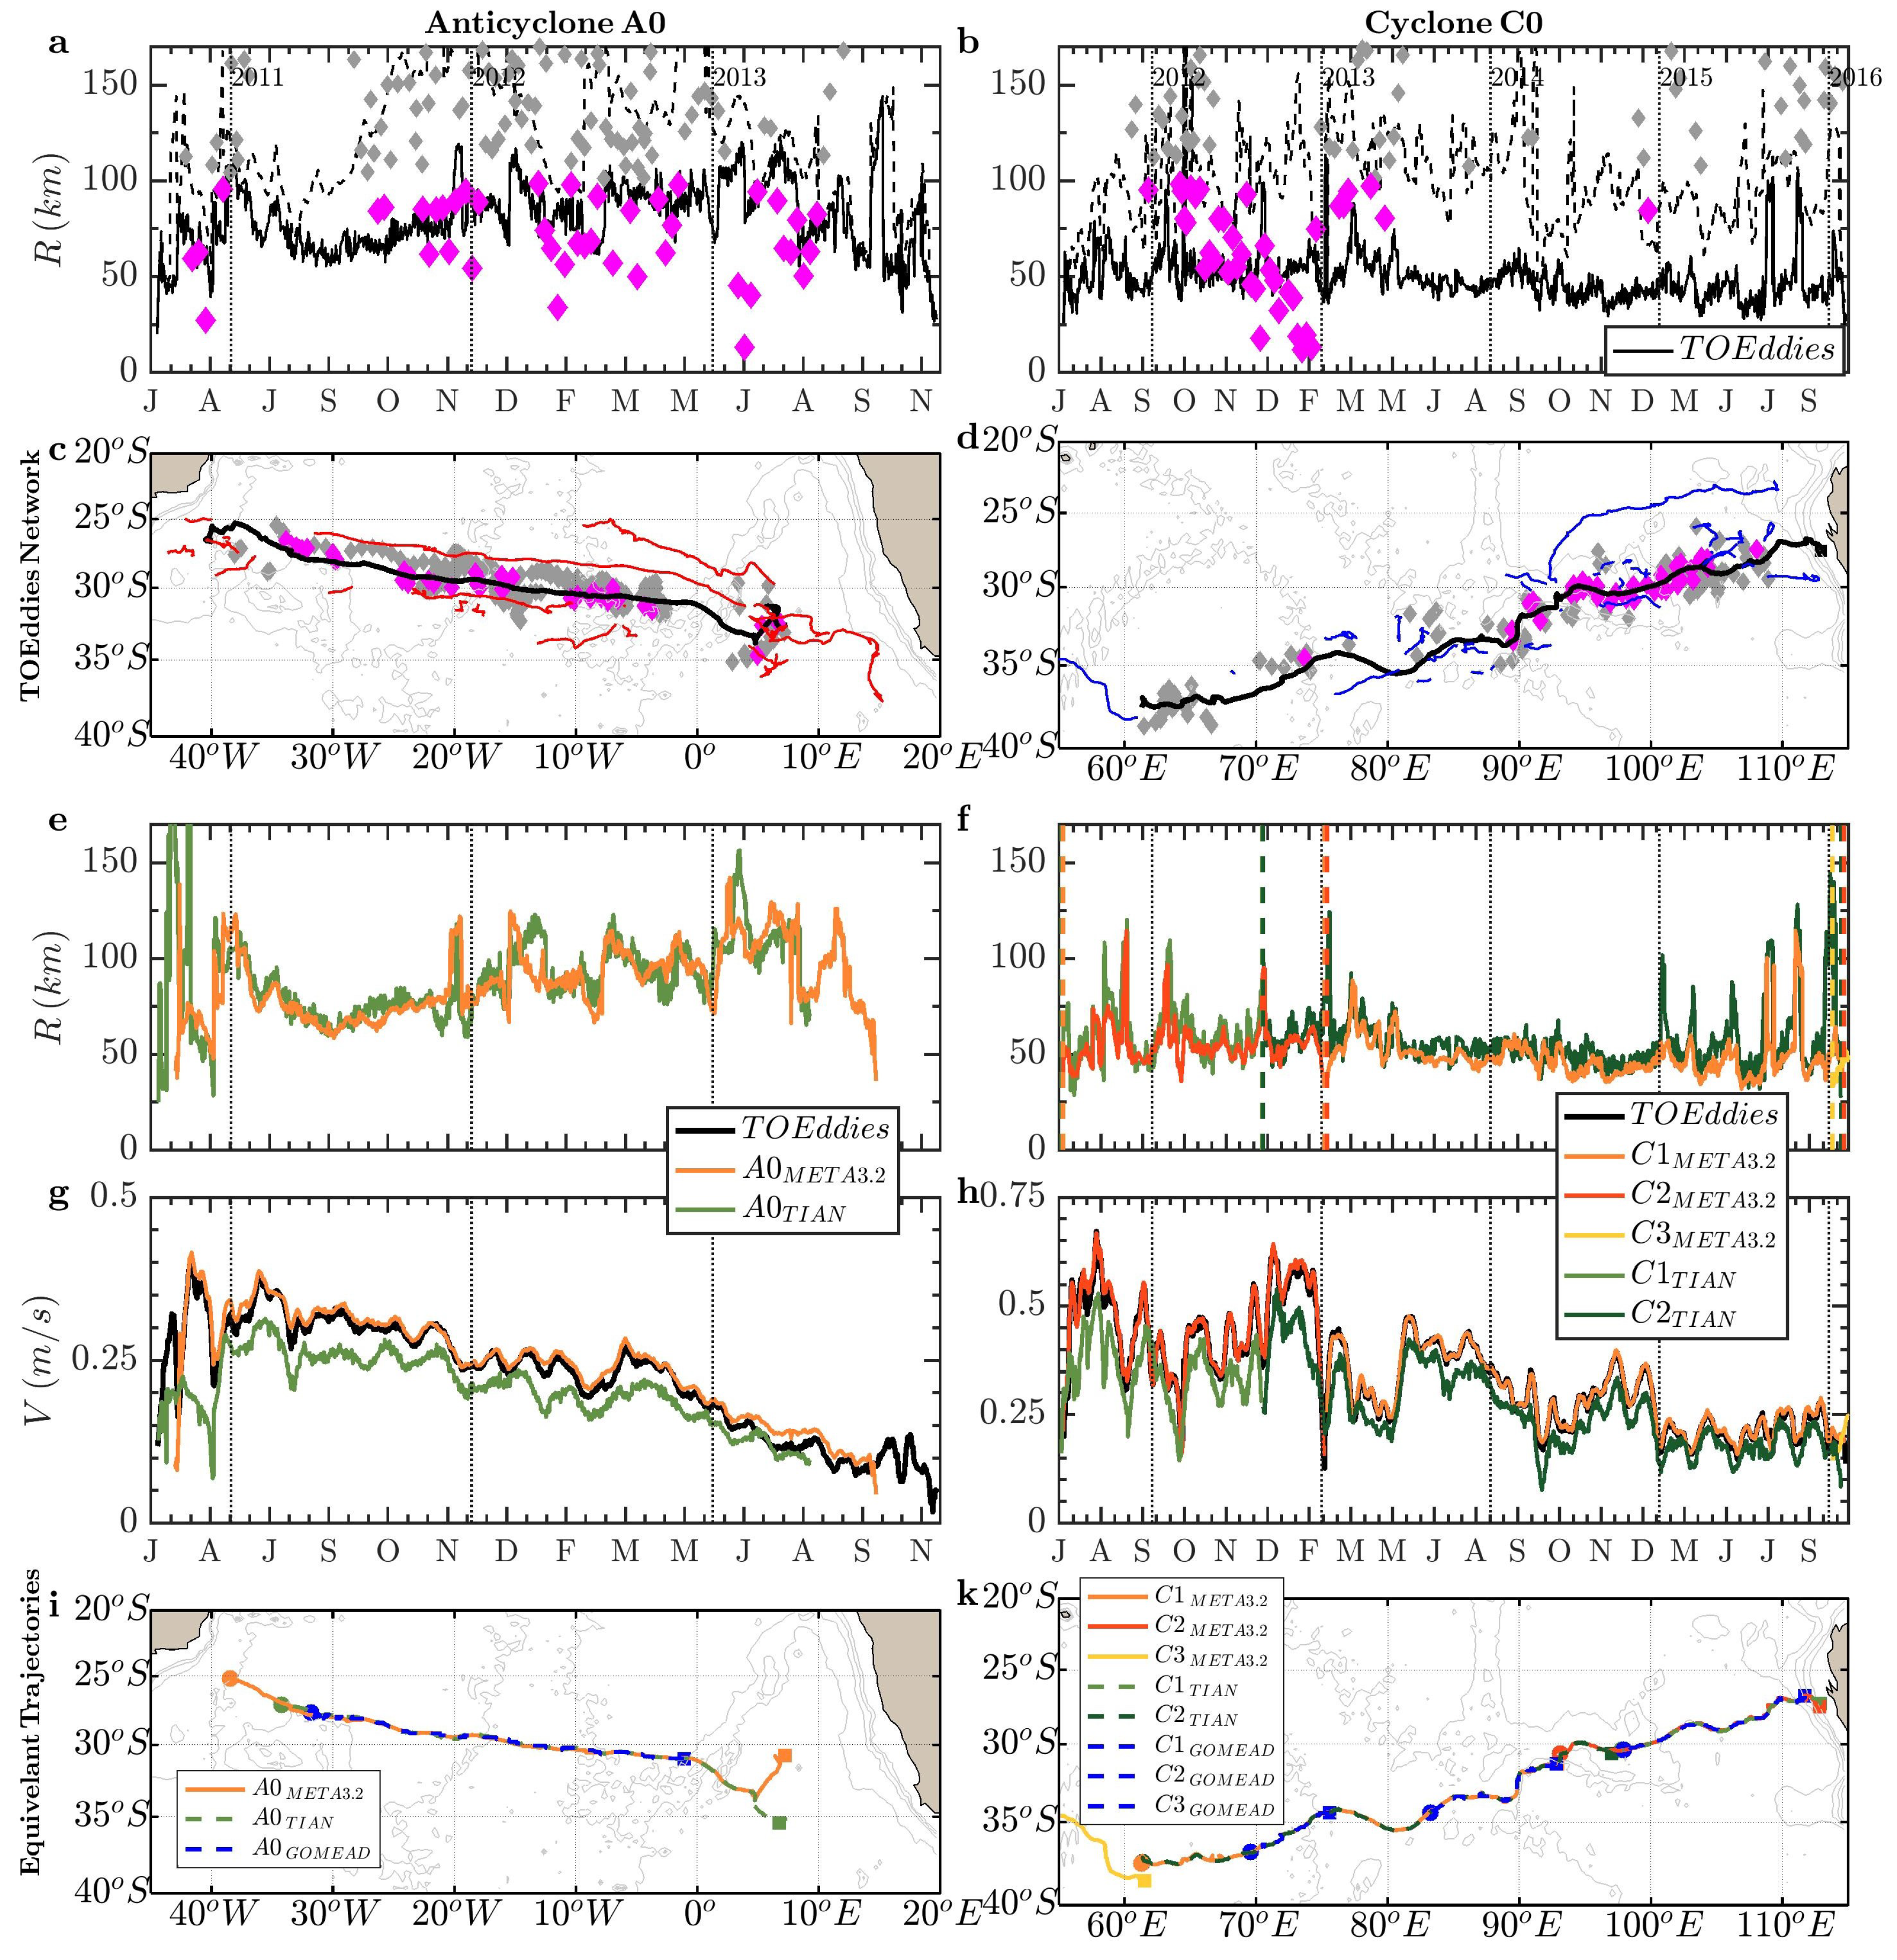
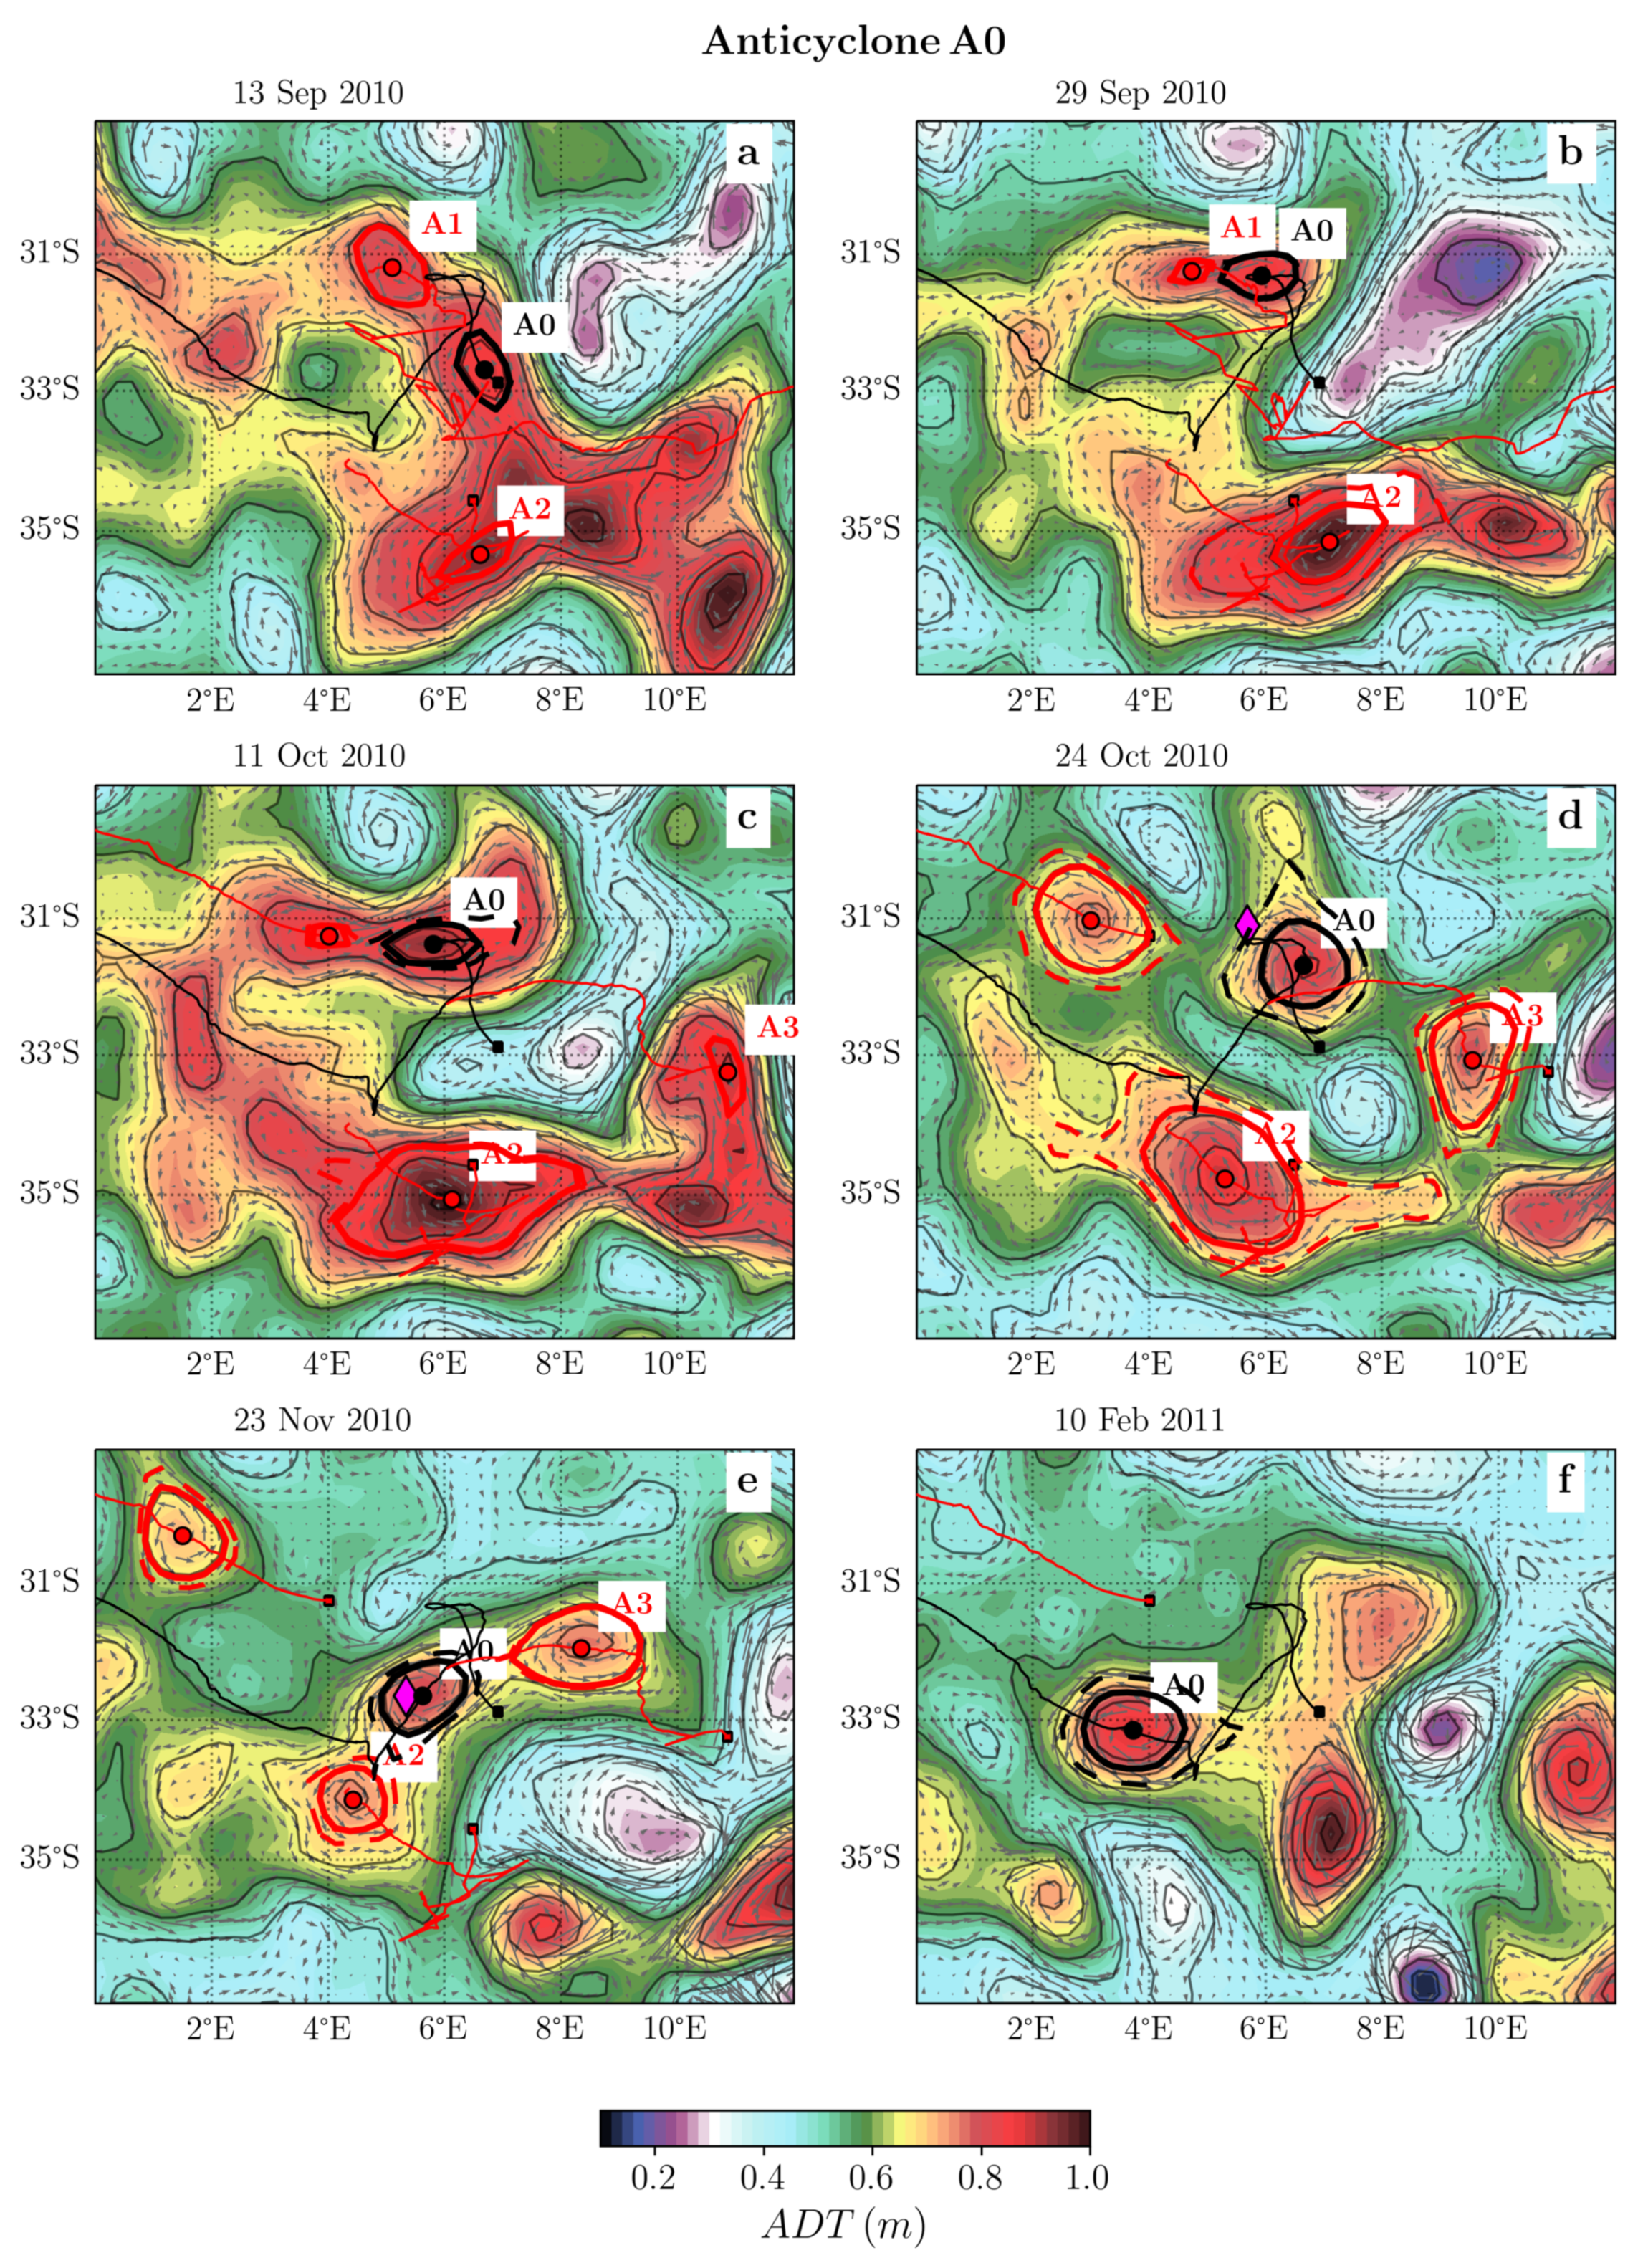
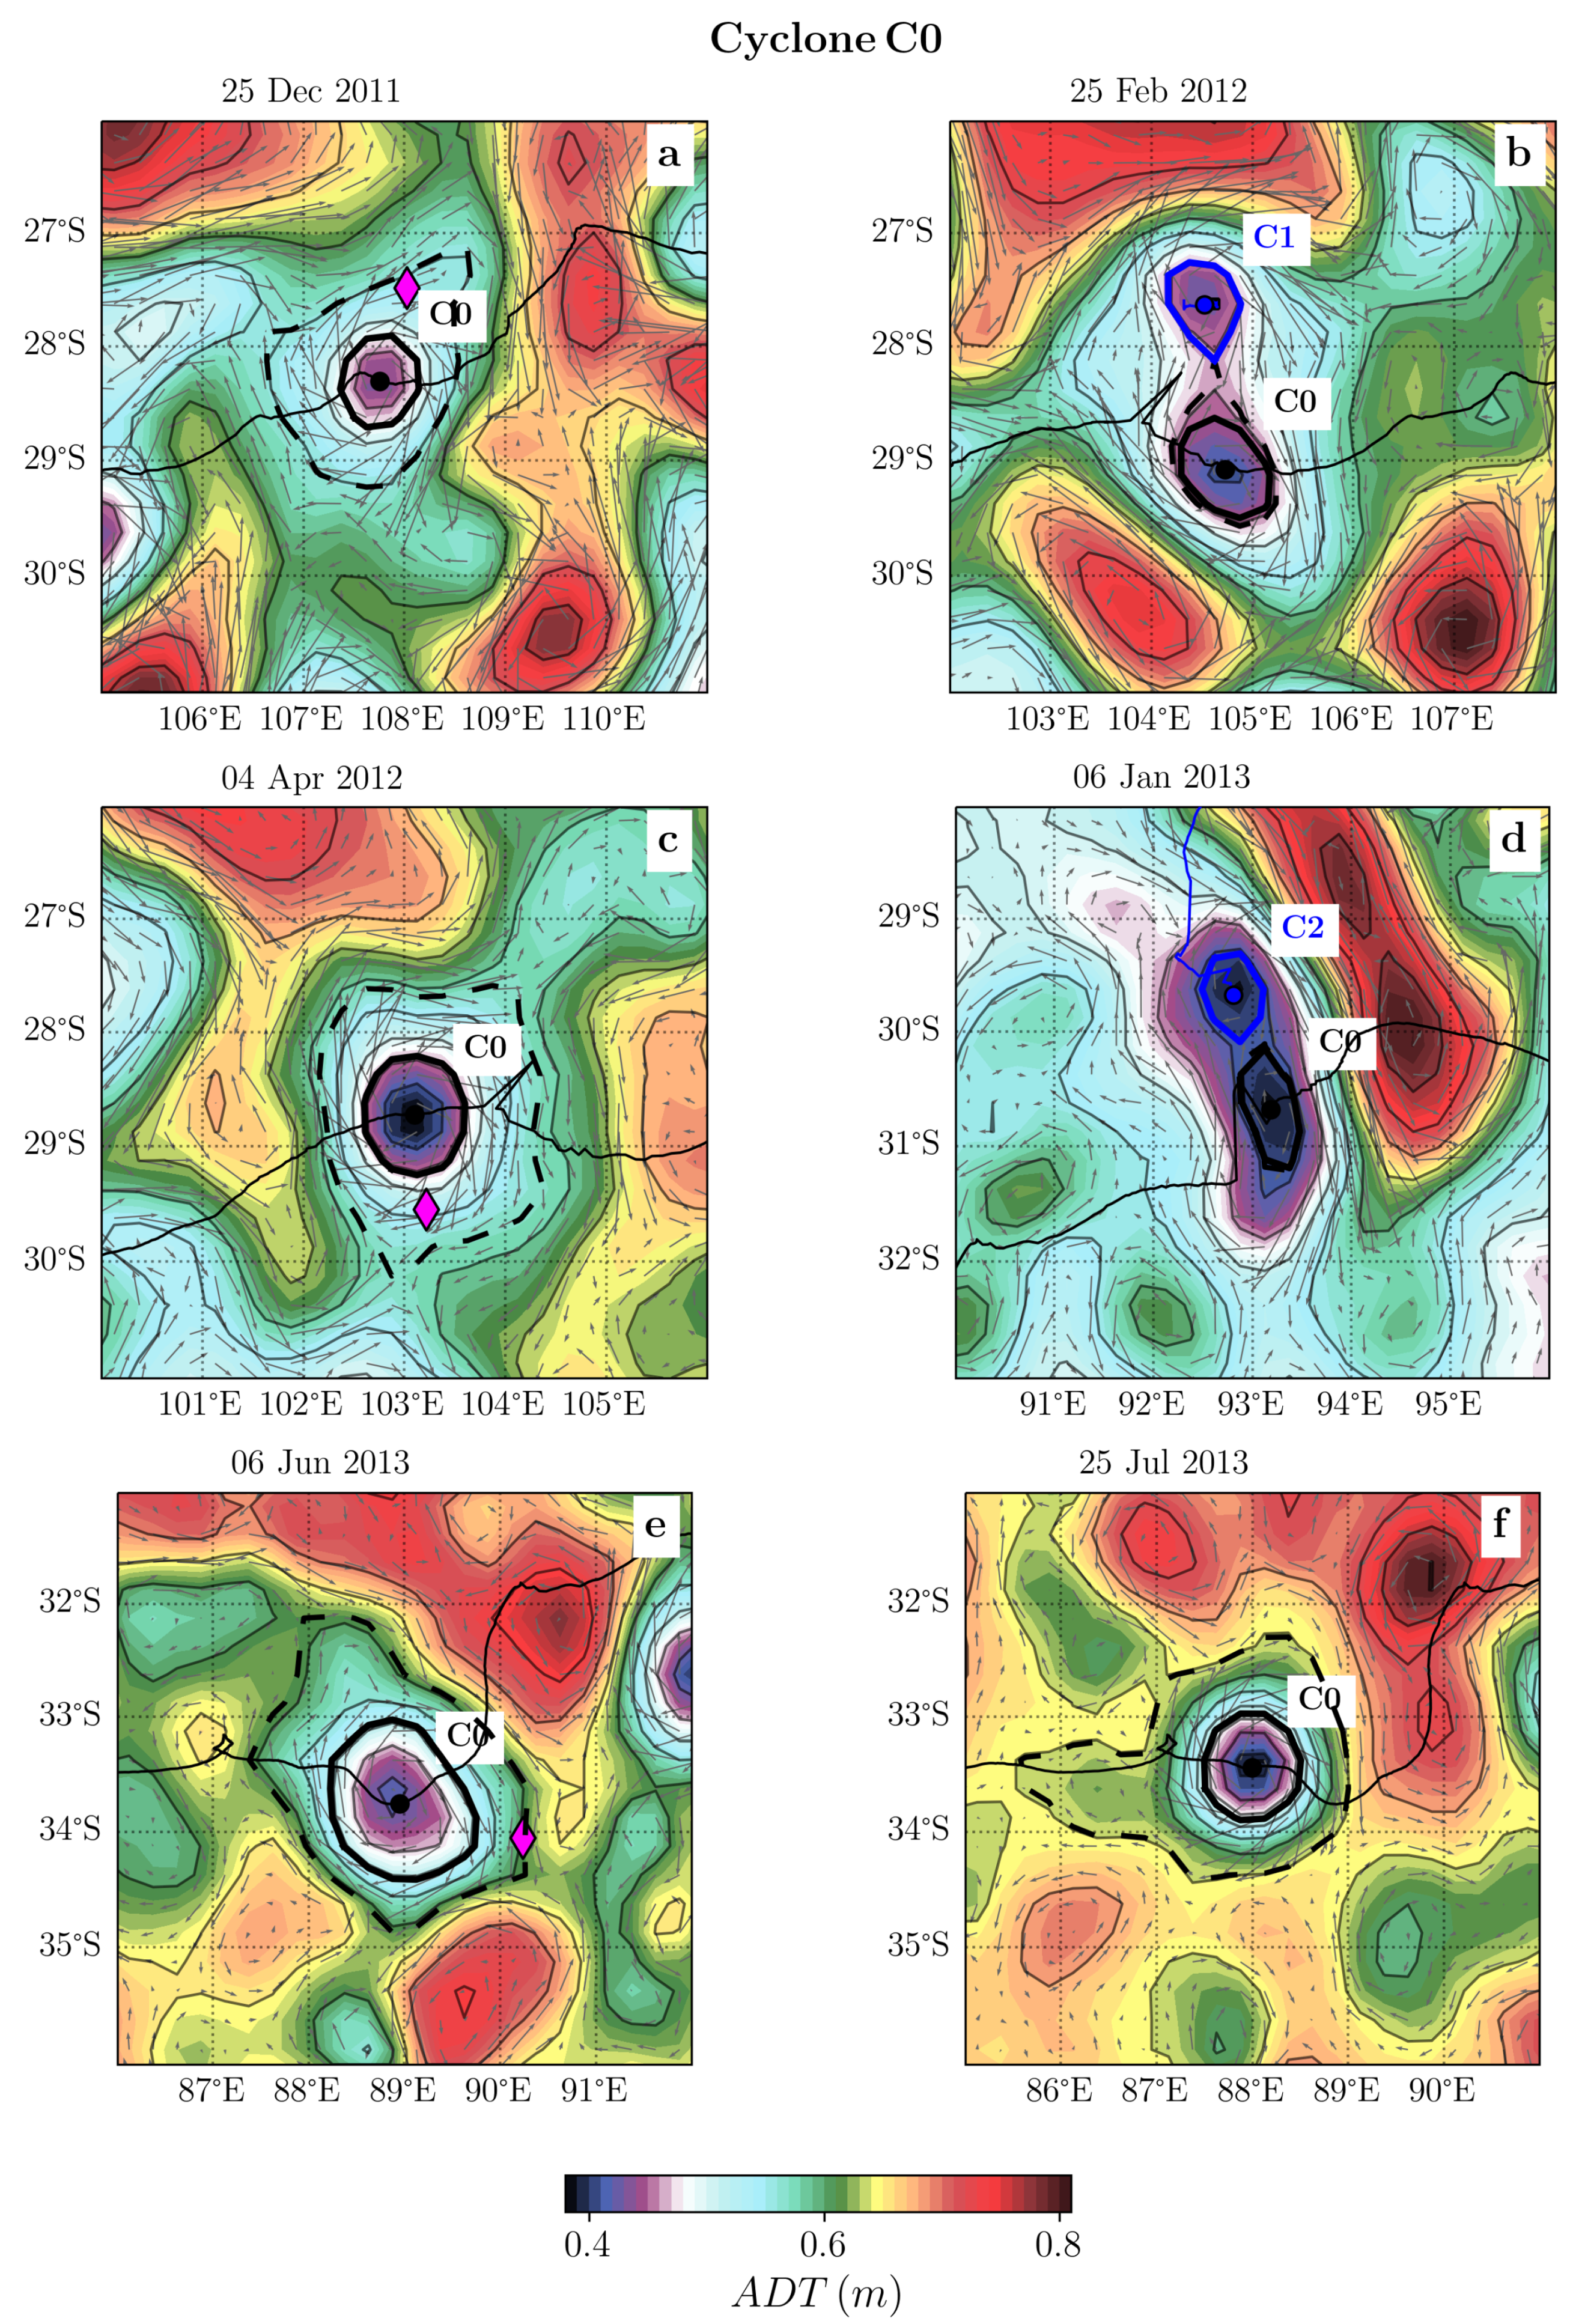
| Dataset | SSH (all-sat) | Threshold | Period |
|---|---|---|---|
| TOEddies | ADT | 0.1 cm | Jan 1993 - May 2023 |
| META3.2 | ADT | 0.4 cm | Jan 1993 - Sep 2022 |
| TIAN | SLA | 0.25 cm | Jan 1993 - Dec 2016 |
| GOMEAD | SLA | - | Jan 1993 - Dec 2019 |
Disclaimer/Publisher’s Note: The statements, opinions and data contained in all publications are solely those of the individual author(s) and contributor(s) and not of MDPI and/or the editor(s). MDPI and/or the editor(s) disclaim responsibility for any injury to people or property resulting from any ideas, methods, instructions or products referred to in the content. |
© 2024 by the authors. Licensee MDPI, Basel, Switzerland. This article is an open access article distributed under the terms and conditions of the Creative Commons Attribution (CC BY) license (http://creativecommons.org/licenses/by/4.0/).


