1. Introduction
Body surface area (BSA) is one of the most important anthropometric parameters in modern medicine. Its direct measurement is difficult and requires sophisticated equipment [
1]. In everyday clinical practice, different formulas are used to estimate body surface area. From the first formula published in Germany in 1879 to modern times, several dozen other formulas have been developed [
2].
Although the basic anthropometric index remains the Quetelet index proposed in 1832, today known as the body mass index (BMI) [
3], it is increasingly subject to criticism. One of the reasons for this criticism is its inability to distinguish the variable proportion of body fat in body composition [
4]. Fat mass has a lower specific weight than muscle mass and its increase takes up more space than an equivalent increase in muscle mass. This fact is more accurately reflected in changes in BSA than in BMI. For this reason, BSA measurement has gained importance in recent years as a potentially better indicator of changes in body weight composition [
5].
BSA measurement is used to normalize the results of a number of structural and functional studies, such as measured glomerular filtration, results of ultrasound examinations of the heart and hemodynamic measurements [
6,
7,
8]. Estimated BSA is also used in transplantology, burn treatment and appropriate selection of medication dosages in oncology and pediatrics [
9,
10,
11,
12].
Recently, there has been growing interest in using BSA to analyze the obesity paradox in chronic diseases. Studies indicate an association of lower BSA values with poorer prognosis. Such observations come from studies of patients with heart failure (HF) [
13,
14], acute kidney injury [
15] and peripheral artery disease [
16].
All the above-mentioned studies were conducted using the Mosteller formula from 1987 [
17]. Although this formula is widely used, it is not the only one. Over the last 150 years, more than 20 different formulas have been published, but their validation is insufficient. Recently, inconsistencies in BSA estimates, have been identified when using different formulas [
2].
In contrast to the Mosteller formula, the association between poorer prognosis in chronic diseases and BSA estimated by other methods has not been documented. Although the justification for BSA research in the obesity paradox was the hypothesis that this parameter might outperform BMI, there are no convincing data supporting such a thesis.
The first objective of this study was to compare the consistency of the BSA estimation results by the available formulas. The second aim was to determine the ability of these formulas to discriminate between the deaths and living patients. The third objective was to compare the diagnostic features of the available formulas, and the last objective was to determine whether the risk associated with low BSA is independent of BMI.
2. Materials and Methods
The study was conducted using data from the Prospective Heart Failure Registry maintained at the Silesian Center for Heart Diseases in Zabrze in 2004-2014. It included patients diagnosed with HF who were assessed for indications for heart transplantation. The registry protocol was approved by the Bioethics Committee of the Medical University of Silesia and the participants provided informed written consent to participate in the study.
A total of 1029 patients were included in the analysis, with a median age of 54 years and 13.7% were women. The etiology of HF was ischemic in 62.9% of cases, while in the remaining patients it was of another origin. The median duration of HF was 35 months. The patients were on stable and optimal pharmacological treatment. They were in different NYHA classes and the percentages of patients in class I / II / III and IV were: 6.3% / 36.5% / 47.7% / 9.5% respectively. The median height was 1.73 m and the median BMI of the entire group was 26.2 kg/m2. The minimum and the maximum values of these parameters were 1.4 and 2.0 m and 40.0 and 139.7 kg, respectively. The percentage distribution of BMI categories according to the recommended classifications was 2.4% / 36.4% / 40.9% / 16.6% / 3.3% / 0.4%, for the categories <18.5 kg/m², 18.5–24.9 kg/m², 25.0–29.9 kg/m², 30.0–34.9 kg/m², 35.0–39.9 kg/m² and >40 kg/m², respectively.
Patients were treated according to the guidelines applicable during the registry period. The percentages of patients receiving ACE inhibitors/ACE receptor antagonists, β-blockers, aldosterone antagonists and loop diuretics were 93.1%, 97.6%, 92.2%, and 87.2%, respectively. Over the 3-year observation period, 31.2% of the patients died.
2.1. Statistical Analysis
Continuous data were presented as medians and interquartile ranges, while categorical data were presented as percentages. For each patient, BSA was calculated using the 25 formulas presented in
Table 1. For all the BSA calculation formulas used, an analysis was conducted to assess their ability to discriminate between the deceased and the living during a 3-year follow-up period. The ROC analysis was used for this purpose and the discriminatory ability of BSA calculated from the various formulas was presented in the form of areas under the ROC curve with 95% confidence intervals and p-values.
To determine the optimal discrimination values, the Youden method was used and such a value was calculated for each BSA formula. ANOVA or chi-square tests were used to compare the parameters characterizing the formulas. Pearson’s linear correlation analysis was used to examine the relationship between discrimination thresholds and patient numbers in subgroups, as well as the relationship between threshold values and mortality.
Next, the Kaplan-Meier survival curves were compared for BSA values < and ≥ the discrimination point for the BSA estimation methods with the lowest BSA (BSA
Meeh1879) and highest (BSA
Nwoye1989) discrimination points, as well as for the methods where mortality below the discrimination points was lowest (BSA
Schlich2010) and highest (BSA
Meeh1879) [
2]. Survival curves were compared with the use of the log-rank test.
In the next step, the Cox proportional hazards method was used to examine the relationship between lower BSA values and the identified optimal thresholds after taking into account the influence of confounding factors, primarily BMI.
In the final stage, for each of the 25 BSA estimation formulas, the chi-square test was used to pairwise compare percentiles of patients in subgroups with BSA values lower than the optimal threshold for that formula, with percentiles of BSA in subgroups below the optimal value for the recommended BSA estimator BSAMosteller1987 from literature. Mortality rate of patients were also compared between the resulting pairs. In all analyses, a p value of <0.05 was considered statistically significant.
3. Results
3.1. BSA and Prognosis
Regardless of the formula used for calculations, BSA was found to be a significant, though weak, predictor of mortality risk. The mean area under the ROC curve was 0.552 ± 0.0015, with the lowest area being 0.549 (BSA
Nwoye1989) and the highest being 0.556 for the 2 estimators BSA
Choi1956 and BSA
Schlich2010. The coefficient of variation of the areas under the ROC curves was only 0.29% (
Table 1).
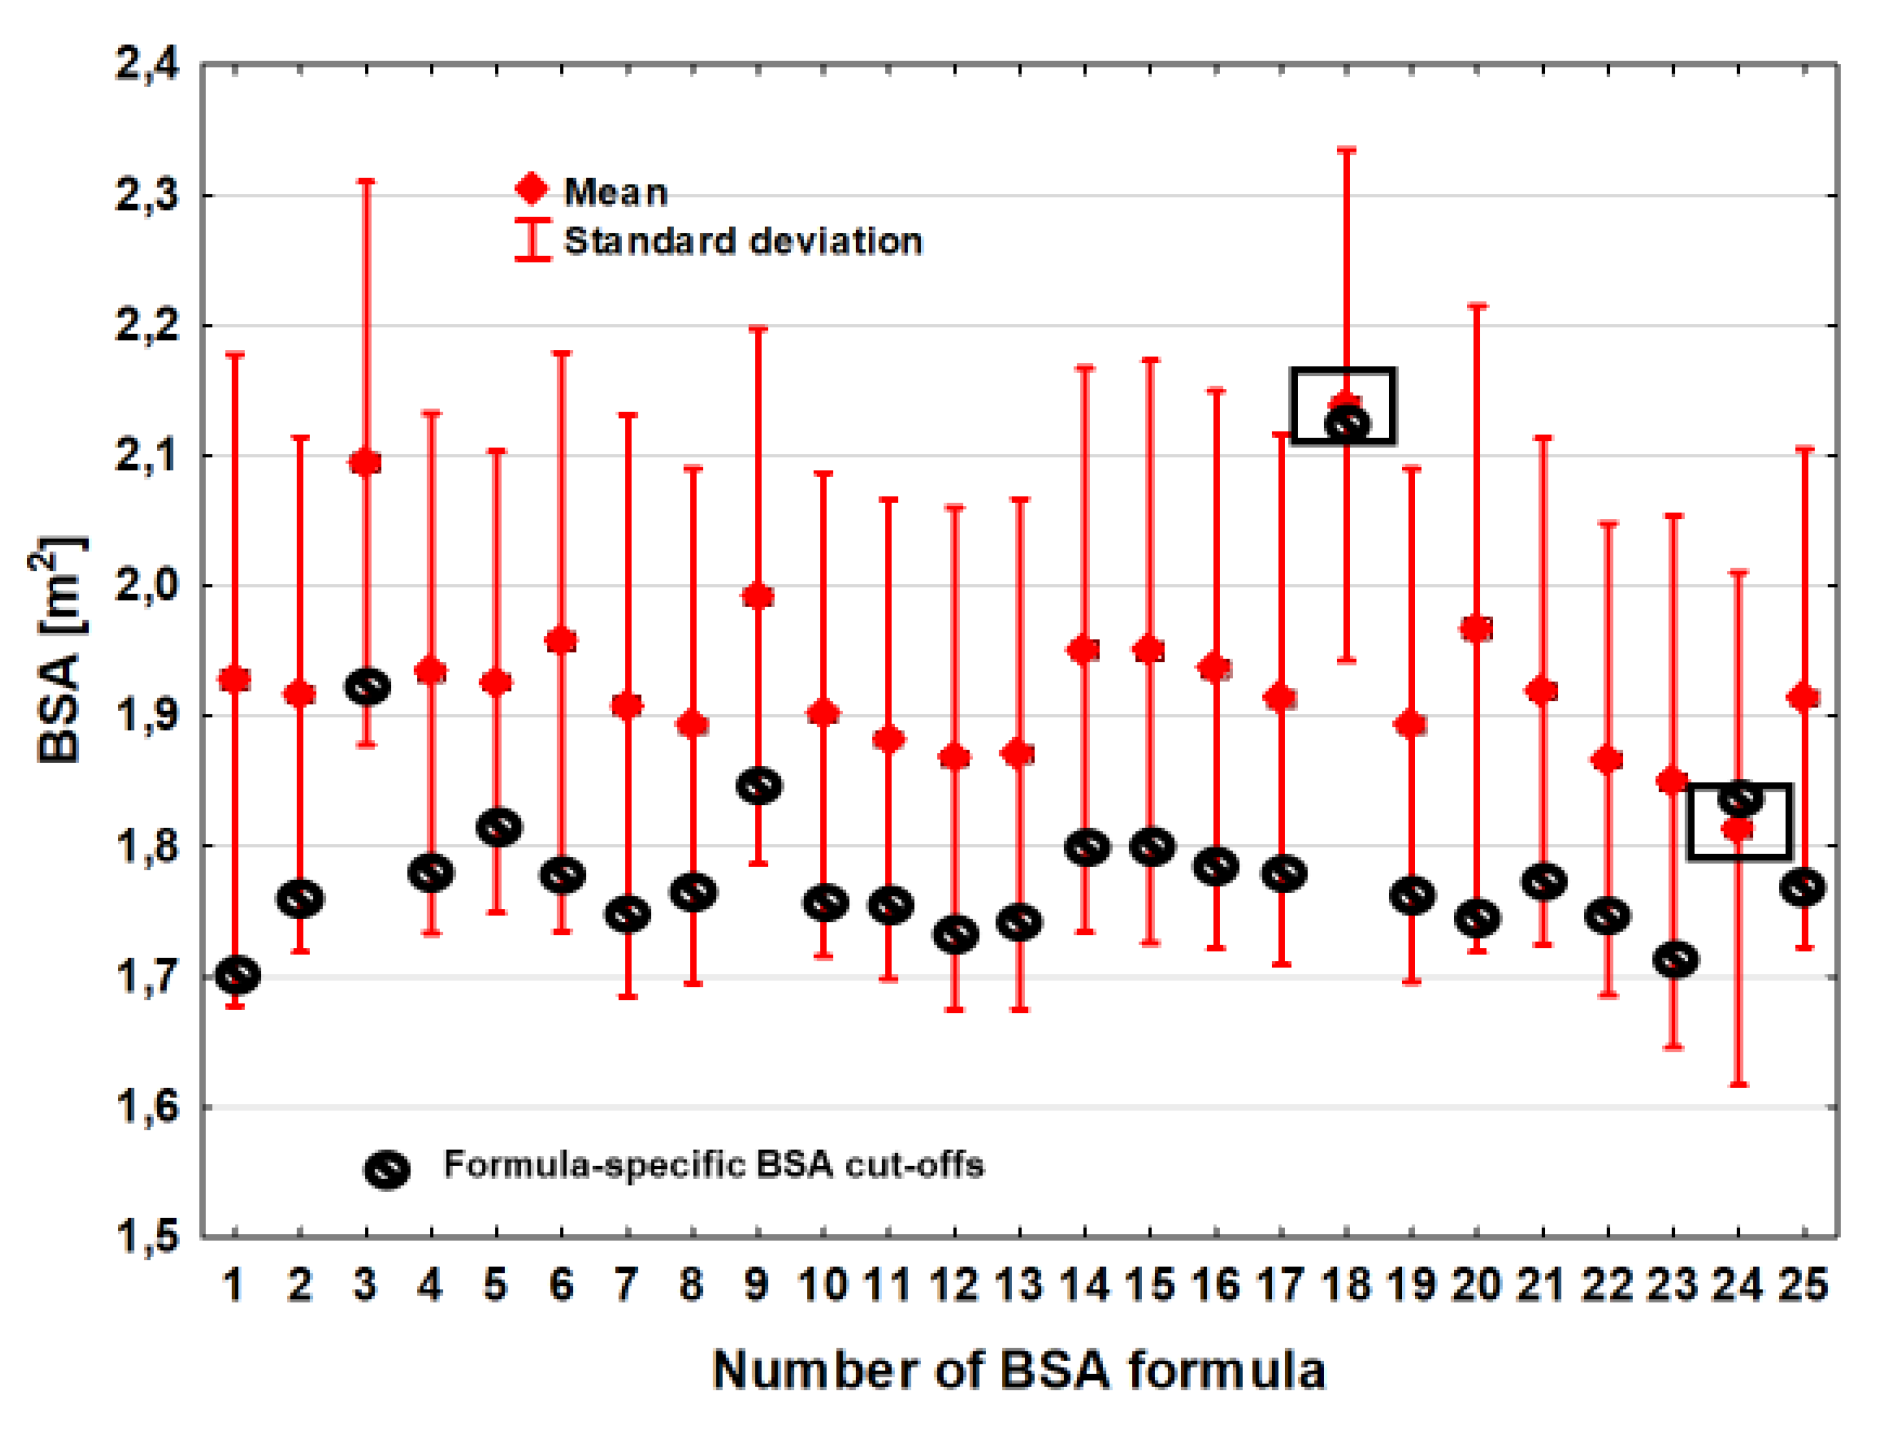
In the ROC analysis, thresholds that optimally discriminated between the living from the dead were identified. These values differed significantly between the BSA estimation formulas.
The average BSA value of the optimal discrimination thresholds was 1.79 m
2 ± 0.084 m
2 and the BSA difference between the estimators with the lowest (BSA
Meeh1879) and the highest (BSA
Nwoye1989) optimal discrimination thresholds was 0.42 m
2 (
Table 2,
Figure 1). The variation in BSA threshold values that optimally differentiated the deceased from the living was also slightly greater compared to the BSA estimation. The coefficient of variation (CV) was 4.7%.
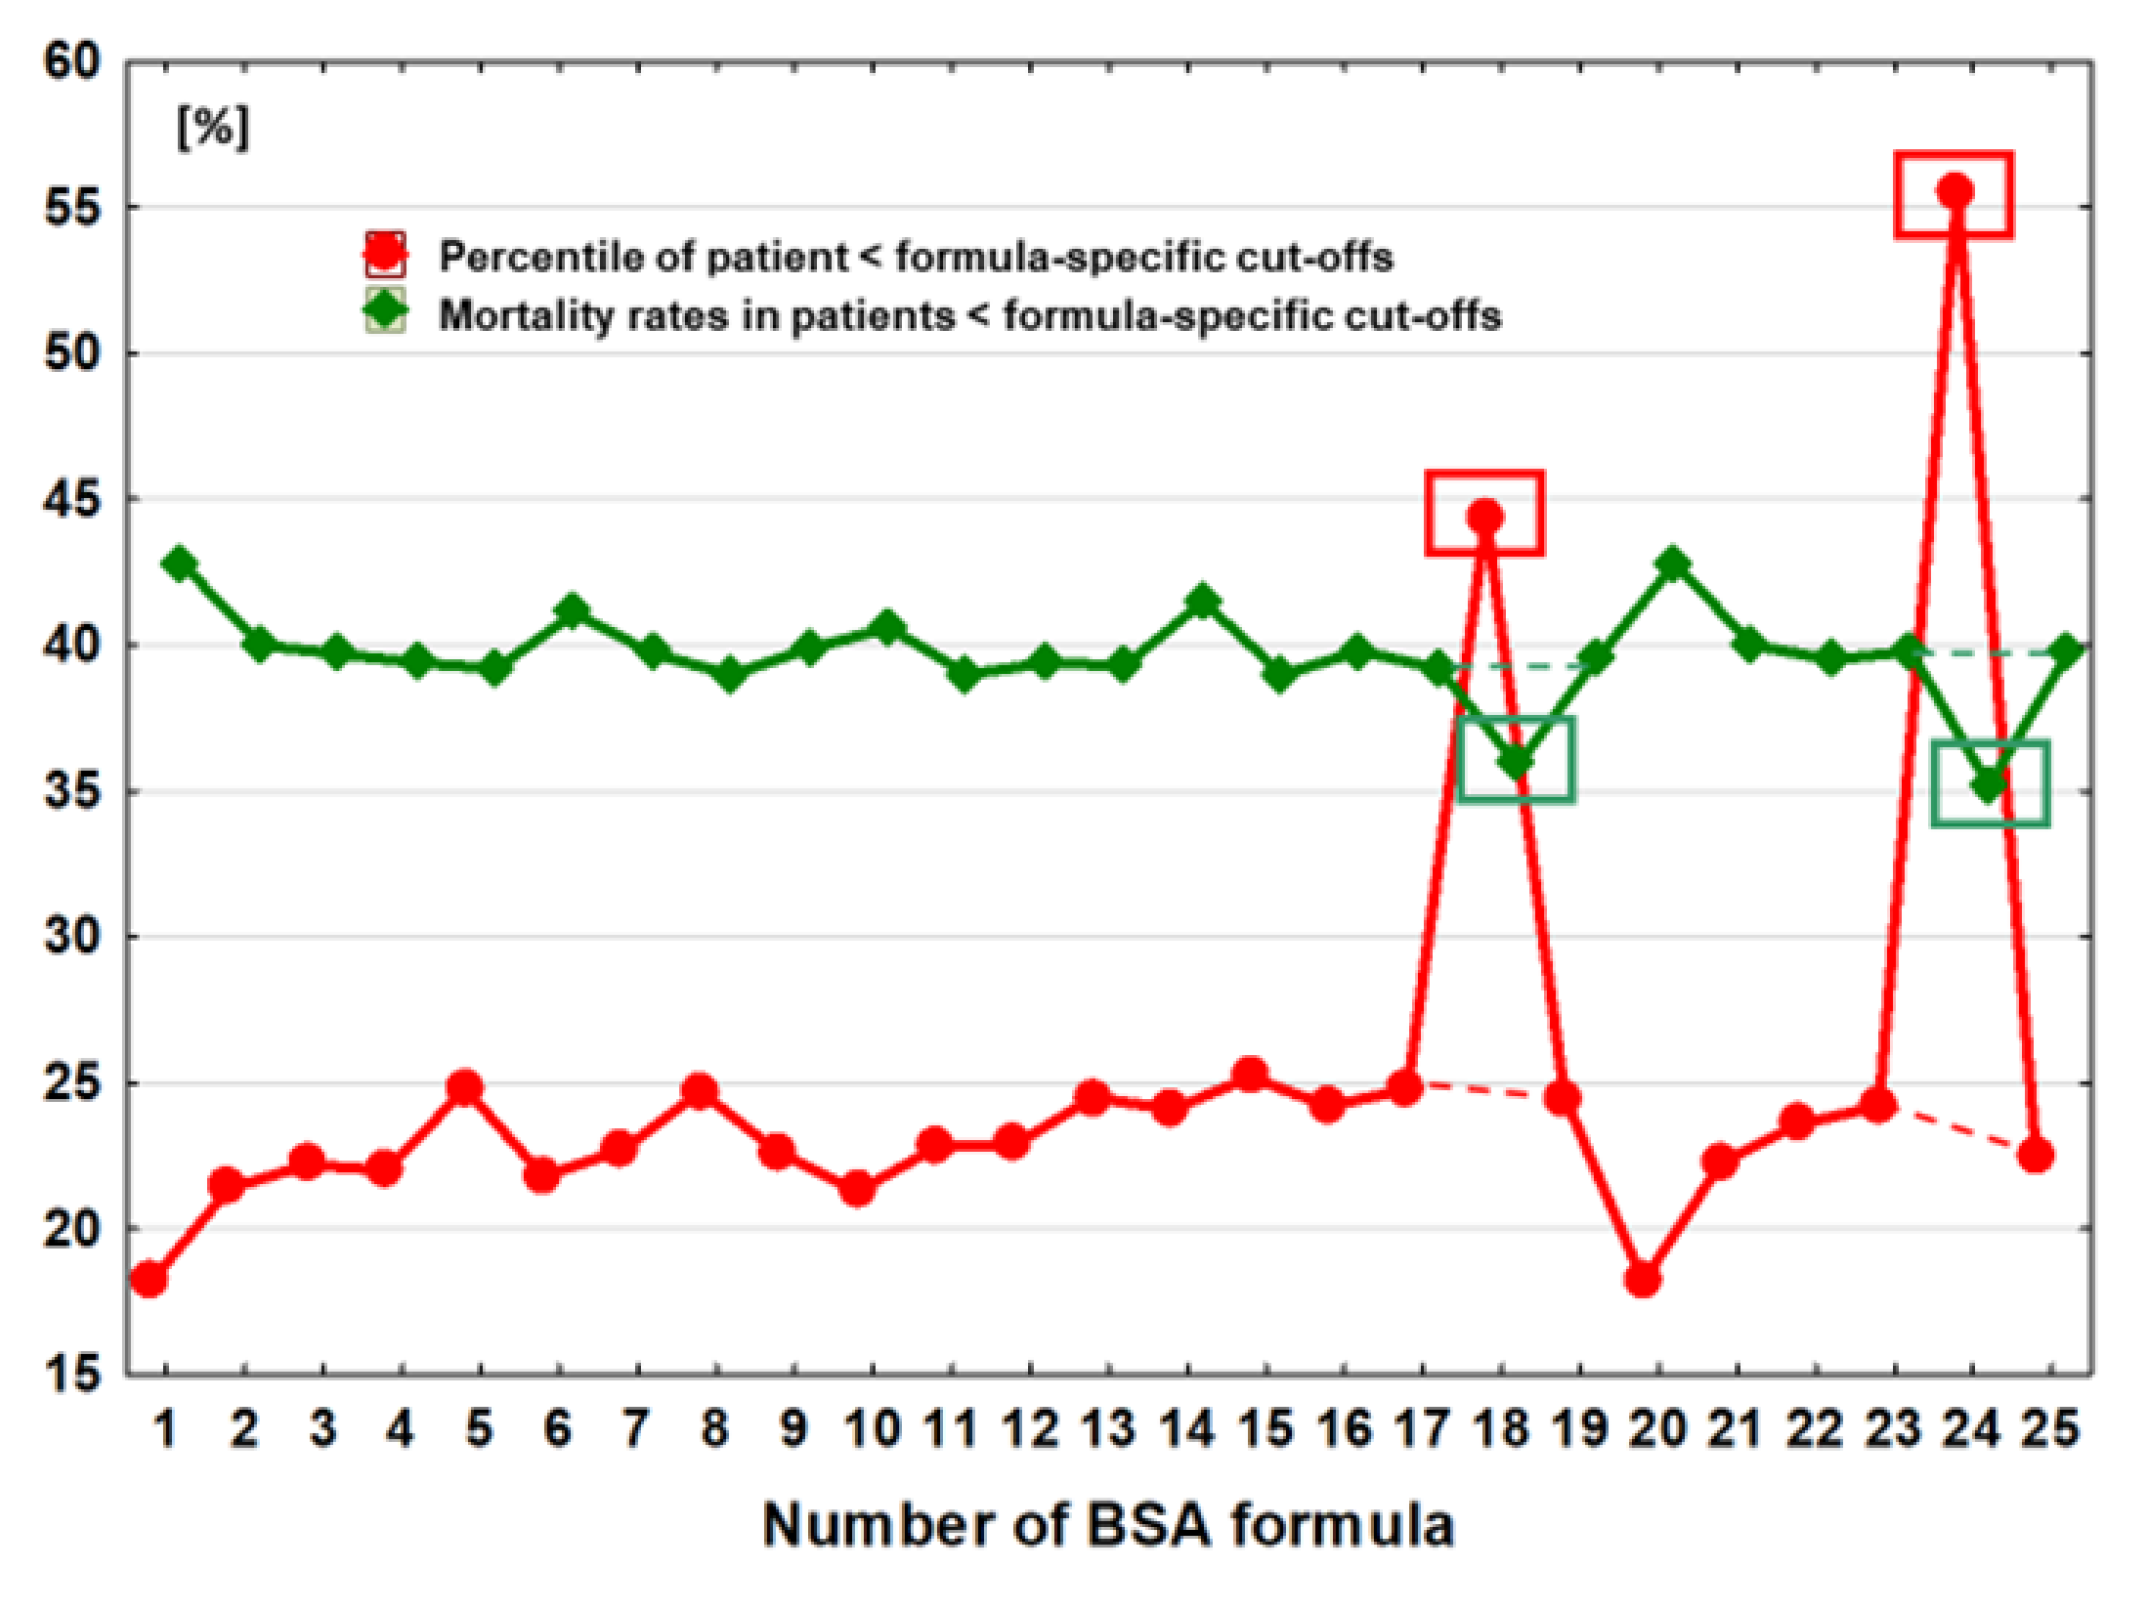
The number (percentiles) of subgroups with BSA values below the optimal discrimination value was strongly associated with the values of the optimal discrimination thresholds for the individual formulas (r=0.59, p=0.002) and ranged from 18.2% of the entire studied cohort, observed in the case of 2 estimators BSA
Meeh1879 and BSA
Livingston&Lee2001, to 55.5% in the case of BSA calculations which were made by using the BSA
Schlich2010 formula (
Table 2,
Figure 2).
The difference in BSA values optimally discriminating prognosis in this case ranged from 0.10 to 0.14 m2, depending on the choice of the BSAMeeh1879 or BSALivingston&Lee2001 formula. The coefficient of variation (CV) for the subgroup sizes was as high as 31.5%.
Mortality was negatively correlated with the height of the optimal discrimination threshold (r=-0.57, p=0.003) and with the number of subgroups with lower discrimination threshold values (r=-0.86, p<0.0001). The lowest mortality rate was 35.2% and occurred in the subgroup of individuals with BSA values below the optimal discrimination threshold using the BSA
Schlich2010 estimator. This threshold was 1.84 m
2, and the percentage of the entire population below this value was 55% (
Table 2,
Figure 2). The highest mortality was observed when estimators BSA
Meeh1879 or BSA
Livingston&Lee2001 were used. In their case, the optimal death discrimination thresholds were 1.70 m
2 and 1.74 m
2, respectively and among the 18.2% of patients who were below this value, the mortality rate was 42.8% (
Table 2,
Figure 2). The coefficient of variation (CV) for mortality in these highlighted subgroups was 4.1%.
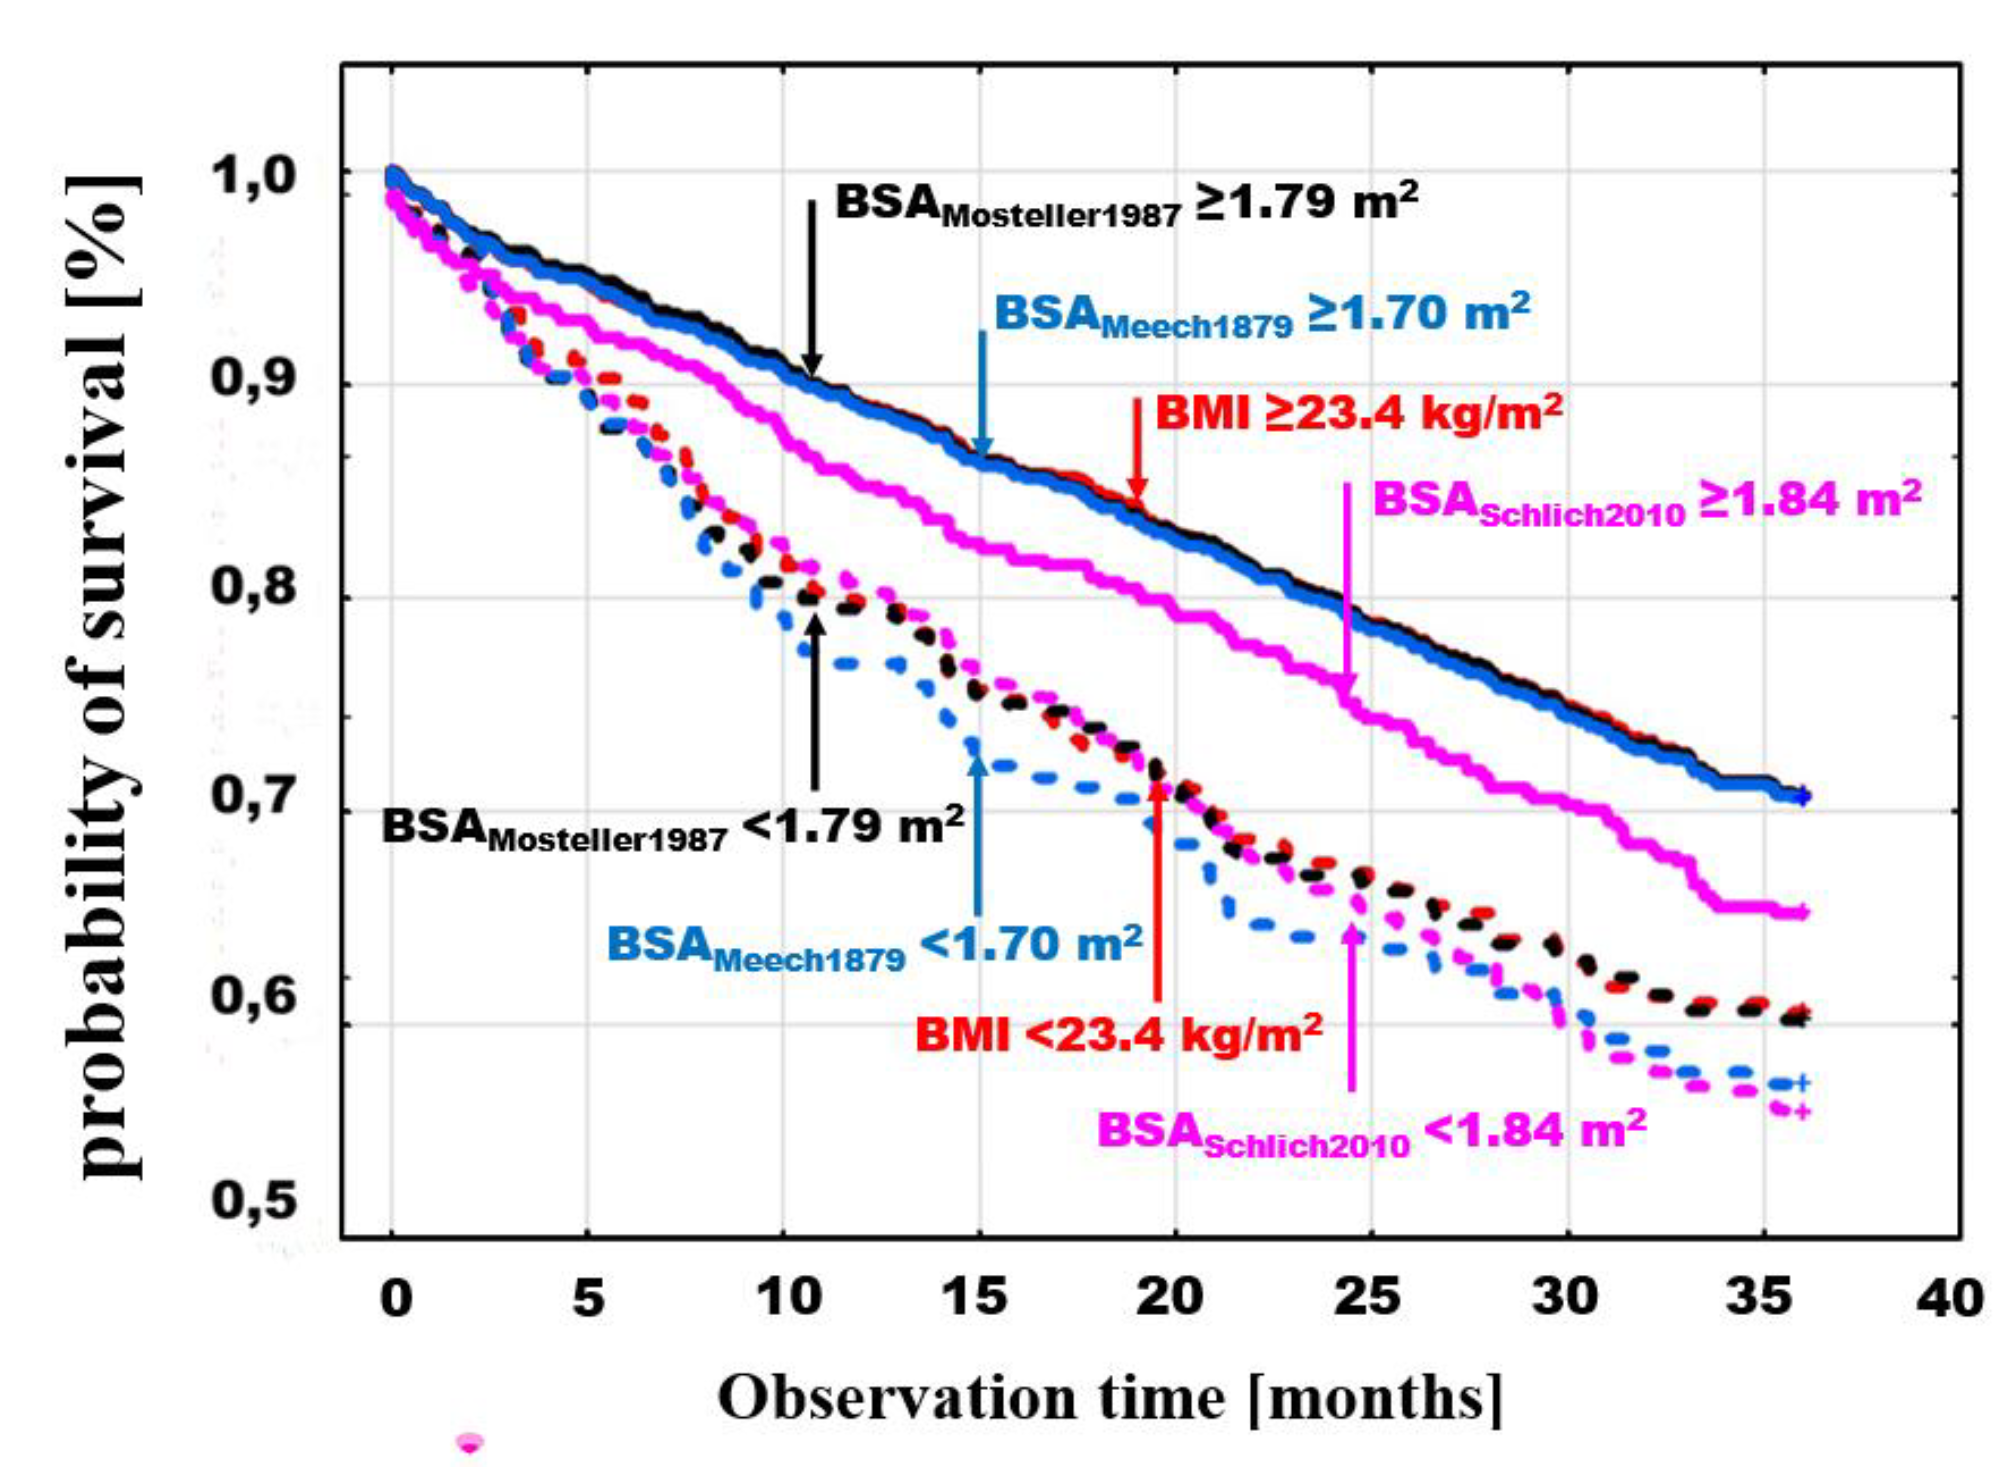
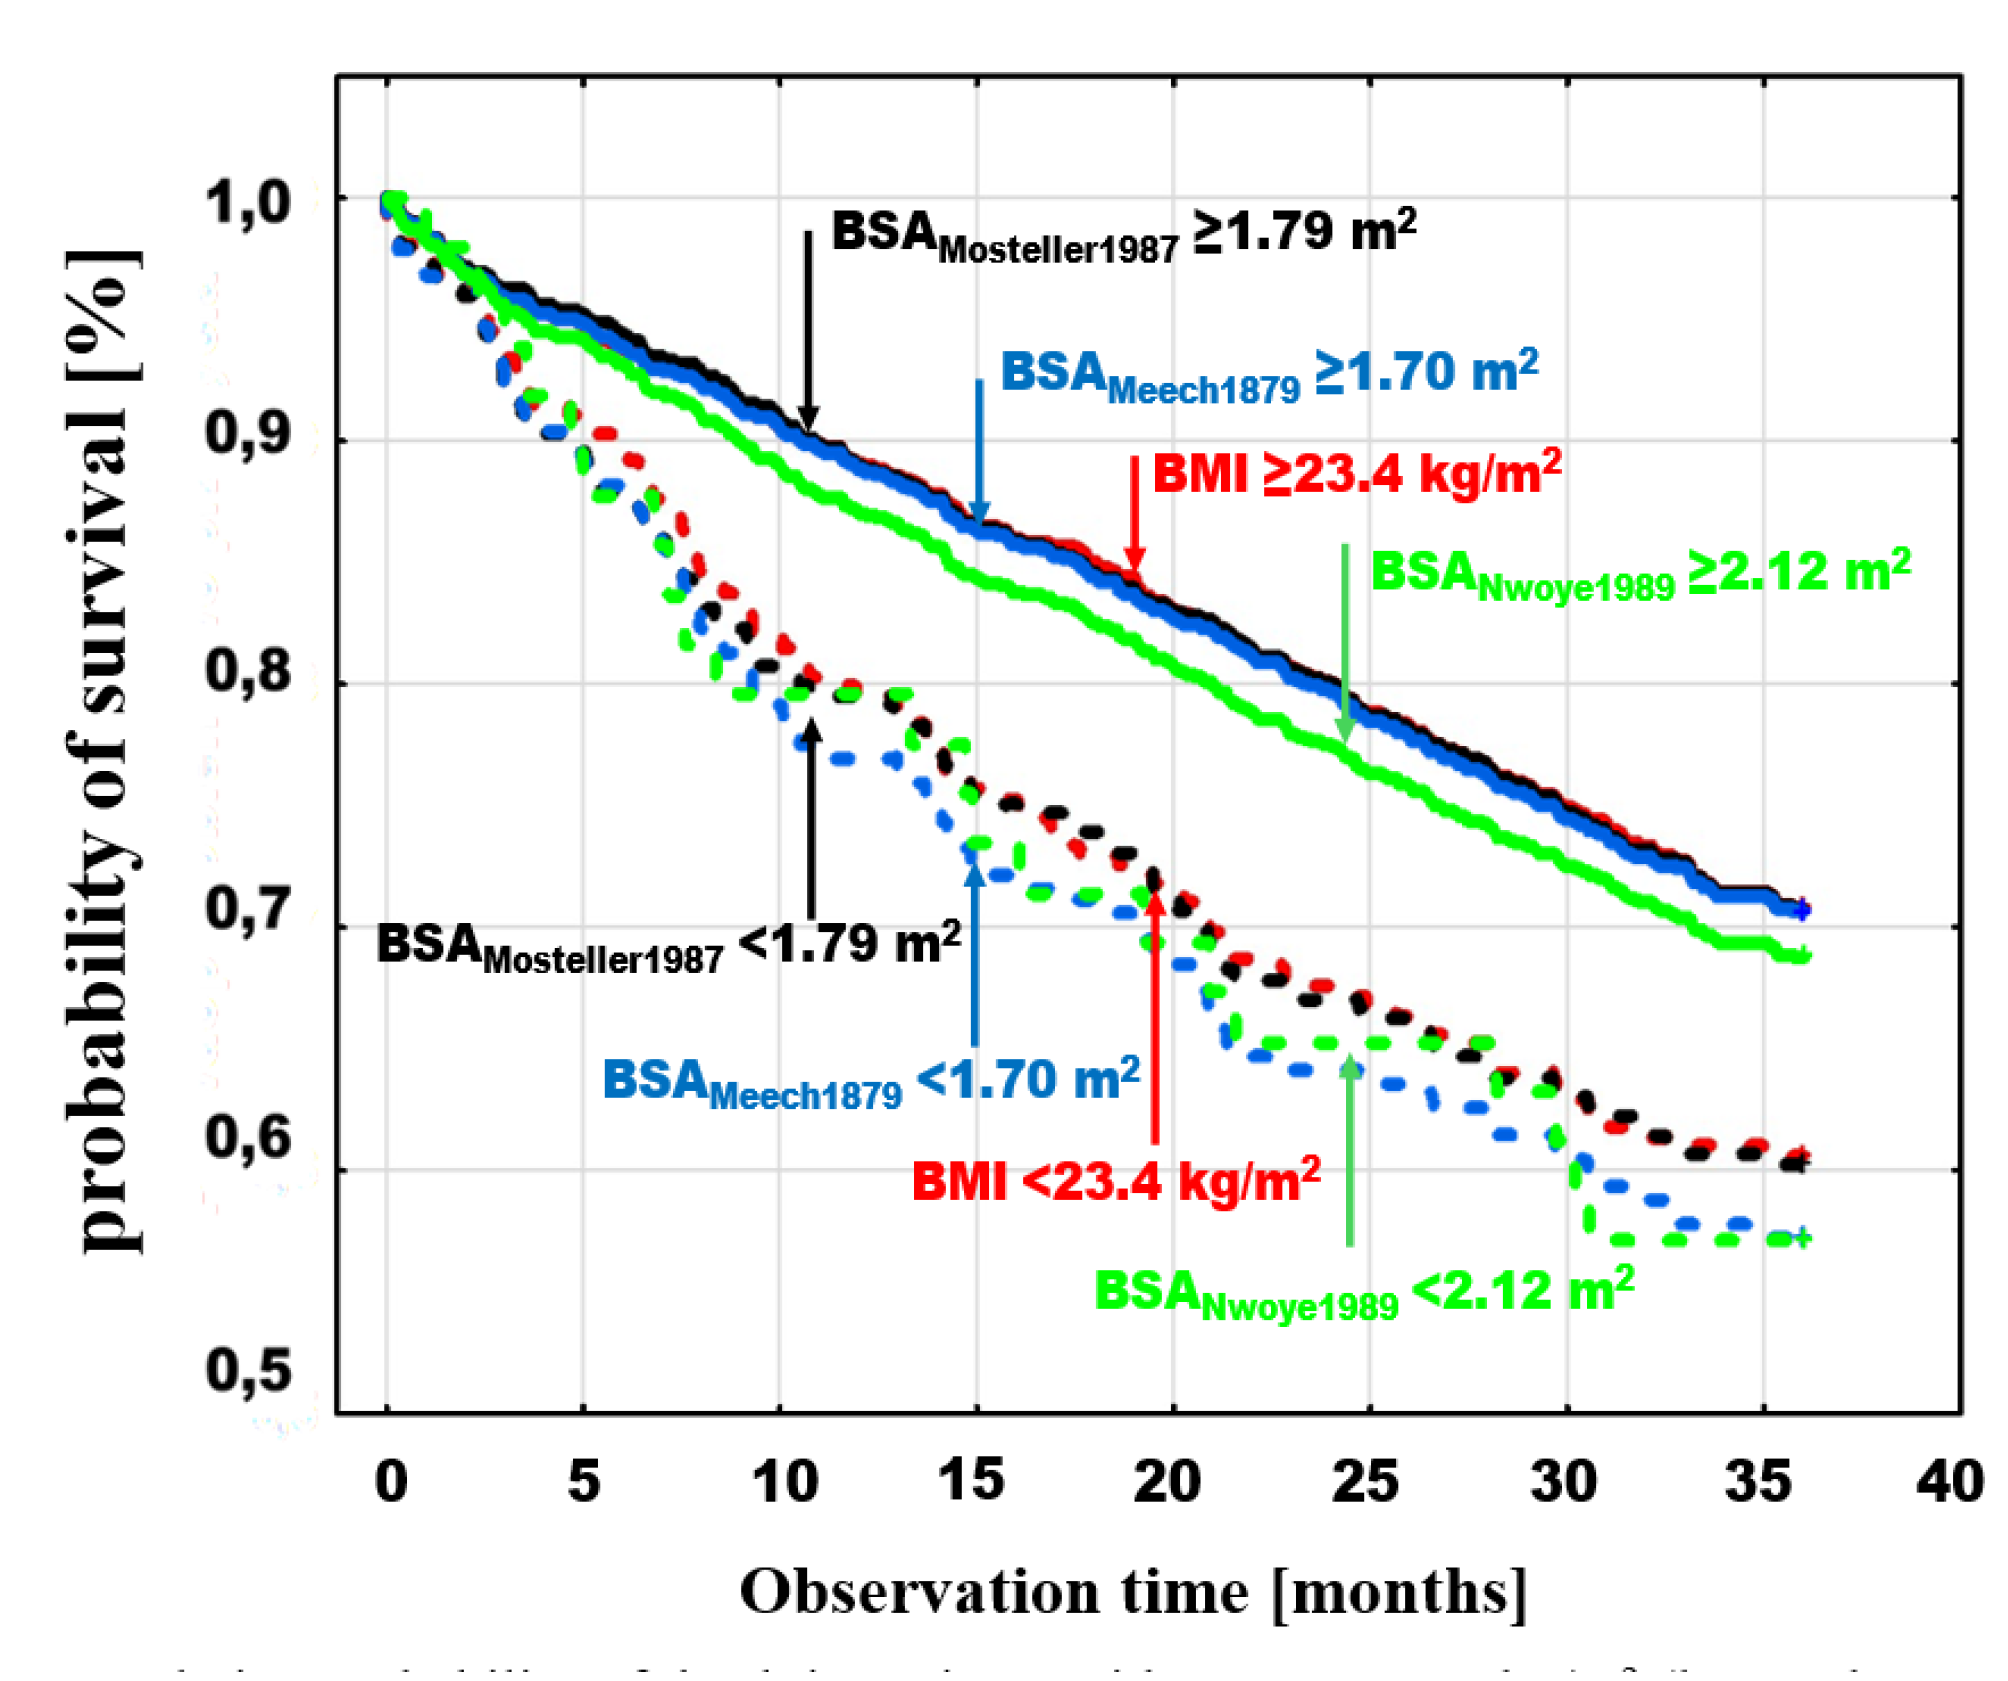
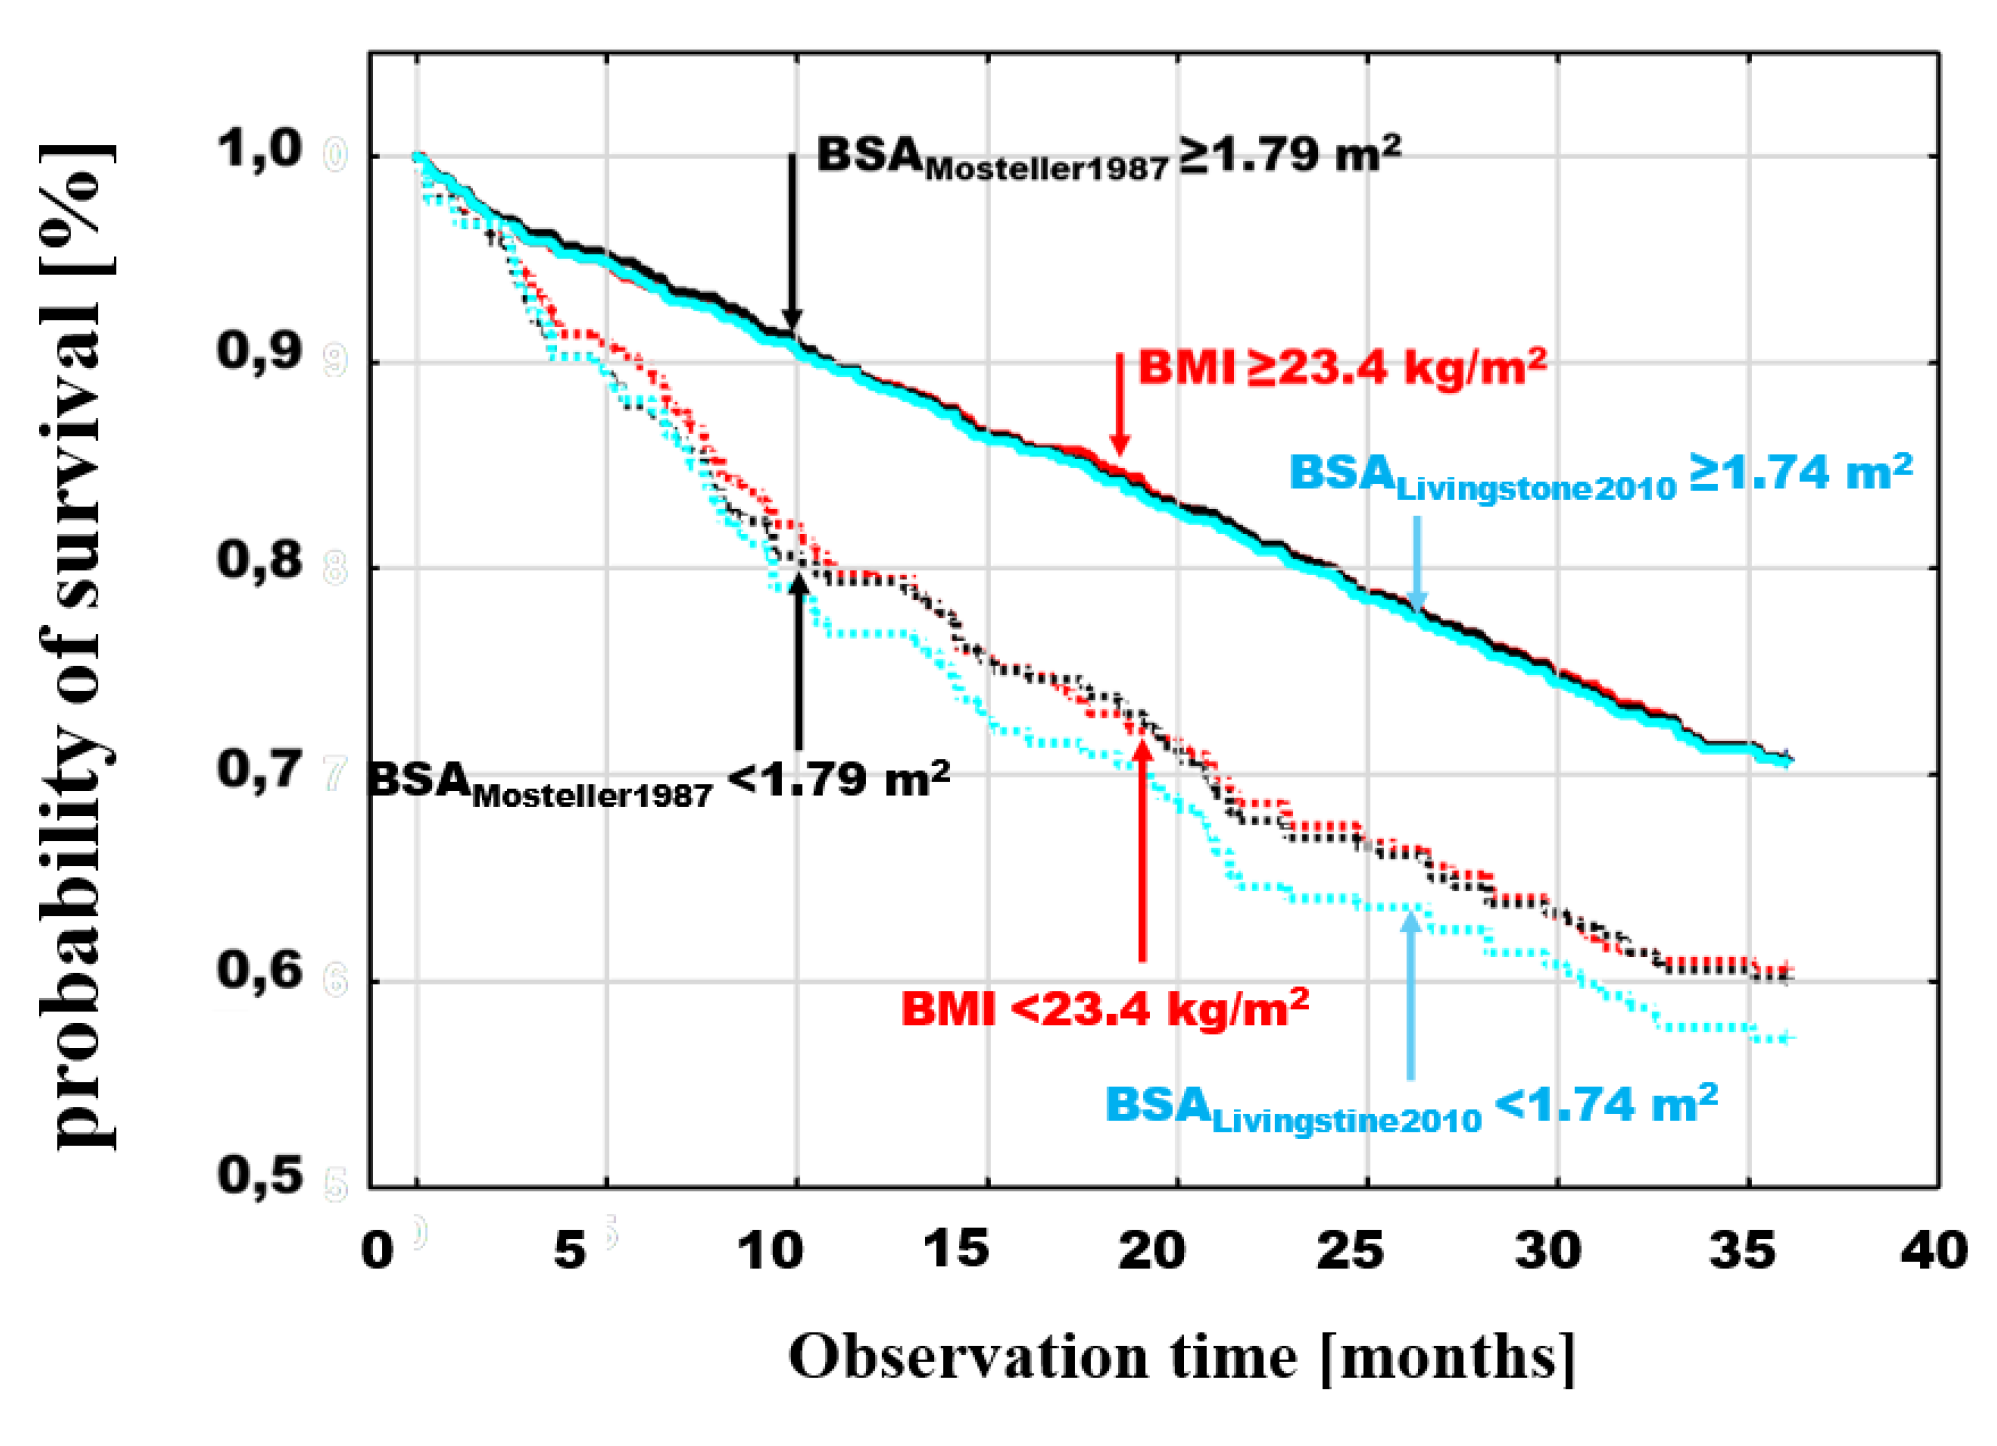
The cumulative probability of survival, analyzed by the Kaplan-Maier method in the BMI and BSA groups defined by dichotomous division according to the optimal discrimination value, showed a higher probability of death in patients with examined parameter values in the lower range. Poorer prognosis for patients in subgroups below these points was observed for both BMI and BSA and in the case of BSA it was independent of the specific estimator used.
The differences between the probabilities of death for values < and ≥ of optimal discrimination were significant for different BSA estimators. Example death probability graphs are presented in
Figure 3, selecting for comparisons BMI with threshold values <23.4≥ kg/m
2, (log-rank p=0.0008), the BSA
Mosteller1987 estimator, which is most frequently used in clinical trials due to its simplicity and validation [
13,
14,
15], with threshold values >1.79 ≥ m
2, (log-rank p=0.0001) as well as two BSA estimators with extreme values of optimal discrimination points; the lowest - BSA
Meeh1879 <1.7≥ m
2 (log-rank p=0.0001) and the highest - BSA
Nwoye1989 >2.12 ≥ m
2 (log-rank p=0.001) (
Figure 3).
A similar comparison was made by adding to BMI and BSAMosteller1987 analysis two estimators with the lowest and highest mortality in the groups of patients with BSA values below the optimal discrimination thresholds for these estimators, BSAMeeh1879 with a threshold of <1.7≥ m2 (log-rank p=0.0001) and BSASchlich2010 with a threshold of <1.84≥ m2 (log-rank p=0.006), respectively.
Figure 4.
Cumulative probability of death in patients with BMI (log-rank p=0.0008) and BSAMosteller1987 (log-rank p=0.0001) with the previously indicated thresholds and with BSA optimal discrimination with the highest mortality in the groups with low BSA values (BSAMeeh1879 <1.7≥ m2 (log-rank p=0.0001) and the lowest mortality (BSASchlich2010) <1.84≥ m2 (log-rank p=0.006).
In the final step, the survival curves for the dichotomous division of BMI and Mosteller with the thresholds indicated above, were compared with the estimator which has the highest relative risk of death revealed in the multivariate analysis (BSA
Livingston&Lee2001) with the dichotomous division < 1.74 ≥ m
2 (log-rank p=0.0001) (
Figure 5). Comparison of these estimators with the thresholds indicated above, shows an overlap of the curves for patients above the respective thresholds (
Figure 5). In contrast to these subgroups, patients with values below the thresholds had different risks. The risk was similar for BMI < 23.4 kg/m
2 and BSA
Mosteller1987 < 1.79 m
2, but lower for patients with BSA
Livingston&Lee2001 < 1.74 m
2.
3.2. Risk of Death - Multivariate Analysis
Multivariate analysis of the relative risk of death for patients with BSA < the optimal discrimination points for individual estimators, relative to patients with BSA ≥ these values, after adjusting for age, gender, and BMI in models, as confounding variables, showed an increased risk of death of 41–80% for most estimators (
Table 1). This effect was independent of age, gender and BMI. For the BSA
Nwoye1989 and BSA
Schlich2010 estimators, values lower than those determined based on the optimal discrimination points of these formulas were not associated with a significantly increased risk.
A unit decrease in BSA was associated with a different change in the risk of death, depending on the estimator. For example, a 0.1 m2 BSA reduction, increased the risk by 3.0% (95%CI: 1.2% – 4.8%) for the BSAMeeh1879 estimator, by 2.2%; (95%CI: 0.6% – 3.9%) for the BSAMosteller1987 estimator, by 3.0%; (95%CI: 1.2% – 4.8%) for the BSALivingston&Lee2001 estimator, and by 2.0%; (95%CI: 0.3% – 3.7%) for the BSADuBois&DuBois1916.
For the most of the estimators, BMI was not a significant predictor of mortality risk in multivariate models. For 5 BSA estimators: BSABreitmann1932, BSASendroy&Cecchini1954, BSAMattar1989, BSANwoye1989 and BSASchlich2010 - BMI turned out to be an independent predictor from BSA, of prognosis in the multivariate analysis. In all of these cases, for each 1 kg/m2 decrease in BMI value, the risk increased by 3–4% (detailed data not presented).
Age and gender were also significant predictors of risk for most of the BSA estimators. For all BSA estimators, the increase in risk for each additional 5 years was approximately 13%. Male gender was associated with a 20–35% higher risk than female gender. In the case of BSATakahira1925, BSAChoi1956, BSANwoye1989 and BSASchlich2010 estimators, gender was not significantly associated with prognosis.
Multivariate analysis revealed that the dichotomous division of BSA into values < and ≥ the BSA optimal discrimination values for different BSA estimators identifies groups of patients with different risk. The highest relative risk after accounting the effects of gender, age and BMI was identified by this method by the BSA
Livingston&Lee2001 estimator, which documented an 80% increase in relative risk (
Table 1). Compared to the most commonly used estimator, BSA
Mosteller1987, the increase in relative risk was 24 percentage points. The lowest relative risk was characterized by the BSA
Sendroy&Cecchini1954, estimator, where the increase in relative risk was 41%; (95%CI:5% - 91%), p=0.02.
3.3. Variability of Parameters after Excluding Estimators Excluded in Multivariate Analysis
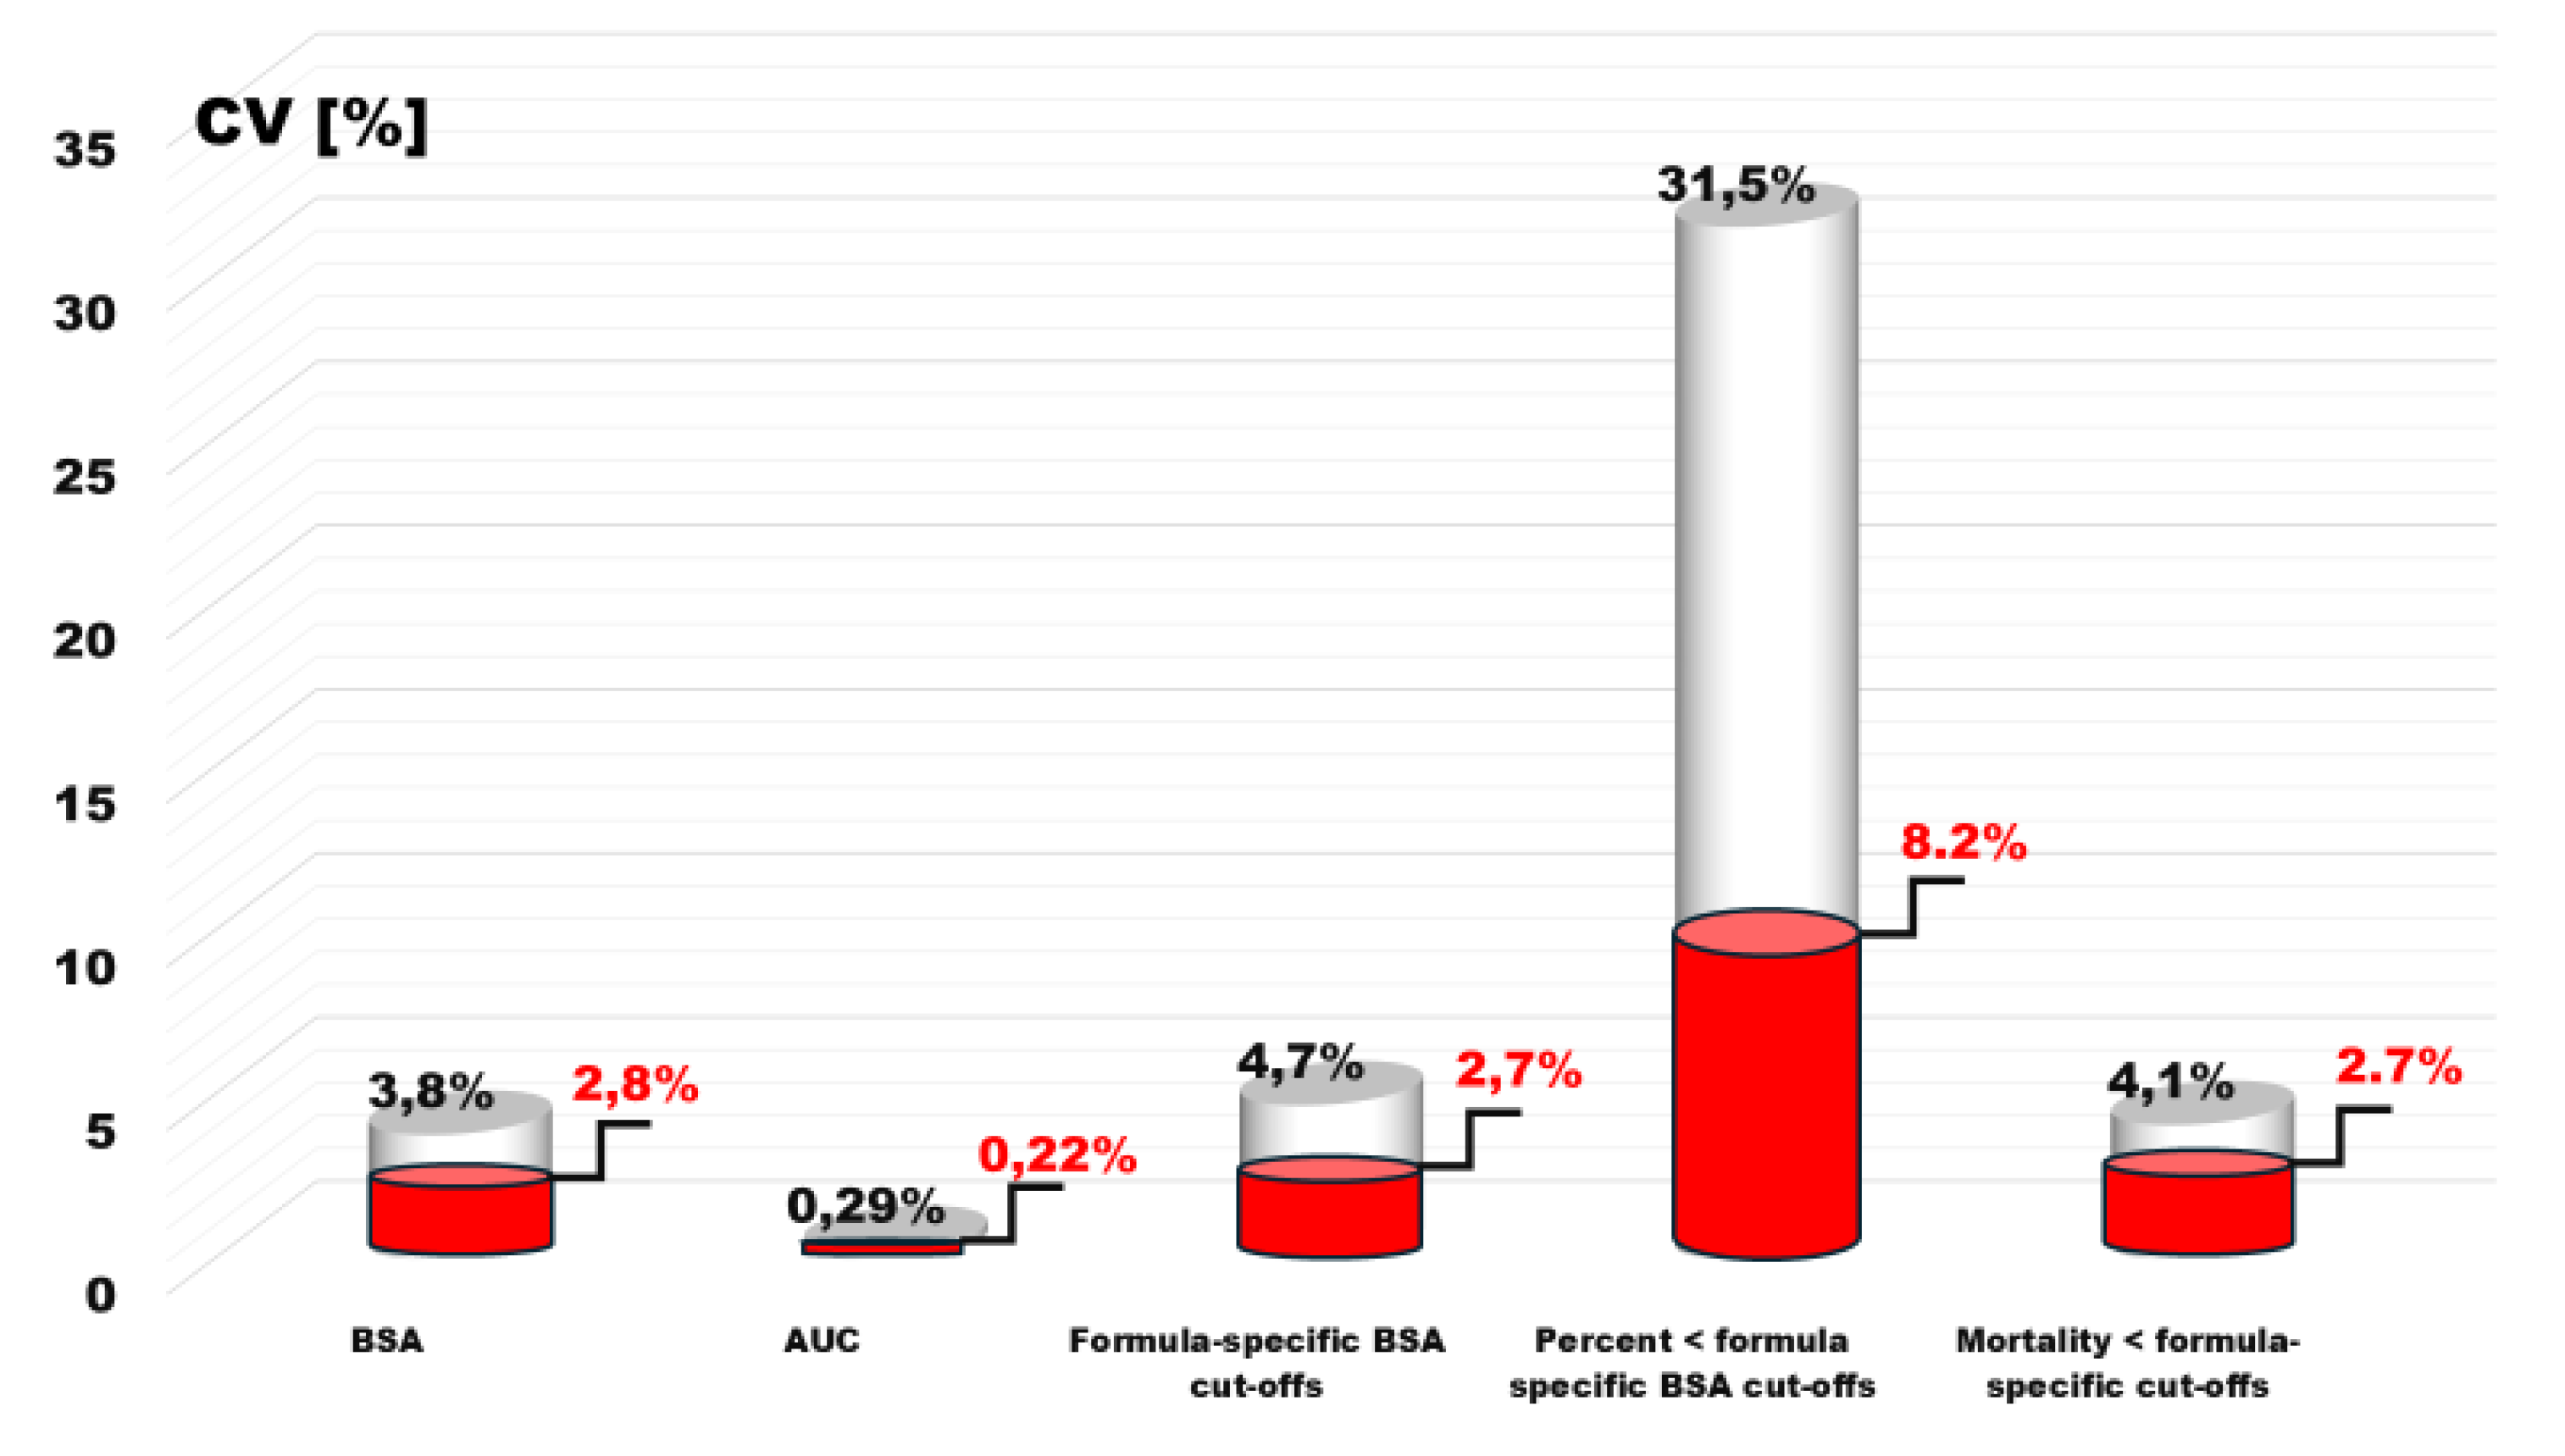
The variability of various parameters of the presented analyses of 25 BSA estimation formulas largely depended on two formulas estimations results, whose results did not provide evidence of a relationship with prognosis. A reanalysis of these formulas revealed significantly different values of the coefficient of variation (CV).
In the case of BSA median variability, it decreased to 2.1%, area under the ROC curve to 0.22% and BSA optimal discrimination values to 2.7%. Similarly, the variability of the ratio of the BSA optimal discrimination to the average BSA value of the used estimator decreased by almost half, to 1.5%.
As a result, there was a radical reduction, 8.2% in the variability of the number of patients with BSA < optimal discrimination threshold and the variability in mortality within these groups to 2.7% (
Figure 6).
3.4. Percentiles and Mortality in Pairs < Formula-Specific Cut-Offs Versus < 1.79m2 BSAMosteller1987 Cut-Off.
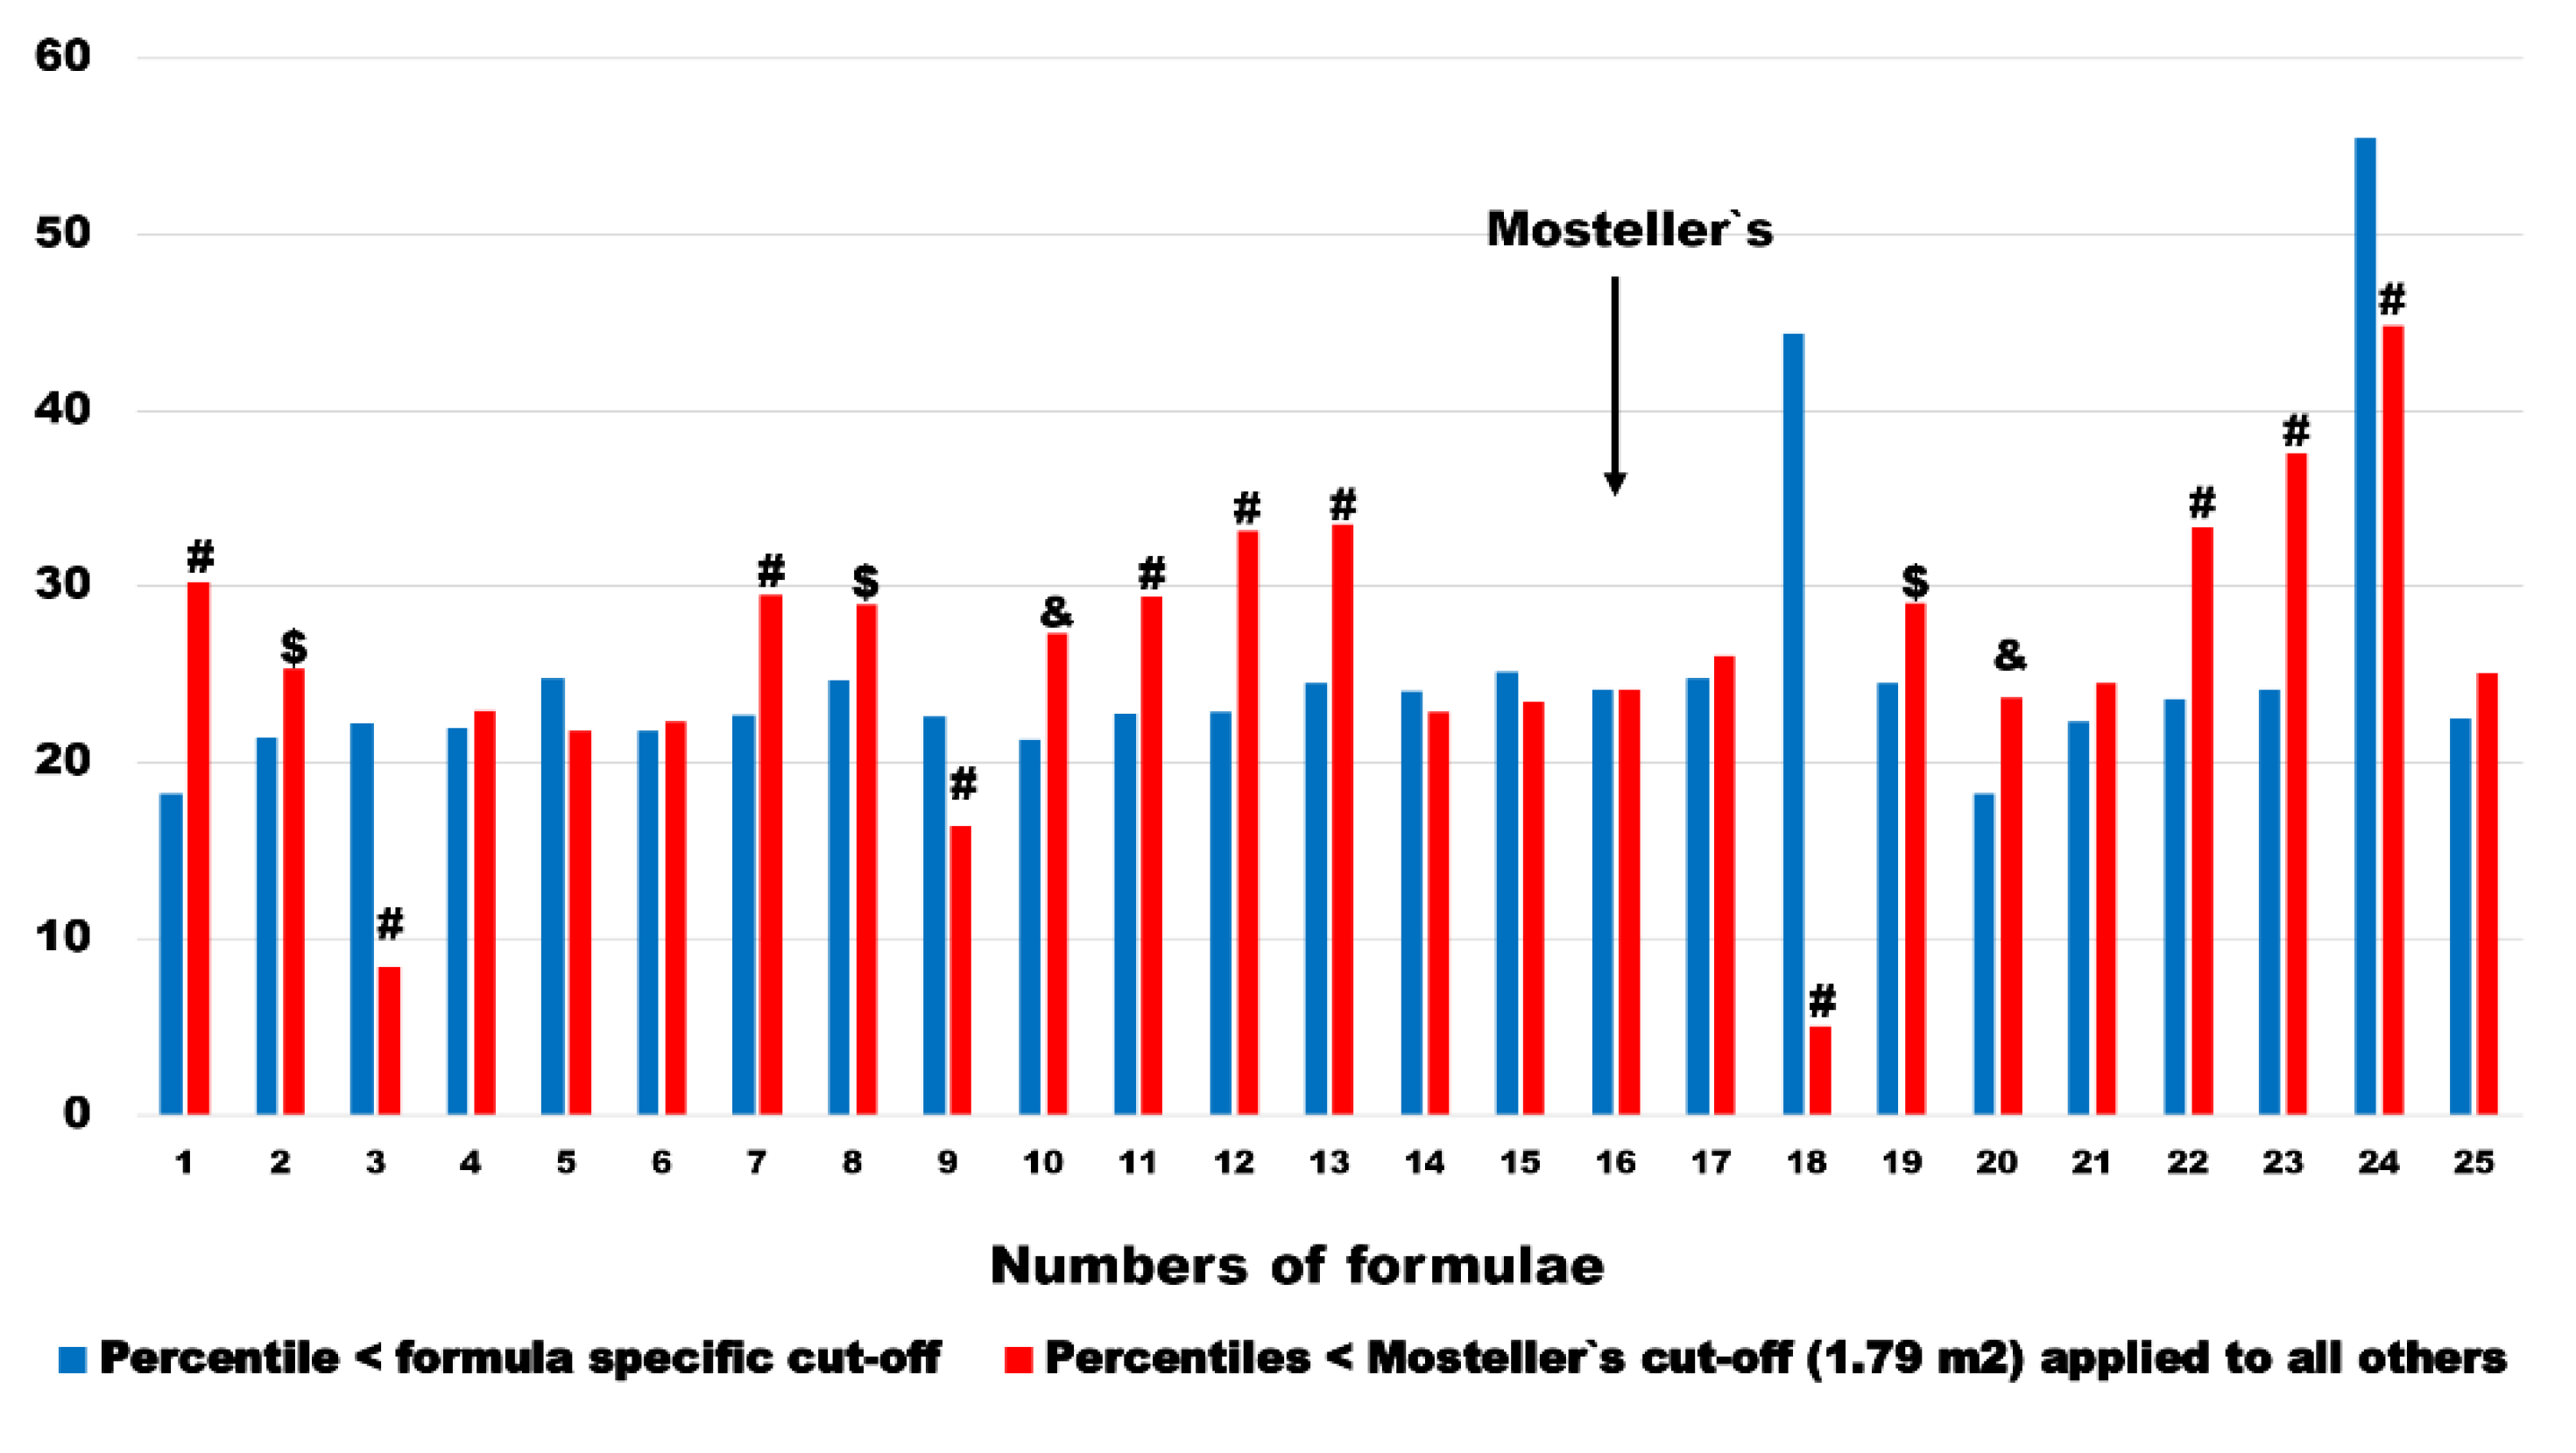
Comparison of patient percentiles in pairs of formula-specific cut-offs and 1.79 m
2 cut-off derived from most recommended BSA
Mosteller1987 formula show huge differences. In 14 out of 24 BSA estimation methods (it was by definition equal in BSA
Mosteller1987) these percentiles were significantly higher when BSA
Mosteller1987 cut-off was applied. In 2 estimators (BSA
Nwoye1989 and BSA
Schlich2010), which were further excluded from multivariable analysis, mentioned percentiles were significantly lower (
Figure 7). In remaining 8 estimators there was no significant difference between pairs. The median change and interquartile range ware 2.5 and 7.9 percentage points, respectively.
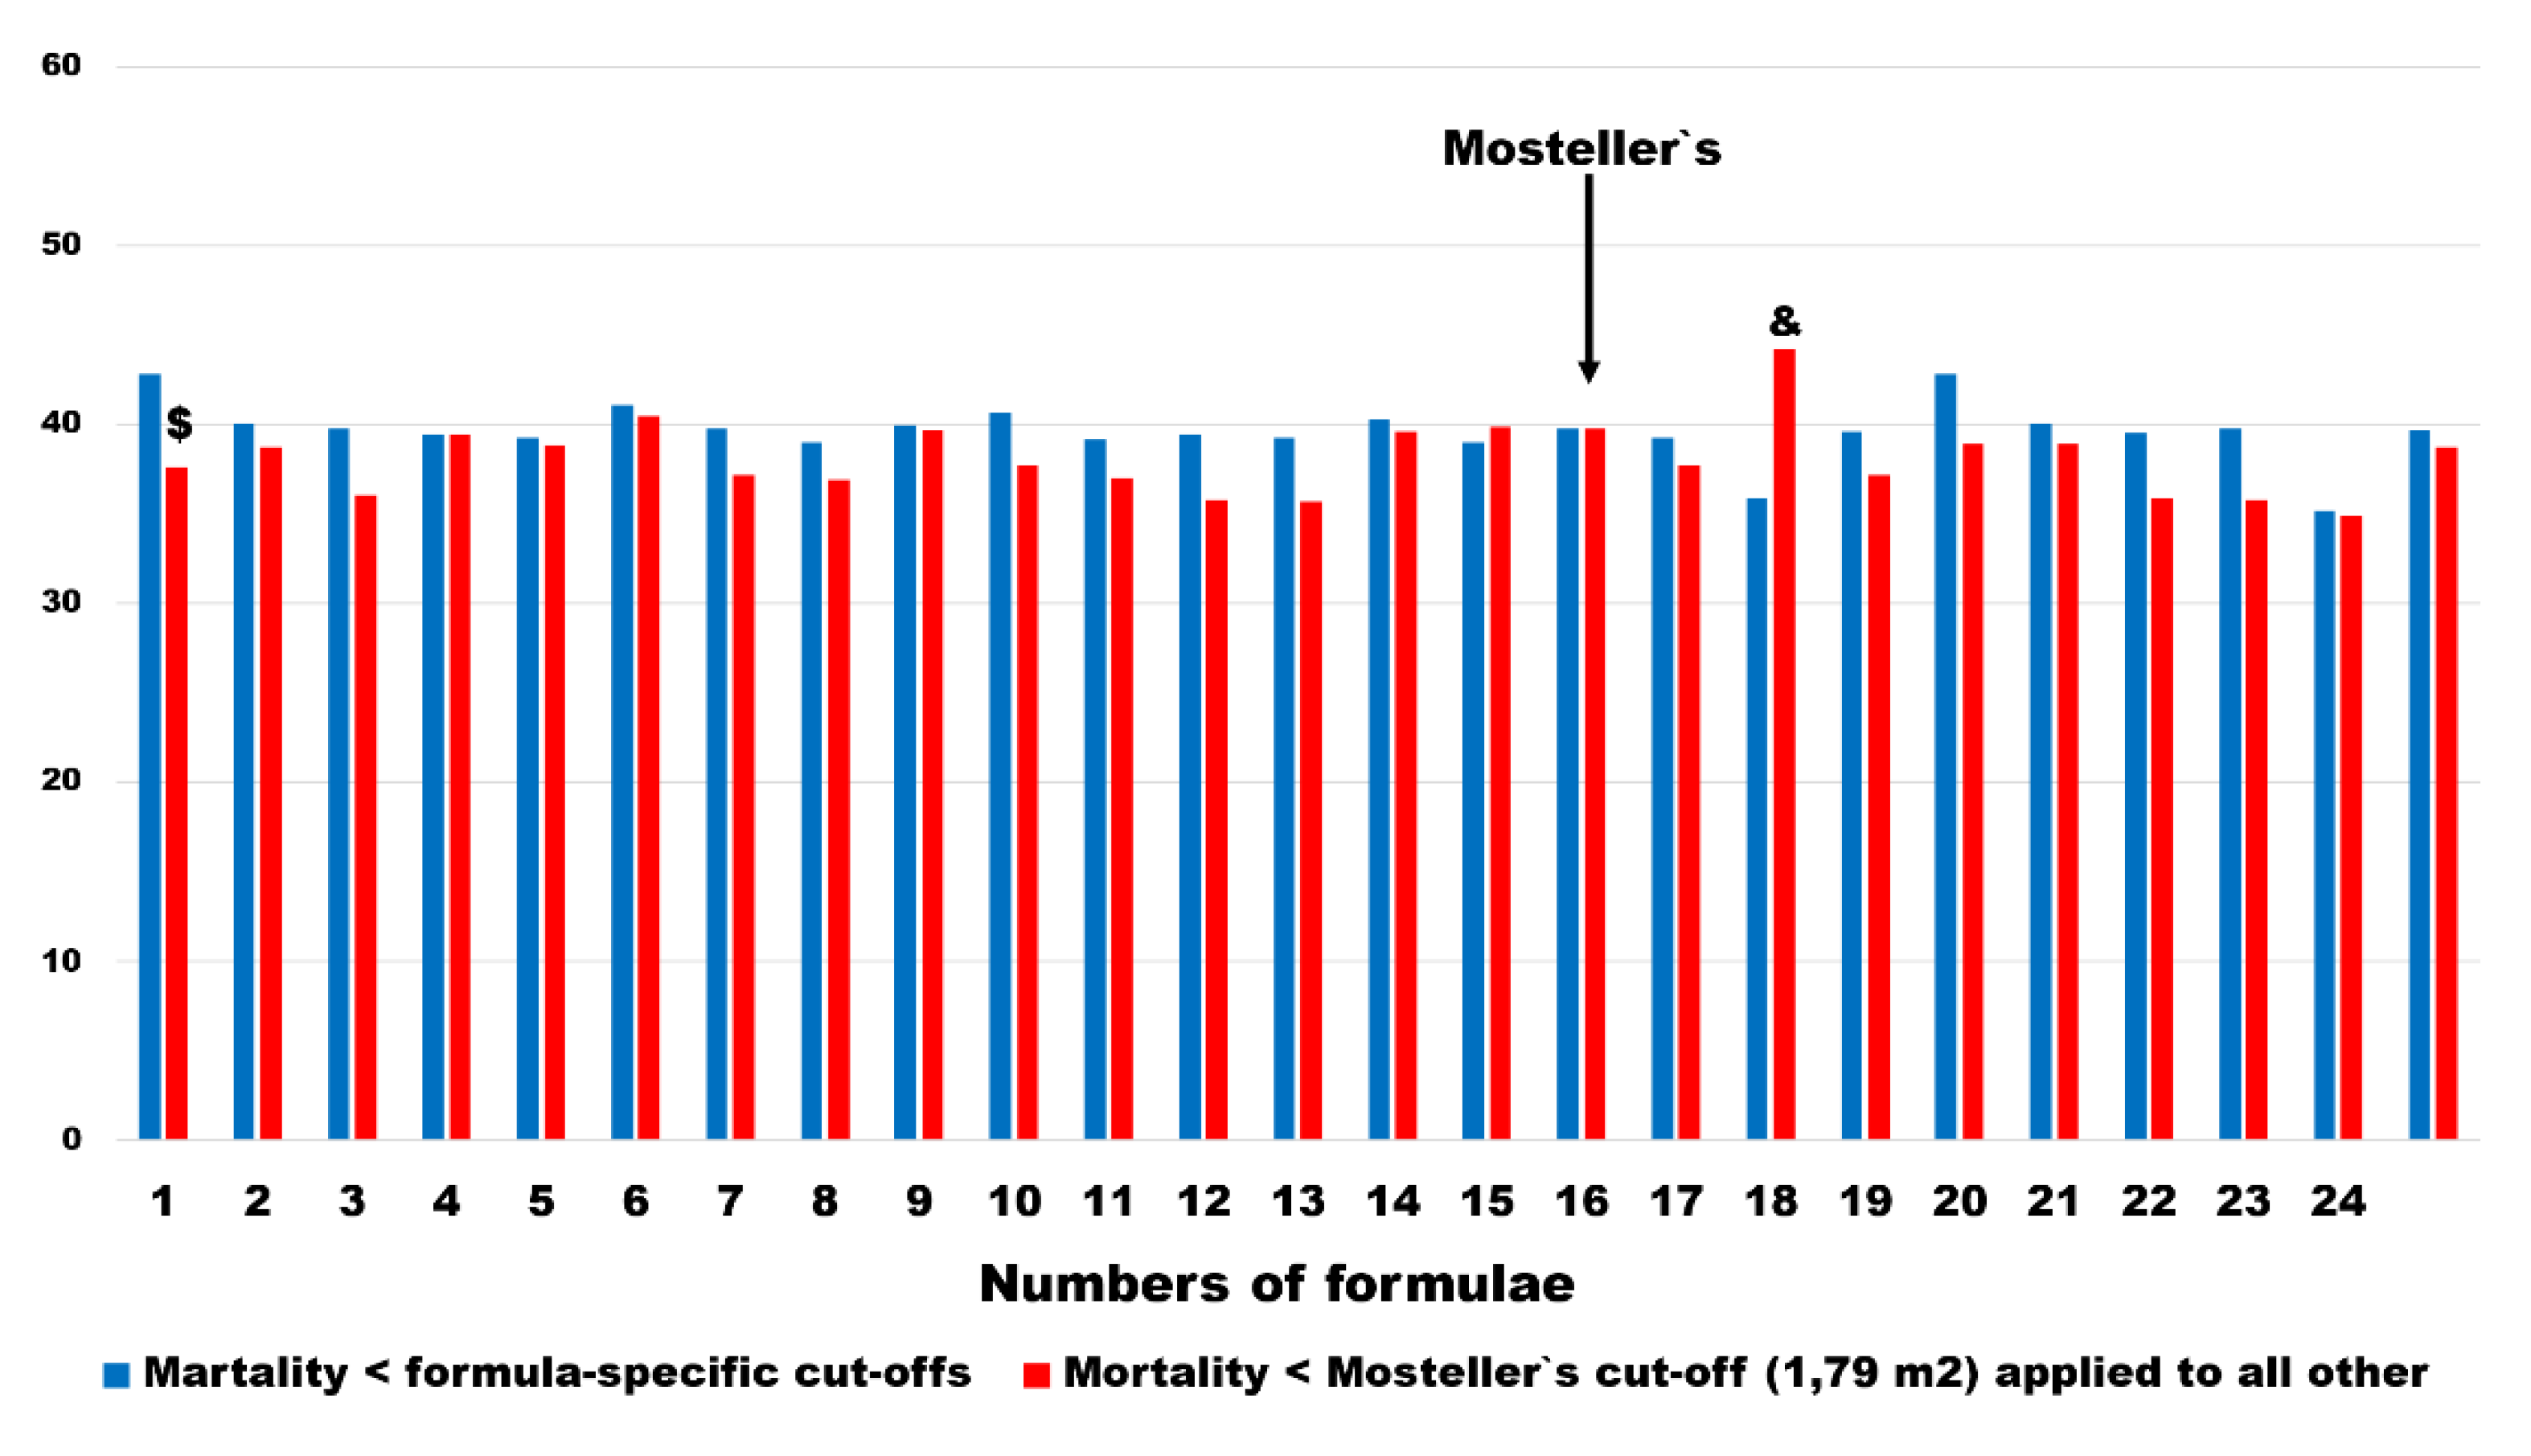
The mortality rates changed less in pairs as defined above. In all, except 1 BSA estimating formulation, mortality rates were lower in subgroups defined as < BSA
Mosteller1987 cut-offs. The difference was statistically significant only in the BSA
Meeh1879. In 1 BSA estimator (BSA
Nwoye1989), which was further excluded from multivariable analysis, the mortality rates in patients with < BSA
Mosteller1987 cut-off was significantly higher (
Figure 8). The median change and interquartile range of mortality risk ware 1.5 and 3.3 percentage points, respectively.
4. Discussion
The phenomenon of better prognosis in overweight or mildly obese as compared to normal weight patients in HF is known as an obesity paradox [
18]. Despite more than 20 years of clinical and scientific research, it`s pathogenesis has remained largely elusive [
19]. Numerous hypotheses have been put forward in order to explain this paradox, but neither has received common acceptance so far. Among possible reasons for this failure, the use of inadequate obesity indices as a measure of risk has been recently suggested [
20].
In spite of widely known limitations of BMI in most studies this anthropometric measure is still used for categorization of body weight [
4]. BSA is believed to overcome some obstacles linked to BMI. It may potentially better account for body composition variation and be more sensitive to central fat redistribution, because the higher muscle mass occupies less volume compared to the same mass of fat tissue. Hence, increase of muscle mass impacts BMI more than BSA and reverse, the increase of fat tissue affects more BSA than BMI. Study shows that BSA is more closely than BMI correlated with numerous physiological parameters, is successfully used for their indexing, and finally BSA is linked to clinical outcome in HF [
21].
In practice BSA is not measured, but estimated by formulas. So far, at least 25 different formulations were published [
2]. The Mosteller formula published in 1987 [
17] has been used in studies of obesity paradox in HF and found the association between lower BSA and worse clinical outcomes, not exceeding that noticed in case of lower BMI [
13,
14]. The Mosteller formula was validated with other formulas only in terms of concordance on BSA estimation [
22]. However, even perfect concordance in BSA estimation between formulas does not guarantee the same effects on prognosis. In each BSA estimating formula the use of specific coefficients to adjust for height and weight the key determinant of BSA [
23], may cause different representation of central versus peripheral components of the body in final BSA estimation. So far, no study has directly compared prognostic performance of different BSA formulation in HF. Further, it is also unclear whether clinical outcome is more strongly correlated with BSA itself or with structure of formulas, for example promoting bigger representation of health protecting peripheral portions of the body.
Our study shows clinically meaningful discordance between certain formulations in estimation of BSA among patients with HF. The extreme discordance found between BSANwoye1989 and BSASchlich2010 was as high as 0.34 m2. Both of these formulas were further found to provide BSA estimation without significant association with mortality. Their exclusion decreased extreme difference between BSAFaber&Melcher1921 and BSAMosteller1987 to 0.25 m2. Based on published data in HF and BSA estimation using Mosteller`s method, this difference would be associated with 25% risk difference. Our BSA data derived from both Mosteller`s or Faber & Melcher`s assessment suggests that 0,25 m2 lower BSA would increase the risk by only 6%; (95%CI: 2% - 10%), p=0.006, in case of BSA estimation by Mosteller`s algorithm and 7%; (95%CI: 1% - 9%), p=0.02, when we used Faber & Melcher formula (data not shown).
Our much lower figures of risk as compared to Zafrir et al. [
14] may be at least partly explained by adjustment for BMI in our study but not in Zafrir et al. Additionally, unlike in Zafrir`s study we did not account for clinical parameters in our adjusted analysis. Finally, the follow up of these studies were different, 1 year in Zafrir`s and 3 years in ours.
Lower BSA estimated by Mosteller`s method showed significantly worse prognosis not only in patients with HF. A similar association has recently been demonstrated in acute kidney disease [
15] in patients with peripheral arterial disease [
16], but not in elderly patients after transcatheter aortic valve implantation [
24]. In all of these studies, groups were constructed by dividing the cohort into tertiles or quartiles, without identification of optimal cut-offs. In doing so, authors found that < 1.67 m
2 in female, <1.93 m
2 in male in acute kidney diseases [
15] and < 1.70 m
2 in peripheral arterial diseases [
16] were associated with a significantly elevated risk of all-cause mortality. The BSA cut-offs set at bottom quartile or tertile represents, on average, 25% - 30% of patients who remain in higher risk BSA spectrum. Our finding of BSA
Mosteller1987 = 1.79 m
2 as optimally separating higher from lower risk, left 24.2% in the higher risk area, which is quite similar to previously published data.
Our study is novel, in that, in neither of previous studies alternative BSA formulations were tested for correlation with prognosis, nor optimal cut-off for mortality were identified. Our study is the first to show predictive performance of all 25 available BSA formulations in comparison to BMI in in the same cohort of patients with HF.
Based on Receiver Operating Characteristics we observed striking differences in formula-specific cut-offs. The mean value of all 25 formula-specific cut-offs was 1.79 ± 0.08 m
2. However, after excluding 2 formulas, as mentioned above, the mean cut-off decreased to 1.77 ± 0.05 m
2. The value of certain cut-offs is important, but it is also crucial to consider where the cutoff point falls within the entire BSA range defined by a given formula, and therefore how many patients remain in higher risk areas. In our study of 25 formulas, the average percentile of patients within higher risk BSA levels was 25% ± 8%. After excluding the 2 formulas, the figure dropped down to 22.8% ± 1.8%, (data not shown). Another novelty of our work is the estimation of formula-specific, age, gender and, for the first time in literature, for BMI adjusted relative risk of death in 3-year follow-up. These analyses provided evidence for lack of interchangeability of available BSA formulas when used for prognostication. In case of two BSA estimators adjustment for age, gender and BMI completely disrupted association between lower BSA and the risk of death. The data of these estimators were excluded from all analyses. In all except 5 BSA estimators (BSA
Breitmann1932, BSA
Sendroy&Cechhini1954, BSA
Mattar1989, BSA
Nwoye1989, BSA
Schlich2010) lower BMI remained independent of BSA predictor of mortality. With exception of 4 BSA formulas (BSA
Takahira1925, BSA
Choi1956, BSA
Nwoye1989, BSA
Schlich2010) gender was significant predictor of death independently of BSA. All these findings suggest high complexity in the interaction between weight, height and gender – likely due to differences in body composition, which are differently reflected in BSA formulas. Such a complexity can be noticed in population of elderly patients with polymorbidity who underwent transcatheter aortic valve implantation. In such patients, BSA did not predict mortality and BMI did it only in short follow-up [
24].
Our data also suggested that the use of BSA formulation published by Livingston & Lee [
25] would help in identification of patients with highest risk related to low BSA. The Kaplan-Meier curves of subgroups dichotomized according to optimal cut-offs from BSA
Livingston&Lee2001, BSA
Mosteller1987 and BMI showed overlapping risk profiles in the subgroups above formula-specific cut-offs and diverging risk profiles in the subgroups bellow respective cut-offs. The Livingston`s formula identified the highest-risk population without any trade-off effects in the lower risk group.
The mortality risk was relatively constant across lower BSA levels as identified by formula-specific respective cut-offs. If we consider the fact that in 2 BSA estimators with lowest mortality (BSANwoye1989, and BSASchlich2010), multivariable analysis denied the significant prognostic role of BSA bellow formula-specific cut-offs, then in remaining 23 formulas low BSA groups mortality varied between 39% and 42.8%. This 3.8% mortality risk change occurred when formula-specific cut-offs differed by 0.23 m2, from 1.70 m2 to 1.93 m2. However, this difference occurred between cut-offs of different BSA estimators. Yet, the increase of adjusted risk by 2 - 3% per 0.1 m² decrease in BSA, as shown for BSA changes assessed by the same formula cannot explain whether this mortality difference reflected inherent features of BSA formulations or was a consequence of lower BSA. The huge variation of number of patients with subgroups identified based on different formula-specific cut-offs may speak in favor of the former explanation.
5. Conclusions
In conclusion, our study has shown relatively good concordance of 25 BSA estimators in BSA assessment in patients, without extremes of weight or height known to disrupt concordance. Further, all BSA estimators presented significant, although weak, ability to discriminate death from alive in 3-year follow-up. The formula-specific cut-offs identified based on ROC analysis allowed separation of patients with higher, but relatively similar across different BSA formulas risk of death. However, similar risk of death was in formula-specific manner identified in highly variable fractions of patients. The higher risk of death in smaller patients as shown by BSA was independent of BMI in all but 2 BSA estimators. We found no justification for preferring BSAMosteller1987 formula to study risk associated with smaller body size. The BSALivingston&Lee2001 estimator may offer probably better diagnostic performance.
5.1. Practical Relevance
Our findings may serve as a useful reference to clinicians searching for the best formula in the obesity paradox study.
5.2. Study Limitation
The main limitation of our study was joint analysis of both female and male groups due to small number of females in whole cohort. We attempted to correct this by adjusting for difference of female in multivariable analysis.
Author Contributions
Conceptualization, M.P. and P.R.; methodology, M.Górski.; software, J.G.; validation, M.C., J.U.N. and J.N.; formal analysis, M.P., M.B., P.R.; investigation, A.S., M. Górski; resources, A.S.; data curation, J.G.; writing—original draft preparation, M.P.; writing—review and editing, M.B.,J.N., J.U.N.; visualization, M.C., J.M.-B., M.Gąsior; supervision, P.R., M.Gąsior.; project administration, J.M.-B.; funding acquisition, M.P. All authors have read and agreed to the published version of the manuscript.
Funding
This research was funded by subsidy Young Scientist Medical University of Silesia number PCN-2-052/N/1/Z.
Institutional Review Board Statement
The study was conducted in accordance with the Declaration of Helsinki and approved by the Ethical Committee of Medical University of Silesia in Katowice (NN-6501-12/I/04).
Informed Consent Statement
Informed consent was obtained from all subjects involved in the study.
Data Availability Statement
Data is unavailable due to privacy.
Acknowledgments
Not applicable.
Conflicts of Interest
The authors declare no conflicts of interest. The funders had no role in the design of the study; in the collection, analyses, or interpretation of data; in the writing of the manuscript; or in the decision to publish the results.
References
- Bartol, K.; Bojanić, D.; Petković, T.; Pribanić, T. A Review of Body Measurement Using 3D Scanning. IEEE Access 2021. 9: 67281-67301. [CrossRef]
- Redlarski, G.; Palkowski, A.; Krawczuk, M. Body surface area formulae: an alarming ambiguity. Sci Rep 2016. 6: 27966. [CrossRef] [PubMed]
- Eknoyan, G. Adolphe Quetelet (1796–1874)—the average man and indices of obesity. Nephrology Dialysis Transplantation 2007. 23(1): 47-51. [CrossRef] [PubMed]
- Wu, Y.; Li, D.; Vermund, S.H. Advantages and Limitations of the Body Mass Index (BMI) to Assess Adult Obesity. International Journal of Environmental Research and Public Health 2024. 21(6): 757. [CrossRef] [PubMed]
- Zanforlini, B.M.; Alessi, A.; Pontarin, A.; De Rui, M.; Zoccarato F.; Seccia D.M.; Trevisan C.; Brunello, A.; Basso, U.; Manzato, E.; Sergi G. Association of body surface area with fat mass, free fat mass and total weight in healthy individuals, and implications for the dosage of cytotoxic drugs. Clinical Nutrition ESPEN 2021. 43: 471-477. [CrossRef] [PubMed]
- Arsos, G.; Sachpekidis, C.; Tsechelidis, I.; Katsampoukas, D.; Manou, E.; Tsakiris, D.; Karatzas, N. Glomerular filtration rate (GFR) normalization by body surface area (BSA) or extracellular fluid volume (ECV): Importance in relation to sex in adult patients with reduced kidney function. Journal of Nuclear Medicine 2013. 54(supplement 2): 2038-2038.
- Eriksen-Volnes, T.; Grue, J.F.; Hellum Olaisen, S.; Letnes, J.M.; Nes, B.; Løvstakken, L.; Wisløff, U.; Dalen H. Normalized Echocardiographic Values From Guideline-Directed Dedicated Views for Cardiac Dimensions and Left Ventricular Function. JACC: Cardiovascular Imaging 2023. 16(12): 1501-1515. [CrossRef] [PubMed]
- Kim, S.H. Normalization of Cardiac Measurements: Isometric vs. Allometric Method. J Cardiovasc Imaging 2020. 28(1): 18-20. [CrossRef] [PubMed]
- Vauthey, J.N.; Abdalla, E.K.; Doherty, D.A.; Gertsch, P.; Fenstermacher, M.J.; Loyer, E.M.; Lerut, J.; Materne, R.; Wang X.; Encarnacion, A. et al., Body surface area and body weight predict total liver volume in Western adults. Liver Transpl 2002. 8(3): 233-40. [CrossRef] [PubMed]
- Mance, M.; Prutki, M.; Dujmovic, A.; Miloševic, M.; Vrbanovic-Mijatovic, V.; Mijatovic, D. Changes in total body surface area and the distribution of skin surfaces in relation to body mass index. Burns 2020. 46(4): 868-875. [CrossRef] [PubMed]
- Baker, S.D.; Verweij, J.; Rowinsky, E.K.; Donehower, R.C.; Schellens, J.H.; Grochow, L.B.; Sparreboom, A. Role of Body Surface Area in Dosing of Investigational Anticancer Agents in Adults, 1991–2001. JNCI: Journal of the National Cancer Institute 2002. 94(24): 1883-1888. [CrossRef] [PubMed]
- Bartelink, I.H.; Rademaker, C.M.; Schobben, A.F.; van den Anker, J.N. Guidelines on paediatric dosing on the basis of developmental physiology and pharmacokinetic considerations. Clin Pharmacokinet. 2006. 45(11): 1077-1097. [CrossRef] [PubMed]
- Zafrir, B.; Goren, Y.; Salman, N.; Amir, O. Comparison of body mass index and body surface area as outcome predictors in patients with systolic heart failure. Cardiol J 2015. 22(4): 375-81. [CrossRef] [PubMed]
- Zafrir, B.; Salman, N.; Crespo-Leiro, M.G.; Anker, S.D.; Coats, A.J.; Ferrari, R.; Filippatos, G.; Maggioni, A.P.; Mebazaa, A.; Piepoli, M.F. et al. Body surface area as a prognostic marker in chronic heart failure patients: results from the Heart Failure Registry of the Heart Failure Association of the European Society of Cardiology. European Journal of Heart Failure 2016. 18(7): 859-868. [CrossRef]
- Lin, S.; Yang, X. Body surface area is a predictor of 90-day all-cause mortality in critically ill patients with acute kidney injury. Injury 2024. 55(6): 111544. 2024.
- Zhong, Q.; Yunus, R.A.; Sohail, M.; Saeed, S.; Rehman, T.A.; Khan, A.A.; Russ, E.; Schermerhorn, M.; Mahmood, F.; Matyal, R. Association of Body Surface Area Versus Body Mass Index on Outcomes in Peripheral Arterial Disease. Ann Vasc Surg 2024. [CrossRef]
- Mosteller, R.D. Simplified calculation of body-surface area. N Engl J Med 1987. 317(17): 1098. [CrossRef] [PubMed]
- Horwich, T.B.; Fonarow, G.C.; Hamilton, M.A.; MacLellan, W.R.; Woo, M.A.; Tillisch, J.H. The relationship between obesity and mortality in patients with heart failure. Journal of the American College of Cardiology 2001. 38(3): 789-795. [CrossRef] [PubMed]
- Alebna, P.L.; Mehta, A.; Yehya, A.; da Silva-de Abreu, A.; Lavie, C.J.; Carbone, S. Update on obesity, the obesity paradox, and obesity management in heart failure. Prog Cardiovasc Dis 2024. 82: 34-42. [CrossRef]
- Butt, J.H.; Thune, J.J.; Nielsen, J.C.; Haarbo, J.; Videbæk, L.; Gustafsson, F.; Kristensen, S.L.; Bruun, N.E.; Eiskjær, H.; Brandes, A. et al. Anthropometric measures and long-term mortality in non-ischaemic heart failure with reduced ejection fraction: Questioning the obesity paradox. Eur J Heart Fail 2024. [CrossRef]
- Ristow, B.; Ali, S.; Na, B.; Turakhia, M.P.; Whooley, M.A.; Schiller, N.B. Predicting heart failure hospitalization and mortality by quantitative echocardiography: is body surface area the indexing method of choice? The Heart and Soul Study. J Am Soc Echocardiogr 2010. 23(4): 406-13. [CrossRef]
- Verbraecken, J.; Van de Heyning, P.; De Backer, W.; Van Gaal, L. Body surface area in normal-weight, overweight, and obese adults. A comparison study. Metabolism 2006. 55(4): 515-24. [CrossRef]
- Sendroy, J.; Cecchini, L.P. Determination of Human Body Surface Area From Height and Weight. Journal of Applied Physiology 1954. 7(1): 1-12. [CrossRef]
- Arsalan, M.; Filardo, G.; Kim, W.K.; Squiers, J.J.; Pollock, B.; Liebetrau, C.; Blumenstein, J.; Kempfert, J.; Van Linden, A.; Arsalan-Werner, A. et al. Prognostic value of body mass index and body surface area on clinical outcomes after transcatheter aortic valve implantation. Clin Res Cardiol 2016. 105(12): 1042-1048. [CrossRef]
- Livingston, E.H.; Lee S. Body surface area prediction in normal-weight and obese patients. Am J Physiol Endocrinol Metab 2001. 281(3), E586-E591. [CrossRef]
|
Disclaimer/Publisher’s Note: The statements, opinions and data contained in all publications are solely those of the individual author(s) and contributor(s) and not of MDPI and/or the editor(s). MDPI and/or the editor(s) disclaim responsibility for any injury to people or property resulting from any ideas, methods, instructions or products referred to in the content. |
© 2024 by the authors. Licensee MDPI, Basel, Switzerland. This article is an open access article distributed under the terms and conditions of the Creative Commons Attribution (CC BY) license (http://creativecommons.org/licenses/by/4.0/).
