Submitted:
09 October 2024
Posted:
09 October 2024
You are already at the latest version
Abstract
Keywords:
1. Introduction
2. Related Work
2.1. Research of Cryptocurrency Market Trend
3. Cryptocurrency Market Trend Assessment Strategy
3.1. Methodology
3.2. Prediction Model Construction
3.3. Data Preparation and Preprocessing
| Date | Open | High | Low | Close | Adj Close | Volume | |
| 0 | 2015/9/13 | 235.242004 | 235.934998 | 229.332001 | 230.511993 | 230.511993 | 18478800 |
| 1 | 2015/9/14 | 230.608994 | 232.440002 | 227.960999 | 230.643997 | 230.643997 | 20997800 |
| 2 | 2015/9/15 | 230.492004 | 259.182007 | 229.822006 | 230.304001 | 230.304001 | 19177800 |
| 3 | 2015/9/16 | 230.25 | 231.214996 | 227.401993 | 229.091003 | 229.091003 | 20144200 |
| 4 | 2015/9/17 | 229.076004 | 230.285004 | 228.925995 | 229.809998 | 229.809998 | 18935400 |
3.4. LSTM Model Construction and Training


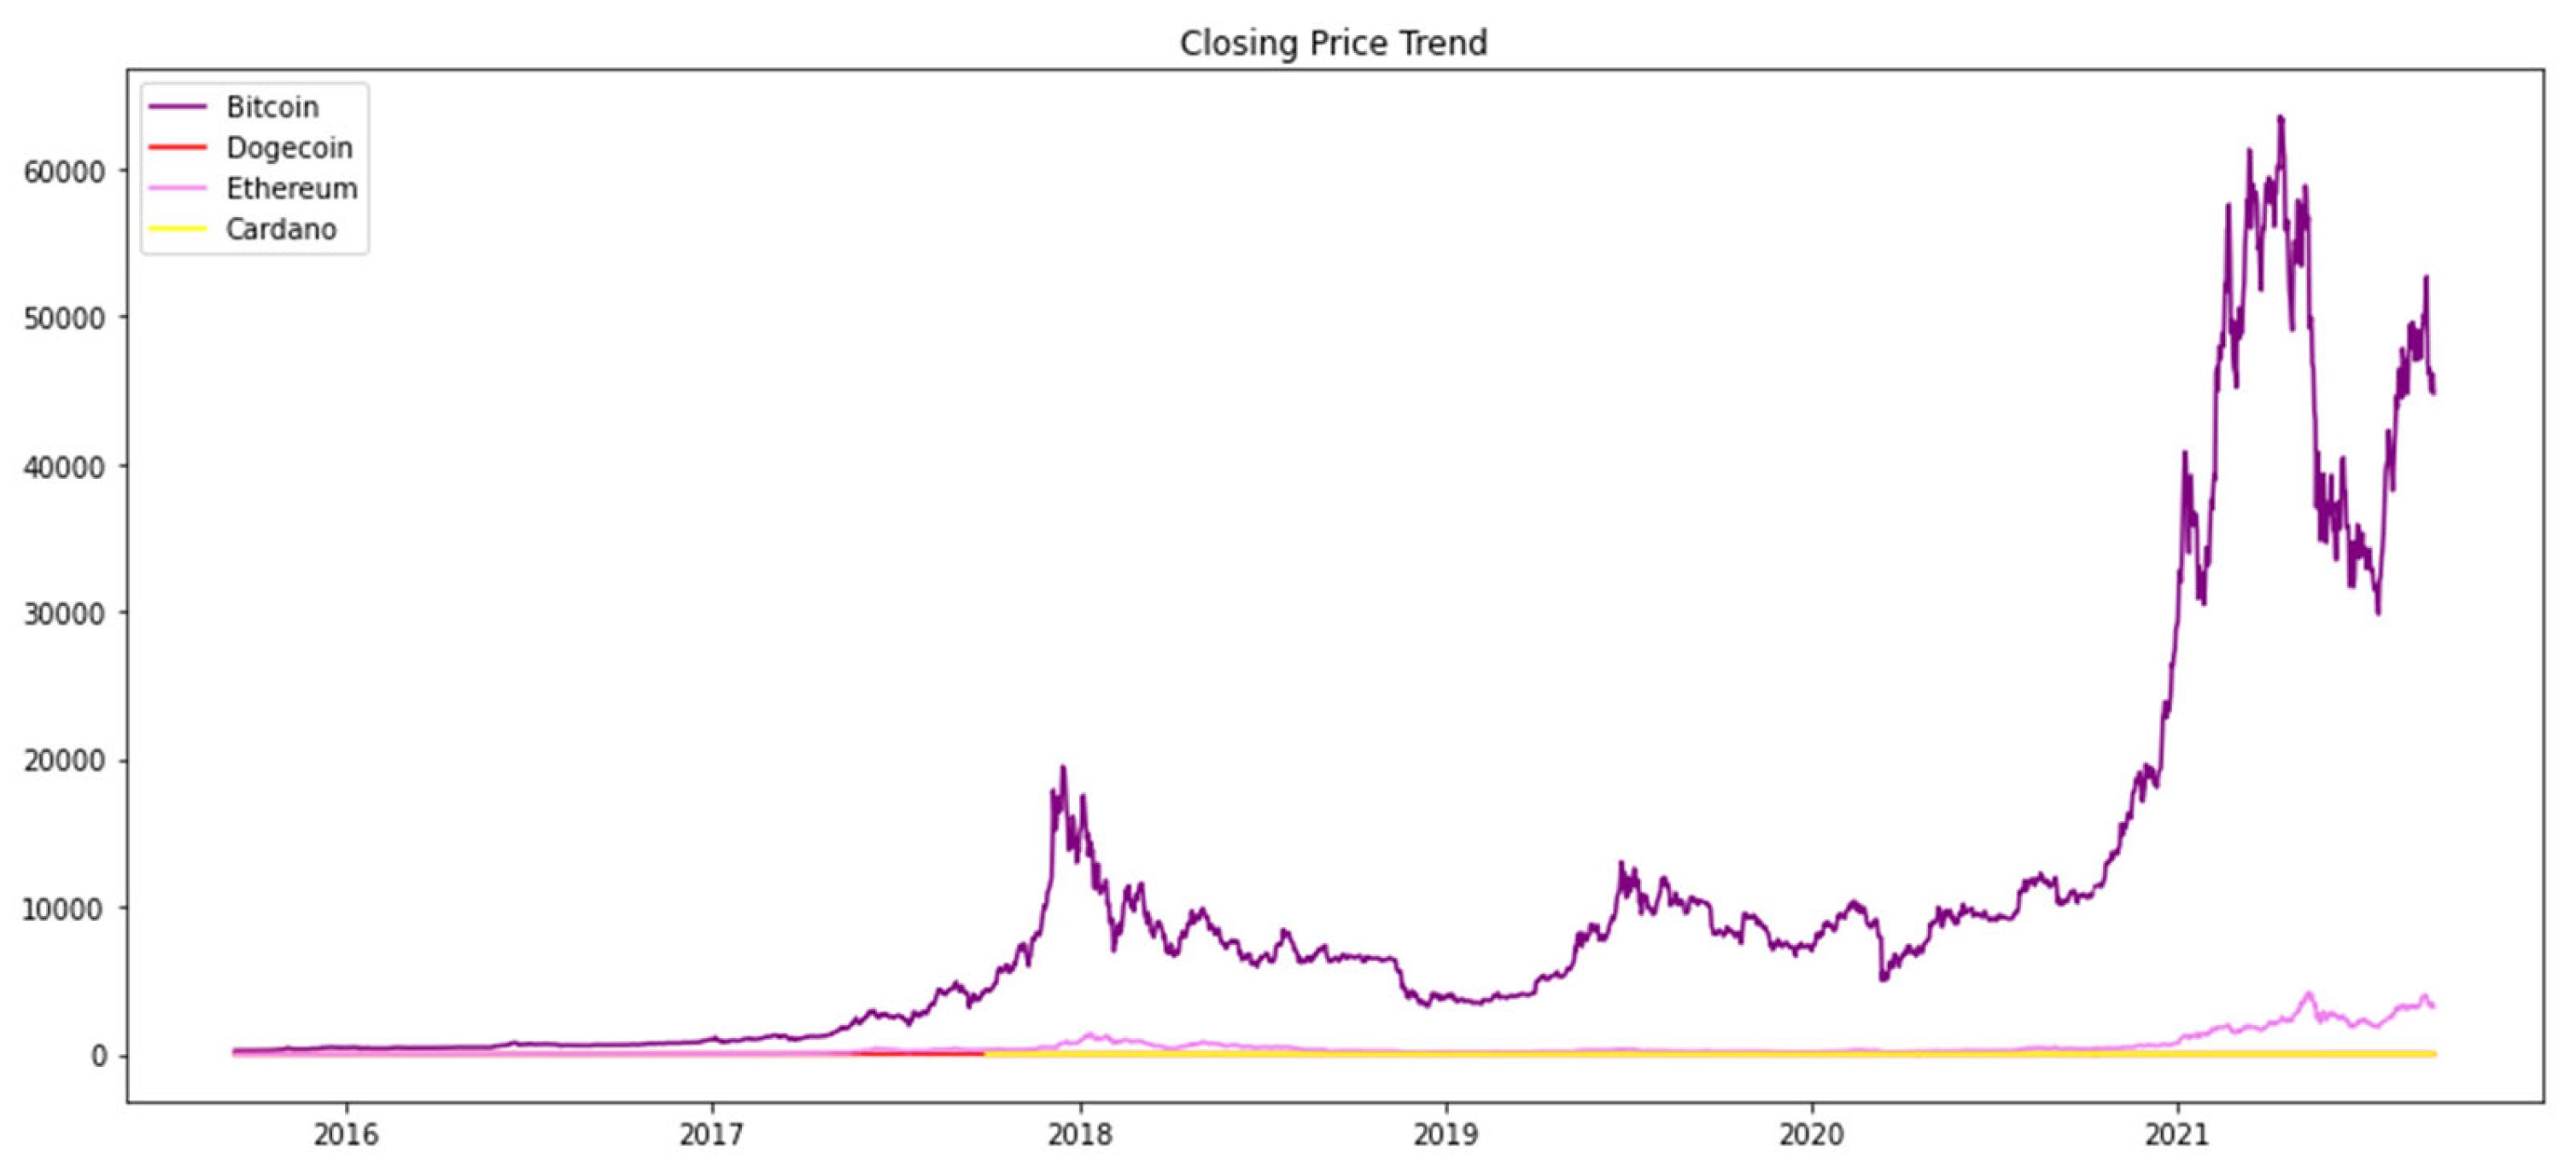
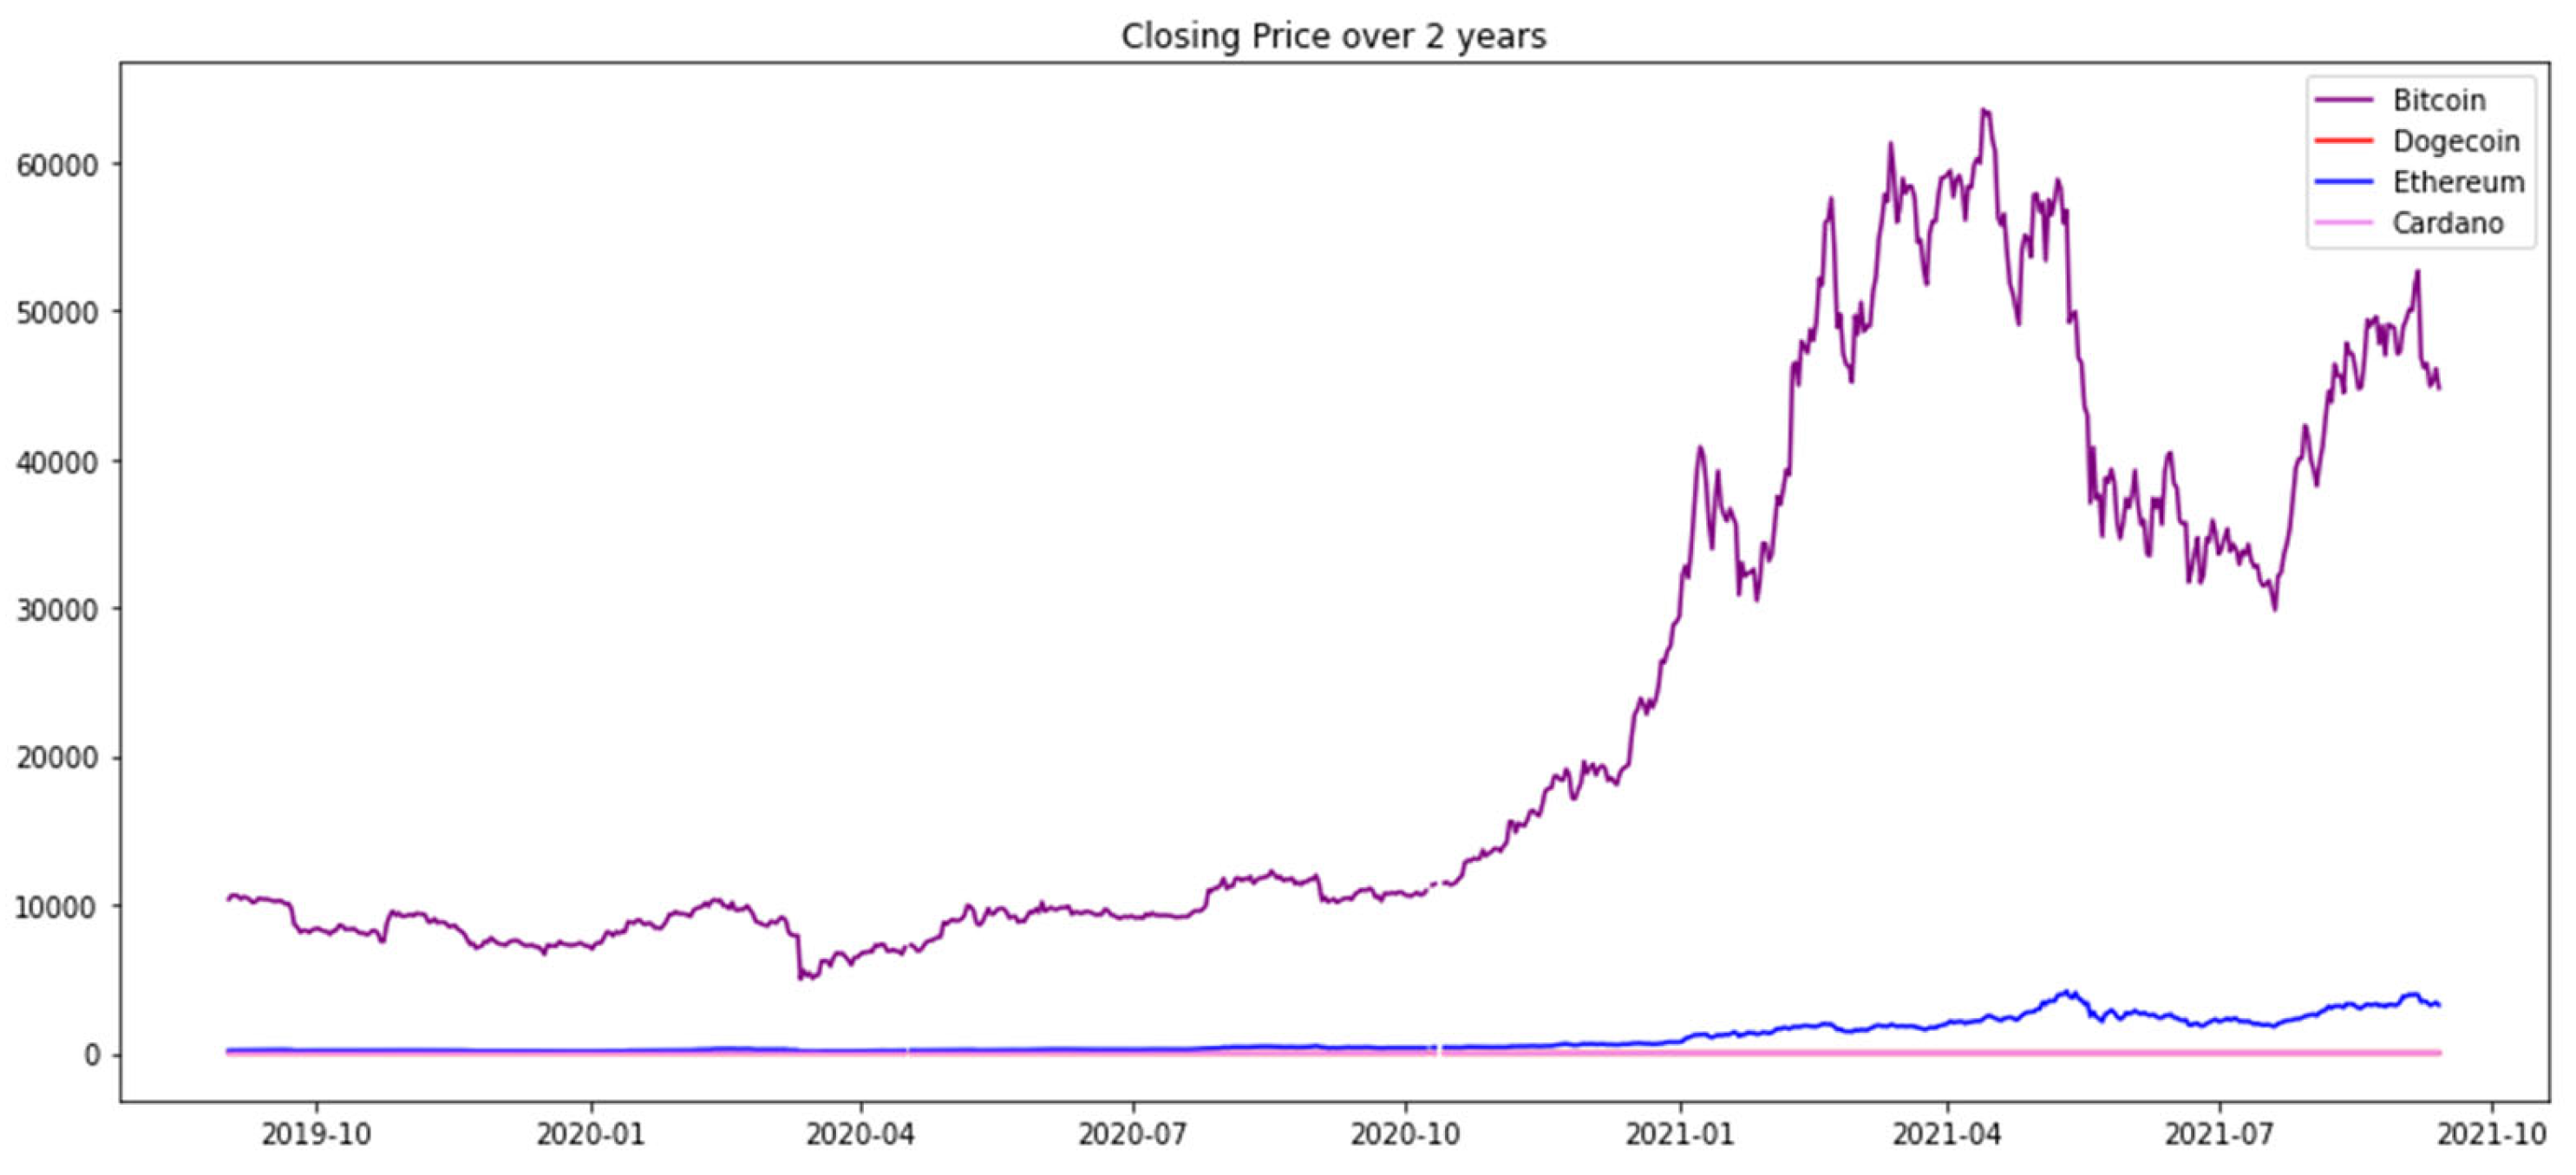
3.5. Cryptocurrency Closing Price Trend Forecast

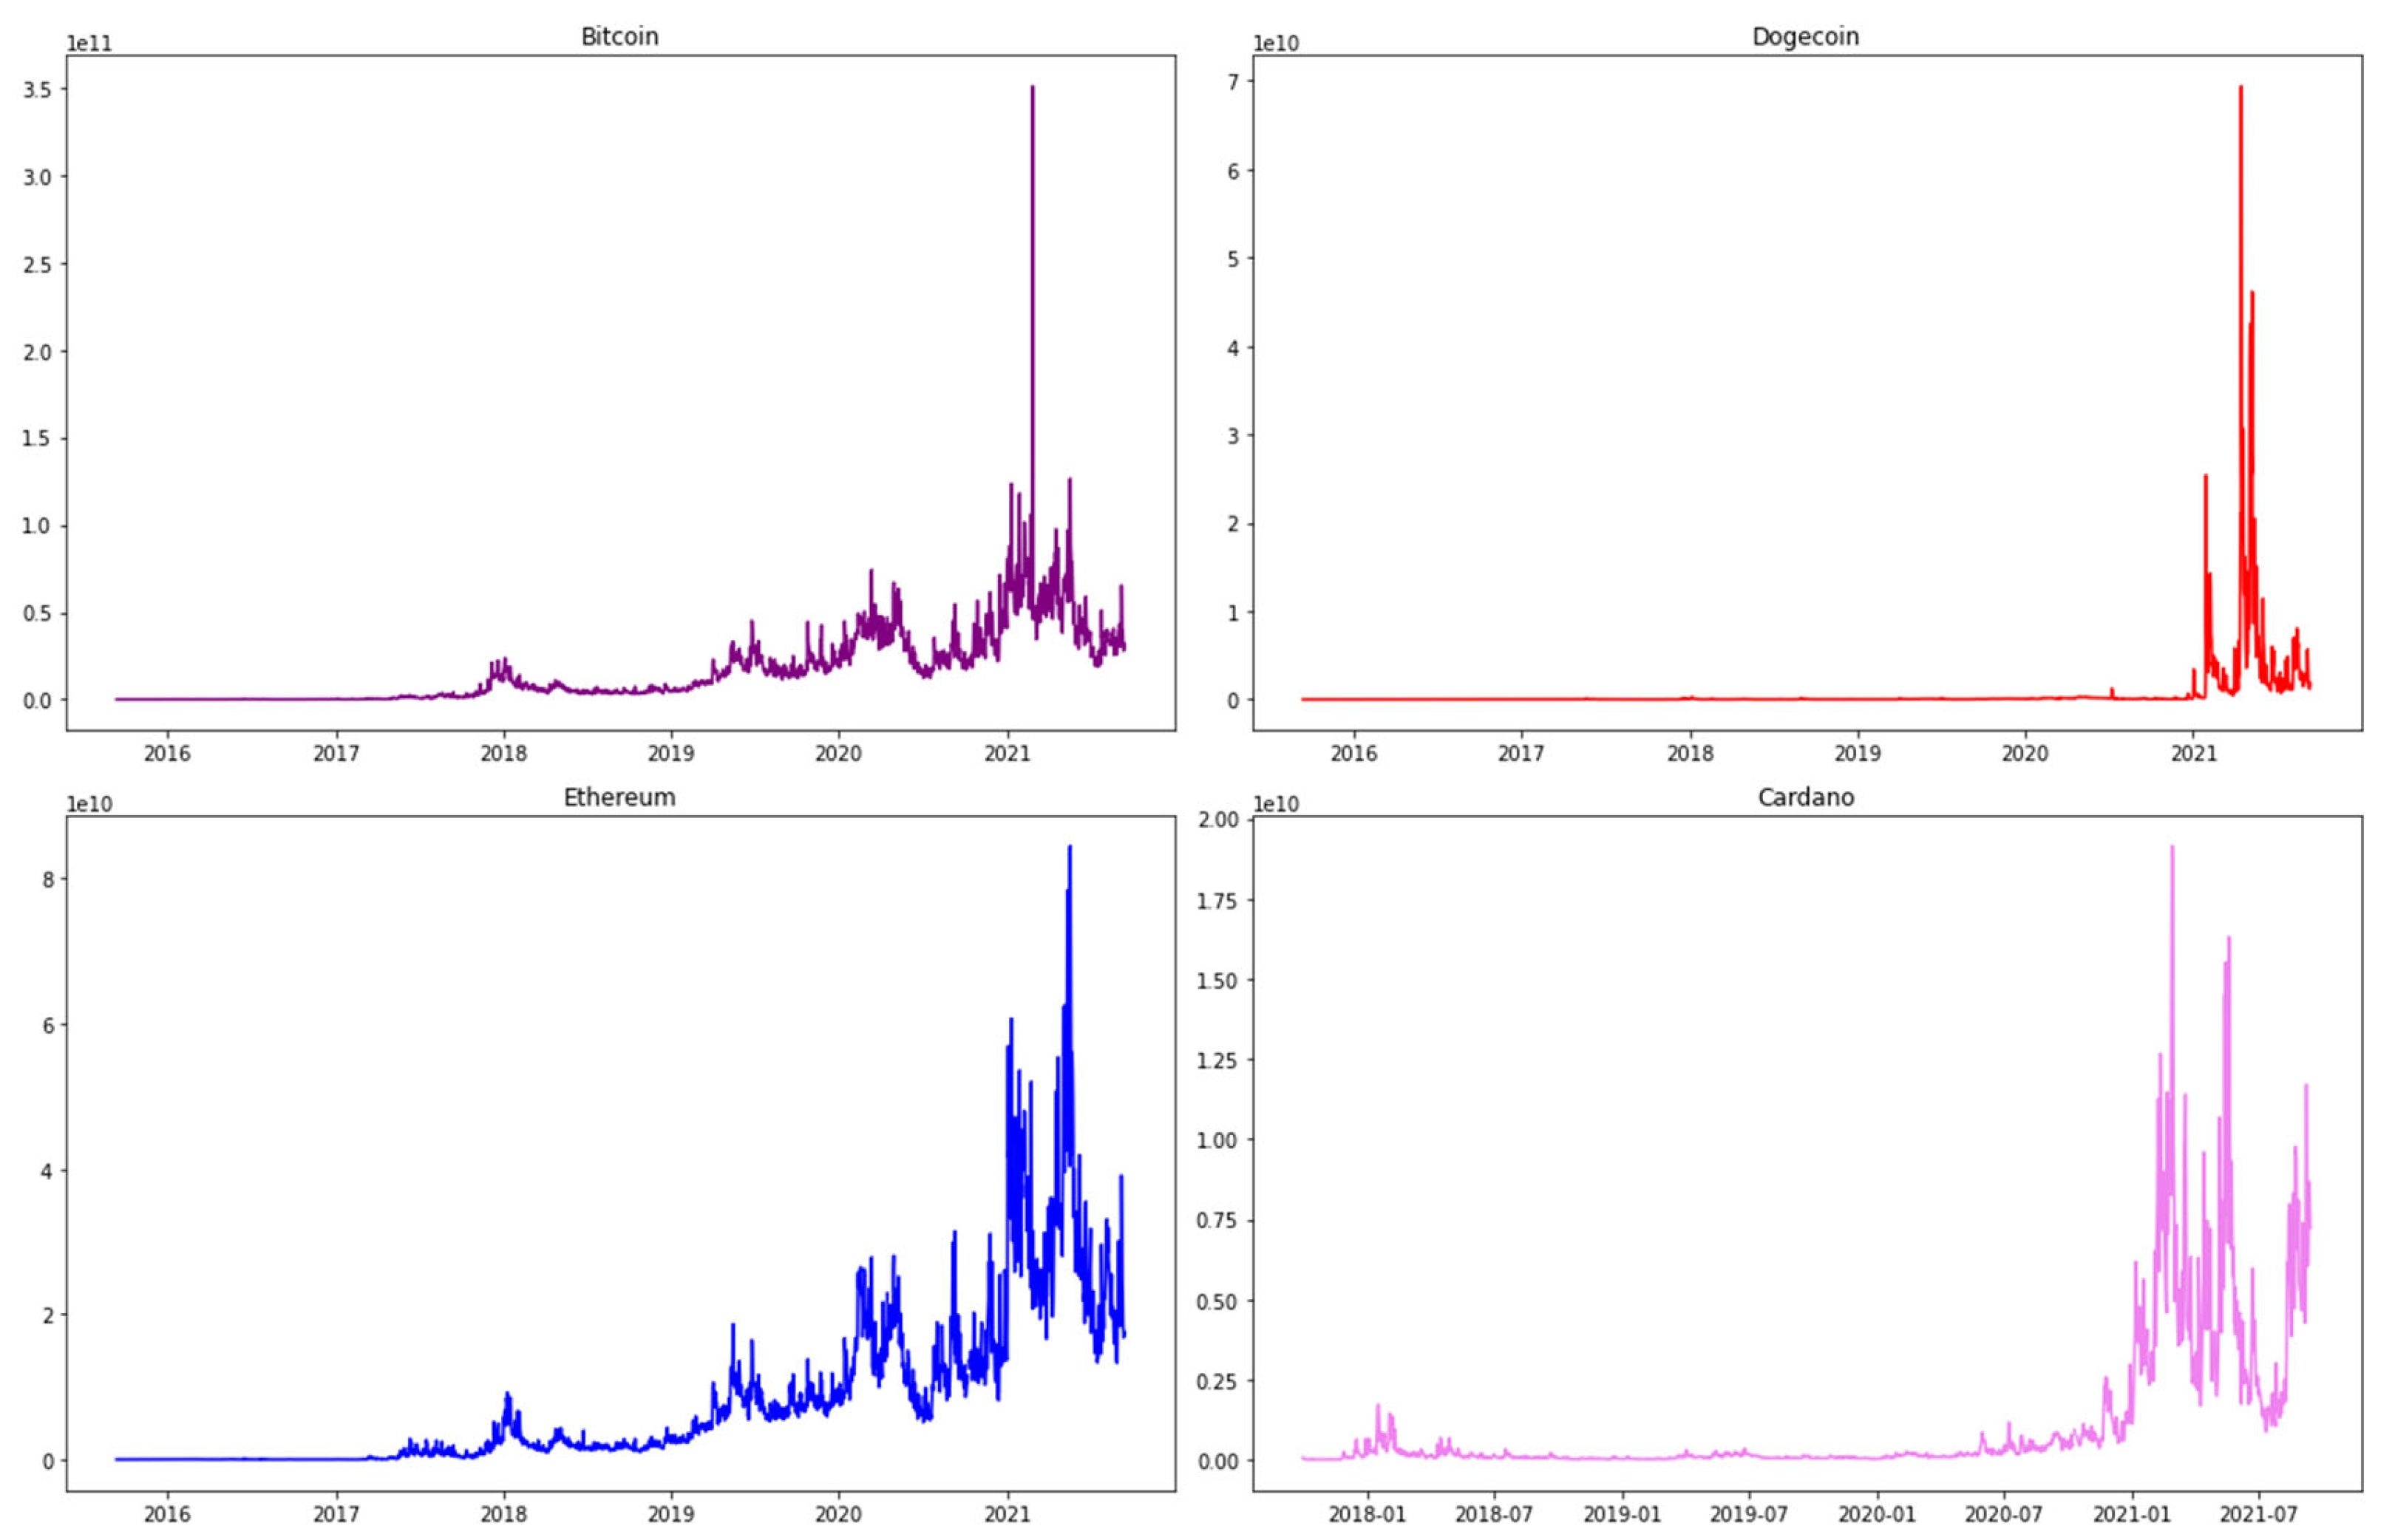
3.6. Cryptocurrency Trading Volume and Price
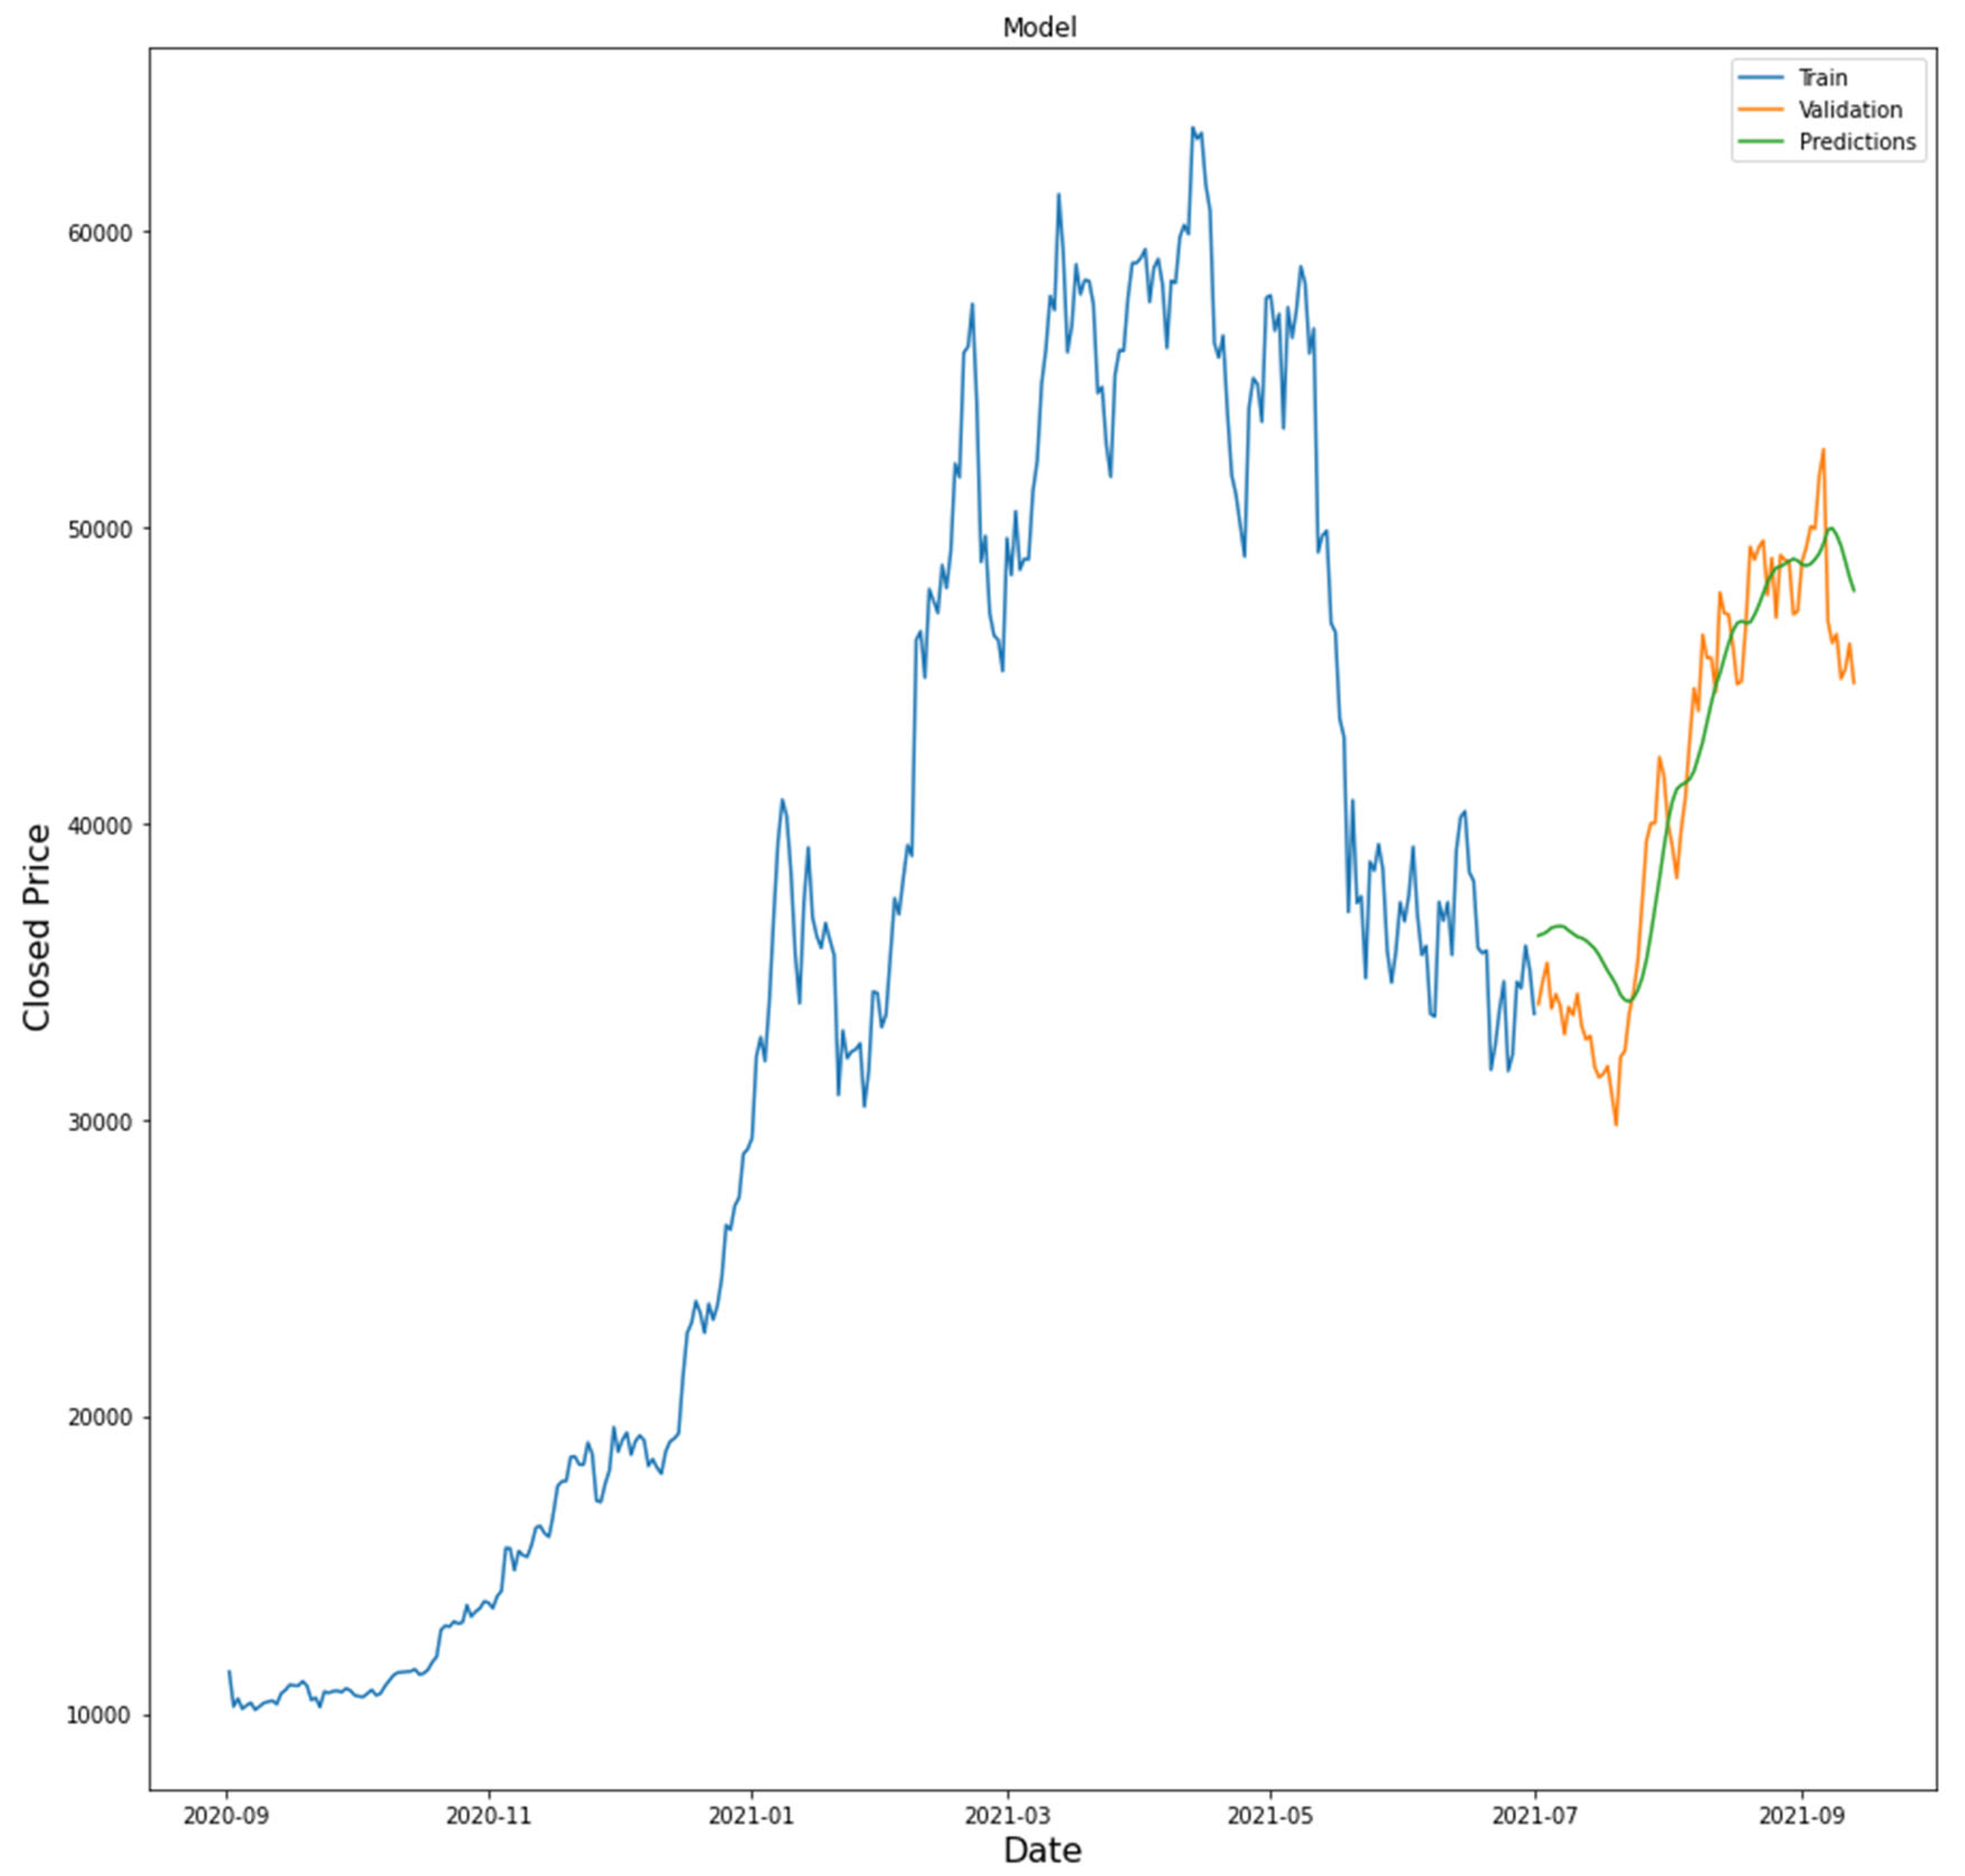
3.7. LSTM Model Predicted Price
| Close | |
|---|---|
| Date | |
| 2020/9/2 | 11414.03418 |
| 2020/9/3 | 10245.29688 |
| 2020/9/4 | 10511.81348 |
| 2020/9/5 | 10169.56738 |
| 2020/9/6 | 10280.35156 |
| ... | ... |
| 2021/6/27 | 34649.64453 |
| 2021/6/28 | 34434.33594 |
| 2021/6/29 | 35867.77734 |
| 2021/6/30 | 35040.83594 |
| 2021/7/1 | 33572.11719 |

3.8. Conclusion and Discussion
4. Conclusions
References
- Jiang, Z., & Liang, J. (2017, September). Cryptocurrency portfolio management with deep reinforcement learning. In 2017 Intelligent systems conference (IntelliSys) (pp. 905-913). IEEE. [CrossRef]
- Lucarelli, G., & Borrotti, M. (2019). A deep reinforcement learning approach for automated cryptocurrency trading. In Artificial Intelligence Applications and Innovations: 15th IFIP WG 12.5 International Conference, AIAI 2019, Hersonissos, Crete, Greece, May 24–26, 2019, Proceedings 15 (pp. 247-258). Springer International Publishing. [CrossRef]
- Xu, Y., Liu, Y., Xu, H., & Tan, H. (2024). AI-Driven UX/UI Design: Empirical Research and Applications in FinTech. International Journal of Innovative Research in Computer Science & Technology, 12(4), 99-109. [CrossRef]
- Liu, Y., Xu, Y., & Song, R. (2024). Transforming User Experience (UX) through Artificial Intelligence (AI) in interactive media design. Engineering Science & Technology Journal, 5(7), 2273-2283. [CrossRef]
- Li, H., Wang, S. X., Shang, F., Niu, K., & Song, R. (2024). Applications of Large Language Models in Cloud Computing: An Empirical Study Using Real-world Data. International Journal of Innovative Research in Computer Science & Technology, 12(4), 59-69. [CrossRef]
- Ping, G., Wang, S. X., Zhao, F., Wang, Z., & Zhang, X. (2024). Blockchain Based Reverse Logistics Data Tracking: An Innovative Approach to Enhance E-Waste Recycling Efficiency. [CrossRef]
- Schnaubelt, M. (2022). Deep reinforcement learning for the optimal placement of cryptocurrency limit orders. European Journal of Operational Research, 296(3), 993-1006. [CrossRef]
- Lei, H., Wang, B., Shui, Z., Yang, P., & Liang, P. (2024). Automated Lane Change Behavior Prediction and Environmental Perception Based on SLAM Technology. arXiv preprint arXiv:2404.04492. [CrossRef]
- Wang, B., Zheng, H., Qian, K., Zhan, X., & Wang, J. (2024). Edge computing and AI-driven intelligent traffic monitoring and optimization. Applied and Computational Engineering, 77, 225-230. [CrossRef]
- Xu, H., Niu, K., Lu, T., & Li, S. (2024). Leveraging artificial intelligence for enhanced risk management in financial services: Current applications and future prospects. Engineering Science & Technology Journal, 5(8), 2402-2426. [CrossRef]
- Shi, Y., Shang, F., Xu, Z., & Zhou, S. (2024). Emotion-Driven Deep Learning Recommendation Systems: Mining Preferences from User Reviews and Predicting Scores. Journal of Artificial Intelligence and Development, 3(1), 40-46.
- Wang, Shikai, Kangming Xu, and Zhipeng Ling. "Deep Learning-Based Chip Power Prediction and Optimization: An Intelligent EDA Approach." International Journal of Innovative Research in Computer Science & Technology 12.4 (2024): 77-87. [CrossRef]
- Ping, G., Zhu, M., Ling, Z., & Niu, K. (2024). Research on Optimizing Logistics Transportation Routes Using AI Large Models. Applied Science and Engineering Journal for Advanced Research, 3(4), 14-27. [CrossRef]
- Shang, F., Shi, J., Shi, Y., & Zhou, S. (2024). Enhancing E-Commerce Recommendation Systems with Deep Learning-based Sentiment Analysis of User Reviews. International Journal of Engineering and Management Research, 14(4), 19-34. [CrossRef]
- Kochliaridis, V., Kouloumpris, E., & Vlahavas, I. (2023). Combining deep reinforcement learning with technical analysis and trend monitoring on cryptocurrency markets. Neural Computing and Applications, 35(29), 21445-21462. [CrossRef]
- Betancourt, Carlos, and Wen-Hui Chen. "Reinforcement learning with self-attention networks for cryptocurrency trading." Applied Sciences 11.16 (2021): 7377. [CrossRef]
- Yang, M., Huang, D., Zhang, H., & Zheng, W. (2024). AI-Enabled Precision Medicine: Optimizing Treatment Strategies Through Genomic Data Analysis. Journal of Computer Technology and Applied Mathematics, 1(3), 73-84. [CrossRef]
- Wen, X., Shen, Q., Zheng, W., & Zhang, H. (2024). AI-Driven Solar Energy Generation and Smart Grid Integration A Holistic Approach to Enhancing Renewable Energy Efficiency. International Journal of Innovative Research in Engineering and Management, 11(4), 55-55. [CrossRef]
- Li, J., Wang, Y., Xu, C., Liu, S., Dai, J., & Lan, K. (2024). Bioplastic derived from corn stover: Life cycle assessment and artificial intelligence-based analysis of uncertainty and variability. Science of The Total Environment, 174349. [CrossRef]
- Xiao, J., Wang, J., Bao, W., Deng, T., & Bi, S. (2024). Application progress of natural language processing technology in financial research. Financial Engineering and Risk Management, 7(3), 155-161. [CrossRef]
- Wang, S., Zhu, Y., Lou, Q., & Wei, M. (2024). Utilizing Artificial Intelligence for Financial Risk Monitoring in Asset Management. Academic Journal of Sociology and Management, 2(5), 11-19. [CrossRef]
- Shen, Q., Wen, X., Xia, S., Zhou, S., & Zhang, H. (2024). AI-Based Analysis and Prediction of Synergistic Development Trends in US Photovoltaic and Energy Storage Systems. International Journal of Innovative Research in Computer Science & Technology, 12(5), 36-46. [CrossRef]
- Zhu, Y., Yu, K., Wei, M., Pu, Y., & Wang, Z. (2024). AI-Enhanced Administrative Prosecutorial Supervision in Financial Big Data: New Concepts and Functions for the Digital Era. Social Science Journal for Advanced Research, 4(5), 40-54. [CrossRef]
- Li, H., Zhou, S., Yuan, B., & Zhang, M. (2024). OPTIMIZING INTELLIGENT EDGE COMPUTING RESOURCE SCHEDULING BASED ON FEDERATED LEARNING. Journal of Knowledge Learning and Science Technology ISSN: 2959-6386 (online), 3(3), 235-260. [CrossRef]
- Pu, Y., Zhu, Y., Xu, H., Wang, Z., & Wei, M. (2024). LSTM-Based Financial Statement Fraud Prediction Model for Listed Companies. Academic Journal of Sociology and Management, 2(5), 20-31. [CrossRef]
- Yang, M., Huang, D., Zhang, H., & Zheng, W. (2024). AI-Enabled Precision Medicine: Optimizing Treatment Strategies Through Genomic Data Analysis. Journal of Computer Technology and Applied Mathematics, 1(3), 73-84. [CrossRef]
- Wen, X., Shen, Q., Zheng, W., & Zhang, H. (2024). AI-Driven Solar Energy Generation and Smart Grid Integration A Holistic Approach to Enhancing Renewable Energy Efficiency. International Journal of Innovative Research in Engineering and Management, 11(4), 55-55. [CrossRef]
- Lou, Q. (2024). New Development of Administrative Prosecutorial Supervision with Chinese Characteristics in the New Era. Journal of Economic Theory and Business Management, 1(4), 79-88. [CrossRef]
Disclaimer/Publisher’s Note: The statements, opinions and data contained in all publications are solely those of the individual author(s) and contributor(s) and not of MDPI and/or the editor(s). MDPI and/or the editor(s) disclaim responsibility for any injury to people or property resulting from any ideas, methods, instructions or products referred to in the content. |
© 2024 by the authors. Licensee MDPI, Basel, Switzerland. This article is an open access article distributed under the terms and conditions of the Creative Commons Attribution (CC BY) license (http://creativecommons.org/licenses/by/4.0/).


