Preprint
Article

Interferon Signaling Activation and LINE1 Expression under Influence of Anticancer Plant Secondary Metabolites

Altmetrics

Downloads

48

Views

45

Comments

0

Submitted:

10 October 2024

Posted:

11 October 2024

You are already at the latest version

Alerts
Abstract
Previously we discovered that among 15 DNA-binding plant secondary metabolites (PSMs) possessing anticancer activity, 11 compounds cause depletion of the linker histones H1.2 and/or H1.4 from chromatin fraction. Chromatin remodeling or multiH1 knocking-down is known to promote the upregulation of repetitive elements, ultimately triggering an interferon response. Herein, using HeLa cells and applying fluorescent reporter assay with flow cytometry and quantitave RT-PCR, we found that among PSMs depleting linker histones, 8 compounds significantly activate type I interferon signaling pathway. Out of these compounds resveratrol, berberine, genistein, delphinidin, naringenin and curcumin also caused LINE1 expression detected by quantitate RT-PCR and by immunefluorescent staining analysis of ORF1 LINE1 and γ-H2AX. Fisetin and quercetin, which also induced linker histone depletion, significantly activated only type I interferon signaling, but not LINE1 expression. Curcumin, sanguinarine and kaempferol, causing depletion of the linker histone H1.4 more intensively respectively to H1.2, activate interferon signaling less intensively without any changes of LINE1 expression. For 4 PSMs, which did not cause linker histone depletion, we did not observe effects of interest. Thus, we have shown for the first time that activation of type I interferon signaling accompanies chromatin remodeling caused by PSMs, and LINE1 expression often impacts this activation.
Keywords: 
Subject: Biology and Life Sciences  -   Biochemistry and Molecular Biology

1. Introduction

The whole number of plant secondary metabolites (PSMs) or phytochemicals, largely consisting of polyphenols, have been shown to possess anticancer activity against chemically induced animal tumors of various types [1,2,3,4]. They reduce the incidence and multiplicity of benign and malignant tumors induced in rodents in colon by 1,2-dimethylhydrazine or azoxymethane, in breast and ovary by 7,12-dimethylbenz(a)anthracene and in breast by N-methyl-N-nitrosourea. Mechanistic data, obtained on human cancer cells growing ex vivo and cultured in vitro, confirmed antiproliferative, proapoptotic, anti-inflammatory and immunomodulatory effects of PSMs, which demonstrated anticancer activity against chemically induced tumors [5,6,7,8]. Chemopreventive effects of genistein, resveratrol, berberine and some other PSMs were shown in a number of clinical trials [2,9,10,11].
Anticarcinogenic PSMs, characterized by the presence of aromatic rings with hydroxyl and other substituents, can bind various molecular targets in cells, such as receptors, enzymes of xenobiotic metabolism and epigenetic regulation of transcription, components of signaling pathways, enzymes of DNA repair and metabolism [12,13,14,15]. A wide range of PSM targets makes it extremely difficult to analyze consequences of different interactions, which impact the integral result of PSM action. Having unique structure, every PSM is characterized by its own spectrum of targets, however, most anticarcinogenic PSMs possess affinity to DNA. PSMs interact with DNA via van der Waals, ionic, and hydrogen bonds without formation of covalent bonds, that explains why they are not genotoxic. Using various sophisticated technics intercalation into DNA helix was shown for apigenin, delphinidin, fisetin, epigallocatechin-3-gallate (EGCG), genistein, naringenin, quercetin, resveratrol and sanguinarine [16,17,18,19,20,21]. Curcumin and sanguinarine interact with DNA as minor groove binders [16,22]. G-quadruplex binding and stabilization were shown for berberine, curcumin, EGCG, fisetin, kaempferol, quercetin, sanguinarine [23,24,25,26,27,28,29]. Formation DNA-PSM complexes can affect the geometric characteristics and thermodynamic stability of DNA duplex, its flexibility and physicochemical properties, as well as its ability to form various alternative DNA structures [19,23,24,25,26,27,28]. PSMs can cover up DNA sites, which are recognized by enzymes of DNA packaging, epigenetic regulation, repair, transcription and replication.
In our previous study we demonstrated that most of DNA-binding PSMs (11 compounds out of analyzed 15 PSMs with anticarcinogenic activity and ability to bind DNA) cause depletions of linker histones H1.2 and H1.4 from chromatin fraction that should be reflected on three-dimensional organization (3D structure) of chromatin and DNA packaging processes [30]. Noteworthy, that in multiH1 knocked-down cells, chromatin opening promotes the upregulation of repetitive elements, ultimately triggering an interferon (IFN) response [31]. In particular, Izquierdo-Bouldstridge et al. demonstrated that histones H1.2 and/or H1.4 are involved in the expression control of transposable elements (TEs) that influences innate immunity regulation. In general, H1 linker histones are enriched in the constitutive heterochromatin with silent repetitive elements LINEs, SINEs, and repeats containing endogenous retroviruses [32,33]. Moreover, in our previous study devoted to chromatin destabilization by a new anticancer drug Curaxin CBL0137 we revealed activation of type I IFN signaling accompanied by repetitive DNA transcription [34]. Chromatin remodeling, caused by ATRX protein, was also demonstrated to activate type I IFN signaling [35].
IFNs represent key modulators of the immune response. These cytokines with potent antiviral and growth-inhibitory effects play critical roles in the first line of defense against infections and homeostatic disorders during cancer pathogenesis [36,37]. IFN signaling activation was described in several studies devoted to effects of some PSMs. In particular, IFN activation was observed when cells were treated with resveratrol [38,39], berberine [37,40], fisetin [42], naringenin [43,44], sanguinarine [45], quercetin [46]. All these studies were performed using separate PSMs and different cancer cells, which makes it difficult to compare their effects, and they do not show possible mechanisms of IFN activation. However, these data and our previously obtained results concerning PSM influence on linker histone location in cell nuclei provide a good basis for clarifying the question of whether PSM-induced chromatin remodeling is accompanied by IFN activation. This clarification should both expand our understanding of molecular effects induced by anticarcinogenic PSM and reveal cell response on chromatin rearrangements caused by different chemicals. The latter may be a strategic basis for the development of new non-genotoxic chemopreventive and anticancer drugs targeting chromatin structure and function.
Thus, the aims of our study include the analysis of the influence of 15 anticarcinogenic DNA-binding on INF-signaling activity, on the patterns of INF-responsive genes and on transcription of repetitive non-coding DNA. At last, the main goal of our study was to compare the data obtained with the abilities of PSMs to cause linker histones H1.2 and H1.4 depletions, which we described in our previous publication [30].
Previously linker histones H1.2 and H1.4 depletions under PSM treatment were observed on HeLa cells and confirmed on T47D cells, that determined the choice of cell lines for the study presented now. We applied flow cytometry of genetically modified HeLa cells with the reporter mCherry gene under control of IFN sensitive responsive element (ISRE) and using immunofluorescent staining of ORF1 LINE1 and H2Ax-gamma. We also used quantitative RT-PCR for analysis of several IFN-responsive gene activation and the pattern of IFN-responsive genes was determined using Human Signal Transduction Pathway Finder RT2Profiler PCR Array (HSTPF, Qiagen, PARN-014Z).

2. Results

2.1. Type I Interferon Signaling Activation by DNA-Binding PSMs

In our study we employed two alternative approaches for assessment of IFN signaling activity in HeLa cells. Firstly, we used flow cytometry and the reporter assay that revealed IFN response through the activation of a consensus ISRE driving mCherry red fluorescent protein transgene expression in HeLa TI ISRE-mCherry cells. Previously we demonstrated that this approach of IFN response assessment is highly sensitive [41]. Secondly, we used Human Signal Transduction Pathway Finder RT2Profiler PCR Array (HSTPF, Qiagen, PARN-014Z) to analyze the changes in the expression pattern of 84 INF-responsive genes. Dose-dependence for PSM toxic effects in HeLa cells was described in our previous publications, and based on those data we chose non-toxic and IC20 (leaving more than 80% of cells alive) concentrations of PSMs for our study (Table S1) [30,48]. Untreated cells and cells treated with the solvents were used as negative controls, while cells treated with IFN-α were used as the positive control. As the main goal of our study was to compare PSM effects on IFN activation and LINE1 expression with their ability to cause linker histones H1.2 and H1.4 depletions described previously [30], PSM order for the effect presentation in all the figures was as follows: 1-8—PSMs causing intensive linker histones depletion from chromatin fraction (mainly H1.2, but accompanied with H1.4), 9-11—PSMs causing significant H1.4 depletion, but insignificant H1.2 depletion and 12-15—PSMs unable to cause both H1.2 and H1.4 depletion.

2.1.1. PSM Influence on Reporter mCherry Expression Driven by IFN-Sensitive Response Element

Using the reporter assays and flow cytometry, we observed very intensive IFN response almost in all HeLa TI ISRE-mCherry cells after 24 h treatment with berberine, curcumin, fisetin and naringenin, resveratrol, while IFN-α treatment activated mCherry expression in 99.0% of cells (Figure 1). Significantly increased proportions of the cells expressing mCherry was also observed after cell treatment with 4 PSMs, in particular, for genistein—by 70.5%, for sanguinarine—by 60.3%, for quercetin—by 33.5% and delphinidin—by 22.5%. We did not observe significant increases in proportions of cells expressing mCherry after the treatment with apigenin, coumarin, ginsenoside Rb1, and thymoquinone, EGCG, kaempferol. Significant increases of mCherry mean fluorescence intensity (MFI) were observed in HeLa TI ISRE-mCherry cells treated with 5 PSMs, although they were less intensive compared to the MFI in cells treated with IFN. In particular, IFN caused MFI to increase by 13.3 times, while naringenin—by 12.7 times, fisetin—by 11.8 times, curcumin and resveratrol—by 9.3 times and berberine—by 8.9 times (Figure 1B).
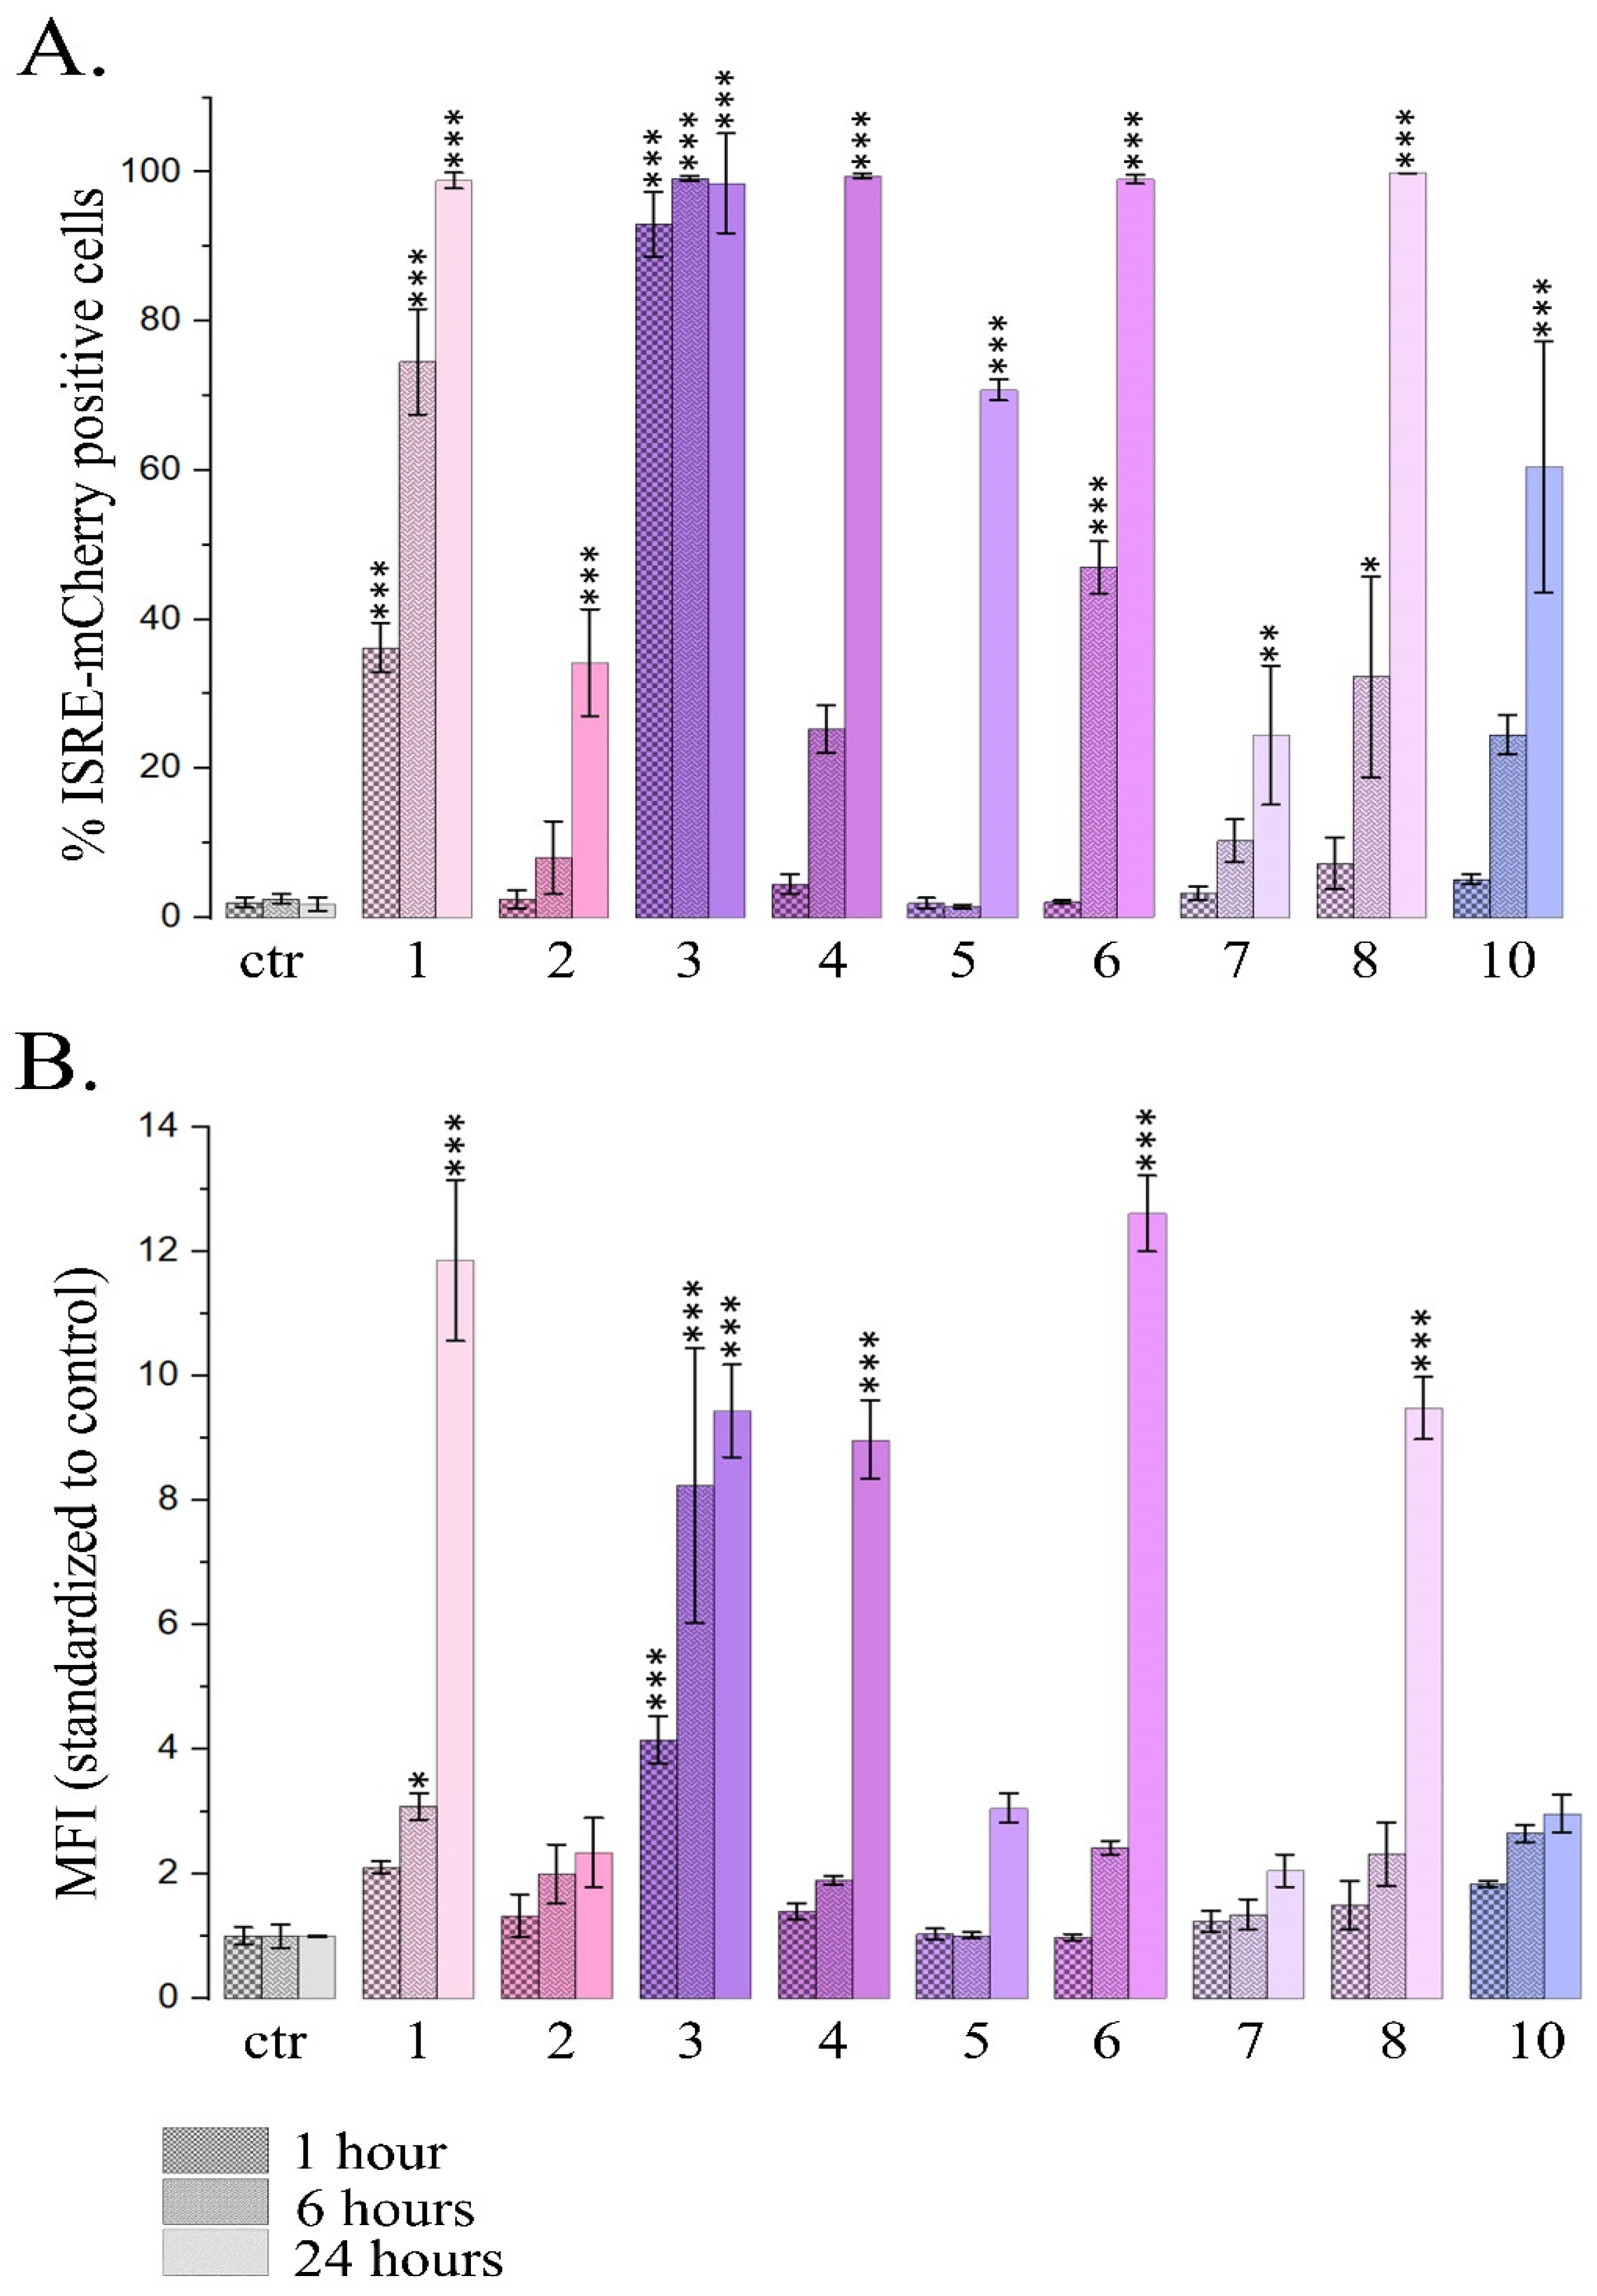
For PSMs, which caused significant increase in the proportion of cells expressing mCherry after 24 h treatment, we also analyzed dynamics of the changes after 1, 6 and 24 h PSM treatment (Figure 2).
We observed significant increase both in the proportion of cells expressing mCherry and in the mean fluorescence intensity after 1 h treatment with fisetin and resveratrol, and the effects increased time-dependently after 6 h and 24 h treatment (Figure 2). Curcumin and naringenin caused significant effect after 6 h treatment and their effects were enhanced after 24 h treatment. Berberine, genistein, sanguinarine and delphinidin caused significant effects only after 24 h treatment. MFI increases after the treatment with curcumin, berberine and naringenin were observed only after 24 h treatment.
Thus using reporter assay and flow cytometry we demonstrated activation of type I IFN signaling pathway after treating HeLa TI ISRE-mCherry cells for 24 hours with 9 PSMs. Two of them (resveratrol and fisetin) caused significant increase even after 1 h treatment.

2.1.2. Influence of PSMs on the Expression Pattern of IFN-Responsive Genes

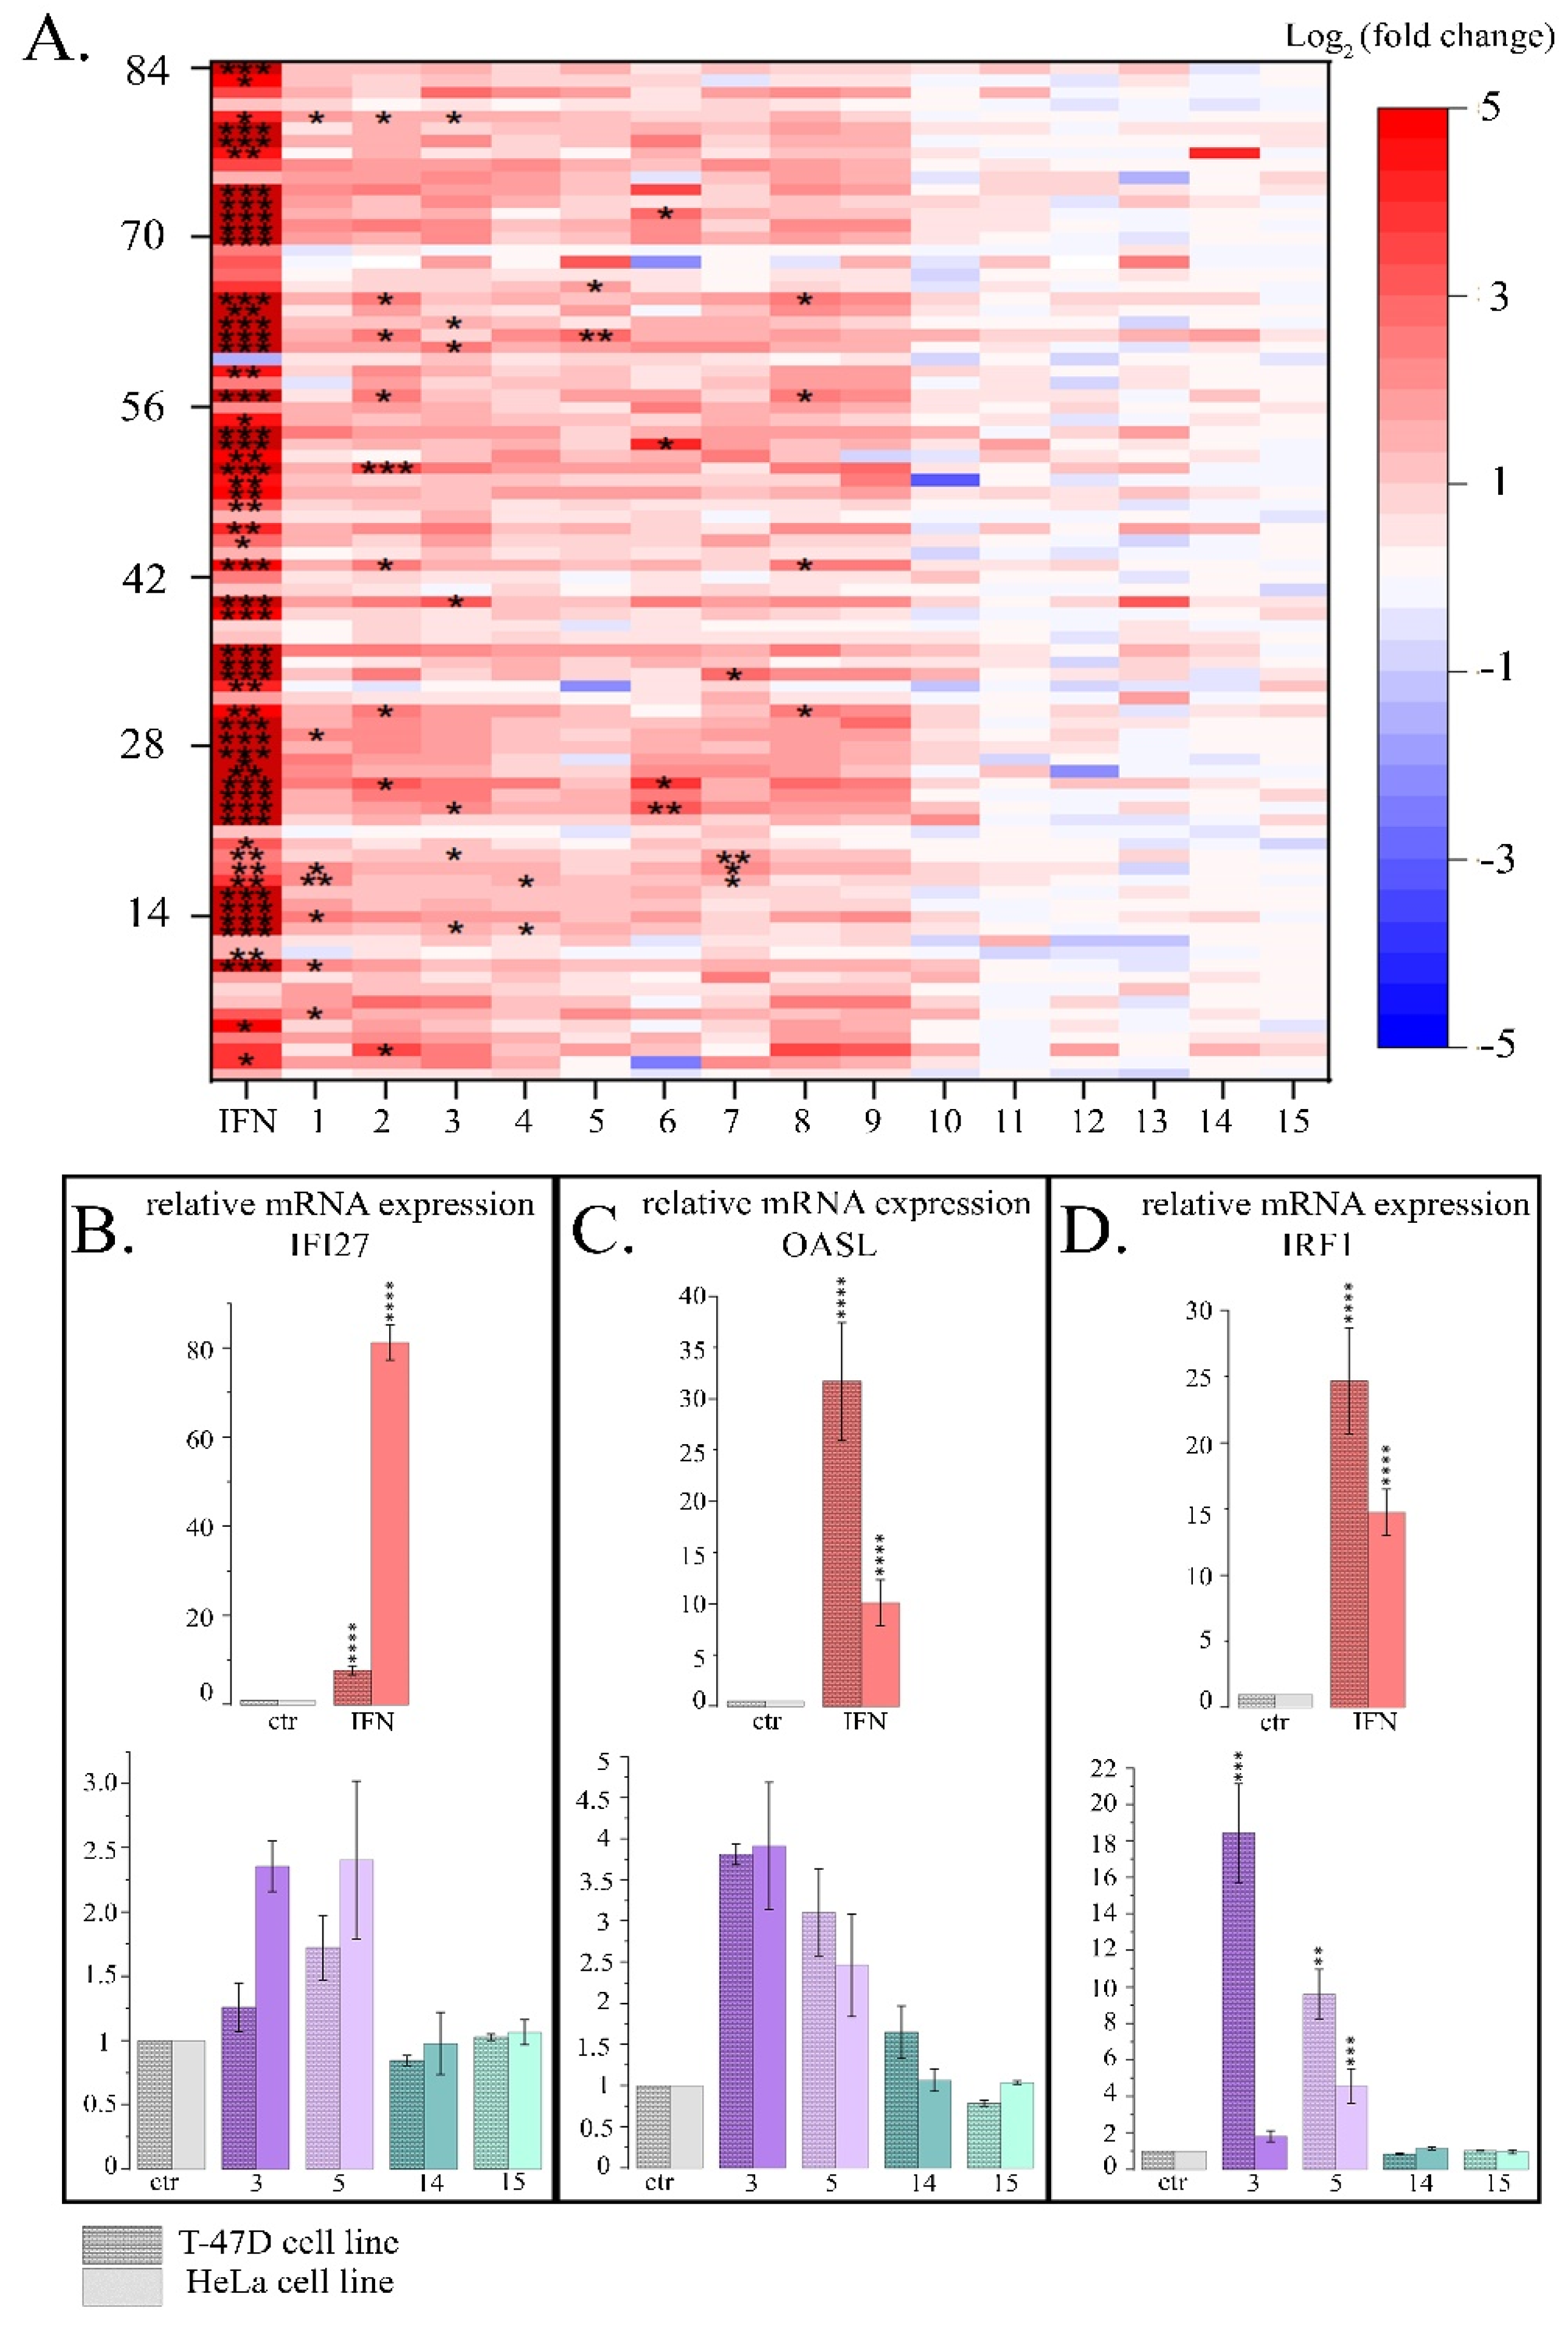
Expression pattern of IFN-responsive genes was analyzed after 24 h treatment with IFN-α (103UI/ml) as the positive control and 15 PSMs (non-toxic concentrations) using Human Signal Transduction Pathway Finder RT2Profiler PCR Array (HSTPF, Qiagen, PARN-014Z) (Figure 3).
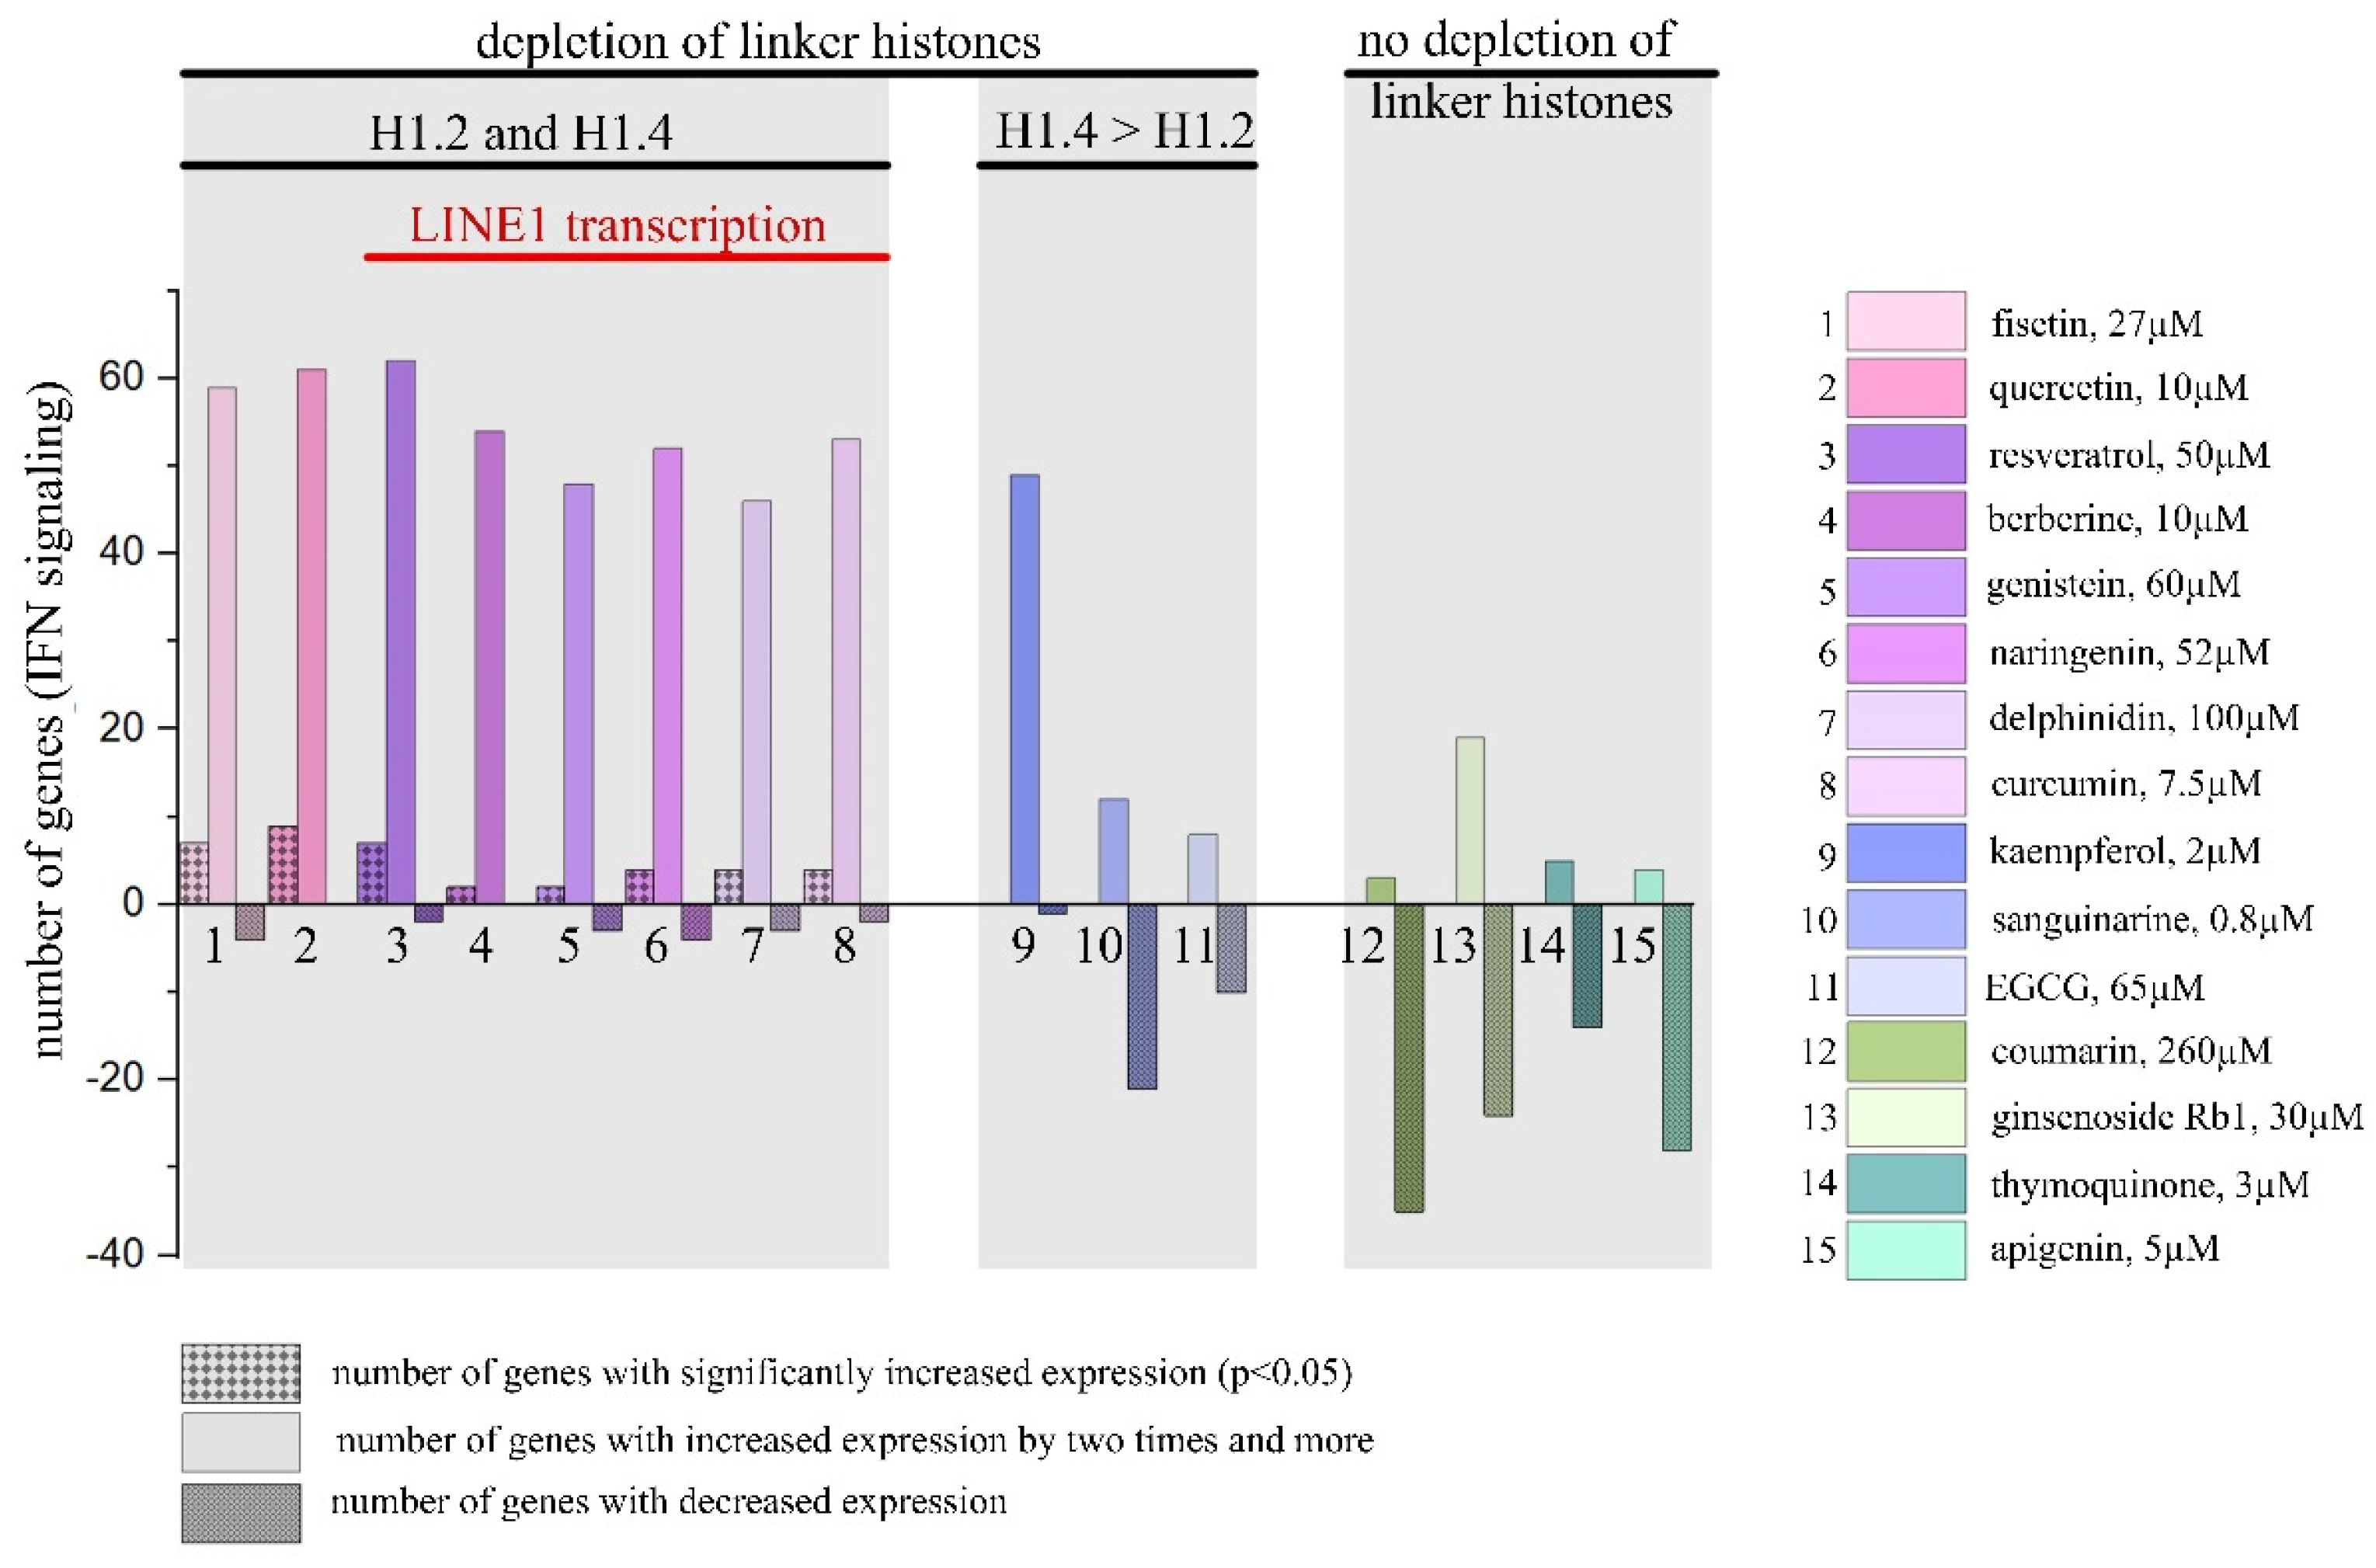
Hela cells 24 h treatment with IFN-α, which was used as a positive control, caused significant expression increase of all the IFN-mediated genes analyzed. Analogous cell treatment with a number of PSMs, in particular, fisetin, curcumin, berberine, resveratrol, genistein, quercetin, kaempferol, naringenin and delphinidin, caused expression activation of the most genes of type I IFN signaling pathway (Figure 3). However, significant increases were observed only for a number of individual genes: 9 genes for quercetin, 7 genes for resveratrol and fisetin, 4 genes for curcumin and naringenin, 2 genes for berberine and genistein, and 1 gene for thymoquinone. Noteworthy, in the treated cells among 84 genes of type I IFN signaling pathway the number of genes whose expression levels were more than doubled was 62 for resveratrol, 61 for quercetin, 59 for fisetin, 54 for berberine, 53 for naringenin, 52 for curcumin, 48 for genistein, 49 for kaempferol, and 46 for delphinidin. It’s also worth noting that 14 genes turned out to be common for the following compounds: CXCL10, IFI27, IFNA14, IFNA16, IFNA2, IFNA4, IFNA7, IFNG, IL20RA, IL5RA, IRF8, IRGM, ISG15. We did not observe significant activation of type I IFN signaling pathway genes for sanguinarine, kaempferol, and EGCG, however, a larger number of genes enhanced their expression. We observed low activation level or even weak inactivation for the genes of type I IFN signaling pathway for apigenin, coumarin, ginsenoside Rb1 and thymoquinone.
Thus, using Human Signal Transduction Pathway Finder RT2Profiler PCR Array we also observed activation of type I IFN signaling pathway after HeLa cell treatment with 8 of 15 studied PSMs, and 4 PSMs did not produce unidirectional influence (Table S).
We studied the effect of resveratrol, genistein, apigenin and thymoquinone at non- toxic concentrations on the activation of type I IFN signaling genes expression (IFN—responsive genes IFI27 and OASL, and IFN regulatory factor IRF1) in another cell line, T47D, human breast cancer cells. According to our previous data, resveratrol and genistein cause active depletion of linker histones H1.2 and H1.4 from the chromatin-bound fraction in both HeLa and T-47D cell lines, while apigenin and thymoquinone did not demonstrate this effect on the HeLa cell line and were not studied on T47D. We observed an increase in relative gene expression (statistically significant for gene IRF1 and not statistically significant for other genes) in both cell lines after 24-hour treatment of cells with resveratrol and genistein, while values of relative expression were comparable to controls after cell treatment with apigenin or thymoquinone. The data obtained are comparable in the two cell lines, indicating a general pattern of observations (Figure 3 B-D).

2.2. Induction of LINE1 Expression by Some PSMs

Influence of PSMs on LINE1 expression was analyzed using two alternative methods: assessment of the expression levels of three LINE1 amplicons (A, B, C) and ORF1 LINE1 gene by qRT-PCR, and immunofluorescence/flow cytometry analysis of the cells with stained ORF1 LINE1 and γ-H2AX proteins.

2.2.1. Quantitative Estimation of LINE1 Expression Level in HeLa Cells Treated with PSMs

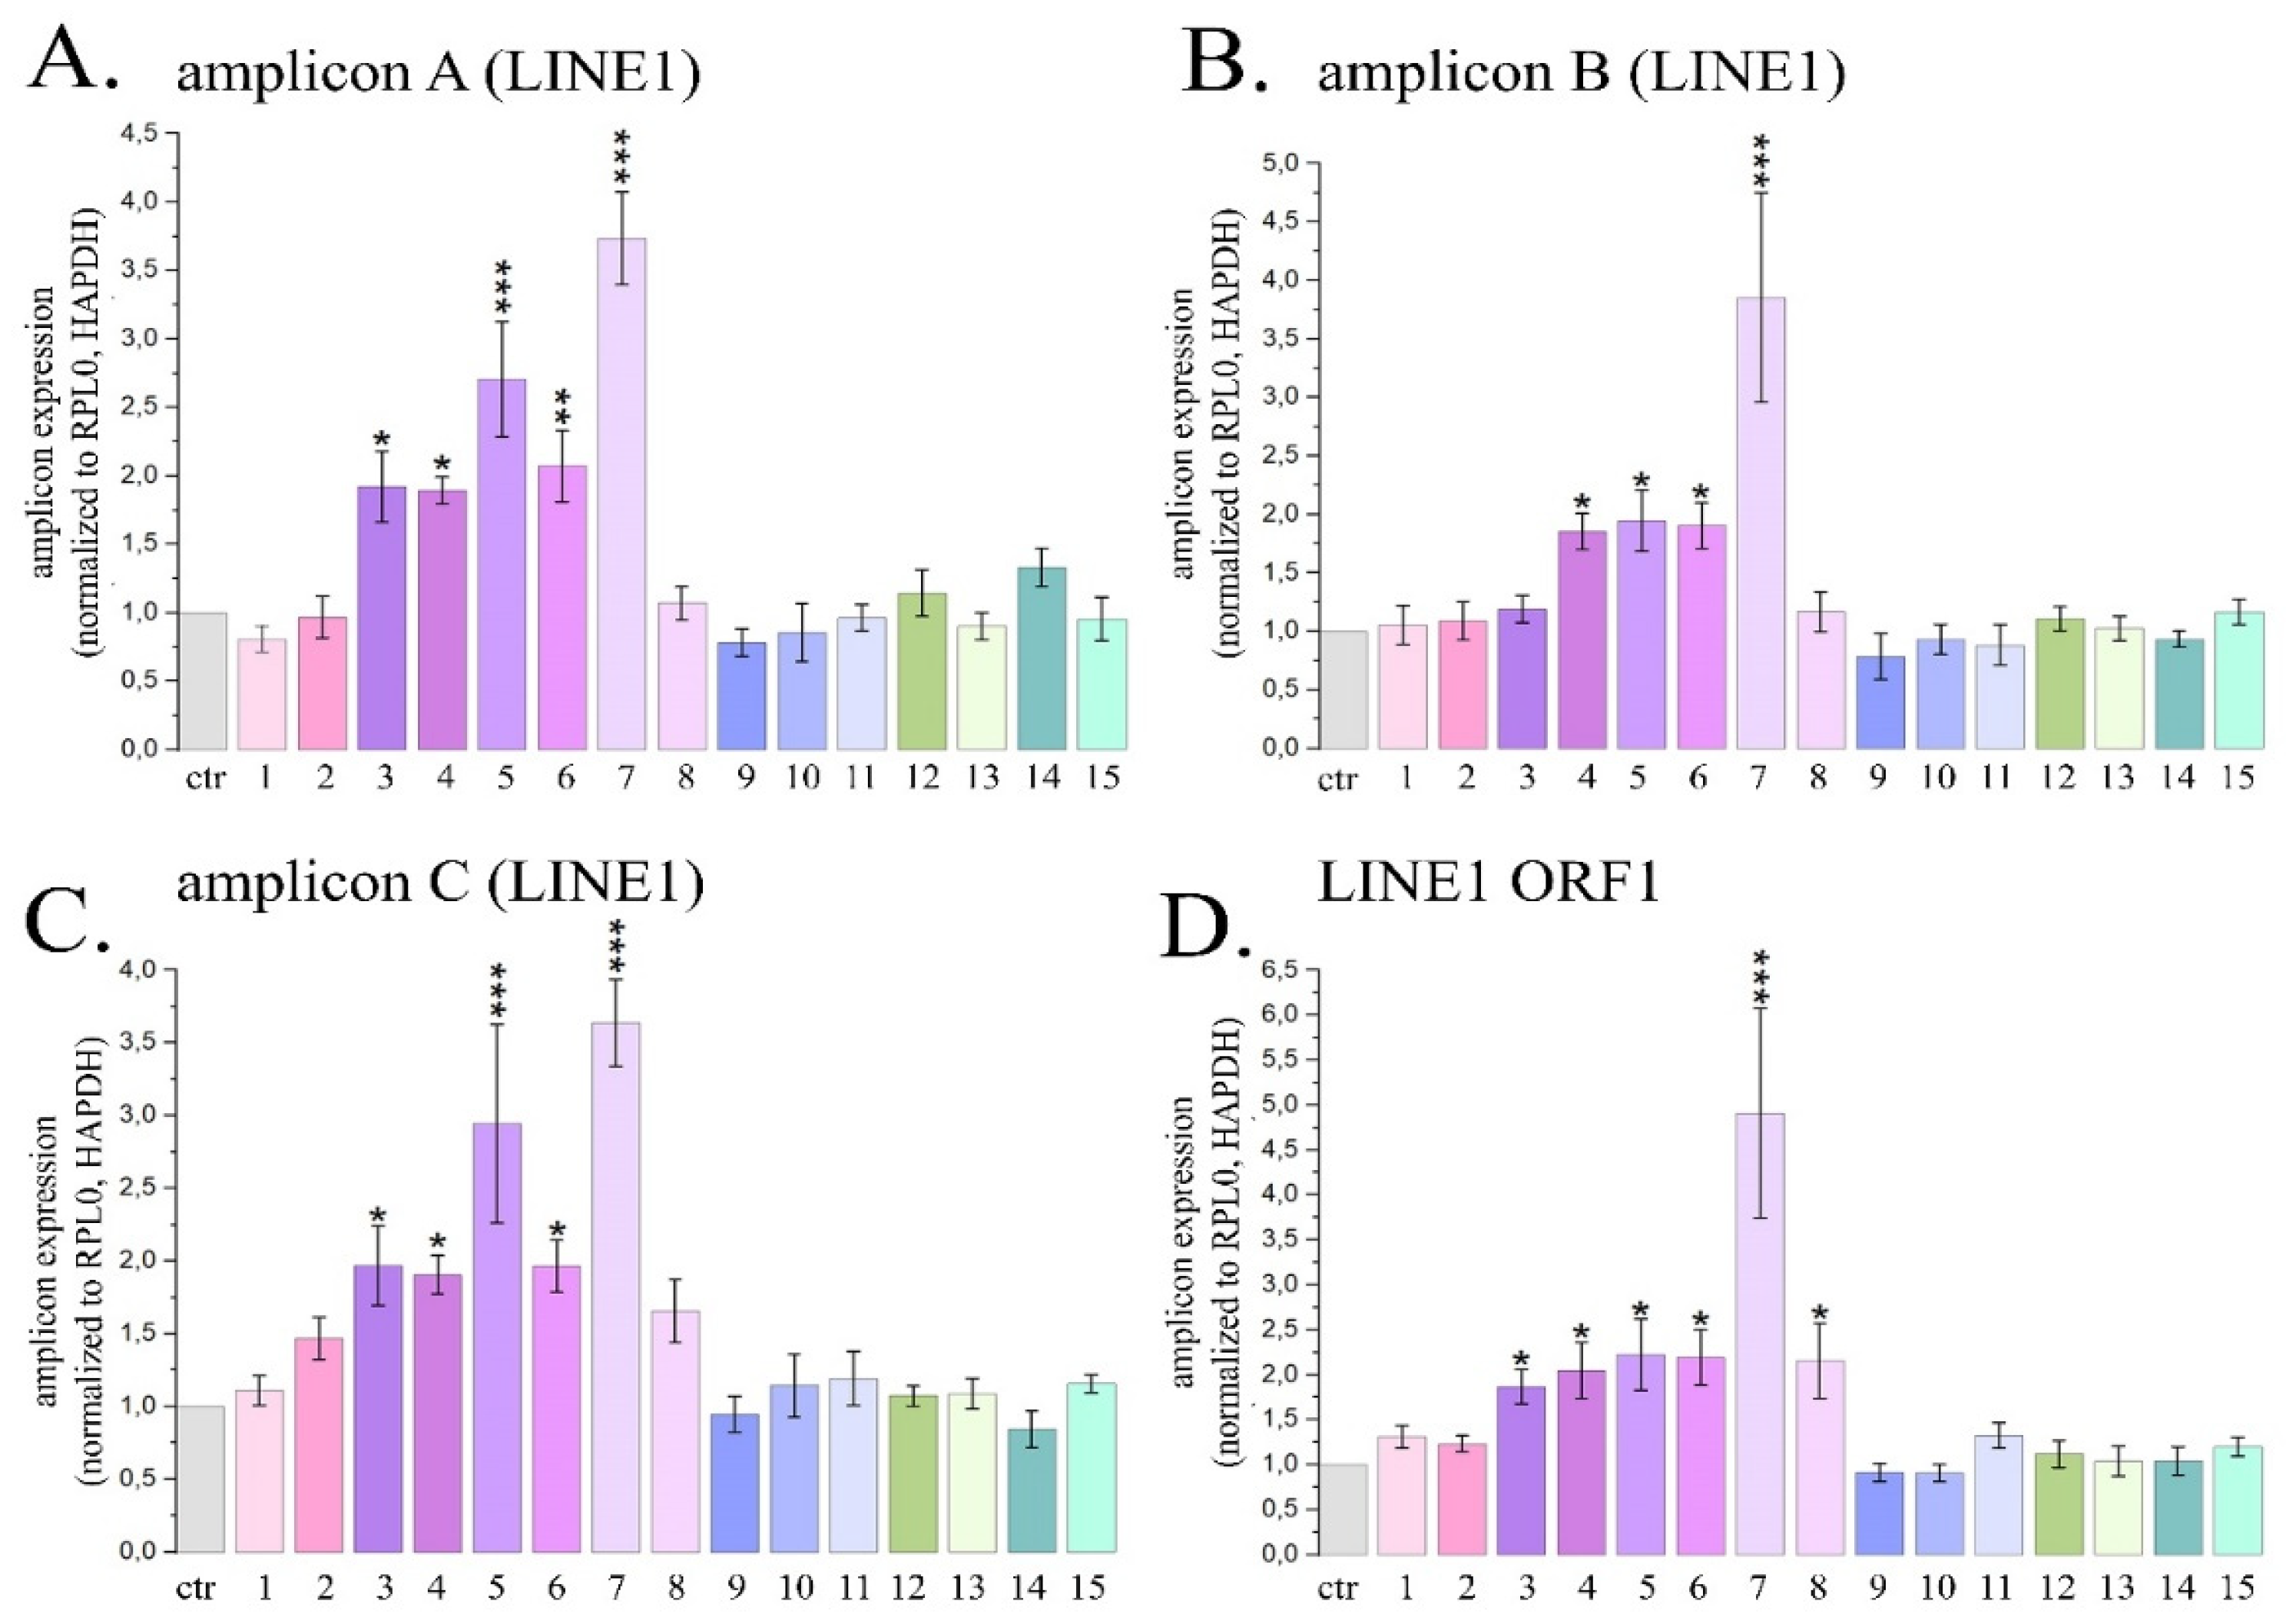
The most pronounced activation of the expression of transposable LINE1 sequences was observed when HeLa cells were treated with delphinidin. It caused the expression levels of LINE1 amplicons A, B and C to enhance by 3.7; 3.8 and 3.6±0.3 times, respectively, and also the expression level of the ORF1 LINE1 gene to increase by 4.9 times (Figure 4).
For resveratrol, naringenin, genistein and berberine, the average expression of LINE 1 amplicons increased by 1.7; 2.0; 2.5 and 1.9 times, and the expression of ORF1 LINE1 increased by 1.9; 2.2; 2.2 and 2.1 times, respectively. Cell treatment with curcumin was followed by a significant increase in the expression level of ORF1 LINE1 by 2.2 ± 0.4 times. The described changes in the expression levels of LINE1 amplicons and the ORF1 LINE1 gene were significant. Treatment of cells with other PSMs used in the study did not cause a statistically significant increase in the expression levels of LINE1 amplicones and/or ORF1 LINE1 gene. Thus, in this part of the study we demonstrated that 6 PSMs, in particular curcumin, berberine, delphinidin, naringenin, genistein and resveratrol, can enhance the activity of LINE1.

2.2.2. Analysis of the Amount of ORF1 LINE1 and γ-H2AX Proteins by Flow Cytometry in HeLa Cells Treated with PSM.

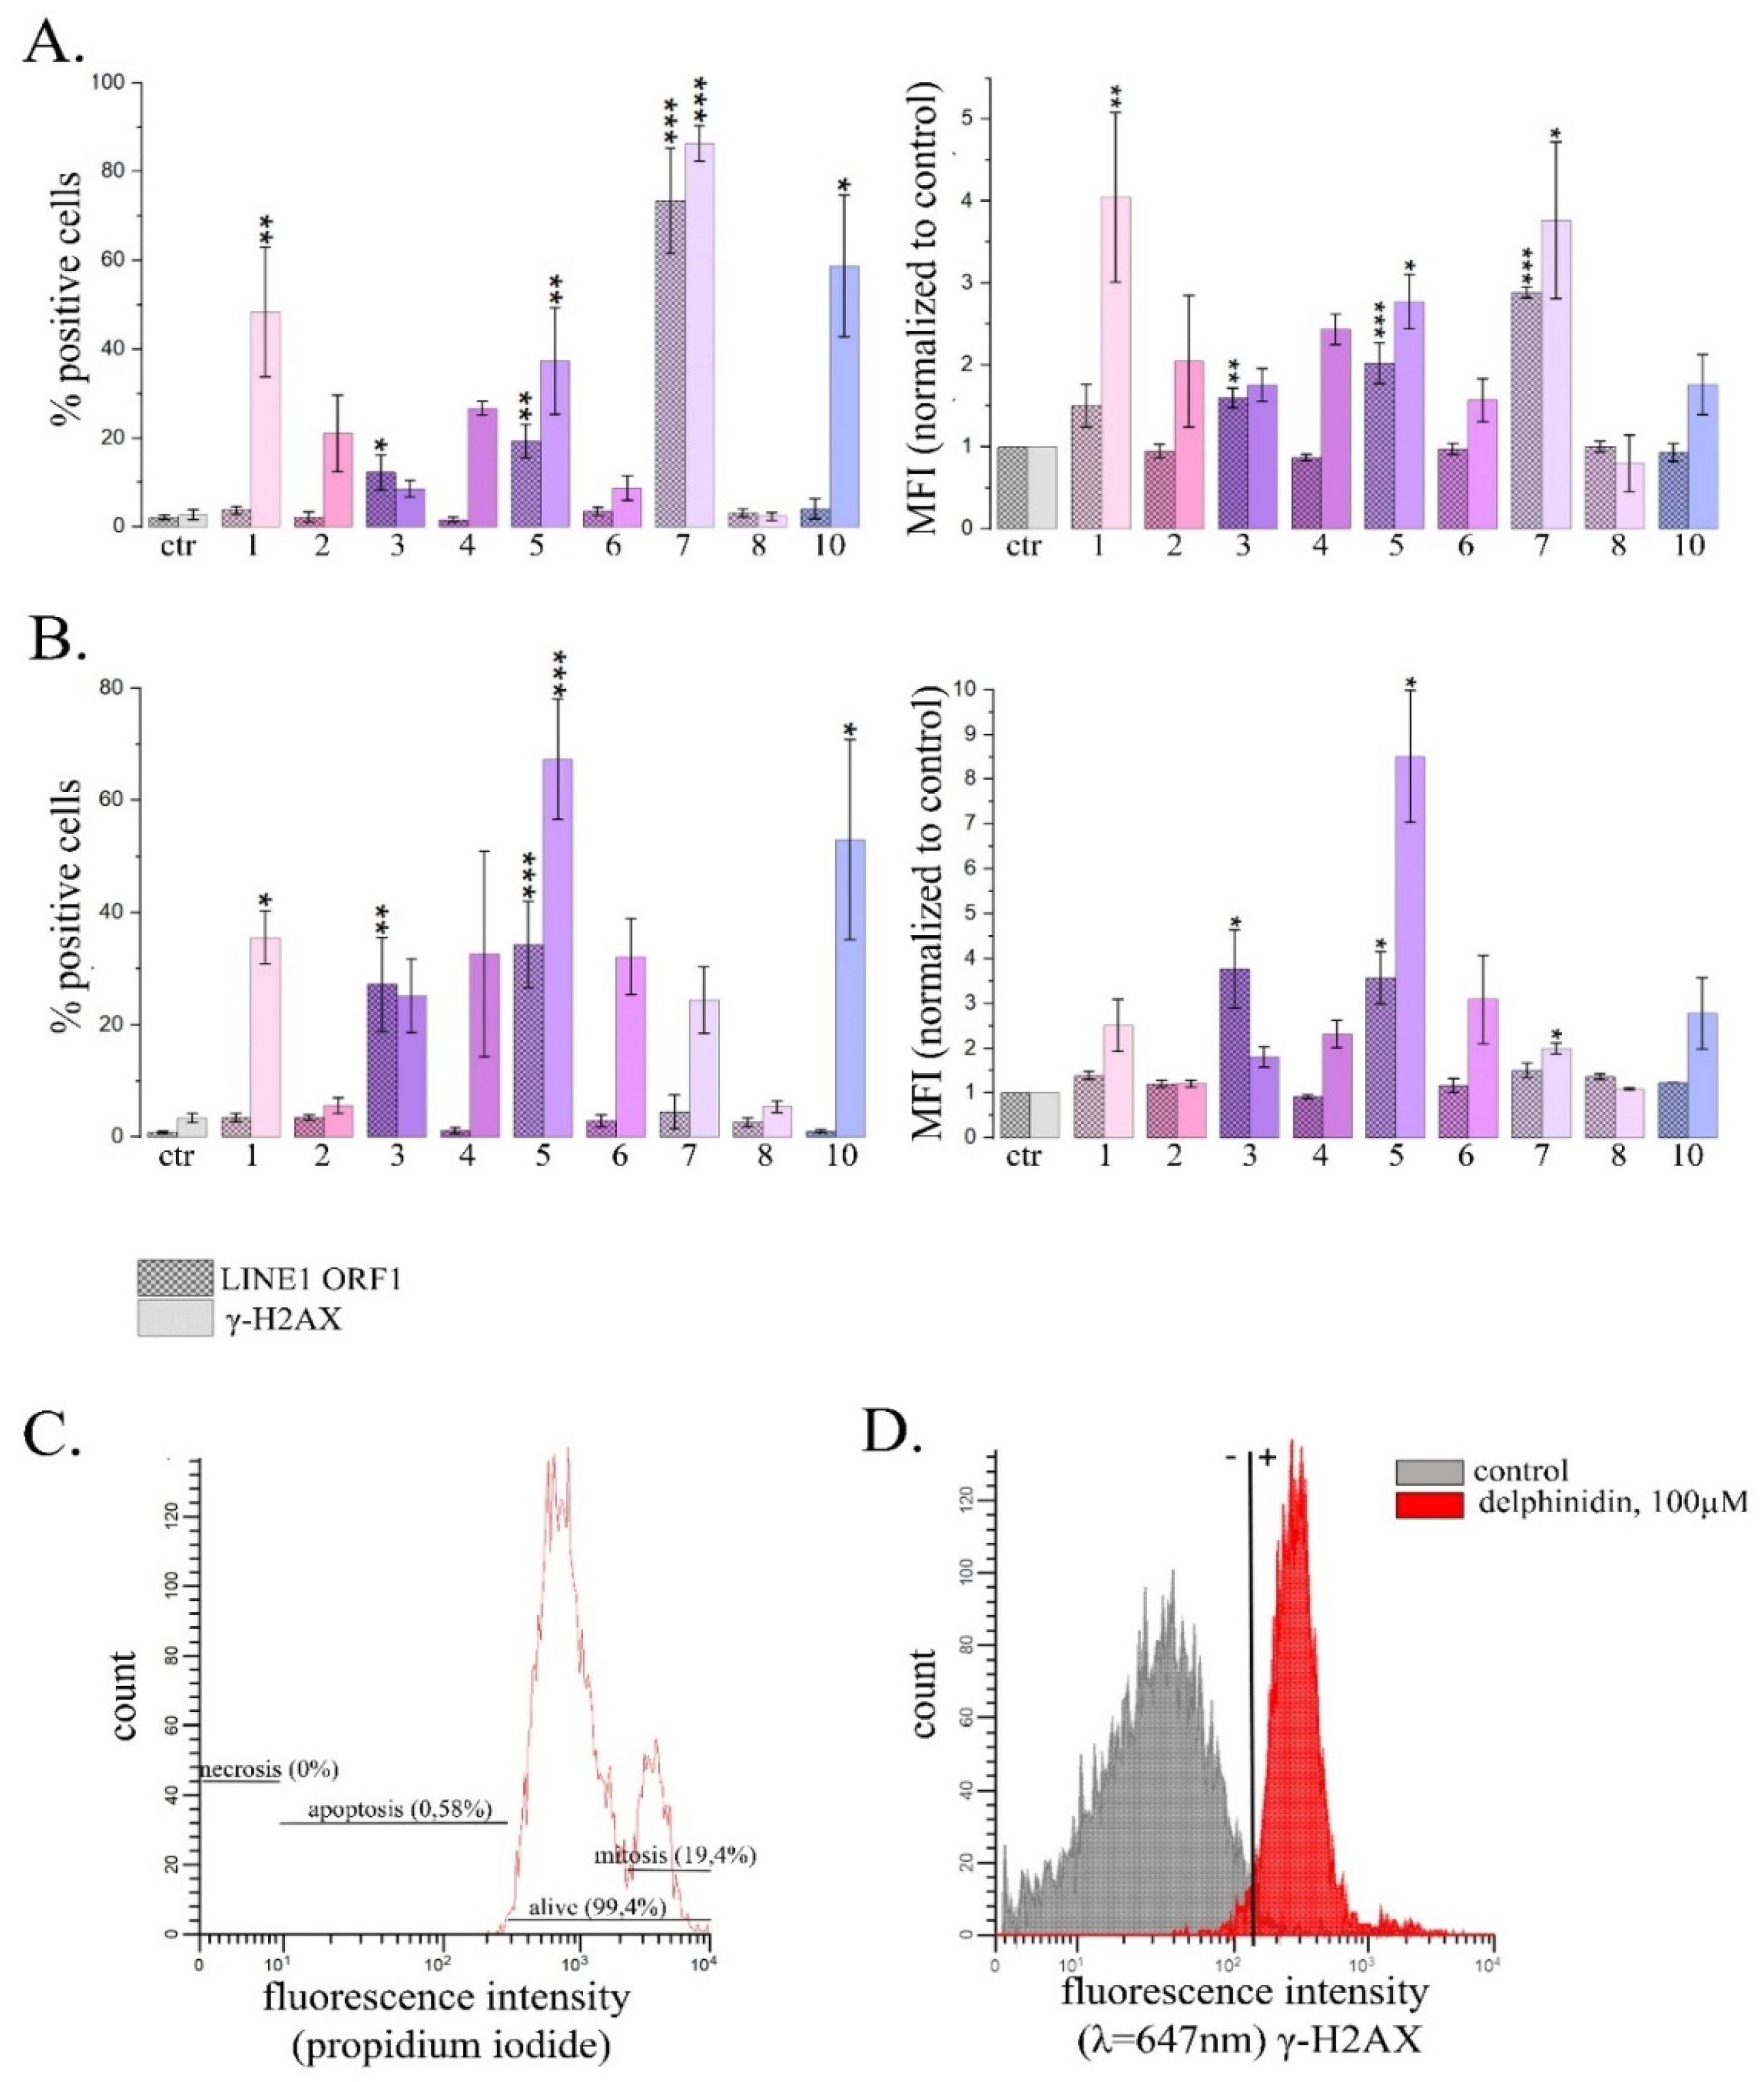
For analysis of LINE1 activity we used immunofluorescent staining with antibodies to ORF1 LINE1 and γ-H2AX proteins and analyzed populations of treated and untreated cells using flow cytometry. LINE1 retrotransposition causes appearance of DNA double-stranded breaks, and therefore γ-H2AX was used as one of the markers of active retrotransposition, despite the fact that it is not specific. It is considered to be a marker of the process. We also controlled the proportion of apoptotic cells (lower than 5%) to prevent possible interference of apoptosis and LINE1 retrotransposition (Figure 5A).
The most pronounced effect was observed for delphinidin. 24 h treatment with delphinidin caused the cells expressing LINE1 ORF1 protein increase by 2.9 times, and the average fluorescence intensity associated with γ-H2AX appearance increased by 3.8 times. Noteworthy, with an exposure time of 72 h, delphinidin did not induce significant changes. Genistein, on the contrary, caused a statistically significant increase in the average fluorescence intensity associated with both ORF1 LINE1 and γ-H2AX at an exposure time of 24 h by 2.0 times and 2.8 times, respectively, and after 72 h treatment at concentration of 60 μM it caused the increase by 3.6 and 8.5 times, respectively. For fisetin, only an increase in parameters associated with γ-H2AX was observed at an exposure time of 24 h. Resveratrol caused the statistically significant increase of the average fluorescence intensity associated with ORF1 LINE1 (3.7 times).
Thus, an alternative approach, although less sensitive, confirmed Influence of a number of PSMs on LINE1 expression.

3. Discussion

Over the last thirty years there has been great progress in understanding innate and adaptive immunity thanks to discovering different pattern recognition receptors (PRRs), which were shown to be associated with pathogens [49].
Four major sub-families of PRRs include more than 4 hundreds of receptors, in particular, toll-like receptors (TLR), nucleotide-binding oligomerization domain—Leucin Rich Repeats-containing receptors (NLR), the retinoic acid-inducible gene 1 (RIG-1)-like receptors, and the C-type lectin receptors [50]. PRRs discovery PRR discoveries allowed to explore the genius idea of «chemical binding of exogenous substances to cell», which dominated Paul Erlich’s life [49,51]. Based on the information about immune system functioning and the role of PRR activation in immune response, P.Matzinger elaborated “the Danger theory” that immune system responses are less concerned with the self/unself origin of the antigens than with the context of its influence on tissue homeostasis [52,53,54]. When PRRs interact with their ligands, presented as the exogenous molecules (pathogen and environmental chemicals) as well as some internal structures associated with homeostasis disorders, it induces cell response. This response is in turn manifested as significant changes in cell signaling, including type I IFN signaling activation, which is considered to focus on identifying viral nucleic acids in the midst of exceedingly hostderived RNA and DNA [55].
From this point of view, the agents, which change DNA-protein interactions and influence chromatin structure should also be recognized at the molecular level as the danger signals, as it could influence the pattern of the transcribed sequences including both coding and non-coding DNA. Recently we have found that a number of PSMs could cause linker histone depletion from chromatin [30]. It may be proposed that PRRs recognize these DNA-binding PSMs or some internal structures appearing after PSM-DNA complex formation.
We separated the studied PSMs into groups depending on their ability to cause depletion of linker histones: compounds 1 to 11 in our previous experiments have this ability while compounds 12 to 15 do not (Figure 6) [30]. A more comprehensive analysis of type I IFN signaling activation pattern where we used Human Signal Transduction Pathway Finder RT2Profiler PCR Array showed results that correspond perfectly to our hypothesis: we revealed IFN signaling activation under the treatment of compounds 1-11. However, it should be emphasized that while compounds 9-11 caused more intensive depletion of H1.4 compared to H1.2, their effects were lower than the effects of compounds inducing significant depletion of both H1.2 and H1.4.
These data mainly correspond to the results of our ISRE-mCherry reporter analysis, and we explain some small discrepancies of the PSM effects by the fact that in this part of the study we only used ISRE to assess IFN signaling activation. The result showing that PSMs 12-15, which did not cause linker histone depletion, are not able to induce type I IFN signaling activation was observed in both experiments, when two alternative techniques of IFN signaling analysis were applied.
In regards to previously published data of type I IFN signaling activation by some PSMs, it was not studied very intensively. However, our results correspond to the published data. In particular, it was shown that quercetin and fisetin activate IFN-α in RAW 264.7 cells [56]. In the study of Lin et al. resveratrol was shown to induce TLR9 activating IFN-β signaling [57]. Activation of IFN-β signaling was also revealed in RAW264.7 and HEK293T cells after the treatment with berberine [58]. Naringenin induced IFN-α activation in U2OS cells that was demonstrated both by luciferase reporter assay and RT-PCR [59]. Sanguinarine was shown to enhance type I INF signaling in cultured monocyte-derived macrophages [60]. In the study of Ullah et al., contradictory results were published regarding genestein ability to influence type I IFN signaling: using STING competent mouse L929 cells demonstrated genistein positive effect, stably expressing an ISRE-luciferase, while the same cells cocultured with STING-deficient cGAS-overexpressing human HEK-cGASlow cells showed the opposite effect, caused by STING blocking [61]. At the same time, another study observed antiviral activity of genistein, which is considered to be the result of type I IFN signaling activation [62].
Concerning PSMs 12-15 that do not cause linker histone depletion, the following data were published: thymoquinone was shown to actually decrease type I IFN signaling activity in RAW 264.7 and MCF-7 cells [63]; for genosinoside RB1 in CRFK 157 cells after 48h treatment, no activation of type I IFN signaling happened [64]; apigenin was shown to influence the inhibitory effect of IFN-α on cancer cell viability, wherein said viability is mediated by inhibition of 26S proteasome, however the effect of apigenin itself on type I IFN signaling was not analyzed [65].
Our research on the activation of IFN signaling by PSMs also revealed that PSMs 3-8, which causes significant depletion of the linker histone H1.2 and H1.4, activate LINE1 expression. This observation concurs with the results of Izquierdo-Bouldstridge et al. who demonstrated that histones H1.2 and/or H1.4 participate in repression of repeats [31]. It also perfectly corresponds to a well-known fact that LINE1 expression along with other TEs stimulate type I IFN signaling [32,66]. PSMs 9-11, which caused more intensive depletion of linker histone H1.4 than H1.2, induce IFN signaling less actively. It may be proposed that it is the consequences of the differential presence of H1 variants within transposable element classes and families described by Salinas-Pena et al. [32]. For instance, in T47D cells and to some extent also in HeLa cells H1.2 and H1.4 are enriched in different TEs, being H1.4 enriched in evolutionary recent SVA, Alu, L1 and LTR, while H1.2 is enriched in older TEs. Noteworthy, fisetin and quercetin (PSMs 1 and 2 in our study) did not induce LINE1 expression, although they do cause significant depletion of the histones H1.2 and H1.4. It also stands to mention that their chemical structures are very similar (Figure S1). Thus, we revealed that influence of PSMs on chromatin structure via linker histone depletion may be accompanied by LINE1 expression enhancement, which in turn impacts type I IFN signaling activation and, consequently, impacts anticancer activity of the corresponding PSMs group.
Additionally, literature search showed that for all the PSMs we studied their peculiar direct or indirect influence on PRR-induced signaling had already been described. In particular, it has already been shown that fisetin binds to TLR4, inhibits the binding of lipopolysaccharide (LPS) to the TLR4/MD2 complex and attenuates inflammatory reaction via TLR4/NLRP3 inflammasome pathway [67,68,69,70], while quercetin and resveratrol inhibit TLR4 and inflammasome activation [71,72,73,74]. Genistein [75] and berberine [40] were also demonstrated to have anti-inflammatory effects via suppression of the toll-like receptor 4-mediated signaling pathway. Naringenin suppresses inflammatory responses by regulation of cell surface TLR2 functioning [43]. Delphinidin inhibits LPS-induced TLR4, MUC8, and MUC5B expression [76]. Curcumin was described to inhibit extracellular TLR 2 and 4 and intracellular TLR9 [77]. Kaempferol attenuates TLR4/NF-κB pathway activation in LPS-activated BV2 cells [78]. Sanguinarine inhibits TLR4/NF-κB pathway in H9c2 cardiomyocytes and thus attenuates LPS-induced inflammation [79], while it up-regulates expressions of endosomal TLRs [80]. EGCG was also revealed to suppress LPS-induced TLR4 activity [81]. Apigenin inhibits the LPS-mediated inflammatory mediator production in keratinocytes by reducing the TLR4-dependent activation of Akt, mTOR, and NF-κB pathways [82]. Thymoquinone was shown to block TLR4/NF-κB signaling pathway in microglia cells [83]. Ginesinoside Rb1 reduces TLR4 dimerization followed by inhibiting the TLR4-MyD88-NF-κB/MAPK pathways [84]. Coumarines were shown to attenuate inflammation also via TLRs [85]. Thus, anti-inflammatory effects were described for all the PSMs considered in our study, which should impact anticancer activity along with type I IFN signaling accompanying the depletion of linker histones.

4. Materials and Methods

4.1. Cell Culture

The HeLa cell line was obtained from the Blokhin CRC cell collection. HeLa-TI-ISRE-mCherry cells were kindly provided by Dr. Gurova, the Department of Cell Stress Biology at Roswell Park (Buffalo, NY, USA). Preparation and maintenance of HeLa-TI-ISRE-mCherry cells, containing integrated red fluorescent protein (mCherry) gene, driven by a consensus IFN-sensitive response element (ISRE), were described previously [34]. Human breast cancer cells T47D were kindly provided by Dr. Jordan, Department of Molecular Genomics, Molecular Biology Institute of Barcelona IBMB-CSIC, Scientific Park of Barcelona, 08028 Barcelona, Catalonia, Spain. Cells were cultured in Dulbecco’s Modified Eagle Medium (DMEM, С420p, PanEco, Moscow, Russia) supplemented with L-glutamine (0.584 mg/mL) (F033Е, PanEco, Moscow, Russia), penicillin (50 U/mL), and streptomycin (50 µg/mL) (А063p, PanEco, Moscow, Russia) and 10% fetal bovine serum (Biowest, S1810-500, Nuaillé, France). Cell lines were incubated at 37 °C and 5% CO2. All cell lines were validated by STR profiling and tested negative for mycoplasma.

4.2. Plant Secondary Metabolites

All of the studied compounds were obtained from Chemlight, Moscow, Russia (1). We studied apigenin (CAS 520- 36-5), (1); berberine (CAS 633-65- 8), (1); coumarin (CAS 91-64-5), (1); curcumin (CAS 458-37-7), (1); delphinidin (CAS 13270- 61-6), (1); EGCG (CAS 989-51-5), (1); fisetin (CAS 528-48-3), (1); genistein (CAS 446-72-0), (1); ginsenoside Rb1 (CAS 41753-43-9), (1); kaempferol (CAS 520-18-3), (1); naringenin (CAS 480-41-1), (1); quercetin (CAS 117-39- 5), (1); resveratrol (CAS 501-36-0), (1); sanguinarine chloride hydrate (CAS 5578-73- 4), (1); thymoquinone (CAS 490-91-5), (1).

4.3. Other Chemicals and Reagents

Curaxin CBL0137 was provided by Incuron, Inc., Russia. TRIzol™ Reagent (15596026), Moloney Murine Leukemia Virus Reverse Transcriptase (M-MLV RT) (18057018) and Random(dN)10 (SB002) were purchased from Evrogen, Moscow, Russia. dNTP mix; deionized water, nuclease-free; Taq DNA polymerase; 10X Taq Turbo Buffer; SYBR® Green dye and primers were purchased from Evrogen, Moscow, Russia. Triton X-100 (CAS 9002-93-1) was purchased from BioInnlabs, Rostov-on-Don, Russia. Dimethyl sulfoxide (DMSO, 67-68-5 | 102952), cOmplete™, Mini Protease Inhibitor Cocktail (cat. 11836153001), Phosphate-buffered saline (PBS, P4417), bovine serum albumin (CAS 9048-46-8), IFN-α A Protein, Recombinant human (P01563) were purchased from Sigma Aldrich (Merck), Bengaluru, Karnataka, India. Versene Solution (Р080p), Trypsin-EDTA 0.25% solution with Hanks salts (P043p) and Phosphate-buffered saline (PBS, P4417) were purchased from PanEco, Moscow, Russia. DC™ Protein Assay Kit I (5000111EDU) was purchased from Bio-Rad (Moscow, Russia). Clarity Max™ Western ECL Substrate for Chemiluminescent Detection of Horseradish Peroxidase (HPR) Conjugates (cat. 1705062) was purchased from Helicon, Moscow, Russia. 2.5x Reaction mixture for qRT-PCR in the presence of SYBR Green I dye (M-427) was purchased from Syntol (Moscow, Russia). Antibodies LINE1-ORF1 (cat# MABC1152, 1:500) were purchased from Sigma Aldrich (Merck), Bengaluru, Karnataka, India; γ-H2AX (cat# ab26350, 1:700) and and Donkey Anti-Mouse IgG H&L (Alexa Fluor® 488, cat# ab150105; 1:1000)—from Abcam, Cambridge, UK).

4.4. Quantitative Reverse Transcriptase-Polymerase Chain Reaction for Analysis of Expression of LINE1 and PSM-Induced Interferon Signaling

For the assay, tumor cells (HeLa) were seeded in 6-well plates (105 cells per well in 2 ml DMEM) and incubated with various concentrations of compounds for 24 h and IFN-α (103UI/ml) used as a positive control for the IFN Signaling analysis. Total RNA was then extracted using TRIzol™ Reagent according to the manufacturer’s protocol. cDNA was synthesized using a reverse transcription reaction. Total RNA (1 μg, from both control and treated cells) was reverse transcribed using M-MLV RT reverse transcriptase and random Random(dN)10 in a reaction volume of 20 μl according to the manufacturer’s protocol (Evrogen, Russia). RNA quantification was performed using NanoDrop Lite (ThermoScientific, Waltham, MA, USA).
For analysis of expression of amplicones LINE1 qRT-PCR was carried out in a reaction mixture containing Master Mix (0.3 mM dNTP mix (10 mM each), 3 mM MgCl2, deionized water, nuclease-free, SYBR® Green dye, 10X Taq Turbo Buffer, 0.2 U/ µl Taq DNA polymerase), 0.2 µM forward and reverse primers, 5 ng of DNA template, in accordance with the manufacturer’s protocol (Evrogen, Russia). Thermal cycling conditions were as follows: initial denaturation step by heating at 95°C for 5 min, followed by 40 cycles of 15 s initial denaturation (at 95°C), 20 s at the appropriate melting temperature according to the primers, and 25 s extension at 72°C. Expression of the gene of interest was normalized to the constitutively expressed housekeeping genes RPL0 and HAPDH. The relative expression level was calculated for each sample using the 2−ΔΔCt method. All experiments were performed at least in triplicate biological replicates.
The sequences of the gene-specific primers used for qRT-PCR were as follows (Primer design from [47]):
LINE1_amplA_F: 5′GCCAAGATGGCCGAATAGGA 3′
LINE1_amplA_R: 5′AAATCACCCGTCTTCTGCGT 3′
LINE1_amplB_F: 5′CGAGATCAAACTGCAAGGCG 3′
LINE1_amplB_R: 5′CCGGCCGCTTTGTTTACCTA 3′
LINE1_amplC_F: 5′ TAAACAAAGCGGCCGGGAA 3′
LINE1_amplC_R: 5′ AGAGGTGGAGCCTACAGAGG 3′
LINE1_ORF1_F: 5′ ACCTGAAAGTGACGGGGAGA 3′
LINE1_ORF1_R: 5′CCTGCCTTGCTAGATTGGGG 3′
RPL0 F: 5′CCTTCTCCTTTGGGCTGGTCATCC A 3′
RPL0 R: 5′CAGACACTGGCAACATTGCGGACAC 3′
HAPDH F: 5′GTCTCCTCTGACTTCAACAGCG 3′
HAPDH R: 5′ACCACCCTGTTGCTGTAGCCAA 3′
The sequences of the gene-specific primers used for type I IFN signaling qRT-PCR were as follows (Primer design from [31]):
IFI27_F: 5′ TGCTCTCACCTCATCAGCAGT 3′
IFI27_R: 5′ CACAACTCCTCCAATCACAACT 3′
OASL_F: 5′ GGGACAGAGATGGCACTGAT 3′
OASL_R: 5′ AAATGCTCCTGCCTCAGAAA 3′
IRF1_F: 5′ TTTGTATCGGCCTGTGTGAATG 3′
IRF1_R: 5′ AAGCATGGCTGGGACATCA 3′
For analysis of gene expression of type I IFN signaling qRT-PCR was performed in 96-well Human Signal Transduction PathwayFinder™ RT 2 Profiler™ PCR Array plates (https://geneglobe.qiagen.com/us/product-groups/rt2-profiler-pcr-arrays/PAHS-064Z, Qiagen, PAHS-064Z, Hilden, Germany) according to the manufacturer’s protocol: 95°C for 10 min, then 40 cycles of 95°C for 15 s and 60°C for 1 min. Each RT2 Profiler PCR array contains gene-specific primers for qRT-PCR assays for a carefully screened set of 84 genes, consisting of IFNs, IFN receptors, IFN regulatory factors, and IFN-responsive genes (Table 1).
Expression of genes of interest was normalized to constitutively expressed housekeeping genes (ACTB, B2M, GAPDH, HPRT1, RPLP0). Relative expression levels were calculated for each sample using the 2−ΔΔCt method using the manufacturer’s software. All experiments were performed at least in triplicate biological replicates.

4.5. Analysis of ISRE-mCherry Reporter Activation in HeLa-TI-ISRE-mCherry Cells by Flow Cytometry

IFN response in HeLa-TI-ISRE-mCherry cells treated with PSMs was assessed by the proportion of the cells expressing mCherry driven by ISRE as well as by mCherry mean fluorescence intensity (MFI) using a BD FACSCanto™ II flow cytometer (BD Biosciences, San Jose, CA, USA). Cells were seeded in 6-well plates (105 cells per well in 2 ml DMEM) and incubated with PSM at non-toxic concentrations for 24 h. For PSMs inducing IFN response after 24 h treatment we studied the dynamics of their effects at 1, 6 and 24 h. After the treatment with PSMs cells were removed from the culture plates using Versene Solution and 0.25% trypsin-EDTA and washed with PBS. To maintain high cell viability, a PBS solution with 2% fetal bovine serum was used as a cell storage buffer. The concentration of dimethyl sulfoxide (DMSO) in the medium for all compounds did not exceed 0.01%. All experiments were performed in triplicate biological replicates. The obtained data were analyzed using WinList™ 3D software (Version 9.0.1, Verity Software House, https://www.vsh.com/products/winlist/index.asp, Topsham, ME, USA).).

4.6. Analysis of PSM Induced LINE1 Activation by Immunofluorescent Antibody Staining and Flow Cytometry

To analyze PSM induced LINE1 activation, HeLa cells were seeded in 6-well plates (105 cells per well in 2 ml DMEM). After 24 h, cells were treated with compounds of interest at IC20 or non-toxic concentrations and incubated for 24/72 h. Then, the cells were removed from the substrate with trypsin, washed three times with PBS and fixed in cold 4% paraformaldehyde for 15 min. After next three washes with PBS, they were permeabilized with cold 0.3% Triton-X100 for 7 minutes and blocked with bovine serum albumin for 1 h. Cells were immunofluorescently stained with antibodies to LINE1-ORF1, γ-H2AX, and subsequent binding with secondary antibodies AlexaFluor488 was carried out in the dark. Cells were washed with PBS and analyzed on a BD FACSCanto™ II flow cytometer (BD Biosciences, San Jose, CA, USA). Proportions of the cells positive for the fluorescent signal and the average intensity of the cell fluorescence normalized to the control were assessed. The obtained data were analyzed using WinList™ 3D software (Version 9.0.1, Verity Software House, https://www.vsh.com/products/winlist/index.asp, Topsham, ME, USA).

4.7. Annexin-FITC/Propidium Iodide Double Staining

Cells were stained with annexin V-FITC and PI to evaluate apoptosis by flow cytometry according to the manufacturer’s instructions to the FITC Anexin V Apoptosis Detection Kit I (Sigma-Aldrich, St. Louis, MI, USA). Cells were treated with maximum non-toxic concentrations of PSM for 24 h. After treatment, cells were collected, washed twice with ice-cold PBS, and resuspended in 0.5 mL of annexin/V-FITC/PI solution for 30 min in the dark according to manufacturer protocol. After staining at room temperature, cells were analyzed by the BD FACSCanto™ II flow cytometer (BD Biosciences, San Jose, CA, USA). For each sample, 10,000 events were acquired and positive FITC and/or PI cells were quantified using WinList™ 3D software (Version 9.0.1, Verity Software House, https://www.vsh.com/products/winlist/index.asp, Topsham, ME, USA).

4.8. Statistical Analysis

We compared the data from the experimental and control groups using one-way analysis of variance (ANOVA) and Dunnett’s post hoc test. Differences between groups were considered significant at a p-value <0.05. Statistical analyses were performed using GraphPad Prism 8.3.0 (GraphPad Software Inc., San Diego, CA, USA).

5. Conclusions

PSMs are important chemical components of the plants, actively used in human nutrition. Their active use may be explained by PSMs influence on human health and considered to be a result of coevolution of flora and fauna. Out study revealed that linker histone depletion from chromatin fraction, caused by DNA-binding anticancer PSMs, is linked to their activating influence on type I IFN signaling. It let us propose a new mechanism of type I INF signaling activation by environmental chemicals, which cause chromatin remodeling. It is in agreement with “the Danger theory” proposed by P.Matzinger, however it requires additional studies to elucidate damage associated molecular patterns formed after PSM-DNA interaction, as well as their PRRs and peculiar gene targets of activated PRRs, that represent a new field of PSM investigations. Moreover, further studies are needed to compare the effects of PSMs with rather similar as well as different chemical structures to examine peculiar new data, important to develop anticancer chromatin remodeling drugs.

Supplementary Materials

The following supporting information can be downloaded at the website of this paper posted on Preprints.org, Supplementary Material_1 (Table S1, Figure S1), Supplementary Material_2 (Table S2).

Author Contributions

Conceptualization, O.V. and M.Y.; methodology, P.Ch., T.Z. and A.B..; software, A.B..; validation, A.O..; formal analysis, I.A., Kh.M., A.O. and P.Sh.; investigation, O.V., I.A., Kh.M. and P.Sh.; resources, I.A.; writing—original draft preparation, O.V. and M.Y.; writing—review and editing, G.B. and K.K..; visualization, O.A. and M.Y.; supervision, A.J. and I.B..; project administration, G.B. All authors have read and agreed to the published version of the manuscript.

Funding

The research was supported by the Russian Science Foundation grant 23-25-00276.

Institutional Review Board Statement

Not applicable.

Data Availability Statement

Data presented in this study are contained within this article and in the supplementary materials, or are available upon request to the corresponding author.

Acknowledgments

We would like to thanks I. Dronova for the help in translating the article.

Conflicts of Interest

The authors declare no conflicts of interest.

References

  1. Barnes, S. Effect of genistein on in vitro and in vivo models of cancer. The Journal of Nutrition. 1995. 125, 3 Suppl, 777S-783S. [CrossRef]
  2. Bishayee, A. Cancer prevention and treatment with resveratrol: from rodent studies to clinical trials. Cancer Prevention Research (Philadelphia, Pa.). 2009. 409–418. [CrossRef]
  3. Kisková, T., Ekmekcioglu, C., Garajová, M. et al. A combination of resveratrol and melatonin exerts chemopreventive effects in N-methyl-N-nitrosourea-induced rat mammary carcinogenesis. European journal of cancer prevention: the official journal of the European Cancer Prevention Organisation (ECP). 2012. 21, 2, 163–170. [CrossRef]
  4. Whitsett, T. G. and Lamartiniere, C. A. Genistein and resveratrol: mammary cancer chemoprevention and mechanisms of action in the rat. Expert Review of Anticancer Therapy. 2006. 6, 12, 1699–1706. [CrossRef]
  5. Fantini, M., Benvenuto, M., Masuelli, L. et al. In Vitro and in Vivo Antitumoral Effects of Combinations of Polyphenols, or Polyphenols and Anticancer Drugs: Perspectives on Cancer Treatment. International Journal of Molecular Sciences. 2015. 16, 5, 9236–9282. [CrossRef]
  6. Jantan, I., Ahmad, W. and Bukhari, S. N. A. Plant-derived immunomodulators: an insight on their preclinical evaluation and clinical trials. Frontiers in Plant Science. 2015. 6, 655. [CrossRef]
  7. Pezzuto, J. M. Resveratrol: Twenty Years of Growth, Development and Controversy. Biomolecules & Therapeutics. 2019. 27, 1, 1–14. [CrossRef]
  8. Russo, M., Russo, G. L., Daglia, M. et al. Understanding genistein in cancer: The “good” and the “bad” effects: A review. Food Chemistry. 2016. 196, 589–600. [CrossRef]
  9. Chen, Y.-X., Gao, Q.-Y., Zou, T.-H. et al. Berberine versus placebo for the prevention of recurrence of colorectal adenoma: a multicentre, double-blinded, randomised controlled study. The Lancet Gastroenterology & Hepatology. 2020. 5, 3, 267–275. [CrossRef]
  10. Thomas, R., Williams, M., Sharma, H. et al. A double-blind, placebo-controlled randomised trial evaluating the effect of a polyphenol-rich whole food supplement on PSA progression in men with prostate cancer—the UK NCRN Pomi-T study. Prostate Cancer and Prostatic Diseases. 2014. 17, 2, 180–186. [CrossRef]
  11. Zhang, H., Gordon, R., Li, W. et al. Genistein treatment duration effects biomarkers of cell motility in human prostate. PLOS ONE. 2019. 14, 3, e0214078. [CrossRef]
  12. Britton, R. G. Kovoor, C. and Brown, K. Direct molecular targets of resveratrol: identifying key interactions to unlock complex mechanisms: Direct molecular targets of resveratrol. Annals of the New York Academy of Sciences. 2015. 1348, 1, 124–133. [CrossRef]
  13. Khan, F., Niaz, K., Maqbool, F. et al. Molecular Targets Underlying the Anticancer Effects of Quercetin: An Update. Nutrients. 2016. 8, 9, 529. [CrossRef]
  14. Nagaraju, G. P. Zafar, S. F. and El-Rayes, B. F. Pleiotropic effects of genistein in metabolic, inflammatory, and malignant diseases. Nutrition Reviews. 2013. 71, 8, 562–572. [CrossRef]
  15. Qadir, M. I., Naqvi, S. T. Q. and Muhammad, S. A. Curcumin: a Polyphenol with Molecular Targets for Cancer Control. Asian Pacific journal of cancer prevention: APJCP. 2016. 17, 6, 2735–2739.
  16. N’soukpoé-Kossi, C. N., Bourassa, P., Mandeville, J. S. et al. Structural modeling for DNA binding to antioxidants resveratrol, genistein and curcumin. Journal of Photochemistry and Photobiology B: Biology. 2015. 151, 69–75. [CrossRef]
  17. Kanakis, C. D., Tarantilis, P. A., Polissiou, M. G. and Tajmir-Riahi, H.-A. Interaction of Antioxidant Flavonoids with tRNA: Intercalation or External Binding and Comparison with Flavonoid-DNA Adducts. DNA and Cell Biology. 2006. 25, 2, 116–123. [CrossRef]
  18. Nafisi, S. Hashemi, M., Rajabi, M. and Tajmir-Riahi, H. A. DNA Adducts with Antioxidant Flavonoids: Morin, Apigenin, and Naringin. DNA and Cell Biology. 2008. 27, 8, 433–442. [CrossRef]
  19. Bhattacharjee, S. Chakraborty, S., Sengupta, P. K. and Bhowmik, S. Exploring the Interactions of the Dietary Plant Flavonoids Fisetin and Naringenin with G-Quadruplex and Duplex DNA, Showing Contrasting Binding Behavior: Spectroscopic and Molecular Modeling Approaches. The Journal of Physical Chemistry. B. 2016. 120, 34, 8942–8952. [CrossRef]
  20. Galindo-Murillo, R. and Cheatham, T. E. Computational DNA binding studies of (–)-epigallocatechin-3-gallate. Journal of Biomolecular Structure and Dynamics. 2018. 36, 13, 3311–3323. [CrossRef]
  21. Khurana, S. Kukreti, S. and Kaushik, M. Designing a two-stage colorimetric sensing strategy based on citrate reduced gold nanoparticles: Sequential detection of Sanguinarine (anticancer drug) and visual sensing of DNA. Spectrochimica Acta Part A: Molecular and Biomolecular Spectroscopy. 2021. 246, 119039. [CrossRef]
  22. Basu, A. and Kumar, G. S. Biophysical studies on curcumin–deoxyribonucleic acid interaction: Spectroscopic and calorimetric approach. International Journal of Biological Macromolecules. 2013. 62, 257–264. [CrossRef]
  23. Pandya, N. Khan, E., Jain, N. et al. Curcumin analogs exhibit anti-cancer activity by selectively targeting G-quadruplex forming c-myc promoter sequence. Biochimie. 2021. 180, 205–221. [CrossRef]
  24. Mikutis, G., Karaköse, H., Jaiswal, R. et al. Phenolic promiscuity in the cell nucleus--epigallocatechingallate (EGCG) and theaflavin-3,3′-digallate from green and black tea bind to model cell nuclear structures including histone proteins, double stranded DNA and telomeric quadruplex DNA. Food & Function. 2013. 4, 2, 328–337. [CrossRef]
  25. Bhattacharjee, S., Chakraborty, S., Chorell, E. et al. Importance of the hydroxyl substituents in the B–ring of plant flavonols on their preferential binding interactions with VEGF G–quadruplex DNA: Multi-spectroscopic and molecular modeling studies. International Journal of Biological Macromolecules. 2018. 118, 629–639. [CrossRef]
  26. Dickerhoff, J., Brundridge, N., McLuckey, S. A. and Yang, D. Berberine Molecular Recognition of the Parallel MYC G-Quadruplex in Solution. Journal of medicinal chemistry. 2021. 64, 21, 16205–16212. [CrossRef]
  27. Jarosova, P., Paroulek, P., Rajecky, M. et al. Naturally occurring quaternary benzo[c]phenanthridine alkaloids selectively stabilize G-quadruplexes. Physical chemistry chemical physics: PCCP. 2018. 20, 33, 21772–21782. [CrossRef]
  28. Tawani, A. Mishra, S. K. and Kumar, A. Structural insight for the recognition of G-quadruplex structure at human c-myc promoter sequence by flavonoid Quercetin. Scientific Reports. 2017. 7, 3600. [CrossRef]
  29. Salem, A. A., El Haty, I. A., Abdou, I. M. and Mu, Y. Interaction of human telomeric G-quadruplex DNA with thymoquinone: A possible mechanism for thymoquinone anticancer effect. Biochimica et Biophysica Acta (BBA)—General Subjects. 2015. 1850, 2, 329–342. [CrossRef]
  30. Vlasova, O., Antonova, I., Zenkov, R. et al. Anticancer Plant Secondary Metabolites Induce Linker Histone Depletion from Chromatin. Frontiers in Bioscience-Landmark, 2024, 29(7). [CrossRef]
  31. Izquierdo-Bouldstridge, A., Bustillos, A., Bonet-Costa, C. et al. Histone H1 depletion triggers an interferon response in cancer cells via activation of heterochromatic repeats. Nucleic Acids Research. 2017. 45, 20, 11622. [CrossRef]
  32. Salinas-Pena M, Serna-Pujol N, Jordan A. Genomic profiling of six human somatic histone H1 variants denotes that H1X accumulates at recently incorporated transposable elements. Nucleic Acids Res. 2024 Feb 28;52(4):1793-1813. [CrossRef]
  33. Healton, S. E., Pinto, H. D., Mishra, L. N. et al. H1 linker histones silence repetitive elements by promoting both histone H3K9 methylation and chromatin compaction. Proc Natl Acad Sci USA. 2020. 117(25):14251-14258. [CrossRef]
  34. Leonova, K., Safina, A., Nesher, E., Sandlesh, P. et al. TRAIN (Transcription of Repeats Activates INterferon) in response to chromatin destabilization induced by small molecules in mammalian cells. Elife. 2018. 7:e30842. [CrossRef]
  35. Stilp, A. C., Scherer, M., König, P., Fürstberger, A. et al. The chromatin remodeling protein ATRX positively regulates IRF3-dependent type I interferon production and interferon-induced gene expression. PLoS Pathog. 2022. 18(8):e1010748. [CrossRef]
  36. Platanias, L.C. Mechanisms of type-I- and type-II-interferon-mediated signalling. Nat Rev Immunol. 2005. 5(5):375-86. [CrossRef]
  37. Petrova, L., Bunz, F. Interferons in Colorectal Cancer Pathogenesis and Therapy. Dis Res. 2024. 4(1):31-39. [CrossRef]
  38. Jiao, F. and Gong, Z. The Beneficial Roles of SIRT1 in Neuroinflammation-Related Diseases. Oxidative Medicine and Cellular Longevity. 2020. 6782872. [CrossRef]
  39. Alesci, A., Nicosia, N., Fumia, A. et al. Resveratrol and Immune Cells: A Link to Improve Human Health. Molecules. 2022. 27, 2, 424. [CrossRef]
  40. Sun, J., Zeng, Q., Wu, Z. et al. Berberine inhibits NLRP3 inflammasome activation and proinflammatory macrophage M1 polarization to accelerate peripheral nerve regeneration. Neurotherapeutics. 2024. 21, 4, e00347. [CrossRef]
  41. Warowicka, A., Nawrot, R. and Goździcka-Józefiak, A. Antiviral activity of berberine. Archives of Virology. 2020. 165, 9, 1935–1945. [CrossRef]
  42. Lani, R., Teoh, B.-T., Sam, S.-S. et al. Fisetin Modulates Toll-like Receptor-Mediated Innate Antiviral Response in Chikungunya Virus-Infected Hepatocellular Carcinoma Huh7 Cells. Immuno. 2022. 2, 4, 703–719. [CrossRef]
  43. Kataoka, H., Saeki, A., Hasebe, A. et al. Naringenin suppresses Toll-like receptor 2-mediated inflammatory responses through inhibition of receptor clustering on lipid rafts. Food Science & Nutrition. 2020. 9, 2, 963–972. [CrossRef]
  44. Yu, J., Shi, H., Song, K. et al. Naringenin Improves Innate Immune Suppression after PRRSV Infection by Reactivating the RIG-I-MAVS Signaling Pathway, Promoting the Production of IFN-I. Viruses. 2023. 15, 11, 2172. [CrossRef]
  45. Sunthamala, N., Suebsamran, C., Khruaphet, N. et al. Sanguinarine and Chelidonine Synergistically Induce Endosomal Toll-like Receptor and M1-Associated Mediators Expression. Journal of Pure and Applied Microbiology. 2020. 14(4):2351-2361. [CrossRef]
  46. Bhaskar, S. and Helen, A. Quercetin modulates toll-like receptor-mediated protein kinase signaling pathways in oxLDL-challenged human PBMCs and regulates TLR-activated atherosclerotic inflammation in hypercholesterolemic rats. Molecular and Cellular Biochemistry. 2016. 423, 1–2, 53–65. [CrossRef]
  47. De Cecco, M., Ito, T., Petrashen, A. P., Elias, A.E. et al. L1 drives IFN in senescent cells and promotes age-associated inflammation. Nature. 2019. 566(7742):73-78. [CrossRef]
  48. Zenkov, R. G., Kirsanov, K. I., Ogloblina, A. M., Vlasova, O. A. et al. Effects of G-Quadruplex-Binding Plant Secondary Metabolites on c-MYC Expression. Int J Mol Sci. 2022. 23(16):9209. [CrossRef]
  49. Amarante-Mendes, G. P., Adjemian, S., Branco, L. M. et al. Pattern Recognition Receptors and the Host Cell Death Molecular Machinery. Front Immunol. 2018, 9, 2379. [CrossRef]
  50. Jiao, F., Gong, Z. The Beneficial Roles of SIRT1 in Neuroinflammation-Related Diseases. Oxid Med Cell Longev. 2020. 2020:6782872. [CrossRef]
  51. Silverstein, A. M. Paul Ehrlich’s passion: the origins of his receptor immunology. Cell Immunol. 1999. 194(2):213-21. [CrossRef]
  52. Matzinger, P. Tolerance, danger, and the extended family. Annu Rev Immunol. 1994. 12:991-1045. [CrossRef]
  53. Matzinger, P. The danger model: a renewed sense of self. Science. 2002. 296(5566):301-5. [CrossRef]
  54. Ancona, G., Alagna, L., Alteri, C. et al. Gut and airway microbiota dysbiosis and their role in COVID-19 and long-COVID. Front Immunol. 2023 Mar 8;14:1080043. [CrossRef]
  55. Stetson, D. B., Medzhitov, R. Type I interferons in host defense. Immunity. 2006. 25(3):373-81. [CrossRef]
  56. Seo, D. J., Choi, C. Inhibitory mechanism of five natural flavonoids against murine norovirus. Phytomedicine. 2017 Jul. 30:59-66. [CrossRef]
  57. Lin, C. J., Lin, H. J., Chen, T.H. et al. Polygonum cuspidatum and its active components inhibit replication of the influenza virus through toll-like receptor 9-induced interferon beta expression. PLoS One. 2015. 6;10(2):e0117602. [CrossRef]
  58. Kim, J. H., Weeratunga, P., Kim, M. S. et al. Inhibitory effects of an aqueous extract from Cortex Phellodendri on the growth and replication of broad-spectrum of viruses in vitro and in vivo. BMC Complement Altern Med. 2016. 16:265. [CrossRef]
  59. Fast, D. J., Stern, N. P., Chuang, J. et al. Flavanones common to citrus fruits activate the interferon-stimulated response element by stimulating expression of IRF7. Journal of Food Bioactives. 2019. 8. [CrossRef]
  60. Akash, S., Bayil, I., Rahman, Md A. et al. Target specific inhibition of West Nile virus envelope glycoprotein and methyltransferase using phytocompounds: an in silico strategy leveraging molecular docking and dynamics simulation. Front. Microbiol. 2023. 14. [CrossRef]
  61. Ullah, T. R., Balka, K. R., Ambrose, R. L et al. Genistein Targets STING-Driven Antiviral Responses. mBio. 2022. 13(4):e0206422. [CrossRef]
  62. LeCher, J. C, Diep, N., Krug, P. W., Hilliard, J. K. Genistein Has Antiviral Activity against Herpes B Virus and Acts Synergistically with Antiviral Treatments to Reduce Effective Dose. Viruses. 2019. 11(6):499. [CrossRef]
  63. Aziz, N., Son, Y. J., Cho, J. Y. Thymoquinone Suppresses IRF-3-Mediated Expression of Type I Interferons via Suppression of TBK1. Int J Mol Sci. 2018. 19(5):1355. [CrossRef]
  64. Lee, M. H., Seo, D. J., Kang, J. H. et al. Expression of antiviral cytokines in Crandell-Reese feline kidney cells pretreated with Korean red ginseng extract or ginsenosides. Food Chem Toxicol. 2014. 70:19-25. [CrossRef]
  65. Li, S., Yang, L. J., Wang, P. et al. Dietary apigenin potentiates the inhibitory effect of interferon-α on cancer cell viability through inhibition of 26S proteasome-mediated interferon receptor degradation. Food Nutr Res. 2016. 60:31288. [CrossRef]
  66. Volkman, H. E., Stetson, D. B. The enemy within: endogenous retroelements and autoimmune disease. Nat Immunol. 2014. 15(5):415-22. [CrossRef]
  67. Molagoda, I. M. N., Athapaththu, A. M. G. K, Choi, Y. H. et al. Fisetin Inhibits NLRP3 Inflammasome by Suppressing TLR4/MD2-Mediated Mitochondrial ROS Production. Antioxidants (Basel). 2021. 10(8):1215. [CrossRef]
  68. Jiang, K., Yang, J., Xue, G. et al. Fisetin Ameliorates the Inflammation and Oxidative Stress in Lipopolysaccharide-Induced Endometritis. J Inflamm Res. 2021. 14:2963-2978. [CrossRef]
  69. Huang, X., Shen, H., Liu, Y. et al. Fisetin attenuates periodontitis through FGFR1/TLR4/NLRP3 inflammasome pathway. Int Immunopharmacol. 2021. 95:107505. [CrossRef]
  70. Lani, R., Teoh, B.-T., Sam, S.-S. et al. Fisetin Modulates Toll-like Receptor-Mediated Innate Antiviral Response in Chikungunya Virus-Infected Hepatocellular Carcinoma Huh7 Cells. Immuno. 2022. 2: 703-719. [CrossRef]
  71. Domiciano, T. P., Wakita, D., Jones, H.D. et al. Quercetin Inhibits Inflammasome Activation by Interfering with ASC Oligomerization and Prevents Interleukin-1 Mediated Mouse Vasculitis. Sci Rep. 2017. 7:41539. [CrossRef]
  72. Alattar, A., Alshaman, R., Althobaiti, Y. S. et al. Quercetin Alleviated Inflammasome-Mediated Pyroptosis and Modulated the mTOR/P70S6/P6/eIF4E/4EBP1 Pathway in Ischemic Stroke. Pharmaceuticals (Basel). 2023. 16(8):1182. [CrossRef]
  73. Malaguarnera, L. Influence of Resveratrol on the Immune Response. Nutrients. 2019. 11(5):946. [CrossRef]
  74. Wang, B., Bellot, G. L., Iskandar, K. et al. Resveratrol attenuates TLR-4 mediated inflammation and elicits therapeutic potential in models of sepsis. Sci Rep. 2020. 10(1):18837. [CrossRef]
  75. Jeong, J. W., Lee, H. H., Han, M. H. et al. Anti-inflammatory effects of genistein via suppression of the toll-like receptor 4-mediated signaling pathway in lipopolysaccharide-stimulated BV2 microglia. Chem Biol Interact. 2014. 212:30-9. [CrossRef]
  76. Bae, C. H., Jeon, B. S., Choi, Y. S. et al. Delphinidin Inhibits LPS-Induced MUC8 and MUC5B Expression Through Toll-like Receptor 4-Mediated ERK1/2 and p38 MAPK in Human Airway Epithelial Cells. Clin Exp Otorhinolaryngol. 2014. 7(3):198-204. [CrossRef]
  77. Shen, X. Y., Liu, X. P., Song, C. K. et al. Genome-wide analysis reveals alcohol dehydrogenase 1C and secreted phosphoprotein 1 for prognostic biomarkers in lung adenocarcinoma. J Cell Physiol. 2019. 234(12):22311-22320. [CrossRef]
  78. Chang, S., Li, X., Zheng, Y. et al. Kaempferol exerts a neuroprotective effect to reduce neuropathic pain through TLR4/NF-ĸB signaling pathway. Phytother Res. 2022. 36(4):1678-1691. [CrossRef]
  79. Meng, Y. Y., Liu, Y., Hu, Z. F. et al. Sanguinarine Attenuates Lipopolysaccharide-induced Inflammation and Apoptosis by Inhibiting the TLR4/NF-κB Pathway in H9c2 Cardiomyocytes. Curr Med Sci. 2018. 38(2):204-211. [CrossRef]
  80. Sunthamala, N., Suebsamran, C., Khruaphet, N. et al. Sanguinarine and Chelidonine synergistically induce endosomal toll-like receptor and M1-associated mediators expression. J. Pure Appl. Microbiol. 2020. 14, 2351–2361. [CrossRef]
  81. Bao, S., Cao, Y., Zhou, H. et al. Epigallocatechin gallate (EGCG) suppresses lipopolysaccharide-induced Toll-like receptor 4 (TLR4) activity via 67 kDa laminin receptor (67LR) in 3T3-L1 adipocytes. J Agric Food Chem. 2015. 63(10):2811-9. [CrossRef]
  82. Kim, A., Lee, C. S. Apigenin reduces the Toll-like receptor-4-dependent activation of NF-κB by suppressing the Akt, mTOR, JNK, and p38-MAPK. Naunyn Schmiedebergs Arch Pharmacol. 2018. 391(3):271-283. [CrossRef]
  83. Zhao, B., Zhang, S., Amin, N. et al. Thymoquinone regulates microglial M1/M2 polarization after cerebral ischemia-reperfusion injury via the TLR4 signaling pathway. Neurotoxicology. 2024. 101:54-67. [CrossRef]
  84. Gao, H., Kang, N., Hu, C. et al. Ginsenoside Rb1 exerts anti-inflammatory effects in vitro and in vivo by modulating toll-like receptor 4 dimerization and NF-kB/MAPKs signaling pathways. Phytomedicine. 2020. 69:153197. [CrossRef]
  85. Rostom, B., Karaky, R., Kassab, I., Sylla-Iyarreta Veitía, M. Coumarins derivatives and inflammation: Review of their effects on the inflammatory signaling pathways. Eur J Pharmacol. 2022. 922:174867. [CrossRef]
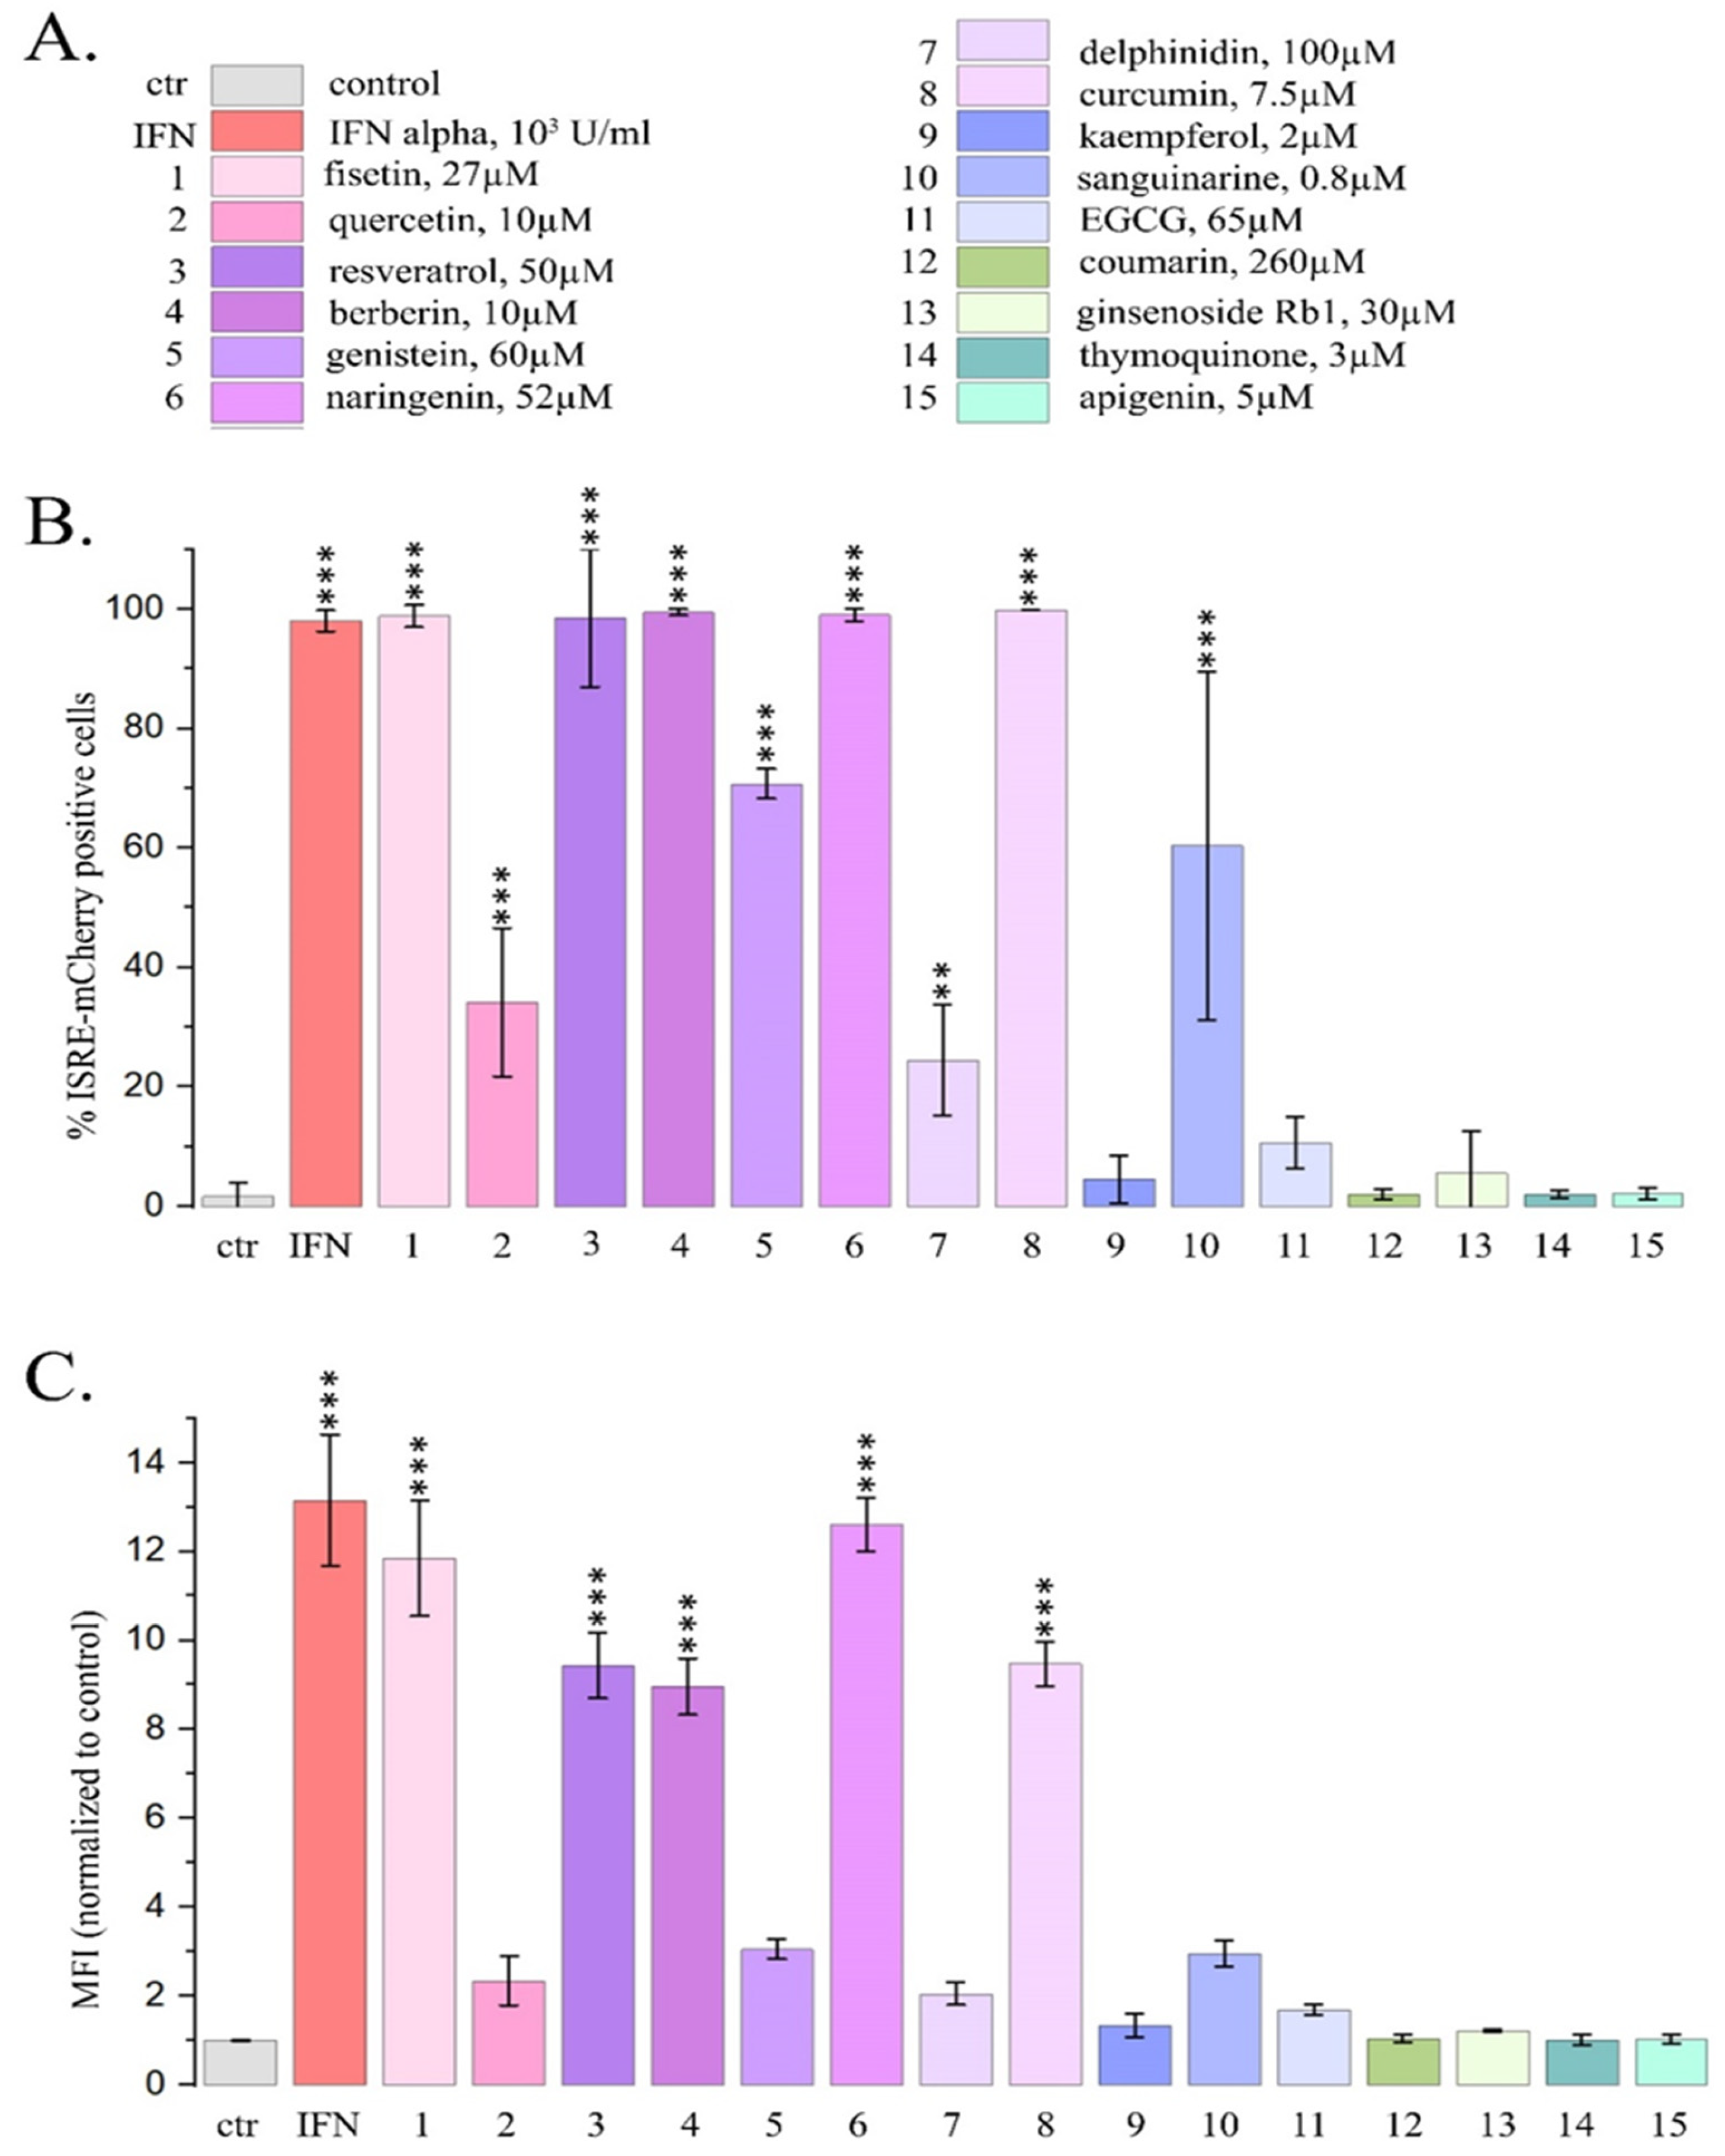
Figure 1. Flow cytometry data for the expression of mCherry driven by ISRE in HeLa TI ISRE-mCherry cells after PSM treatment for 24 h. A. Color-numeric designation of PSMs in non-toxic concentrations. Ctr- control; IFN- IFN-α, 103 U/ml; 1- fisetin, 27µM; 2- quercetin, 10µM; 3- resveratrol, 50µM; 4- berberine, 10µM; 5- genistein, 60µM; 6-naringenin, 52µM; 7-delphinidin, 100µM; 8- curcumin, 7.5µM; 9- kaempferol, 2µM; 10- sanguinarine, 0.8µM; 11- EGCG, 65µM; 12- coumarin, 260µM; 13- ginsenoside Rb1, 30µM; 14- thymoquinone, 3µM; 15- apigenin, 5µM. This color-number legend is used in all figures. B. Proportions of the cells expressing mCherry. C. Mean fluorescence intensity of mCherry per cell. The data are presented as an average value ± SD. Significance of the differences between control untreated cells and PSM treated cells was determined using ANOVA test and Dunnett’s post hoc test: significant difference, *— p < 0.05, **— p < 0.01, ***— p < 0.001, ****— p < 0.0001.
Preprints 120852 g001
Figure 2. Flow cytometry data for the expression of mCherry driven by ISRE in HeLa TI ISRE-mCherry cells after PSMs treatment for 1, 6 and 24 h. Ctr- control; 1- fisetin, 27µM; 2- quercetin, 10µM; 3- resveratrol, 50µM; 4- berberine, 10µM; 5- genistein, 60µM; 6-naringenin, 52µM; 7-delphinidin, 100µM; 8- curcumin, 7.5µM; 10- sanguinarine, 0.8µM. A. Proportions of the cells expressing mCherry. B. Mean fluorescence intensity of mCherry per cell. The data are presented as m± SD. Significance of the differences between control untreated cells and PSM treated cells was determined using ANOVA test and Dunnett’s post hoc test: significant difference, *— p < 0.05, **— p < 0.01, ***— p < 0.001, ****— p < 0.0001.
Preprints 120852 g002
Figure 3. Influence of PSMs on gene expression of type I IFN signaling pathway. A. Pattern of gene expression of type I IFN signaling. Data presented as Log2 (fold change) for each of 84 genes (HSTPF, Qiagen, PARN-014Z). IFN- IFN-α, 103 U/ml; 1- fisetin, 27µM; 2- quercetin, 10µM; 3- resveratrol, 50µM; 4- berberine, 10µM; 5- genistein, 60µM; 6-naringenin, 52µM; 7-delphinidin, 100µM; 8- curcumin, 7.5µM; 9- kaempferol, 2µM; 10- sanguinarine, 0.8µM; 11- EGCG, 65µM; 12- coumarin, 260µM; 13- ginsenoside Rb1, 30µM; 14- thymoquinone, 3µM; 15- apigenin, 5µM. Significance of the differences between control untreated cells and PSM treated cells was determined using ANOVA test and Dunnett’s post hoc test: significant difference, *— p < 0.05, **— p < 0.01, ***— p < 0.001, ****— p < 0.0001. B-D. mRNA expression of genes IFN-signaling normalized to RPL0 and HAPDH in T-47D and HeLa cell lines. Ctr- control; IFN- IFN-α, 103 U/ml; 3- resveratrol, 50µM; 5- genistein, 60µM; 14- thymoquinone, 3µM; 15- apigenin, 5µM. The data are presented as m± SD. Significance of the differences between control untreated cells and PSM treated cells was determined using ANOVA test and Dunnett’s post hoc test: significant difference, *— p < 0.05, **— p < 0.01, ***— p < 0.001, ****— p < 0.0001. B. IFN-responsive gene IFI27. C. IFN-responsive gene OASL. D. IFN regulatory factor IRF1.
Preprints 120852 g003
Figure 4. Expression of three LINE1 amplicons (A, B, C) and ORF1 LINE1 gene in HeLa cells treated with maximal non-toxic concentrations of PSMs for 24 h. Ctr- control; 1- fisetin, 27µM; 2- quercetin, 10µM; 3- resveratrol, 50µM; 4- berberine, 10µM; 5- genistein, 60µM; 6-naringenin, 52µM; 7-delphinidin, 100µM; 8- curcumin, 7.5µM; 9- kaempferol, 2µM; 10- sanguinarine, 0.8µM; 11- EGCG, 65µM; 12- coumarin, 260µM; 13- ginsenoside Rb1, 30µM; 14- thymoquinone, 3µM; 15- apigenin, 5µM. The data are presented as an average value ± SD. Significance of the differences between PSM treated cells and control untreated cells was determined using ANOVA test and Dunnett’s post hoc test: significant difference, *— p < 0.05, **— p < 0.01, ***— p < 0.001, ****— p < 0.0001.
Preprints 120852 g004
Figure 5. Flow cytometry analysis of Hela cells treated with PSMs in non-toxic concentrations and immunofluorescently stained ORF1 LINE1 or γ-H2AX. B. Example of the analysis of Hela cells with the immunofluorescently stained γ-H2AX treated with delphinidin for 24 h. A.B. The effect of PSM on the proportion of stained cells. C. 24-h PSM treatment. Ctr- control; 1- fisetin, 27µM; 2- quercetin, 10µM; 3- resveratrol, 50µM; 4- berberine, 10µM; 5- genistein, 60µM; 6-naringenin, 52µM; 7-delphinidin, 100µM; 8- curcumin, 7.5µM; 10- sanguinarine, 0.8µM. B. 72 h PSM treatment. Ctr- control; 1- fisetin, 13.5µM; 2- quercetin, 5µM; 3- resveratrol, 25µM; 4- berberine, 5µM; 5- genistein, 30µM; 6-naringenin, 26µM; 7-delphinidin, 50µM; 8- curcumin, 3,7µM; 10- sanguinarine, 0.4µM. The data are presented as an average value ± SD. Significance of the differences between control untreated cells and PSM treated cells was determined using ANOVA test and Dunnett’s post hoc test: significant difference, *— p < 0.05, **— p < 0.01, ***— p < 0.001, ****— p < 0.0001. С. Measurement of proportion of apoptotic cells in the analyzed populations of fixed cells. D. Example of the analysis of Hela cells with the immunofluorescently stained γ-H2AX treated with delphinidin for 24 h.
Preprints 120852 g005
Figure 6. Activation of IFN signaling type I by PSMs (number of genes with significantly increased expression, with increased expression by two times and more and with decreased expression). PMS separated into groups depending on their ability to cause depletion of linker histones and LINE1 transcription.
Preprints 120852 g006
Table 1.
Type of gene products Gene products Number of genes
IFNs(21) IFN-α; IFN-β; receptor ligands 5 genes
IFN-γ; receptor ligands 1 genes
Hematopoietin & IFN class (D200-domain) cytokine receptor ligands 10 genes
Other IFN related genes 5
IFN receptors(37) IFN-α and IFN-β receptors 2
IFN-γ receptors 2
Hematopoietin, IFN class (D200-domain) receptors 28
IFN regulatory factors (9) 9
IFN-responsive genes(23) Response to virus 13*
Transcriptional regulation 2*
Other IFN responsive genes 8
*Note: The IFI16 gene is repeated in groups of Response to virus and transcriptional regulation.
Disclaimer/Publisher’s Note: The statements, opinions and data contained in all publications are solely those of the individual author(s) and contributor(s) and not of MDPI and/or the editor(s). MDPI and/or the editor(s) disclaim responsibility for any injury to people or property resulting from any ideas, methods, instructions or products referred to in the content.
Copyright: This open access article is published under a Creative Commons CC BY 4.0 license, which permit the free download, distribution, and reuse, provided that the author and preprint are cited in any reuse.
Prerpints.org logo

Preprints.org is a free preprint server supported by MDPI in Basel, Switzerland.

Subscribe

© 2024 MDPI (Basel, Switzerland) unless otherwise stated