Submitted:
11 October 2024
Posted:
11 October 2024
You are already at the latest version
Abstract
Keywords:
1. Introduction
2. Materials and Methods
2.1. Isolation and Culture of PBMCs from Healthy Adult Volunteers
2.2. Reagents and Antibodies
2.3. Isolation of TIICs from Gastric Cancer Patients
2.4. Primary Gastric Cancer Cells (PGCCs) Culture from Fresh Surgical Malignant Gastric Tissues
2.5. Sorting of CD8+T cells, CD4+CD25+ Treg, CD14+Macrophages, and GRN+ PGCCs
2.6. Human CD8+, CD4+CD25+, CD14+PBMCs and CD8+, CD4+CD25+, CD14+ TIICs Viability
2.7. CD8+ Primary T Cells and CD14+ Primary Macrophage Activation
2.8. Analysis of Cytokines by ELISA
2.9. Foxp3 Staining and Intracellular Cytokine Staining
2.10. Detection of PD-1+ Analysis of TIICs by Flow Cytometry
2.11. Apoptosis Assays
2.12. Detection of Cytotoxicity of CD8+TIICs and PGCCs
2.13. Lidocaine Treated-CD8+TIICs Mediated Cytotoxicity Assay Using Time-Resolved Fluorometry
2.14. Statistical Analysis
3. Results
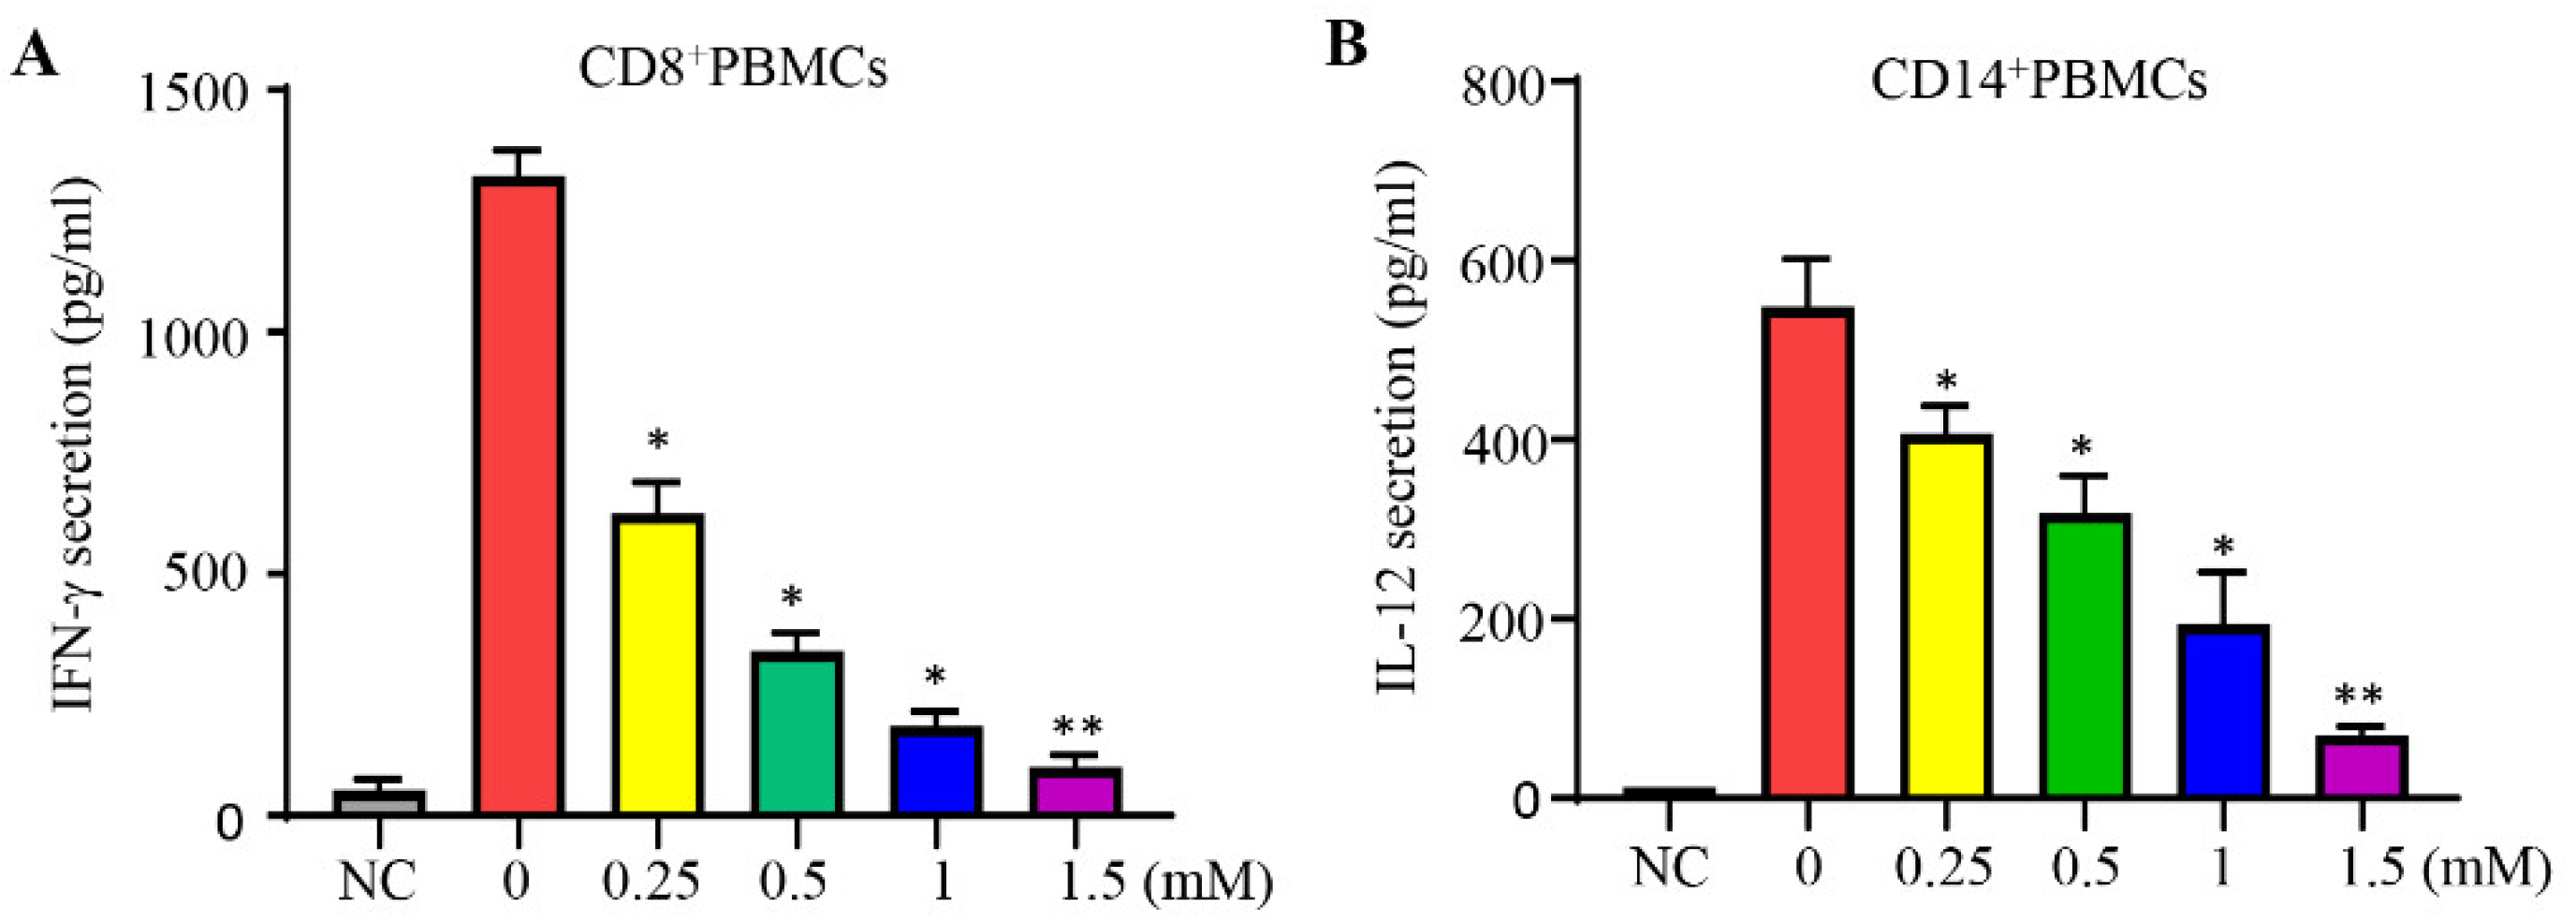
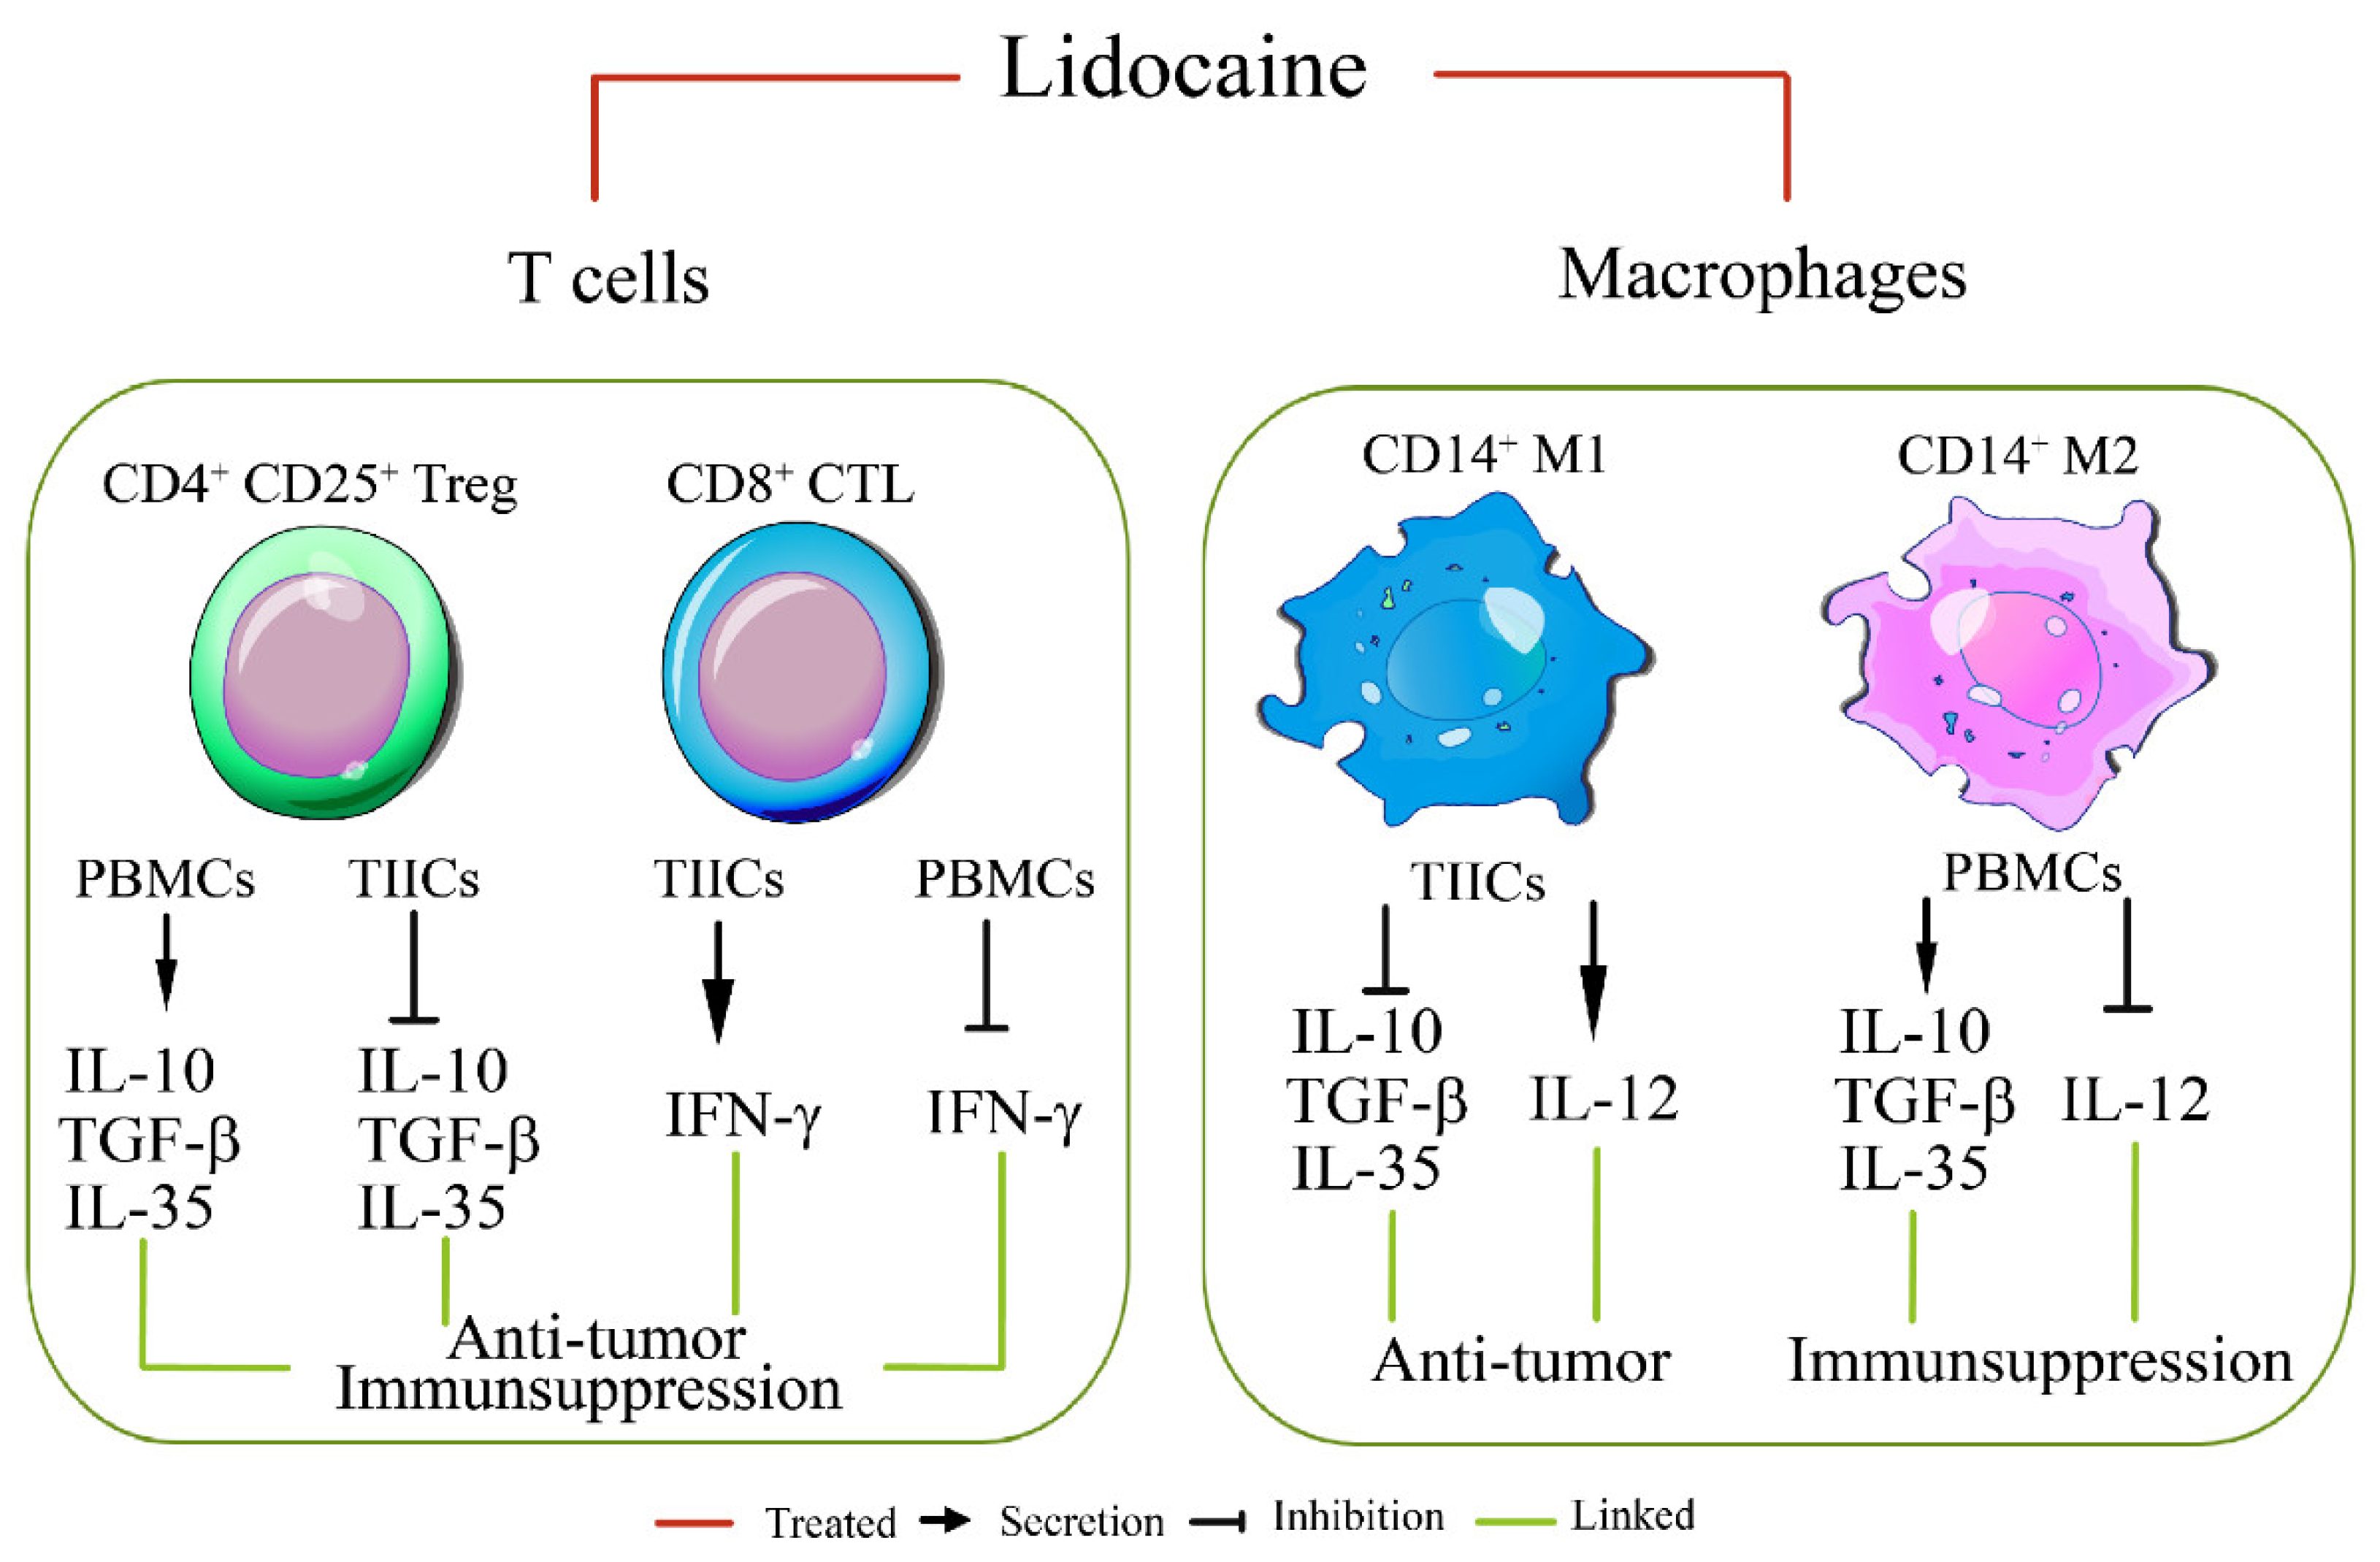
3.1. Lidocaine Inhibits IFN-γ Production by CD8+PBMCs and IL-12 Production by CD14+PBMCs
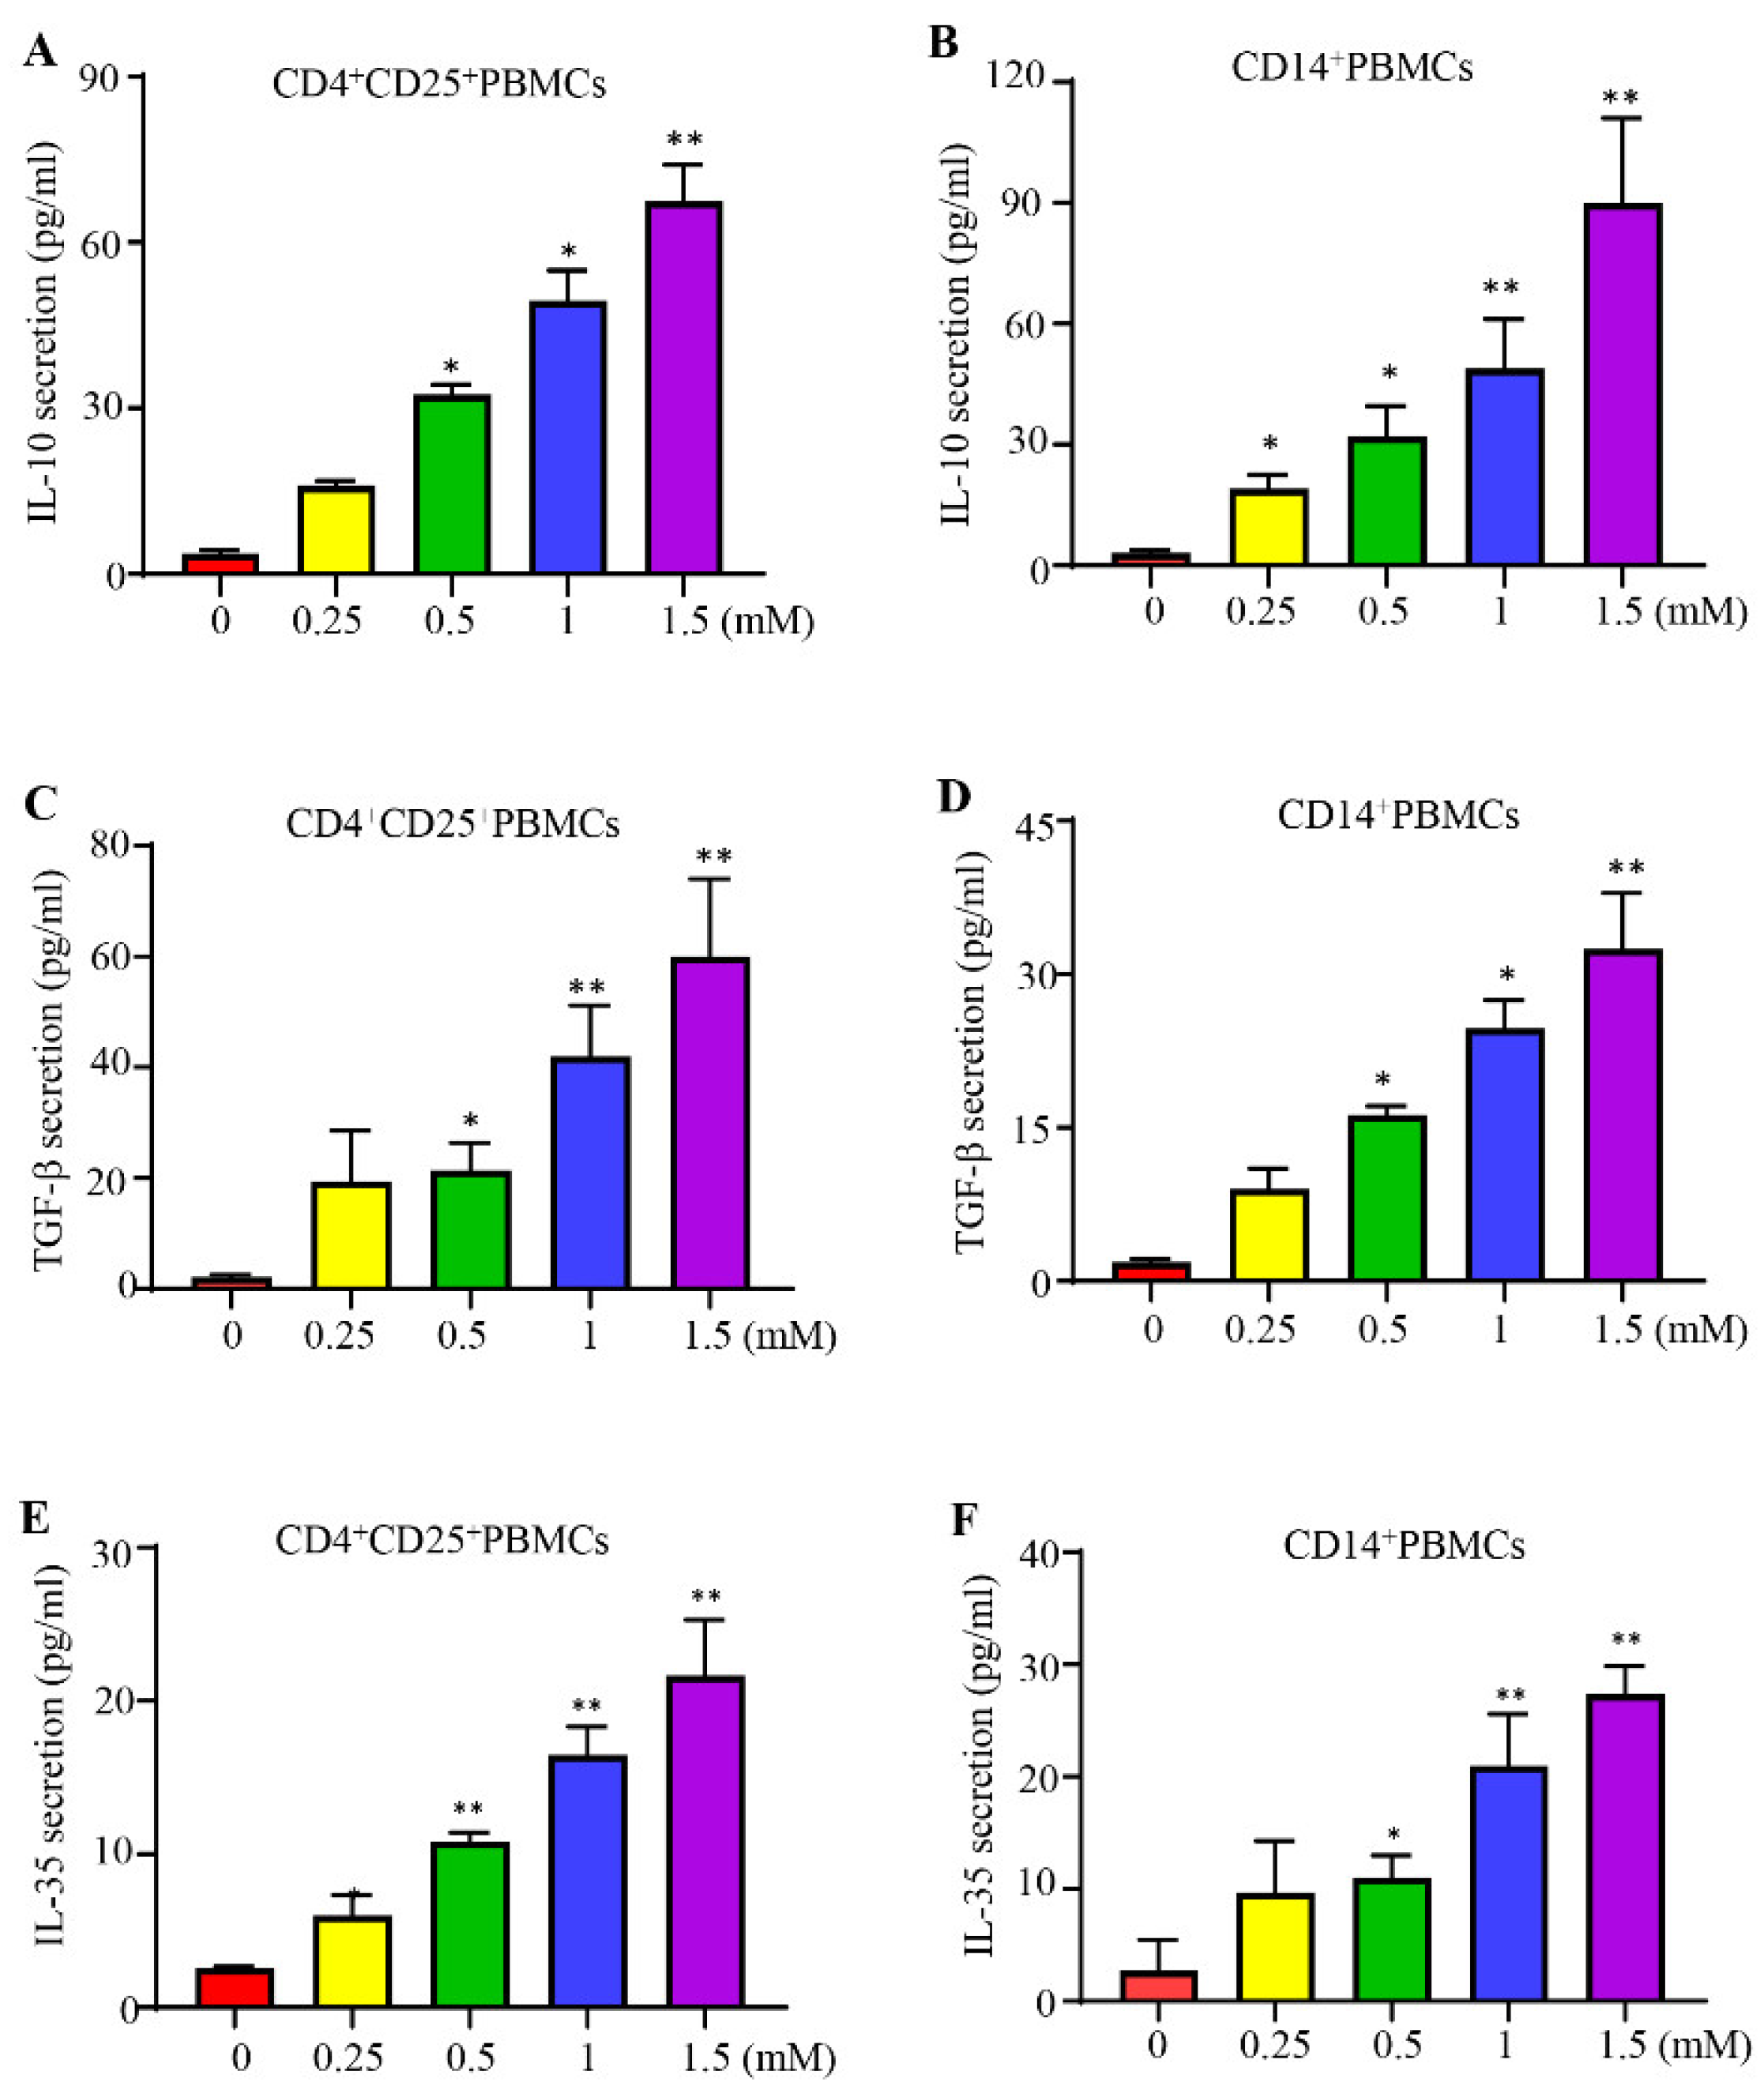
3.2. Lidocaine Increases the Production of Anti-Inflammatory Cytokine IL-10 by CD4+CD25+PBMCs and CD14+PBMCs
3.3. Lidocaine Increases the CD4+CD25+Tregs-Related Cytokine TGF-β and M2 CD14+Macrophage-Related Cytokine TGF-β
3.4. Lidocaine Increases a Novel Immunomodulator Cytokine IL-35 by CD4+CD25+PBMCs and CD14+PBMCs
3.5. Lidocaine Does Not Affect the Viability of CD4+CD25+, CD8+, and CD14+ PBMCs.
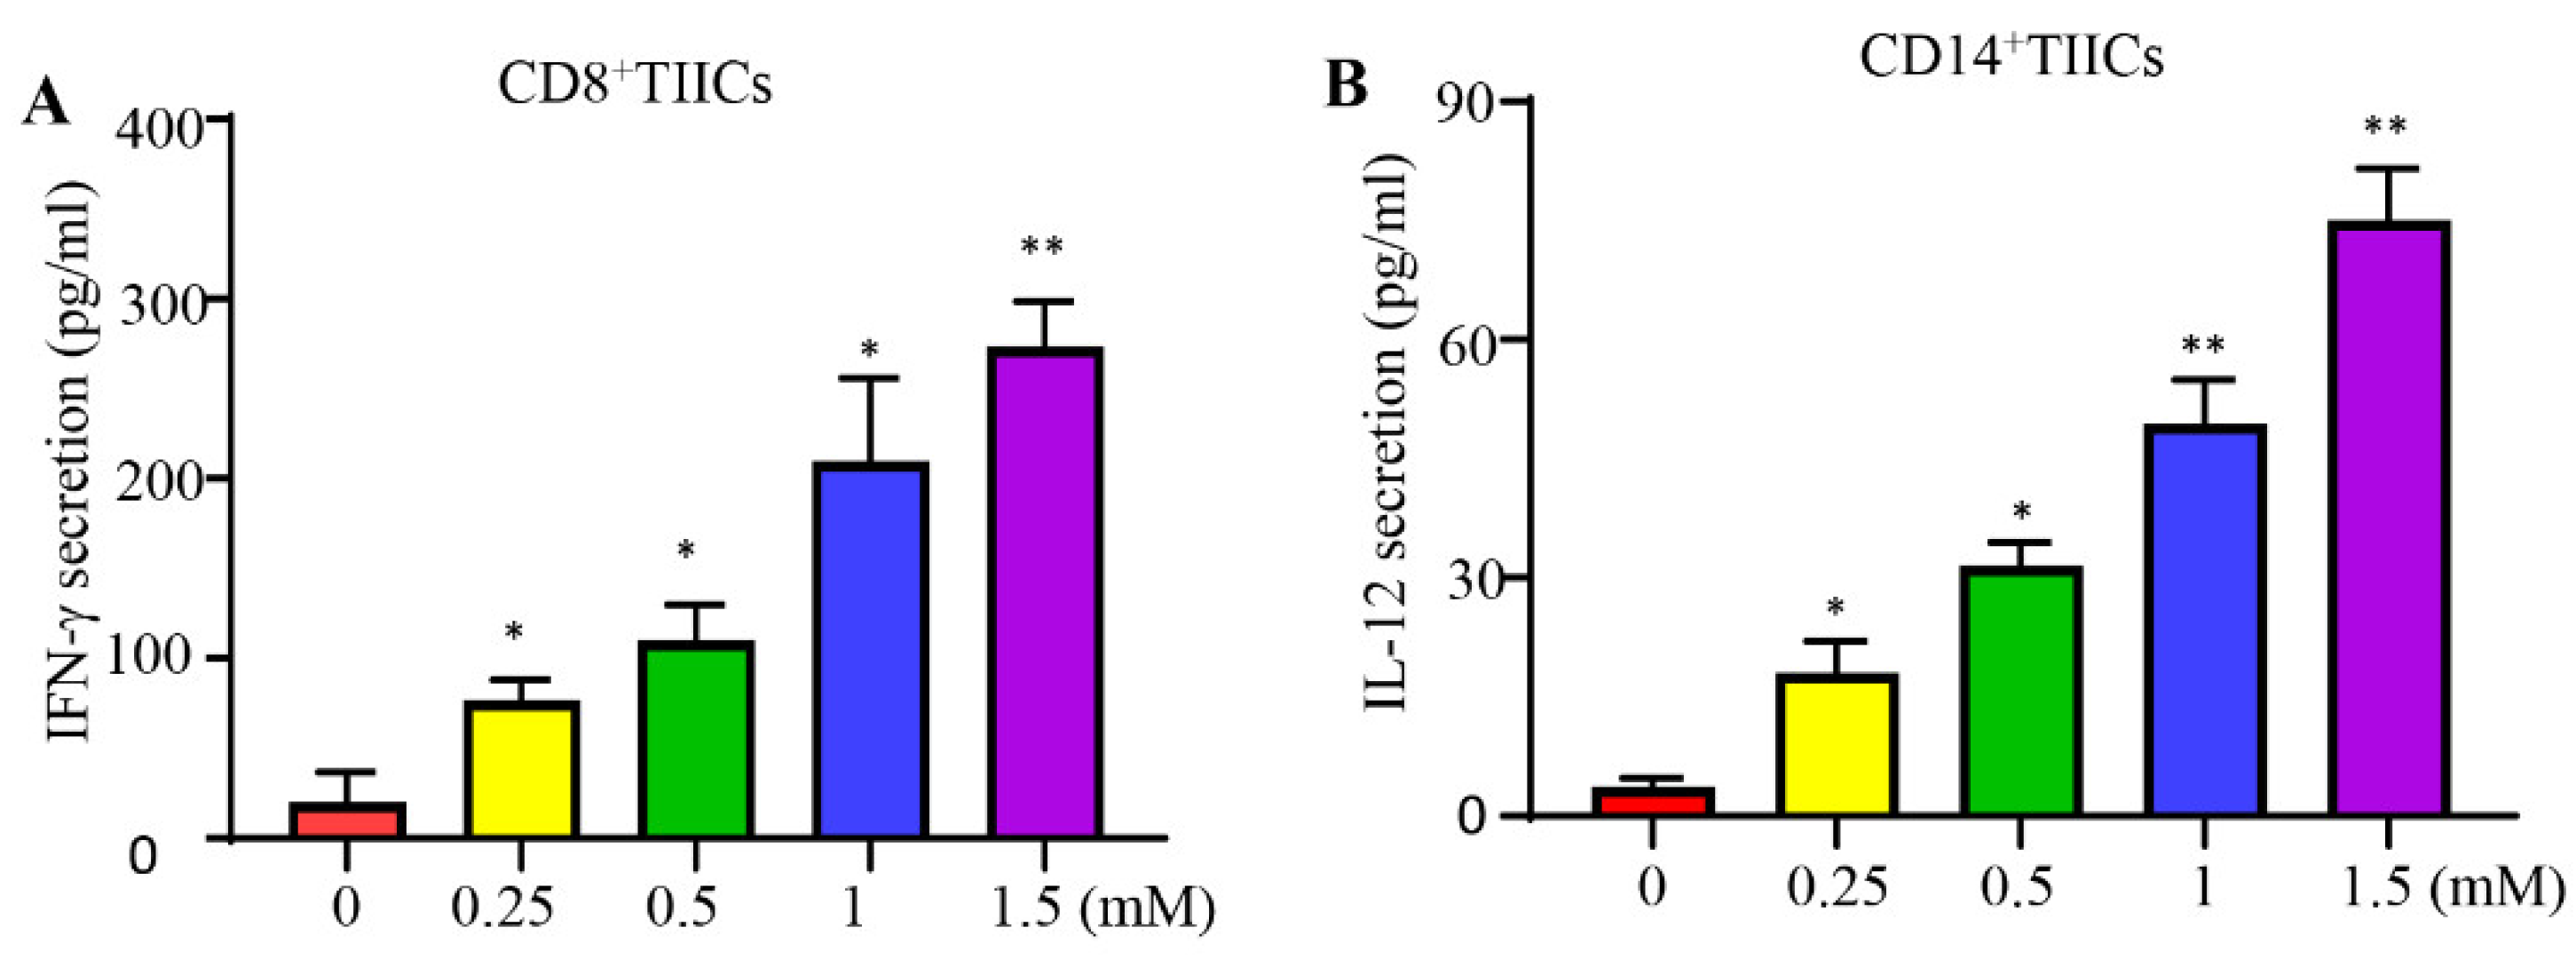
3.6. Lidocaine Increases the Anti-Cancer-Related Cytokines IFN-γ by CD8+ TIICs and IL-12 by CD14+ TIICs
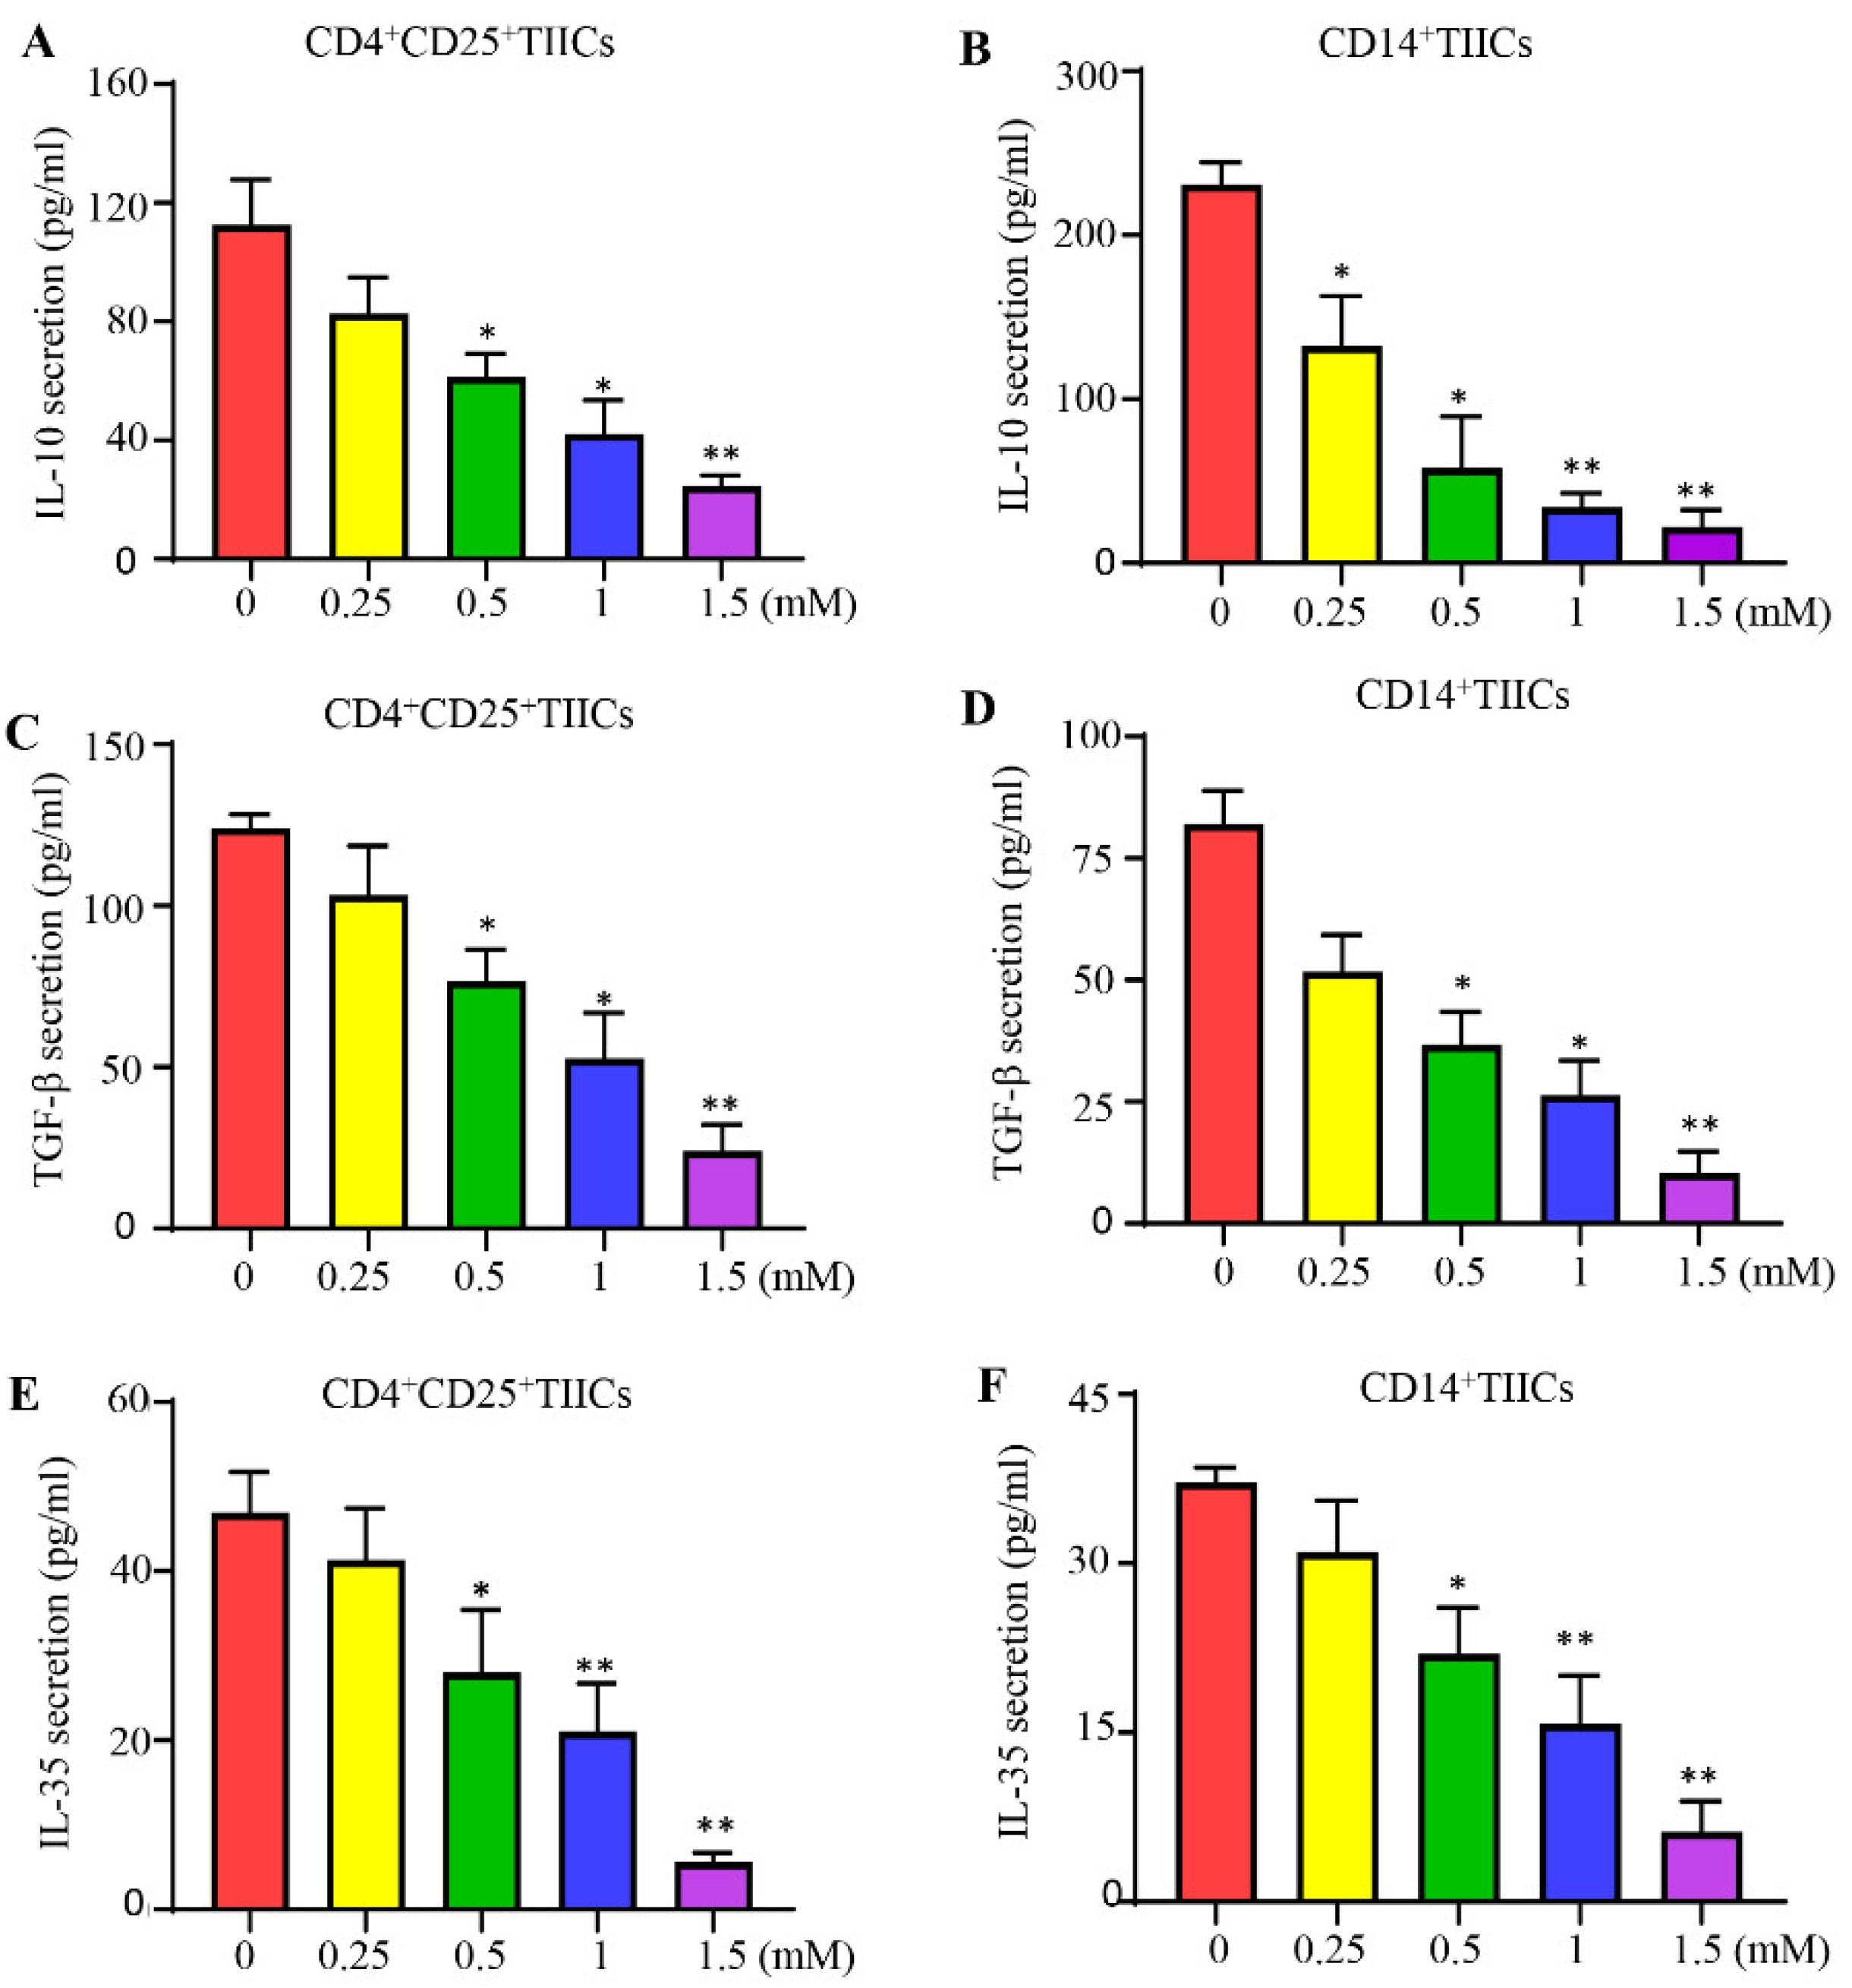
3.7. Lidocaine Inhibits IL-10, TGF-β, and IL-35 Production by CD4+CD25+ and CD14+TIICs
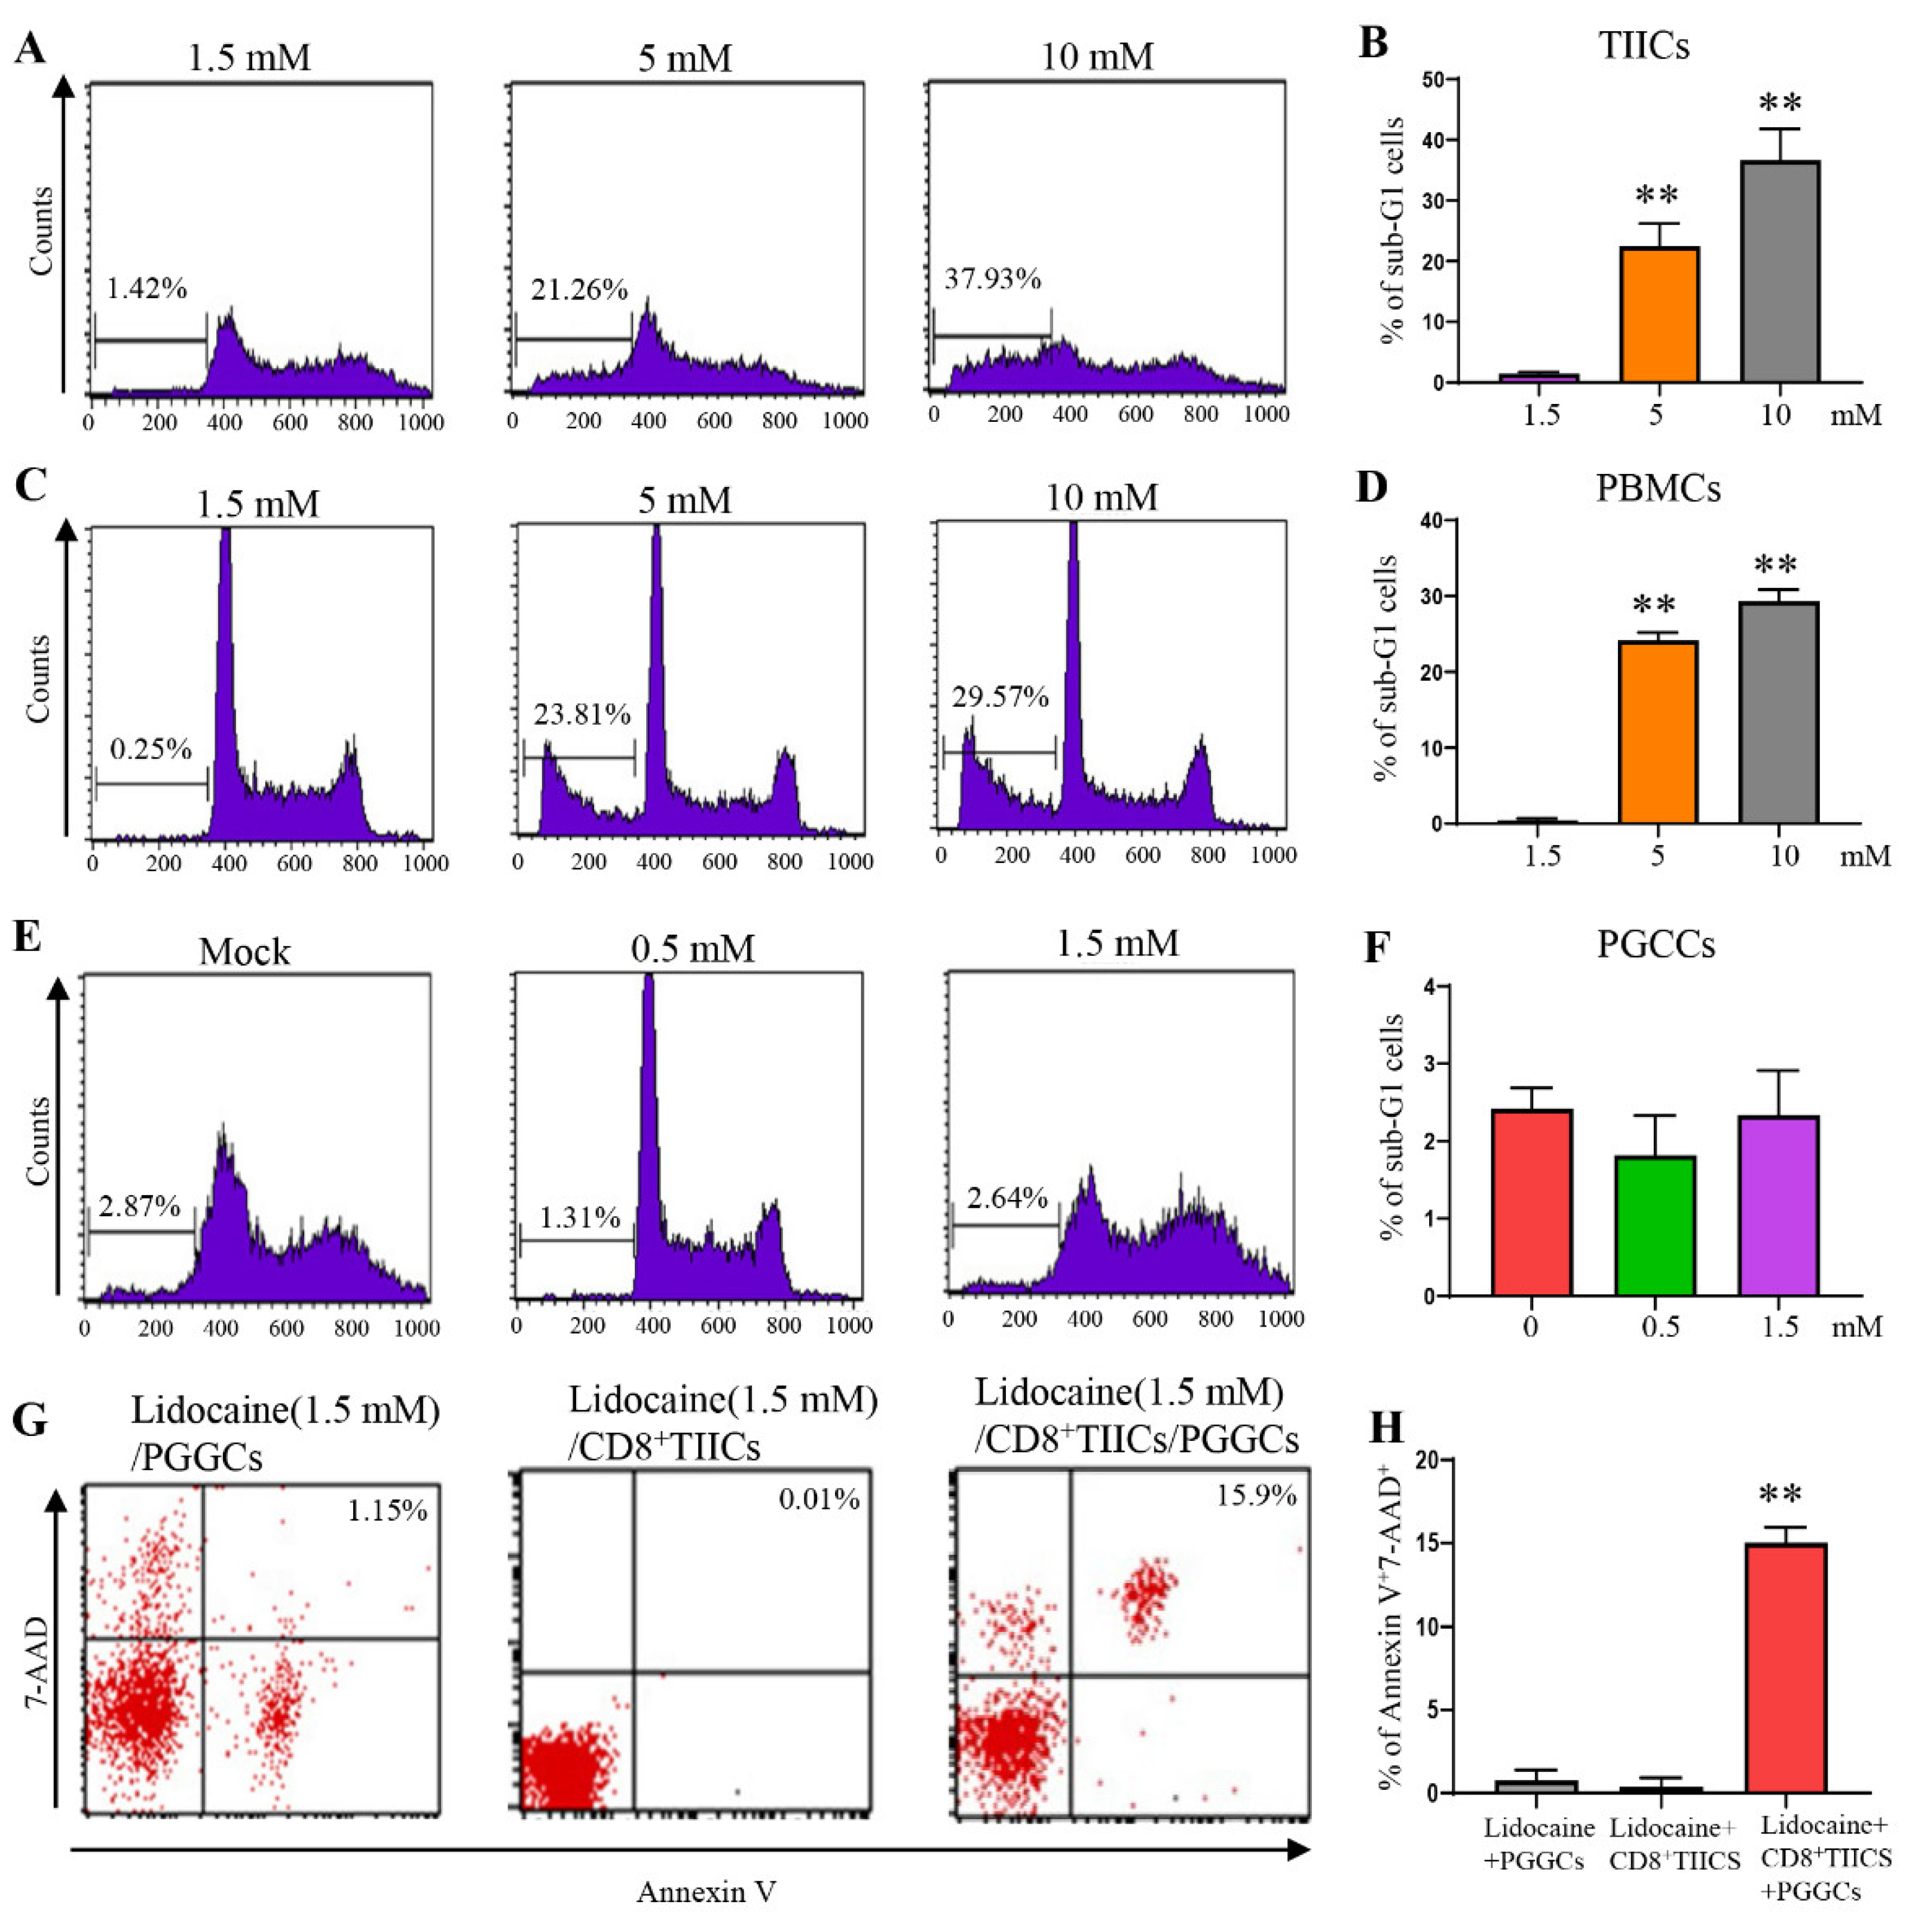
3.8. Lidocaine Does Not Affect the Viability of CD4+CD25+, CD8+, and CD14+ TIICs.
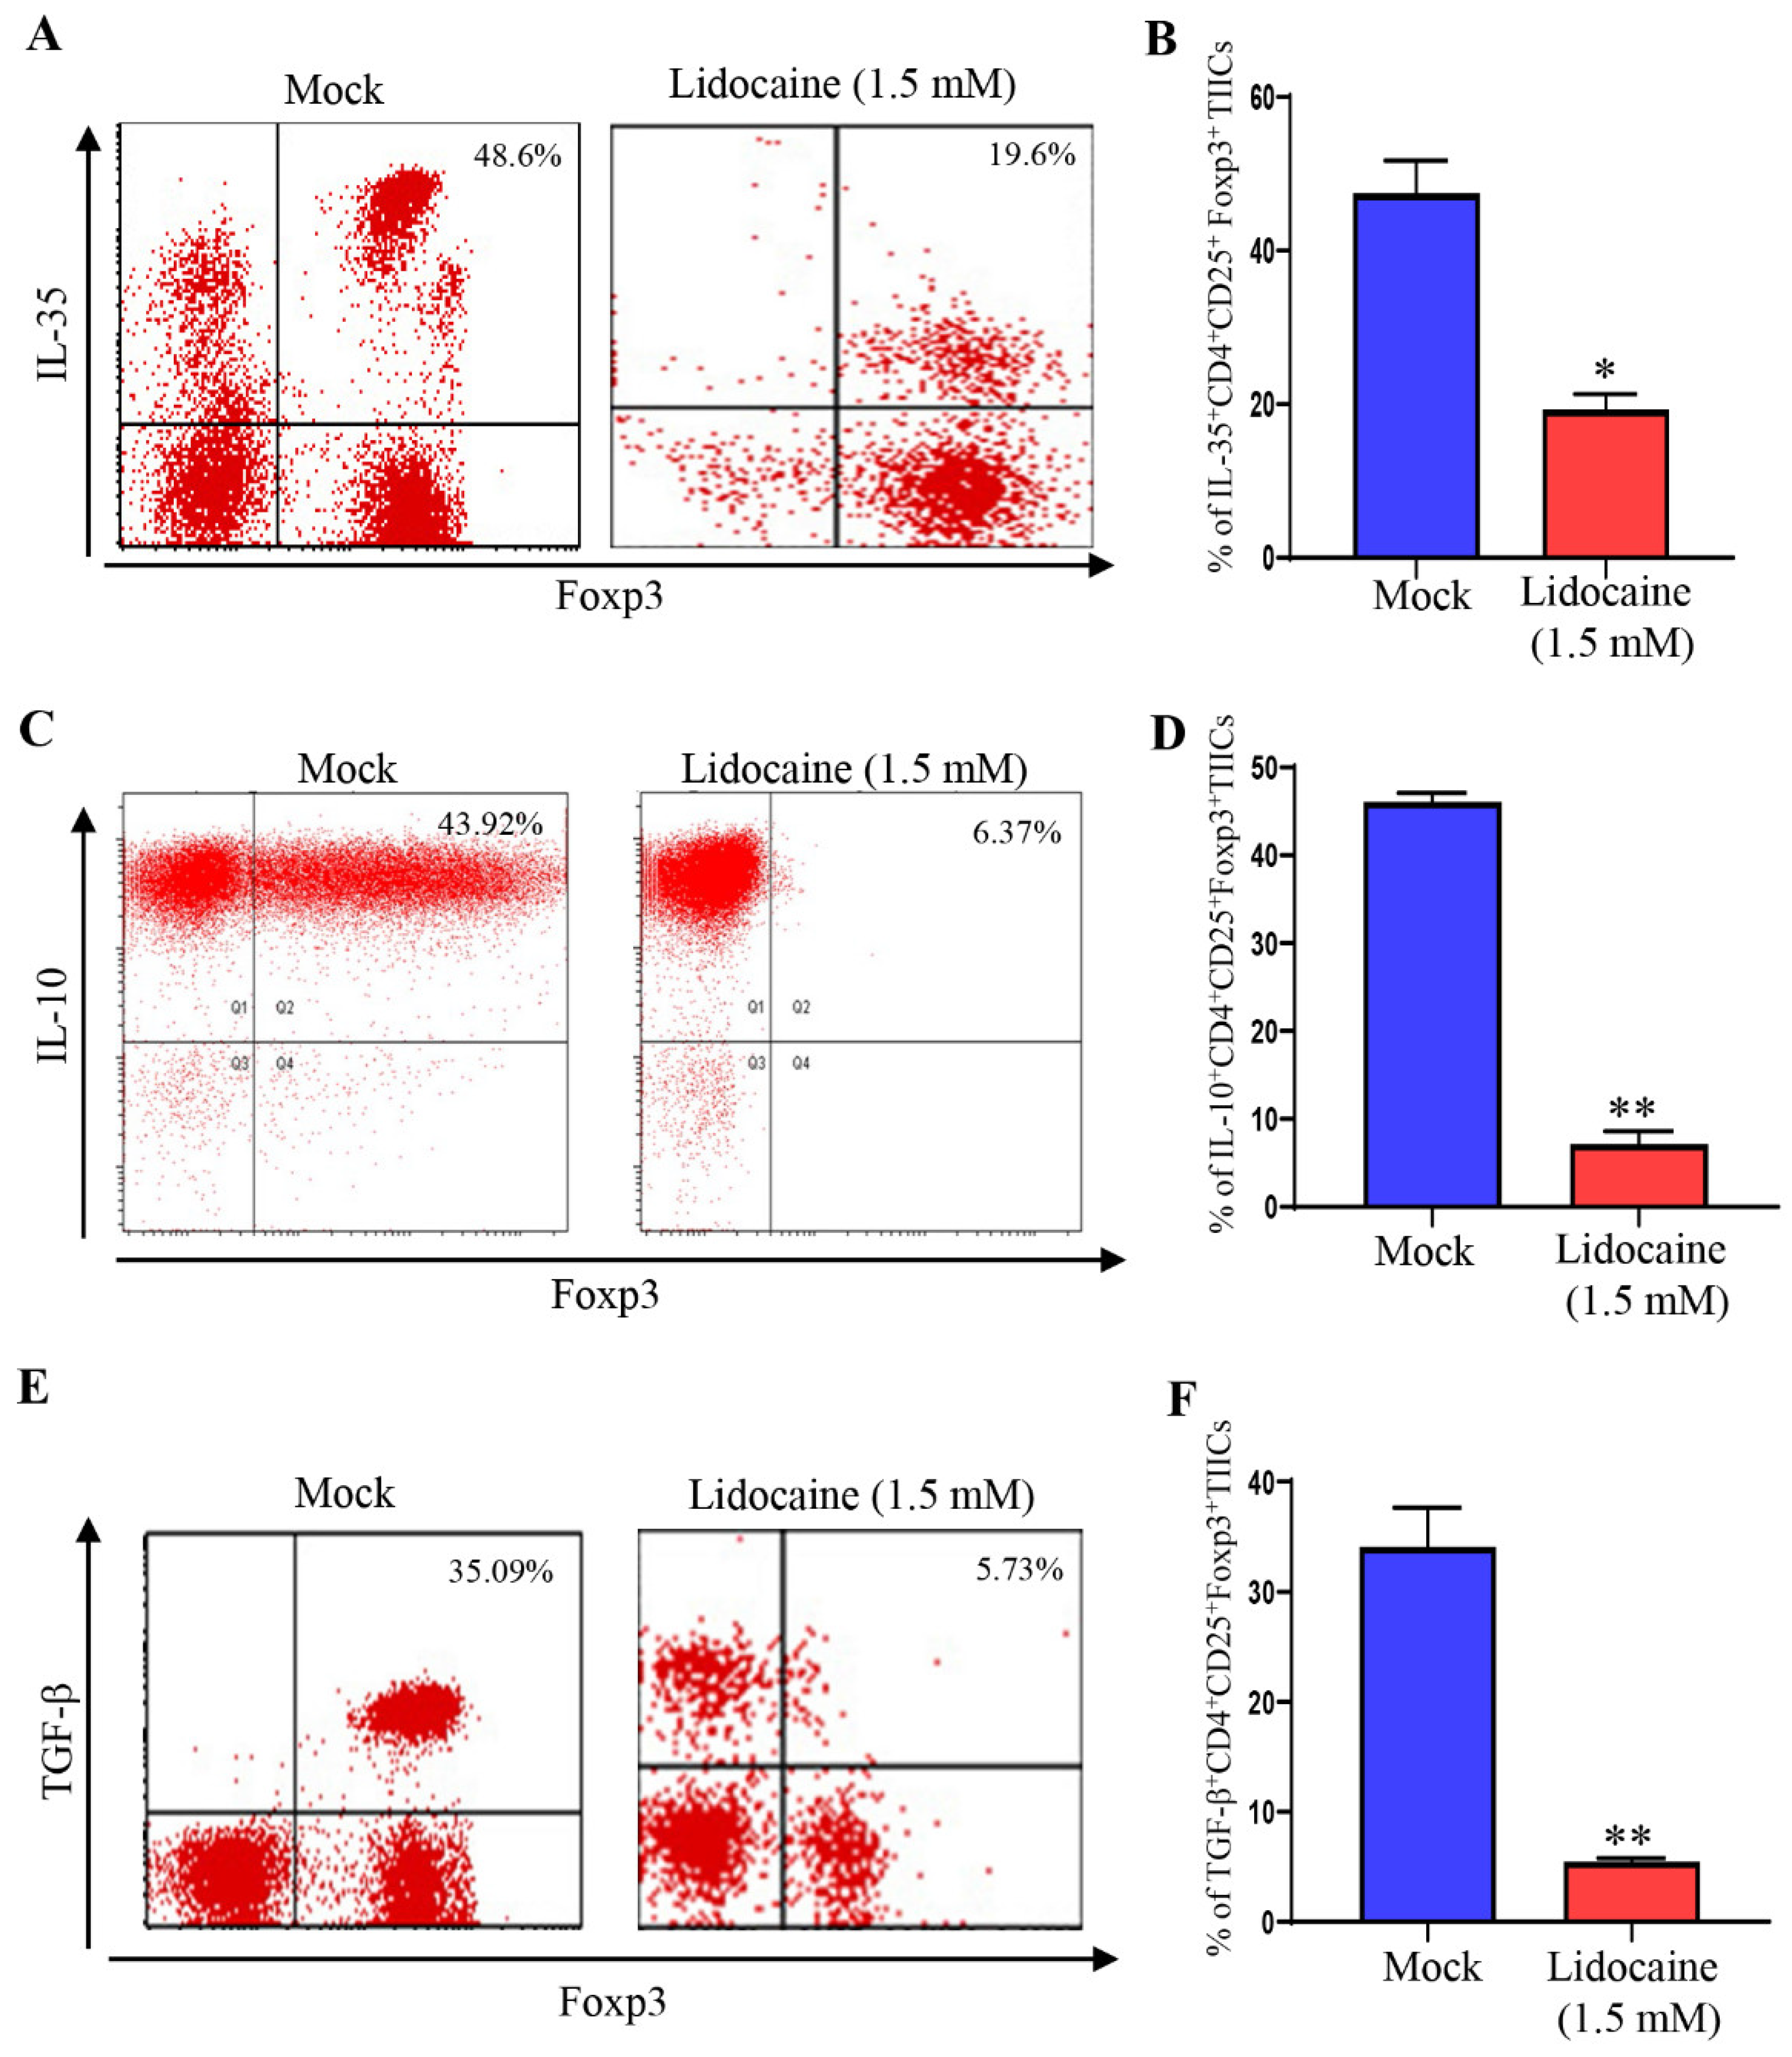
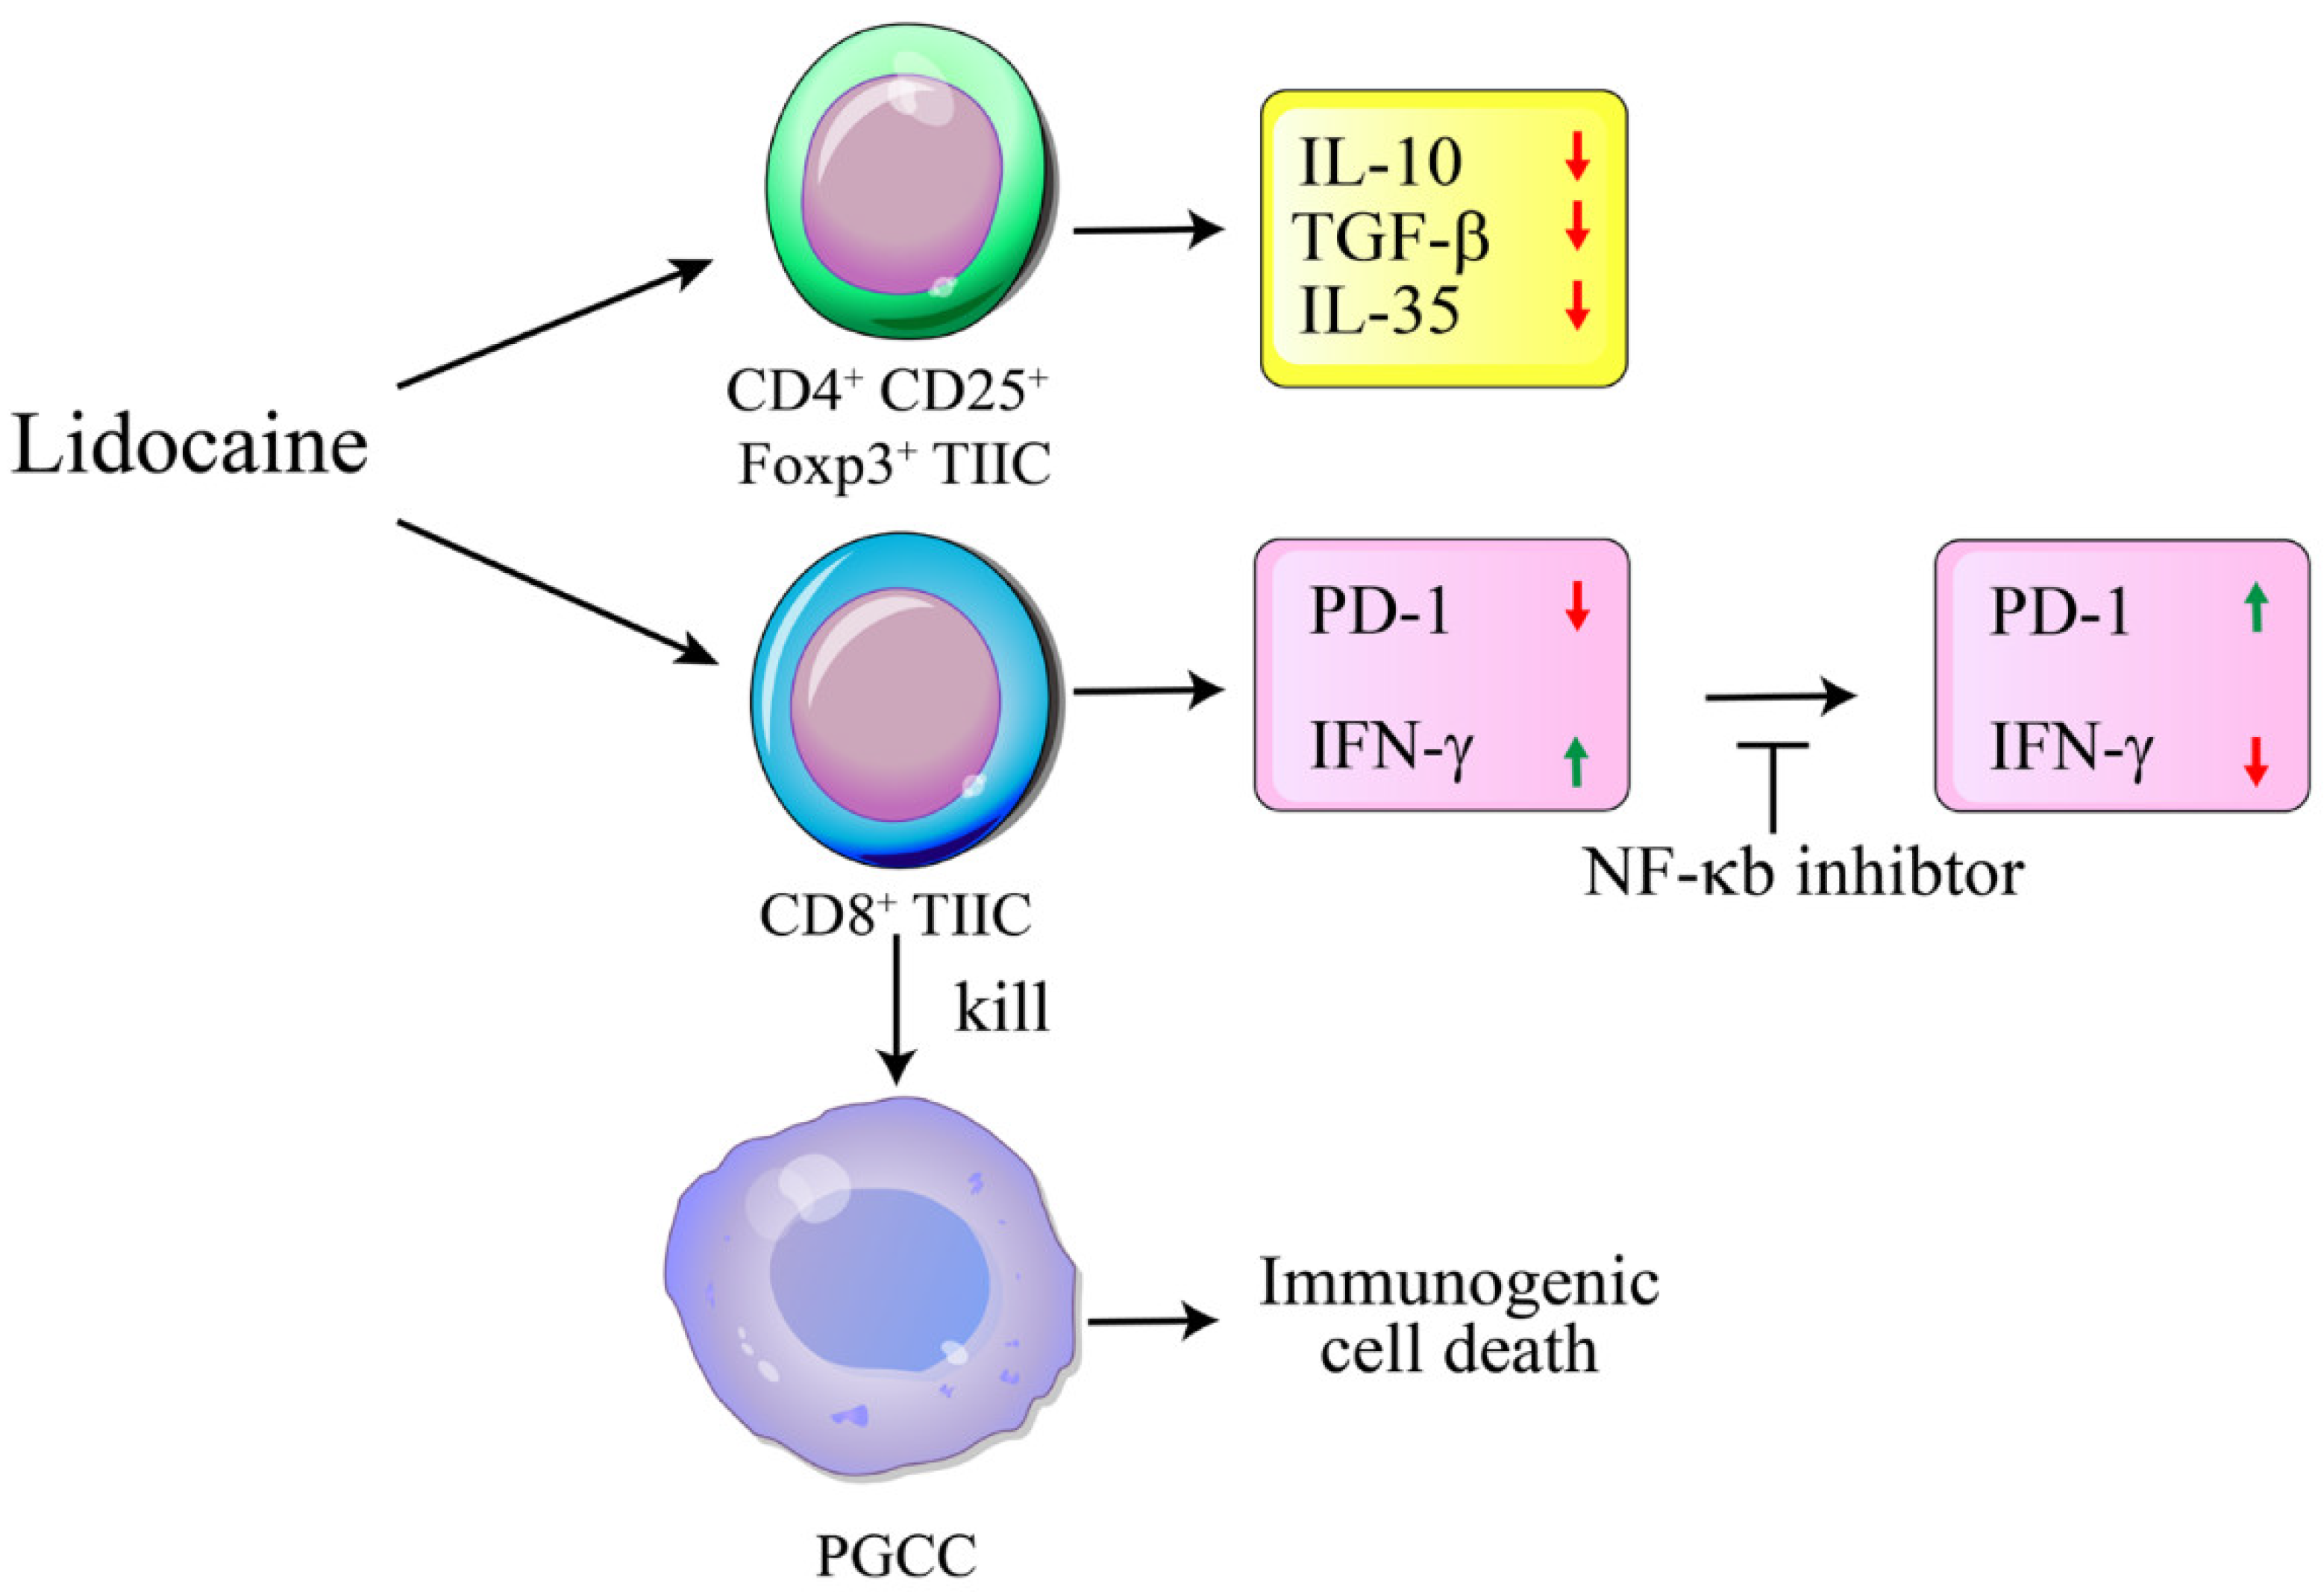
3.9. Lidocaine Inhibits IL-10, TGF-β and IL-35 Production by the CD4+CD25+ Foxp3+ TIICs
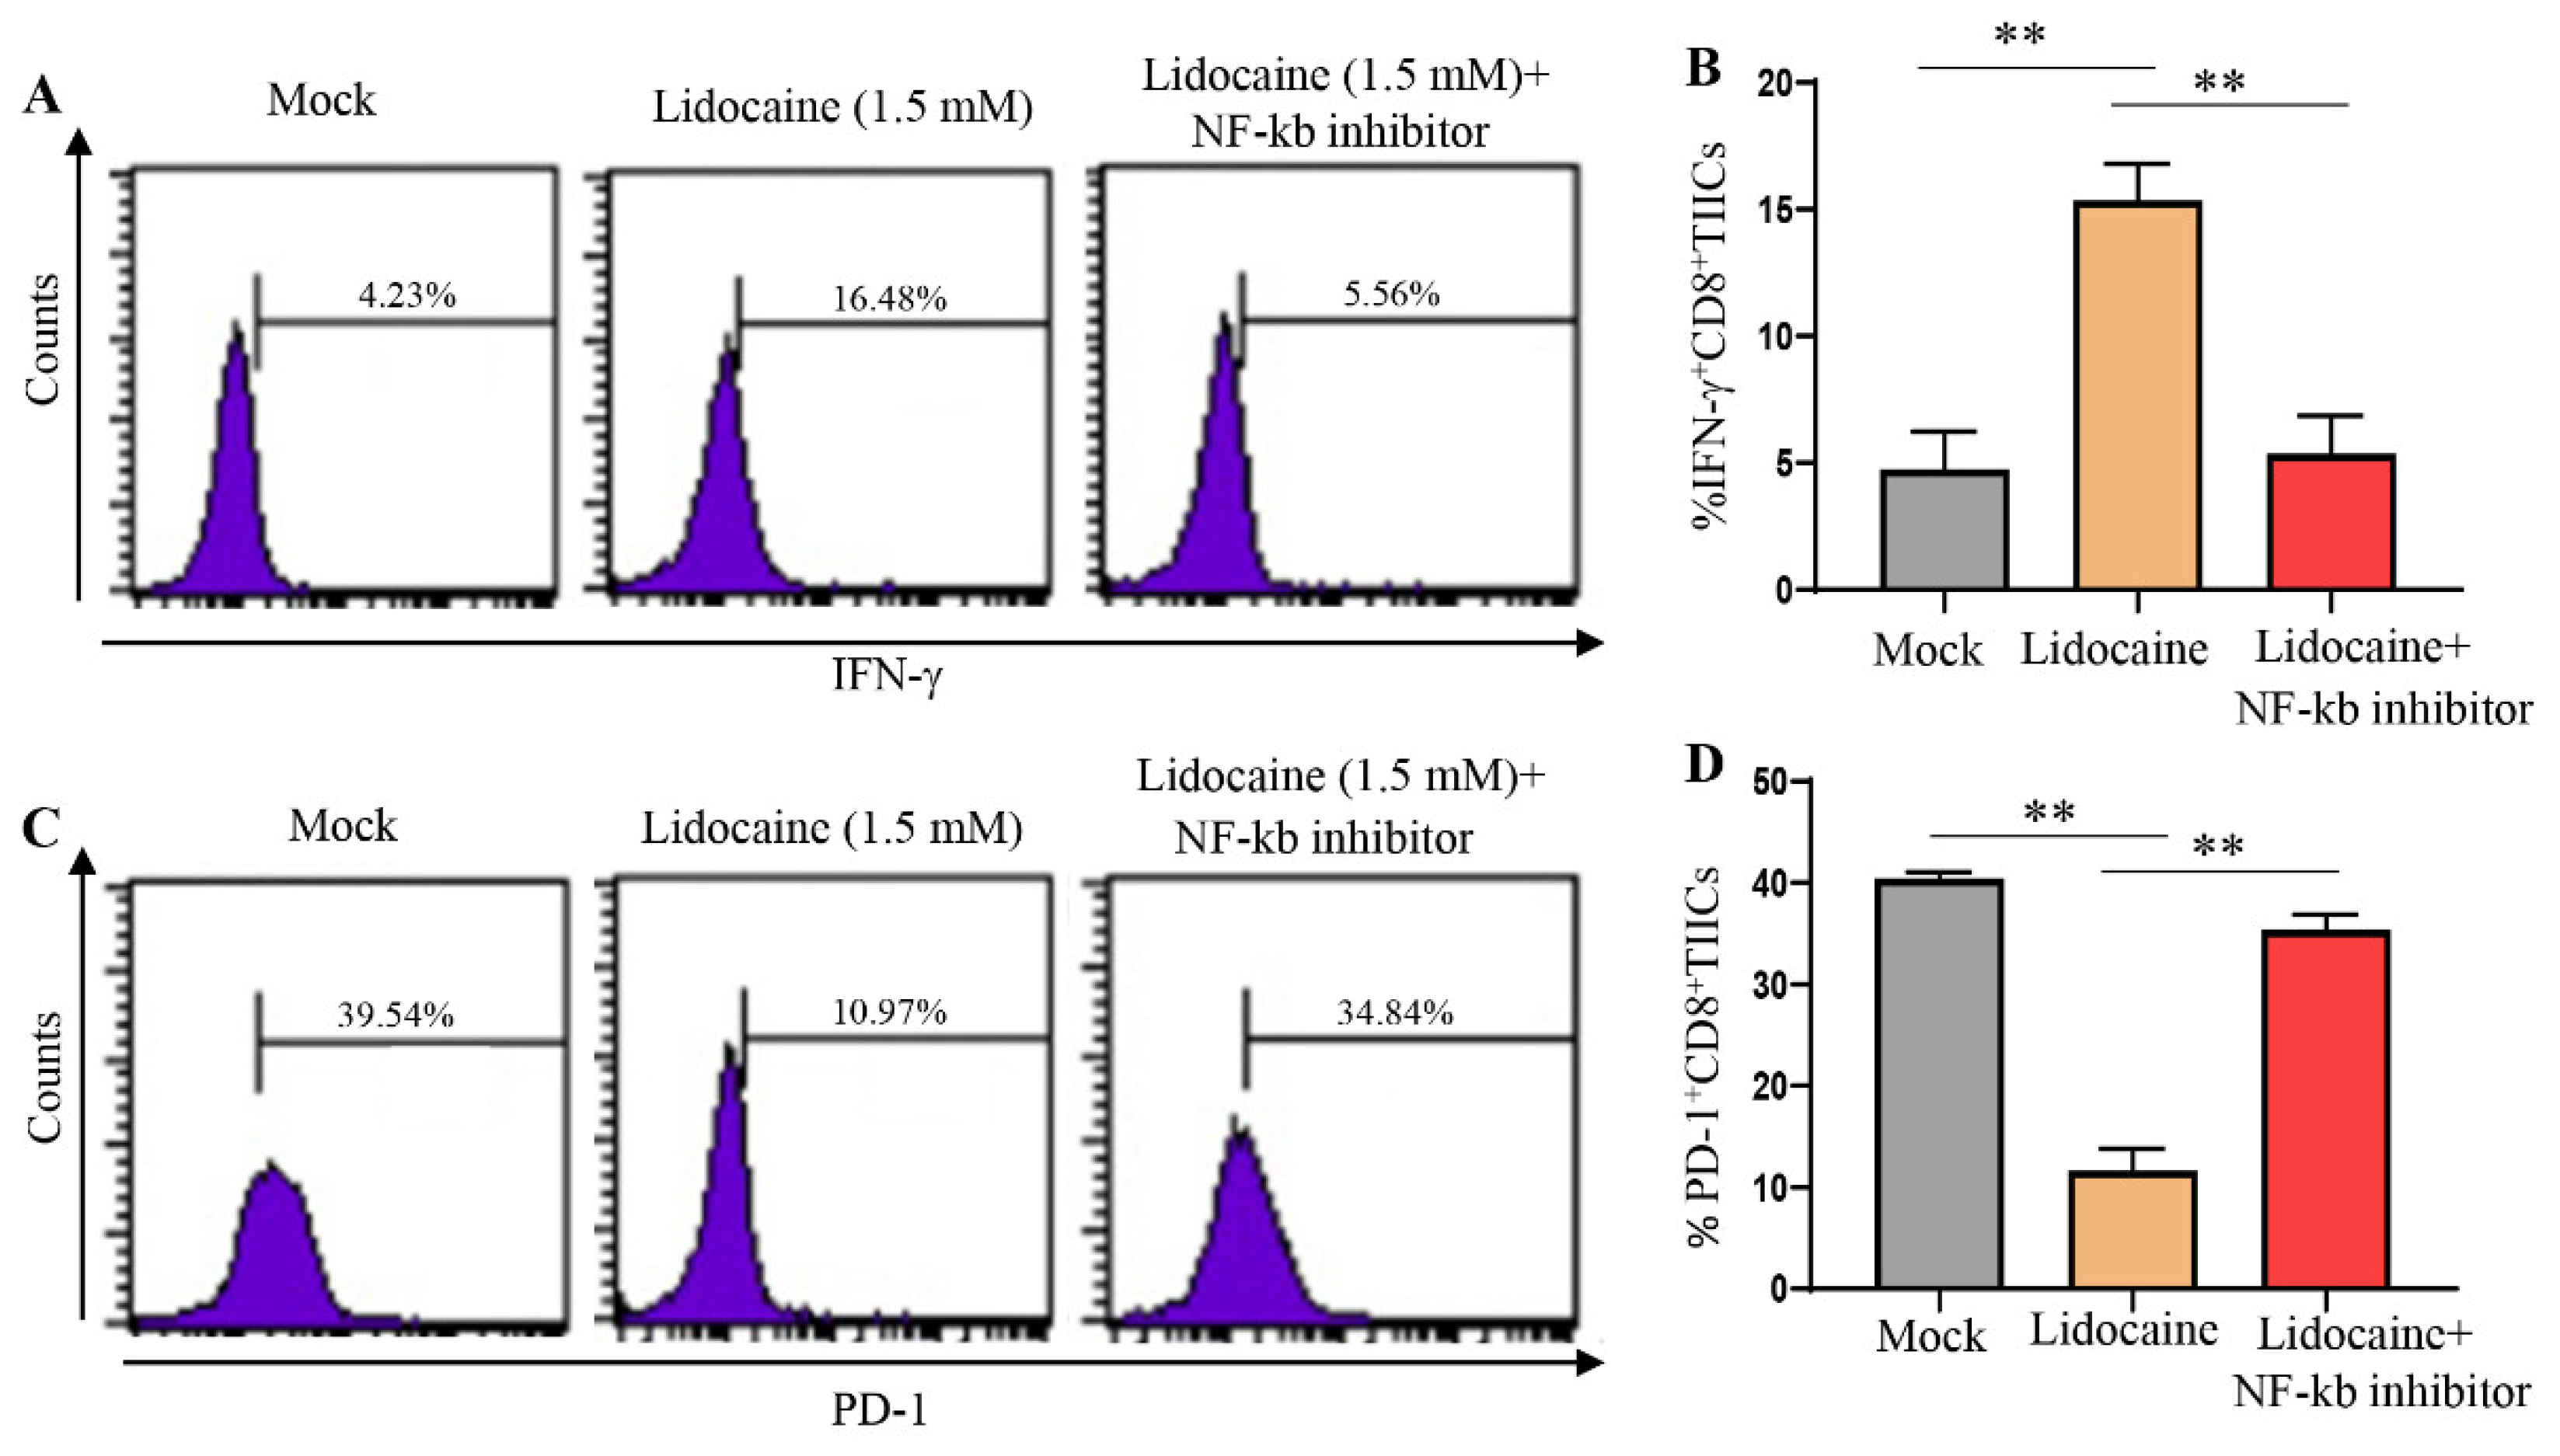
3.10. A significant Decrease in PD-1 and Significant Increase IFN-γ Expression Was Observed in Lidocaine-Treated CD8+ TIICs through the NF-κB Signaling Pathway
3.11. Lidocaine Does Not Affect the Viability of Primary Gastric Cancer Cells
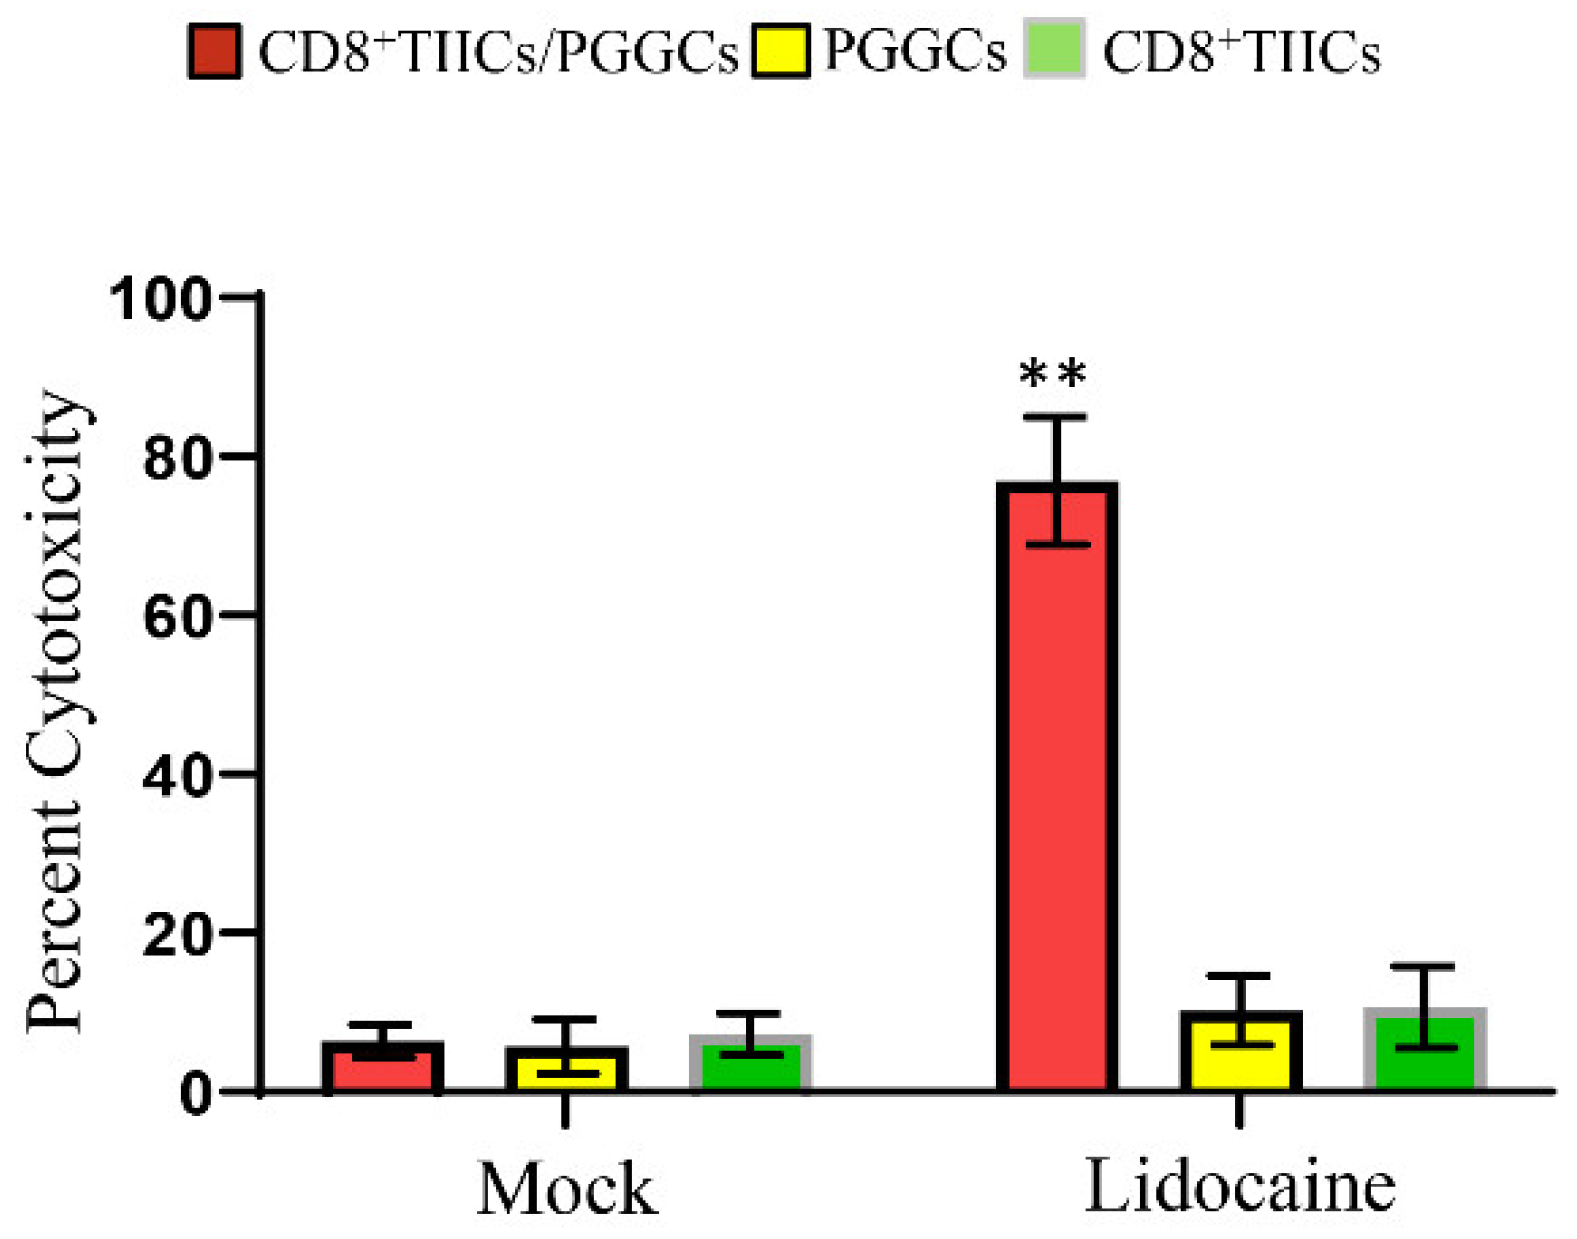
3.12. Lidocaine-Treated CD8+TIICs Induced Primary Gastric Cancer Cell Death
3.13. Lidocaine Enhances the Killing Activity of CD8+ TIICs against Gastric Cancer
4. Discussion
Supplementary Materials
Author Contributions
Funding
Institutional Review Board Statement
Informed Consent Statement
Data Availability Statement
Acknowledgments
Conflicts of Interest
References
- Loftus, J.P.; Williams, J.M.; Belknap, J.K.; Black, S.J. In vivo priming and ex vivo activation of equine neutrophils in black walnut extract-induced equine laminitis is not attenuated by systemic lidocaine administration. Vet Immunol Immunopathol 2010, 138, 60–69. [Google Scholar] [CrossRef] [PubMed]
- Renzi, P.M.; Ginns, L.C. Effect of lidocaine on natural killer activity: Rapid inhibition of lysis. Immunopharmacol Immunotoxicol 1990, 12, 417–437. [Google Scholar] [CrossRef] [PubMed]
- Elizagaray, M.L.; Mazitelli, I.; Pontoriero, A.; Baumeister, E.; Docena, G.; Raimondi, C.; Correger, E.; Rumbo, M. Lidocaine reinforces the anti-inflammatory action of dexamethasone on myeloid and epithelial cells activated by inflammatory cytokines or SARS-CoV-2 infection. Biomedical journal 2022. [Google Scholar] [CrossRef] [PubMed]
- Feng, G.; Liu, S.; Wang, G.L.; Liu, G.J. Lidocaine attenuates lipopolysaccharide-induced acute lung injury through inhibiting NF-kappaB activation. Pharmacology 2008, 81, 32–40. [Google Scholar] [CrossRef]
- Sun, H.; Sun, Y. Lidocaine inhibits proliferation and metastasis of lung cancer cell via regulation of miR-539/EGFR axis. Artificial cells, nanomedicine, and biotechnology 2019, 47, 2866–2874. [Google Scholar] [CrossRef]
- Chen, L.J.; Ding, Y.B.; Ma, P.L.; Jiang, S.H.; Li, K.Z.; Li, A.Z.; Li, M.C.; Shi, C.X.; Du, J.; Zhou, H.D. The protective effect of lidocaine on lipopolysaccharide-induced acute lung injury in rats through NF-κB and p38 MAPK signaling pathway and excessive inflammatory responses. European review for medical and pharmacological sciences 2018, 22, 2099–2108. [Google Scholar]
- Lahat, A.; Ben-Horin, S.; Lang, A.; Fudim, E.; Picard, O.; Chowers, Y. Lidocaine down-regulates nuclear factor-kappaB signalling and inhibits cytokine production and T cell proliferation. Clinical and experimental immunology 2008, 152, 320–327. [Google Scholar] [CrossRef] [PubMed]
- Johnson BD, Jing W, Orentas RJ. CD25+ regulatory T cell inhibition enhances vaccine-induced immunity to neuroblastoma. J Immunother 2007, 30, 203–214. [Google Scholar] [CrossRef]
- Hesse, M.; Piccirillo, C.A.; Belkaid, Y.; Prufer, J.; Mentink-Kane, M.; Leusink, M.; Cheever, A.W.; Shevach, E.M.; Wynn, T.A. The pathogenesis of schistosomiasis is controlled by cooperating IL-10-producing innate effector and regulatory T cells. J Immunol 2004, 172, 3157–3166. [Google Scholar] [CrossRef]
- Farhood B, Najafi M, Mortezaee K. CD8(+) cytotoxic T lymphocytes in cancer immunotherapy: A review. J Cell Physiol 2019, 234, 8509–8521. [Google Scholar] [CrossRef]
- Dinarello, C.A. Anti-cytokine therapeutics and infections. Vaccine 2003, 21 Suppl. S2, S24–S34. [Google Scholar] [CrossRef] [PubMed]
- Macedo, N.; Miller, D.M.; Haq, R.; Kaufman, H.L. Clinical landscape of oncolytic virus research in 2020. Journal for immunotherapy of cancer 2020, 8. [Google Scholar] [CrossRef] [PubMed]
- Shi, X.; Cao, S.; Mitsuhashi, M.; Xiang, Z.; Ma, X. Genome-wide analysis of molecular changes in IL-12-induced control of mammary carcinoma via IFN-gamma-independent mechanisms. Journal of immunology (Baltimore, Md: 1950) 2004, 172, 4111–4122. [Google Scholar] [CrossRef] [PubMed]
- Hung, C.H.; Hsu, H.Y.; Chiou, H.C.; Tsai, M.L.; You, H.L.; Lin, Y.C.; Liao, W.T.; Lin, Y.C. Arsenic Induces M2 Macrophage Polarization and Shifts M1/M2 Cytokine Production via Mitophagy. Int J Mol Sci 2022, 23. [Google Scholar] [CrossRef] [PubMed]
- Kang MJ, Jang AR, Park JY, Ahn JH, Lee TS, Kim DY, Lee MS, Hwang S, Jeong YJ, Park JH. IL-10 Protects Mice From the Lung Infection of Acinetobacter baumannii and Contributes to Bacterial Clearance by Regulating STAT3-Mediated MARCO Expression in Macrophages. Frontiers in immunology 2020, 11, 270.
- Collison, L.W.; Workman, C.J.; Kuo, T.T.; Boyd, K.; Wang, Y.; Vignali, K.M.; Cross, R.; Sehy, D.; Blumberg, R.S.; Vignali, D.A. The inhibitory cytokine IL-35 contributes to regulatory T-cell function. Nature 2007, 450, 566–569. [Google Scholar] [CrossRef]
- Feng, J.; Wu, Y. Interleukin-35 ameliorates cardiovascular disease by suppressing inflammatory responses and regulating immune homeostasis. International immunopharmacology 2022, 110, 108938. [Google Scholar] [CrossRef]
- He, W.; Hao, S.; Dong, X.; Zhang, D.; Jia, Z. Circulating cytokine profile and modulation of regulatory T cells in chronic hepatitis B patients with type 2 diabetes mellitus. Bosnian journal of basic medical sciences 2022. [Google Scholar] [CrossRef]
- Han Y, Liu D, Li L. PD-1/PD-L1 pathway: Current researches in cancer. Am J Cancer Res 2020, 10, 727–742. [Google Scholar]
- Wei SC, Levine JH, Cogdill AP, Zhao Y, Anang NAS, Andrews MC, Sharma P, Wang J, Wargo JA, Pe’er D et al. : Distinct Cellular Mechanisms Underlie Anti-CTLA-4 and Anti-PD-1 Checkpoint Blockade. Cell 2017, 170, 1120–1133. [Google Scholar] [CrossRef]
- Huang Q, Wu X, Wang Z, Chen X, Wang L, Lu Y, Xiong D, Liu Q, Tian Y, Lin H et al. : The primordial differentiation of tumor-specific memory CD8(+) T cells as bona fide responders to PD-1/PD-L1 blockade in draining lymph nodes. Cell 2022, 185, 4049–4066. [Google Scholar] [CrossRef] [PubMed]
- Chen YY, Yang WC, Chang YK, Wang CY, Huang WR, Li JY, Chuang KP, Wu HY, Chang CD, Nielsen BL et al. : Construction of polycistronic baculovirus surface display vectors to express the PCV2 Cap(d41) protein and analysis of its immunogenicity in mice and swine. Vet Res 2020, 51, 112. [Google Scholar] [CrossRef]
- Dudley, M.E.; Wunderlich, J.R.; Shelton, T.E.; Even, J.; Rosenberg, S.A. Generation of tumor-infiltrating lymphocyte cultures for use in adoptive transfer therapy for melanoma patients. J Immunother 2003, 26, 332–342. [Google Scholar] [CrossRef]
- Aziz, F.; Yang, X.; Wen, Q.; Yan, Q. A method for establishing human primary gastric epithelial cell culture from fresh surgical gastric tissues. Mol Med Rep 2015, 12, 2939–2944. [Google Scholar] [CrossRef]
- Smoot, D.T.; Sewchand, J.; Young, K.; Desbordes, B.C.; Allen, C.R.; Naab, T. A method for establishing primary cultures of human gastric epithelial cells. Methods Cell Sci 2000, 22, 133–136. [Google Scholar] [CrossRef]
- Sultan, M.; Alghetaa, H.; Mohammed, A.; Abdulla, O.A.; Wisniewski, P.J.; Singh, N.; Nagarkatti, P.; Nagarkatti, M. The Endocannabinoid Anandamide Attenuates Acute Respiratory Distress Syndrome by Downregulating miRNA that Target Inflammatory Pathways. Front Pharmacol 2021, 12, 644281. [Google Scholar] [CrossRef] [PubMed]
- Vergis, J.; Malik, S.V.S.; Pathak, R.; Kumar, M.; Kurkure, N.V.; Barbuddhe, S.B.; Rawool, D.B. Exploring Galleria mellonella larval model to evaluate antibacterial efficacy of Cecropin A (1-7)-Melittin against multi-drug resistant enteroaggregative Escherichia coli. Pathog Dis 2021, 79. [Google Scholar] [CrossRef] [PubMed]
- Ilkow CS, Marguerie M, Batenchuk C, Mayer J, Ben Neriah D, Cousineau S, Falls T, Jennings VA, Boileau M, Bellamy D et al. : Reciprocal cellular cross-talk within the tumor microenvironment promotes oncolytic virus activity. Nat Med 2015, 21, 530–536. [Google Scholar] [CrossRef]
- Zhou Y, Chen CL, Jiang SW, Feng Y, Yuan L, Chen P, Zhang L, Huang S, Li J, Xia JC et al. : Retrospective analysis of the efficacy of adjuvant CIK cell therapy in epithelial ovarian cancer patients who received postoperative chemotherapy. Oncoimmunology 2019, 8, e1528411. [Google Scholar] [CrossRef]
- Snyder KM, Dixon KJ, Davis Z, Hosking M, Hart G, Khaw M, Matson A, Bjordahl R, Hancock B, Shirinbak S et al.: iPSC-derived natural killer cells expressing the FcγR fusion CD64/16A can be armed with antibodies for multitumor antigen targeting. J Immunother Cancer 2023, 11.
- Yao L, Hou J, Wu X, Lu Y, Jin Z, Yu Z, Yu B, Li J, Yang Z, Li C et al.: Cancer-associated fibroblasts impair the cytotoxic function of NK cells in gastric cancer by inducing ferroptosis via iron regulation. Redox Biol 2023, 67, 102923.
- Sun, L.; Jiang, G.; Ng, Y.Y.; Xiao, L.; Du, Z.; Wang, S.; Zhu, J. T cells with split CARs specific for NKG2D ligands and PD-L1 exhibit improved selectivity towards monocyte-derived cells while effective in eliminating acute myeloid leukaemia in vivo. J Cancer Res Clin Oncol 2023, 149, 10189–10201. [Google Scholar] [CrossRef] [PubMed]
- Jimenez-Duran G, Luque-Martin R, Patel M, Koppe E, Bernard S, Sharp C, Buchan N, Rea C, de Winther MPJ, Turan N et al.: Pharmacological validation of targets regulating CD14 during macrophage differentiation. EBioMedicine 2020, 61, 103039.
- Yu Q, Xu M, Yu F, Jin Y. CD4(+)CD25(+) regulatory T cells as a therapeutic target in rheumatoid arthritis. Cent Eur J Immunol 2014, 39, 100–103. [Google Scholar]
- Liu Q, Yang C, Wang S, Shi D, Wei C, Song J, Lin X, Dou R, Bai J, Xiang Z et al. : Wnt5a-induced M2 polarization of tumor-associated macrophages via IL-10 promotes colorectal cancer progression. Cell Commun Signal 2020, 18, 51. [Google Scholar] [CrossRef] [PubMed]
- Ma X, Gao Y, Chen Y, Liu J, Yang C, Bao C, Wang Y, Feng Y, Song X, Qiao S. M2-Type Macrophages Induce Tregs Generation by Activating the TGF-β/Smad Signalling Pathway to Promote Colorectal Cancer Development. Onco Targets Ther 2021, 14, 5391–5402. [CrossRef]
- Pan, Y.; Yu, Y.; Wang, X.; Zhang, T. Tumor-Associated Macrophages in Tumor Immunity. Front Immunol 2020, 11, 583084. [Google Scholar] [CrossRef]
- Gocher, A.M.; Workman, C.J.; Vignali, D.A.A. Interferon-γ: Teammate or opponent in the tumour microenvironment? Nat Rev Immunol 2022, 22, 158–172. [Google Scholar] [CrossRef]
- Banta KL, Xu X, Chitre AS, Au-Yeung A, Takahashi C, O’Gorman WE, Wu TD, Mittman S, Cubas R, Comps-Agrar L et al. : Mechanistic convergence of the TIGIT and PD-1 inhibitory pathways necessitates co-blockade to optimize anti-tumor CD8(+) T cell responses. Immunity 2022, 55, 512–526. [Google Scholar] [CrossRef]
- Yang, R.; Pei, T.; Huang, R.; Xiao, Y.; Yan, J.; Zhu, J.; Zheng, C.; Xiao, W.; Huang, C. Platycodon grandiflorum Triggers Antitumor Immunity by Restricting PD-1 Expression of CD8(+) T Cells in Local Tumor Microenvironment. Front Pharmacol 2022, 13, 774440. [Google Scholar] [CrossRef]
- Garg, S.K.; Welsh, E.A.; Fang, B.; Hernandez, Y.I.; Rose, T.; Gray, J.; Koomen, J.M.; Berglund, A.; Mulé, J.J.; Markowitz, J. Multi-Omics and Informatics Analysis of FFPE Tissues Derived from Melanoma Patients with Long/Short Responses to Anti-PD1 Therapy Reveals Pathways of Response. Cancers (Basel) 2020, 12. [Google Scholar] [CrossRef] [PubMed]
- Bally AP, Lu P, Tang Y, Austin JW, Scharer CD, Ahmed R, Boss JM. NF-κB regulates PD-1 expression in macrophages. J Immunol 2015, 194, 4545–4554. [Google Scholar] [CrossRef] [PubMed]
- Xu, P.; Sun, Z.; Wang, Y.; Miao, C. Long-term use of indomethacin leads to poor prognoses through promoting the expression of PD-1 and PD-L2 via TRIF/NF-κB pathway and JAK/STAT3 pathway to inhibit TNF-α and IFN-γ in hepatocellular carcinoma. Exp Cell Res 2015, 337, 53–60. [Google Scholar] [CrossRef] [PubMed]
- Ye, L.; Zhang, Y.; Chen, Y.J.; Liu, Q. Anti-tumor effects of lidocaine on human gastric cancer cells in vitro. Bratisl Lek Listy 2019, 120, 212–217. [Google Scholar] [CrossRef] [PubMed]
- Hayakawa, Y.; Fox, J.G.; Gonda, T.; Worthley, D.L.; Muthupalani, S.; Wang, T.C. Mouse models of gastric cancer. Cancers (Basel) 2013, 5, 92–130. [Google Scholar] [CrossRef]
- Chow, A.; Perica, K.; Klebanoff, C.A.; Wolchok, J.D. Clinical implications of T cell exhaustion for cancer immunotherapy. Nat Rev Clin Oncol 2022, 19, 775–790. [Google Scholar] [CrossRef]
- Wen, Z.; Sun, H.; Zhang, Z.; Zheng, Y.; Zheng, S.; Bin, J.; Liao, Y.; Shi, M.; Zhou, R.; Liao, W. High baseline tumor burden-associated macrophages promote an immunosuppressive microenvironment and reduce the efficacy of immune checkpoint inhibitors through the IGFBP2-STAT3-PD-L1 pathway. Cancer Commun (Lond) 2023, 43, 562–581. [Google Scholar] [CrossRef]
- Steen, E.H.; Wang, X.; Balaji, S.; Butte, M.J.; Bollyky, P.L.; Keswani, S.G. The Role of the Anti-Inflammatory Cytokine Interleukin-10 in Tissue Fibrosis. Adv Wound Care (New Rochelle) 2020, 9, 184–198. [Google Scholar] [CrossRef]
- Degboé, Y.; Rauwel, B.; Baron, M.; Boyer, J.F.; Ruyssen-Witrand, A.; Constantin, A.; Davignon, J.L. Polarization of Rheumatoid Macrophages by TNF Targeting Through an IL-10/STAT3 Mechanism. Frontiers in immunology 2019, 10, 3. [Google Scholar] [CrossRef]
- Zhang H, Li R, Cao Y, Gu Y, Lin C, Liu X, Lv K, He X, Fang H, Jin K et al. : Poor Clinical Outcomes and Immunoevasive Contexture in Intratumoral IL-10-Producing Macrophages Enriched Gastric Cancer Patients. Ann Surg 2022, 275, e626–e635. [Google Scholar] [CrossRef]
- Ahn, E.; Araki, K.; Hashimoto, M.; Li, W.; Riley, J.L.; Cheung, J.; Sharpe, A.H.; Freeman, G.J.; Irving, B.A.; Ahmed, R. Role of PD-1 during effector CD8 T cell differentiation. Proc Natl Acad Sci U S A 2018, 115, 4749–4754. [Google Scholar] [CrossRef] [PubMed]
- Cai, Z.; Zhang, S.; Wu, P.; Ren, Q.; Wei, P.; Hong, M.; Feng, Y.; Wong, C.K.; Tang, H.; Zeng, H. A novel potential target of IL-35-regulated JAK/STAT signaling pathway in lupus nephritis. Clinical and translational medicine 2021, 11, e309. [Google Scholar] [CrossRef]
- Moeini, S.; Saeidi, M.; Fotouhi, F.; Mondanizadeh, M.; Shirian, S.; Mohebi, A.; Gorji, A.; Ghaemi, A. Synergistic effect of programmed cell death protein 1 blockade and secondary lymphoid tissue chemokine in the induction of anti-tumor immunity by a therapeutic cancer vaccine. Arch Virol 2017, 162, 333–346. [Google Scholar] [CrossRef] [PubMed]
- Wu W, Jiang H, Li Y, Yan MX. IL-35 expression is increased in laryngeal squamous cell carcinoma and in the peripheral blood of patients. Oncol Lett 2017, 13, 3303–3308. [Google Scholar] [CrossRef] [PubMed]
- Jiang H, Zhang T, Yan MX, Wu W. IL-35 inhibits CD8(+) T cells activity by suppressing expression of costimulatory molecule CD28 and Th1 cytokine production. Transl Cancer Res 2019, 8, 1319–1325. [Google Scholar] [CrossRef]
- Zeng JC, Zhang Z, Li TY, Liang YF, Wang HM, Bao JJ, Zhang JA, Wang WD, Xiang WY, Kong B et al. : Assessing the role of IL-35 in colorectal cancer progression and prognosis. Int J Clin Exp Pathol 2013, 6, 1806–1816. [Google Scholar]
- Huang Y, Hu H, Liu L, Ye J, Wang Z, Que B, Liu W, Shi Y, Zeng T, Shi L et al.: Interleukin-12p35 Deficiency Reverses the Th1/Th2 Imbalance, Aggravates the Th17/Treg Imbalance, and Ameliorates Atherosclerosis in ApoE-/- Mice. Mediators Inflamm 2019, 2019, 3152040.
- Olson, B.M.; Jankowska-Gan, E.; Becker, J.T.; Vignali, D.A.; Burlingham, W.J.; McNeel, D.G. Human prostate tumor antigen-specific CD8+ regulatory T cells are inhibited by CTLA-4 or IL-35 blockade. J Immunol 2012, 189, 5590–5601. [Google Scholar] [CrossRef]
- Vinay DS, Ryan EP, Pawelec G, Talib WH, Stagg J, Elkord E, Lichtor T, Decker WK, Whelan RL, Kumara H et al.: Immune evasion in cancer: Mechanistic basis and therapeutic strategies. Semin Cancer Biol 2015, 35 Suppl, S185–s198.
Disclaimer/Publisher’s Note: The statements, opinions and data contained in all publications are solely those of the individual author(s) and contributor(s) and not of MDPI and/or the editor(s). MDPI and/or the editor(s) disclaim responsibility for any injury to people or property resulting from any ideas, methods, instructions or products referred to in the content. |
© 2024 by the authors. Licensee MDPI, Basel, Switzerland. This article is an open access article distributed under the terms and conditions of the Creative Commons Attribution (CC BY) license (http://creativecommons.org/licenses/by/4.0/).


