Preprint
Article

Diospyros kaki Alcoholic Extract Induces Mitochondrial Dysfunction in Colorectal Cancer Cell Lines

Submitted:

10 October 2024

Posted:

11 October 2024

You are already at the latest version

A peer-reviewed article of this preprint also exists.

Abstract

Diospyros kaki, the most widely cultivated species of persimmon, has been long used in traditional medicine since its leaves extracts contain high amounts of flavonoids and terpenoids, endowed with potential antioxidant, anti-inflammatory, anticancer, antidiabetic and antimicrobial effects. Re-cently, many in vitro and in vivo studies have assessed different potential health benefits of per-simmon leaves; however, its anticancer activity towards colorectal cancer (CRC), the second deadliest cancer in Western countries, has not been investigated in depth. Since CRC current therapies are associated with serious side effects and show no efficacy towards patients carrying RAS/BRAF mutations, the search for new and more effective therapies has turned to plant extracts, which could help reduce conventional drugs dosages and toxicity. The effect of Diospyros kaki al-coholic extract has been investigated on E705 CRC cell line, representative of most CRC patients, and on SW480 cells, carrying a KRAS activating mutation. This extract is effective in reducing tumor cells viability, without affecting the healthy mucosa cell line CCD 841, and it triggers apoptosis in CRC cells, by disrupting mitochondrial functionality and increasing oxidative stress.

Keywords: 
Subject: 
Biology and Life Sciences  -   Biochemistry and Molecular Biology

1. Introduction

Oriental persimmon, Diospyros kaki Thunb. (Ebenaceae), is the most widely cultivated species of persimmon; its leaves have long been used in traditional medicine to treat infectious diseases, bites, constipation, hemorrhages and strokes. Moreover, in Asian cultures, leaves extracts are also used to make tea and as food additives; they contain high amounts of flavonoids and terpenoids, endowed with potential antioxidant, antihypertensive, anti-inflammatory, anticancer, antidiabetic, antiallergic and antimicrobial effects. More recently, many in vitro and in vivo studies have assessed different potential health benefits of persimmon leaves, including antioxidant, anticancer, antidiabetic, antihyperlipidemic, antihypertensive as well as anti-atherosclerosis, anti-inflammatory, immunostimulatory, neuroprotective and antimicrobial properties [1].
As regards anticancer activity, ethanolic extract of persimmon leaves have been shown to induce apoptosis in prostate cancer PC-3 cells [2], by increasing oxidative stress, and to activate c-Jun N-terminal kinase (JNK) [3]. These effects have been attributed to flavonoids, the main components of persimmon leaves extracts. However, polysaccharides have also shown anticancer effect, suppressing Transforming Growth Factor-beta 1 (TGF-β1)-induced epithelial-to-mesenchymal transition in A549 lung cancer cells [4]. Other studies have shown that persimmon leaves ethanolic extract are endowed with antioxidant activity and free-radical scavenging ability [5]. Moreover, ethanol extracts of D. kaki leaves have been shown to inhibit epithelial-to-mesenchymal transition in hepatocellular carcinoma cell cultures [6].
The anticancer activity of persimmon leaves extracts towards colorectal cancer (CRC) has not been investigated in depth. A preventive effect towards CRC was suggested by Direito and collaborators, who detected anti-inflammatory properties in persimmon phenolic extracts, as well as the ability to impair cell proliferation and invasion in colon carcinoma HT-29 cells [7]. Chen and coworkers have reported that flavonoids obtained from persimmon leaves can induce apoptosis in HCT-116 CRC cells, among others, by increasing intracellular ROS, causing damage to the cell membrane and rupture of the nuclear membrane [8]. Keskin and collaborators have shown that silver nanoparticles coated with persimmon leaves extracts reduce Caco2 cells viability in a dose dependent way [9]. Moreover, Park and coworkers showed that D. kaki calyx, a plant byproduct containing high polyphenols levels, suppressed the proliferation of different human CRC cell lines, decreasing cyclin D1 expression, through Wnt signalling [10].
Given the fact that CRC is the second deadliest cancer in the Western world [11] and that current therapies are associated with serious side effects [12], in recent years the search for new and more effective therapies has turned to plant extracts. The majority of CRC are sporadic [13], with only a 10–20 % of hereditary forms, and lifestyle plays a very important role in CRC pathogenesis. In fact, excessive red meat and alcohol intake, as well as being overweight and a sedentary lifestyle promote CRC [11]. Conversely, regular physical activity, a diet rich in fruits, vegetables, fiber and fish, as well as adequate vitamins supply have been found protective towards CRC [14,15].
The current CRC therapies aim to inhibit epidermal growth factor receptor (EGFR) dimerization [16]. However, drugs like anti-EGFR monoclonal antibodies are associated to serious side effects and chemoresistance [12] and show no efficacy towards patients carrying RAS/BRAF mutations, whose prognosis is generally more unfavorable. For these reasons plant extracts, such as persimmon leaves extract, could reduce conventional drugs dosages and toxicity.
In this work we show that persimmon leaves extract is effective in reducing viability of two different CRC cell lines: E705 cells, KRAS, NRAS, BRAF wild type but carrying a silent mutation in the PIK3CA gene, which are representative of most CRC patients, and SW480 cells, carrying a KRAS activating mutation which normally leads to a less common but more aggressive form of CRC. Persimmon leaves extract triggers apoptosis in both cell lines, by increasing oxidative stress.

2. Materials and Methods

2.1. Cell Cultures

The human colorectal cancer cell lines E705 (kindly provided by Fondazione IRCCS Istituto Nazionale dei Tumori, Milan, Italy) and SW480 (ATCC® CCL-228) were grown in RPMI 1640 medium supplemented with heat-inactivated 10 % FBS, 2 mM L-glutamine, 100 U/mL penicillin, 100 µg/mL streptomycin. The human healthy colon mucosa cell line CCD 841 (ATCC® CRL-1790) was grown in EMEM medium supplemented with heat-inactivated 10% fetal bovine serum (FBS), 2 mM L-glutamine, 0.1 mM non-essential amino acids, 100 U/mL penicillin, 100 µg/mL streptomycin. All cell lines were maintained at 37 °C in a humidified 5 % CO2 incubator. Cell lines were validated by short tandem repeat profiles that are generated by simultaneous amplification of multiple short tandem repeat loci and amelogenin (for gender identification). All the reagents for cell cultures were supplied by EuroClone (EuroClone S.p.A, Milan, Italy).

2.2. Plant Material and Preparation of D. kaki Extract

Leaves of D. kaki Thunb. were collected from a fruit-bearing tree growing in the botanical garden of Padua (Italy) and immediately frozen in dry ice. The plant material was ground in liquid nitrogen through an A11 basic analytical mill (IKA-Werke, Staufen, Germany) and 1 g of the resulting frozen powder was extracted with 10 mL of LC-MS grade methanol (Honeywell, Seelze, Germany). The sample was vortexed for 30 s, sonicated for 10 min at 40 kHz in an ultrasonic bath (SOLTEC, Milano, Italy) with ice, and centrifuged at 4 °C for 10 min at 14000 ×g. Supernatant was split into 1 mL-aliquots, each deriving from 100 mg of fresh leaves, and dried using a speed-vac system (Heto-Holten; Frederiksborg, Denmark).

2.3. UHPLC-DAD-HRMS/MS Analysis

Untargeted analysis of D. kaki extract was performed on a Vanquish Flex UHPLC system interfaced to Diode Array Detector FG and Orbitap Exploris 120 mass spectrometer (ThermoFisher Scientific, Milano, Italy), equipped with a heated electrospray ionization source (HESI-II). A Kinetex C18 column (2.1 × 100 mm, 2.6 μm; Phenomenex, Bologna, Italy), protected by a C18 Guard Cartridge (2.1 mm I.D.) and thermostated at 30 °C, and a binary gradient (0-3 min, 2 % B; 3-5 min, 2-13 % B; 5-9 min, 13 % B; 9-13 min 13-18 % B; 13-17 min 18-30 % B; 17-20 min 30 % B; 20-30 min 30-40 % B; 30-38 min 40-60 % B; 38-40 min 68-98 % B flow rate of 500 µL min−1 and injection volume of 5 µL) of H2O (A) and MeCN (B), both containing 0.1 % of HCOOH, were employed for the chromatographic separation.
Mass spectrometer was operated in positive and negative ionization modes using a Full MS data-dependent MS/MS acquisition mode with a stepped collision energy HCD (20, 40, and 60). The resolution of the Full MS scans (scan range 150-1500 m/z) and dd-MS2 scans was set at 30k (FWHM). Instrument control and spectra acquisition were carried out using Xcalibur software (Version 4.4, ThermoFisher Scientific). UV spectra were acquired in the 200-600 nm range.
Detected compounds were characterized based on HRMS data (accurate masses, probable molecular formulas and product ions) and retention times. The identification level was established following the metabolomics standards initiative (MSI): level 1, unambiguous identification with reference standards; level 2, tentative identification by comparing MS2 data with literature or spectral databases; level 3, tentative identification by spectral similarity to chemical class of compounds and chemotaxonomic data.

2.4. Viability Assay

The different cell lines were seeded in 96-well microtiter plates at a density of 1 x 10⁴ cells/well, cultured in complete medium and after 24 hours treated with D. kaki extract, solubilized in pure ethanol, at a concentrations range between 0 and 400 μg/mL. Ethanol concentration in the wells was 0.5 % in both treated and untreated cells. Then, 24 hours after treatment, cell viability was investigated using MTT (3-(4,5-Dimethylthiazol-2-yl)-2,5-Diphenyltetrazolium Bromide) in vitro toxicology assay kit (Merck KGaA, Darmstadt, Germany), according to manufacturer’s protocols. Absorbance was measured at 570 nm using Spectrostar Nano Microplate Reader (BMG LABTECH, Ortenberg, Germany) after a 4-hour incubation for CCD 841 and 2 hours for E705 and SW480 cell lines, upon formazan crystals solubilization. Cell viability was expressed as a percentage against untreated cells used as control.

2.5. SDS-PAGE and Western Blotting

For Western-blot analysis, SW480 and E705 cells were seeded at a density of 6 × 10⁵ cells/60 mm dish and treated with 200 and 400 μg/mL D. kaki extract 24 hours after seeding. At the end of the 24 hours treatment cells were rinsed with ice-cold PBS (10 mM K2HPO4, 150 mM NaCl, pH 7.2) and lysed on ice in RIPA buffer (50 mM Tris-HCl pH 7.5, 150 mM NaCl, 1 % NP-40, 0.5 % sodium deoxycholate, 0.1 % SDS) containing 1 μM leupeptin, 2 μg/mL aprotinin, 1 μg/mL pepstatin, 1 mM PMSF and a phosphatase inhibitors cocktail (Merck KgaA, Darmstadt, Germany). Subsequently, homogenates were obtained by passing 5 times through a blunt 20-gauge needle fitted to a syringe and then centrifuged at 15000 ×g for 30 min. Supernatants were analyzed for protein content by the BCA protein assay [17]. SDS-PAGE and Western blotting were carried out by standard procedures [18]. The following antibodies were used: anti-Bcl-2 (dilution 1:1000, #15071 Cell Signaling Technology, Danvers, MA, USA), anti-caspase-3 (dilution 1:1000, #14220 Cell Signaling Technology, Danvers, MA, USA), anti-P-ERK (dilution 1:1000, #4370 Cell Signaling Technology, Danvers, MA, USA), anti-ERK (dilution 1:1000, #4695 Cell Signaling Technology, Danvers, MA, USA), anti-vinculin (dilution 1:5000, V9131 Merck KgaA, Darmstadt, Germany), IgG HRP anti-rabbit (dilution 1:8000, #7074 Cell Signaling Technology, Danvers, MA, USA) and IgG HRP anti-mouse (dilution 1:8000, #7076 Cell Signaling Technology, Danvers, MA, USA). Protein levels were visualized using ECL detection system (EuroClone S.p.A, Milan, Italy) and quantified by densitometry of immunoblots using ImageStudio software (LI-COR Biosciences, Lincoln, NE, USA).

2.6. Intracellular Reactive Oxygen Species (ROS) Measurement

Dichlorofluorescein diacetate (H2DCFDA) dye has been used for total intracellular reactive oxygen species (ROS) detection. SW480 and E705 cell lines were seeded in 96-well black microplates with clear bottom at a density of 1 × 10⁴ cells and 2 × 10⁴ cells per well respectively. Twenty-four hours after seeding cells were incubated with 5 µM H2DCFDA in PBS for 30 min in the dark at 37 °C; then they were rinsed in PBS, treated for 4 hours with 200 and 400 μg/mL D. kaki extract and fluorescence (λem = 485 nm/λex = 535 nm) was measured using a fluorescence microtiter plate reader (VICTOR X3, PerkinElmer, Akron, OH, USA). Normalization was performed on total protein content, measured with Bradford assay [19]. All chemicals were supplied by Merck KGaA, Darmstadt, Germany.

2.7. Glutathione Detection

The measurement of total glutathione, oxidized glutathione (GSSG) and reduced glutathione (GSH) content was carried out on colorectal cancer cells treated with 200 and 400 μg/mL D. kaki extract for 24 hours. In detail, SW480 and E705 cells were seeded in 6-well plates at a density of 2 × 10⁵ cells/well and, the day after seeding, treated with D. kaki extract for 24 hours. At the end of the treatment, cells were harvested by trypsinization, washed with PBS and then glutathione measurements were performed as described in Bovio et al. 2024 [20]. All chemicals were supplied by Merck KGaA, Darmstadt, Germany.

2.8. Mitochondrial Transmembrane Potential (MTP) Evaluation

The mitochondrial potential sensitive carbocyanine dye 3,3′-dihexyloxacarbocyanine iodide (DiOC6) [21,22], which accumulates in mitochondria due to their negative membrane potential, has been used to measure MTP in both treated and untreated cancer cell lines. SW480 and E705 cells were plated at a density of 1 × 10⁴ cells per well in 96-well black microplates with clear bottom and 24 hours later treated with D. kaki extract at a final concentration of 200 and 400 μg/mL for a 24-hour treatment. Then treated cells were incubated with 40 nM DiOC6 in PBS for 20 min at 37 °C and 5 % CO2 in the dark. Plates were rinsed in PBS twice and fluorescence was measured at emission 485 nm/excitation 535 nm in end point mode, using a fluorescence microtiter plate reader (VICTOR X3, PerkinElmer, Akron, OH, USA). Normalization was performed on total protein content, measured with Bradford assay [19]. All chemicals were supplied by Merck KGaA, Darmstadt, Germany.

2.9. Seahorse Mito Stress Test and ATP Rate Assay

For the evaluation of mitochondrial parameters as well as the total ATP production, distinguishing between the amount derived from oxidative phosphorylation and glycolysis, Agilent Seahorse XF Cell Mito Stress Test Kit and XF ATP Rate Assay Kit were performed according to manufacturer protocols.
In brief, SW480 and E705 cells were seeded in Agilent Seahorse 96-well XF cell culture microplates at a density of 2 × 10⁴ cells/well in 180 µL of growth medium, allowed to adhere for 24 hours in a 37 °C humidified incubator with 5 % CO2 and treated with 200 and 400 μg/mL D. kaki extract for further 24 hours. Before running the assay, the Seahorse XF Sensor Cartridge was hydrated and calibrated with 200 µL of Seahorse XF Calibrant Solution in a non-CO2 37 °C incubator. Moreover, at the end of the treatment, the medium was replaced with 180 μL/well of Seahorse XF RPMI Medium pH 7.4 containing 1 mM pyruvate, 2 mM L-glutamine and 10 mM glucose and the Seahorse analyses have been carried out.
Each experiment was performed in technical quadruplicate per treatment for each biological replicate and at least three independent biological replicates have been carried out. Data were normalized on total protein content, quantified by Bradford assay [19]. All the kits and reagents were purchased by Agilent Technologies, Santa Clara, CA, USA.

2.10. Statistical Analysis

The samples were compared to their reference controls and the data were tested by Dunnett’s multiple comparison procedure (GraphPad Prism Software v. 8.0.2). Results were considered statistically significant at p < 0.05.

3. Results and Discussion

3.1. Profiling of Bioactive Compounds of D. kaki Leaf Extract

The profile of specialized metabolites in D. kaki leaf extract was defined using untargeted UHPLC-HRMS/MS analysis. A total of thirty-one compounds were tentatively identified based on HRMS/MS data and comparison with literature or database data, chemo-taxonomic data and the use of available standard compounds. The main compounds are listed in Table 1, and UHPLC- HRMS profile is shown in Figure 1.
Flavonol glycosides (13-15, 18, 19-31), mainly consisting of kaempferol, quercetin, myricetin and laricitrin derivatives, were found to be the most abundant and representative compounds. They exhibited diagnostic product ions in the (−)-HRMS2 spectra resulting from retro Diels-Alder reaction (1,3A−, 1,2A− and 1,2B−) of flavonol skeleton, as well as from the loss of the sugar moieties [23]. Kaempferol derivatives such as astragalin (26), one of its isomers (25) and two galloyl derivatives (28 and 29) were the major flavonol glycosides in D. kaki leaf.
Flavan 3-ols, including gallocatechin (2), catechin (7) and four B-type dimers (1, 3, 4 and 6), were also identified in the extract based on their characteristic fragmentation pattern [24].
The results of the untargeted analysis conducted in this study reveal a profile consistent with previously reported data on the composition of D. kaki leaves [1,25].

3.2. D. kaki Extract Reduces CRC Cells Viability, Triggering Apoptosis [26]

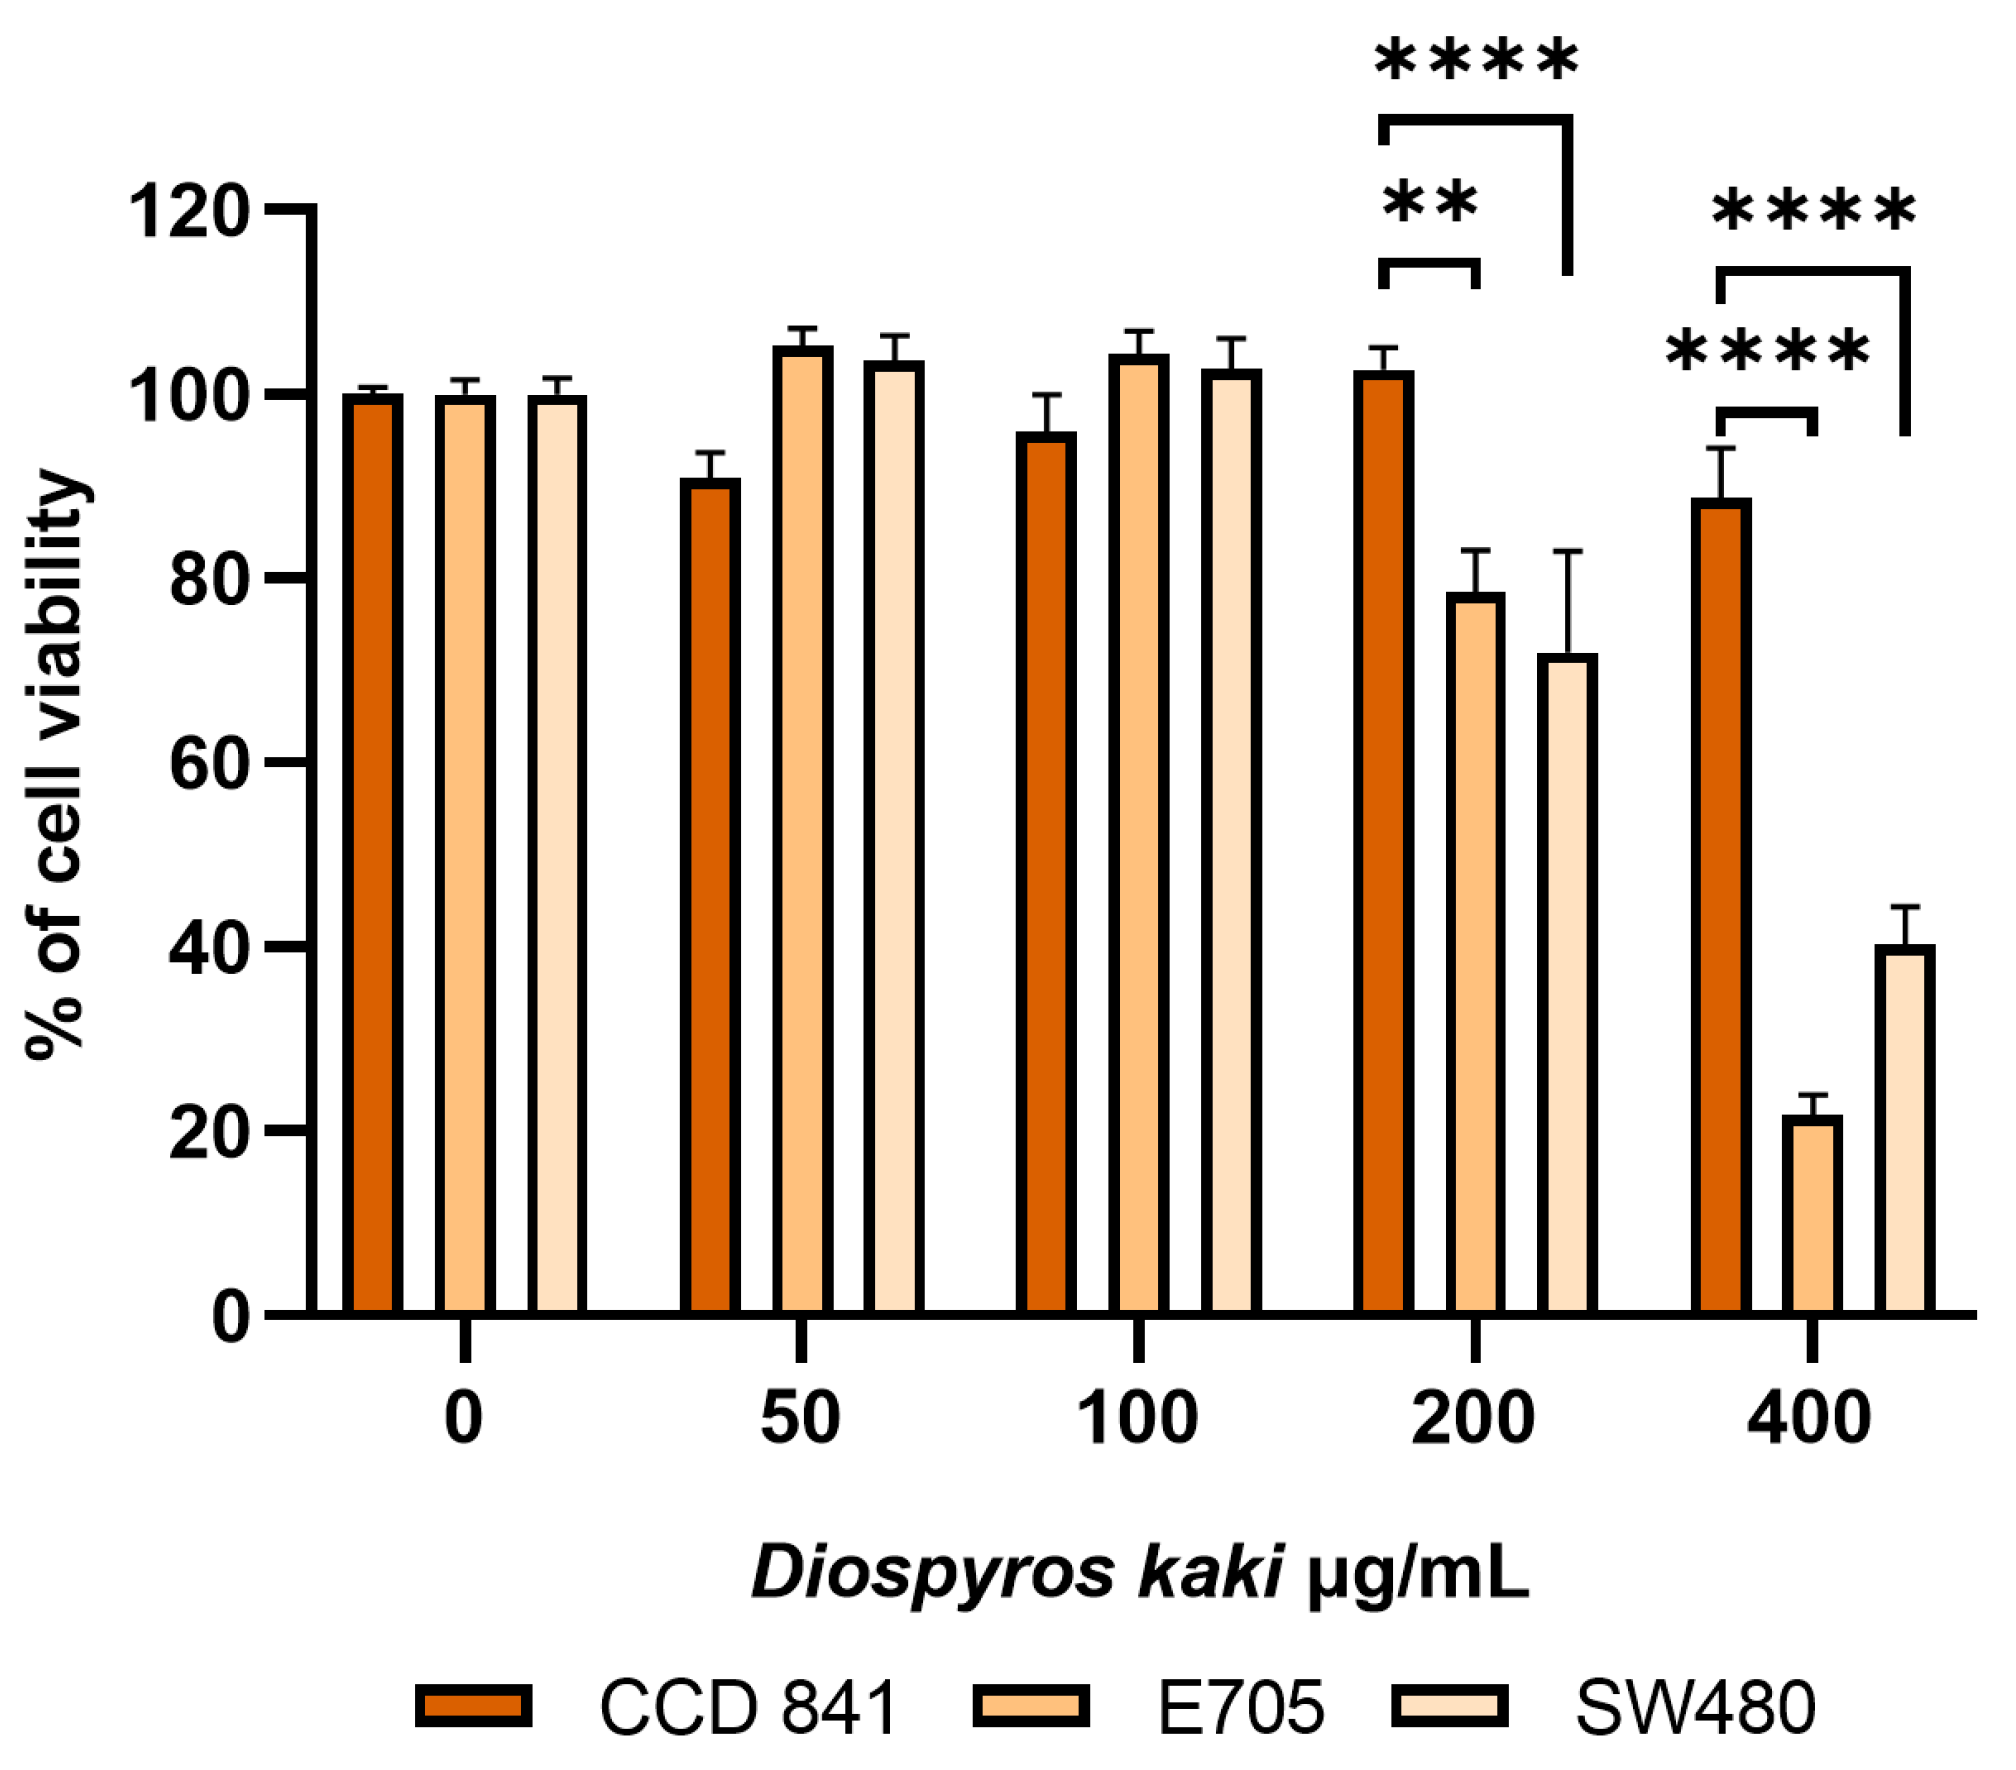
As reported in Figure 2, MTT tests performed on E705 and SW480 cells treated with different D. kaki concentrations showed a reduction of cells viability, starting from 200 µg/mL extract; following treatment with 400 µg/mL extract a reduction of cell viability of over 70 % and 60 % was achieved for E705 and SW480 cells respectively. Viability of healthy colon mucosa CCD 841 cells remained around 90 % even at the highest extract concentration.
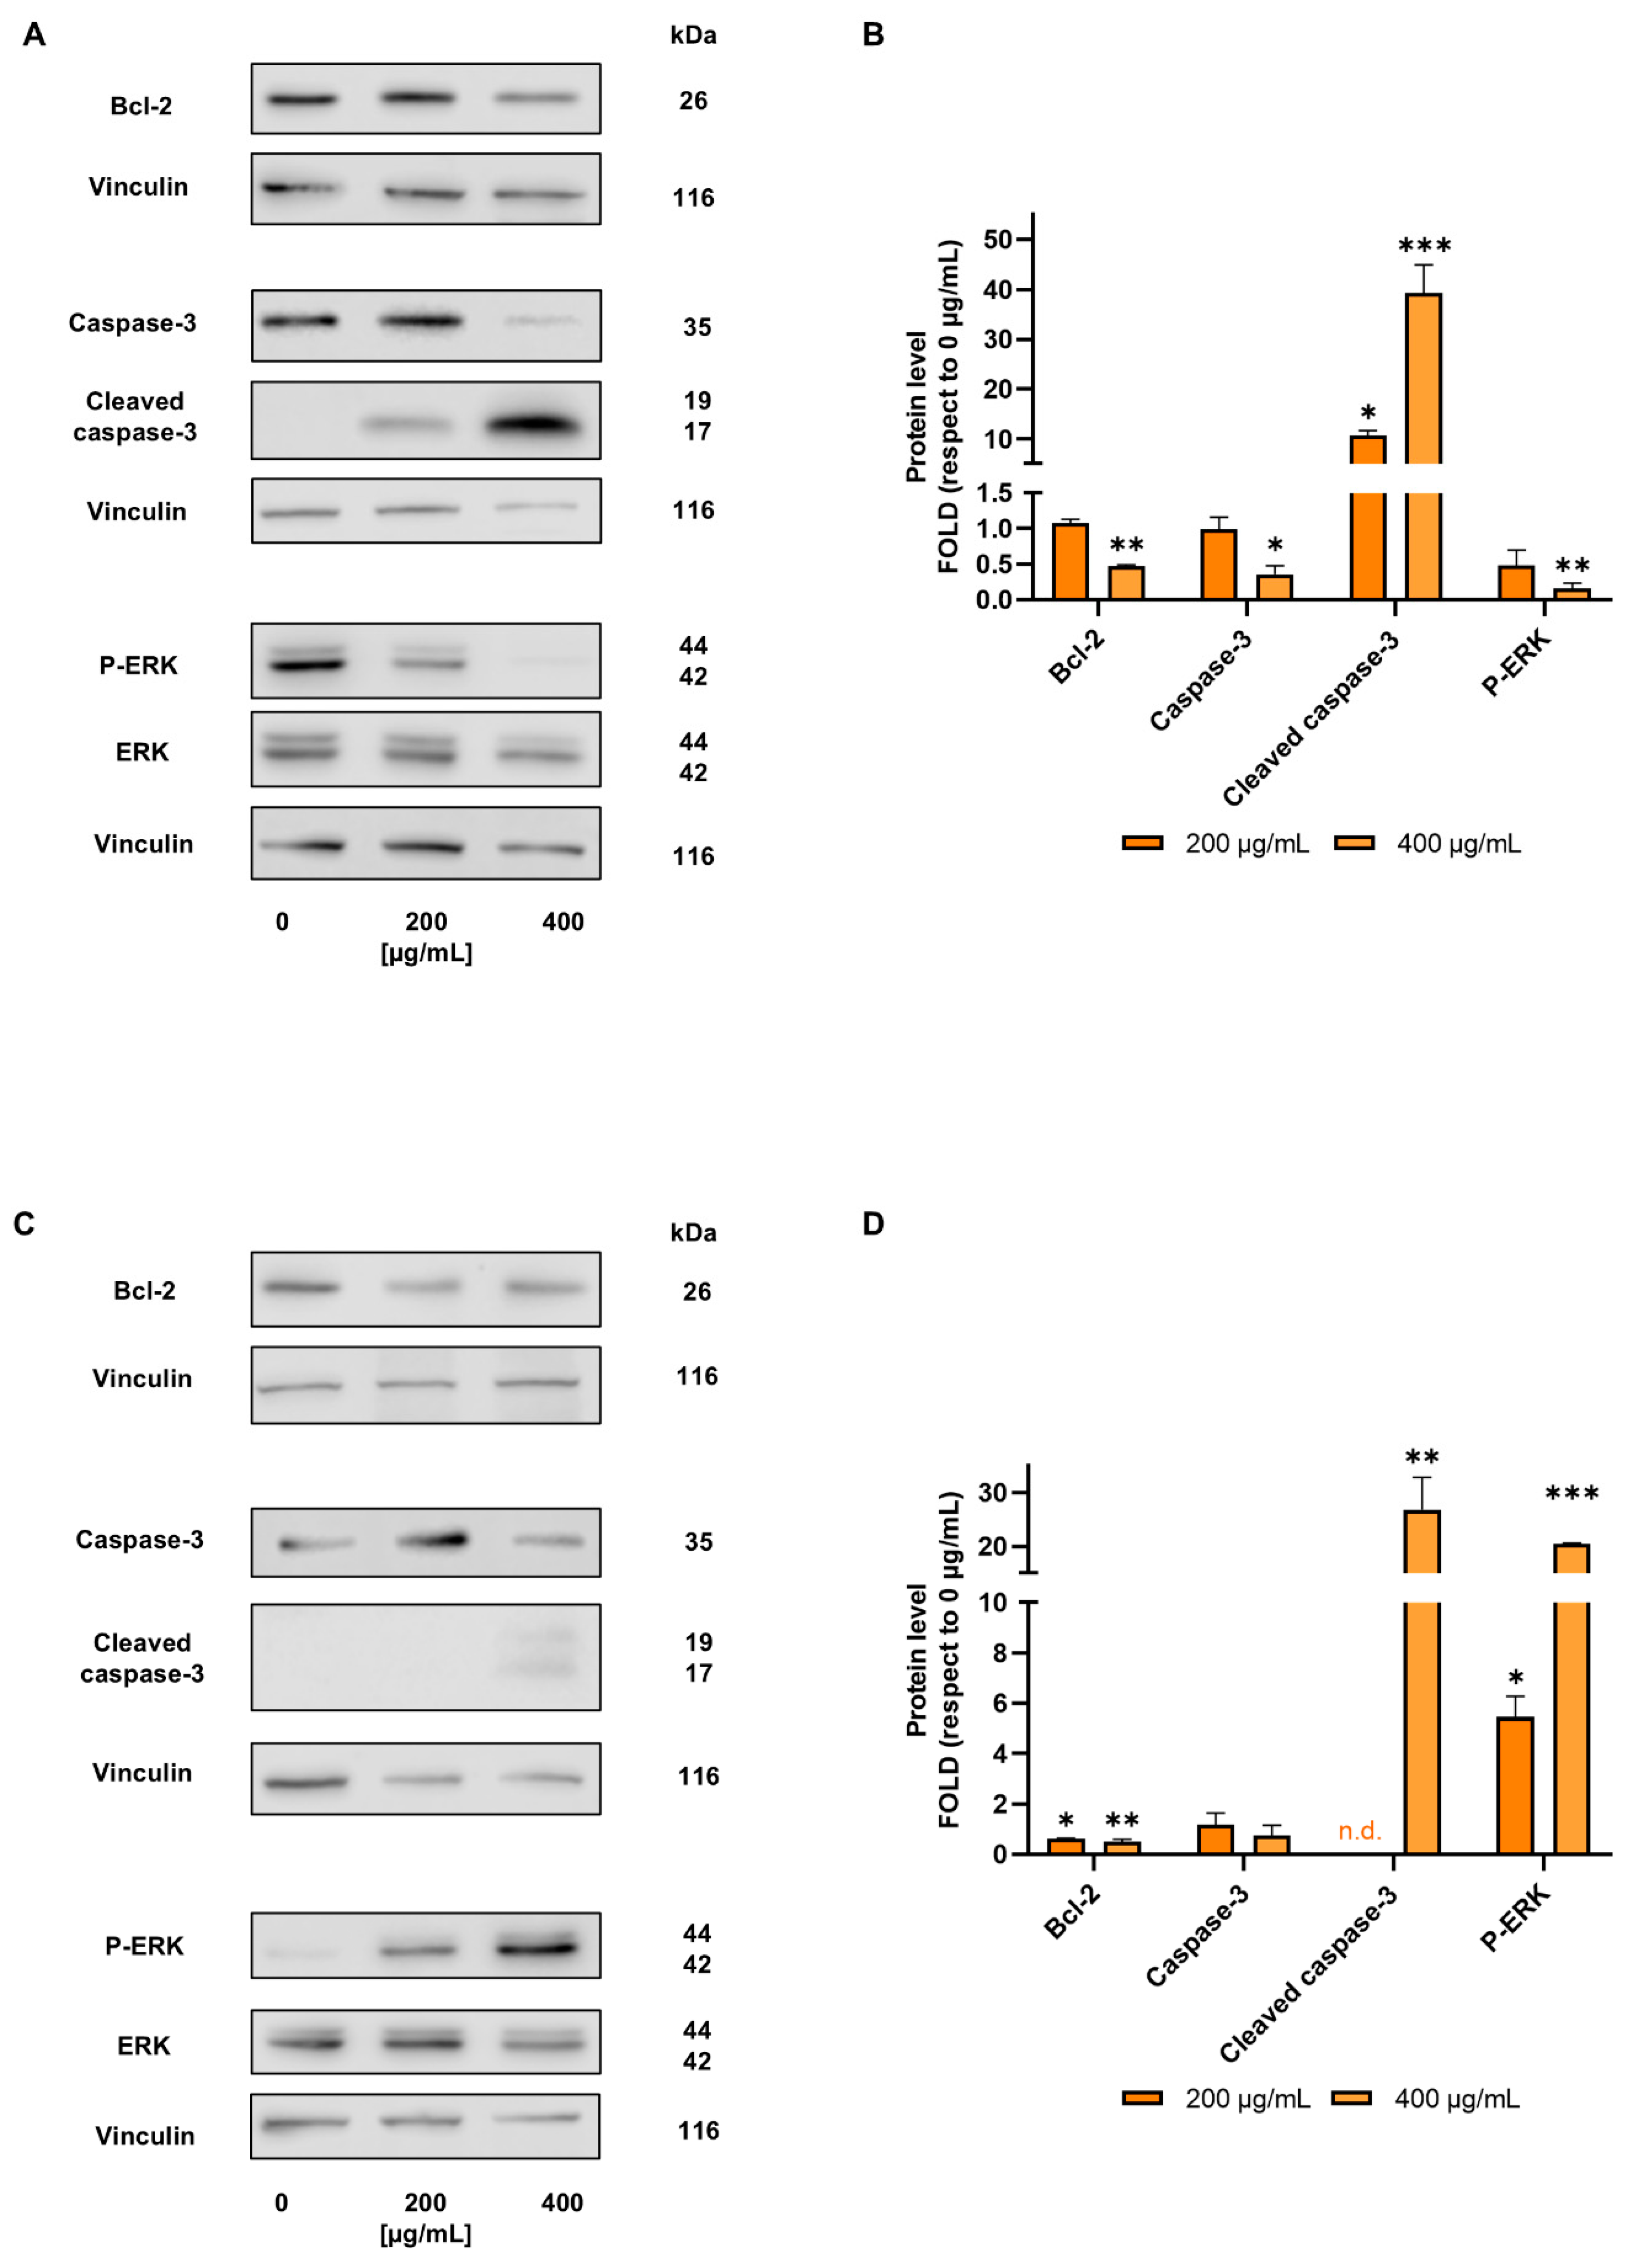
Western blotting, reported in Figure 3, showed for both cancer cell lines the downregulation of Bcl-2 and a decrease in the level of full-length caspase-3, following its proapoptotic cleavage. Cleaved caspase-3 was found to increase 40-fold and 25-fold in E705 and SW480 cells respectively, thus demonstrating the proapoptotic effect of D. kaki extract. However, while in E705 cells treatment with D. kaki extract decreased ERK phosphorylation, suggesting the downregulation of EGFR downstream pathway, in SW480 cells ERK phosphorylation was found to increase. A role for ERK activation in promoting apoptosis has been previously proposed and many compounds from plant extracts, including betulinic acid, quercetin, kaempferol and piperlongumine, have been reported to promote apoptosis through ERK activation [26] . Moreover, in a previous work by our group, we observed, in SW480 cells treated with polyphenols-enriched fractions of extracts of Cinnamomum cassia bark, Cinnamomum zeylanicum bark and Cinnamomum cassia buds, a particularly marked ERK activation triggering apoptosis [27].

3.3. D. kaki Extract Increases Oxidative Stress in CRC Cells

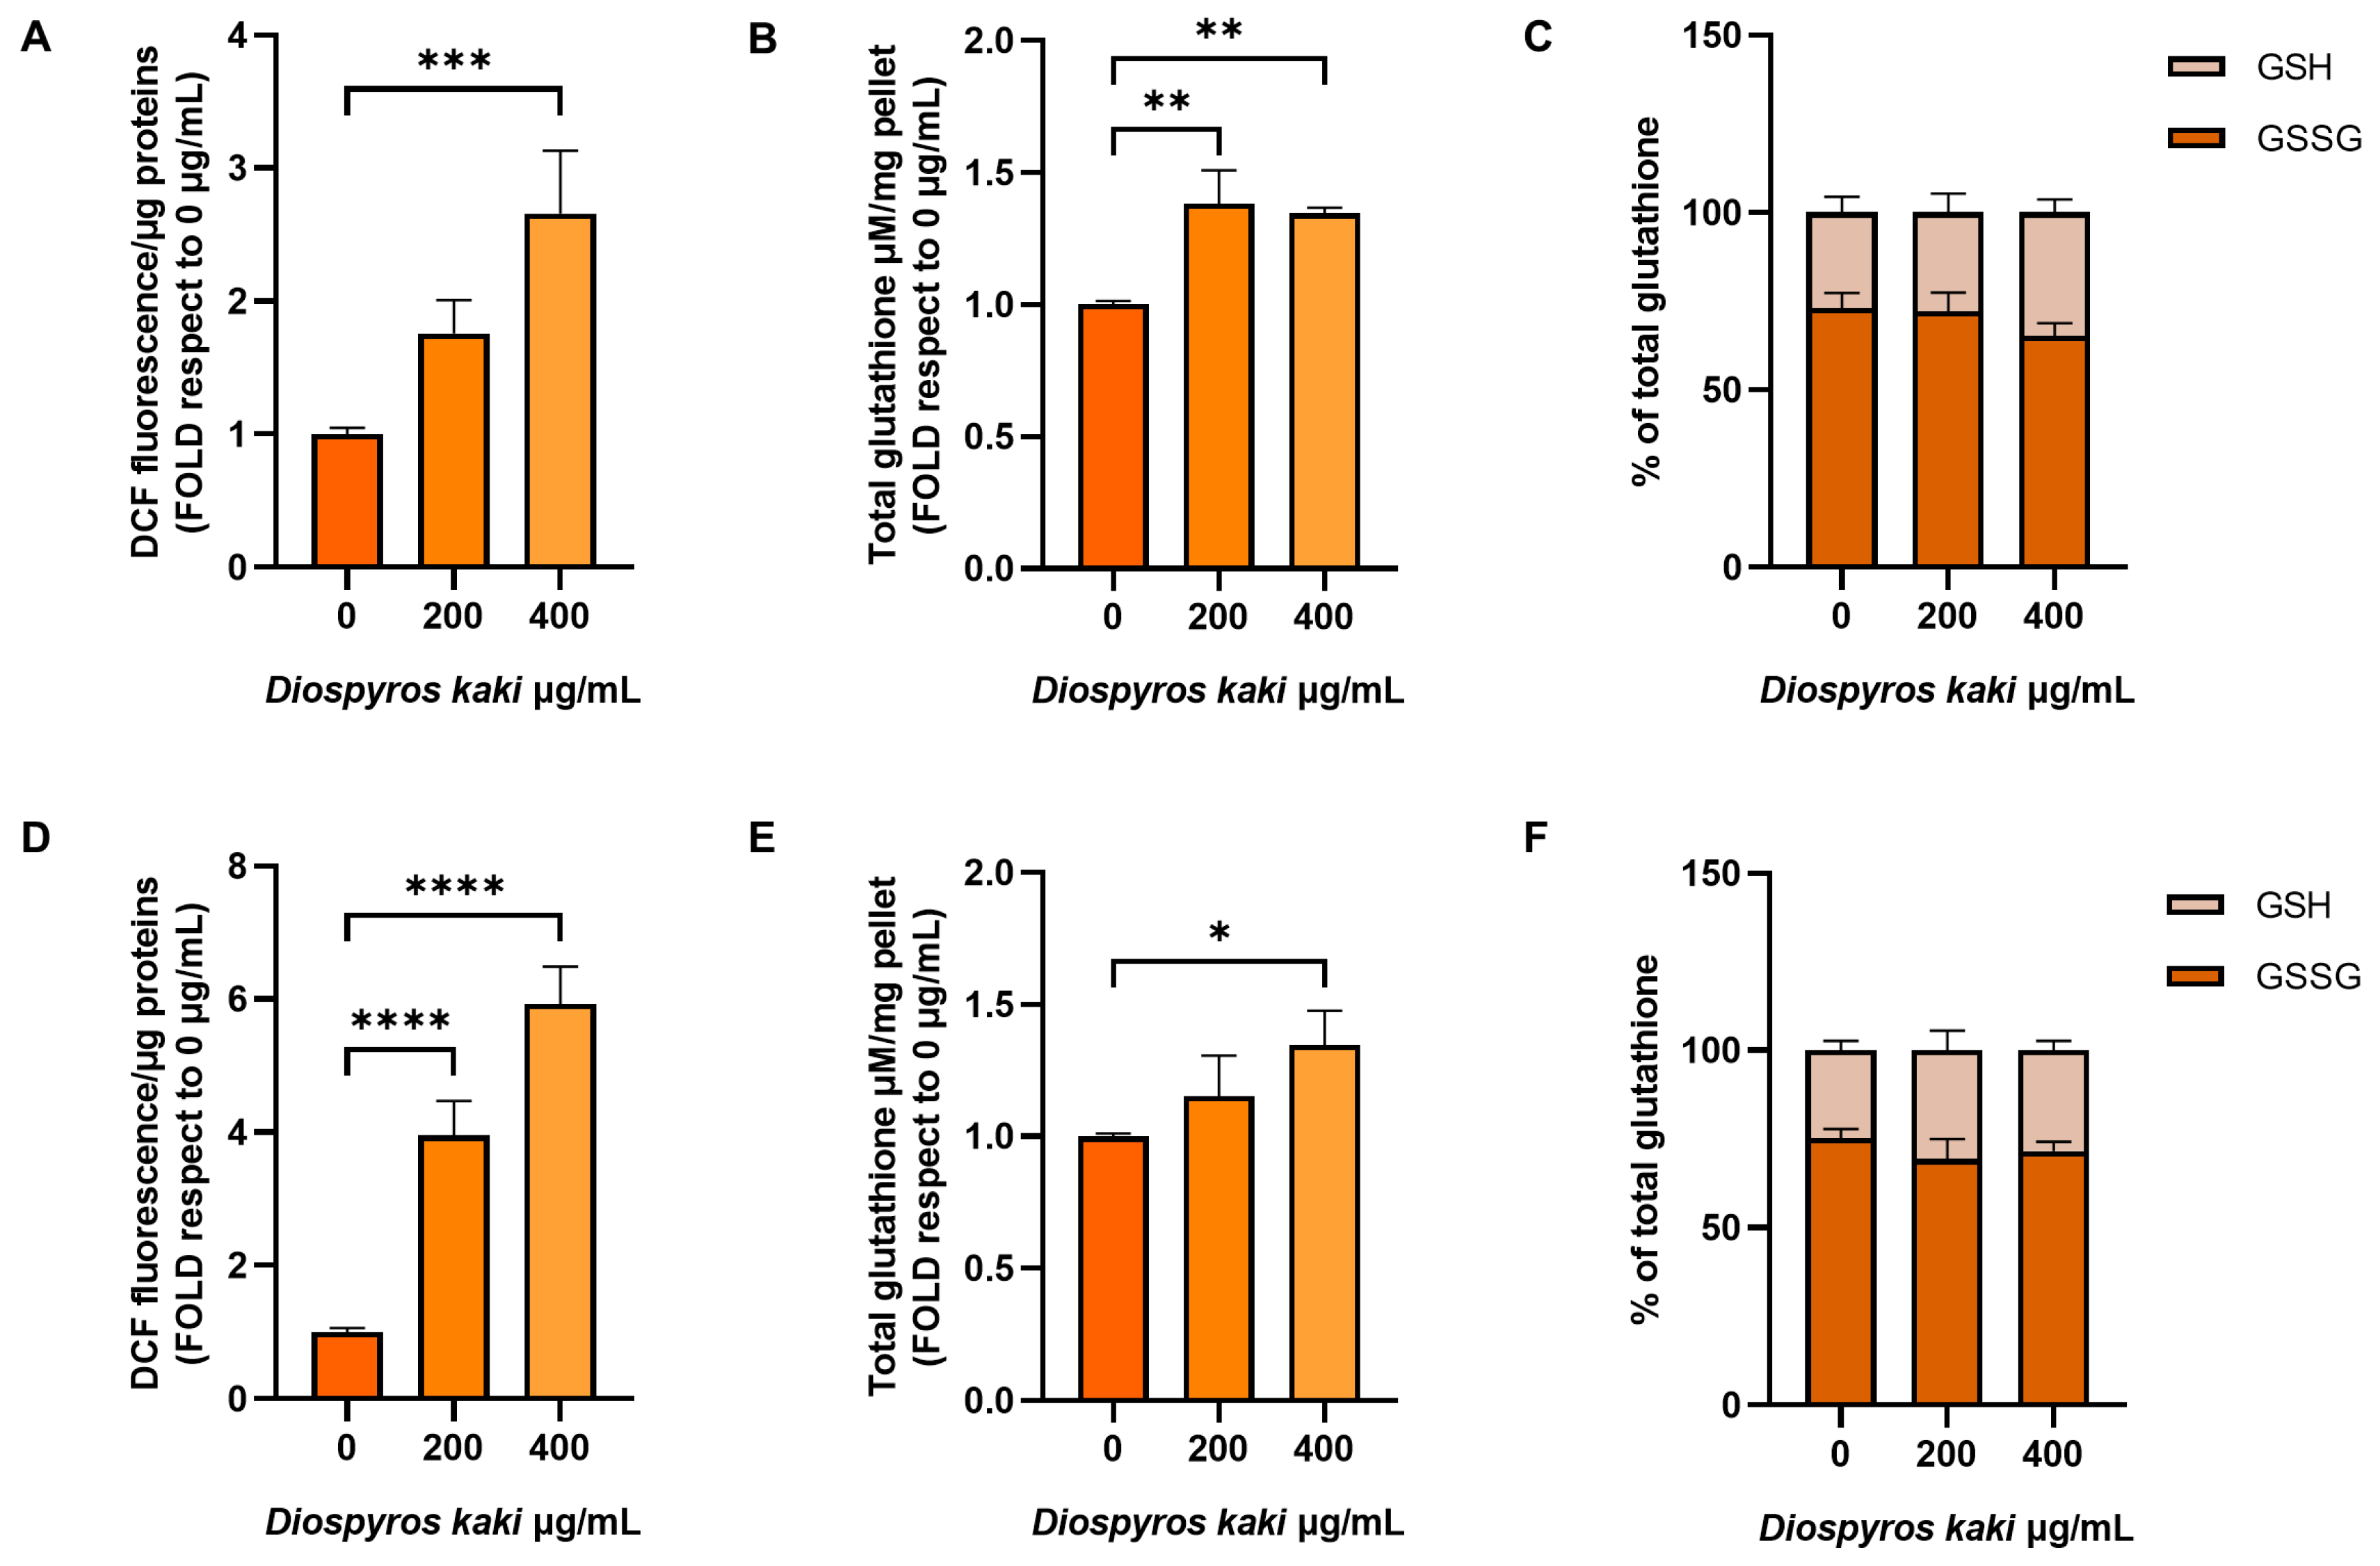
Evaluation of oxidative stress markers showed a dose dependent increase of cytosolic reactive oxygen species in both E705 and SW480 cells treated with D. kaki extract, as shown in Figure 4A and D. Total glutathione was also found to increase in both cell lines, although to a minor extent compared to the increase in ROS (Figure 4B and E). In particular, in E705 cells a 50 % increase of total glutathione was detected after 200 µg/mL D. kaki extract administration, while no further increase was induced by the administration of 400 µg/mL extract; this suggests that the high ROS increase may not be adequately matched by molecular defense against reactive oxygen species. In SW480 cells the increase in total glutathione was found dose dependent, but represented, at the maximum extract dose, only about 30 % of the initial level, suggesting that it may be not sufficient to balance increased oxidative stress. The ratio between reduced (GSH) and oxidized (GSSG) glutathione was found unaffected by extract administration.

3.4. Mitochondria Dysfunction Induced by D. kaki Extract is Not Rescued by Glycolysis Upregulation

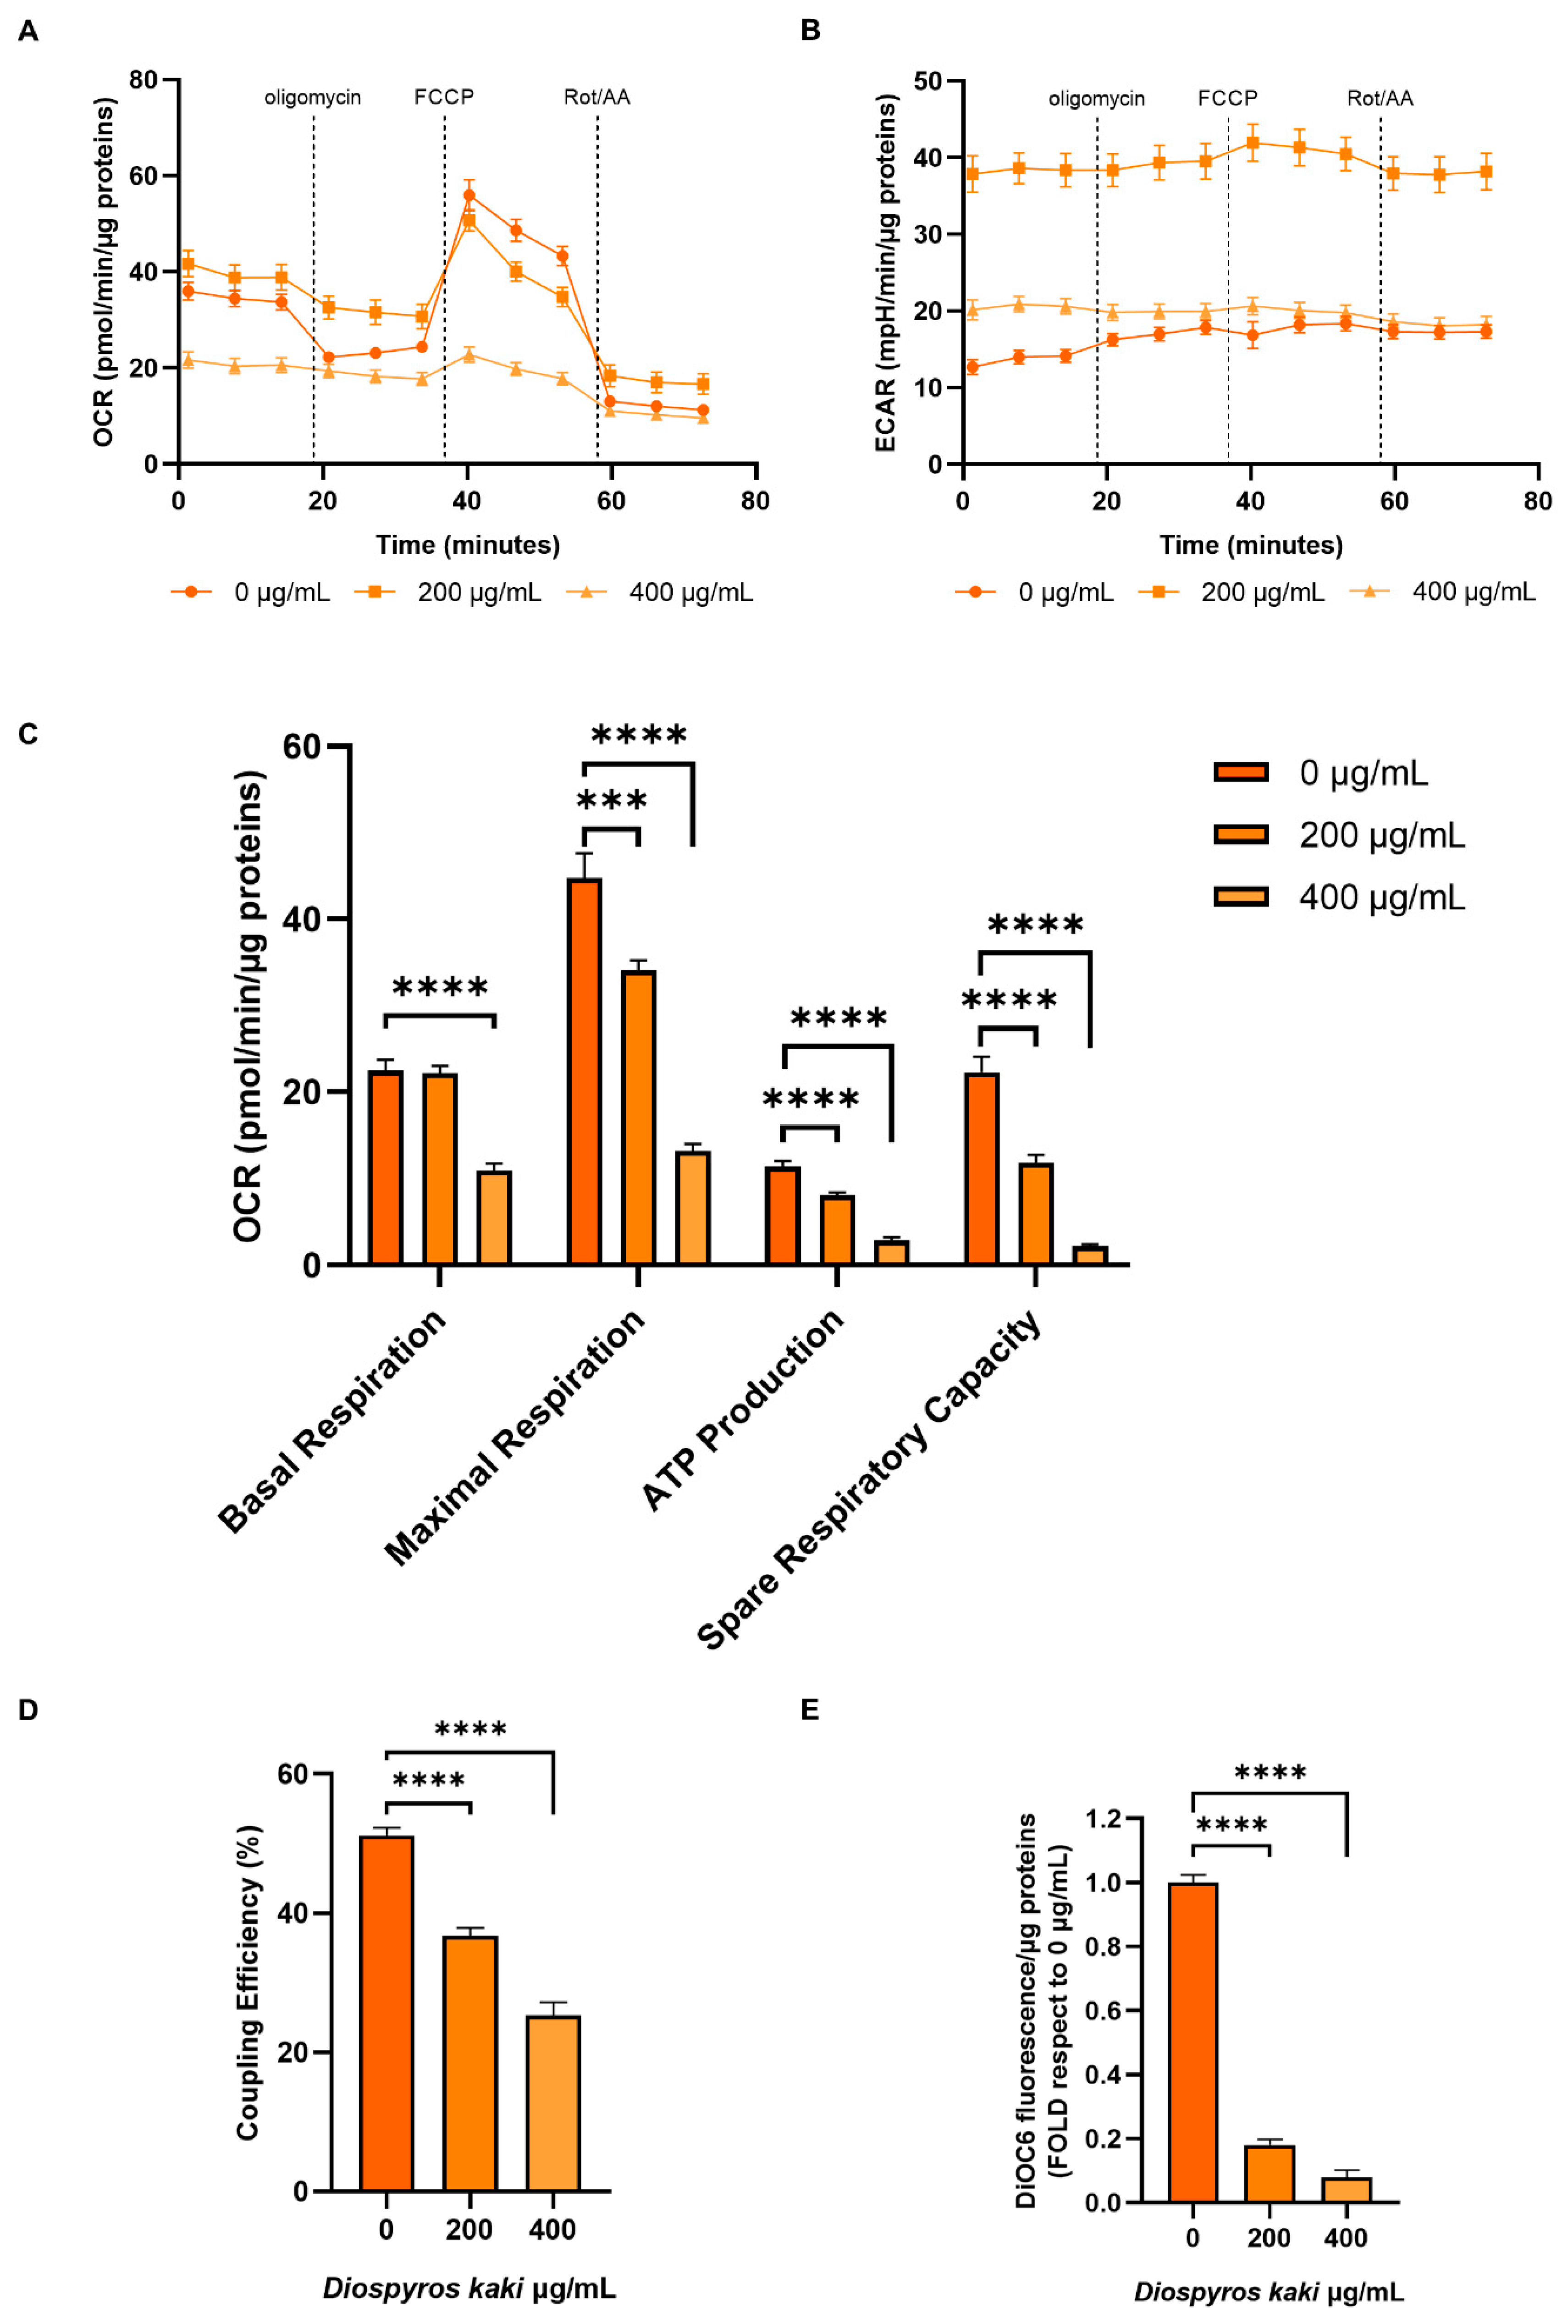
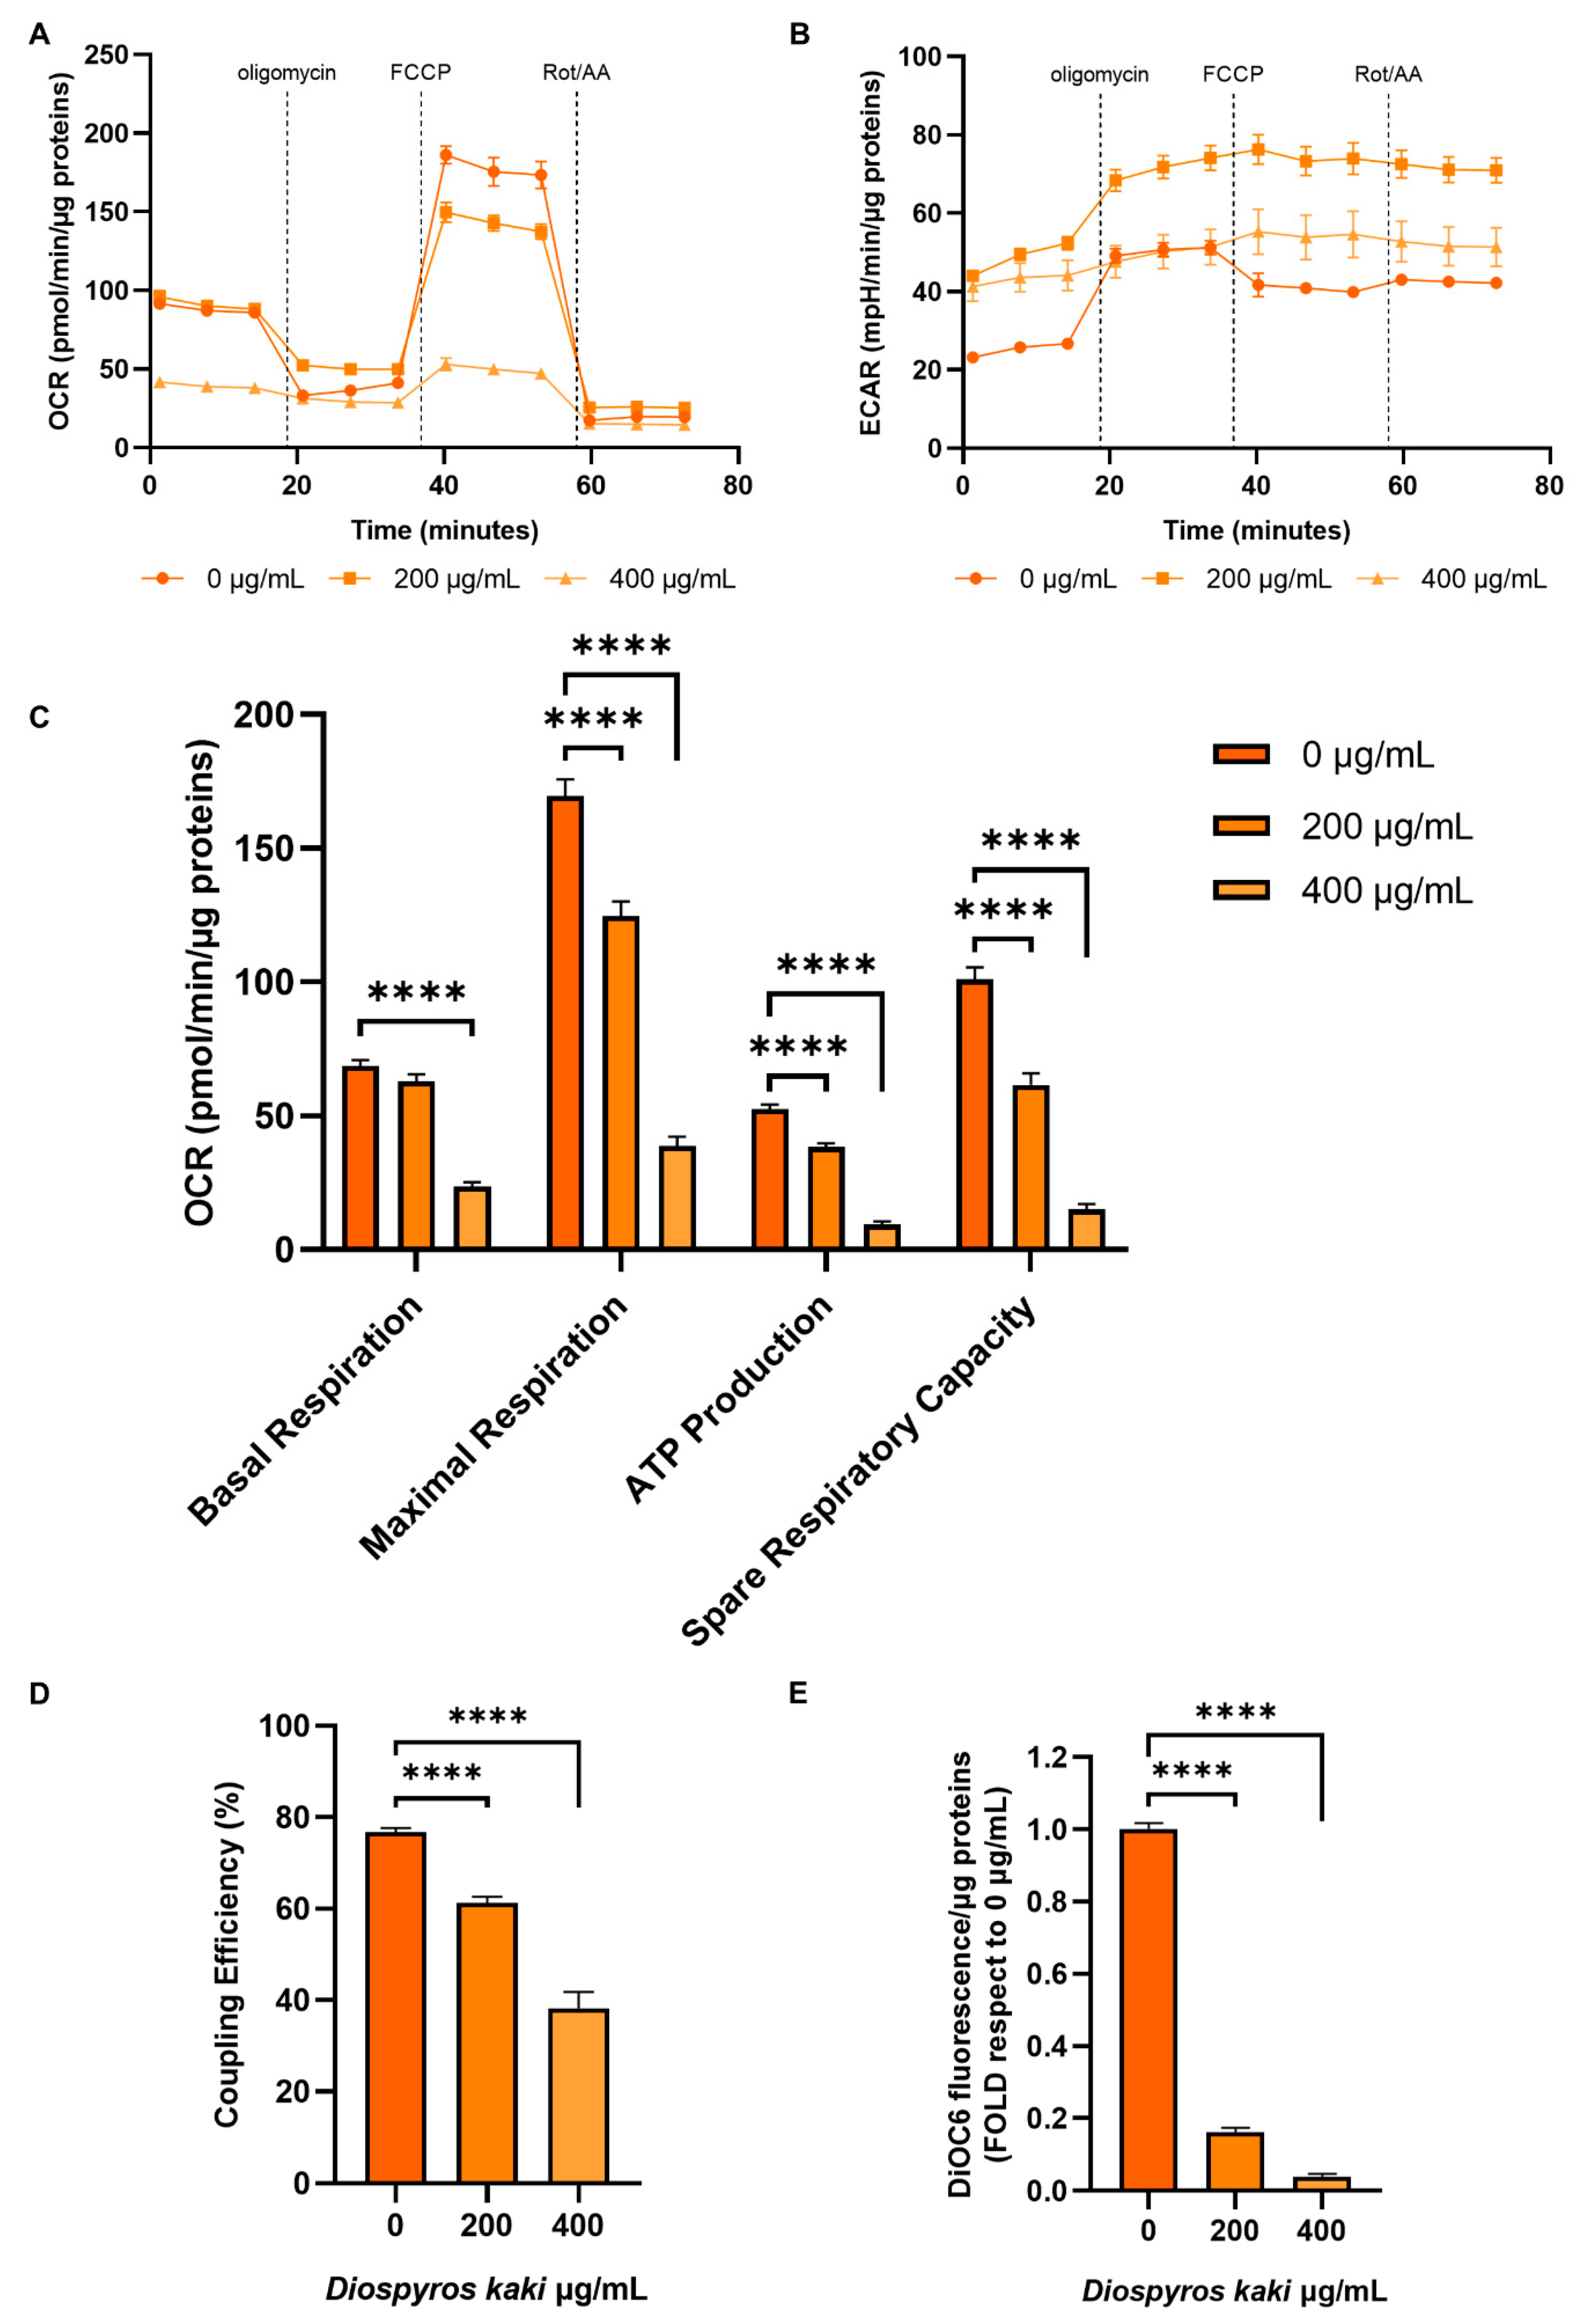
The increase in oxidative stress detected following incubation with D. kaki extract prompted us to investigate mitochondrial functionality through Seahorse technology. Results, reported in Figure 5, Figure 6 and Figure 7, showed that D. kaki extract administration triggered mitochondrial dysfunction in both E705 and SW480 cells. Although SW480 cells showed a higher basal respiration rate, extract addition led in both cases to a dose dependent decrease of both the maximal respiratory rate and the spare respiratory capacity (Figure 5A–C; Figure 6A–C). In particular, following incubation with 400 µg/mL extract, basal respiration was decreased to about 50 pmol/min/µg proteins in SW480 cells and to 20 pmol/min/µg proteins in E705 cells, showing only a minimal increase upon FCCP administration (Figures 5A and 6A), suggesting that mitochondria are largely uncoupled, as shown in Figures 5D and 6D. Accordingly, mitochondrial electrochemical potential decreased in both cell lines in a dose dependent fashion (Figures 5E and 6E).
ECAR evaluation, a pH measurement which is contributed to by both glycolysis and oxidative phosphorylation, showed a different pattern in the two different cell lines. In E705 cells (Figure 5B), addition of 200 µg/mL D. kaki extract led to a marked ECAR increase, which is entirely due to glycolysis hyperactivation, as demonstrated by the fact that it was not lowered by electron transport inhibition through rotenone and antimycin A addition. Moreover, no ECAR variation was observed when ATP synthase was inhibited, through oligomycin addition, nor upon mitochondrial uncoupling through FCCP addition, showing that basal ECAR increase was entirely due to glycolysis upregulation. When 400 µg/mL extract was added, basal ECAR increased to half the level reached upon addition of 200 µg/mL extract and also in this case the increase can be attributed exclusively to glycolysis upregulation, as demonstrated by the fact that it remained unchanged after rotenone and antimycin administration.
In SW480 cells, the addition of either 200 or 400 µg/mL extract increased ECAR by two-fold; however, following treatment with 200 µg/mL extract, glycolysis could be further upregulated upon oligomycin addition, suggesting that it could rescue aerobic ATP production impairment; on the other hand, following treatment with 400 µg/mL extract, glycolytic rate did not increase, following aerobic ATP synthesis inhibition. The inability of both cell lines to increase glycolytic rate switching to the Warburg effect, together with the extreme reduction of mitochondrial potential, likely led most cells to apoptotic death, following treatment with 400 µg/mL D. kaki extract.
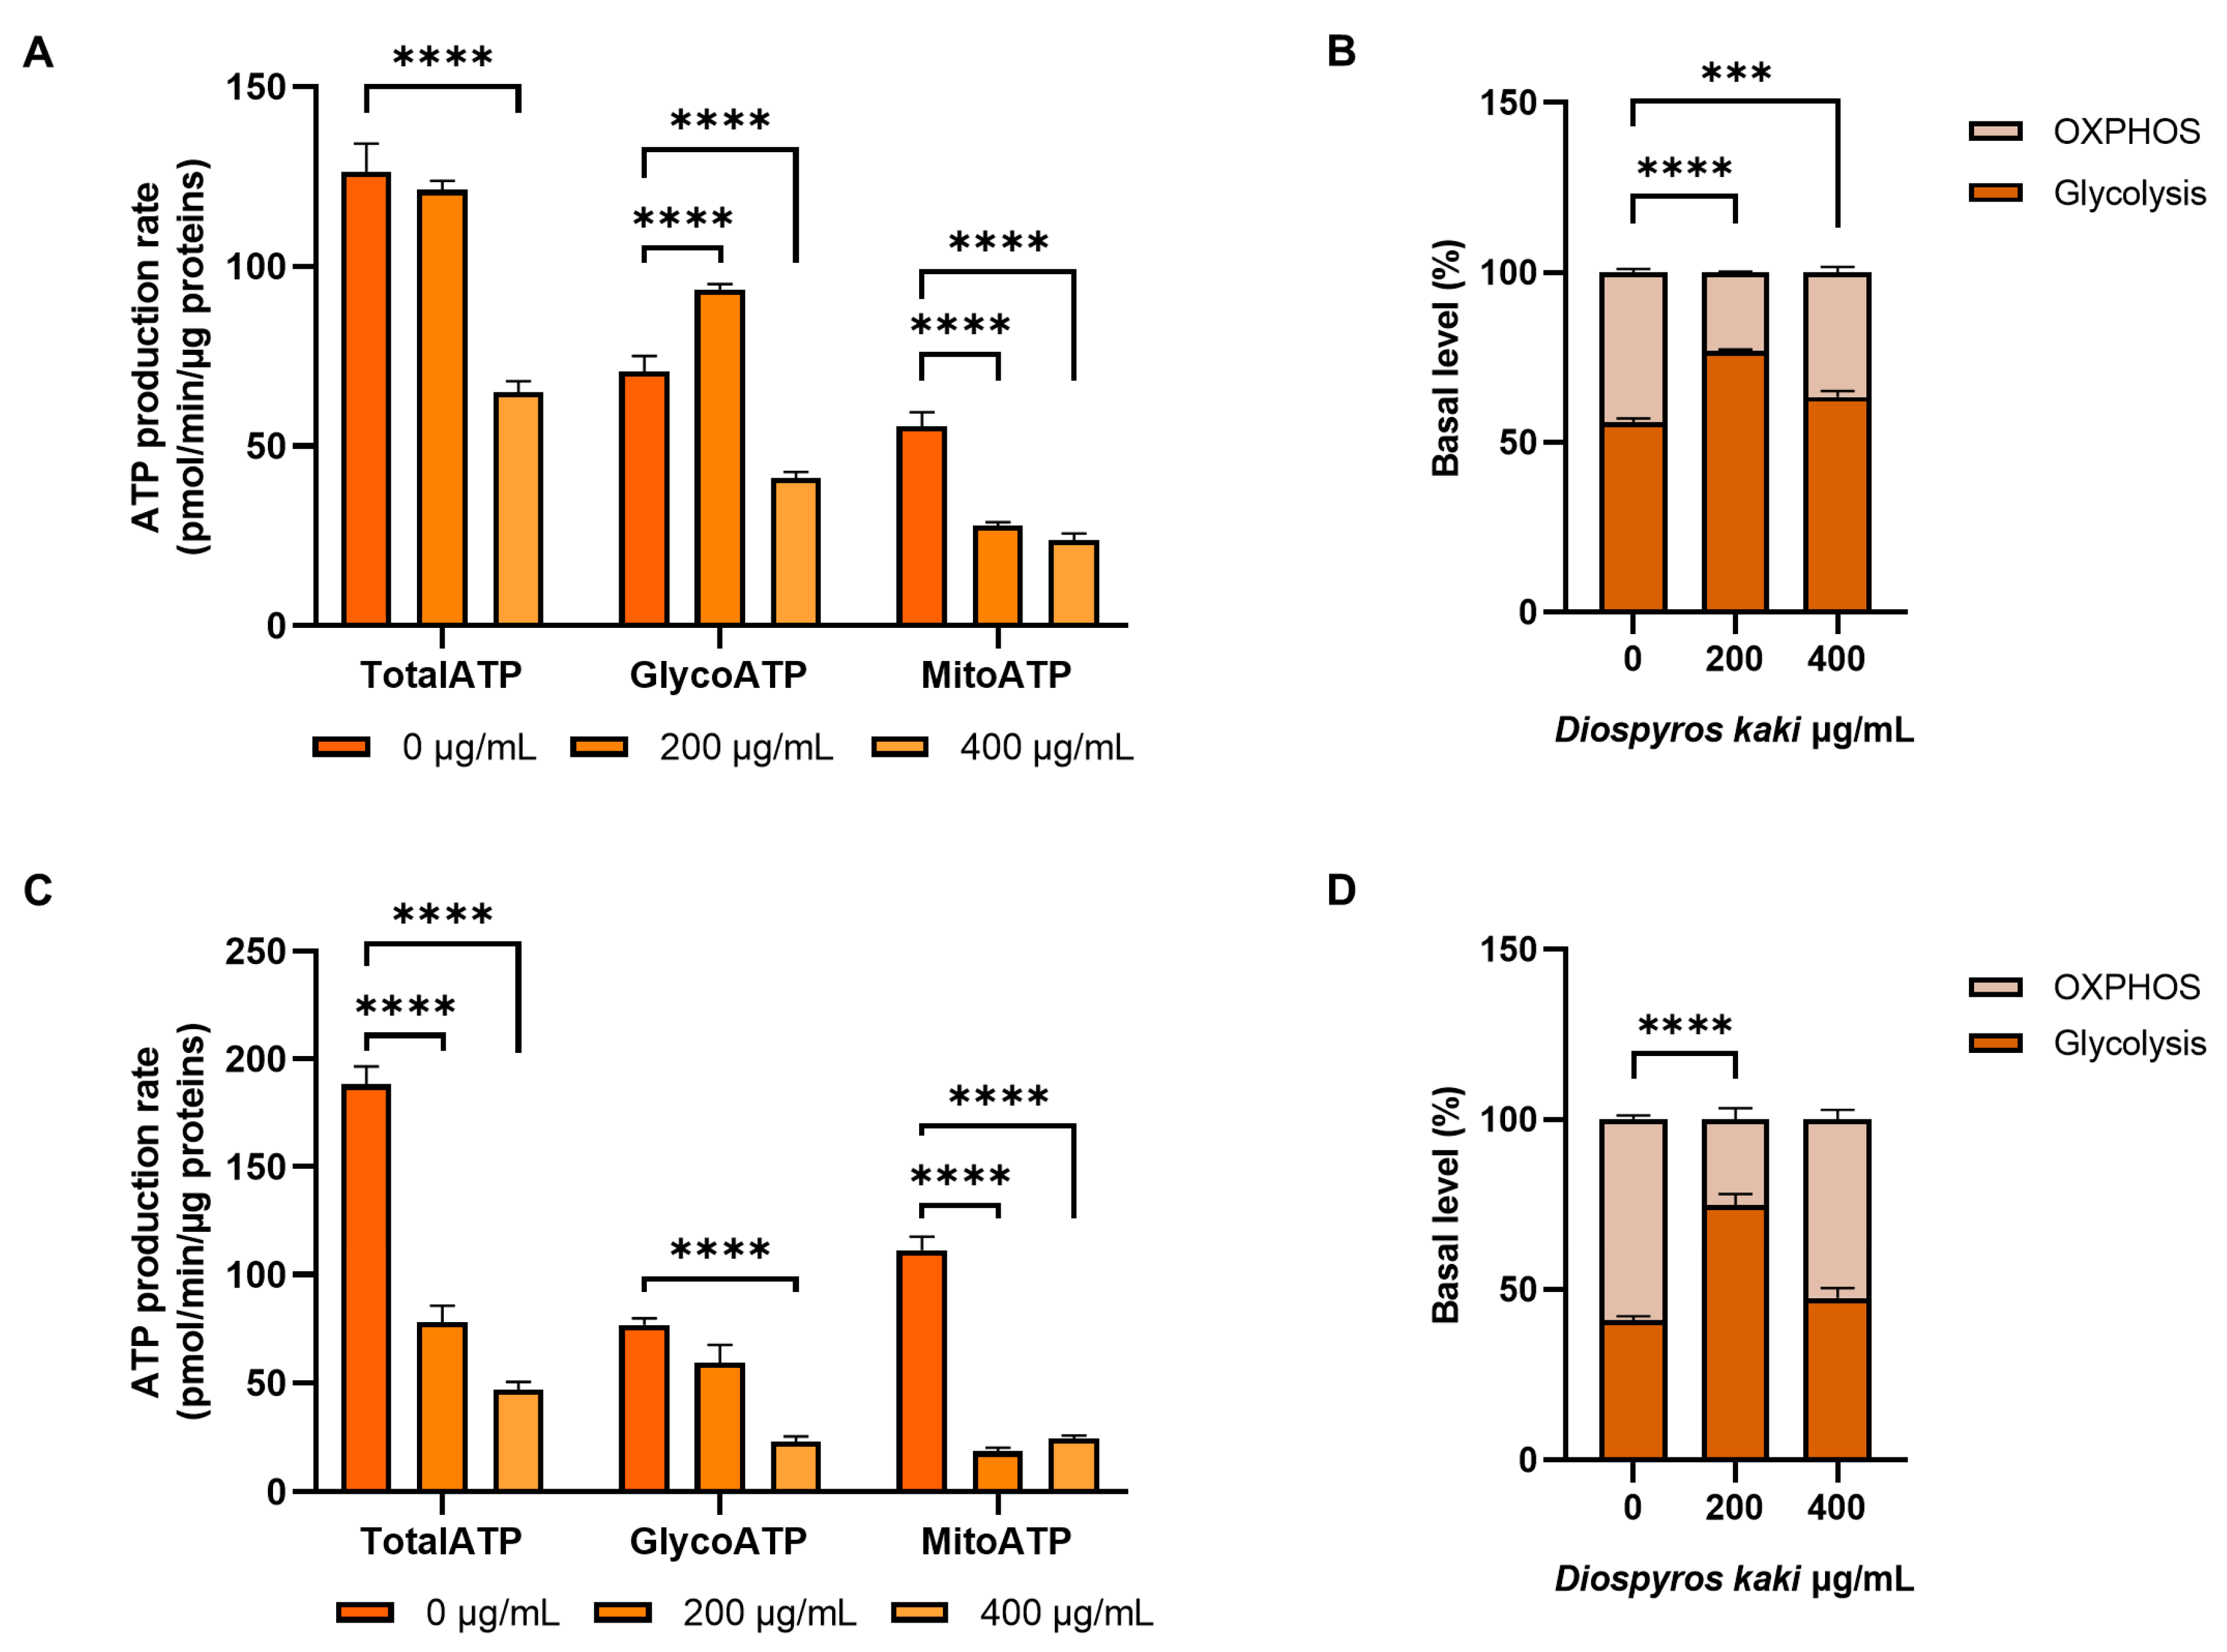
These data are in accordance with the relative contribution of glycolysis and oxidative phosphorylation to ATP synthesis reported in Figure 7. In E705 cells total ATP was found to decrease only upon addition of 400 µg/mL D. kaki extract, in accordance with the high glycolytic basal level of this cell line (Figure 7A). Addition of 200 µg/mL extract led to an increase in glycolytic ATP production, due to glycolysis hyperactivation, and to a decrease in mitochondrial ATP production; however, following 400 µg/mL extract administration, both glycolytic and mitochondrial ATP production markedly decreased (Figure 7A). Therefore, E705 cells metabolism was shifted towards a more glycolytic phenotype by the addition of 200 µg/mL extract, while it reverted to the original ratio between mitochondrial and glycolytic ATP production, following treatment with 400 µg/mL extract, although in this case total ATP production was strongly impaired, with a marked reduction of both glycolytic and mitochondrial ATP (Figure 7B).
In SW480 cells, addition of D. kaki extracts at either concentration led to a marked decrease of total ATP (Figure 7C). Both glycolytic and mitochondrial ATP production were impaired by the extract administration, in a dose dependent way; however, following treatment with 200 µg/mL extract, glycolysis upregulation could limit glycolytic ATP decrease, while mitochondrial ATP production was already strongly impaired, switching SW480 cells metabolism towards a glycolytic phenotype (Figure 7D). After treatment with 400 µg/mL extract, both glycolytic and mitochondrial ATP production were seriously damaged, leading most cells to apoptotic death.

4. Conclusions

This work shows that D. kaki ethanolic extract is endowed with anticancer activity towards both E705 and SW480 cell lines. Thus, it is in principle worth being taken into consideration for the therapy of CRC patients, including those carrying a KRAS mutation. At molecular level D. kaki extract increases the level of oxidative stress, which in turn leads to mitochondrial dysfunction. Overall, although at low extract concentrations both cell lines can compensate for the mitochondrial damage through glycolysis upregulation, at higher extract concentrations they appear unable to further increase glycolytic rate. This leads to a dramatic drop in ATP synthesis which triggers apoptosis. The ability of D. kaki extract to prevent cell switching to Warburg effect, although still to be elucidated at molecular level, makes this extract extremely promising for colorectal cancer therapy. Further studies will be carried out to assess whether this anticancer activity can be attributed to any single component of D. kaki extract or to a mixture.

Author Contributions

Conceptualization, S.B., M.F. and P.F.; Validation, S.B.; Formal Analysis, S.B., F.B., S.N., L.B., A.L.P. and L.R.; Investigation, S.B., F.B., S.N., L.B. and A.L.P.; Resources, A.L.P, L.R. and P.F.; Writing – Original Draft Preparation, S.N., A.L.P., M.F. and P.F.; Writing – Review & Editing, S.B., F.B., S.N., L.B., A.L.P., L.R., M.F. and P.F.; Visualization, S.B., A.L.P. and L.R.; Supervision, M.F.; Project Administration, M.F. and P.F.; Funding Acquisition, P.F.
All authors have read and agreed to the published version of the manuscript.

Funding

This research was funded by the National Recovery and Resilience Plan (NRRP), Mission 4. Component 2 Investment 1.4—call for tender No. 3138 of 16 December 2021, rectified by Decree No. 3175 of 18 December 2021 of the Italian Ministry of University and Research funded by the European Union—NextGenerationEU; Award Number: Project code CN_00000033, Concession Decree No. 1034 of 17 June 2022. Adopted by the Italian Ministry of University and Research, CUP, H43C22000530001, Spoke 6, Project title “National Biodiversity Future Center—NBFC”.

Acknowledgments

We are grateful to the Project “ON Foods - Research and innovation network on food and nutrition Sustainability, Safety and Security – Working ON Foods”Project code PE0000003 ON FOODS - CUP:H43C22000820001 Spoke 6, funded by the European Union—NextGenerationEU; “ the National Recovery and Resilience Plan (NRRP).

Conflicts of Interest

The authors declare no conflicts of interest.

References

  1. Hossain, A.; Shahidi, F. Persimmon Leaves: Nutritional, Pharmaceutical, and Industrial Potential—A Review. Plants 2023, 12, 937. [Google Scholar] [CrossRef] [PubMed]
  2. Ding, Y.; Ren, K.; Dong, H.; Song, F.; Chen, J.; Guo, Y.; Liu, Y.; Tao, W.; Zhang, Y. Flavonoids from Persimmon (Diospyros Kaki L.) Leaves Inhibit Proliferation and Induce Apoptosis in PC-3 Cells by Activation of Oxidative Stress and Mitochondrial Apoptosis. Chem Biol Interact 2017, 275, 210–217. [Google Scholar] [CrossRef] [PubMed]
  3. Kim, H.-S.; Suh, J.-S.; Jang, Y.-K.; Ahn, S.-H.; Raja, G.; Kim, J.-C.; Jung, Y.; Jung, S.H.; Kim, T.-J. Anti-Cancer Potential of Persimmon (Diospyros Kaki) Leaves via the PDGFR-Rac-JNK Pathway. Sci Rep 2020, 10, 18119. [Google Scholar] [CrossRef]
  4. Lim, W.C.; Choi, J.W.; Song, N.E.; Cho, C.W.; Rhee, Y.K.; Hong, H. Do Polysaccharide Isolated from Persimmon Leaves (Diospyros Kaki Thunb.) Suppresses TGF-Β1-Induced Epithelial-to-Mesenchymal Transition in A549 Cells. Int J Biol Macromol 2020, 164, 3835–3845. [Google Scholar] [CrossRef] [PubMed]
  5. Hong, C.; Wang, X.; Xu, J.; Guo, J.; Peng, H.; Zhang, Y. A Review: Pharmacological Effect of Natural Compounds in Diospyros Kaki Leaves from the Perspective of Oxidative Stress. Molecules 2023, 29. [Google Scholar] [CrossRef] [PubMed]
  6. Ko, H.; Huh, G.; Jung, S.H.; Kwon, H.; Jeon, Y.; Park, Y.N.; Kim, Y.J. Diospyros Kaki Leaves Inhibit HGF/Met Signaling-Mediated EMT and Stemness Features in Hepatocellular Carcinoma. Food and Chemical Toxicology 2020, 142, 111475. [Google Scholar] [CrossRef]
  7. Direito, R.; Lima, A.; Rocha, J.; Ferreira, R.B.; Mota, J.; Rebelo, P.; Fernandes, A.; Pinto, R.; Alves, P.; Bronze, R.; et al. Dyospiros Kaki Phenolics Inhibit Colitis and Colon Cancer Cell Proliferation, but Not Gelatinase Activities. J Nutr Biochem 2017, 46, 100–108. [Google Scholar] [CrossRef]
  8. CHEN, L.I.; GUO, Y.; ALSAIF, G.; GAO, Y. Total Flavonoids Isolated from &lt;Em&gt;Diospyros Kaki&lt;/Em&gt; L. f. Leaves Induced Apoptosis and Oxidative Stress in Human Cancer Cells. Anticancer Res 2020, 40, 5201. [Google Scholar] [CrossRef]
  9. Keskin, C.; Ölçekçi, A.; Baran, A.; Baran, M.F.; Eftekhari, A.; Omarova, S.; Khalilov, R.; Aliyev, E.; Sufianov, A.; Beilerli, A.; et al. Green Synthesis of Silver Nanoparticles Mediated Diospyros Kaki L. (Persimmon): Determination of Chemical Composition and Evaluation of Their Antimicrobials and Anticancer Activities. Front Chem 2023, 11. [Google Scholar] [CrossRef]
  10. Park, S. Bin; Park, G.H.; Song, H.M.; Son, H.-J.; Um, Y.; Kim, H.-S.; Jeong, J.B. Anticancer Activity of Calyx of Diospyros Kaki Thunb. through Downregulation of Cyclin D1 via Inducing Proteasomal Degradation and Transcriptional Inhibition in Human Colorectal Cancer Cells. BMC Complement Altern Med 2017, 17, 1–10. [Google Scholar] [CrossRef]
  11. Ranasinghe, R.; Mathai, M.; Zulli, A. A Synopsis of Modern - Day Colorectal Cancer: Where We Stand. Biochimica et Biophysica Acta (BBA) - Reviews on Cancer 2022, 1877, 188699. [Google Scholar] [CrossRef] [PubMed]
  12. Ríos-Hoyo, A.; Monzonís, X.; Vidal, J.; Linares, J.; Montagut, C. Unveiling Acquired Resistance to Anti-EGFR Therapies in Colorectal Cancer: A Long and Winding Road. Front Pharmacol 2024, 15. [Google Scholar] [CrossRef] [PubMed]
  13. Dekker, E.; Tanis, P.J.; Vleugels, J.L.A.; Kasi, P.M.; Wallace, M.B. Colorectal Cancer. The Lancet 2019, 394, 1467–1480. [Google Scholar] [CrossRef] [PubMed]
  14. Thanikachalam, K.; Khan, G. Colorectal Cancer and Nutrition. Nutrients 2019, 11. [Google Scholar] [CrossRef]
  15. McCullough, M.L.; Zoltick, E.S.; Weinstein, S.J.; Fedirko, V.; Wang, M.; Cook, N.R.; Eliassen, A.H.; Zeleniuch-Jacquotte, A.; Agnoli, C.; Albanes, D.; et al. Circulating Vitamin D and Colorectal Cancer Risk: An International Pooling Project of 17 Cohorts. J Natl Cancer Inst 2019, 111, 158–169. [Google Scholar] [CrossRef]
  16. Masci, D.; Puxeddu, M.; Silvestri, R.; La Regina, G. Metabolic Rewiring in Cancer: Small Molecule Inhibitors in Colorectal Cancer Therapy. Molecules 2024, 29. [Google Scholar] [CrossRef]
  17. Smith, P.K.; Krohn, R.I.; Hermanson, G.T.; Mallia, A.K.; Gartner, F.H.; Provenzano, M.D.; Fujimoto, E.K.; Goeke, N.M.; Olson, B.J.; Klenk, D.C. Measurement of Protein Using Bicinchoninic Acid. Anal Biochem 1985, 150, 76–85. [Google Scholar] [CrossRef]
  18. Laemmli, U.K. Cleavage of Structural Proteins during the Assembly of the Head of Bacteriophage T4. Nature 1970, 227, 680–685. [Google Scholar] [CrossRef]
  19. Bradford, M.M. A Rapid and Sensitive Method for the Quantitation of Microgram Quantities of Protein Utilizing the Principle of Protein-Dye Binding. Anal Biochem. 1976, 72, 248–254. [Google Scholar] [CrossRef]
  20. Bovio, F.; Perciballi, E.; Melchioretto, P.; Ferrari, D.; Forcella, M.; Fusi, P.; Urani, C. Morphological and Metabolic Changes in Microglia Exposed to Cadmium: Cues on Neurotoxic Mechanisms. Environ Res 2024, 240, 117470. [Google Scholar] [CrossRef] [PubMed]
  21. Korchak, H.M.; Rich, A.M.; Wilkenfeld, C.; Rutherford, L.E.; Weissmann, G. A Carbocyanine Dye, DiOC6(3), Acts as a Mitochondrial Probe in Human Neutrophils. Biochem Biophys Res Commun 1982, 108, 1495–1501. [Google Scholar] [CrossRef] [PubMed]
  22. Seligmann, B.E.; Gallin, J.I. Use of Lipophilic Probes of Membrane Potential to Assess Human Neutrophil Activation. Abnormality in Chronic Granulomatous Disease. J Clin Invest 1980, 66, 493–503. [Google Scholar] [CrossRef] [PubMed]
  23. Cerrato, A.; Cannazza, G.; Capriotti, A.L.; Citti, C.; La Barbera, G.; Laganà, A.; Montone, C.M.; Piovesana, S.; Cavaliere, C. A New Software-Assisted Analytical Workflow Based on High-Resolution Mass Spectrometry for the Systematic Study of Phenolic Compounds in Complex Matrices. Talanta 2020, 209, 120573. [Google Scholar] [CrossRef] [PubMed]
  24. Piccinelli, A.L.; Pagano, I.; Esposito, T.; Mencherini, T.; Porta, A.; Petrone, A.M.; Gazzerro, P.; Picerno, P.; Sansone, F.; Rastrelli, L.; et al. HRMS Profile of a Hazelnut Skin Proanthocyanidin-Rich Fraction with Antioxidant and Anti- Candida Albicans Activities. J Agric Food Chem 2016, 64, 585–595. [Google Scholar] [CrossRef]
  25. Zhao, J.; Chen, Z.; Li, L.; Sun, B. UHPLC-MS/MS Analysis and Protective Effects on Neurodegenerative Diseases of Phenolic Compounds in Different Parts of Diospyros Kaki L. Cv. Mopan. Food Research International 2024, 184, 114251. [Google Scholar] [CrossRef] [PubMed]
  26. Sugiura, R.; Satoh, R.; Takasaki, T. ERK: A Double-Edged Sword in Cancer. ERK-Dependent Apoptosis as a Potential Therapeutic Strategy for Cancer. Cells 2021, 10. [Google Scholar] [CrossRef] [PubMed]
  27. Palmioli, A.; Forcella, M.; Oldani, M.; Angotti, I.; Sacco, G.; Fusi, P.; Airoldi, C. Adjuvant Effect of Cinnamon Polyphenolic Components in Colorectal Cancer Cell Lines. Int J Mol Sci 2023, 24. [Google Scholar] [CrossRef] [PubMed]
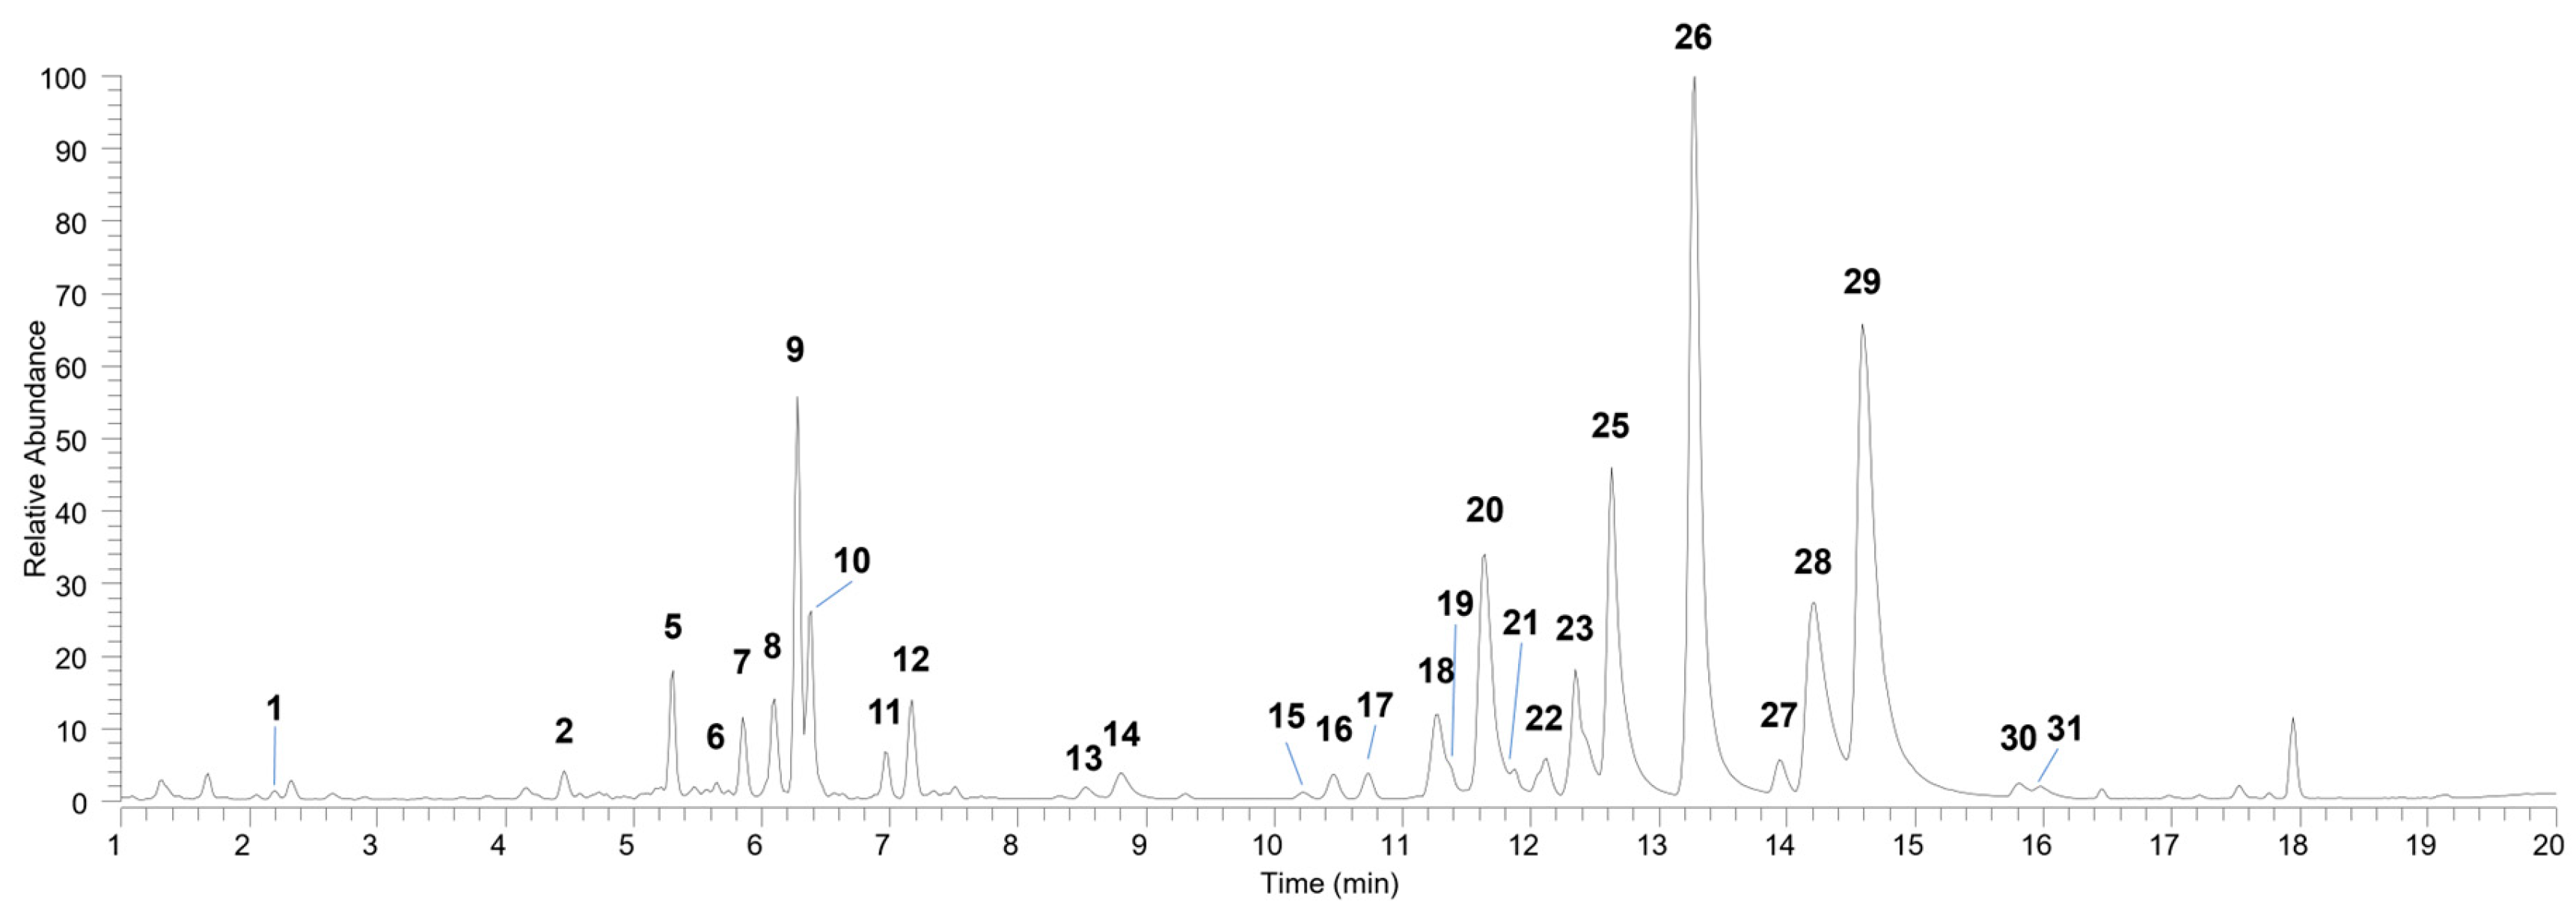
Figure 1. UHPLC-(―)-HRMS profiles of Diospyros kaki extract (full range MS, m/z 50–1500).
Preprints 120854 g001
Figure 2. MTT viability assay on the CCD 841 healthy colon mucosa cell line and on the E705 and SW480 colorectal cancer cell lines. Cells were treated with D. kaki extract at concentrations between 0 and 400 µg/mL for 24 hours. Average values and standard error from three biological replicates are shown. Statistical significance: ** p < 0.01, **** p < 0.0001.
Preprints 120854 g002
Figure 3. Representative Western blot analysis performed on E705 (A) and SW480 (C) cell lines untreated and treated for 24 hours with 200 and 400 µg/mL of D. kaki extract. Protein extracts were separated on 12 % acrylamide/bis-acrylamide SDS-PAGE and the nitrocellulose membranes were probed with anti-Bcl-2, anti-caspase-3, anti-P-ERK and anti-ERK antibodies. Vinculin was used as a loading control. Quantifications of the immunoblots are represented as fold respect to the untreated condition. Data are shown as mean ± SE from three biological replicates (B, D), except for Bcl-2 in the E705 line (two replicates). Statistical significance: * p < 0.05, ** p < 0.01, *** p < 0.001.
Preprints 120854 g003
Figure 4. Analysis of reactive oxygen species following incubation with 5 µM H2DCFDA on E705 (A) and SW480 (D) cell lines untreated and treated with 200 and 400 µg/mL of D. kaki extract. Fluorescence is indicated as fold compared to the untreated control. Total glutathione level of the E705 (B) and SW480 (E) cell lines is expressed as fold compared to the untreated condition. GSSG and GSH contents expressed as a percentage of total glutathione are presented in panel C and F for the E705 and SW480 cell lines, respectively. Average values and standard error from three biological replicates are shown. Statistical significance: * p < 0.05, ** p < 0.01, *** p < 0.001, **** p < 0.0001.
Preprints 120854 g004
Figure 5. OCR and ECAR profiles following Cell Mito Stress Test on the E705 cell line untreated and treated for 24 hours with 200 and 400 µg/mL D. kaki extract (A, B). Dotted lines indicate the time of addition of 1 µM oligomycin, 2 µM FCCP and 1 µM rotenone and antimycin A. Basal respiration, maximal respiration, ATP production, spare respiratory capacity (C), and coupling efficiency (D) are reported. Analysis of mitochondrial Δψ after incubation with 40 nm DiOC6 (E). Fluorescence is represented as fold compared to the untreated condition. Average values and standard error from three biological replicates are shown. Statistical significance: *** p < 0.001, **** p < 0.0001.
Preprints 120854 g005
Figure 6. OCR and ECAR profiles following Cell Mito Stress Test on the SW480 cell line untreated and treated for 24 hours with 200 and 400 µg/mL D. kaki extract (A, B). Dotted lines indicate the time of addition of 1 µM oligomycin, 2 µM FCCP and 1 µM rotenone and antimycin A. Basal respiration, maximal respiration, ATP production, spare respiratory capacity (C), and coupling efficiency (D) are reported. Analysis of mitochondrial Δψ after incubation with 40 nm DiOC6 (E). Fluorescence is represented as fold compared to the untreated condition. Average values and standard error from three biological replicates are shown. Statistical significance: **** p < 0.0001.
Preprints 120854 g006
Figure 7. ATP Rate Assay. Total, glycolytic and mitochondrial ATP production rate in E705 (A) and SW480 (C) cell lines untreated and treated for 24 hours with 200 and 400 µg/mL of D. kaki extract. The ratio between glycolytic and mitochondrial ATP production in E705 (B) and SW480 (D) cell lines is also reported. Average values and standard error from three biological replicates are shown. Statistical significance: *** p < 0.001, **** p < 0.0001.
Preprints 120854 g007
Table 1. UHPLC-(―)-HRMS data of compounds detected in D. kaki leaf extract.
N Compound Molecular Formula Rt
(min)
[M-H]-
(m/z)
Error
(ppm)
Diagnostic product ions
(m/z)
MSI
levela
1 (epi)Gallocatechin-(epi)gallocatechin C30H26O14 2.2 609.1248 -0.2 483.0952, 441.0816, 423.0715, 305.0663, 177.0183, 125.0231 2
2 Gallocatechin C15H14O7 4.5 305.0663 -1.0 167.0339, 165.0182, 137.0232, 125.0231 1
3 (epi)Gallocatechin-(epi)catechin C30H26O13 4.7 593.1296 -0.7 467.0996, 441.0825, 425.0873, 407.0765, 303.0512, 289.0715 2
4 (epi)Catechin-(epi)gallocatechin C30H26O13 5.0 593.1294 -1.2 467.0985, 441.0829, 423.0714, 305.0663, 289.0714, 287.0559 2
5 Hydroxyroseoside C19H30O9 5.3 447.1867 b -1.3 371.1716, 239.1287 3
6 Procyanidin B1 C30H26O12 5.6 577.1342 -1.2 451.1023, 425.0874, 407.0766, 299.0557, 289.0715, 287.0557 1
7 Catechin C15H14O6 5.9 289.0713 -1.6 151.0389, 149.0233, 137.0232, 125.0231 1
8 Coumaroyl-hexoside-pentoside C20H26O12 6.1 457.1347 -1.0 325.0926, 1630.390, 119.0490 2
9 Roseoside C19H30O8 6.3 431.1914 b -2.0 223.1321, 205.0498 2
10 Roseoside pentoside C24H38O12 6.4 563.2335 b -2.1 3
11 Iridoid glycoside C19H32O8 7.0 433.2077 b -0.3 4
12 Iridoid glycoside C19H28O10 7.2 415.1606 -0.9 4
13 Myricetin 3-O-hexoside C21H20O13 8.5 479.0829 -0.3 317.0283, 316.0220, 287.0195, 271.0246, 178.9976, 151.0026 2
14 Myricetin 3-O-hexoside C21H20O13 8.8 479.0829 -0.3 317.0280, 316.0220, 287.0196, 271.0246, 178.9975, 151.0026 2
15 Quercetin-3-O-hexoside-deoxyhexoside C27H30O16 10.2 609.1464 0.7 301.0318, 300.0271, 271.0246, 255.0296, 178.9969, 151.0022 2
16 Iridoid glycoside C24H42O11 10.5 551.2708 b -0.2 4
17 Iridoid glycoside C24H42O11 10.7 551.2705 b -0.6 4
18 Quercetin-3-O-hexoside C21H20O12 11.3 463.0875 -1.3 301.0343, 300.0272, 271.0245, 255.0295, 178.9974, 151.0025 2
19 Iridoid glycoside C24H42O11 11.4 551.2700 b -1.8 2
20 Quercetin-3-O-glucoside (isoquercitrin) C21H20O12 11.6 463.0874 -1.7 301.0342, 300.0272, 271.0245, 255.0294, 178.9973, 151.0026 1
21 Kaempferol-3-O-hexoside-deoxyhexoside C27H30O15 11.9 593.1506 -0.8 285.0378, 284.0322, 255.0294, 227.0343, 151.0022 2
22 Laricitrin 3-O-hexoside C22H22O13 12.1 493.0985 -0.5 331.0461, 330.0375, 316.01930, 315.0144, 287.0195, 178.9975, 151.0022 2
23 Quercetin-7(4’)-O-galloylhexoside C28H24O16 12.4 615.0981 -1.6 313.0559, 301.0349, 178.9975, 169.0129, 151.0025 2
24 Quercetin-7(4’)-O-galloylhexoside C28H24O16 12.7 615.0983 -1.6 463.0864, 313.0566, 301.0351, 178.9977, 169.0127, 151.0026 2
25 Kaempferol-3-O-hexoside C21H20O11 12.6 447.0924 -2.1 285.0392, 284.0324, 255.0296, 227.0344, 151.0025 2
26 Kaempferol-3-O-glucoside (Astragalin) C21H20O11 13.3 447.0923 -2.2 285.0394, 284.0323, 255.0295, 227.0343, 151.0026 1
27 Kaempferol-3-O-pentose C20H18O10 13.9 417.0825 -0.4 285.0387, 284.0323, 255.0295, 227.0343, 151.0023 2
28 Kaempferol 7(4’)-O-galloylhexoside C28H24O15 14.2 599.1032 -1.9 313.0563, 285.0402, 257.0455, 229.0498, 169.0132, 151.0025 2
29 Kaempferol 7(4’)- O-galloylhexoside C28H24O15 14.6 599.1033 -1.7 313.0562, 285.0402, 257.0452, 229.0502, 169.0133, 151.0025 2
30 Kaempferol 7(4’)-O-galloylpentoside C27H22O14 15.8 569.0937 0.2 285.0402, 283.0457, 257.0452, 229.0500, 169.0130, 151.0025 2
31 Kaempferol 7(4’)-O-galloylpentoside C27H22O14 16.0 569.0939 0.5 285.0402, 283.0458, 257.0453, 229.0500, 169.0129, 151.0026 2
a according to metabolomics standards initiative (MSI); b corresponding to formic acid adduct [M+FA-H] -.
Disclaimer/Publisher’s Note: The statements, opinions and data contained in all publications are solely those of the individual author(s) and contributor(s) and not of MDPI and/or the editor(s). MDPI and/or the editor(s) disclaim responsibility for any injury to people or property resulting from any ideas, methods, instructions or products referred to in the content.
Copyright: This open access article is published under a Creative Commons CC BY 4.0 license, which permit the free download, distribution, and reuse, provided that the author and preprint are cited in any reuse.
Alerts
Prerpints.org logo

Preprints.org is a free preprint server supported by MDPI in Basel, Switzerland.

Subscribe

© 2025 MDPI (Basel, Switzerland) unless otherwise stated