1. Introduction
Immunoassays, analytical methods using antibodies, have become increasingly popular in diagnostics and clinical research to detect various biomarkers, antigens, and antibodies with high sensitivity and specificity [
1,
2,
3]. However, conventional immunoassay methods such as enzyme-linked immunosorbent assay (ELISA) are relatively time consuming. Although faster and more convenient methods such as immunochromatography have been widely used, they are generally not very quantitative and require more than several minutes to complete the measurement with sufficient sensitivity. To overcome such problems, homogeneous immunosensors based on fluorescence or bioluminescence using antibody engineering have been developed [
4].
As a leading example of fluorescent immunosensors, Quenchbody (Q-body) has been developed [
5,
6,
7,
8]. Q-body is a fluorolabeled antibody fragment, single-chain variable region (scFv) or antigen-binding fragment (Fab), and its fluorescence intensity increases when its antigen is added. In the beginning of Q-body development, carboxytetramethylrhodamine (TAMRA)-labeled scFv was prepared using a position-specific protein labeling methodology based on fluorolabeled aminoacyl tRNA and a cell-free translation system [
5]. However, the stability and affinity of scFv, compared with its parental full-size antibody or fragment of antigen binding (Fab), was of controversial concern. To explore the practical utility of Q-body, Fab-based Q-bodies (also called “Ultra-Quenchbodies (UQ-bodies)”) were developed [
6]. Fab fragments were fluorolabeled at either one or two of the N-terminal regions, using a cell-free translation-mediated position-specific protein labeling system. In addition, a Fab-based Q-body was successfully prepared using a combination of recombinant protein expression in
Escherichia coli and thiol-based fluorescence labeling [
6].
With the homogeneous assay using Q-body, a positive fluorescent signal can be readily obtained within a few minutes depending on the antigen concentration in a sample. In contrast to ELISA, time-consuming procedures such as washing and enzyme reaction steps are unnecessary for the Q-body assay. Furthermore, not only proteins and peptides, but also small molecules with a molecular weight of less than ~1000, such as morphine and estradiol, can be specifically detected with similar sensitivity in competitive assays [
5,
9,
10,
11].
In regard to the action mechanism of Q-body, a model based on conformational change upon antigen binding has been proposed [
5,
7]. In the absence of antigen, a fluorescent dye such as 5(6)-carboxytetramethylrhodamine (TAMRA), attached to the N-terminus of scFv or Fab via a short linker, transiently interacts with the tryptophan (Trp) residues highly conserved in the antigen binding region. The mutagenesis of the Trp residues resulted in attenuation of fluorescence quenching, suggesting that the Trp residues are important for quenching process [
5], probably due to photoinduced electron transfer (PET) [
12,
13]. In the presence of antigen, the interaction between V
H and V
L becomes stronger [
14] and the dye competitively moves out of the variable region (Fv); therefore, the quenching effect is reduced depending on the antigen concentration, resulting in the increased fluorescence. In addition, the mechanism of Q-body was supported by analysis of the dynamics of dye movement in Q-body using ELISA and fluorescence polarization assay [
15]. However, detailed structural information is necessary for further understanding.
Human osteocalcin (bone Gla protein, BGP) is a useful biomarker for bone formation and bone related disease [
16]. An anti-osteocalcin C-terminal peptide antibody KTM219 [
14] is one of antibody Fab fragments applicable to the Q-body immunoassay [
6]. KTM219 Fab with one or two Cys-containing peptide tag(s) at the N-terminal region(s) was expressed in
E. coli. After protein purification, KTM219 Fab was labeled with a thiol-reactive fluorescent dye such as TAMRA-C5-maleimide. A significant antigen-dependent fluorescence increase was observed for single TAMRA-labeled Q-body (labeled at N-terminus of V
H), which showed a 7.0-fold increase with a low EC
50 of 1.9 × 10
−8 M [
6]. In contrast, double TAMRA-labeled Q-body (labeled at N-termini of V
H and V
L) showed a relatively modest antigen-dependent response of up to 2.4-fold. Hereafter, we focus on the single TAMRA-labeled Fab-based Q-body (KTM219 Fab fluorolabeled at N-terminus of V
H) to discuss the mechanism of Q-body in this study. To analyze the detailed structural mechanism of Q-body and utilize it for further antibody engineering, here we report the crystal structures of KTM219 Fab and discuss the structural basis for Q-body.
2. Results
2.1. Crystal Structure of KTM219 Fab
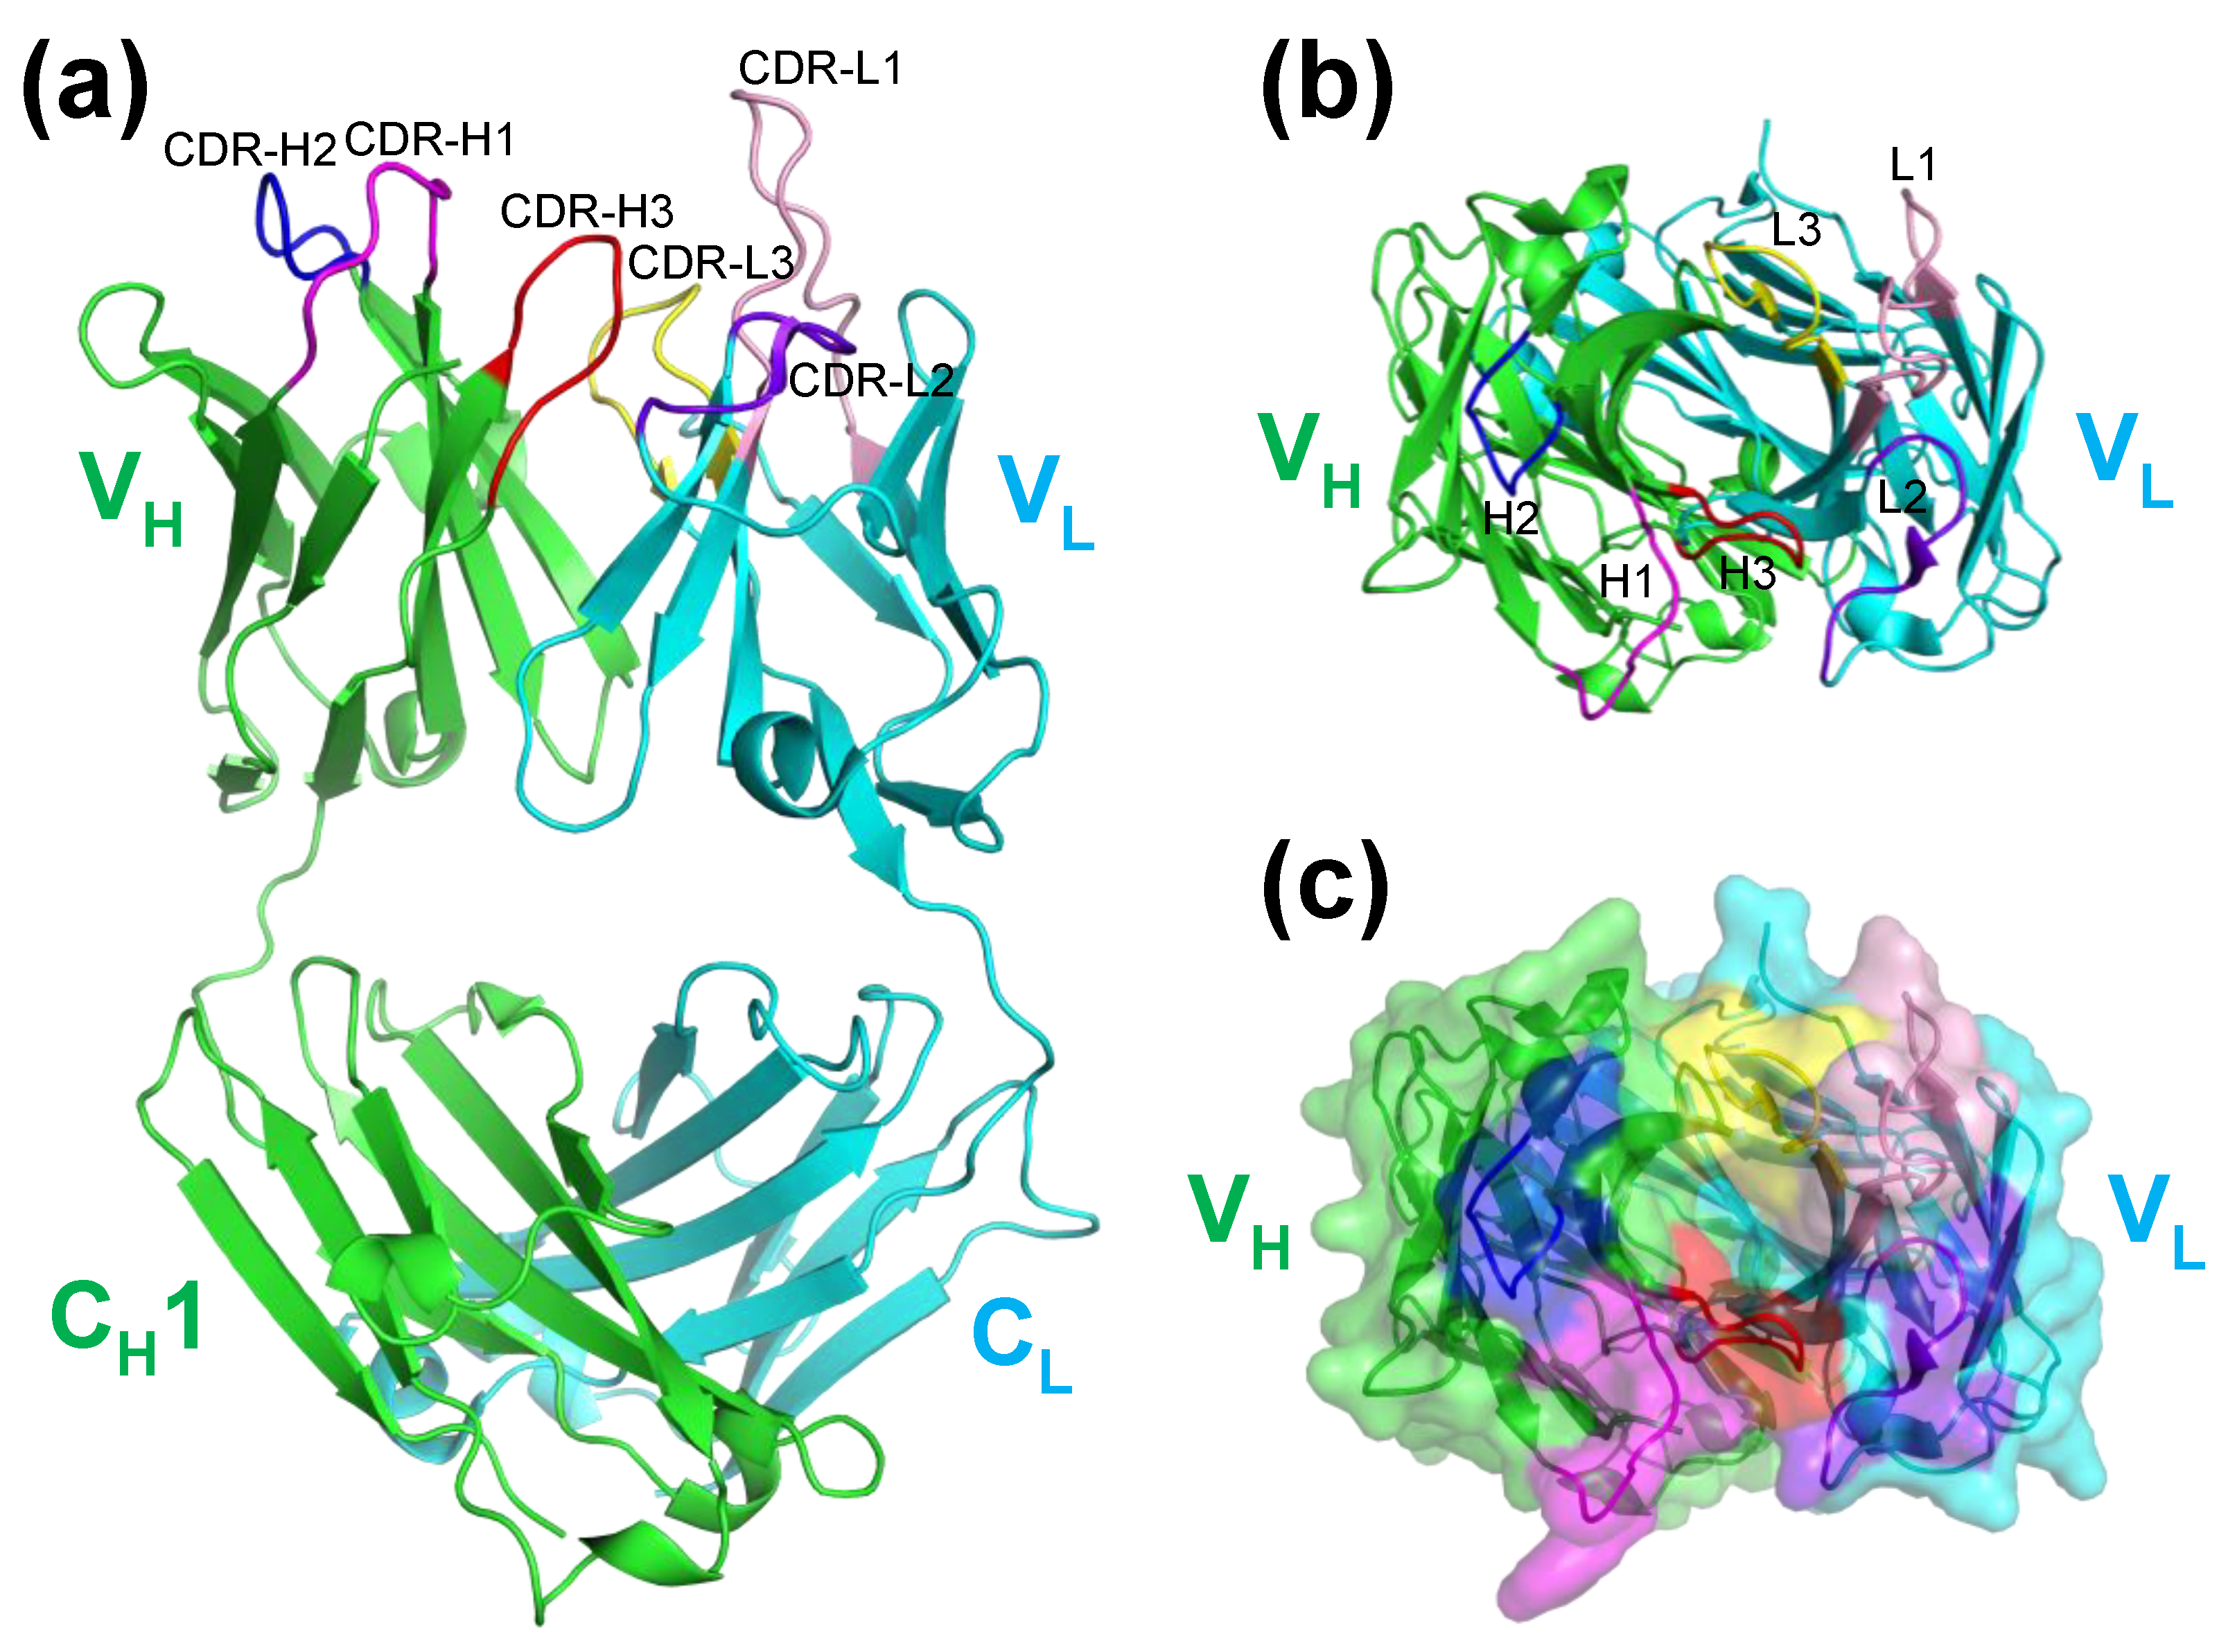
First, we solved the crystal structure of the Fab antibody fragment of anti-osteocalcin antibody KTM219. The KTM219 Fab crystal belonged to the orthorhombic space group
P2
122
1, with unit cell constants of
a = 64.80 Å,
b = 71.47 Å,
c = 96.88 Å, and contained one Fab antibody fragment per asymmetric unit. The structure was solved by the molecular replacement method with a model structure of anti-emmprin antibody 4A5 Fab (PDB ID: 4KUZ) [
17]. The structure was refined to 1.90 Å resolution (
Rwork = 18.1%,
Rfree = 22.4%). All refinement statistics are shown in
Table S1. The crystal structure of KTM219 Fab (PDB ID: 5X5X) comprises a light chain (V
L–C
L) and a heavy chain (V
H–C
H1) with typical immunoglobulin folds with complementary determining regions (CDRs) (
Figure 1a). A deep pocket is formed between V
H and V
L, and it can provide a putative binding site for the antigen (
Figure 1b).
2.2. Crystal Structure of Antibody-Antigen Complex of KTM219 Fab
To investigate the details of the binding site, we crystalized the antibody-antigen complex of KTM219 Fab and osteocalcin C-terminal 7 residues peptide BGP-C7 (RRFYGPV). The crystal of the complex belonged to the orthorhombic space group
P2
12
12
1, with unit cell constants of
a = 43.88 Å,
b = 67.49 Å,
c = 138.66 Å, and contained one complex of the KTM219 Fab antibody and the BGP-C7 antigen per asymmetric unit. The structure was refined to 2.30 Å resolution (
Rwork = 19.8%,
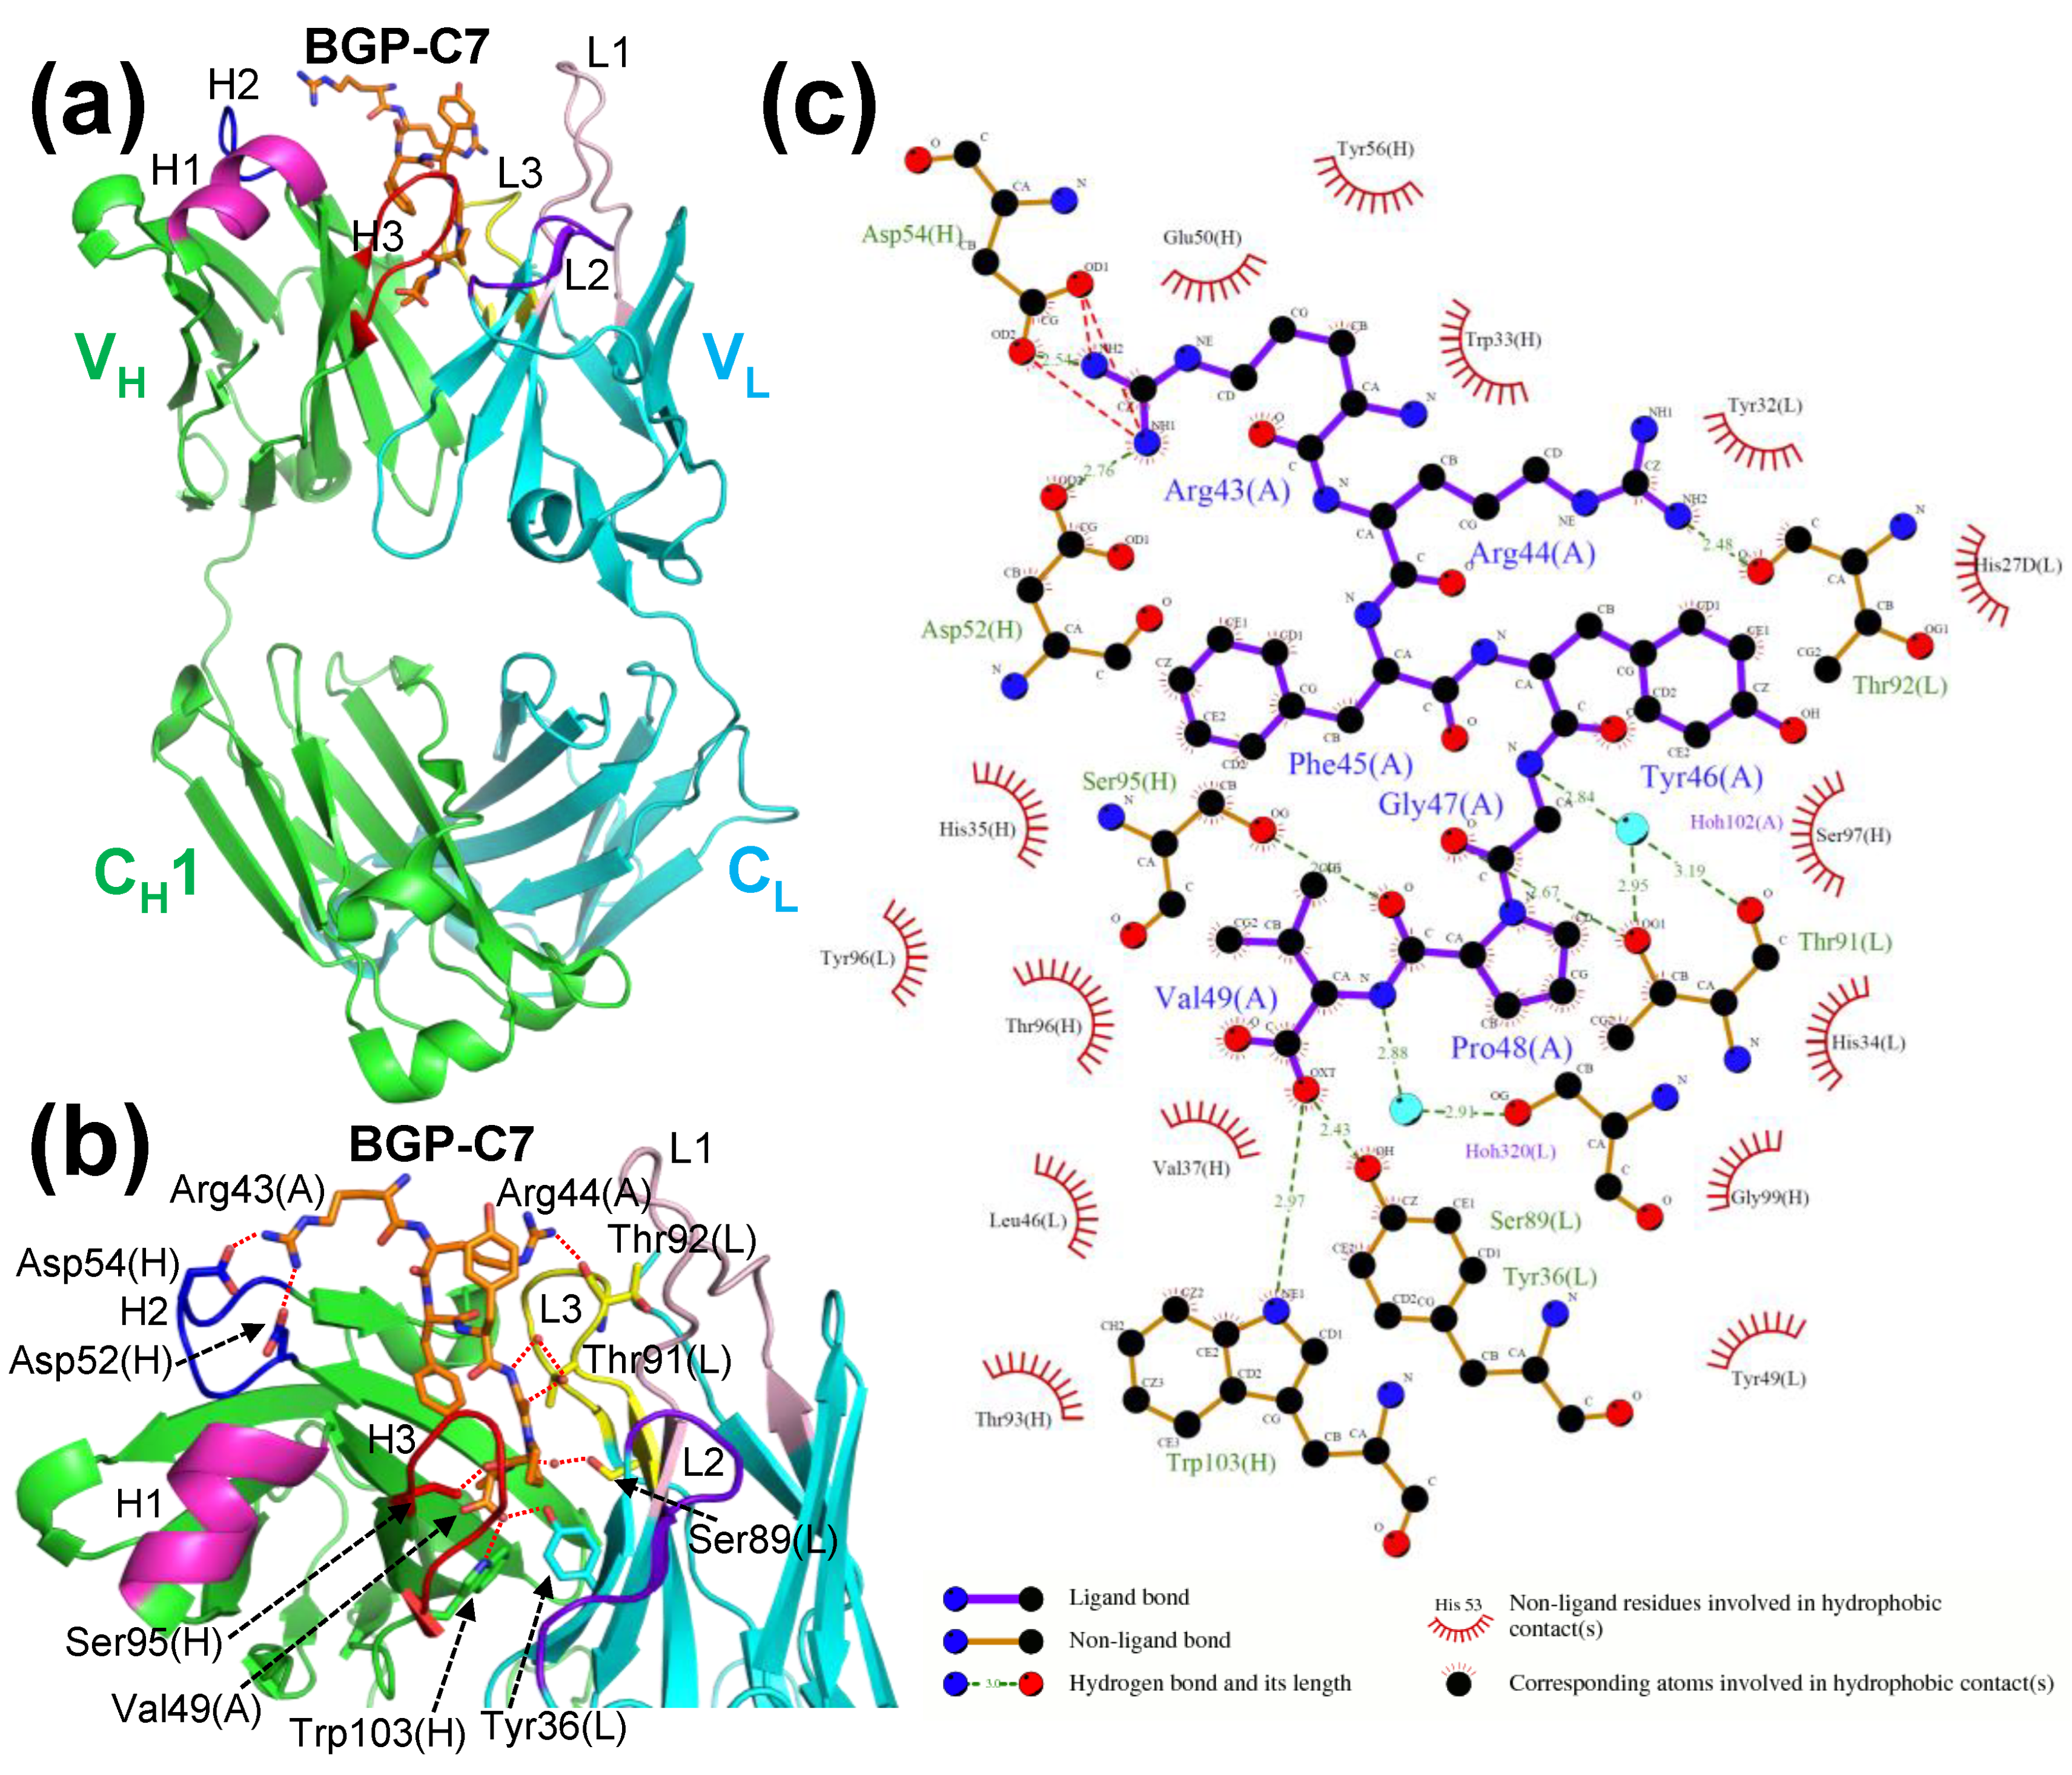
Rfree = 24.4%). The crystal structure (PDB ID: 8XS1) clearly shows the binding site of the antigen BGP-C7 in detail (
Figure 2). The BGP-C7 peptide binds to the hydrophobic pocket between V
H and V
L. The C-terminal residue Val49(A) of the antigen peptide is buried into the deep hydrophobic pocket. The details of the interactions of antibody and antigen are shown in
Figure 2c depicted using LigPlot
+ [
18]. The antigen peptide residues are recognized by several hydrogen bonds, many hydrophobic interactions, and a few salt bridges. Especially, the terminal carboxy group of antigen Val49(A) is recognized by hydrogen bonds from the antibody residues Trp103(H) and Tyr36(L) (according to Kabat numbering scheme [
19]). Besides, two waters mediate the interactions between amide protons of the antigen and Ser89(L) and Thr91(L) in CDR-L3 of the antibody. Moreover, the salt bridges between the antigen residue Arg43(A) and the antibody residues Asp52(H) and Asp54(H) in CDR-H2 contribute to antibody-antigen recognition. These findings are fully consistent with the experimental results of the binding assay by open sandwich ELISA [
14]. C-terminal 10 residues peptide BGP-C10 (EAYRRFYGPV), 8 residues peptide BGP-C8 (YRRFYGPV), and 7 residues peptide BGP-C7 (RRFYGPV) showed full binding activities. In contrast, 9 residues peptide BGP-C10dV (C10 without C-terminal Val, EAYRRFYGP) and C-terminal 5 residues peptide BGP-C5 (FYGPV) showed negligible binding, and C-terminal 6 residues peptide BGP-C6 (RFYGPV) showed much less binding than BGP-C7.
2.3. Structure of KTM219 Fab Crystal Grown in the Presence of a Fluorescent Dye TAMRA
To elucidate mechanism of Q-body, we tried to crystalize Cys-tagged KTM219 Fab (Cys-containing peptide tag [MSKQIEVNYCSNETG] was added to N-terminus of V
H) [
6] chemically modified with TAMRA-C5-maleimide (Biotium, Hayward, CA, USA) using thiol target labeling. However, we did not obtain crystals suitable for structural analysis.
Therefore, we grew the KTM219 Fab crystal in the presence of free TAMRA fluorophore. The crystal belongs to the orthorhombic space group
P2
122
1, with unit cell constants of
a = 66.19 Å,
b = 69.52 Å,
c = 96.65 Å, and contains one Fab antibody fragment per asymmetric unit. The structure (PDB ID: 8XS2) was refined to 2.14 Å resolution (
Rwork = 20.2%,
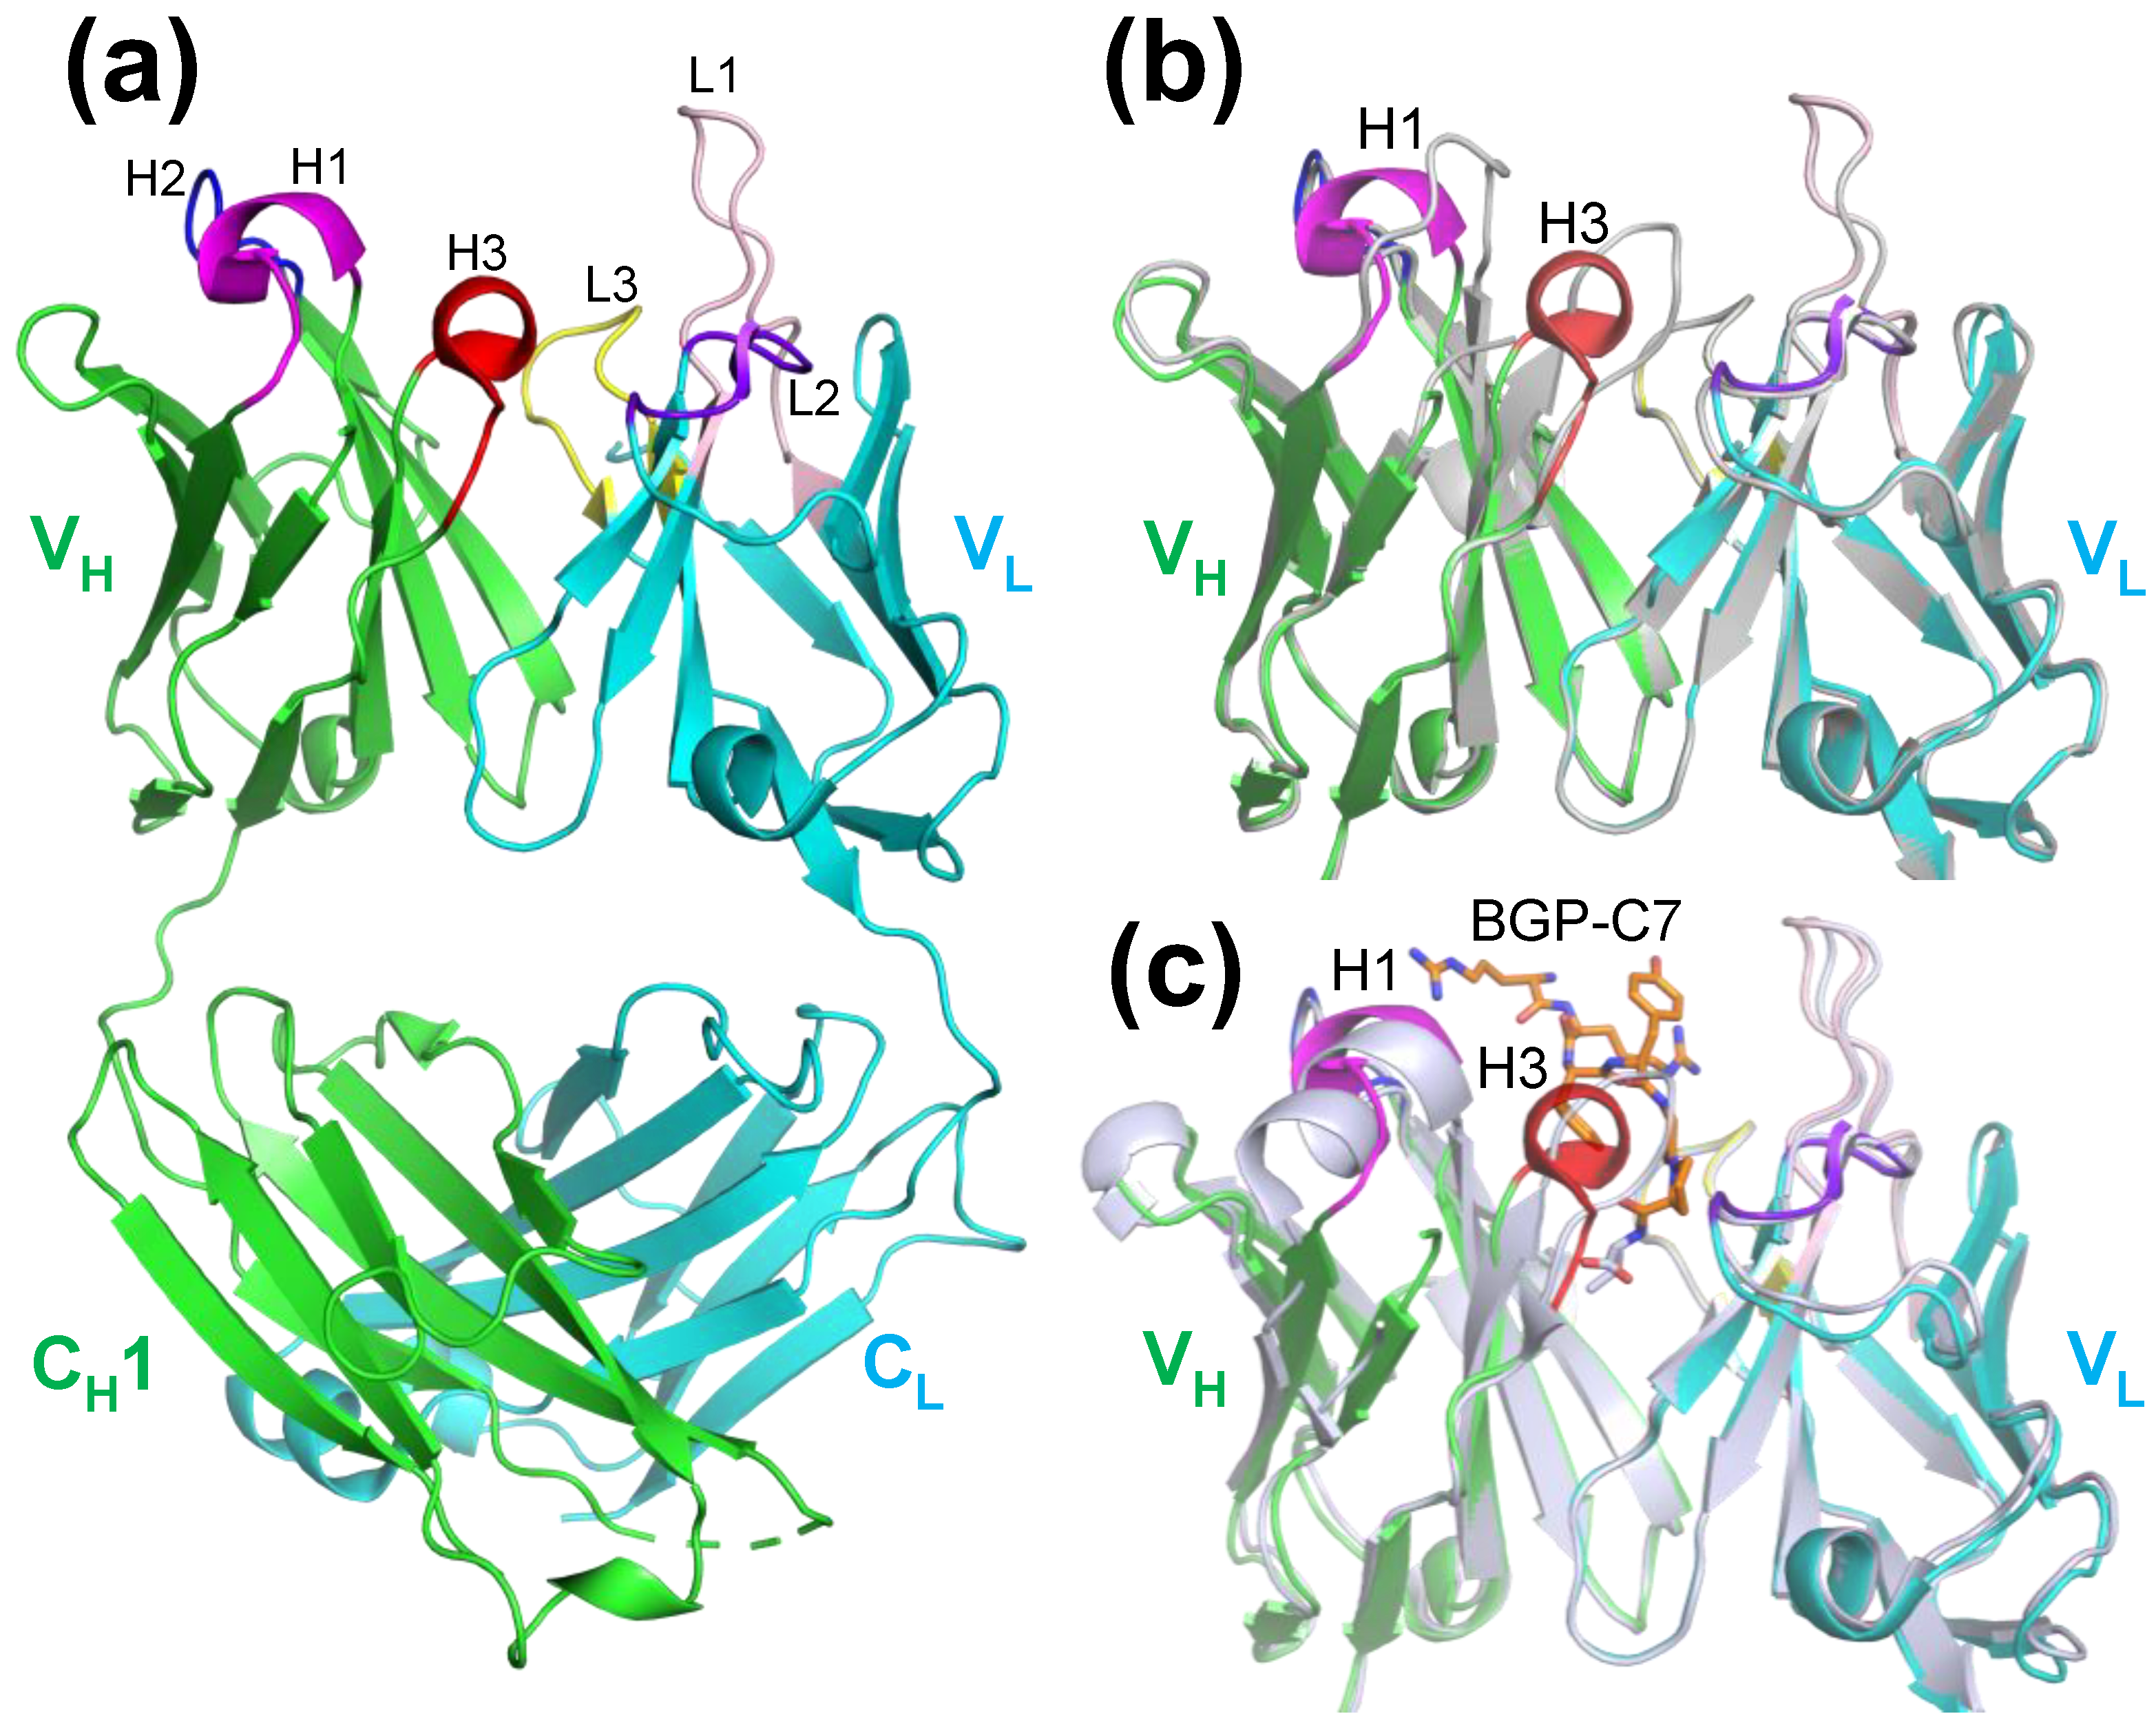
Rfree = 24.4%). Although the overall structure is almost the same with/without the addition of TAMRA, the CDR-H1 and CDR-H3 loops of V
H near the binding pocket have different conformations (
Figure 3b). However, we did not find the electron density assigned to TAMRA. These suggest that TAMRA does not tightly bind to the specific site of antibody but weak interactions with TAMRA may affect the structural conformations of the CDR loops around the antigen binding pocket. In addition, a comparison of the structure of KTM219 Fab with the addition of TAMRA and the structure complexed with the antigen shows that the CDR-H3 loop has different conformations although the overall structure is almost identical (
Figure 3c). The CDR-H1 structure with the addition of TAMRA has a partial helix, which partly resembles a helical conformation of CDR-H1 in the antibody-antigen complex.
2.4. Docking Simulations of a Fluorescent Dye TAMRA to KTM219 Fab
To predict the Q-body structure complexed with a fluorescent dye TAMRA, we performed docking simulations of TAMRA to the KTM219 Fab structure of the crystal grown in the presence of TAMRA (PDB ID: 8XS2).
First, we used SwissDock [
20] based on EADock DSS [
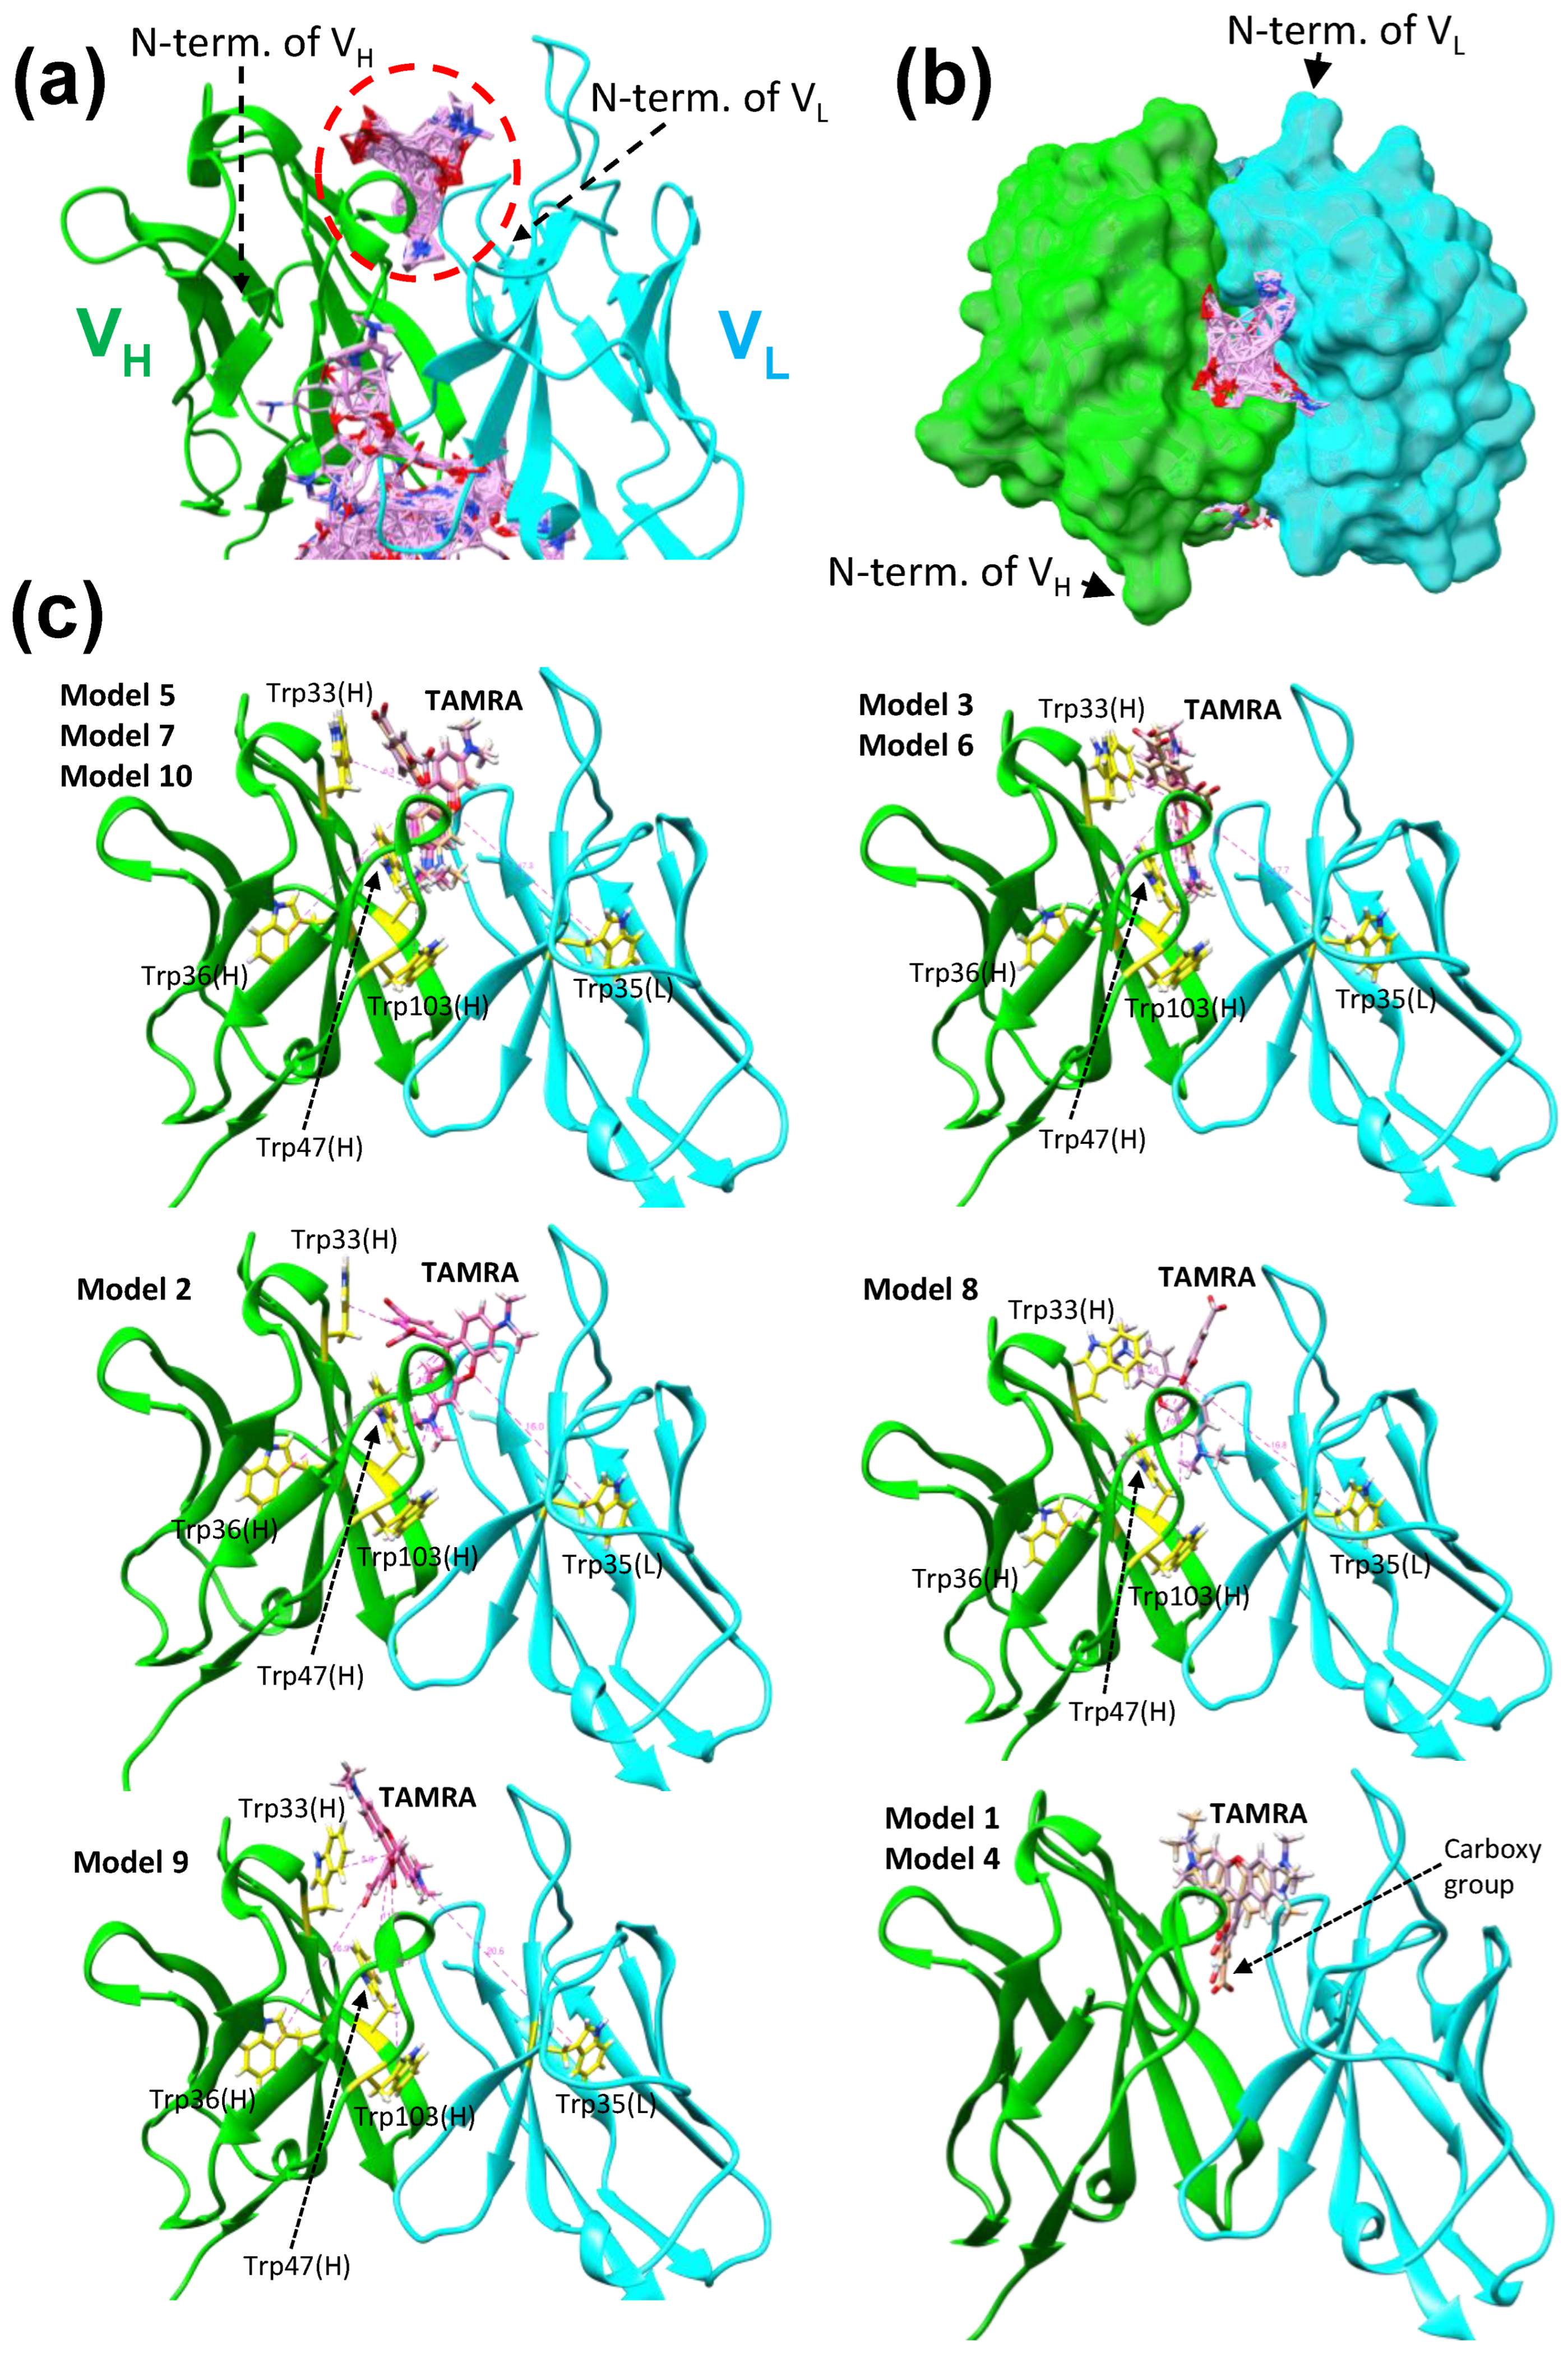
21] to search for possible interaction sites of TAMRA to the KTM219 Fab structure. The whole target protein structure of the KTM219 Fab was considered to search for possible binding pockets during the docking. Several clusters of predicted docking poses (256 poses in total) are shown on the protein structure (
Figure S1), suggesting several candidates for interaction sites. In particular, 24 poses formed dense clusters in the antigen binding pocket (
Figure 4ab). Hereafter, we focused on the antigen binding pocket near the N-terminus of V
H as a major interaction site because we focused on the single TAMRA-labeled Q-body (KTM219 Fab fluorolabeled at the N-terminus of V
H) in this study.
To predict detailed conformations of TAMRA bound to the antigen binding pocket, we performed docking simulation using RosettaLigand in Rosetta Online Server that Includes Everyone (ROSIE) [
22]. The central part of the antigen binding pocket was set as an initial position of TAMRA. From the results (200 models) of RosettaLigand docking simulations (
Figure S2), the top 10 models with lower interface scores (i.e., better docking models) were selected. The two models (Model 1 and Model 4) with unrealistic conformations were omitted because their carboxy group, which should be linked to a maleimide linker, buried in the deep pocket could not lead to the N-terminus of V
H with a maleimide linker due to the limited space (
Figure 4c). The eight models with realistic conformations were selected and further divided into five classes based on the orientations of TAMRA (
Figure 4c). These docking simulation results suggest that TAMRA can bind to the antigen binding pocket of KTM219 Fab with several conformations. Interaction residues with TAMRA are shown in
Figure S3a depicted using LigPlot
+ in three typical models (Model 5, Model 3, and Model 2). Several hydrogen bonds and hydrophobic interactions were predicted to contribute to the binding between antibody and TAMRA. In addition, tryptophan residues, Trp33(H), Trp36(H), Trp47(H), Trp103(H), and Trp35(L), are located around the predicted binding sites of TAMRA (
Figure 4c) in distances of ~5–20 Å (
Table S2). Moreover, the binding sites of TAMRA and the antigen are significantly overlapped (
Figure S3b). These simulation results and the crystal structure of antibody-antigen complex suggest the molecular competition between the fluorescent dye and the antigen to occupy the shared binding site.
3. Discussion
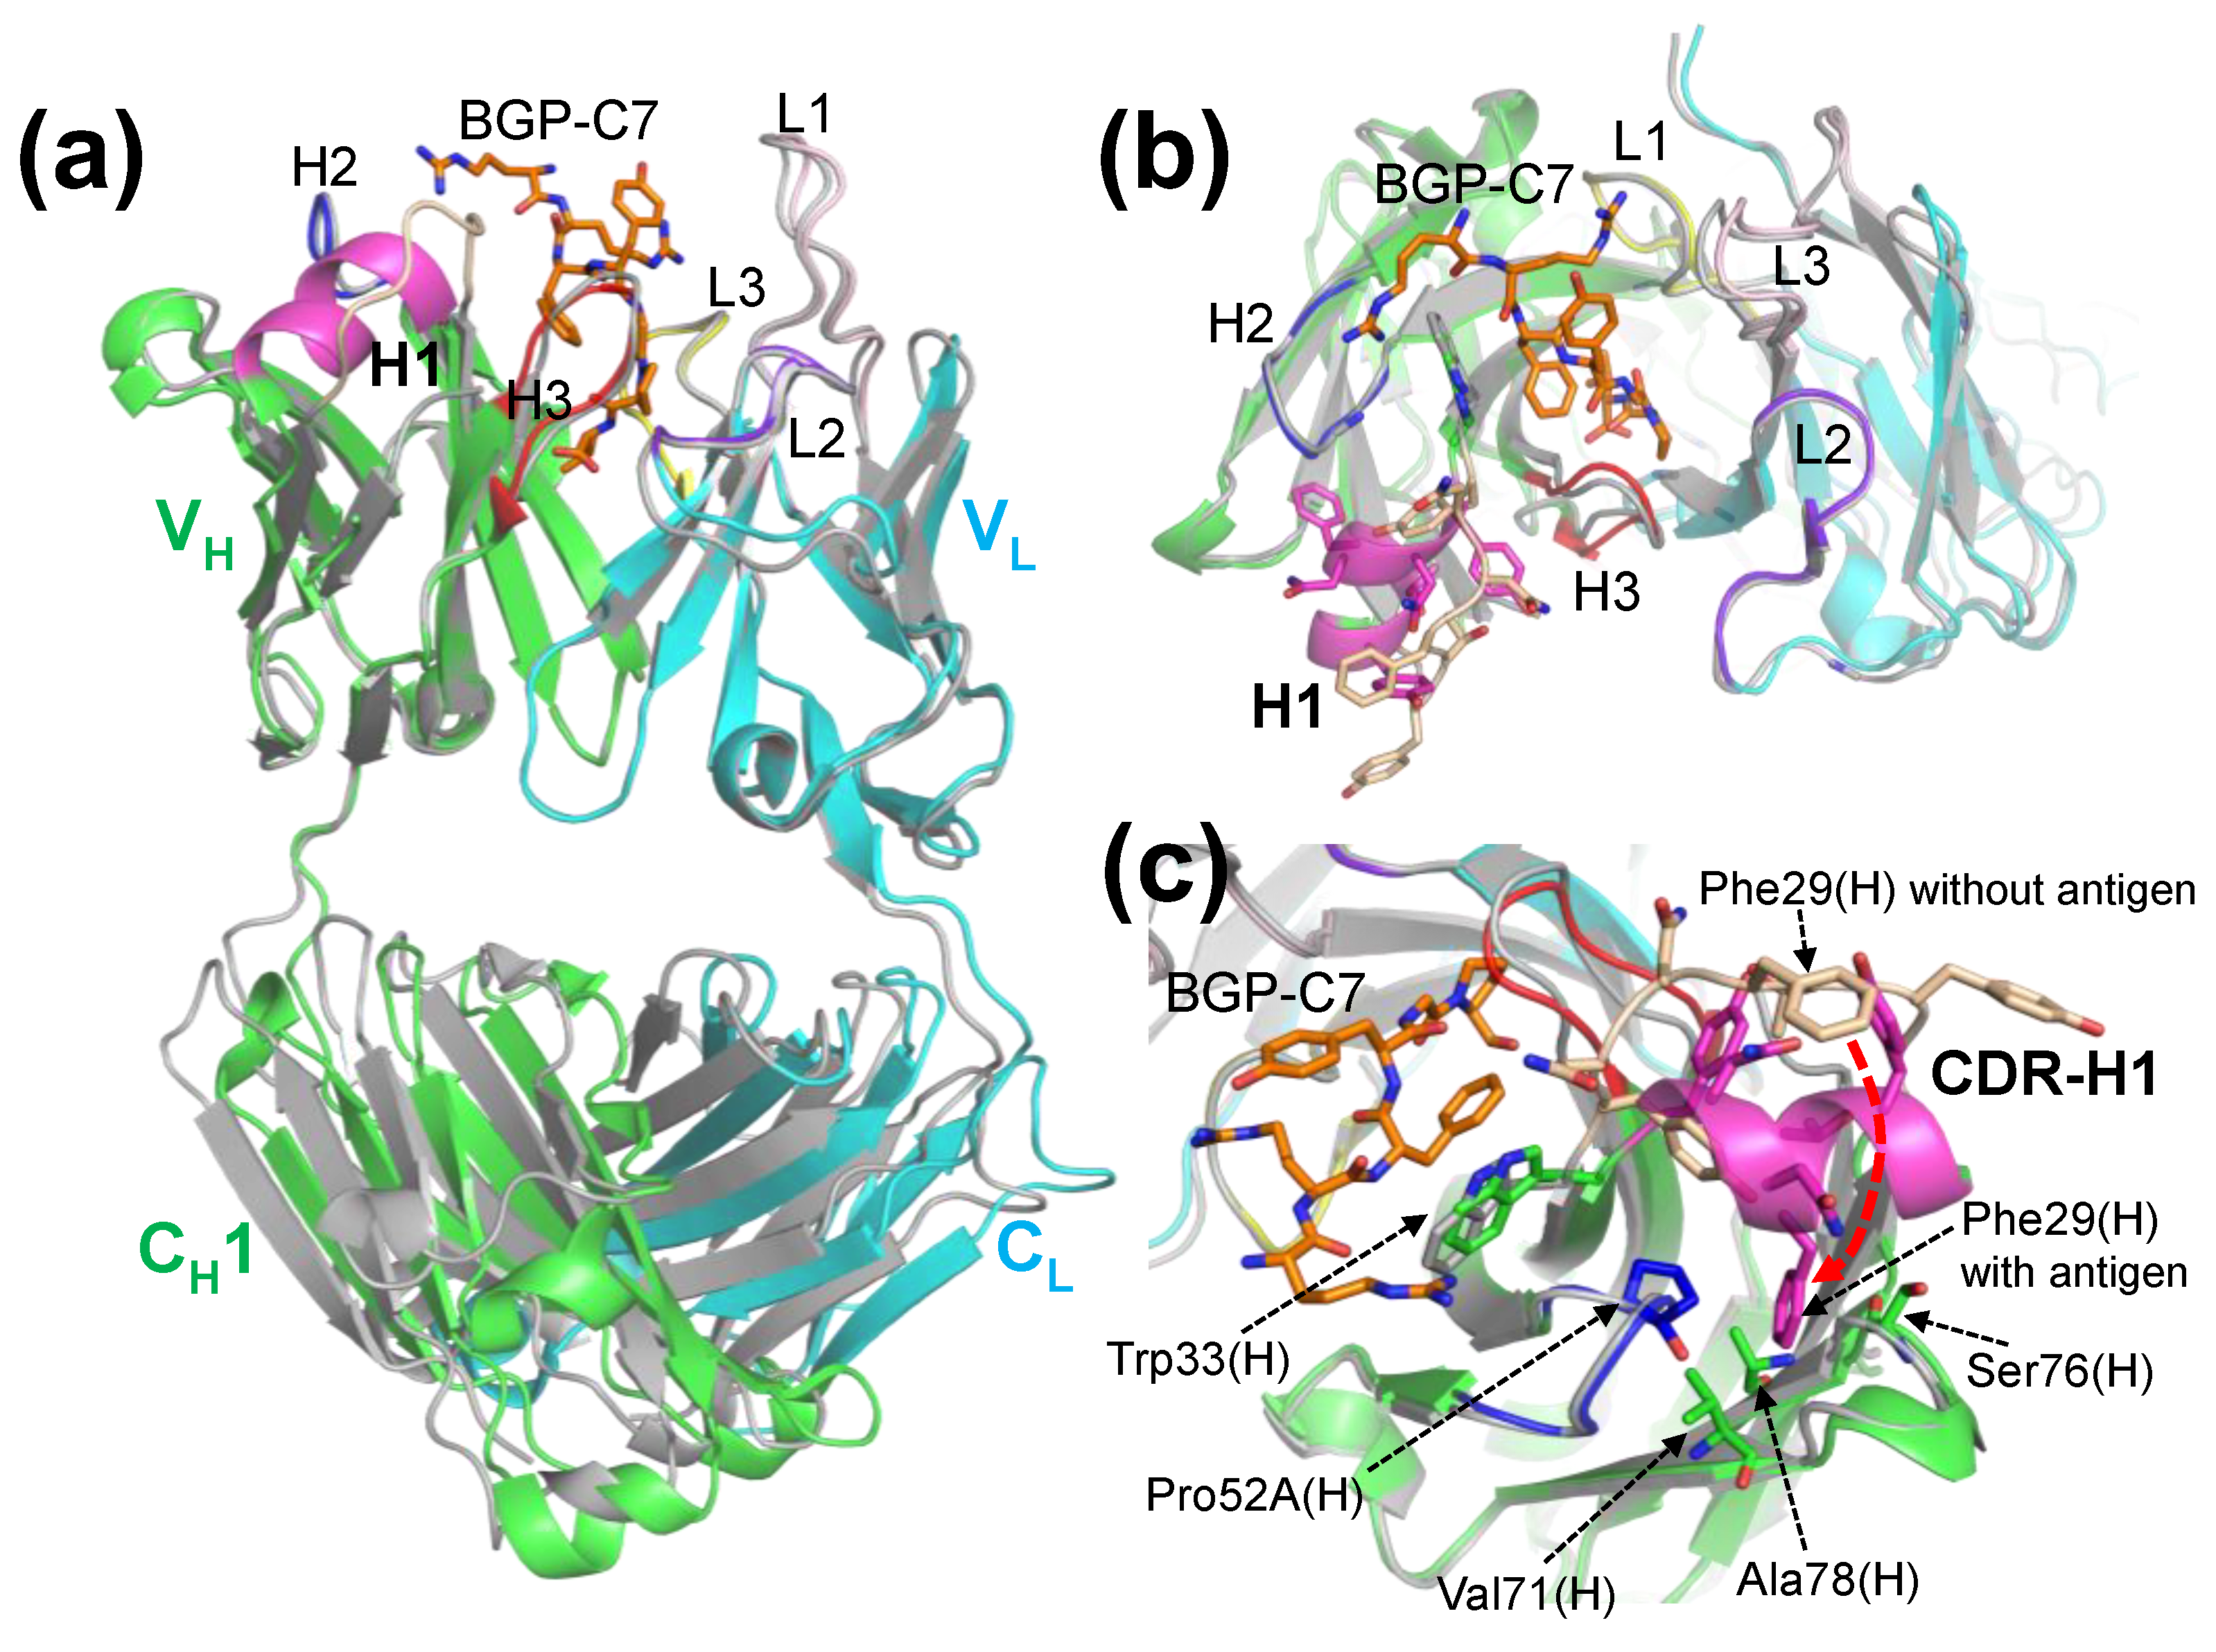
We solved the crystal structures of the anti-osteocalcin antibody KTM219 Fab and its complex with the antigen BGP-C7.
Figure 5 shows a comparison of the two structures. Although the overall structures of V
H and V
L with/without the antigen are almost identical, the structures of CDR-H1 have significantly different conformations (
Figure 5a). The structure of the CDR-H1 loop was changed to a short helix upon antigen binding, although the residues of CDR-H1 did not interact directly with the antigen peptide (
Figure 5b). When the antigen binds to the antibody and then Trp33(H) is slightly shifted, this structural change is probably induced by the insertion of the side chain of Phe29(H) into a hydrophobic pocket due to hydrophobic interactions of Phe29(H) with Pro52A(H), Val71(H), Ser76(H) and Ala78(H) (
Figure 5c).
Q-body is an antibody-based immunosensor constructed by labeling the N-terminal region of scFv or Fab of an antibody with a fluorescent dye [
5,
6,
7]. This technique is easy to operate by simply adding the sample to the Q-body reagent solution and measuring the fluorescence intensity within a few minutes. The following putative mechanism and working principle of a Q-body have been proposed [
5,
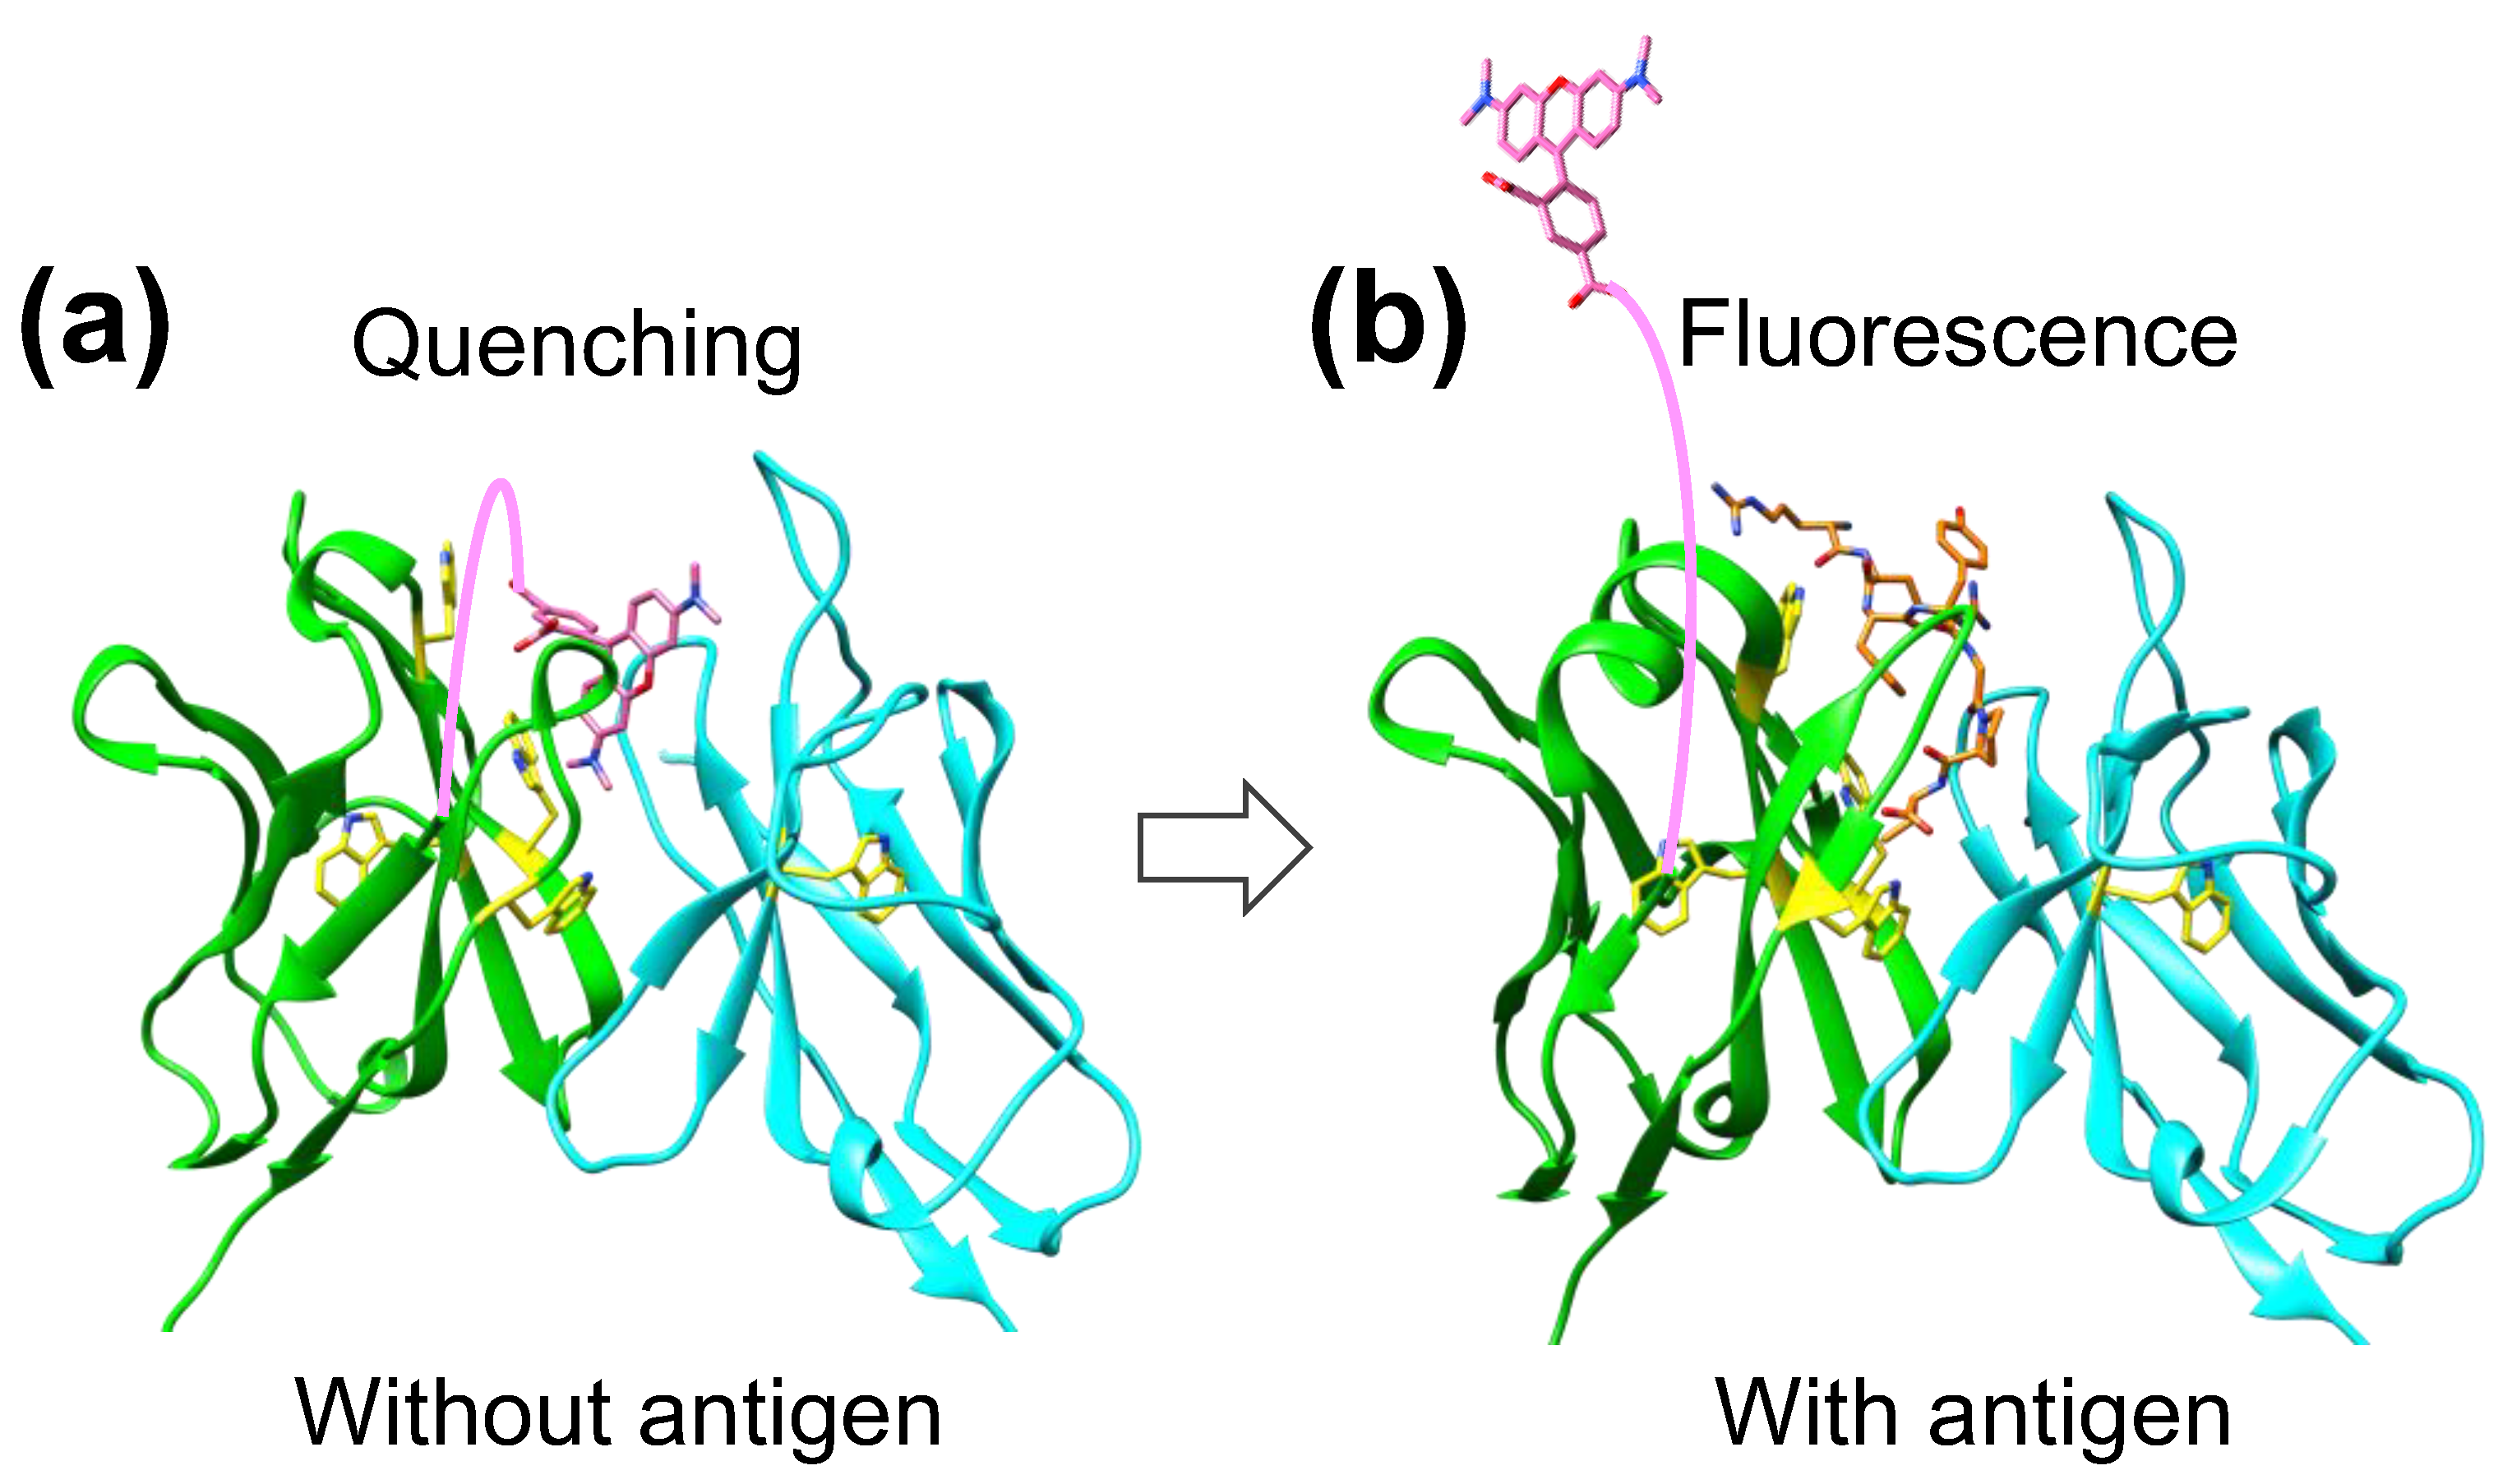
7]. The crystal structures of KTM219 Fab clearly support the proposed mechanism of Q-body (
Figure 6). In the absence of the antigen, the fluorescent dye enters the hydrophobic interface region between V
H and V
L due to the hydrophobicity of the dye; the fluorophore is quenched by Trp residues in the hydrophobic pocket near the antigen binding site between V
H and V
L. When Q-body binds to the antigen, the dye moves outward due to the antigen-dependent Fv stabilization and steric hindrance by the bound antigen and recovers its fluorescence by dequenching. Thus, the antigen concentration can be detected by measuring the positive change in fluorescence intensity. In addition, analyses of the dynamics of dye movement in the reaction between Q-body and antigen by ELISA and fluorescence polarization techniques [
15] have supported the proposed mechanism of Q-body.
Specific amino acids, namely several Trp residues in the antibody variable region attenuate the fluorescence of the dye by quenching due to photoinduced electron transfer (PET) from Trp to the dye [
5]. Tryptophan with an indole side chain is an effective electron donor in the reaction with dye molecules because it is one of the most easily oxidized functional groups among natural amino acids [
12,
13]. Antibody fragments quench the coupled fluorescent dye through the Trp residues semiconserved in its variable region. The crystal structures of KTM219 Fab reveal that there are five Trp residues (Trp33(H), Trp36(H), Trp47(H), Trp103(H), and Trp35(L)) around the antigen binding pocket with appropriate distances (
Table S2) from the predicted binding sites of TAMRA for quenching by PET [
13,
23]. In addition, Trp33(H) and Trp103(H) interacts directly with the antigen peptide BGP-C7 according to the crystal structure of the antibody-antigen complex (
Figure 2c).
In a previous study, Q-bodies with single point mutation of these five Trp to Phe were prepared, and the antigen-dependent fluorescence intensities were measured [
5]. All mutant Q-bodies showed attenuated changes in fluorescence intensity upon addition of the antigen peptide BGP-C7, when compared to the wild-type Q-body. Compared with the basal intensity without antigen, the fluorescence enhancements observed upon addition of antigen were 3.7-, 4.7-, 2.5-, 3.5-, and 3.1-fold for the W33F(H), W36F(H), W47F(H), W103F(H), and W35F(L) mutants, respectively. These values are lower than the value observed for the wild-type scFv (5.6-fold), suggesting that the five Trp residues are involved in the Q-body mechanism. These results are basically consistent with the results from the crystal structures and docking simulations. In addition, the four Trp residues (Trp36(H), Trp47(H), Trp103(H), and Trp35(L)) are located in the framework region of Fv and are highly conserved (> 93%) among immunoglobulins of various origins, suggesting the potential generality of the Q-body methodology [
5,
7].
In this study, the crystal structures of KTM219 Fab and the antibody-antigen complex and docking simulations with a fluorescent dye (TAMRA) clearly support the proposed mechanism of Q-body, which is summarized as the molecular competition between the antibody-tethered dye and the antigen in a sample (
Figure 6). These structural analyses provide the structural basis for Q-body and these findings would be useful for further development and improvement of Q-body fluorescent immunosensors.
4. Materials and Methods
4.1. Protein Expression and Purification
The Fab fragment of anti-osteocalcin C-terminal peptide antibody KTM219 was expressed in
E. coli SHuffle T7 Express
lysY (New England BioLabs) with a protein expression plasmid pET-Fab(KTM219) [
24] as previously described [
6,
24]. The His
6-tagged proteins were purified using immobilized metal affinity chromatography with TALON Metal Affinity Resin (Takara Bio, Kusatsu, Shiga, Japan). The equilibration/wash buffer contained 50 mM sodium phosphate buffer (pH 7.0) and 300 mM NaCl, and the elution buffer contained 50 mM sodium phosphate buffer (pH 7.0), 300 mM NaCl, and 150 mM imidazole. The protein was further purified by anion exchange chromatography (20 mM Tris-HCl buffer (pH 8.5) with a linear gradient of NaCl from 0 to 1 M) with a RESOURCE Q 1 mL column (Cytiva, Little Chalfont, Buckinghamshire, UK) and size-exclusion chromatography (20 mM Tris-HCl buffer (pH 8.0) containing 150 mM NaCl with a Superdex 75 10/300 GL column (Cytiva). The Fab fragment of KTM219 with the addition of three molar excess BGP-C7 (NH
2-RRFYGPV-COOH) was also purified by gel filtration chromatography to obtain the antibody-antigen complex.
4.2. Crystallization
The KTM219 Fab protein (4 mg/mL) was crystallized at 20°C using the hanging drop vapor diffusion method. The KTM219 Fab (1 μL) was mixed with the same volume of reservoir solution (0.6 M sodium formate, 29% w/v polyethylene glycol (PEG) 3350).
The antibody-antigen complex (KTM219 Fab + BGP-C7) was crystallized at 20°C using the sitting and hanging drop vapor diffusion methods. Microcrystals and polycrystals were obtained in several conditions, such as reservoir solution (0.2 M sodium formate, 20–35% w/v PEG 3350). Furthermore, to obtain better crystals, we used a random microseed matrix screening (rMMS) method, a crystal seeding method with random screening kits [
25]. The protein complex (15 mg/mL) and reservoir solution were mixed with microseeds prepared from the microcrystals using Seed Bead (Hampton Research, Aliso Viejo, CA, USA). The best crystal for X-ray crystallography was obtained with a reservoir solution (0.07 M citric acid, 0.03 M BIS-TRIS propane (pH 3.4), 16% w/v PEG 3,350) using the sitting drop vapor diffusion method.
The KTM219 Fab protein (6 mg/mL) with the addition of five molar excess TAMRA (Biotium, Hayward, CA, USA; The stock solution was dissolved in dimethyl sulfoxide.) was mixed with the same volume of reservoir solution (0.3 M ammonium acetate, 0.1 M HEPES (pH 7.5), 25% w/v PEG 3350). The crystal of the KTM219 Fab protein was grown in the presence of TAMRA at 20°C using the hanging drop vapor diffusion method.
4.3. Data Collection, Structure Determination and Refinement
X-ray diffraction data were collected at KEK Photon Factory (PF) Structural Biology Beamline BL-5A or AR-NW12A at 95 K with reservoir solution added to 25% w/v PEG 400 or 25% w/v glycerol as a cryoprotectant. Diffraction data were processed with the program HKL2000 [
26]. The structure was solved by molecular replacement method using Phaser with a model structure of anti-emmprin antibody 4A5 Fab (PDB ID: 4KUZ) [
17]. The model was corrected with the program COOT [
27] and was refined with the program REFMAC5 [
28] in the CCP4 suite [
29]. The quality of the model was inspected by the programs PROCHECK [
30] and MolProbity [
31]. All data collection and refinement statistics are shown in
Table S1. The atomic coordinates and the structure factors have been deposited in the Protein Data Bank (PDB) with the accession codes 5X5X (KTM219 Fab), 8XS1 (KTM219 Fab + BGP-C7), and 8XS2 (KTM219 Fab + TAMRA). The graphic figures were created using the programs PyMOL (Schrödinger, New York, NY), UCSF Chimera [
32], and UCSF ChimeraX [
33].
4.4. Docking Simulations
To predict possible interaction sites of TAMRA to the KTM219 Fab structure, Docking simulation of a fluorescent dye TAMRA to the KTM219 Fab structure of the crystal grown in the presence of TAMRA (PDB ID: 8XS2) was performed using SwissDock [
20] based on EADock DSS [
21]. The whole target protein structure of KTM219 Fab was considered during the docking.
In addition, to predict detailed conformations of TAMRA bound to the antigen binding pocket of KTM219 Fab, docking simulation was performed using RosettaLigand [
34,
35] in ROSIE [
22]. The initial position of a fluorescent dye TAMRA was set at the central part of the antigen binding pocket of KTM219 Fab.
5. Conclusions
In this study, we solved the crystal structures of the anti-osteocalcin antibody KTM219 Fab and its complex with the antigen BGP-C7. In addition, we predicted the binding sites of TAMRA by docking simulations. These results clearly support the proposed mechanism of Q-body as follows. In the absence of antigen, the fluorophore located near the tryptophan residues (Trp33(H), Trp36(H), Trp47(H), Trp103(H), and Trp35(L)) is quenched by photoinduced electron transfer (PET) in the hydrophobic pocket of the antigen binding site between VH and VL. In association with the competitive binding of the antigen, the fluorophore is released from the antigen binding pocket and emits fluorescence. The crystal structures of KTM219 Fab and the structural basis for Q-body would be useful for further development and improvement of Q-body fluorescent immunosensors.
Supplementary Materials
The following supporting information can be downloaded at the website of this paper posted on
Preprints.org, Figure S1: Overall view of docking simulation of TAMRA to KTM219 Fab using SwissDock; Figure S2: Score plots of docking simulation of TAMRA to KTM219 Fab using RosettaLigand; Figure S3: Typical docking simulation results of TAMRA to KTM219 Fab using RosettaLigand; Table S1: X-ray data collection and refinement statistics; Table S2: Distances between the Trp residues and TAMRA from the results of RosettaLigand docking simulation.
Author Contributions
Conceptualization, H.U. and R.A.; methodology, J.D., H.U. and R.A.; validation, S.Y., M.K. and R.A.; formal analysis, S.Y., M.K. and R.A.; investigation, S.Y., M.K. and R.A.; resources, J.D., H.U. and R.A.; data curation, S.Y., M.K. and R.A.; writing—original draft preparation, S.Y., M.K., J.D. and R.A.; writing—review and editing, S.Y., J.D., H.U. and R.A.; visualization, S.Y., M.K. and R.A.; supervision, H.U. and R.A.; project administration, H.U. and R.A.; funding acquisition, H.U. and R.A. All authors have read and agreed to the published version of the manuscript.
Funding
This work was funded by JSPS KAKENHI Grants numbers JP24780097, JP15H04191, JP16K05841, JP16H00761, JP17KK0104, JP18H03851, JP19H02522 and JP24K01267. This work was supported by the Cooperative Research Program of Network Joint Research Center for Materials and Devices.
Data Availability Statement
The atomic coordinates and the structure factors have been deposited in the Protein Data Bank with the accession codes 5X5X, 8XS1 and 8XS2.
Acknowledgments
We thank Tetsuya Kitaguchi and Takanobu Yasuda at Tokyo Institute of Technology and Yuki Ohmuro-Matsuyama at Shimadzu Corporation for helpful comments. Synchrotron X-ray diffraction experiments were performed at Photon Factory (PF), KEK, under the approval of PF program advisory committee (Proposal No. 2014G673, 2016G617, 2018G636, and 2020G658). We thank the beamline scientists and staff at PF, KEK. We are indebted to Research Center for Advanced Science and Technology, Shinshu University, for providing facilities. This work was performed under the Cooperative Research Program of “Network Joint Research Center for Materials and Devices (MEXT).”
Conflicts of Interest
The authors declare no conflicts of interest.
References
- Nan, X.; Yang, L.; Cui, Y. Lateral flow immunoassay for proteins. Clin Chim Acta 2023, 544, 117337. [Google Scholar] [CrossRef] [PubMed]
- Li, G.; Li, Q.; Wang, X.; Liu, X.; Zhang, Y.; Li, R.; Guo, J.; Zhang, G. Lateral flow immunoassays for antigens, antibodies and haptens detection. Int J Biol Macromol 2023, 242, 125186. [Google Scholar] [CrossRef] [PubMed]
- Spicuzza, L.; Campagna, D.; Di Maria, C.; Sciacca, E.; Mancuso, S.; Vancheri, C.; Sambataro, G. An update on lateral flow immunoassay for the rapid detection of SARS-CoV-2 antibodies. AIMS Microbiol 2023, 9, 375–401. [Google Scholar] [CrossRef] [PubMed]
- Rani, A. Q.; Zhu, B.; Ueda, H.; Kitaguchi, T. Recent progress in homogeneous immunosensors based on fluorescence or bioluminescence using antibody engineering. Analyst 2023, 148, 1422–1429. [Google Scholar] [CrossRef]
- Abe, R.; Ohashi, H.; Iijima, I.; Ihara, M.; Takagi, H.; Hohsaka, T.; Ueda, H. "Quenchbodies": quench-based antibody probes that show antigen-dependent fluorescence. J. Am. Chem. Soc. 2011, 133, 17386–17394. [Google Scholar] [CrossRef]
- Abe, R.; Jeong, H. J.; Arakawa, D.; Dong, J.; Ohashi, H.; Kaigome, R.; Saiki, F.; Yamane, K.; Takagi, H.; Ueda, H. Ultra Q-bodies: quench-based antibody probes that utilize dye-dye interactions with enhanced antigen-dependent fluorescence. Sci. Rep. 2014, 4, 4640. [Google Scholar] [CrossRef]
- Dong, J.; Ueda, H. Recent Advances in Quenchbody, a Fluorescent Immunosensor. Sensors 2021, 21. [Google Scholar] [CrossRef]
- Jeong, H. J. Quenchbodies That Enable One-Pot Detection of Antigens: A Structural Perspective. Bioengineering (Basel) 2023, 10. [Google Scholar] [CrossRef]
- Huynh Nhat, K. P.; Watanabe, T.; Yoshikoshi, K.; Hohsaka, T. Antibody-based fluorescent and fluorescent ratiometric indicators for detection of phosphotyrosine. J. Biosci. Bioeng. 2016, 122, 146–154. [Google Scholar] [CrossRef]
- Yoshinari, T.; Ohashi, H.; Abe, R.; Kaigome, R.; Ohkawa, H.; Sugita-Konishi, Y. Development of a rapid method for the quantitative determination of deoxynivalenol using Quenchbody. Anal. Chim. Acta 2015, 888, 126. [Google Scholar] [CrossRef]
- Tsujikawa, K.; Saiki, F.; Yamamuro, T.; Iwata, Y. T.; Abe, R.; Ohashi, H.; Kaigome, R.; Yamane, K.; Kuwayama, K.; Kanamori, T.; Inoue, H. Development of a novel immunoassay for herbal cannabis using a new fluorescent antibody probe, "Ultra Quenchbody". Forensic Sci. Int. 2016, 266, 541–548. [Google Scholar] [CrossRef] [PubMed]
- Marmé, N.; Knemeyer, J. P.; Sauer, M.; Wolfrum, J. Inter- and intramolecular fluorescence quenching of organic dyes by tryptophan. Bioconjugate Chem. 2003, 14, 1133–1139. [Google Scholar] [CrossRef]
- Vaiana, A. C.; Neuweiler, H.; Schulz, A.; Wolfrum, J.; Sauer, M.; Smith, J. C. Fluorescence quenching of dyes by tryptophan: interactions at atomic detail from combination of experiment and computer simulation. J. Am. Chem. Soc. 2003, 125, 14564–14572. [Google Scholar] [CrossRef] [PubMed]
- Lim, S. L.; Ichinose, H.; Shinoda, T.; Ueda, H. Noncompetitive detection of low molecular weight peptides by open sandwich immunoassay. Anal. Chem. 2007, 79, 6193–6200. [Google Scholar] [CrossRef]
- Ohashi, H.; Matsumoto, T.; Jeong, H. J.; Dong, J.; Abe, R.; Ueda, H. Insight into the Working Mechanism of Quenchbody: Transition of the Dye around Antibody Variable Region That Fluoresces upon Antigen Binding. Bioconjug Chem. 2016, 27, 2248–2253. [Google Scholar] [CrossRef]
- Li, J.; Zhang, H.; Yang, C.; Li, Y.; Dai, Z. An overview of osteocalcin progress. J Bone Miner Metab 2016, 34, 367–379. [Google Scholar] [CrossRef]
- Teplyakov, A.; Obmolova, G.; Malia, T. J.; Luo, J.; Gilliland, G. L. Structural evidence for a constrained conformation of short CDR-L3 in antibodies. Proteins 2014, 82, 1679–1683. [Google Scholar] [CrossRef]
- Laskowski, R. A.; Swindells, M. B. LigPlot+: multiple ligand-protein interaction diagrams for drug discovery. J. Chem. Inf. Model 2011, 51, 2778–2786. [Google Scholar] [CrossRef]
- Kabat, E. A.; Wu, T. T.; Perry, H. M.; Gottesman, K. S.; Foeller, C. , Sequences of Proteins of Immunological Interest., 5th ed.; U.S. Government Printing Office: Bethesda, MD, USA, 1991. [Google Scholar]
- Grosdidier, A.; Zoete, V.; Michielin, O. SwissDock, a protein-small molecule docking web service based on EADock DSS. Nucleic Acids Res. 2011, 39, W270–277. [Google Scholar] [CrossRef]
- Grosdidier, A.; Zoete, V.; Michielin, O. Fast docking using the CHARMM force field with EADock DSS. J. Comput. Chem. 2011, 32, 2149–2159. [Google Scholar] [CrossRef]
- Moretti, R.; Lyskov, S.; Das, R.; Meiler, J.; Gray, J. J. Web-accessible molecular modeling with Rosetta: The Rosetta Online Server that Includes Everyone (ROSIE). Protein Sci. 2018, 27, 259–268. [Google Scholar] [CrossRef] [PubMed]
- Hush, N. S.; Paddon-Row, M. N.; Cotsaris, E.; Oevering, H.; Verhoeven, J. W.; Heppener, M. Distance dependence of photoinduced electron transfer through non-conjugated bridges. Chem Phys Lett 1985, 117, 8–11. [Google Scholar] [CrossRef]
- Dong, J.; Jeong, H. J.; Ueda, H. Preparation of Quenchbodies by protein transamination reaction. J. Biosci. Bioeng. 2016, 122, 125–130. [Google Scholar] [CrossRef]
- Stewart, P. D. S.; Kolek, S. A.; Briggs, R. A.; Chayen, N. E.; Baldock, P. F. M. Random Microseeding: A Theoretical and Practical Exploration of Seed Stability and Seeding Techniques for Successful Protein Crystallization. Cryst. Growth Des. 2011, 11, 3432–3441. [Google Scholar] [CrossRef]
- Otwinowski, Z.; Minor, W. Processing of X-ray diffraction data collected in oscillation mode. Methods Enzymol. 1997, 276, 307–326. [Google Scholar] [CrossRef]
- Emsley, P.; Lohkamp, B.; Scott, W. G.; Cowtan, K. Features and development of Coot. Acta Crystallogr. D 2010, 66, 486–501. [Google Scholar] [CrossRef]
- Murshudov, G. N.; Skubak, P.; Lebedev, A. A.; Pannu, N. S.; Steiner, R. A.; Nicholls, R. A.; Winn, M. D.; Long, F.; Vagin, A. A. REFMAC5 for the refinement of macromolecular crystal structures. Acta Crystallogr. D 2011, 67, 355–367. [Google Scholar] [CrossRef]
- Agirre, J.; Atanasova, M.; Bagdonas, H.; Ballard, C. B.; Basle, A.; Beilsten-Edmands, J.; Borges, R. J.; Brown, D. G.; Burgos-Marmol, J. J.; Berrisford, J. M.; Bond, P. S.; Caballero, I.; Catapano, L.; Chojnowski, G.; Cook, A. G.; Cowtan, K. D.; Croll, T. I.; Debreczeni, J. E.; Devenish, N. E.; Dodson, E. J.; Drevon, T. R.; Emsley, P.; Evans, G.; Evans, P. R.; Fando, M.; Foadi, J.; Fuentes-Montero, L.; Garman, E. F.; Gerstel, M.; Gildea, R. J.; Hatti, K.; Hekkelman, M. L.; Heuser, P.; Hoh, S. W.; Hough, M. A.; Jenkins, H. T.; Jimenez, E.; Joosten, R. P.; Keegan, R. M.; Keep, N.; Krissinel, E. B.; Kolenko, P.; Kovalevskiy, O.; Lamzin, V. S.; Lawson, D. M.; Lebedev, A. A.; Leslie, A. G. W.; Lohkamp, B.; Long, F.; Maly, M.; McCoy, A. J.; McNicholas, S. J.; Medina, A.; Millan, C.; Murray, J. W.; Murshudov, G. N.; Nicholls, R. A.; Noble, M. E. M.; Oeffner, R.; Pannu, N. S.; Parkhurst, J. M.; Pearce, N.; Pereira, J.; Perrakis, A.; Powell, H. R.; Read, R. J.; Rigden, D. J.; Rochira, W.; Sammito, M.; Sanchez Rodriguez, F.; Sheldrick, G. M.; Shelley, K. L.; Simkovic, F.; Simpkin, A. J.; Skubak, P.; Sobolev, E.; Steiner, R. A.; Stevenson, K.; Tews, I.; Thomas, J. M. H.; Thorn, A.; Valls, J. T.; Uski, V.; Uson, I.; Vagin, A.; Velankar, S.; Vollmar, M.; Walden, H.; Waterman, D.; Wilson, K. S.; Winn, M. D.; Winter, G.; Wojdyr, M.; Yamashita, K. The CCP4 suite: integrative software for macromolecular crystallography. Acta Crystallogr. D 2023, 79, 449–461. [Google Scholar] [CrossRef] [PubMed]
- Laskowski, R. A.; Macarthur, M. W.; Moss, D. S.; Thornton, J. M. Procheck - a Program to Check the Stereochemical Quality of Protein Structures. J. Appl. Crystallogr. 1993, 26, 283–291. [Google Scholar] [CrossRef]
- Williams, C. J.; Headd, J. J.; Moriarty, N. W.; Prisant, M. G.; Videau, L. L.; Deis, L. N.; Verma, V.; Keedy, D. A.; Hintze, B. J.; Chen, V. B.; Jain, S.; Lewis, S. M.; Arendall, W. B., 3rd; Snoeyink, J.; Adams, P. D.; Lovell, S. C.; Richardson, J. S.; Richardson, D. C. MolProbity: More and better reference data for improved all-atom structure validation. Protein Sci. 2018, 27, 293–315. [Google Scholar] [CrossRef]
- Pettersen, E. F.; Goddard, T. D.; Huang, C. C.; Couch, G. S.; Greenblatt, D. M.; Meng, E. C.; Ferrin, T. E. UCSF Chimera--a visualization system for exploratory research and analysis. J. Comput. Chem. 2004, 25, 1605–1612. [Google Scholar] [CrossRef] [PubMed]
- Pettersen, E. F.; Goddard, T. D.; Huang, C. C.; Meng, E. C.; Couch, G. S.; Croll, T. I.; Morris, J. H.; Ferrin, T. E. UCSF ChimeraX: Structure visualization for researchers, educators, and developers. Protein Sci. 2021, 30, 70–82. [Google Scholar] [CrossRef] [PubMed]
- Combs, S. A.; Deluca, S. L.; Deluca, S. H.; Lemmon, G. H.; Nannemann, D. P.; Nguyen, E. D.; Willis, J. R.; Sheehan, J. H.; Meiler, J. Small-molecule ligand docking into comparative models with Rosetta. Nat. Protoc. 2013, 8, 1277–1298. [Google Scholar] [CrossRef] [PubMed]
- DeLuca, S.; Khar, K.; Meiler, J. Fully Flexible Docking of Medium Sized Ligand Libraries with RosettaLigand. PLoS One 2015, 10, e0132508. [Google Scholar] [CrossRef]
|
Disclaimer/Publisher’s Note: The statements, opinions and data contained in all publications are solely those of the individual author(s) and contributor(s) and not of MDPI and/or the editor(s). MDPI and/or the editor(s) disclaim responsibility for any injury to people or property resulting from any ideas, methods, instructions or products referred to in the content. |
© 2024 by the authors. Licensee MDPI, Basel, Switzerland. This article is an open access article distributed under the terms and conditions of the Creative Commons Attribution (CC BY) license (http://creativecommons.org/licenses/by/4.0/).
