1. Introduction
Coronavirus disease 2019 (COVID-19), caused by severe acute respiratory syndrome coronavirus 2 (SARS-CoV-2), was first documented in late 2019 and declared a global pandemic on March 11, 2020 by the World Health Organization (WHO) [
1]. The virus responsible for COVID-19 is an enveloped, single-stranded RNA virus that has been characterized by high infectivity, relatively high asymptomatic ratio in the population, and potential to result in serious health complications [
2,
3,
4]. The number and proportion of persons infected with SARS-CoV-2 were mainly determined based on individual testing and laboratory-based bio-molecular diagnostics. It was expected that the infection extent in a specific region could only be estimated very roughly, partly because undetected cases contribute significantly to the spread of the infection [
5]. Epidemic or even pandemic viruses also include influenza A and B viruses; both are single-stranded RNA viruses that cause respiratory infection in humans. In contrast to SARS-CoV-2, influenza viruses have a seasonal incidence and are less severe but could still lead to serious complications [
6,
7,
8]. The primary mode of transmission of SARS-CoV-2 and influenza viruses is via respiratory droplets that per capita produce when they cough, sneeze, or exhale; additionally these viruses may also be spread via fomites [
8,
9]. Many researchers have shown that RNA of SARS-CoV-2 and influenza viruses can be found in stool samples weeks after the infection, therefore, it must be systematically assessed whether the virus might, in addition to respiratory droplets, also be transmitted via feces [
10,
11,
12,
13,
14,
15].
SARS-CoV-2 and influenza A and B viruses are a promising candidates for wastewater-based epidemiology (WBE) that has been suggested as a potentially useful complementary tool to gain insights into the degree of diseases spread in a population, including also asymptomatic or pre-symptomatic individuals [
16,
17]. Retrospective analyses, performed in Switzerland, on wastewater samples collected in 2020-2022, shown the great potential of WBE for spatiotemporal detection of SARS-CoV-2 [
18] and influenza viruses [
19].
Despite the high potential of WBE there are no standard methods for the quantification of RNA of SARS-CoV-2 and influenza A and B in wastewater. Many factors that may affect data interpretation, must be considered and mitigated. First step was the correct storage temperature of wastewater, prior to analysis, to avoid RNA degradation and loss of quantity [
20,
21]. Viral nucleic acid concentration and extraction methods should be fast and must ensure a good recovery [
22]. Finally, to obtain reliable results, it was useful to normalize SARS-CoV-2 concentration to population served by wastewater treatment plant [
23].
To explore long term, the situation in our region, we aim to monitor the presence of SARS-CoV-2 and influenza A and B in three wastewater treatment plants (WWTP) located in Southern Switzerland (Canton Ticino and Canton Grisons, Moesa Region). We could detect the presence of SARS-CoV-2 and influenza A and B in all the WWTP monitored. The concentration of viral RNA in wastewater correlated with clinical cases highlighting peaks of infection. WBE confirms to be a powerful tool for evaluating the incidence of a disease in a population at large scale and can be applied to different microorganisms.
2. Materials and Methods
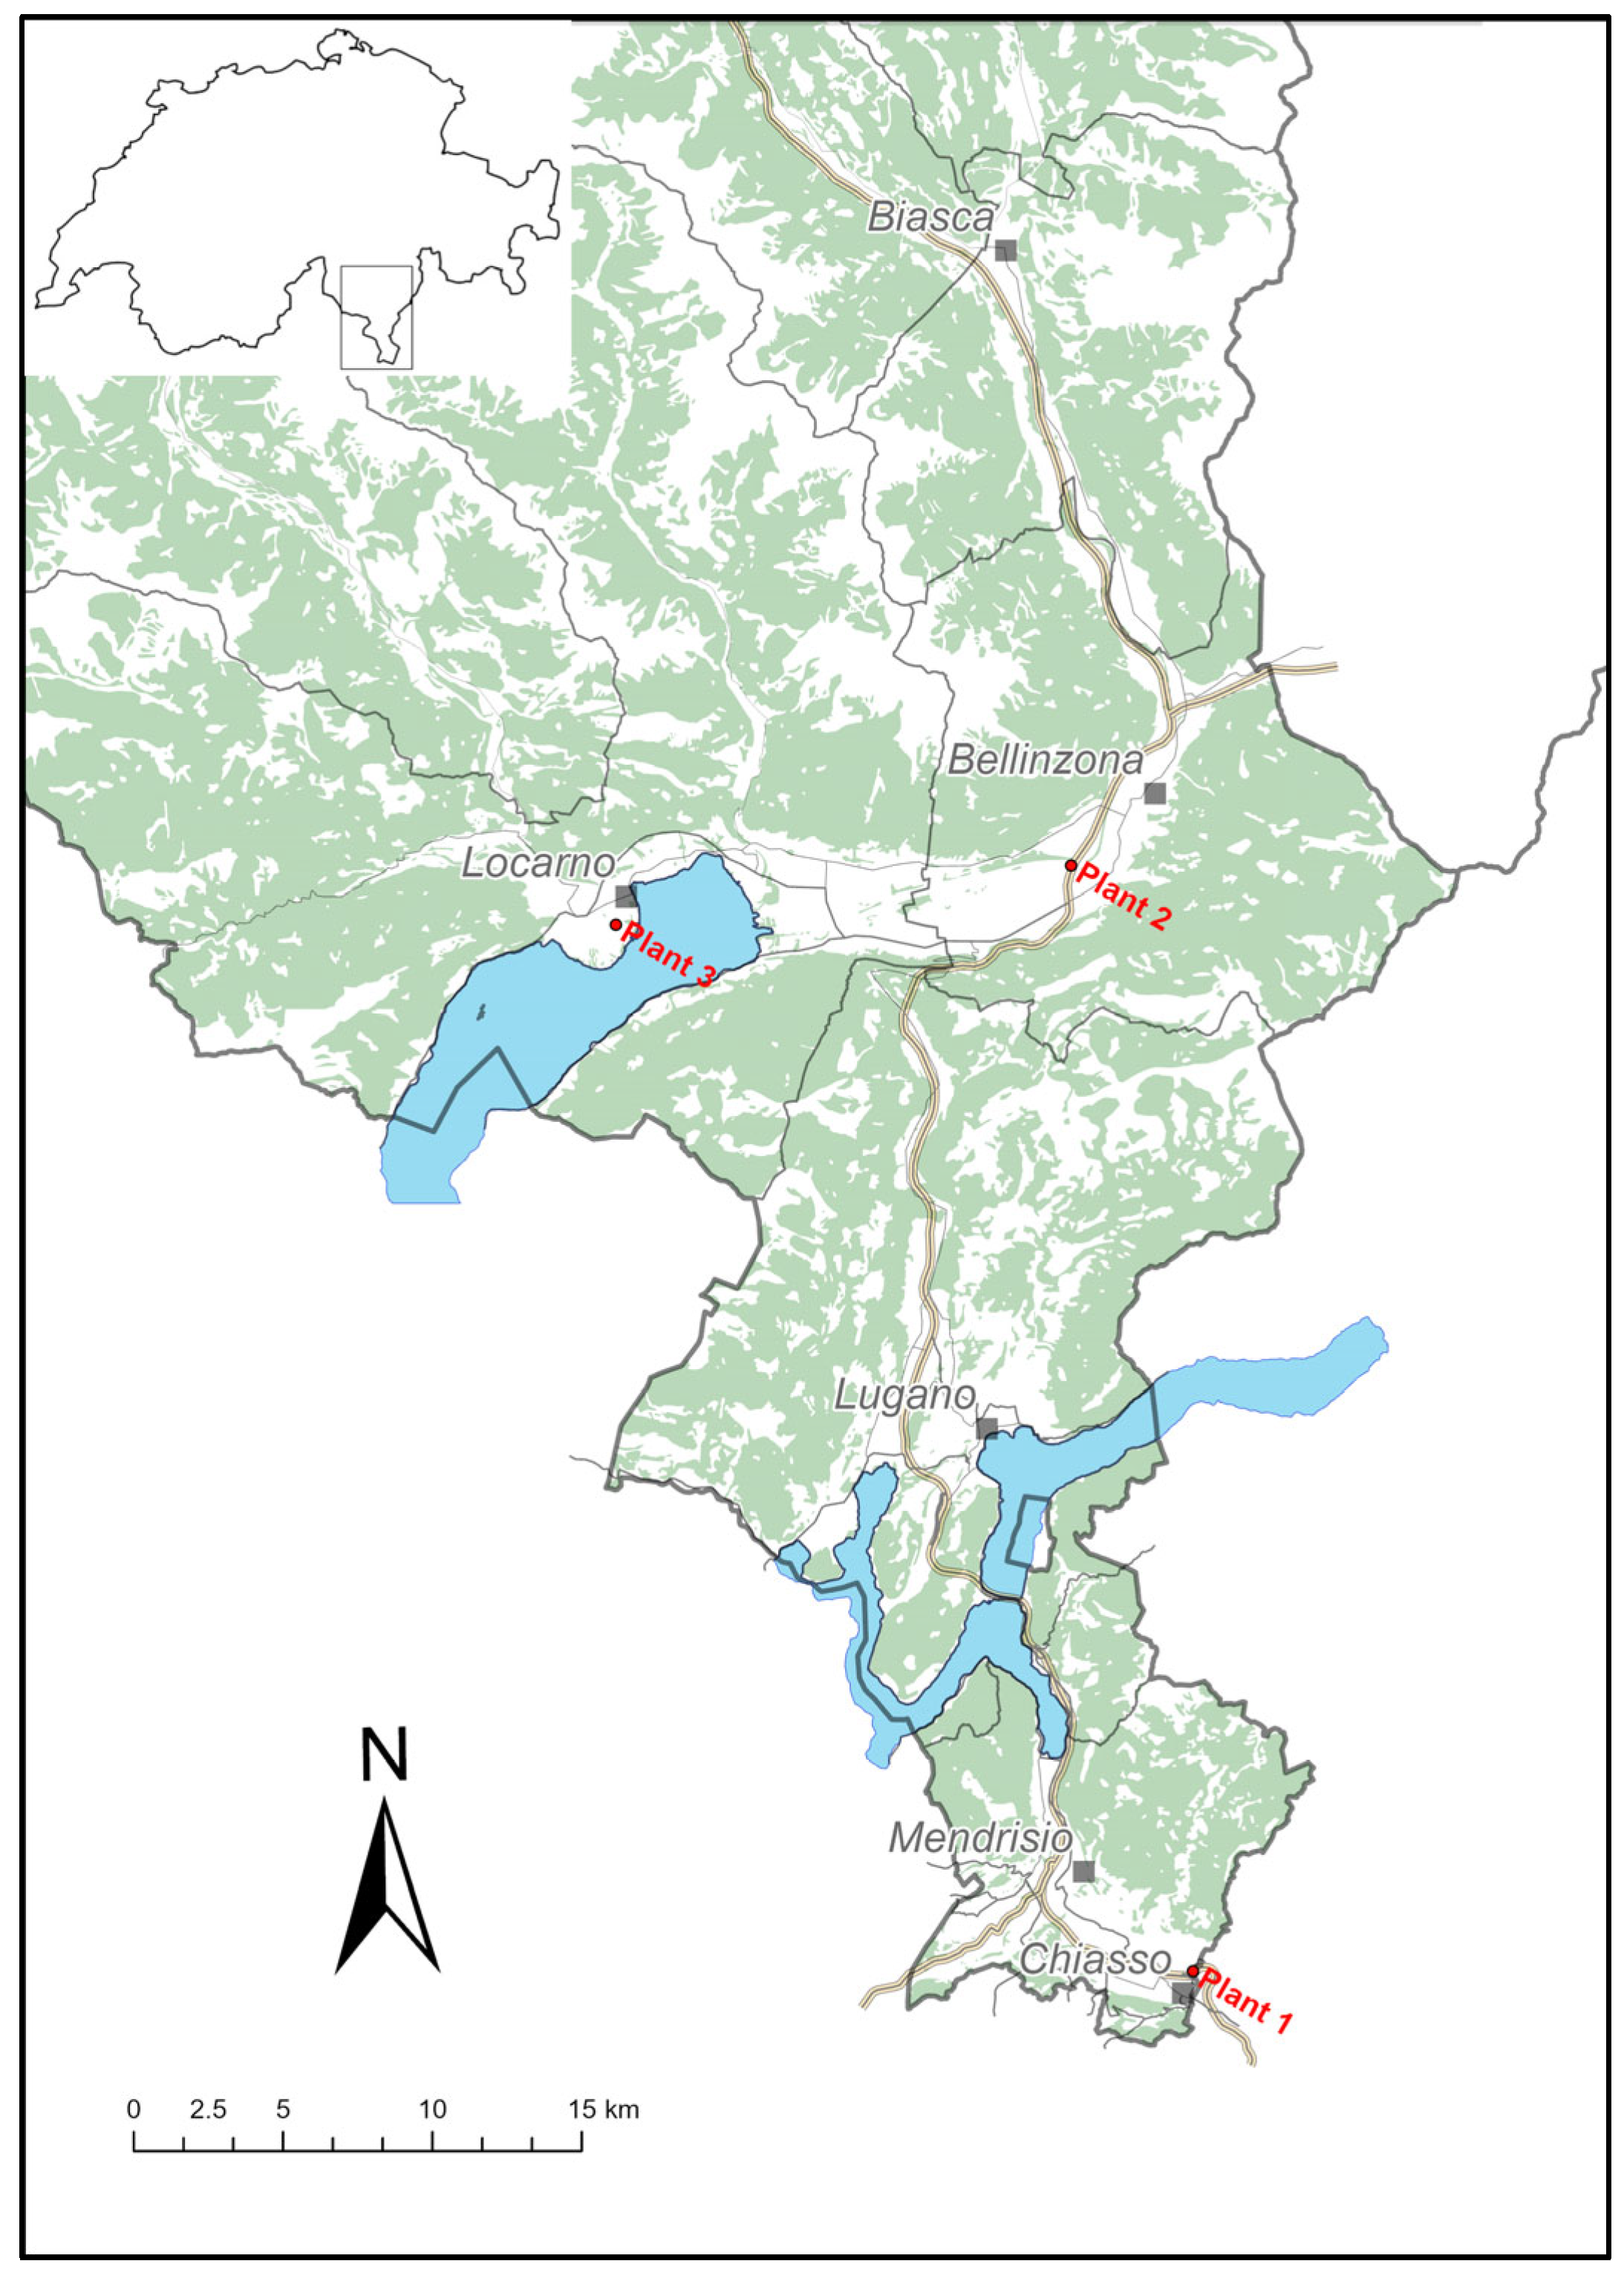
Three WWTP were selected in Canton Ticino, Southern Switzerland (
Figure 1): Plant 1, located near the border with Italy (Lombardy), serving a population of 28’358 inhabitants in the district of lower Mendrisiotto; Plant 2 with 53’209 inhabitants connected, the plant serves the Bellinzona district and the lower Mesolcina valley; Plant 3 located near Locarno in the north part of Ticino, this plant serves 51’061 inhabitants.
Wastewater collection started in March 2021 with one sampling per week for each plant. From January 2022 until June 2023, sampling was intensified to three times a week. Water samples were 24h composite.
Total nucleic acid (TNA) was extracted and purified, according to the manufacturer instructions, using Wizard® Enviro Wastewater TNA kit (Promega Corp.) from March 2021 to November 2021 and Maxwell® RSC Enviro Total Nucleic Acid Kit (Promega Corp.) from December 2021 until the end of the project [
24]. Both methods use the same system of direct capture and concentration of TNA on silica resin, the second one involves the use of an instrument (Maxwell® RSC, Promega Corp.) for walk-away-automation. We tested, in parallel with the two methods, 34 samples. The results obtained are comparable (data not shown).
SARS-CoV-2 quantification was performed by RT-qPCR using SARS-CoV-2 RT-qPCR Detection Kit for Wastewater (Promega Corp.). The reaction targeted the nucleocapsid gene (N1) of SARS-CoV-2 and co-amplified the pepper mild mottle virus (PMMoV) biomarker used as RNA recovery control. Each reaction included an internal amplification control (IAC) to check PCR inhibitions [
24].
Influenza A and B detection was performed by RT-qPCR using the GoTaq® Enviro FluA/FluB/SARS-CoV-2 kit (Promega Corp.), targeting the matrix gene segment (M) for influenza A , and a non-structural gene (NS) for influenza B was [
25]. PMMoV and IAC were again used as inhibition and process controls, as described above.
All RT-qPCR reactions were run in triplicate on a 7500 Fast Real-Time PCR System (Applied Biosystems, USA) with the cycling condition suggested by the RT-qPCR detection kits manufacturer (Promega Corp.).
SARS-CoV-2 RNA recovery, limit of quantification (LOQ), limit of detection (LOD), and accuracy of the whole process (from TNA extraction to amplification), were determined by spiking wastewater with known concentrations of an inactivated strain of SARS-CoV-2, kindly provided by Dr. C. Bagutti (Kantonales Laboratorium Basel-Stadt, Switzerland). Briefly, sterilized wastewater samples (at 121°C for 20 min) were spiked with 10-fold dilutions (from 108 to 102 copies/L) of inactivated SARS-CoV-2 strain. Samples were then processed for RNA extraction and amplification. The LOQ was defined as the lowest concentration tested with a relative standard deviation (RSD) below 25%. Concentrations corresponding to 107 and 103 copies/L were used to test sample stability at 4°C and -20°C for short- and long-term storage. Briefly, samples spiked with known number of copies/L were tested, by RNA extraction and RT-qPCR, at time 0 and after two, four and seven days at 4°C and after 14, 28 and 42 days at -20°C. The acceptability criteria were based on Relative Standard Deviation (RSD) (percent value ≥ 25% with respect to time zero).
Limits of quantification and detection of the RT-qPCR for influenza A and B were verified using known concentrations of standards provided by Promega.
All data were reported as target genes copies per capita, dividing the number of copies per liter by the number of per capita connected to each plant.
Kruskal-Wallis test (GraphPad Prism, version 9.5.1) was used to analyze differences between the three plants in terms of quantity of SARS-CoV-2, influenza A and influenza B (α set to 0.05). 7-day moving average was used to smooth the data. Differences between influenza viruses A and B in each WWTPs were compared using Mann Whitney test (α set to 0.05) (GraphPad Prism, version 9.5.1).
The number of SARS-CoV-2 clinical cases were downloaded from the website of Federal Office of Public Health (
https://www.covid19.admin.ch/it/epidemiologic/case) that reported, daily, the laboratory confirmed cases for each Cantons. Influenza confirmed cases were registered weekly and reported as a sum of A and B. Influenza clinical cases from Ticino have been kindly provided by Dr G. Martinetti (Institute of Laboratory Medicine, Ente Ospedaliero Cantonale, Bellinzona, Switzerland). Correlation trends between the presence of viruses RNA in wastewater and clinical cases were analyzed by non-parametric Spearman correlation (GraphPad Prism, version 9.5.1).
3. Results
3.1. SARS-CoV-2
3.1.1. RNA Recovery, Sample Stability at 4°C and -20°C
The entire wastewater analytical process, from samples concentration to RNA extraction and amplification, showed a good linearity (R2 0.99) and efficiency (E 86%) in the tested interval of 108, 107, 105, 104 SARS-CoV-2 copies/L. Analyzing the difference between expected and obtained log quantity, we observed a recovery loss of 1 log ± 0.4SD. Limit of detection of the method was 102 copies/L and LOQ was 103 copies/L.
Concentrations of SARS-CoV-2 corresponding to 10
7 and 10
3 copies/L were used to test RNA stability at 4°C (short term storage) and -20°C (long term storage) in the wastewater sample. We determined that at 4°C RNA was stable up to 7 days at concentration above LOQ, and up to 4 days at concentrations near the LOQ (
Table 1). For long term preservation, the concentration of RNA decreased already after 14 days of storage at -20°C (
Table 2).
3.1.2. SARS-CoV-2 Detection and Quantification in Wastewater
We analyzed a total of 862 samples, distributed as follow: 289 samples from Plant 1, 290 from Plant 2, and 283 from Plant 3. SARS-CoV-2 RNA was detected and quantified in almost all samples, with 99% of wastewater samples positives in Plant 1, 99.7% in Plant 2, and 100% in Plant 3 (
Table S1).
All samples tested were also screened for the presence of PMMoV and IAC. Threshold cycles of PMMoV were always above 40, cut-off cycle specified by the manufacturer for a successful extraction procedure, and the mean quantity detected in all samples was about 1∙108 copies/L without differences between WWTPs. Threshold cycles of IAC, co-amplified in all samples, were between 27 and 30, and never exceeded those of the negative control.
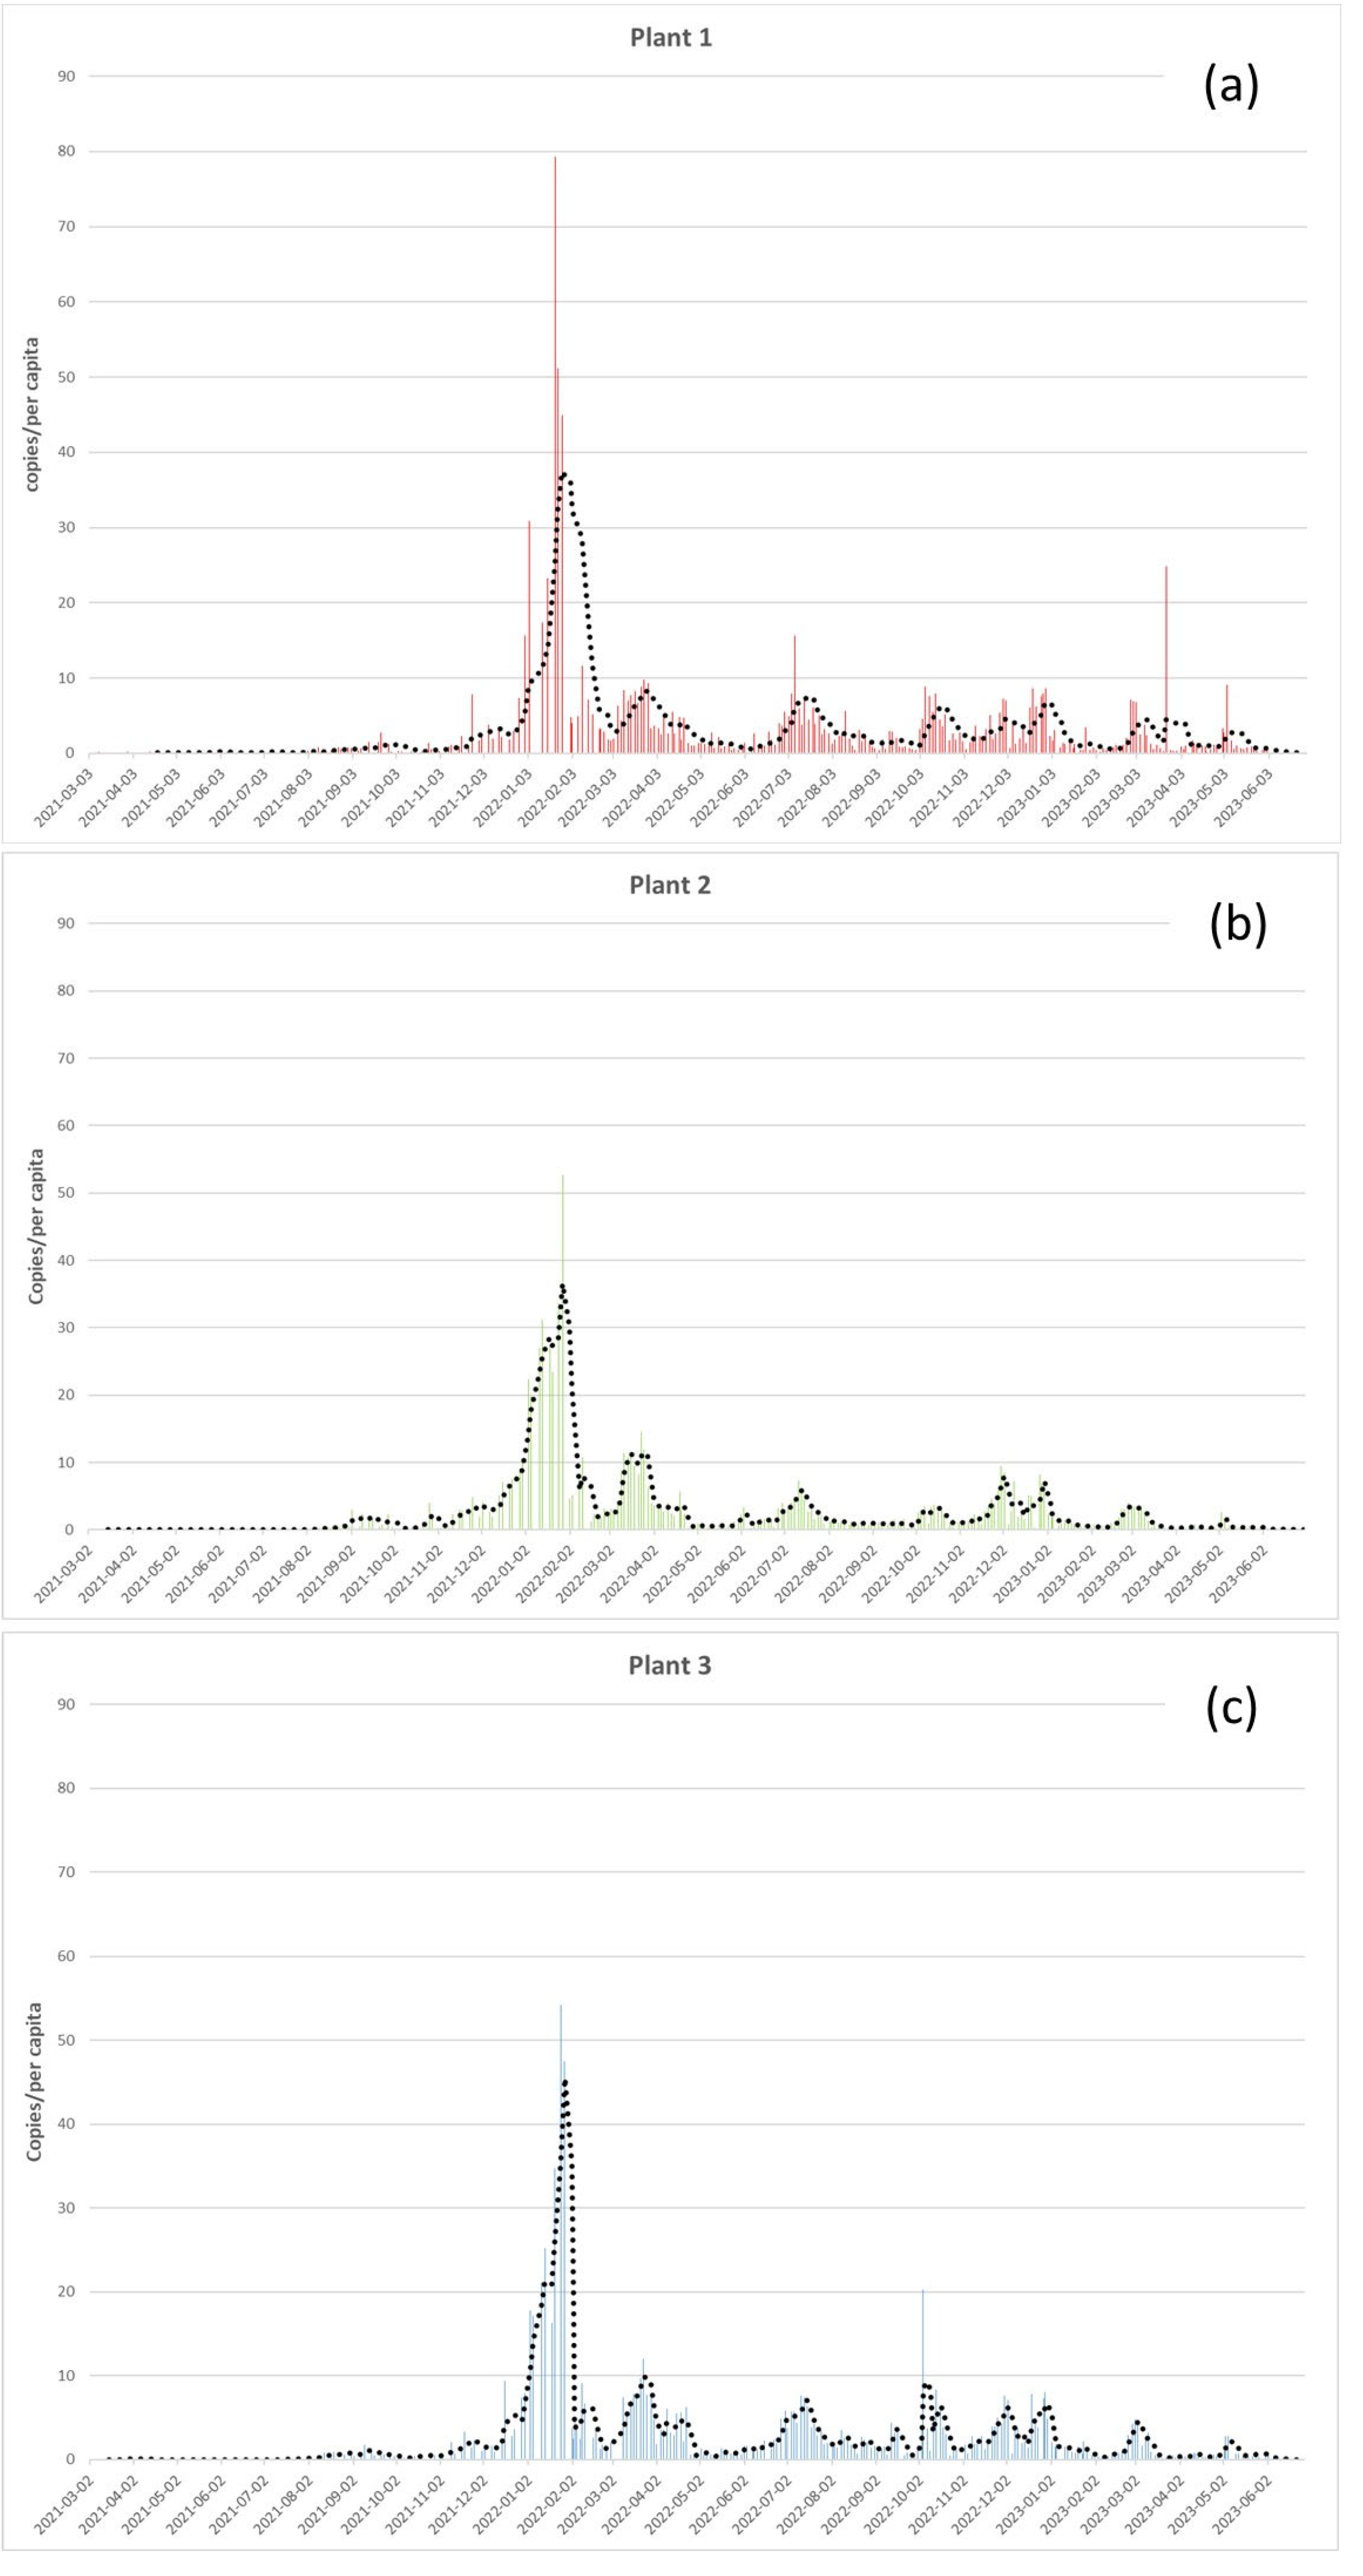
As shown in
Figure 2, there were no significant differences in the SARS-CoV-2 load between the three WWTPs monitored (Kruskal-Wallis test, p-value = 0.2). During the monitoring period, we detected a mean of 3.3 RNA copies/per capita in Plant 1 and 2.9 copies/per capita in Plant 2 and 3. The Highest SARS-CoV-2 concentration detected (79 copies/per capita) was reached in Plant 1 at the end of January 2022 (
Figure 2a), followed by Plant 3 with 54 copies/per capita (
Figure 2c), and Pant 2 with 53 copies/per capita (
Figure 2b), in the same period. 7-day moving average, highlighted six main picks in January, March, July, October, December 2022, and March 2023 (
Figure 2).
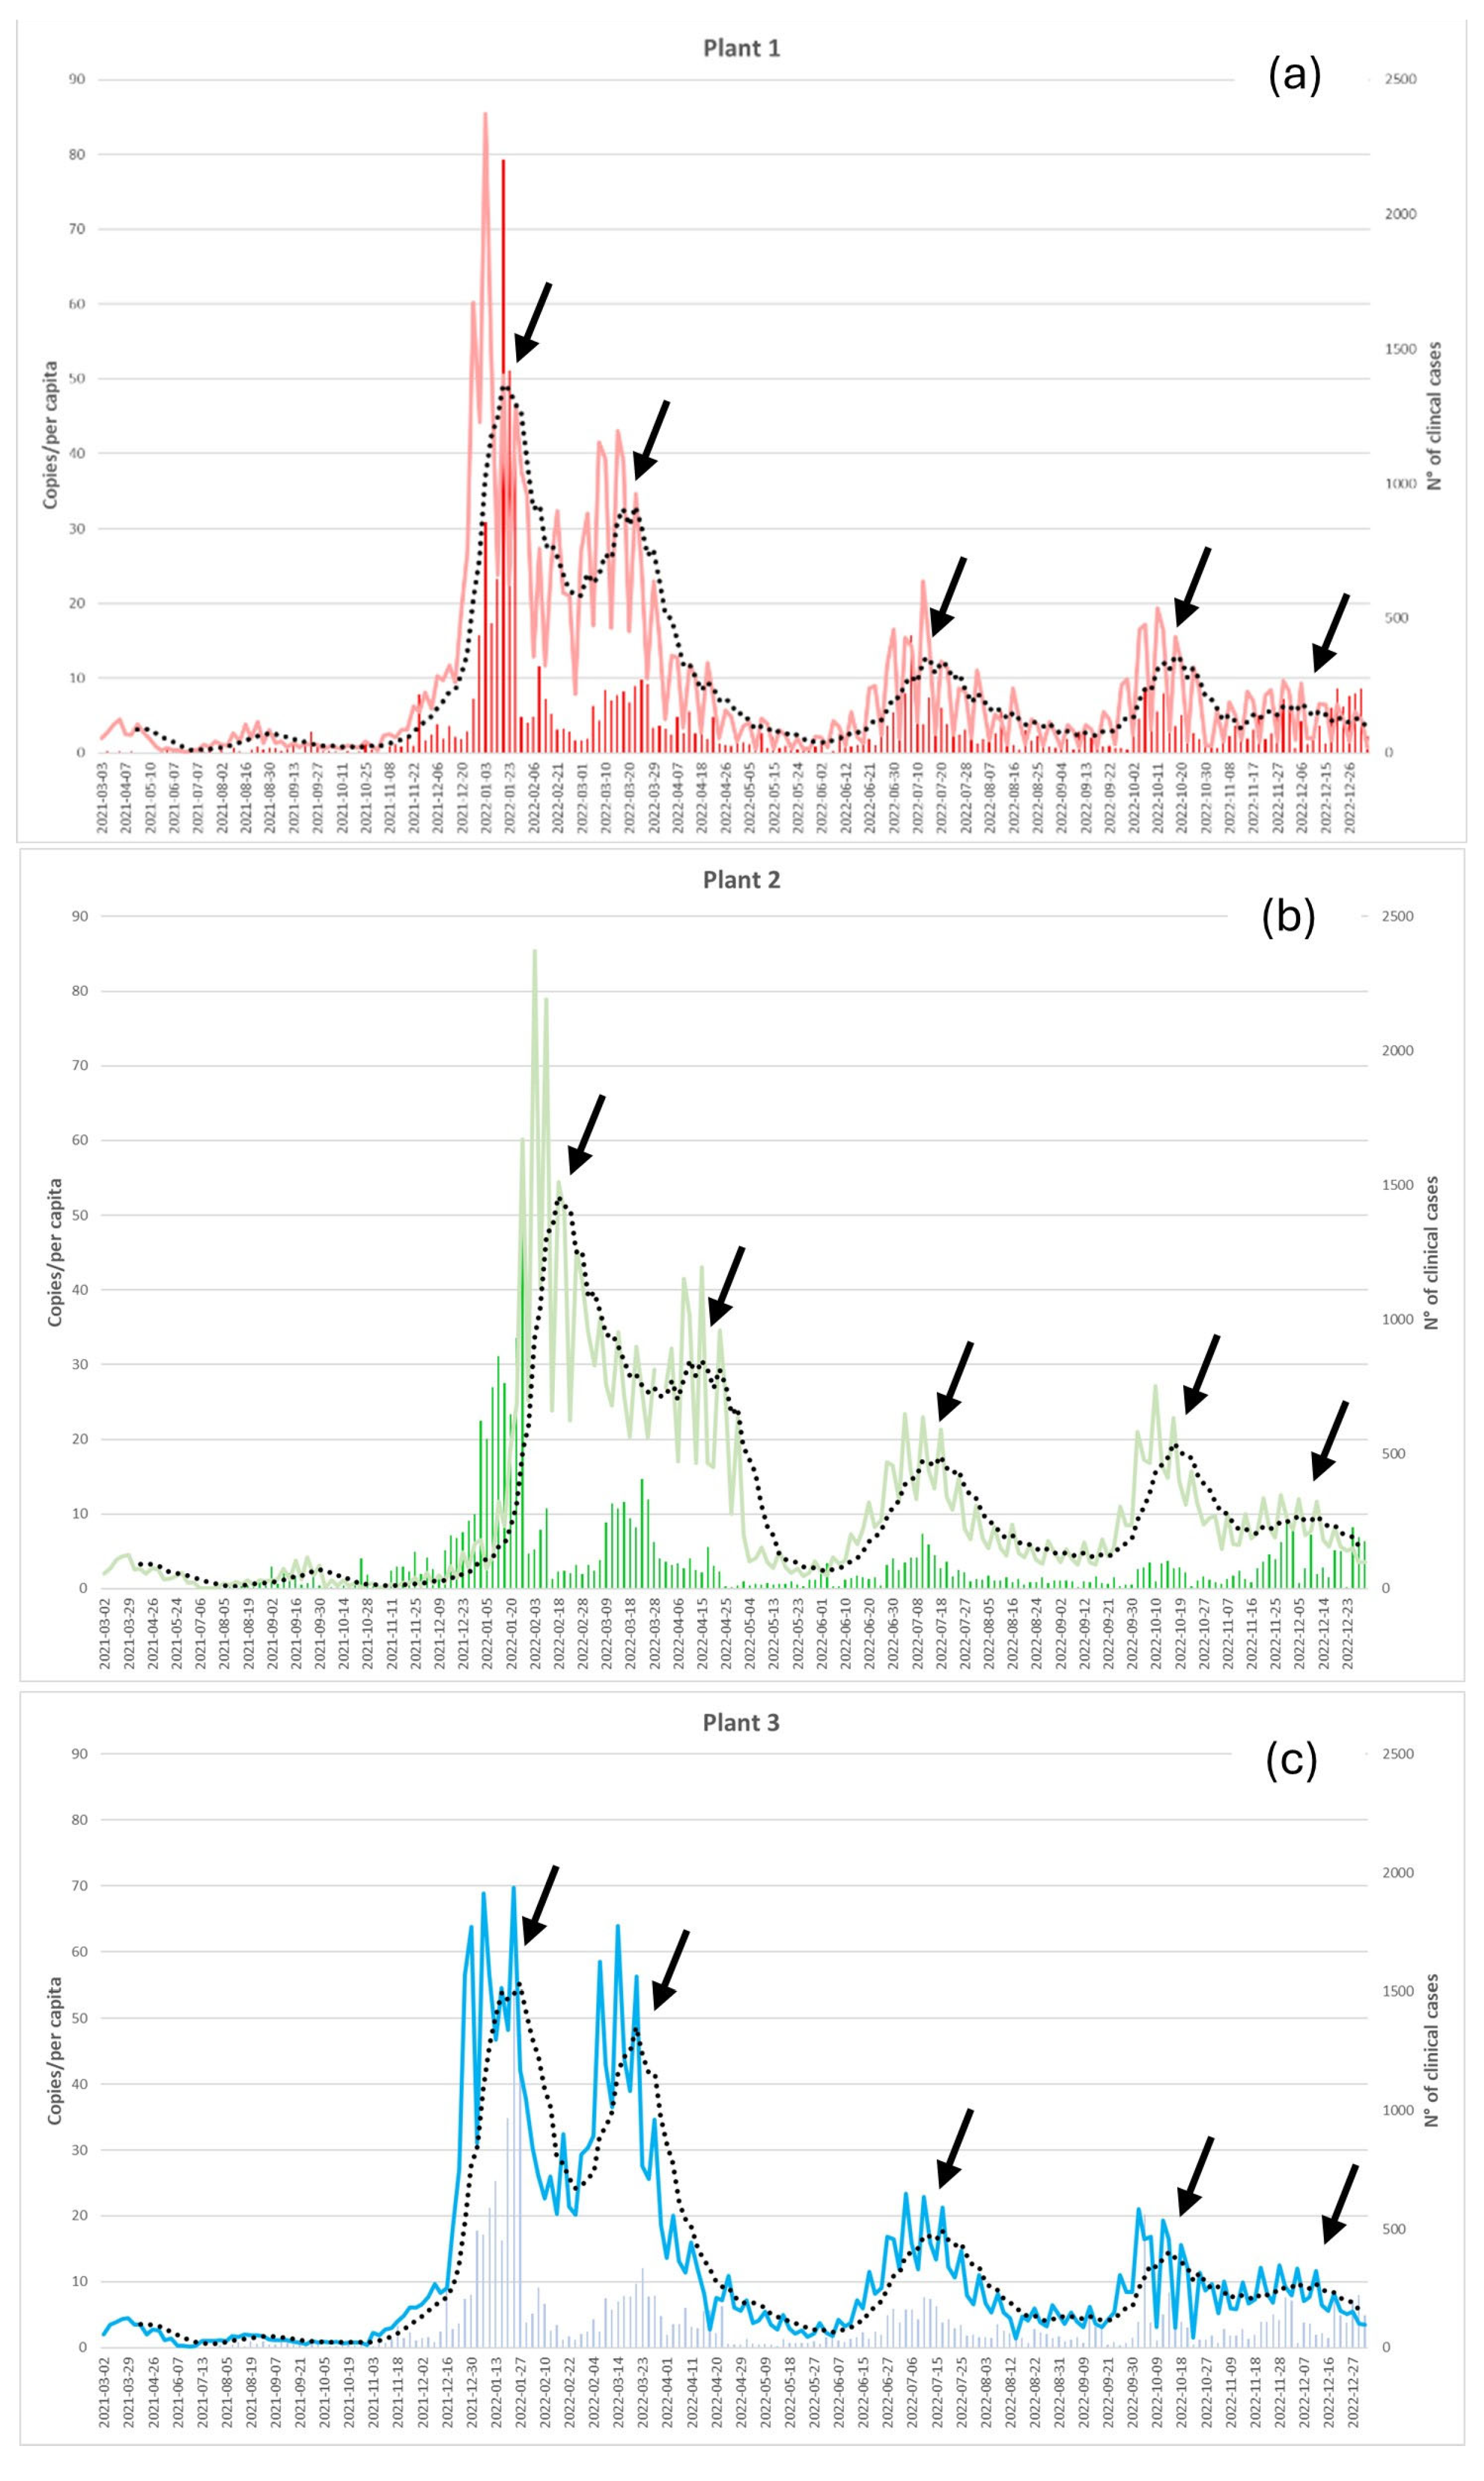
Peaks of SARS-CoV-2 RNA identified in WWTP in 2022 (January, March, July, October and December) correspond to the five waves of COVID-19 cases confirmed by clinical laboratory tests (
Figure 3, 7-day moving averages, black arrows).
A positive significant correlation was shown between clinical confirmed cases and SARS-CoV-2 RNA detected in each wastewater treatment plants (Spearman’s correlation; Plant 1: r = .7, N 289; Plant 2: r = .5, N 290; Plant 3: r = .8, N 283; p < .001 for all)
3.2. Influenza A and B
3.2.1. RT-qPCR Linearity, Limit of Detection and Quantification
Using RT-qPCR standards (GoTaq® Enviro FluA/FluB/SARS-CoV-2 kit, Promega) at known concentrations we estimated an LOD and LOQ for influenza A corresponding to 50 RNA copies/reaction; LOD for influenza B was 20 copies/reaction and LOQ was 50 copies/reaction. Both PCRs showed good linearity (R2 = 0.99) and efficiency (influenza A, E = 95%; influenza B, E = 91%).
3.2.2. Influenza A e B in Wastewater
We analyzed a total of 329 samples, distributed as follows: 111 samples from Plant 1, 111 from Plant 2, and 107 from Plant 3. Influenza A RNA could be detected and quantified in 66% of samples in Plant 1, 77% in both Plant 2 and Plant 3. Influenza B was detected and quantified in 63%, 71%, and 62% of samples in the three wastewater treatement plants, respectively (
Table S2).
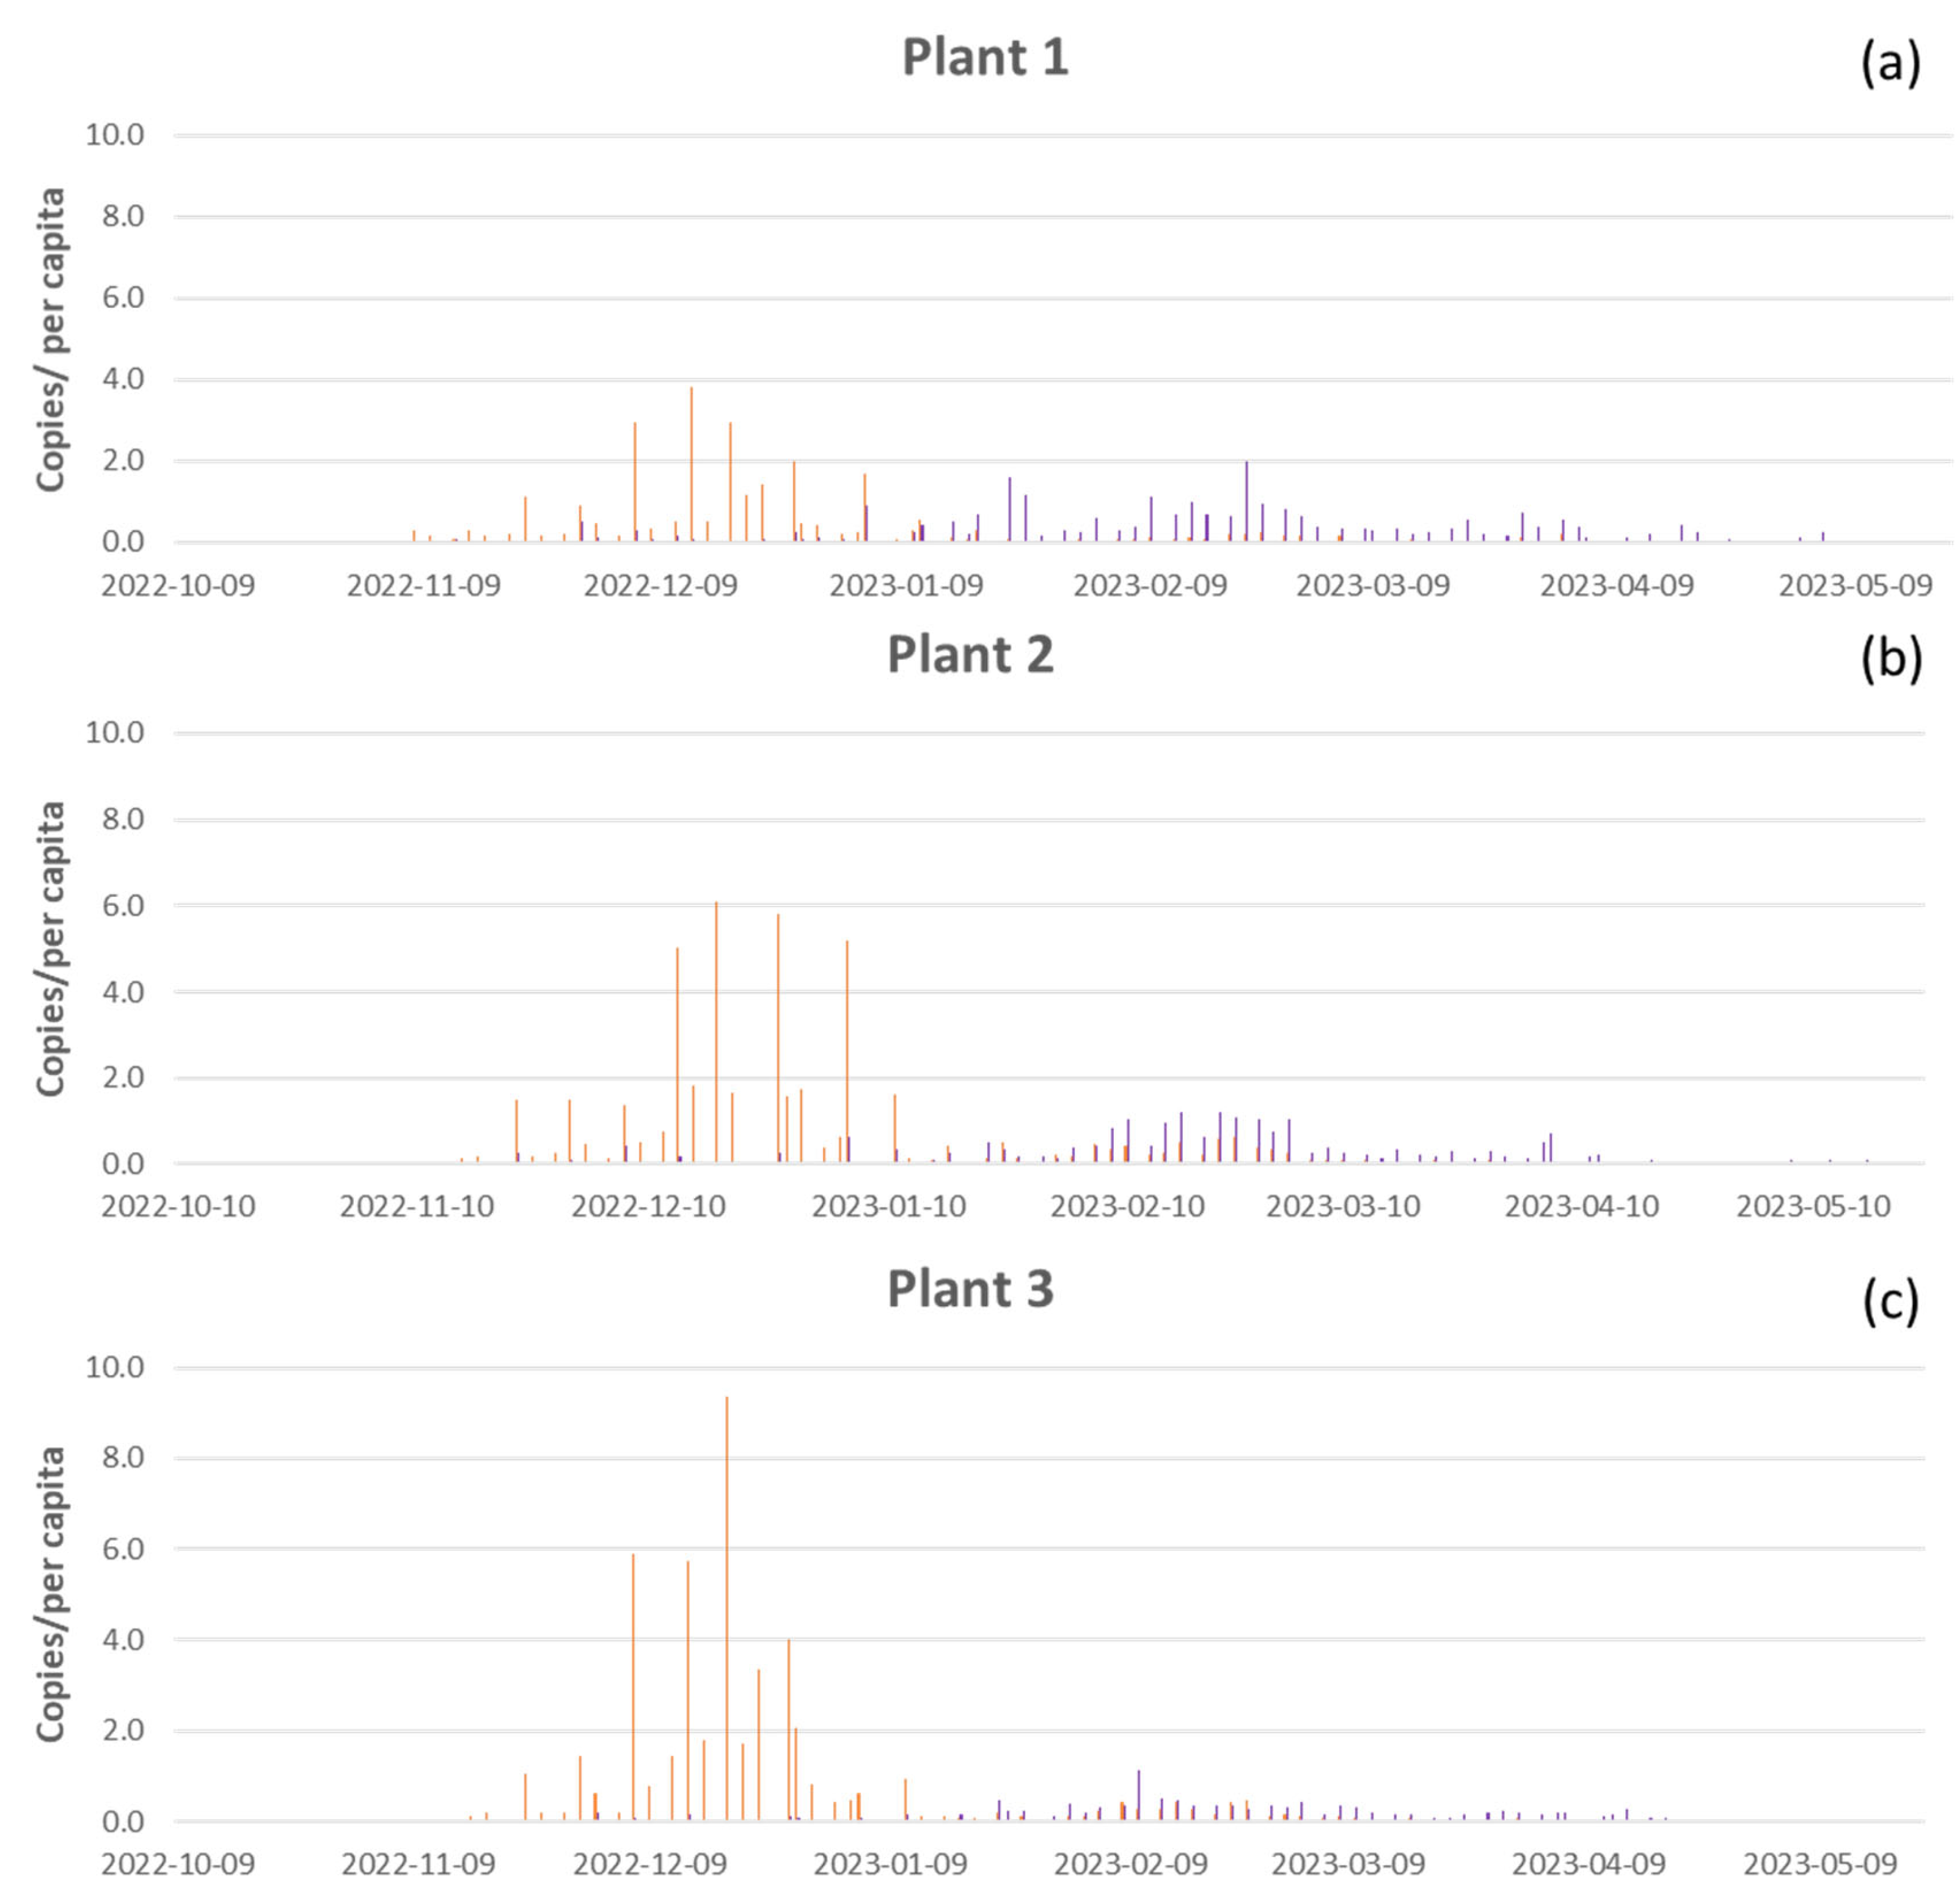
As shown in
Figure 4, there were no significant differences in load of influenza viruses RNA between the three WWTPs (Kruskal-Wallis test, influenza A p-value =0.6, influenza B p-value = 0.08). During the monitoring period, we detected a mean of 0.25 copies/per capita of influenza A and 0.23 copies/per capita of influenza B in Plant 1; 0.42 copies/per capita of influenza A and 0.19 copies/per capita of influenza B in Plant 2; and 0.46 copies/per capita of influenza A and 0.11 copies/per capita of influenza B in Plant 3. The higher concentration of influenza A (9.3 copies/per capita) was reached in Plant 3 in mid-December 2022 (
Figure 4c), followed by Plant 2 with 6.1 copies/per capita (
Figure 4b), and Pant 1 with 3.8 copies/per capita (
Figure 4a). Higher concentration of influenza B (2 copies/per capita) was reached in Plant 1 at the end of February 2023 (
Figure 4a), followed by Plant 2 with 1.2 copies/per capita (
Figure 4b), and in Plant 3 with 1.1 copies/per capita in mid-February (
Figure 4c).
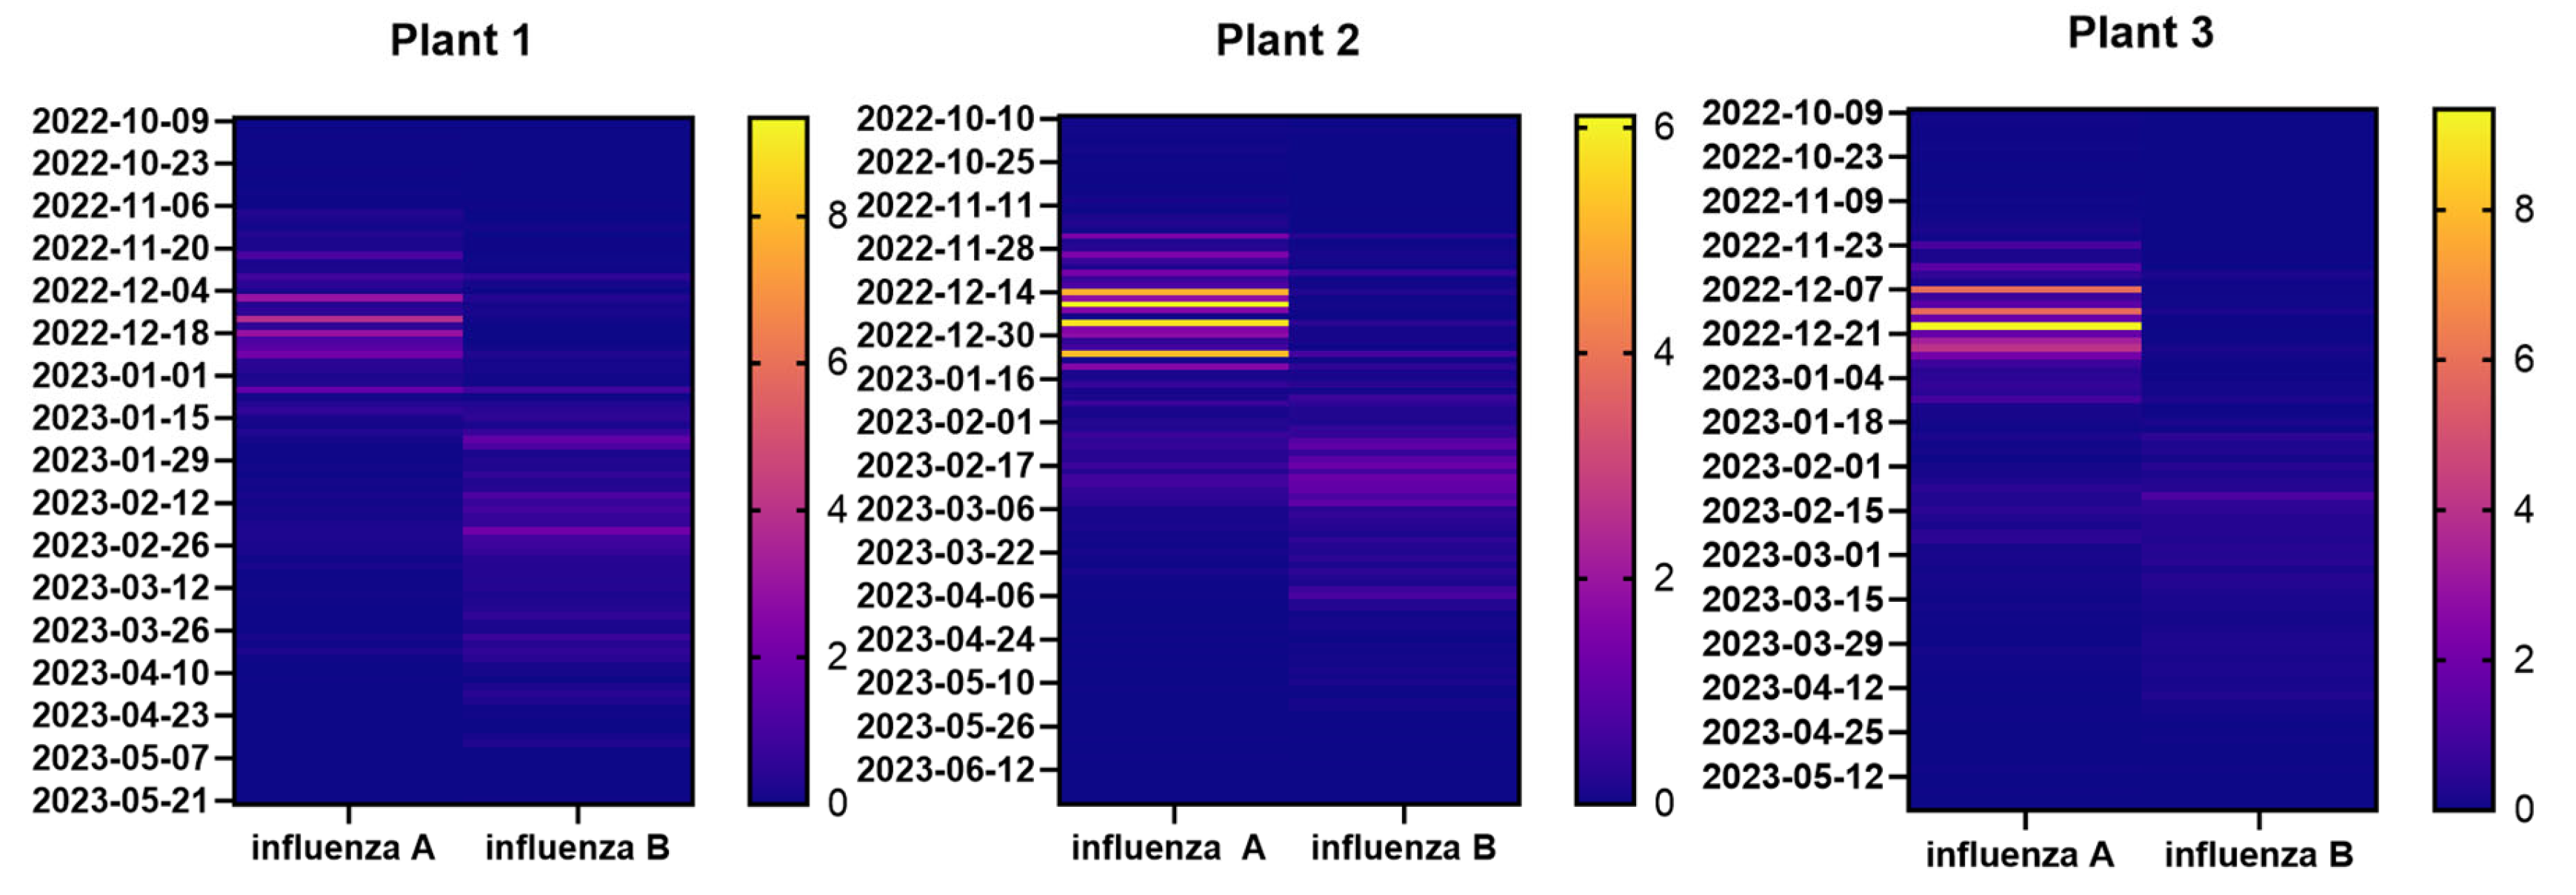
Heat maps shown in
Figure 5 highlight differences in the distribution of influenza A and B during the monitoring period (from October 2022 to June 2023). However, these differences were not significant (Mann-Whitney, p-value = 0.3 for Plant 1; p-value = 0.7 for Plant 2; p-value = 0.07 for Plant 3), it was clear that influenza A concentration was higher at the beginning of monitoring and decreased when influenza B started to be detected (
Figure 5 and
Table S2). Particularly, influenza A virus RNA load started to increase at the beginning of December 2022 until first days of January 2023 conversely influenza B virus RNA load started to increase in February 2023 until April 2013.
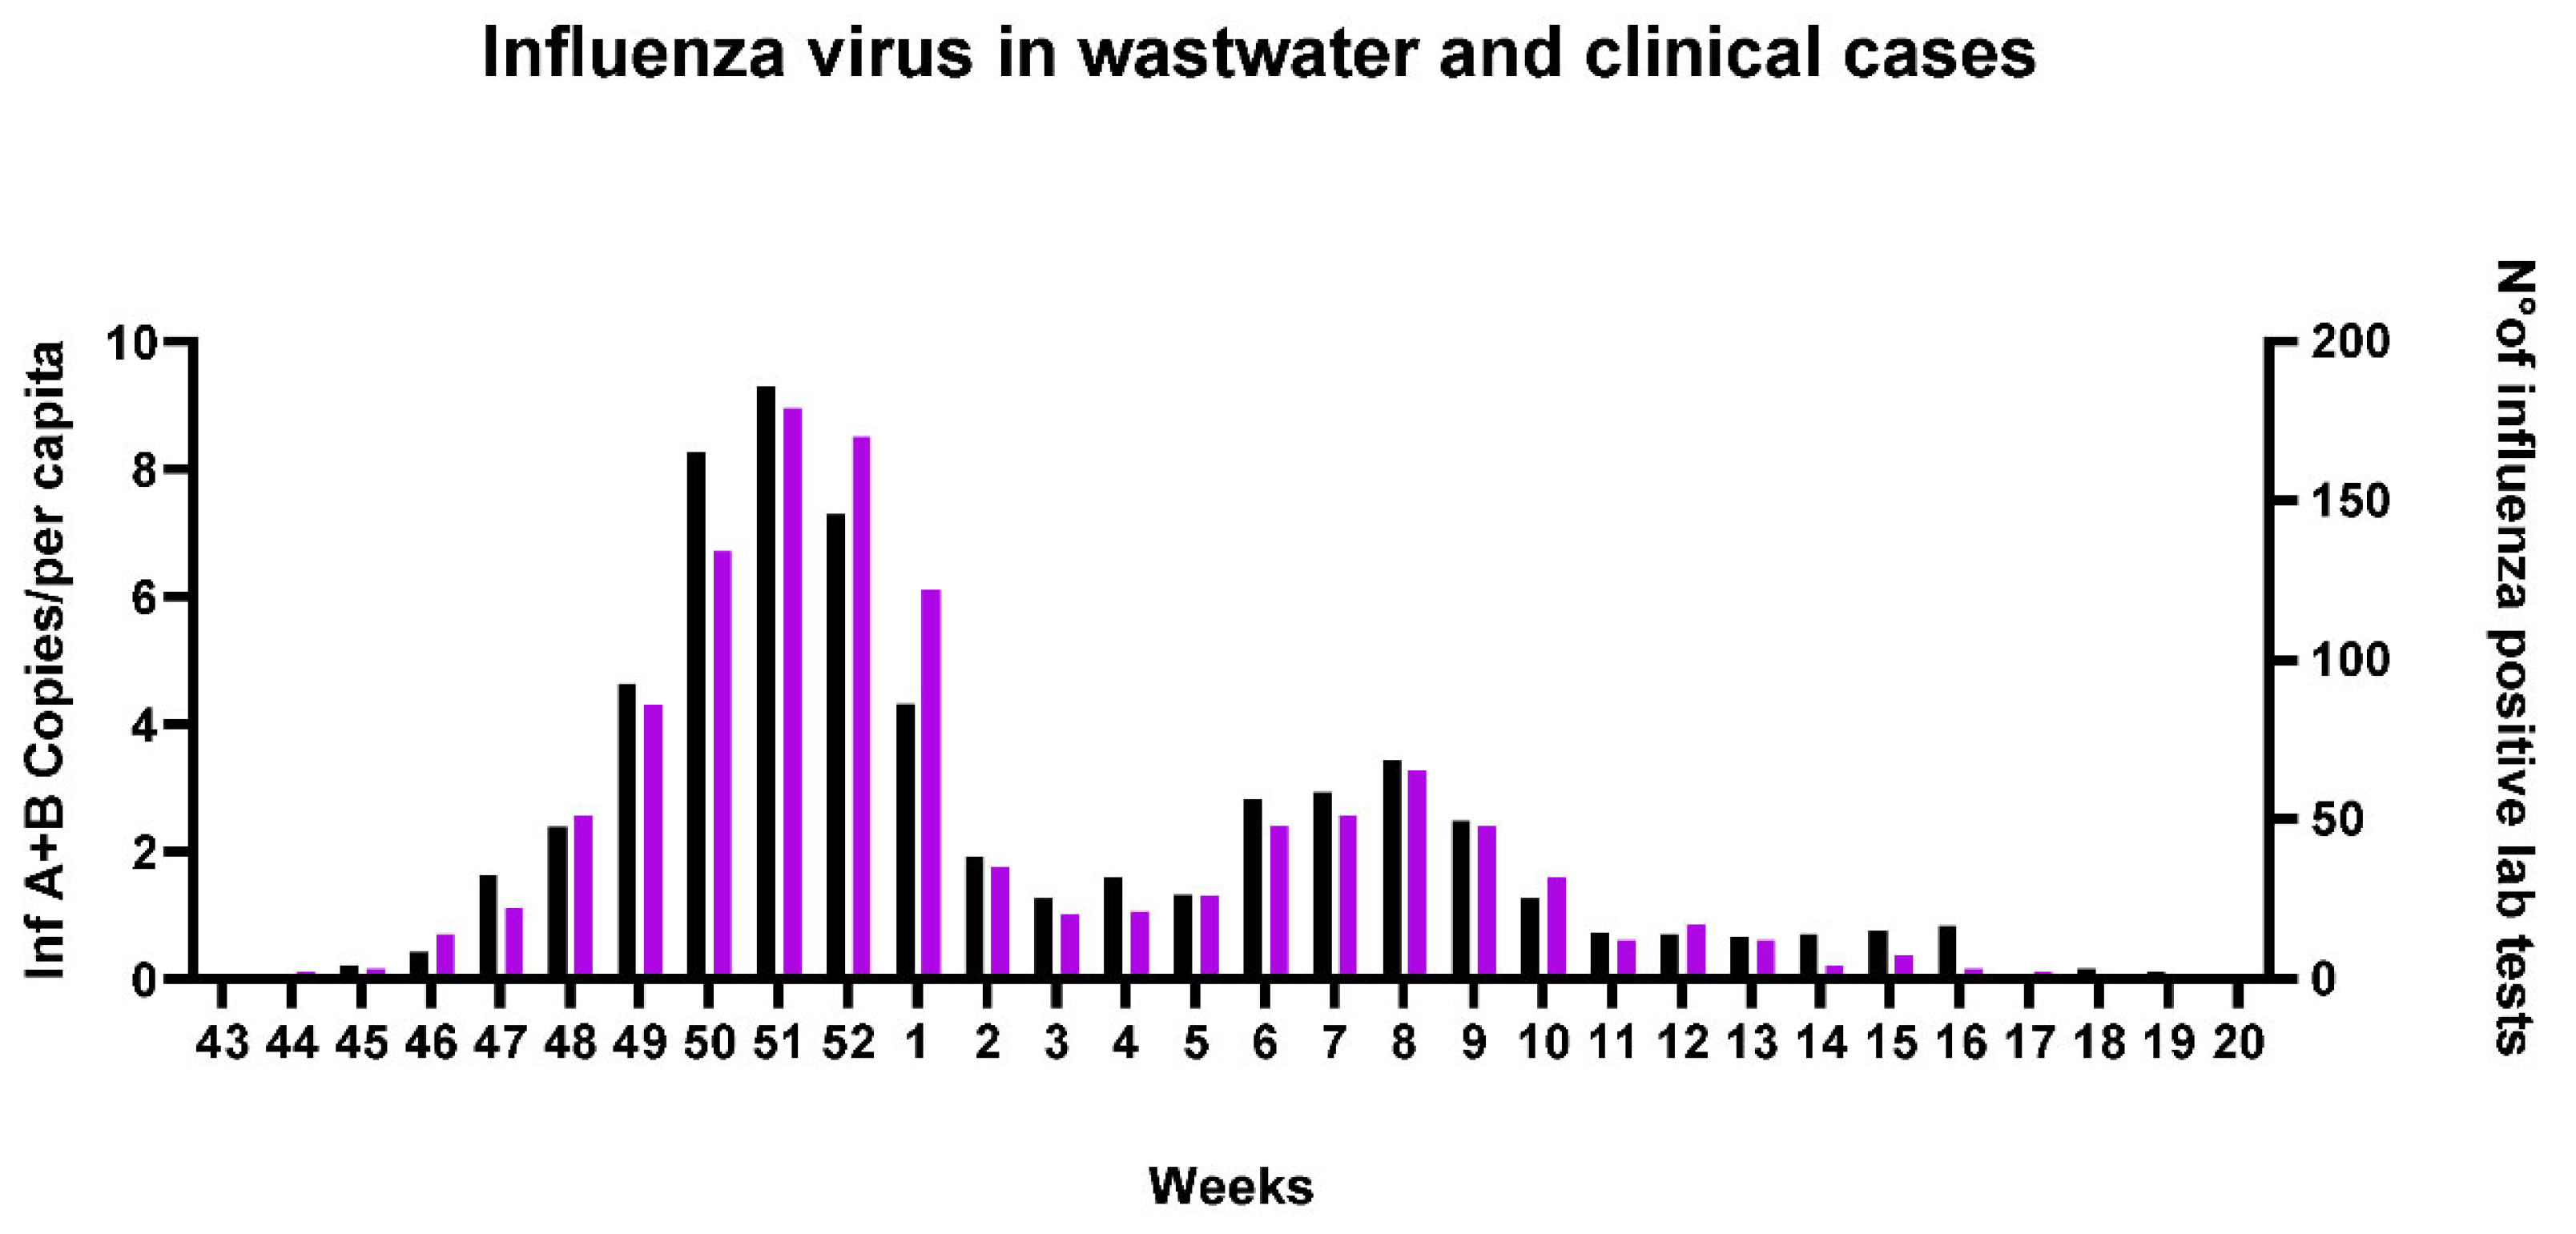
Clinical cases of influenza in Southern Switzerland were reported as total of inf A and B cases collected in a specific week. To correlate clinical data with concentration of viruses RNA in wastewater and since we had less data compared to SARS-Cov-2, we decided to sum up inf A and B concentration (copies/per capita) detected, in the corresponding week, in all plants (
Table S3). The data thus reported show a positive correlation with influenza viruses load in WW and clinical cases (spearman correlation, r 0.9 and p value < 0.0001), highlighting the two major peaks of infection in December 2022 and February 2023 (
Figure 6).
4. Discussion
This work demonstrated the presence, in different municipal wastewaters of Southern Switzerland, of the RNA of three respiratory viruses, the well-established influenza viruses (A and B) and the new pandemic SARS-CoV-2. SARS-CoV-2 RNA was detected, with high number of copies, in almost 99% of samples collected; unlike the influenza viruses that were less present and less abundant. Compared to other studies, where influenza B has not been often detected in wastewater as influenza A [
15,
17,
19,
26], we have not observed significant differences in RNA quantity of the two viruses.
The three wastewater treatment plants monitored covers about 37% of the population of Canton Ticino and had already been selected in a previous study that demonstrated, retrospectively, the presence of SARS-CoV-2 in Ticino’s wastewater in the early stages of the pandemic [
18]. Differently to this study, we monitored the situation in real-time during pandemic. Our results demonstrated the correlation between clinical cases and the presence of viruses in wastewater; nevertheless, seemed not to be predictive. With regard to correlation with SARS-CoV-2 in waste water and clinical cases, no differences were found between the three plants, differently to what observed by other authors for other cities [
27,
28,
29].
The study has revealed differences between the distribution of SARS-CoV-2 and influenza A and B in wastewater. SARS-CoV-2 remained detectable for almost the entire duration of monitoring, and peaks correlated with the increased clinical cases. In 2023, when the number of laboratory tests and self-testing swabs decreased, with a consequent decrease in reported clinical cases, SARS-CoV-2 RNA concentration persisted in wastewater, showing that COVID19 was still circulating in the population. Conversely, influenza A and B RNA concentration in WW were quantifiable only in correspondence with their typically Swiss seasonal waves of infection, with a change from A to B occurring in February 2023. Both for SARS-CoV-2 and influenza viruses, WW monitoring reflected the trend and the spread of the diseases.
We confirmed that the appropriate temperature of sample storage is 4°C and RNA stays stable for four days after collection, especially when RNA concentrations in WW decreases, as also previously highlighted [
30]. So, we were able to quantify the virus RNA the same day of collection or within four days, thus obtaining real time data. The technology of direct capture and concentration of TNA on silica resin avoided PCR inhibition and allowed an effective RNA extraction and purification as demonstrated by the detection of two quality controls (IAC and PMMoV).
Reliable and comparable results for a long-term trend evaluation were obtained by normalizing the data by the number of people served by each plant (per capita). Since environmental samples are influenced by many variables, data analysis could be improved considering, for example, the role of precipitation and flow rate of treatment plants. Other than that, the use of an effective detection method, giving a quick and clear answer, was crucial as clinical tests gradually disappeared.
5. Conclusions
Our findings confirmed that wastewater-based epidemiology (WBE) represents a powerful tool for evaluating the incidence of a disease in a population at large scale and can be applied for the detection of several viral pathogens. Different methods can be used for trend analyses and for studying correlations with clinical cases, according to the information to be obtained and depending on how the clinical data are collected. Although there were no standard methods to detect and quantify RNA of respiratory viruses in wastewater, WBE, alone or combined with clinical laboratory tests, could be used to inform authorities on the effectiveness of interventions to contain the spread of the diseases.
Supplementary Materials
The following supporting information can be downloaded at the website of this paper posted on Preprints.org, Table S1: number, location, date of collection, copies/L, and copies/per capita for all samples analyzed for the presence of N1 target specific for SARS-CoV-2; Table S2: Number, location, date of collection, copies/L and copies/per capita for all samples analyzed for the presence of influenza A and B targets (M and NS); Table S3: Sum of influenza A and B concentration in wastewater detected in all plants in the same weeks in which clinical data were collected. Last column reports numbers of laboratory tests positive for influenza in Canton of Ticino.
Author Contributions
writing—draft preparation, Federica Mauri; methodology and sample analyses, AnnaPaola Caminada, Elisa Pianta, Giulia Zezza; review and editing, Valeria Guidi, Elisa Pianta, Mauro Tonolla; project conceptualization, Federica Mauri and Valeria Guidi. All authors have read and agreed to the published version of the manuscript.
Funding
This research was funded by Department of Health and Social Affairs of Canton Ticino (Cantonal Doctor Office) and by Federal Office of Public Health (FOPH).
Data Availability Statement
The data presented in this study are available in supplementary material. Additional information is available on request from the corresponding author.
Acknowledgments
we thank the Department of territory of Canton Ticino and the WWTPs administrators and operators for their managing and support in collecting samples. Thanks to Camilla Perego, Roger Konig, Francesco Di Nezio and Nikoleta Anicic for the transport of samples to the laboratory; thanks to Nikoleta Anicic for creating the Swiss map.
Conflicts of Interest
The authors declare no conflict of interest.
References
- WHO, COVID 19 Public Health Emergency of International Concern (PHEIC), 2020. https://www.who.int/publications/m/item/covid-19-public-health-emergency-of-international-concern-(pheic)-global-research-and-innovation-forum.
- B. Hu, H. Guo, P. Zhou, Z.L. Shi, Characteristics of SARS-CoV-2 and COVID-19, Nat. Rev. Microbiol. 19 (2021) 141–154. [CrossRef]
- T.C. Jones, G. Biele, B. Mühlemann, T. Veith, J. Schneider, J. Beheim-Schwarzbach, T. Bleicker, J. Tesch, M.L. Schmidt, L.E. Sander, F. Kurth, P. Menzel, R. Schwarzer, M. Zuchowski, J. Hofmann, A. Krumbholz, A. Stein, A. Edelmann, V.M. Corman, C. Drosten, Estimating infectiousness throughout SARS-CoV-2 infection course, Science (80-. ). 373 (2021). [CrossRef]
- National Institutes of Health, Treatment Guidelines Panel. Coronavirus Disease 2019 (COVID-19), 2021. https://www.covid19treatmentguidelines.nih.gov/.
- E.A. Meyerowitz, A. Richterman, R.T. Gandhi, P.E. Sax, Transmission of sars-cov-2: A review of viral, host, and environmental factors, Ann. Intern. Med. 174 (2021) 69–79. [CrossRef]
- W. Punpanich, T. Chotpitayasunondh, A review on the clinical spectrum and natural history of human influenza, Int. J. Infect. Dis. 16 (2012) e714–e723. [CrossRef]
- L.M. Tsybalova, L.A. Stepanova, E.S. Ramsay, A. V. Vasin, Influenza B: Prospects for the Development of Cross-Protective Vaccines, Viruses 14 (2022) 1–23. [CrossRef]
- Havasi, S. Visan, C. Cainap, S.S. Cainap, A.A. Mihaila, L.A. Pop, Influenza A, Influenza B, and SARS-CoV-2 Similarities and Differences – A Focus on Diagnosis, Front. Microbiol. 13 (2022) 1–22. [CrossRef]
- Y. Geng, Y. Wang, Stability and transmissibility of SARS-CoV-2 in the environment, J. Med. Virol. 95 (2023). [CrossRef]
- F. Miura, M. Kitajima, R. Omori, Duration of SARS-CoV-2 viral shedding in faeces as a parameter for wastewater-based epidemiology: Re-analysis of patient data using a shedding dynamics model, Sci. Total Environ. 769 (2021) 144549. [CrossRef]
- P. Foladori, F. Cutrupi, N. Segata, S. Manara, F. Pinto, F. Malpei, L. Bruni, G. La Rosa, SARS-CoV-2 from faeces to wastewater treatment: What do we know? A review, Sci. Total Environ. 743 (2020) 140444. [CrossRef]
- E.S. Amirian, Potential fecal transmission of SARS-CoV-2: Current evidence and implications for public health, Int. J. Infect. Dis. 95 (2020) 363–370. [CrossRef]
- H.A. Al Khatib, P. V. Coyle, M.A. Al Maslamani, A.A. Al Thani, S.A. Pathan, H.M. Yassine, Molecular and biological characterization of influenza A viruses isolated from human fecal samples, Infect. Genet. Evol. 93 (2021) 104972. [CrossRef]
- M.C.W. Chan, P.K.S.C. Nelson Lee, J.J.Y.S. K.F. To, Rity Y.K. Wong, Wing-Shan Ho, Karry L.K. Ngai, Seasonal influenza a virus in feces of hospitalized adults, Emerg. Infect. Dis. 17 (2011) 2038–2042.
- E. Mercier, P.M. D’Aoust, O. Thakali, N. Hegazy, J.J. Jia, Z. Zhang, W. Eid, J. Plaza-Diaz, M.P. Kabir, W. Fang, A. Cowan, S.E. Stephenson, L. Pisharody, A.E. MacKenzie, T.E. Graber, S. Wan, R. Delatolla, Municipal and neighbourhood level wastewater surveillance and subtyping of an influenza virus outbreak, Sci. Rep. 12 (2022) 1–11. [CrossRef]
- F. Mauri, A. Oppliger, A. Laffite, I. Microbiologia, Literature screening report Wastewater-based surveillance of SARS-CoV-2 to help public health decision-making : unravelling the extend of the network and outcomes, 2022.
- A.B. Boehm, B. Hughes, D. Duong, V. Chan-Herur, A. Buchman, M.K. Wolfe, B.J. White, Wastewater concentrations of human influenza, metapneumovirus, parainfluenza, respiratory syncytial virus, rhinovirus, and seasonal coronavirus nucleic-acids during the COVID-19 pandemic: a surveillance study, The Lancet Microbe 4 (2023) e340–e348. [CrossRef]
- F. Cariti, A. Tuñas Corzon, X. Fernandez-Cassi, P. Ganesanandamoorthy, C. Ort, T.R. Julian, T. Kohn, Wastewater Reveals the Spatiotemporal Spread of SARS-CoV-2 in the Canton of Ticino (Switzerland) during the Onset of the COVID-19 Pandemic, ACS ES T Water 2 (2022) 2194–2200. [CrossRef]
- S. Nadeau, A.J. Devaux, C. Bagutti, M. Alt, E.I. Hampe, M. Kraus, E. Würfel, K.N. Koch, S. Fuchs, S. Tschudin-Sutter, A. Holschneider, C. Ort, C. Chen, J.S. Huisman, T.R. Julian, T. Stadler, Influenza transmission dynamics quantified from RNA in wastewater in Switzerland, Swiss Med. Wkly. 154 (2024). [CrossRef]
- R. Markt, M. Mayr, E. Peer, A.O. Wagner, N. Lackner, H. Insam, R. Markt, Detection and stability of SARS-CoV-2 fragments in wastewater: Impact of storage temperature, MedRxiv (2021).
- W. Ahmed, P.M. Bertsch, K. Bibby, E. Haramoto, J. Hewitt, F. Huygens, P. Gyawali, A. Korajkic, S. Riddell, S.P. Sherchan, S.L. Simpson, K. Sirikanchana, E.M. Symonds, R. Verhagen, S.S. Vasan, M. Kitajima, A. Bivins, Decay of SARS-CoV-2 and surrogate murine hepatitis virus RNA in untreated wastewater to inform application in wastewater-based epidemiology, Environ. Res. 191 (2020). [CrossRef]
- X. Zheng, Y. Deng, X. Xu, S. Li, Y. Zhang, J. Ding, H.Y. On, J.C.C. Lai, C. In Yau, A.W.H. Chin, L.L.M. Poon, H.M. Tun, T. Zhang, Comparison of virus concentration methods and RNA extraction methods for SARS-CoV-2 wastewater surveillance, Sci. Total Environ. 824 (2022) 153687. [CrossRef]
- Sakarovitch, O. Schlosser, S. Courtois, C. Proust-Lima, J. Couallier, A. Pétrau, X. Litrico, J.F. Loret, Monitoring of SARS-CoV-2 in wastewater: what normalisation for improved understanding of epidemic trends?, J. Water Health 20 (2022) 712–726. [CrossRef]
- S. Mondal, N. Feirer, M. Brockman, M.A. Preston, S.J. Teter, D. Ma, S.A. Goueli, S. Moorji, B. Saul, J.J. Cali, A direct capture method for purification and detection of viral nucleic acid enables epidemiological surveillance of SARS-CoV-2, Sci. Total Environ. 795 (2021) 148834. [CrossRef]
- Shu, M.K. Kirby, W.G. Davis, C. Warnes, J. Liddell, J. Liu, K.H. Wu, N. Hassell, A.J. Benitez, M.M. Wilson, M.W. Keller, B.L. Rambo-Martin, Y. Camara, J. Winter, R.J. Kondor, B. Zhou, S. Spies, L.E. Rose, J.M. Winchell, B.M. Limbago, D.E. Wentworth, J.R. Barnes, Multiplex real-time reverse transcription PCR for influenza a virus, influenza b virus, and severe acute respiratory syndrome coronavirus 2, Emerg. Infect. Dis. 27 (2021) 1821–1830. [CrossRef]
- Toribio-Avedillo, C. Gómez-Gómez, L. Sala-Comorera, L. Rodríguez-Rubio, A. Carcereny, D. García-Pedemonte, R.M. Pintó, S. Guix, B. Galofré, A. Bosch, S. Merino, M. Muniesa, Monitoring influenza and respiratory syncytial virus in wastewater. Beyond COVID-19, Sci. Total Environ. 892 (2023). [CrossRef]
- R.H. Holm, A. Mukherjee, J.P. Rai, R.A. Yeager, D. Talley, S.N. Rai, A. Bhatnagar, T. Smith, SARS-CoV-2 RNA abundance in wastewater as a function of distinct urban sewershed size, Environ. Sci. Water Res. Technol. 8 (2022) 807–819. [CrossRef]
- M. Rusiñol, I. Zammit, M. Itarte, E. Forés, S. Martínez-Puchol, R. Girones, C. Borrego, L. Corominas, S. Bofill-Mas, Monitoring waves of the COVID-19 pandemic: Inferences from WWTPs of different sizes, Sci. Total Environ. 787 (2021). [CrossRef]
- M. Nagarkar, S.P. Keely, M. Jahne, E. Wheaton, C. Hart, B. Smith, J. Garland, E.A. Varughese, A. Braam, B. Wiechman, B. Morris, N.E. Brinkman, SARS-CoV-2 monitoring at three sewersheds of different scales and complexity demonstrates distinctive relationships between wastewater measurements and COVID-19 case data, Sci. Total Environ. 816 (2022) 151534. [CrossRef]
- Y. Qiu, J. Yu, K. Pabbaraju, B.E. Lee, T. Gao, N.J. Ashbolt, S.E. Hrudey, M. Diggle, G. Tipples, R. Maal-Bared, X. Pang, Validating and optimizing the method for molecular detection and quantification of SARS-CoV-2 in wastewater, Sci. Total Environ. 812 (2022). [CrossRef]
|
Disclaimer/Publisher’s Note: The statements, opinions and data contained in all publications are solely those of the individual author(s) and contributor(s) and not of MDPI and/or the editor(s). MDPI and/or the editor(s) disclaim responsibility for any injury to per capita or property resulting from any ideas, methods, instructions or products referred to in the content. |
© 2024 by the authors. Licensee MDPI, Basel, Switzerland. This article is an open access article distributed under the terms and conditions of the Creative Commons Attribution (CC BY) license (http://creativecommons.org/licenses/by/4.0/).

