Submitted:
10 October 2024
Posted:
11 October 2024
You are already at the latest version
Abstract

Keywords:
1. Introduction
2. Materials and Methods
2.2. Starting Materials
2.2. Equipment
2.3. AC Preparation
- -
- Physical activation (ACPhys)
- -
- Chemical-physical activation (ACPhys-Chem)
2.4. AC Disc Electrode Preparation
2.5. Electrochemical Methods
3. Results
- -
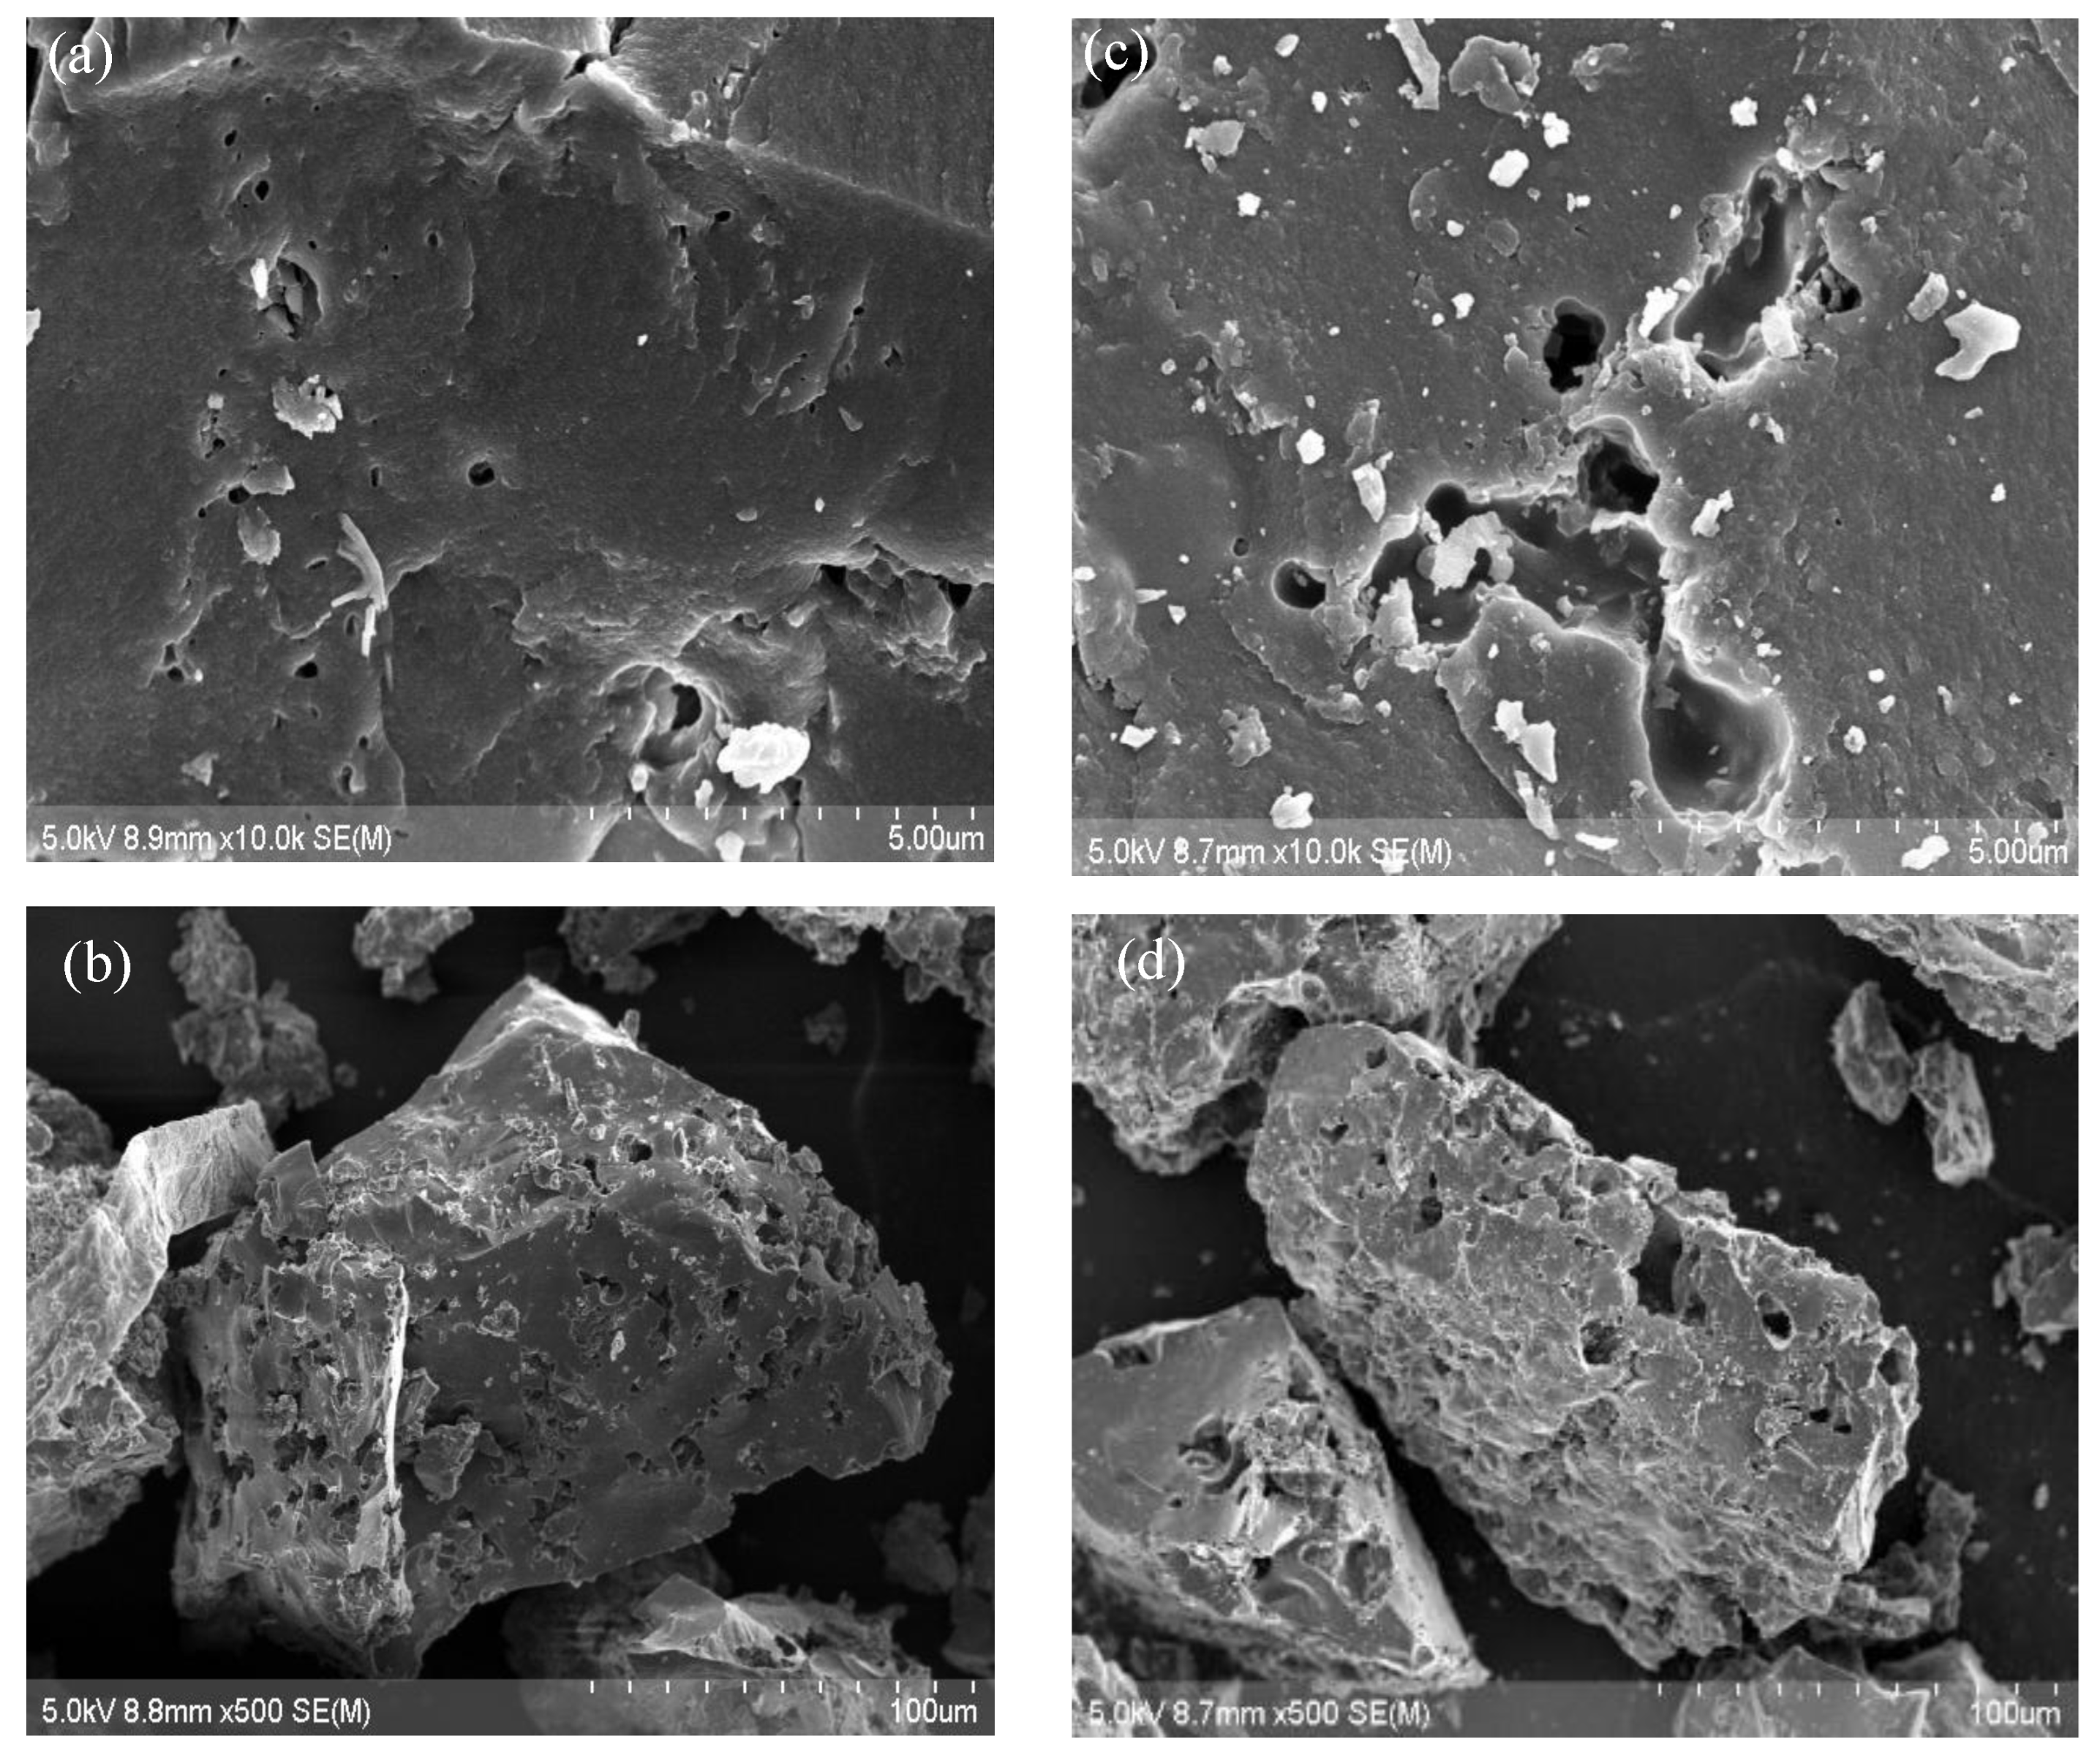
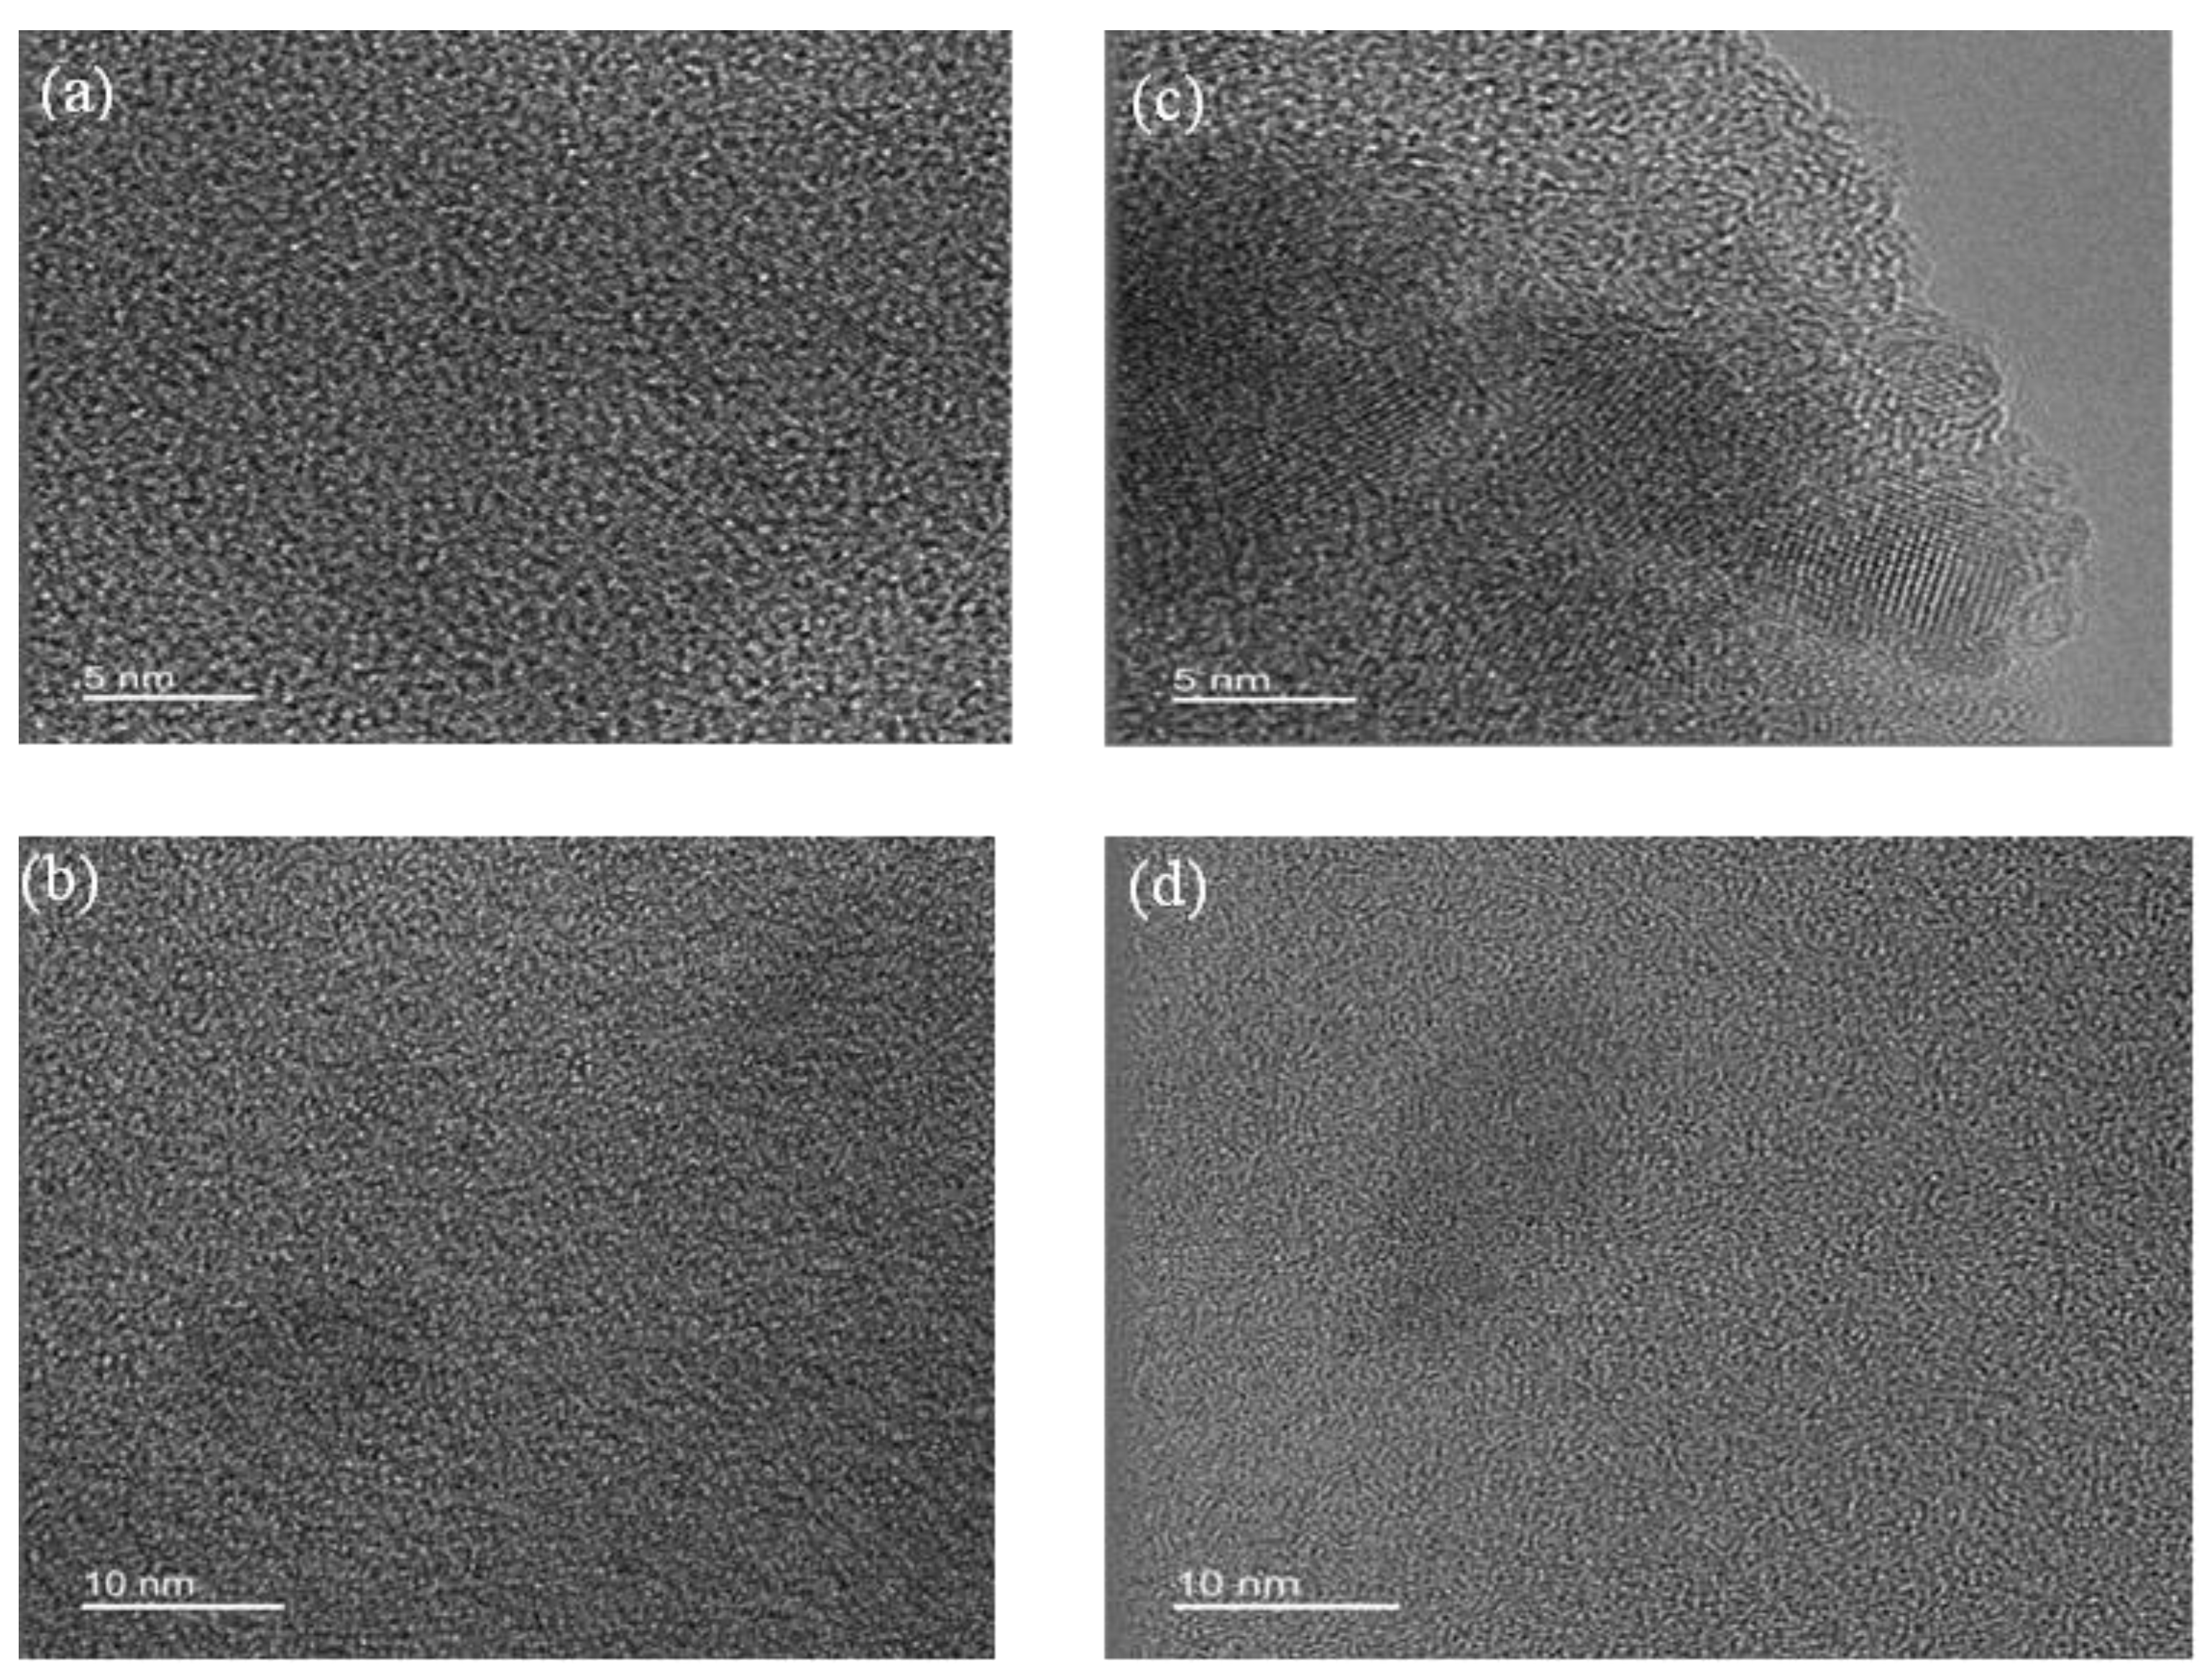
- AC disc characterization AC Morphology
- -
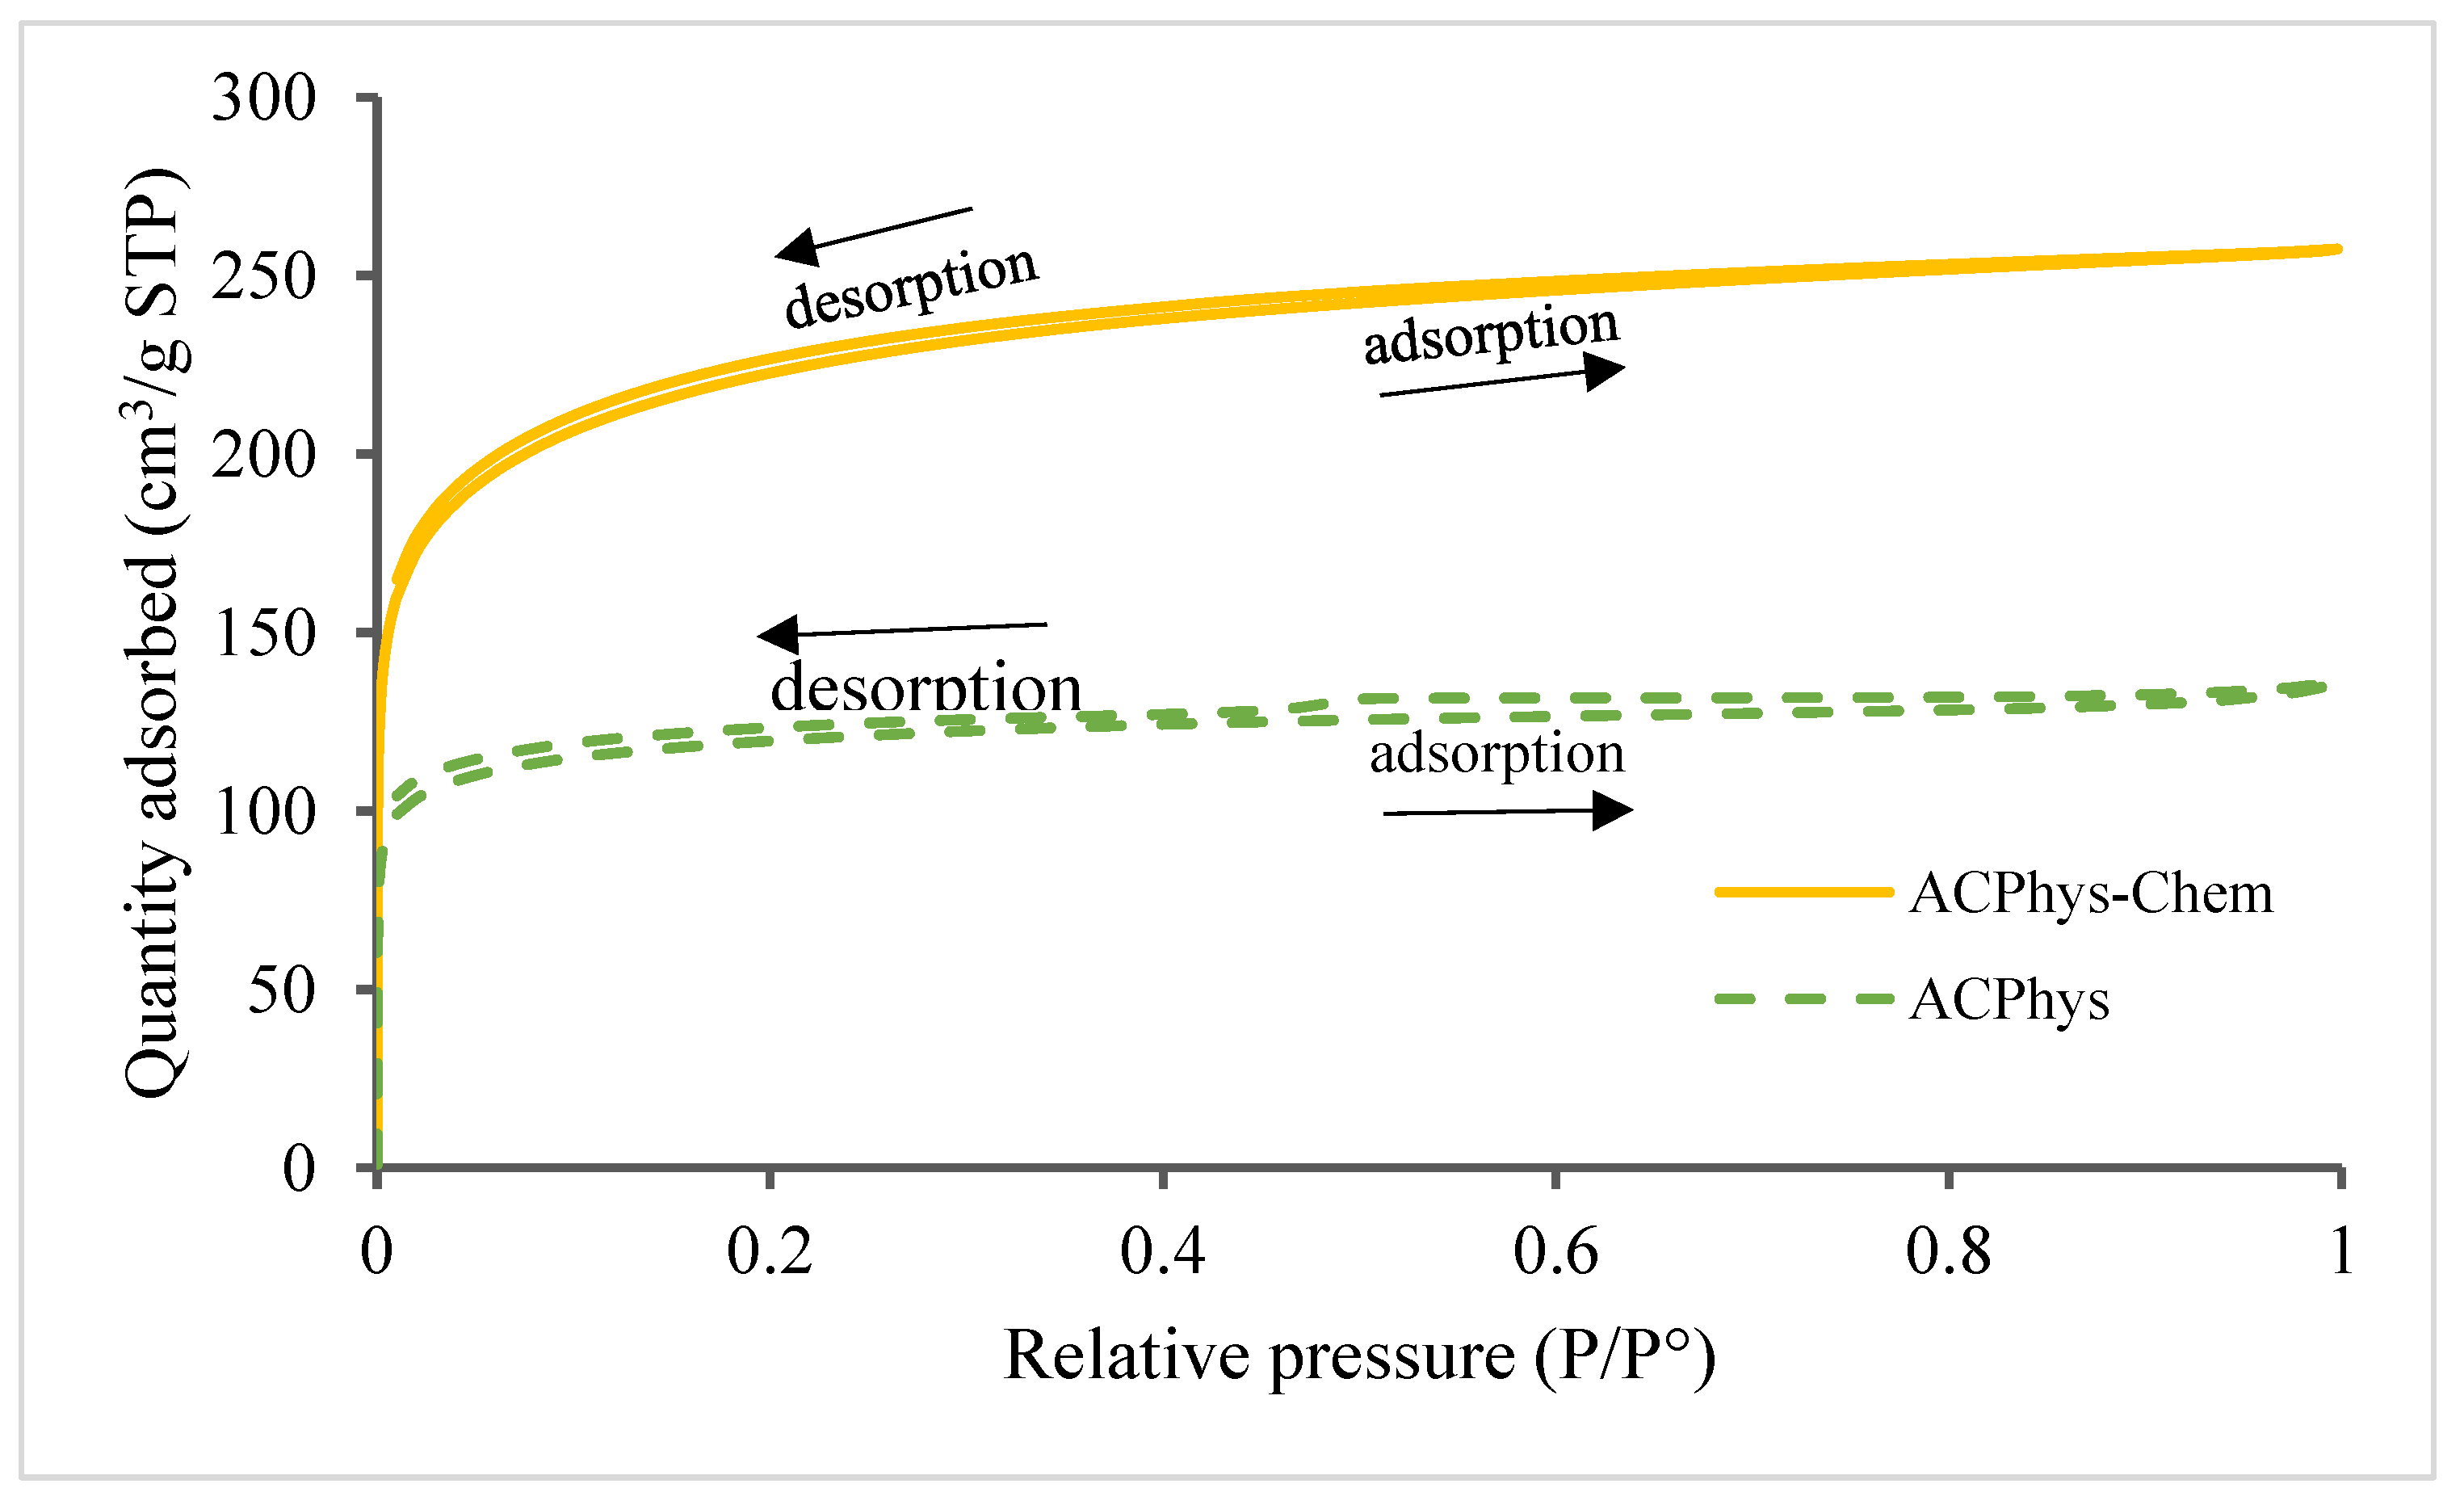
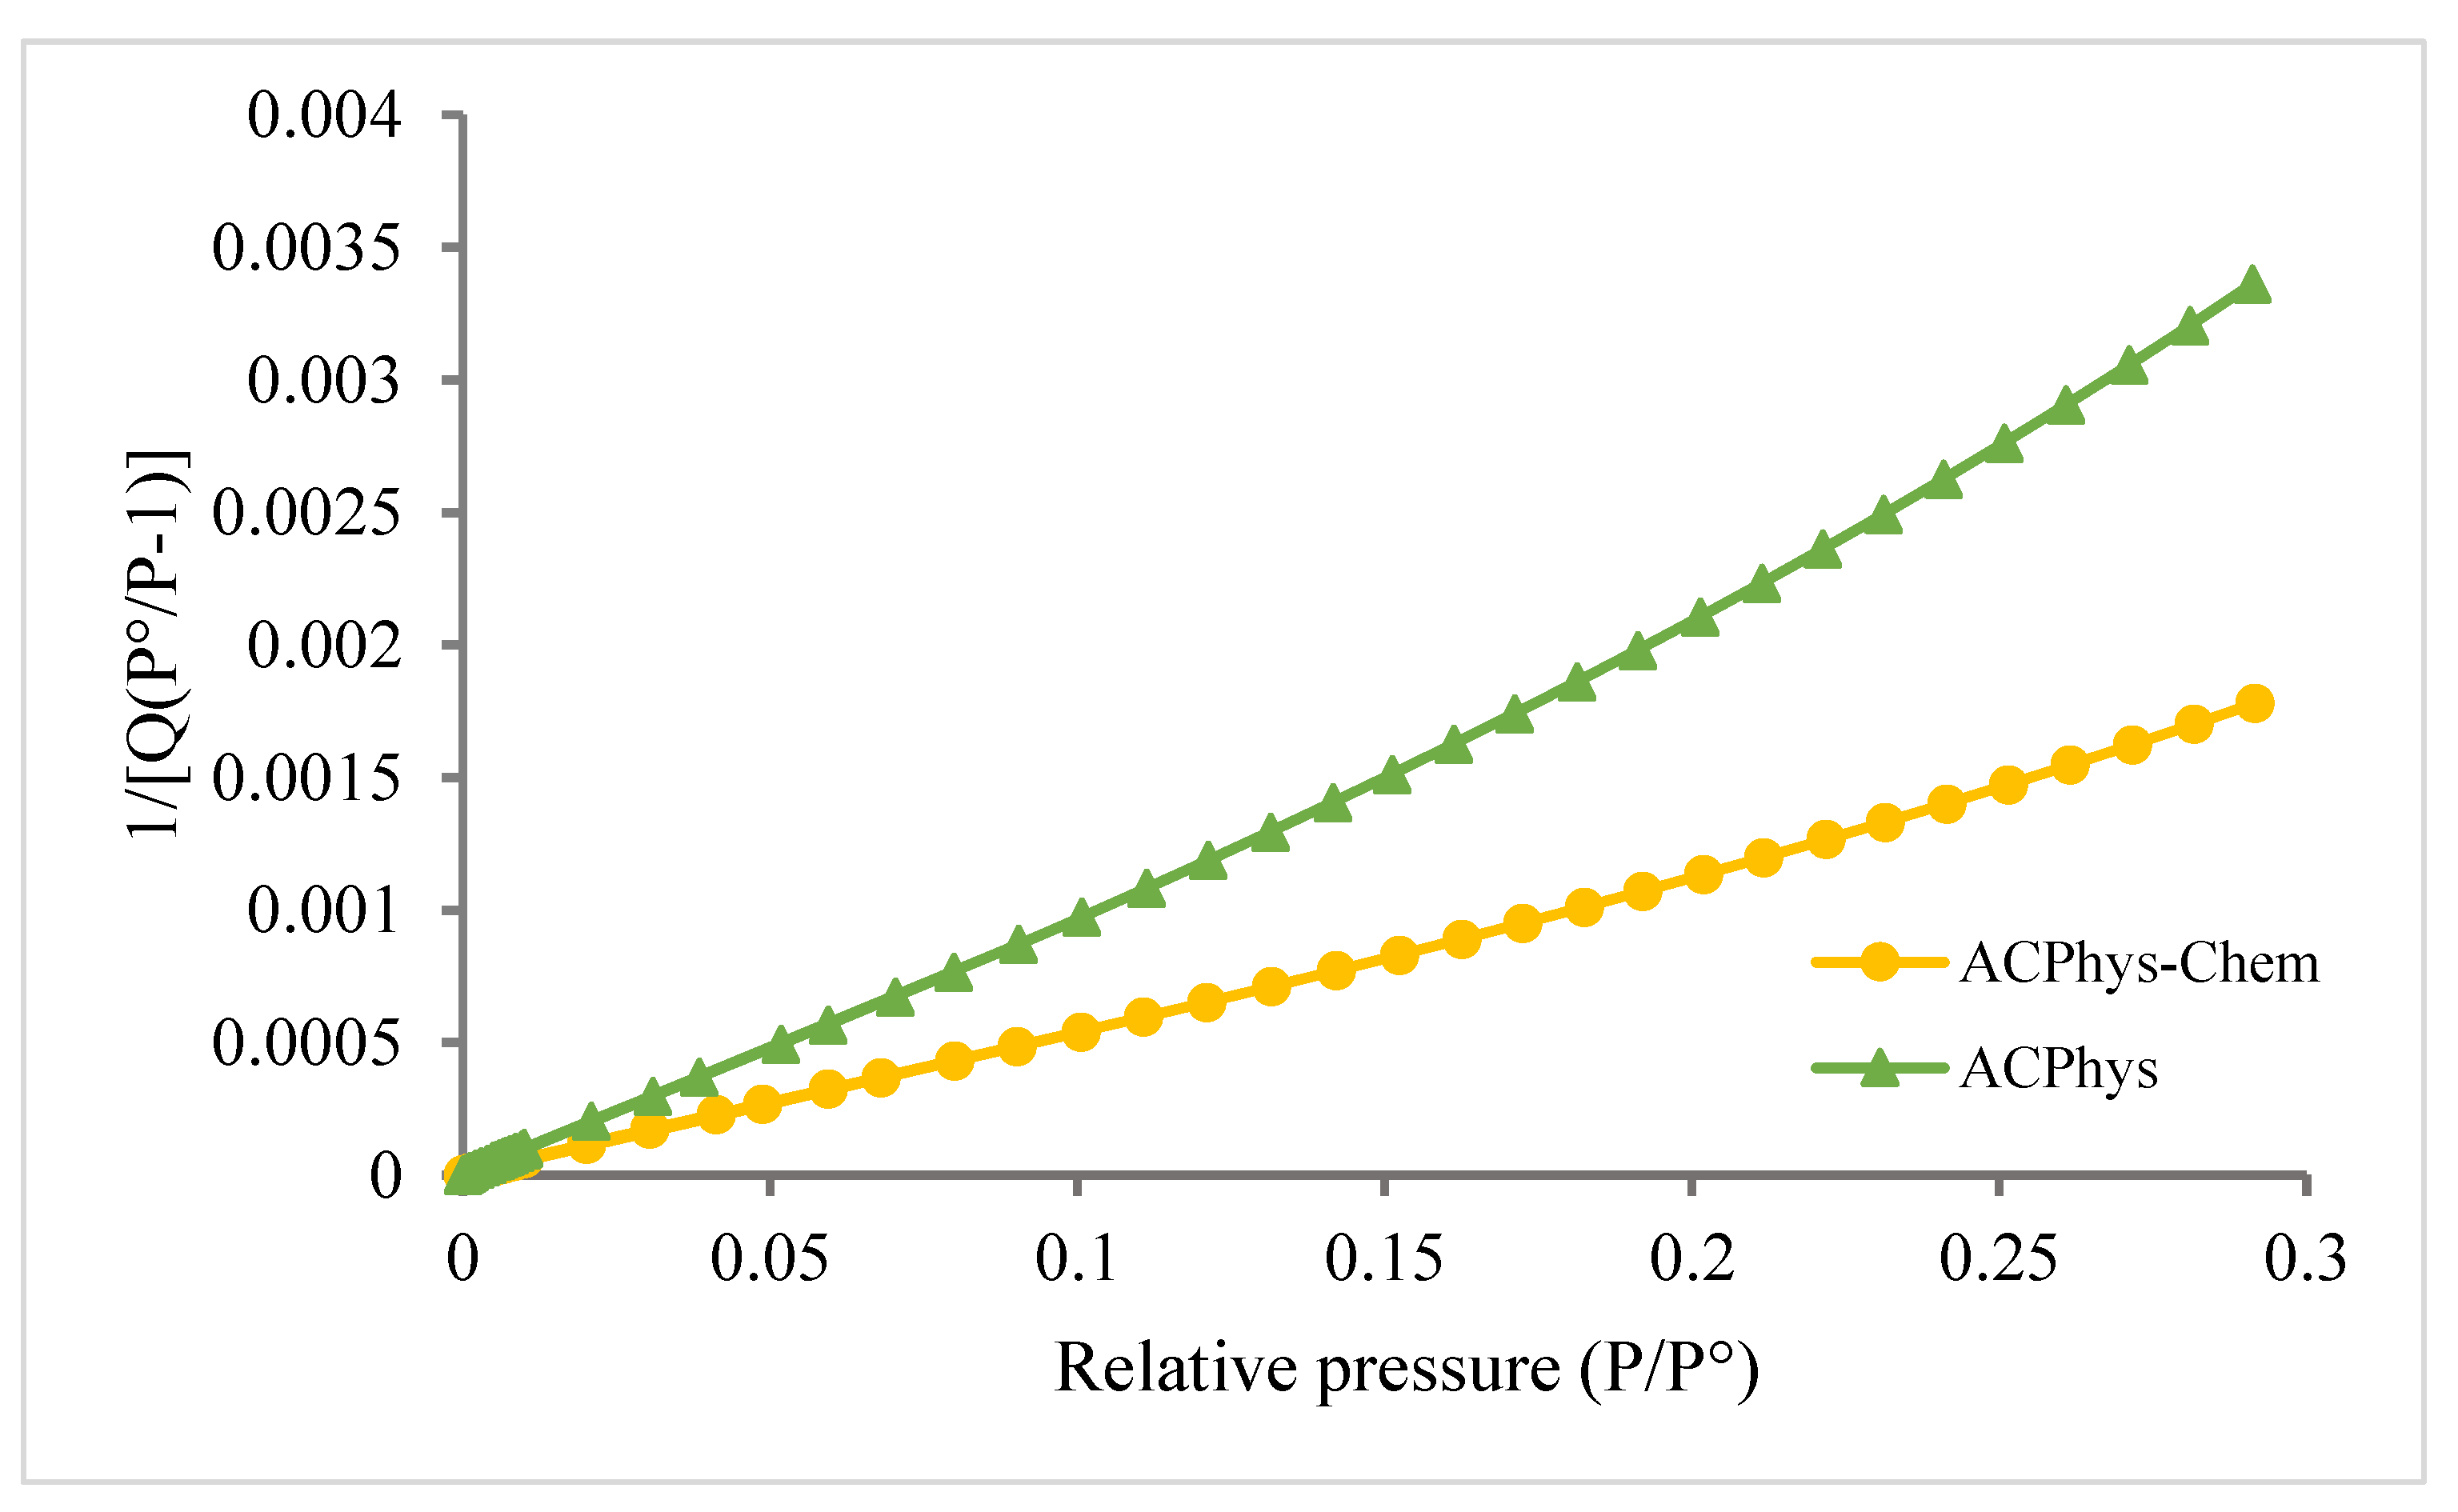
- AC porosity
- -
- Pore size distribution by the BJH method
- -
- Increasing specific-surface area
- -
- Reducing spacing between ions and electrode surfaces.
- -
- Pore size distribution by the (HJ) t-plot
- -
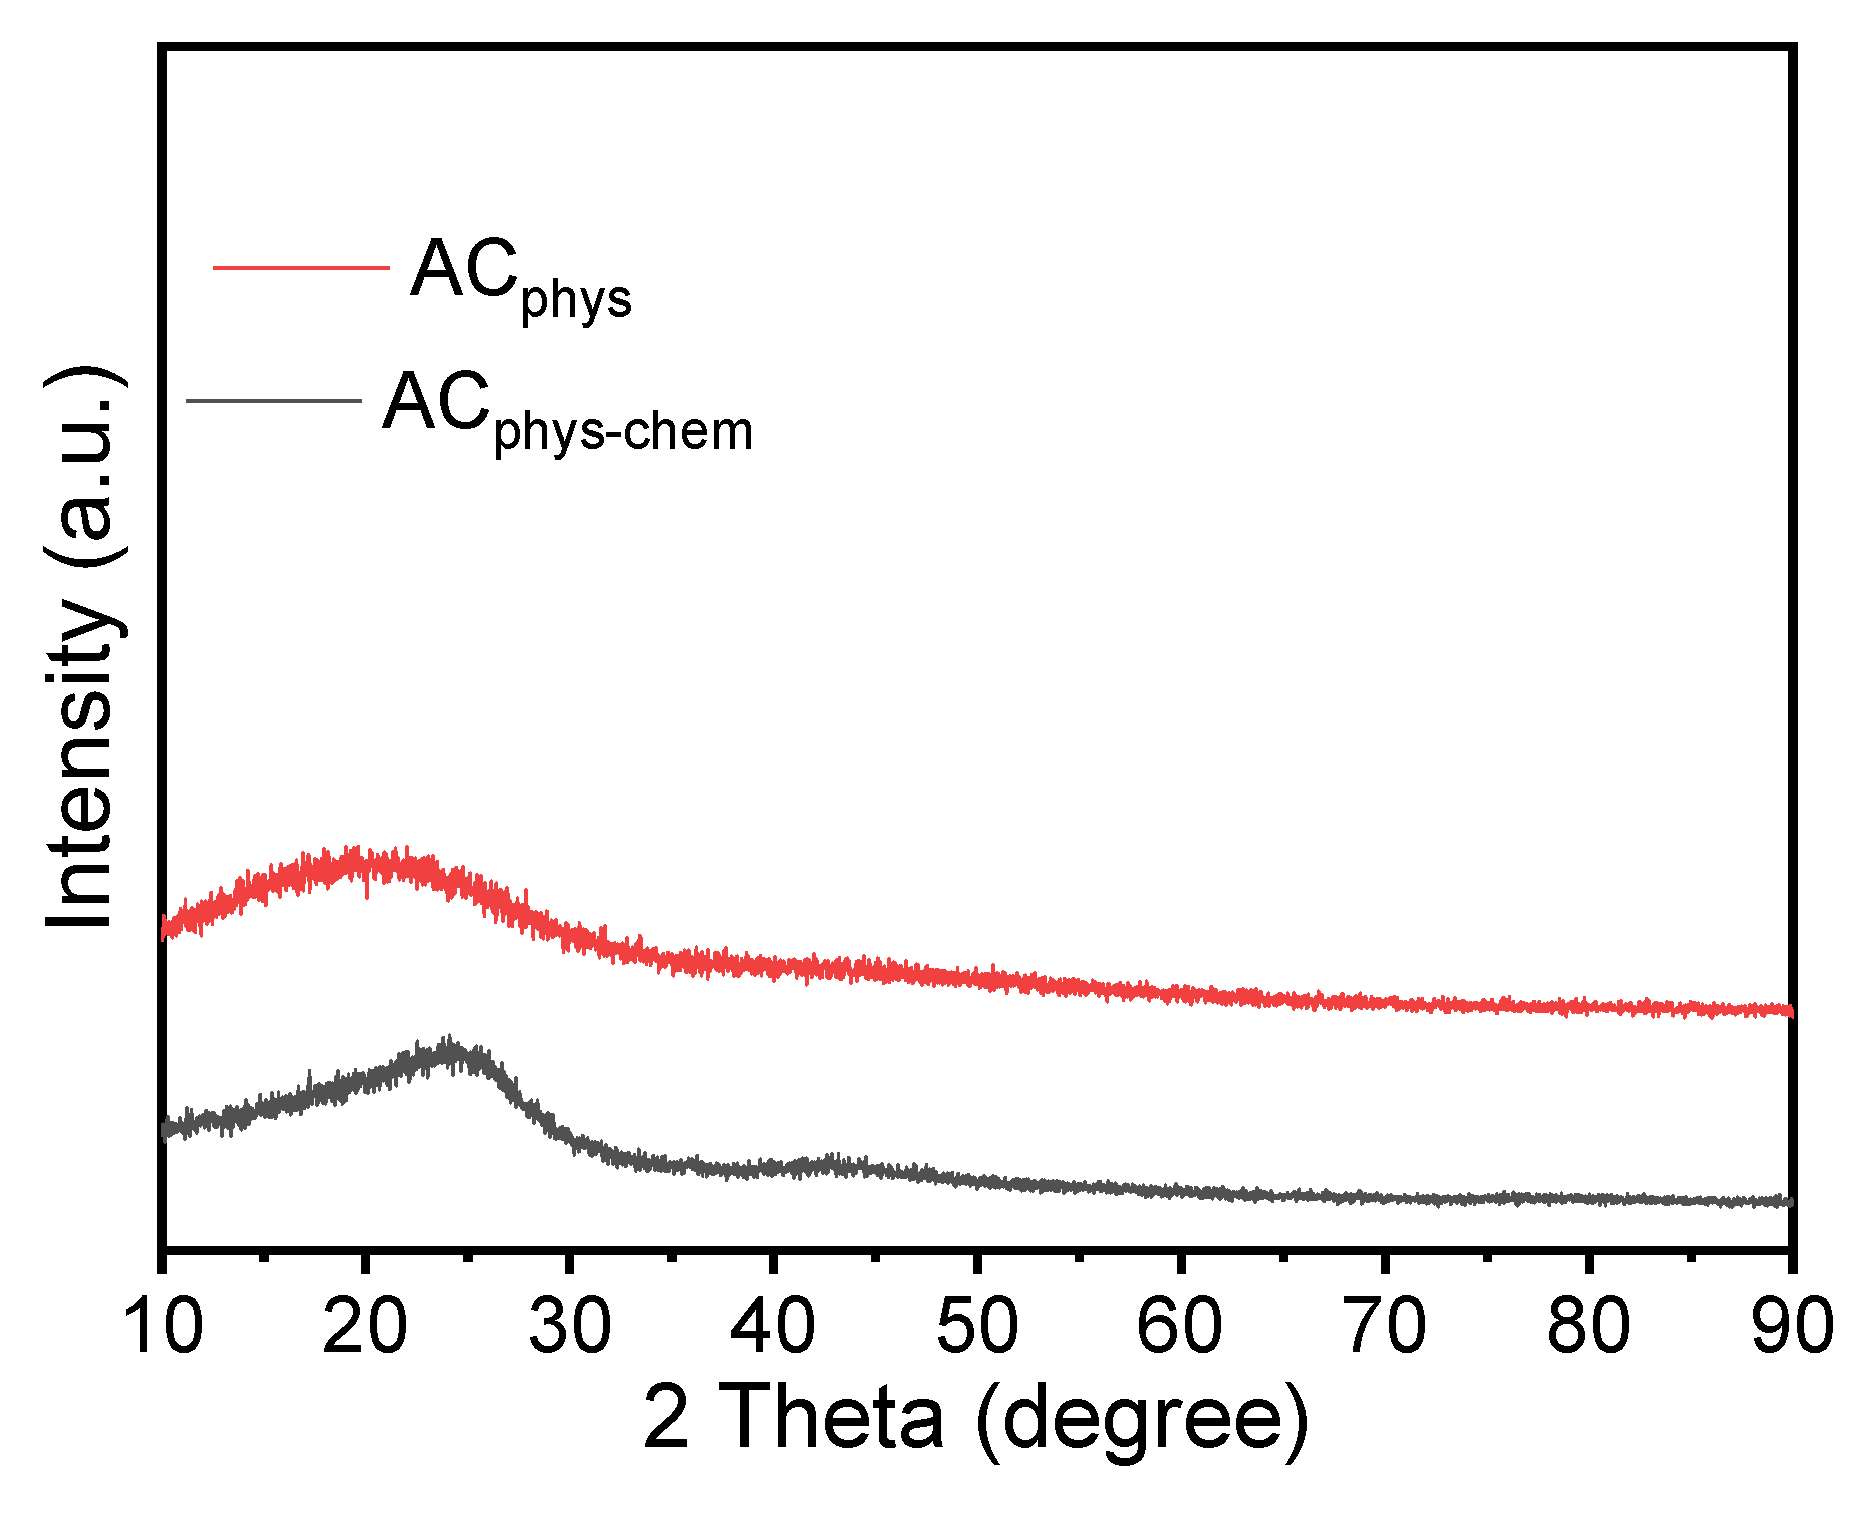
- X-Ray patterns
- -
- Elemental analysis
- -
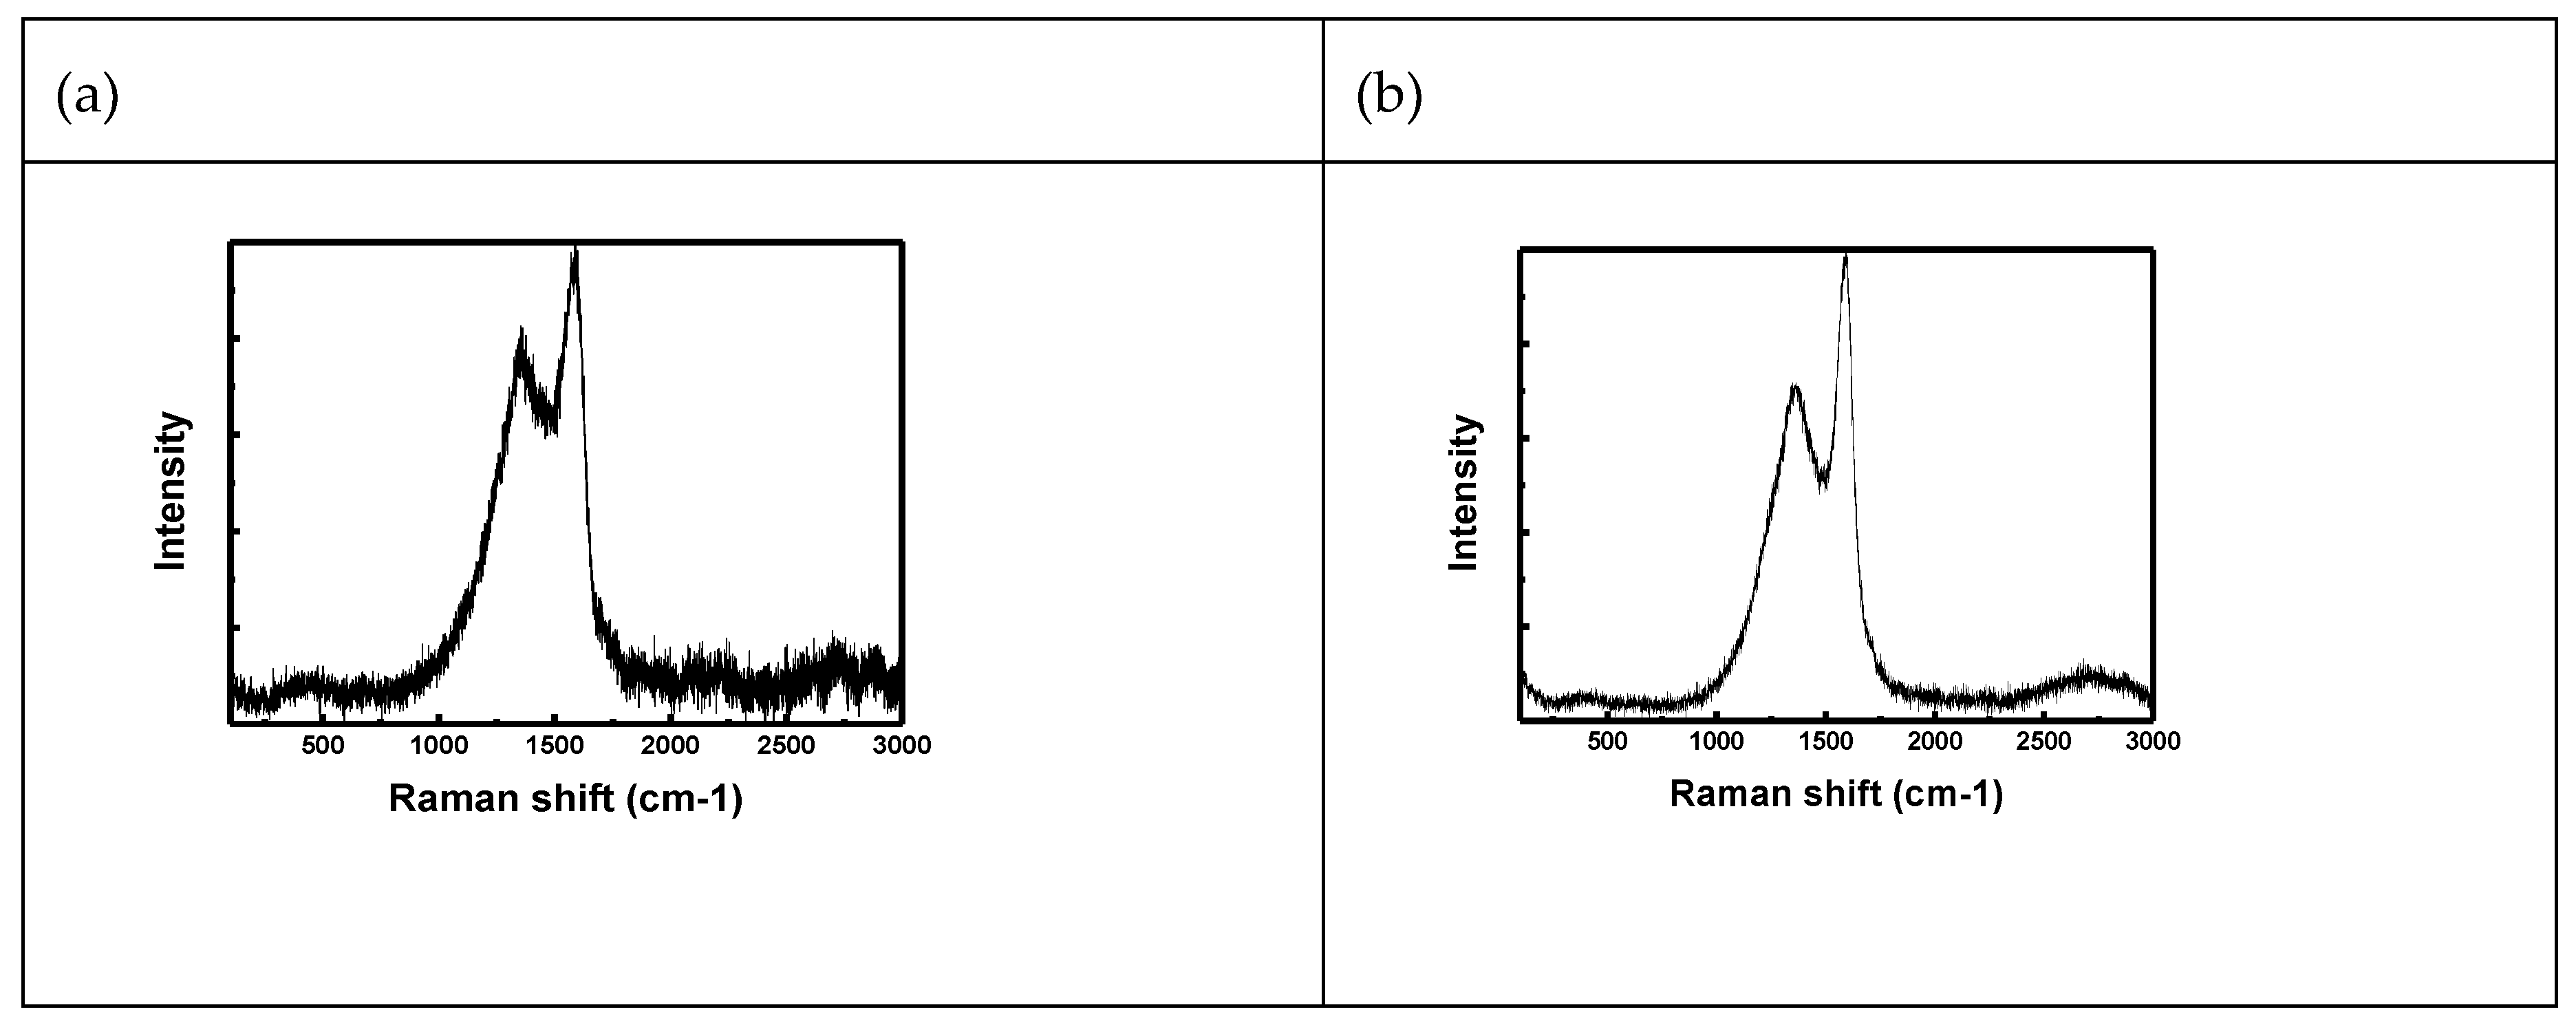
- Raman spectra
3.2. Supercapacitor Testing
- -
- Cyclic voltammetry (CV)
- -
- Galvanostatic charge/discharge (GCD)
- -
- Electrochemical impedance spectra (EIS)
4. Conclusions
Supplementary Materials
Author Contributions
Funding
Data Availability Statement
Acknowledgments
Conflicts of Interest
References
- H. Huang, X. Wang, Graphene nanoplate-MnO2 composites for supercapacitors: a controllable oxidation approach. Nanoscale 2011, 3, 3185–3191. [Google Scholar] [CrossRef] [PubMed]
- Q. Cheng, J. Tang, J. Ma, H. Zhang, N. Shinya, L.-C. Qin, Graphene and nanostructured MnO2 composite electrodes for supercapacitors. Carbon 2011, 49, 2917–2925. [Google Scholar] [CrossRef]
- H. Yang, Graphene-based supercapacitor for energy storage applications, in, Thesis, Ohio State University, 2013.
- Arvinder Singh, Alexander J. Roberts, Robert C. T. Slade and Amreesh Chandra, High electrochemical performance in asymmetric supercapasitor using MWCNT/nickel sulfide composite and graphene nanoplates as electrodes. Journal of materials chemistry A 2014, 2, 16723–16730. [Google Scholar] [CrossRef]
- J. Libich, J. Máca, J. Vondrák, O. Čech, M. Sedlaříková, Supercapacitors: Properties and applications. Journal of energy storage 2018, 17, 224–227. [Google Scholar]
- M. Vangari, T. Pryor, L. Jiang, Supercapacitors: review of materials and fabrication methods. Journal of energy engineering 2013, 139, 72–79. [Google Scholar] [CrossRef]
- F. Lufrano, and P. Staiti. Mesoporous carbon materials as electrodes for electrochemical supercapacitors. international journal of electrochemical science 2010, 5, 903–916. [Google Scholar] [CrossRef]
- Mao Lu, Graphene-Based Material for supercapacitor electrode, in, Thesis, National University of Singapore. 2013. https://core.ac.uk/download/pdf/48678913.
- R. Kötz, M. Carlen, Principles and applications of electrochemical capacitors. Electrochimica Acta 2000, 45, 2483–2498. [Google Scholar] [CrossRef]
- Q. Guo, X Zhou, X. Li, S. Chen, A. Seema, A. Greiner and H. Hou Supercapacitors based on hybrid carbon nanofibers containing multiwalled carbon nanotubes. J. Materials Chemistry 2009, 19, 2810–2816. [Google Scholar] [CrossRef]
- Meryl, D. Stoller and R.S. Ruoff, Best practice methods for determining an electrode material's performance for Ultracapacitors. J. Energy & Environmental Science 2010, 3, 1294–1301. [Google Scholar] [CrossRef]
- R. Kotz, M. Carlen, Principles and applications of electrochemical capacitors. J. ElectrochimicaActa 2000, 45, 2483–249. [Google Scholar] [CrossRef]
- R. Farma, M. Deraman, Awitdrus I.A. Talib, R. Omar, J.G. Manjunatha, M.M. Ishak, N.H. Basri and B.N.M. Dolah, Physical and electrochemical properties of supercapacitor electrodes derived from carbon nanotube and biomass carbon, M.M. Int. J. Electrochem. Sci. 2013, 8, 257–273. [Google Scholar] [CrossRef]
- W. Li, J. Peng, L. Zhang, K. Yang, H. Xia, S. Zhang, S.-h. Guo, Preparation of activated carbon from coconut shell chars in pilot-scale microwave heating equipment at 60 kW. Waste management 2009, 29, 756–760. [Google Scholar] [CrossRef] [PubMed]
- J. Arrebola, A. Caballero, L. Hernán, J. Morales, M. Olivares-Marín, V. Gómez-Serrano, Improving the performance of biomass-derived carbons in Li-ion batteries by controlling the lithium insertion process. Journal of The Electrochemical Society 2010, 157, A791. [Google Scholar] [CrossRef]
- A. A. Palanichamy Kalyani, Andre Darchen. Obtaining Activated Carbon from Papaya Seeds for Energy Storage Devices. International Journal of Engineering Sciences & Research Technology. 2015, 4, 110–122. [Google Scholar]
- L. -b.Z. Wei Li, Jin-hui Peng, Ning Li, Xue-yun Zhu, Preparation Of High Surface Area Activated Carbons From Tobacco Stems With K2CO3 Activation Using Microwave Radiation. Industrial Crops and Products 2008, 27, 341–347. [Google Scholar] [CrossRef]
- W. M.A.W. Doud. R. H. Hesas, J.N. Sahu, A. Arami-Niya, The Effects Of A Microwave Heating Method On The Production Of Activated Carbon From Agricultural Waste: A Review. Journal of Analytical and Applied Pyrolysis. 2013, 100, 1–11. [Google Scholar] [CrossRef]
- J. P. Kunbin Yang, C Srinivasakannan, Libo Zhang, Hongying Xia, Xinhui Duan, Preparation Of High Surface Area Activated Carbon From Coconut Shells Using Microwave Heating. Bioresour Technol 2010, 101, 6163–6169. [Google Scholar] [CrossRef]
- J. Y. Hwang, M. Li, M.F. El-Kady, R.B. Kaner, Next-generation activated carbon supercapacitors: a simple step in electrode processing leads to remarkable gains in energy density. Advanced Functional Materials 2017, 27, 1605745. [Google Scholar] [CrossRef]
- L. Jiang, J. Yan, L. Hao, R. Xue, G. Sun, B. Yi, High rate performance activated carbons prepared from ginkgo shells for electrochemical supercapacitors. Carbon 2013, 56, 146–154. [Google Scholar] [CrossRef]
- P. Hong, X. Liu, X. Zhang, S. Peng, T. Zou, Z. Wang, Y. Yang, R. Zhao, Y. Chen, Y. Wang, Potassium sulphate (K2SO4) activation of chestnut shell to oxygen-enriched porous carbons with enhanced capacitive properties. International Journal of Energy Research 2020, 44, 5385–5396. [Google Scholar] [CrossRef]
- L. Cheng, P. Guo, R. Wang, L. Ming, F. Leng, H. Li, X. Zhao, Electrocapacitive properties of supercapacitors based on hierarchical porous carbons from chestnut shell. Colloids and Surfaces A: Physicochemical and Engineering Aspects 2014, 446, 127–133. [Google Scholar] [CrossRef]
- L. Wan, X. Li, N. Li, M. Xie, C. Du, Y. Zhang, J. Chen, Multi-heteroatom-doped hierarchical porous carbon derived from chestnut shell with superior performance in supercapacitors. Journal of Alloys and Compounds 2019, 790, 760–771. [Google Scholar] [CrossRef]
- N. Czerwinska, C. Giosuè, I. Matos, S. Sabbatini, M.L. Ruello, M. Bernardo, Development of activated carbons derived from wastes: coffee grounds and olive stones as potential porous materials for air depollution. Science of The Total Environment 2024, 914, 169898. [Google Scholar] [CrossRef] [PubMed]
- M. Pagett, K.S. Teng, G. Sullivan, W. Zhang, Reusing waste coffee grounds as electrode materials: recent advances and future opportunities. Global Challenges 2023, 7, 2200093. [Google Scholar] [CrossRef] [PubMed]
- F. Aouay, A. Attia, L. Dammak, R. Ben Amar, A. Deratani, Activated carbon prepared from waste coffee grounds: Characterization and adsorption properties of dyes. Materials 2024, 17, 3078. [Google Scholar] [CrossRef]
- AlMarzooqi, H. Almazrouei, H. Alhammadi, Drugs Removal from Wastewater with Activated Carbon from Coffee Waste. Int J Biomed Res Prac 2024, 4, 1–5. [Google Scholar]
- C. -H. Kim, S.-Y. Lee, S.-J. Park, Valorization of waste coffee grounds into microporous carbon materials for CO 2 adsorption. Green Chemistry 2024, 26, 1901–1909. [Google Scholar] [CrossRef]
- K. Pandey, H.K. Jeong, Coffee waste-derived porous carbon based flexible supercapacitors. Chemical Physics Letters 2022, 809, 140173. [Google Scholar] [CrossRef]
- Y. -H. Chiu, L.-Y. Lin, Effect of activating agents for producing activated carbon using a facile one-step synthesis with waste coffee grounds for symmetric supercapacitors. Journal of the taiwan institute of chemical engineers 2019, 101, 177–185. [Google Scholar] [CrossRef]
- M. Biegun, A. Dymerska, X. Chen, E. Mijowska, Study of the active carbon from used coffee grounds as the active material for a high-temperature stable supercapacitor with ionic-liquid electrolyte. Materials 2020, 13, 3919. [Google Scholar] [CrossRef]
- A. Khadka, U. Lawaju, S. Koju, R.C. Rai, M.L. Nakarmi, P. Joshi, Activated carbon derived from coffee waste as supercapacitor electrode material. Scientific World 2024, 17, 19–26. [Google Scholar] [CrossRef]
- J.M. Davidraj, C.I. J.M. Davidraj, C.I. Sathish, M.R. Benzigar, Z. Li, X. Zhang, R. Bahadur, K. Ramadass, G. Singh, J. Yi, P. Kumar, Recent advances in food waste-derived nanoporous carbon for energy storage. Science and Technology of Advanced Materials, (2024) 2357062.
- T. E. Rufford, D. Hulicova-Jurcakova, Z. Zhu, G.Q. Lu, Nanoporous carbon electrode from waste coffee beans for high performance supercapacitors. Electrochemistry Communications 2008, 10, 1594–1597. [Google Scholar] [CrossRef]
- Zyoud, H.N. Nassar, A. El-Hamouz, H.S. Hilal, Solid olive waste in environmental cleanup: enhanced nitrite ion removal by ZnCl2-activated carbon. Journal of environmental management 2015, 152, 27–35. [Google Scholar] [CrossRef] [PubMed]
- T. E. Rufford, D. Hulicova-Jurcakova, E. Fiset, Z. Zhu, G.Q. Lu, Double-layer capacitance of waste coffee ground activated carbons in an organic electrolyte. Electrochemistry Communications 2009, 11, 974–977. [Google Scholar] [CrossRef]
- P. T. Williams, A.R. Reed, Development of activated carbon pore structure via physical and chemical activation of biomass fibre waste. Biomass and bioenergy 2006, 30, 144–152. [Google Scholar] [CrossRef]
- K. Le Van, T. Luong Thi Thu, Preparation of Pore-Size Controllable Activated Carbon from Rice Husk Using Dual Activating Agent and Its Application in Supercapacitor. Journal of Chemistry 2019, 2019, 4329609. [Google Scholar]
- S. Lowell, J.E. S. Lowell, J.E. Shields, M.A. Thomas, M. Thommes, Characterization of porous solids and powders: surface area, pore size and density, book, Springer Science & Business Media, 2012. pp. 1–4. [CrossRef]
- R. Rajbhandari, L.K. Shrestha, R.R. Pradhananga, Nanoporous activated carbon derived from Lapsi (Choerospondias Axillaris) seed stone for the removal of arsenic from water. Journal of nanoscience and nanotechnology 2012, 12, 7002–7009. [Google Scholar] [CrossRef]
- X. -Y. Liu, M. Huang, H.-L. Ma, Z.-Q. Zhang, J.-M. Gao, Y.-L. Zhu, X.-J. Han, X.-Y. Guo, Preparation of a carbon-based solid acid catalyst by sulfonating activated carbon in a chemical reduction process. Molecules 2010, 15, 7188–7196. [Google Scholar] [CrossRef]
- Y. Liu, X. Liu, W. Dong, L. Zhang, Q. Kong, W. Wang, Efficient adsorption of sulfamethazine onto modified activated carbon: a plausible adsorption mechanism. Scientific reports 2017, 7, 12437. [Google Scholar]
- G. K. Gupta, P. Sagar, S.K. Pandey, M. Srivastava, A. Singh, J. Singh, A. Srivastava, S. Srivastava, A. Srivastava, In situ fabrication of activated carbon from a bio-waste desmostachya bipinnata for the improved supercapacitor performance. Nanoscale research letters 2021, 16, 85. [Google Scholar] [CrossRef]
- Daraghmeh, S. Hussain, L. Servera, E. Xuriguera, M. Blanes, F. Ramos, A. Cornet, A. Cirera, Flexible supercapacitors based on low-cost tape casting of high dense carbon nanofibers. Materials Research Express 2017, 4, 025007. [Google Scholar] [CrossRef]
- Q. Ke, J. Wang, Graphene-Based Materials For Supercapacitor Electrodes. J. Mathematics 2016, 2, 37–54. [Google Scholar] [CrossRef]
- Singh, A.J. Roberts, R.C. Slade, A. Chandra, High electrochemical performance in asymmetric supercapacitors using MWCNT/nickel sulfide composite and graphene nanoplatelets as electrodes. Journal of Materials Chemistry A 2014, 2, 16723–16730. [Google Scholar] [CrossRef]
- S. Y. Kim, Y.J. Noh, J. Yu, Thermal conductivity of graphene nanoplatelets filled composites fabricated by solvent-free processing for the excellent filler dispersion and a theoretical approach for the composites containing the geometrized fillers. Composites Part A: Applied Science and Manufacturing 2015, 69, 219–225. [Google Scholar] [CrossRef]
- S. Jarrar, S. Hussain, A.U. Haq, G. Bhattacharya, I. Saadeddin, L. Servera, J. Ruiz, A. Janem, A. Daraghmeh, Binder-free all-carbon composite supercapacitors. Nanotechnology 2024, 35, 305708. [Google Scholar]
- S. Prabaharan, R. Vimala, Z. Zainal, Nanostructured mesoporous carbon as electrodes for supercapacitors. Journal of Power Sources 2006, 161, 730–736. [Google Scholar] [CrossRef]
- D. Saha, Y. Li, Z. Bi, J. Chen, J.K. Keum, D.K. Hensley, H.A. Grappe, H.M. Meyer III, S. Dai, M.P. Paranthaman, Studies on supercapacitor electrode material from activated lignin-derived mesoporous carbon. Langmuir 2014, 30, 900–910. [Google Scholar] [CrossRef]
- E. Frackowiak, F. Beguin, Carbon materials for the electrochemical storage of energy in capacitors. Carbon 2001, 39, 937–950. [Google Scholar] [CrossRef]
- C. -S. Lim, K. Teoh, C.-W. Liew, S. Ramesh, Electric double layer capacitor based on activated carbon electrode and biodegradable composite polymer electrolyte. Ionics 2014, 20, 251–258. [Google Scholar] [CrossRef]
- S. K. Meher, P. Justin, G. Ranga Rao, Microwave-mediated synthesis for improved morphology and pseudocapacitance performance of nickel oxide. ACS applied materials & interfaces 2011, 3, 2063–2073. [Google Scholar]
- J. W. Graydon, M. Panjehshahi, D.W. Kirk, Charge redistribution and ionic mobility in the micropores of supercapacitors. Journal of Power Sources 2014, 245, 822–829. [Google Scholar] [CrossRef]
- R. A.P. Jayawickramage, J.P. Ferraris, High performance supercapacitors using lignin based electrospun carbon nanofiber electrodes in ionic liquid electrolytes. Nanotechnology 2019, 30, 155402. [Google Scholar] [CrossRef] [PubMed]
- J. Choi, C. Zequine, S. Bhoyate, W. Lin, X. Li, P. Kahol, R. Gupta, Waste coffee management: deriving high-performance supercapacitors using nitrogen-doped coffee-derived carbon, C 2019, 5, 44.
- R. Farma, M. Deraman, I. Talib, R. Omar, J. Manjunatha, M. Ishak, N. Basri, B. Dolah, Physical and electrochemical properties of supercapacitor electrodes derived from carbon nanotube and biomass carbon. International Journal of Electrochemical Science 2013, 8, 257–273. [Google Scholar] [CrossRef]
- Sabreen Jarrar, Carbon Nanofibers/Graphene Nanoplateletes Composite as Supercapacitor Electrode Using KOH Aqueous Electrolyte, in, Thesis, An-Najah National University, 2020.
- Daraghmeh, S. Hussain, L. Servera, E. Xuriguera, A. Cornet, A. Cirera, Impact of binder concentration and pressure on performance of symmetric CNFs based supercapacitors. Electrochimica Acta 2017, 245, 531–538. [Google Scholar] [CrossRef]
- Y. Zhou, P. Jin, Y. Zhou, Y. Zhu, High-performance symmetric supercapacitors based on carbon nanotube/graphite nanofiber nanocomposites. Scientific reports 2018, 8, 9005. [Google Scholar]
- V. Ganesh, S. Pitchumani, V. Lakshminarayanan, New symmetric and asymmetric supercapacitors based on high surface area porous nickel and activated carbon, Journal of Power Sources 2006, 158, 1523–1532.
- Y. Gong, D. Li, Q. Fu, C. Pan, Influence of graphene microstructures on electrochemical performance for supercapacitors. Progress in Natural Science: Materials International 2015, 25, 379–385. [Google Scholar] [CrossRef]
- C. Schütter, C. Ramirez-Castro, M. Oljaca, S. Passerini, M. Winter, A. Balducci, Activated carbon, carbon blacks and graphene based nanoplatelets as active materials for electrochemical double layer capacitors: a comparative study. Journal of the Electrochemical Society 2014, 162, A44. [CrossRef]
- E. Calvo, F. Lufrano, P. Staiti, A. Brigandì, A. Arenillas, J. Menéndez, Optimizing the electrochemical performance of aqueous symmetric supercapacitors based on an activated carbon xerogel. Journal of Power Sources 2013, 241, 776–782. [Google Scholar] [CrossRef]
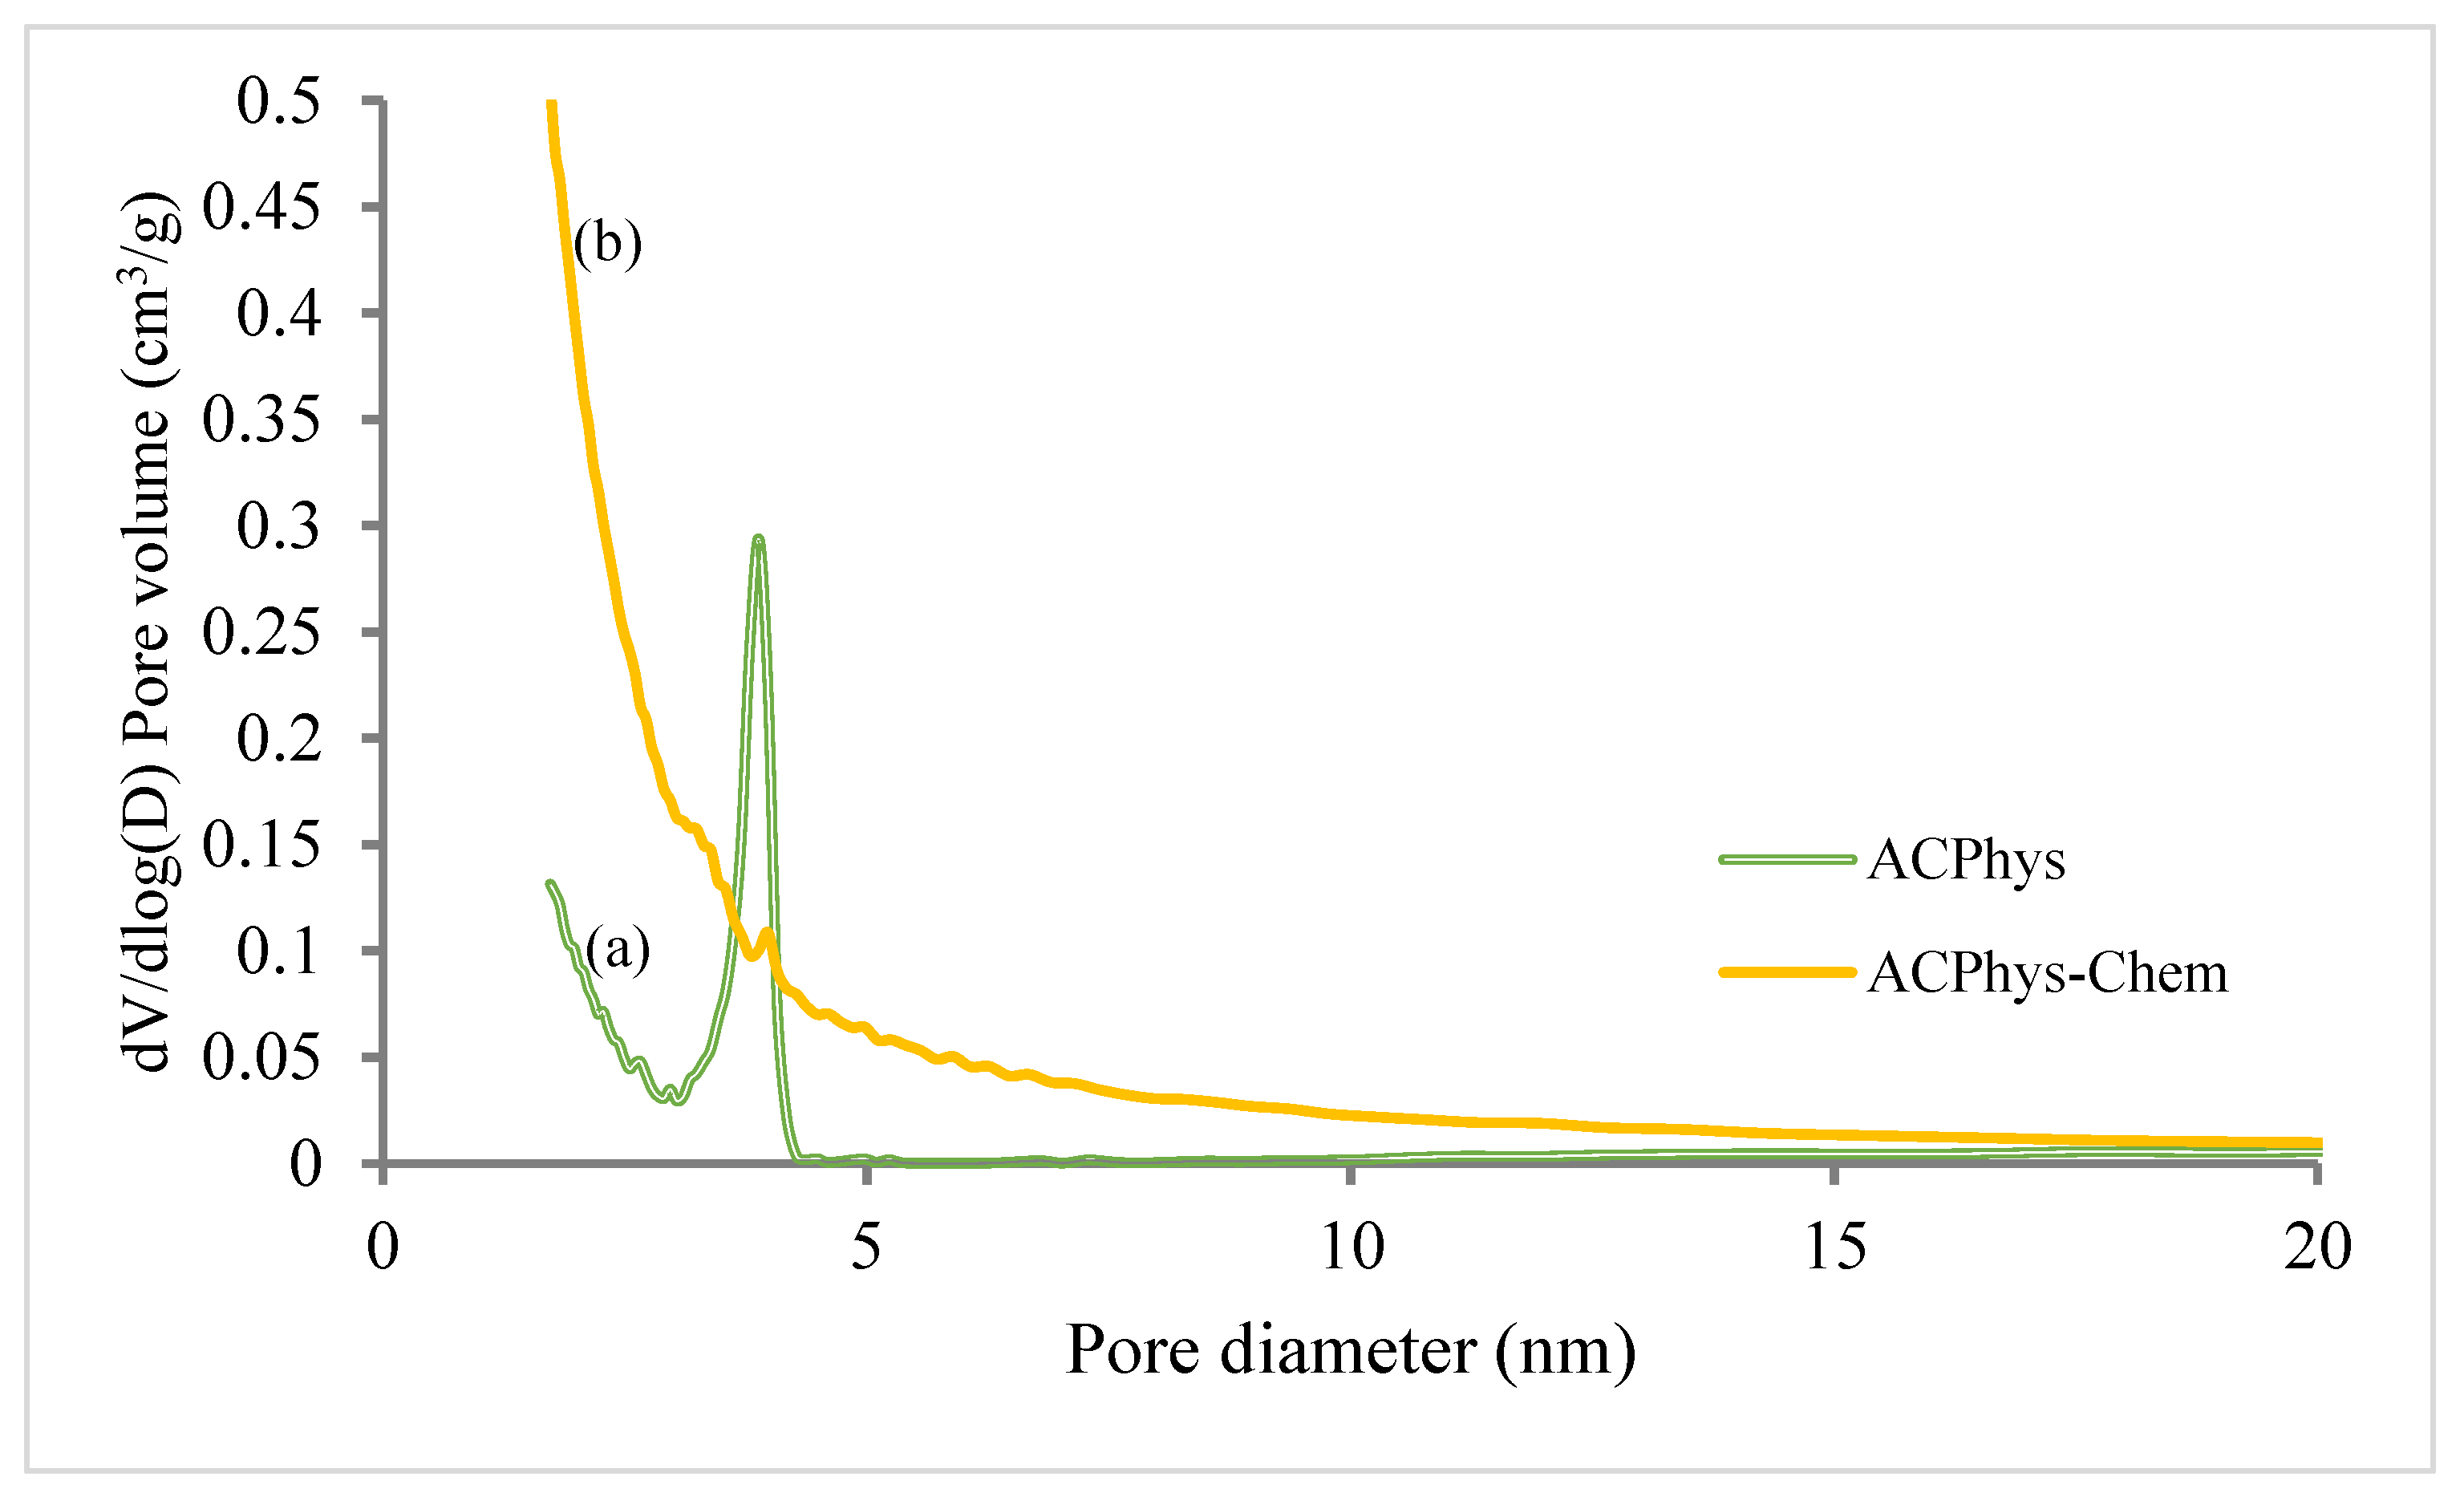
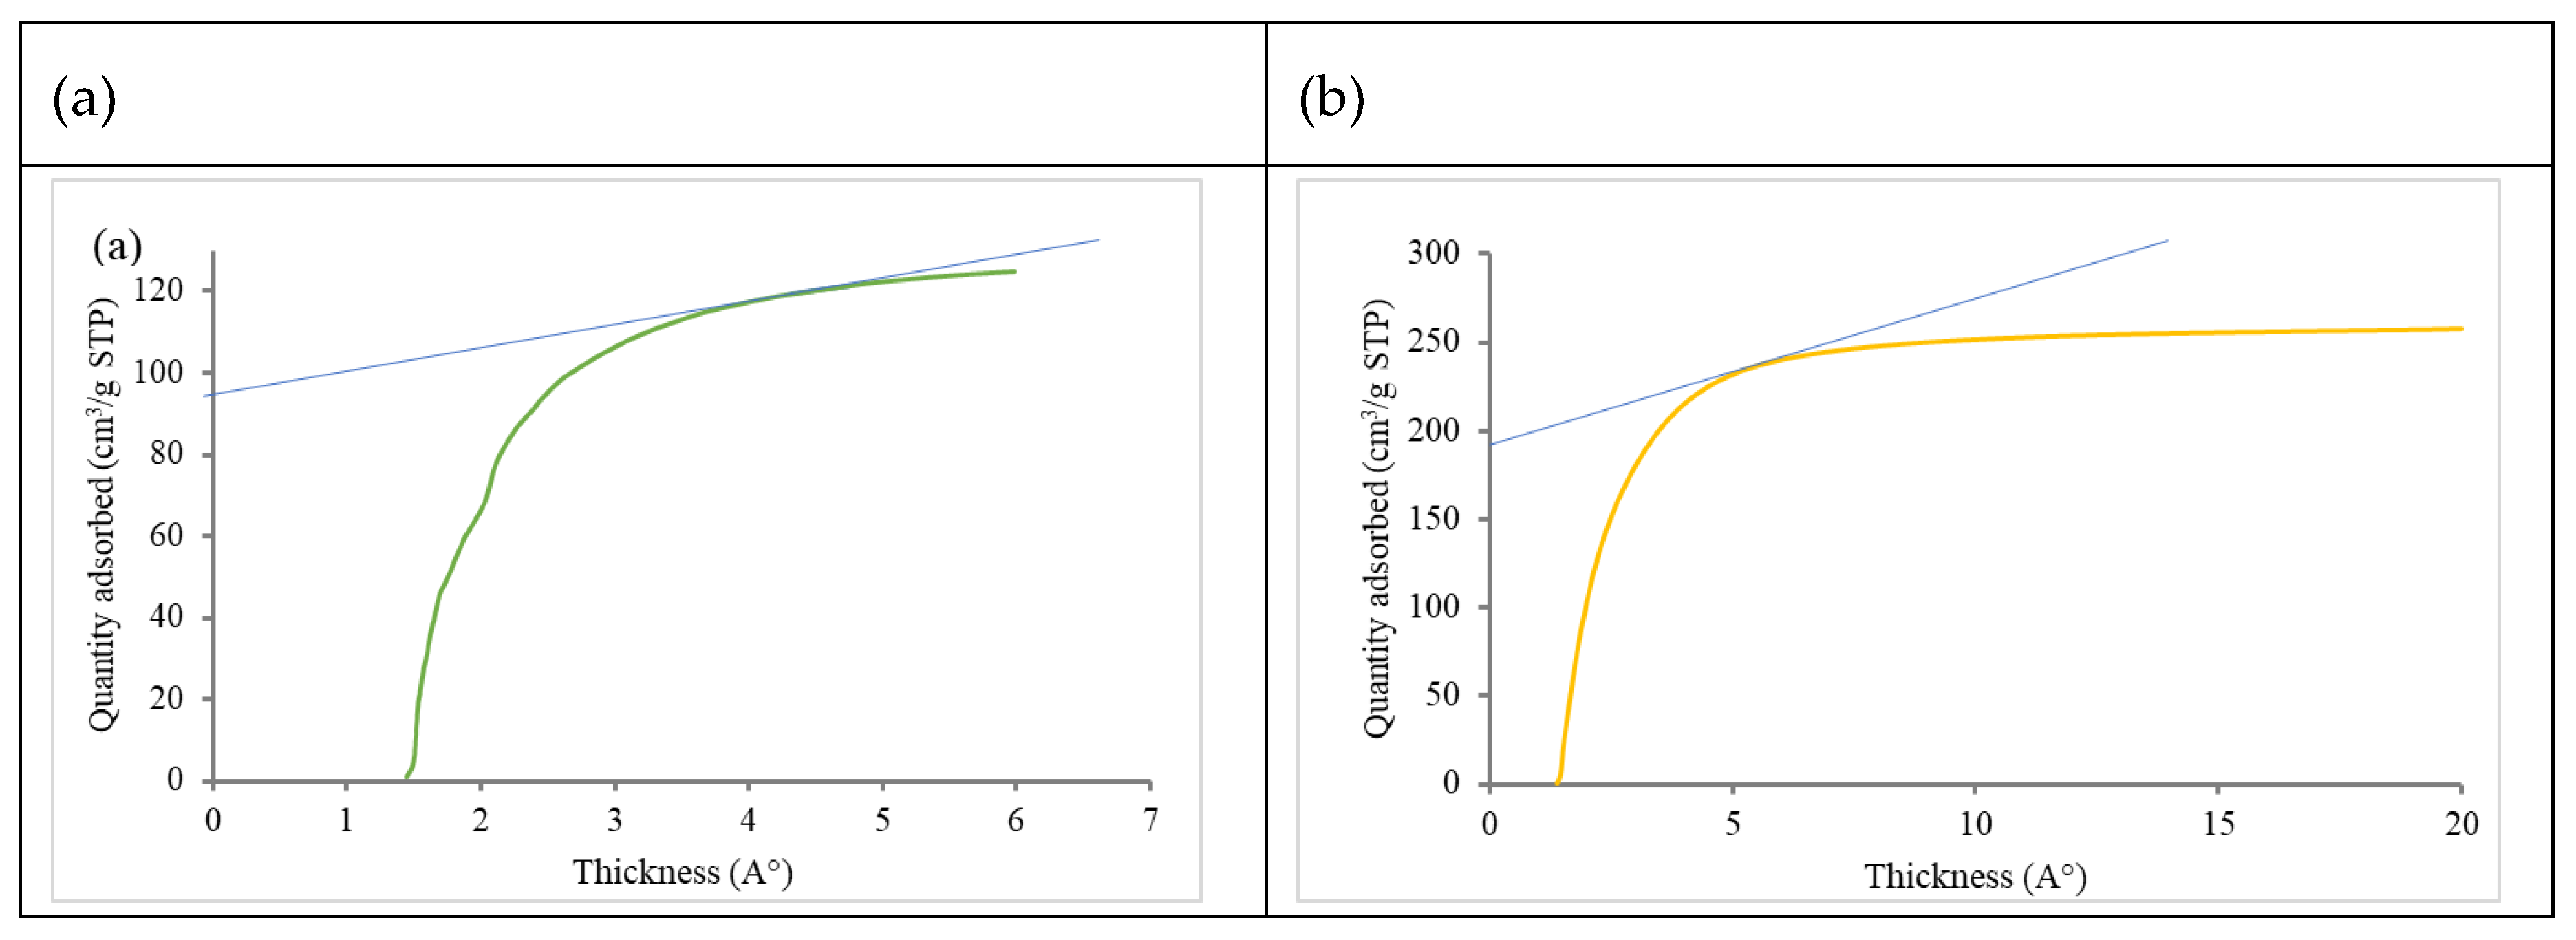
| BET based data | ||||||||
|---|---|---|---|---|---|---|---|---|
| Material | SBET m2/g |
Vtb cm3/g |
V0.5-2c mic cm3/g t-plot |
V2-5e cm3/g BJH meso |
V>50 | S mic m2/g |
S Meso m2/g |
APS nm |
| ACPhys | 458 | 0.2114 | 0.153 | 0.23 | 0.0084 | 385 | 73 | 1.8-3.3 |
| ACPhy-Chem | 830 | 0.41 | 0.19 | 0.072 | 0.148 | 755 | 75 | 0.8-2.7 |
| a | Element | C | N | O | S | Cl | Fe |
| Atom% | 93.3 | 2.3 | 3.9 | 0.1 | 0.2 | 1x10⁻² | |
| Mass% | 96.6 | 0.3 | 0.1 | 0.2 | 2x10⁻² | ||
| b | Element | C | N | O | S | Cl | Fe |
| Atom% | 63.2 | 1.9 | 23.7 | 0.04 | 1.1 | 0.04 | |
| Mass% | 83.3 | 4.0 | 0.1 | 1.5 | 0.1 |
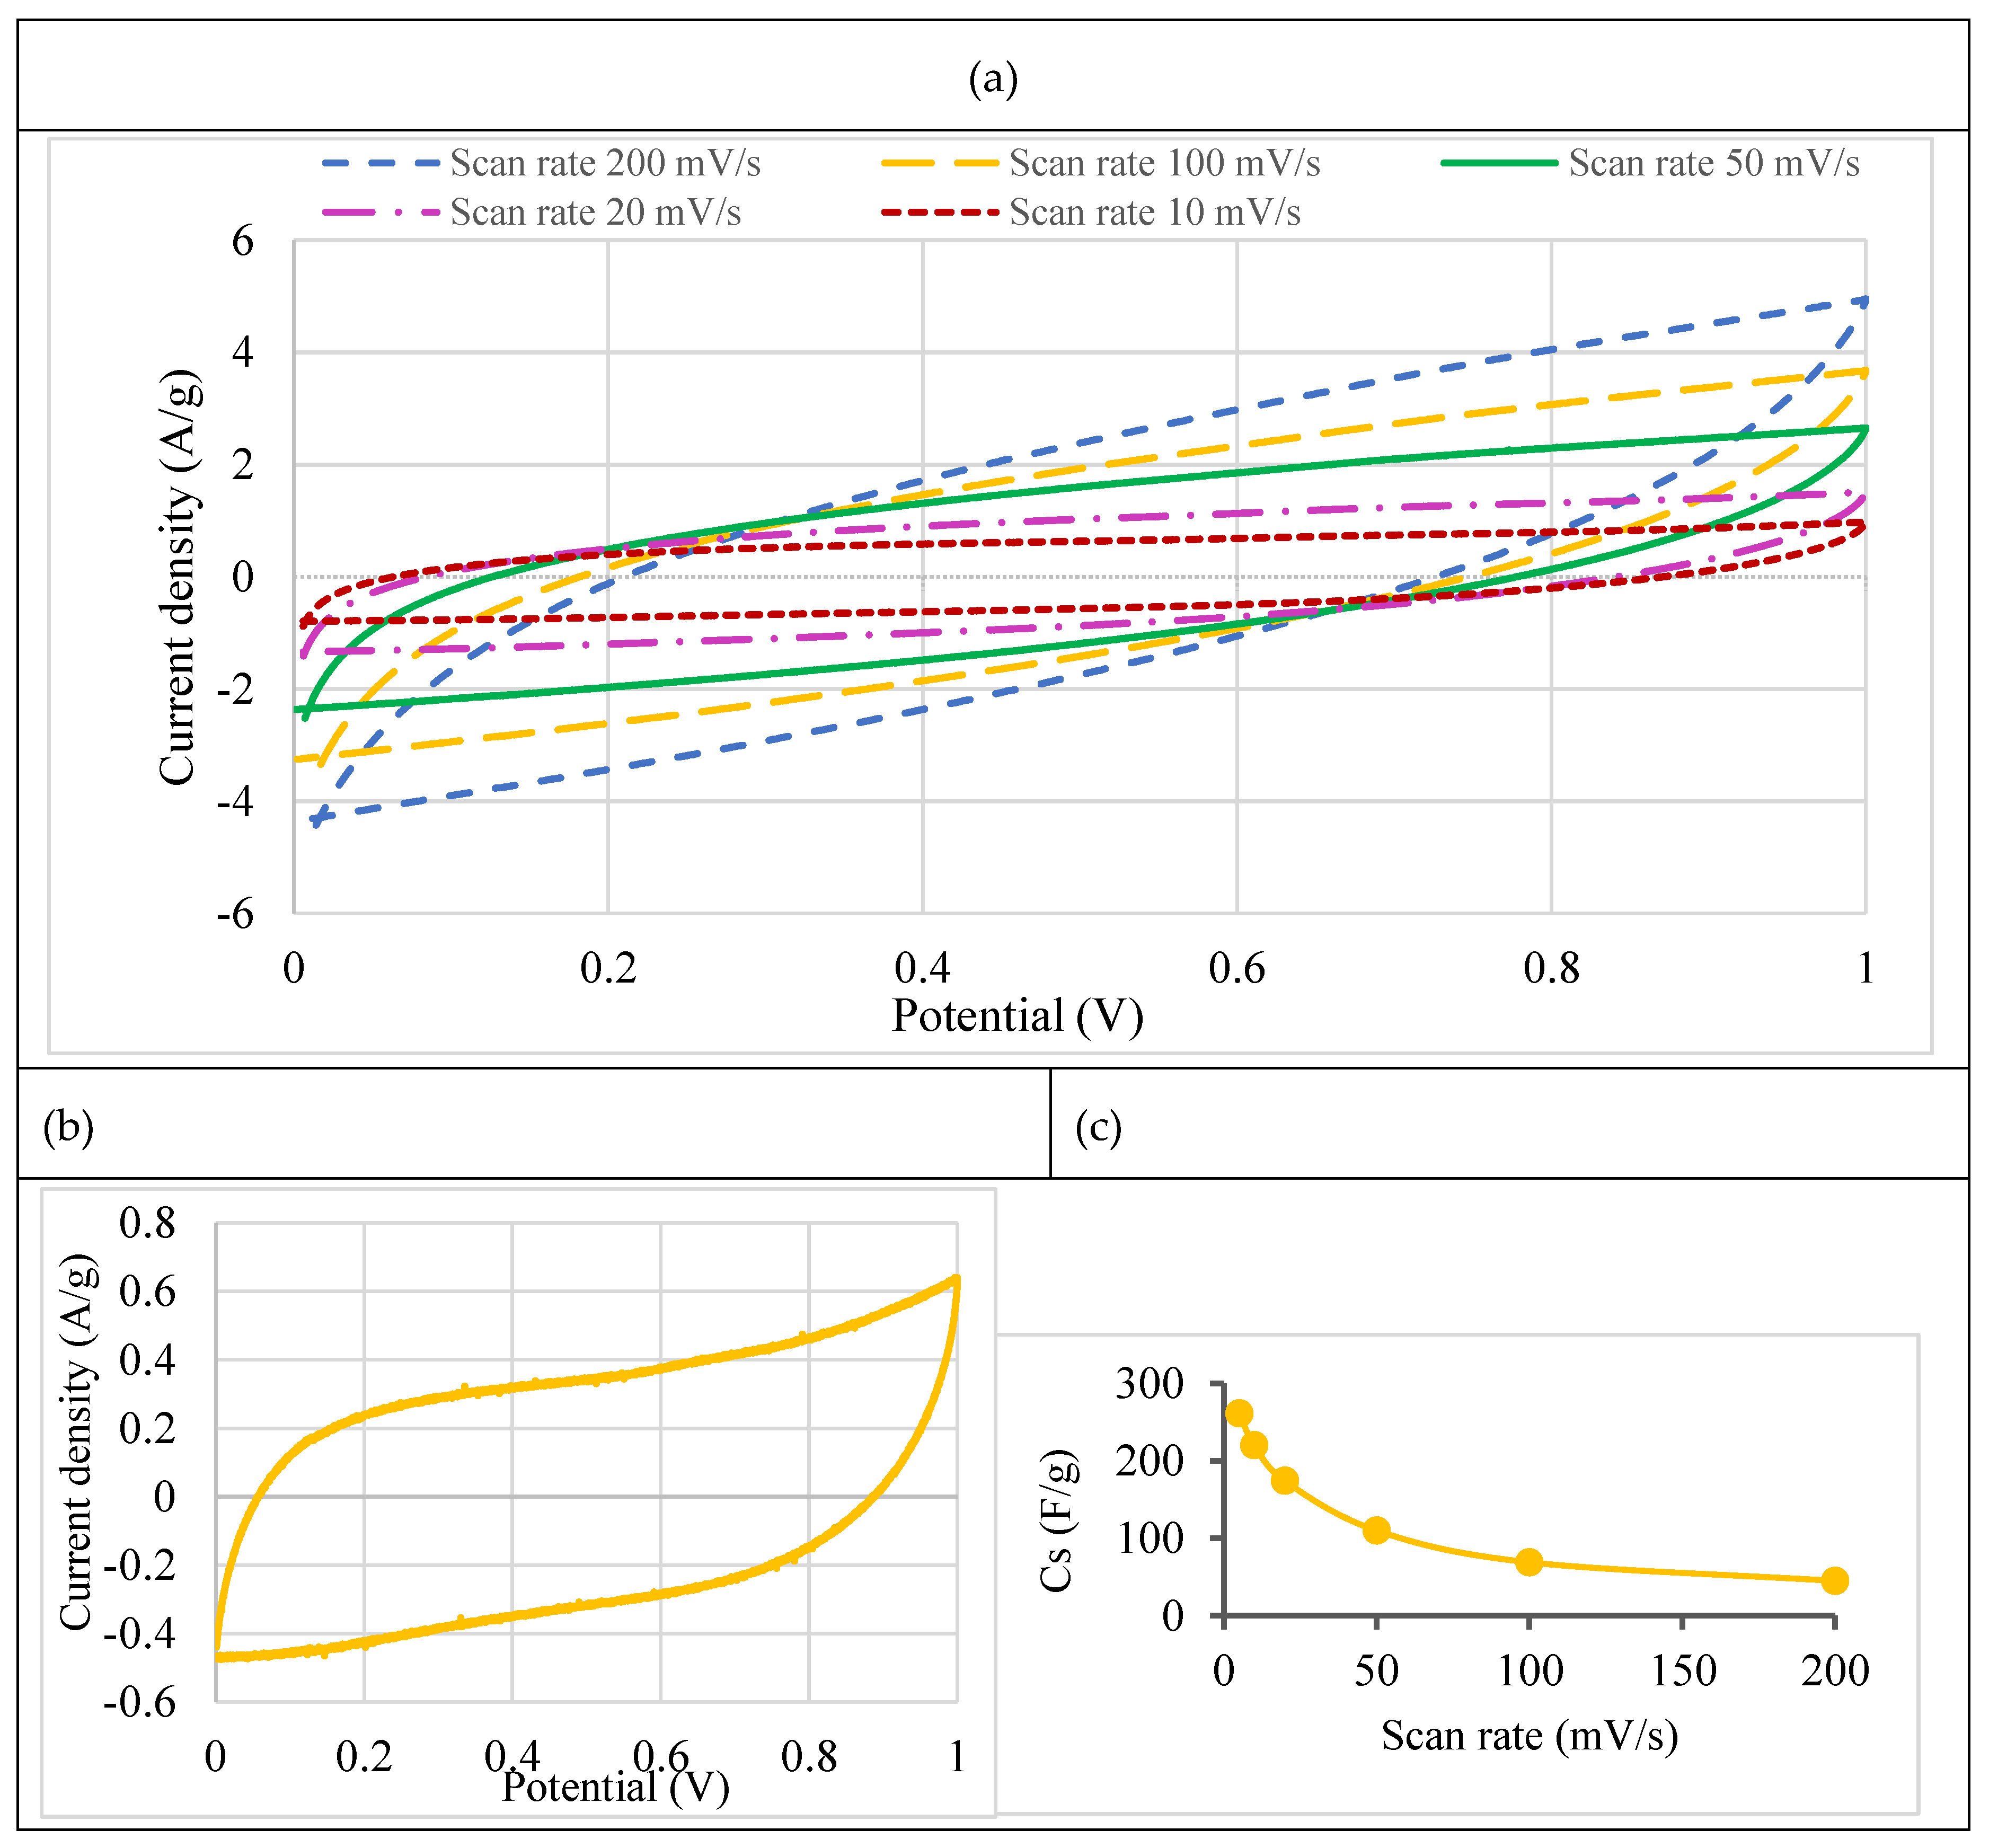
| Scan rate (mV/s) |
Cs this work (F g-1) |
Literature Cs (F g-1) for coffee waste-based electrodes |
|---|---|---|
| 1 | -- | 150 [57] |
| 5 | 261 | 109 [33] |
| 10 | 220 | 101 [33] |
| 20 | 174 | 130 [57] 90 [33] |
| 50 | 110 | 100 [57] |
| 100 | 69 | 47 [33] |
| 200 | 45 | -- |
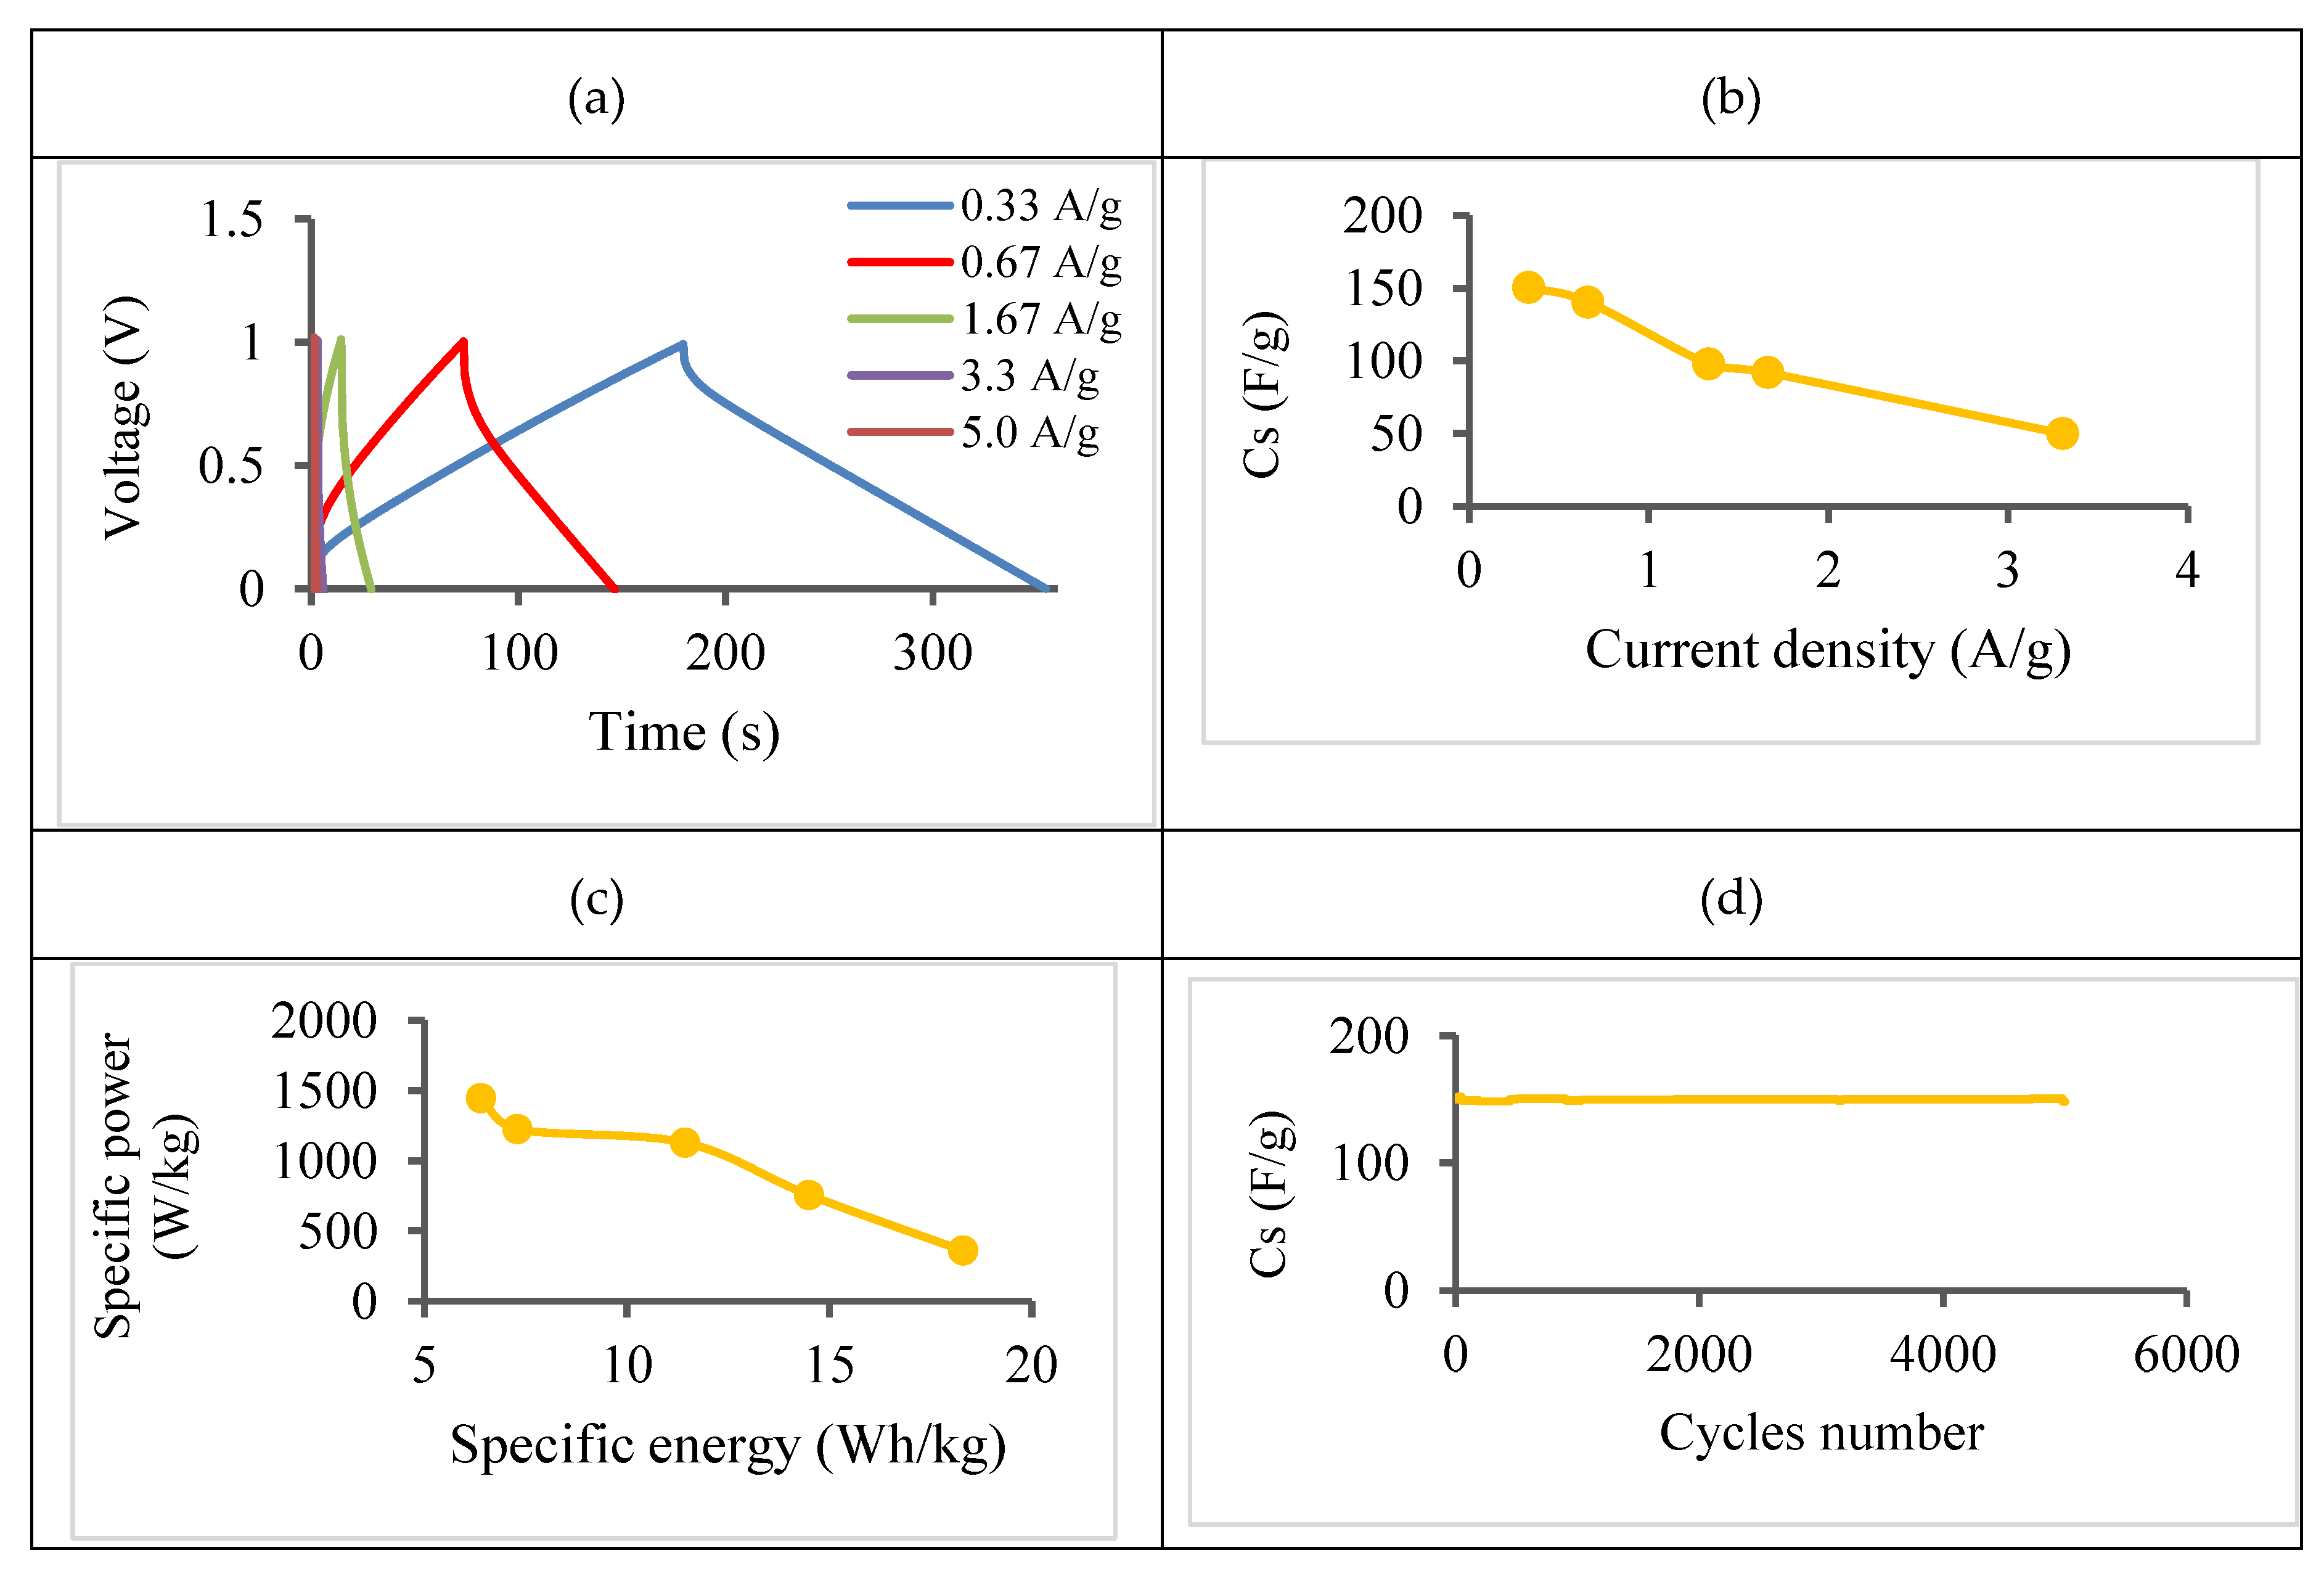
| Discharge Current (A) | 0.01 | 0.02 | 0.05 | 0.10 | 0.15 |
| VIR (V) | 0.064 | 0.134 | 0.297 | 0.660 | 0.760 |
| ESR (Ω) | 3.20 | 3.35 | 3.00 | 3.30 | 2.53 |
| Specific Capacitance (F g-1) | 150 | 141 | 92 | 50 | 39 |
Disclaimer/Publisher’s Note: The statements, opinions and data contained in all publications are solely those of the individual author(s) and contributor(s) and not of MDPI and/or the editor(s). MDPI and/or the editor(s) disclaim responsibility for any injury to people or property resulting from any ideas, methods, instructions or products referred to in the content. |
© 2024 by the authors. Licensee MDPI, Basel, Switzerland. This article is an open access article distributed under the terms and conditions of the Creative Commons Attribution (CC BY) license (http://creativecommons.org/licenses/by/4.0/).


