Submitted:
11 October 2024
Posted:
12 October 2024
You are already at the latest version
Abstract
Keywords:
1. Introduction
2. Thermofluidic Numerical Simulation
2.1. Thermofluidic Governing Equations
2.2. Thermofluidic Boundary Conditions
2.3. Governing Equation for Electric Field
2.4. Boundary Conditions for the Electric Field
2.5. Numerical Simulation Schemes
| Range of | Empirical formula | Refs. |
| (Top) | McAdams et al. [40] | |
|
(Top) (Bottom) |
|
Fishenden et al. [41] |
| (Top) | Al-Arabi et al. [42] | |
| (Top) | Yousef et al. [43] |
| Parameters | Values |
| Number of grid points | |
| Time increment [s] | |
| Characteristic length [m] | |
| Characteristic temperature [K] | |
| Effective potential [V] | |
| Solution conductivity [S/m] | |
| Flow rate [mL/h] |
| [W/(mK)] | [kg/m3] | [J/(kgK)] | [m2/s] | [1/K] | Pr | |
| Water | ||||||
| Air | ||||||
| Glass | ― | ― | ― |
3. Experimental
3.1. Device Fabrication
3.2. Sample Solution Preparation
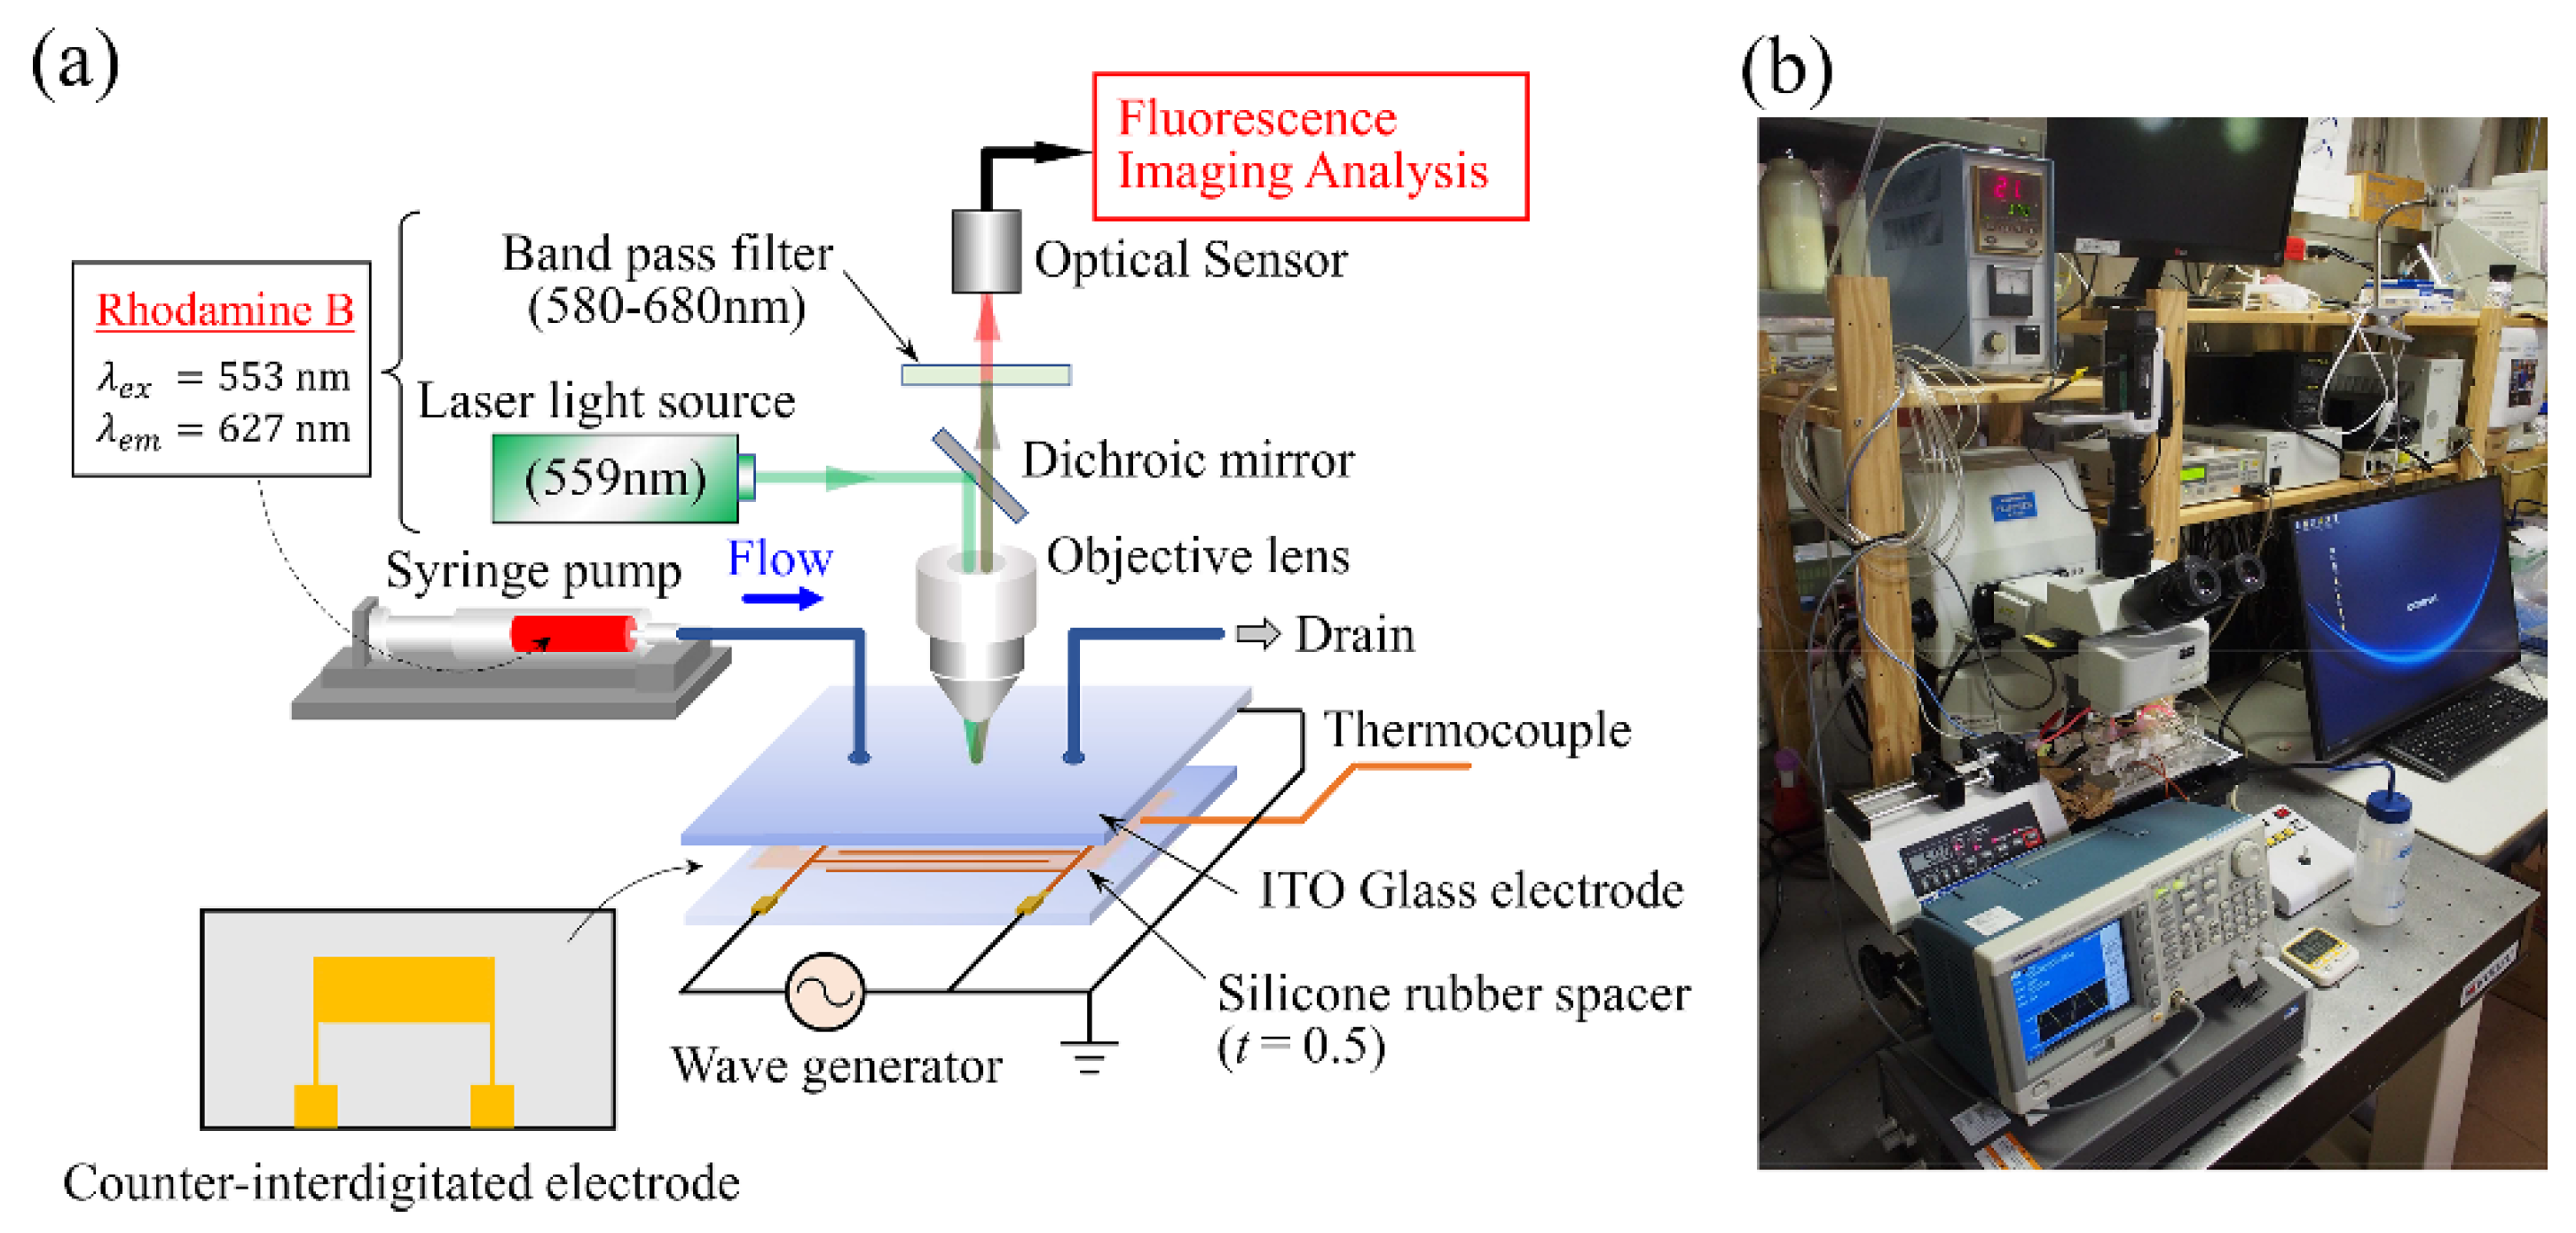
3.3. Experimental Setup
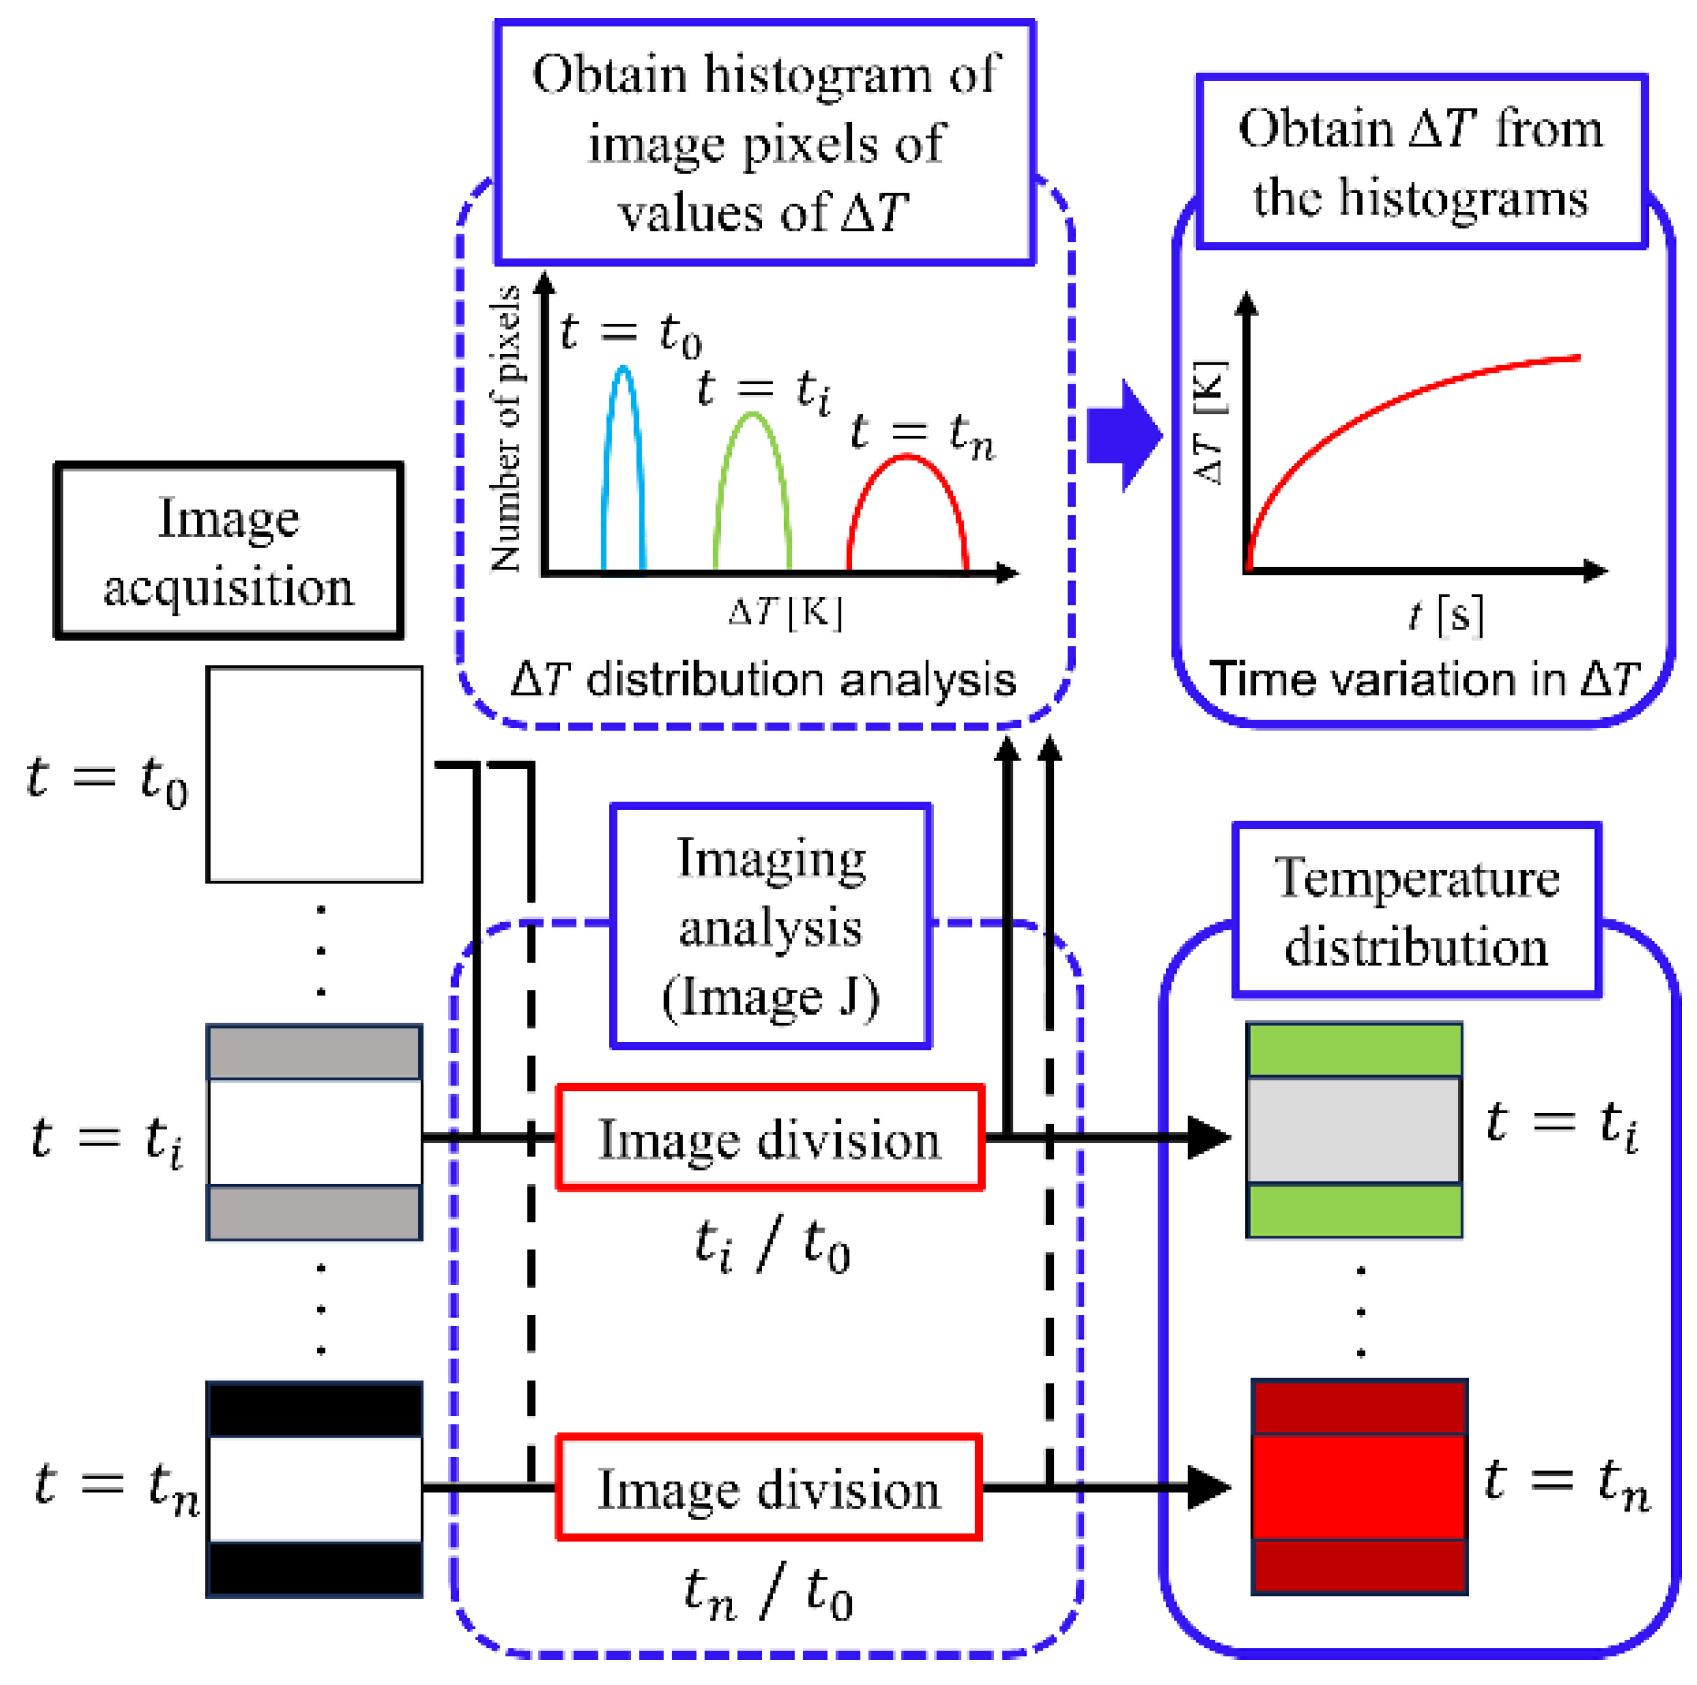
3.4. Image Processing
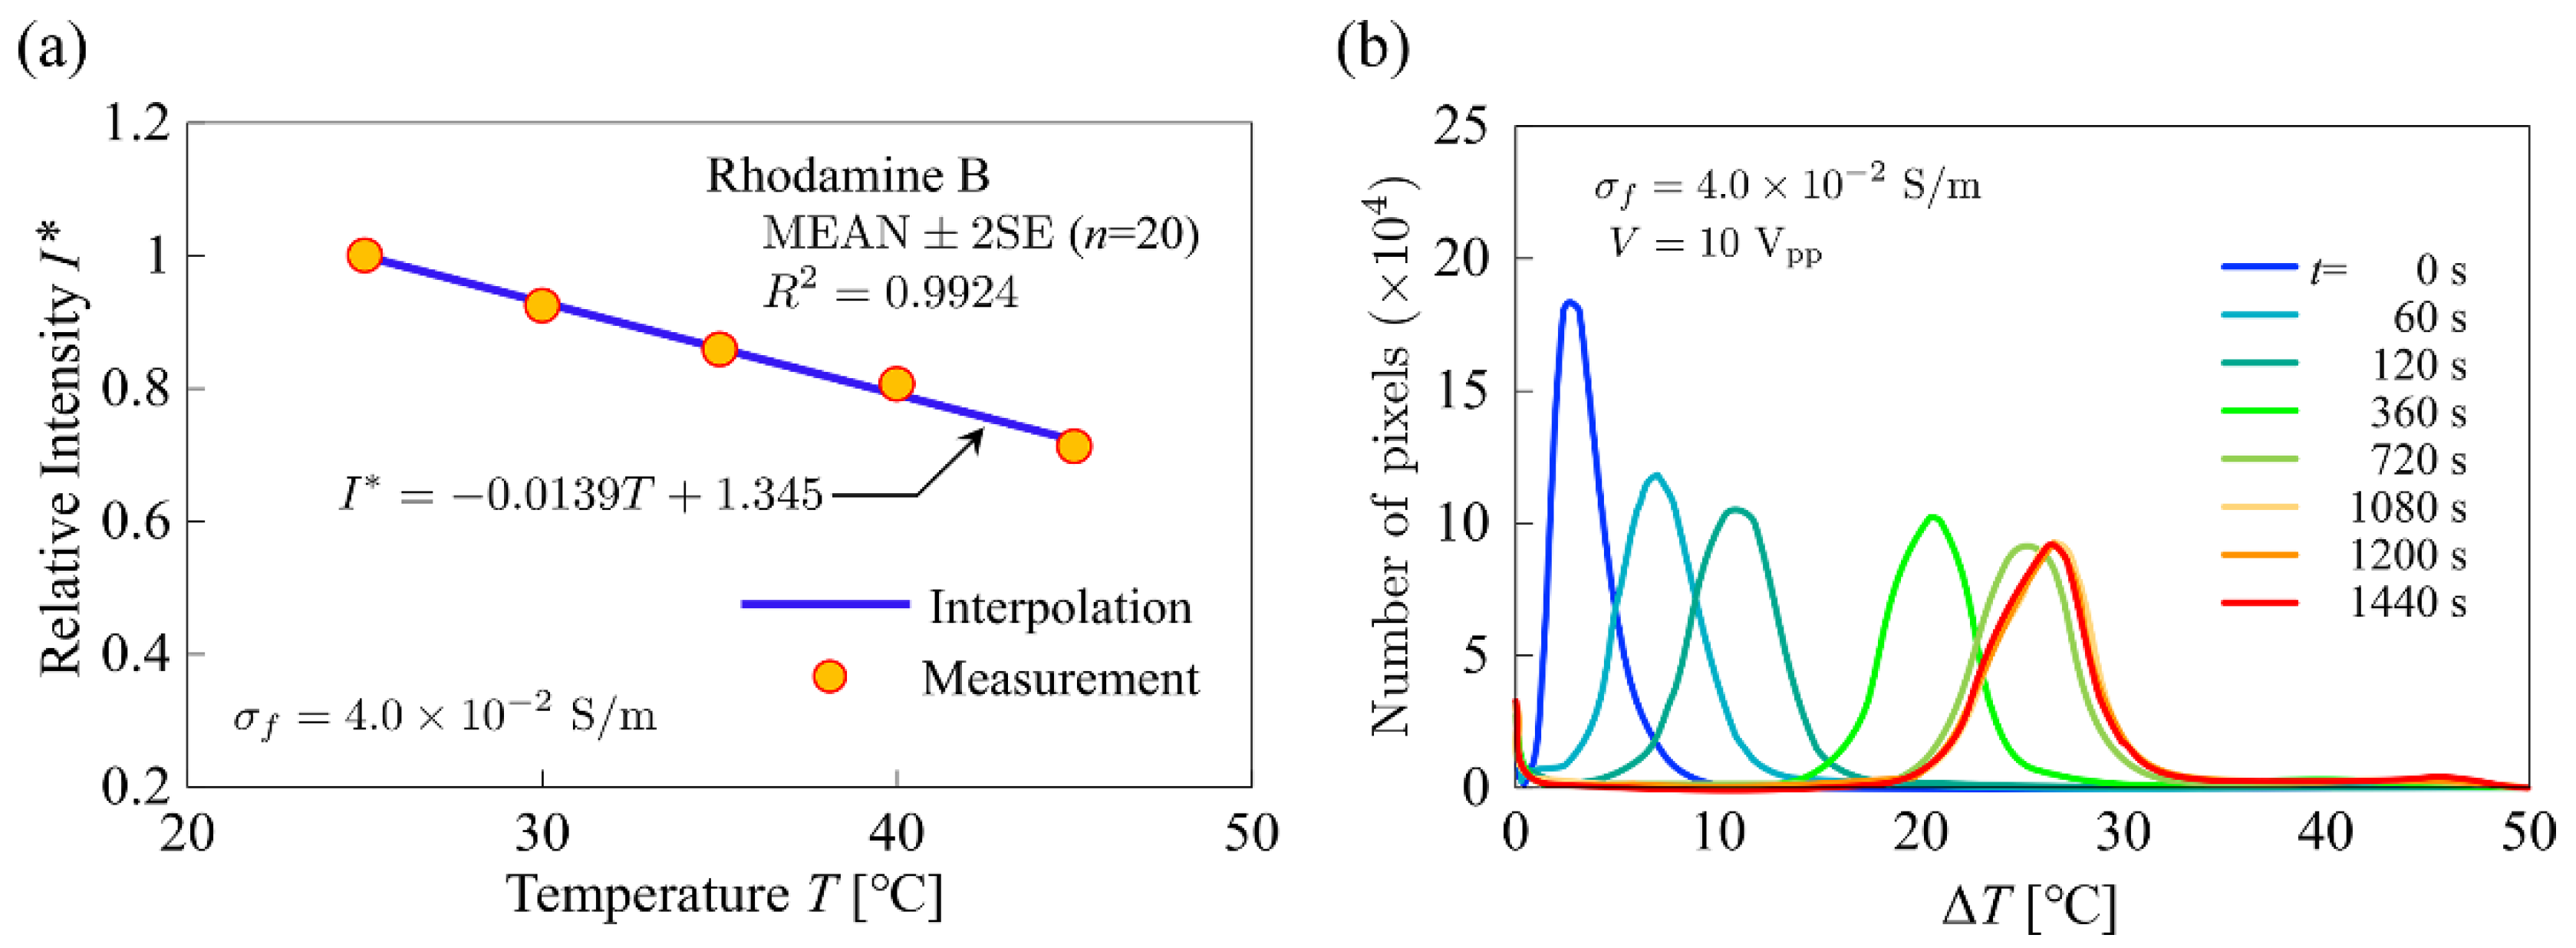
3.5. Temperature Calibration
4. Results and Discussion
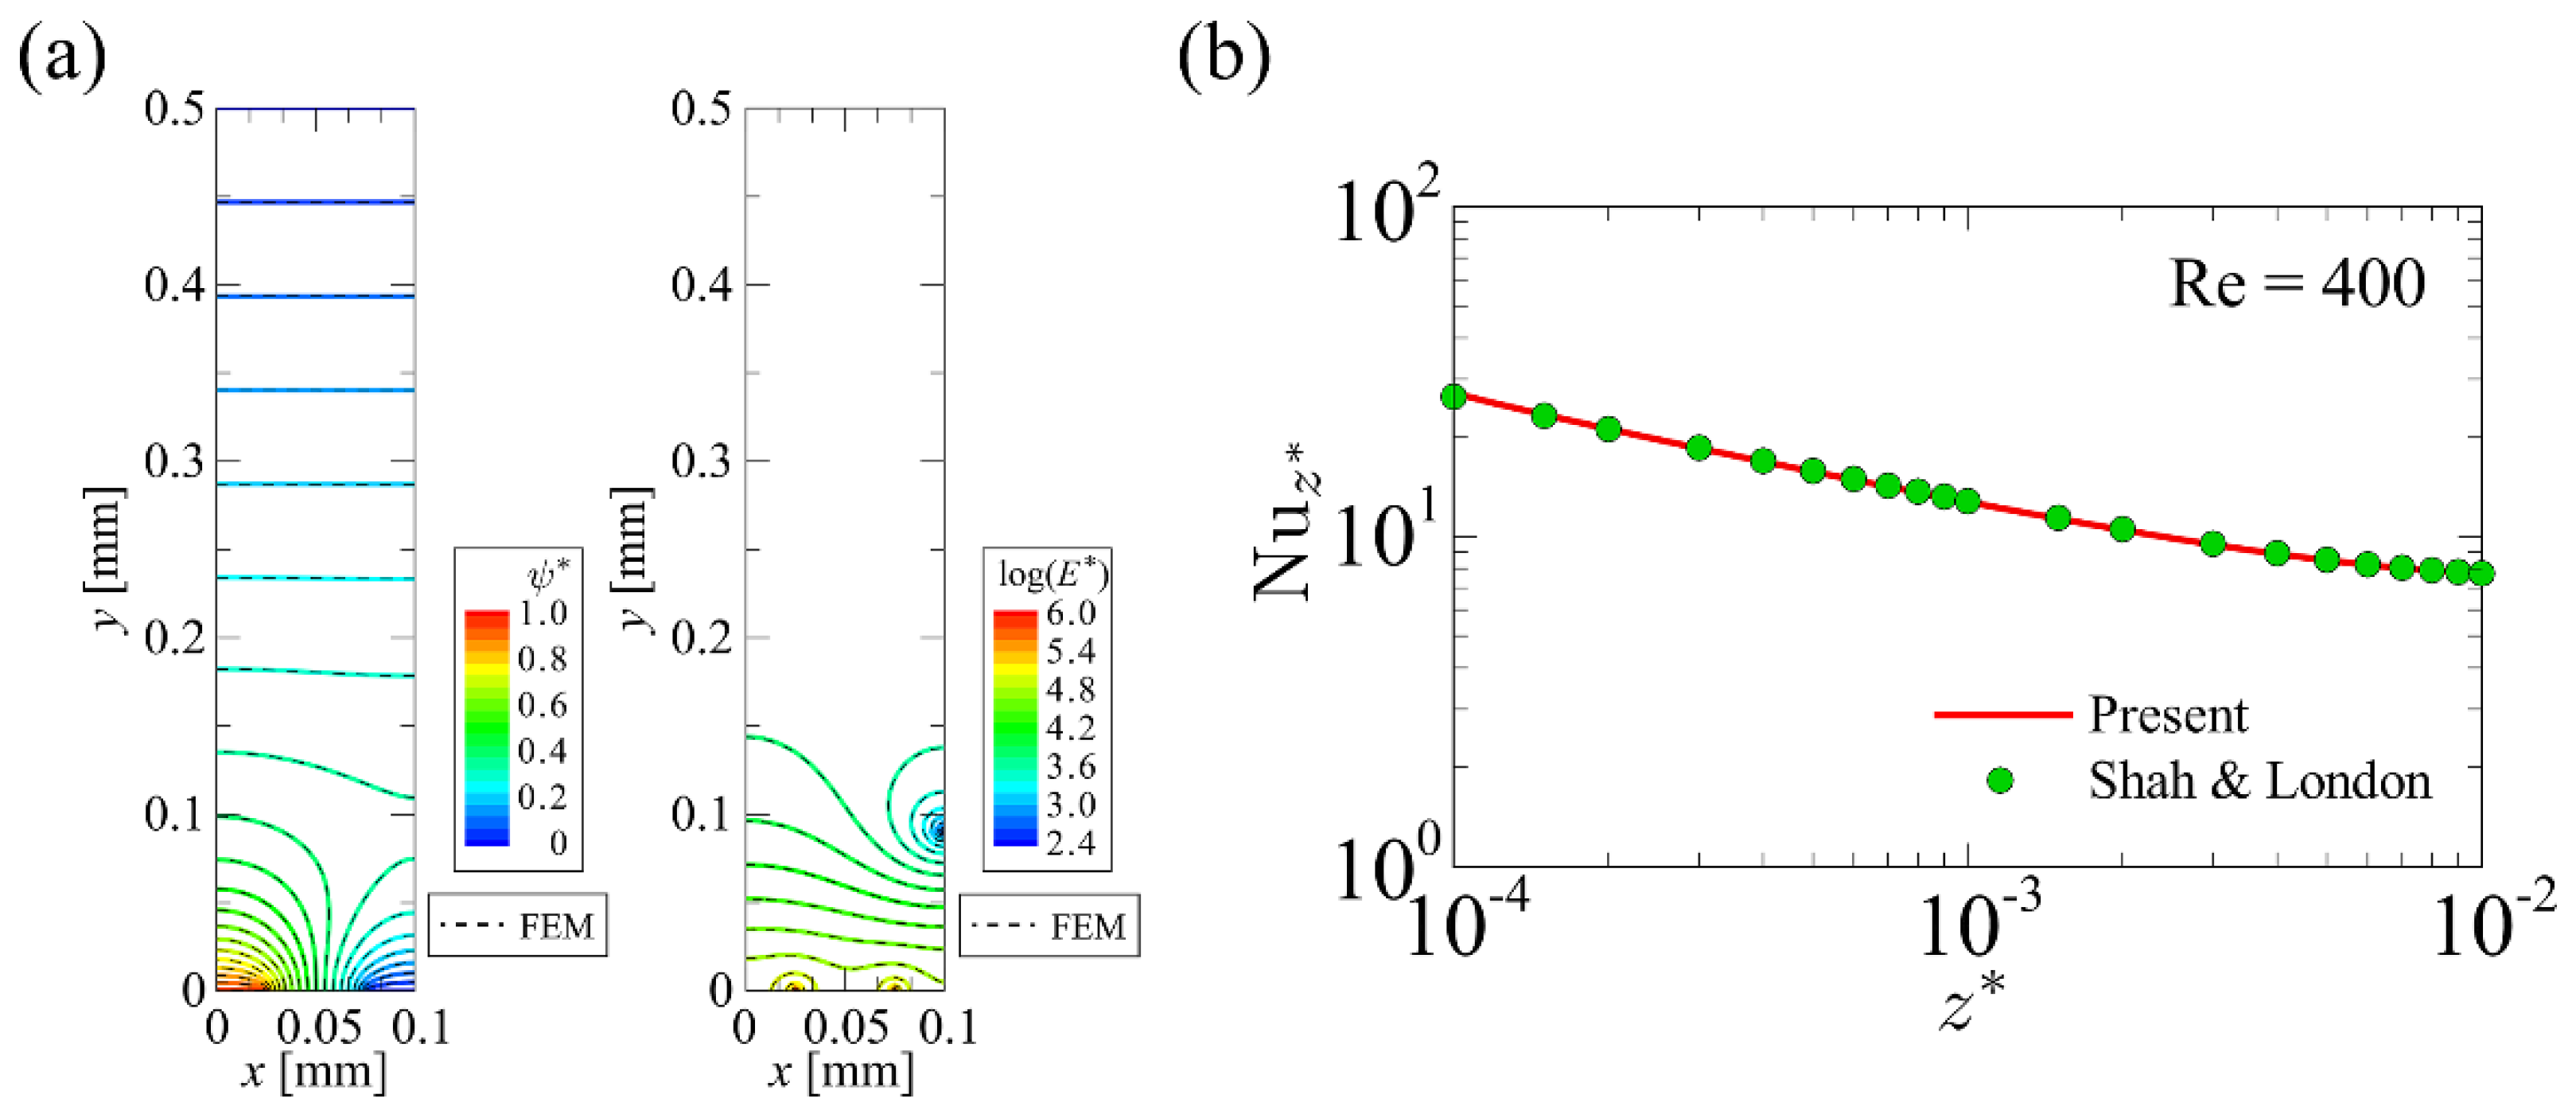
4.1. Developed Code Verification
4.1.1. Developed Code Verification
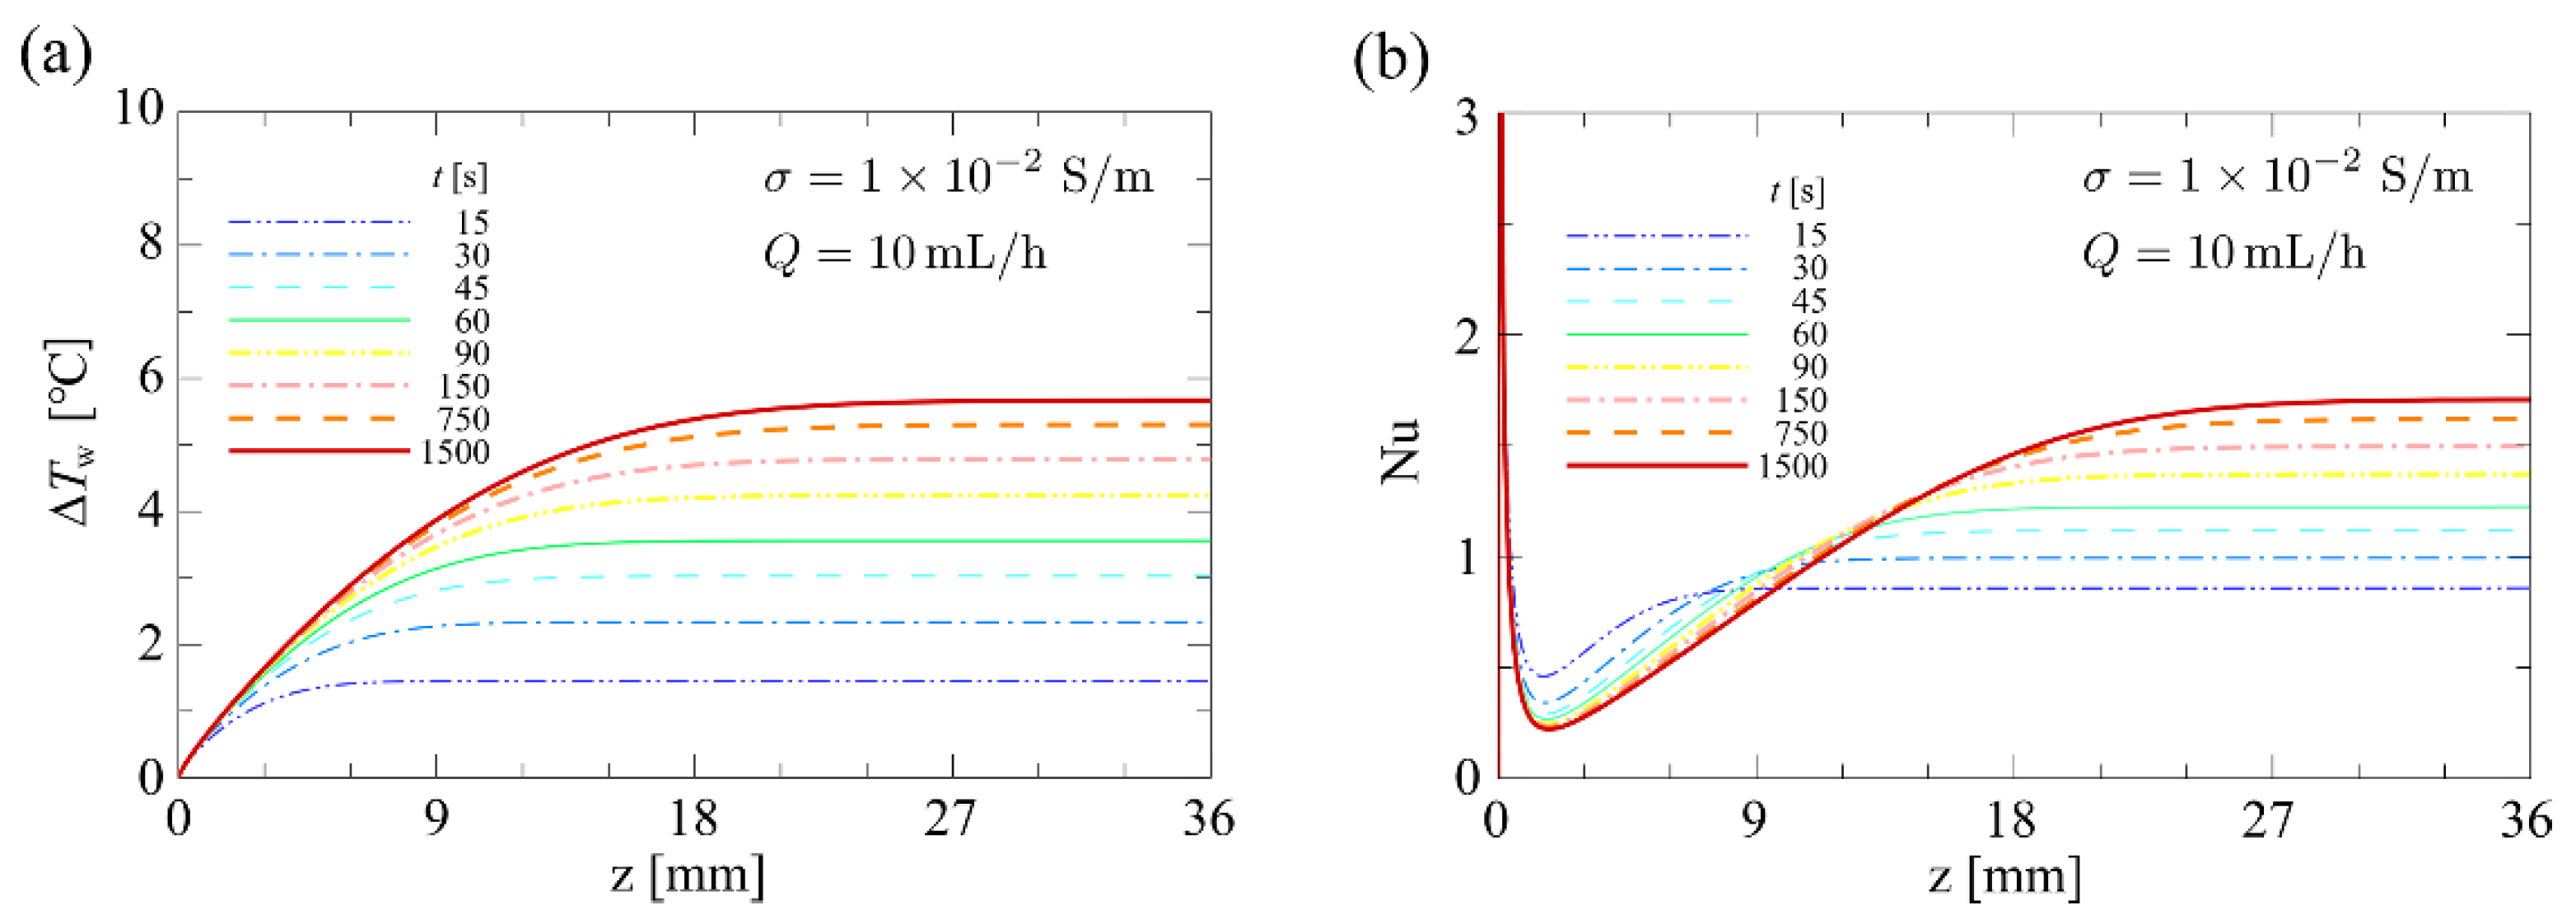
4.1.2. Thermal Structure of the Device
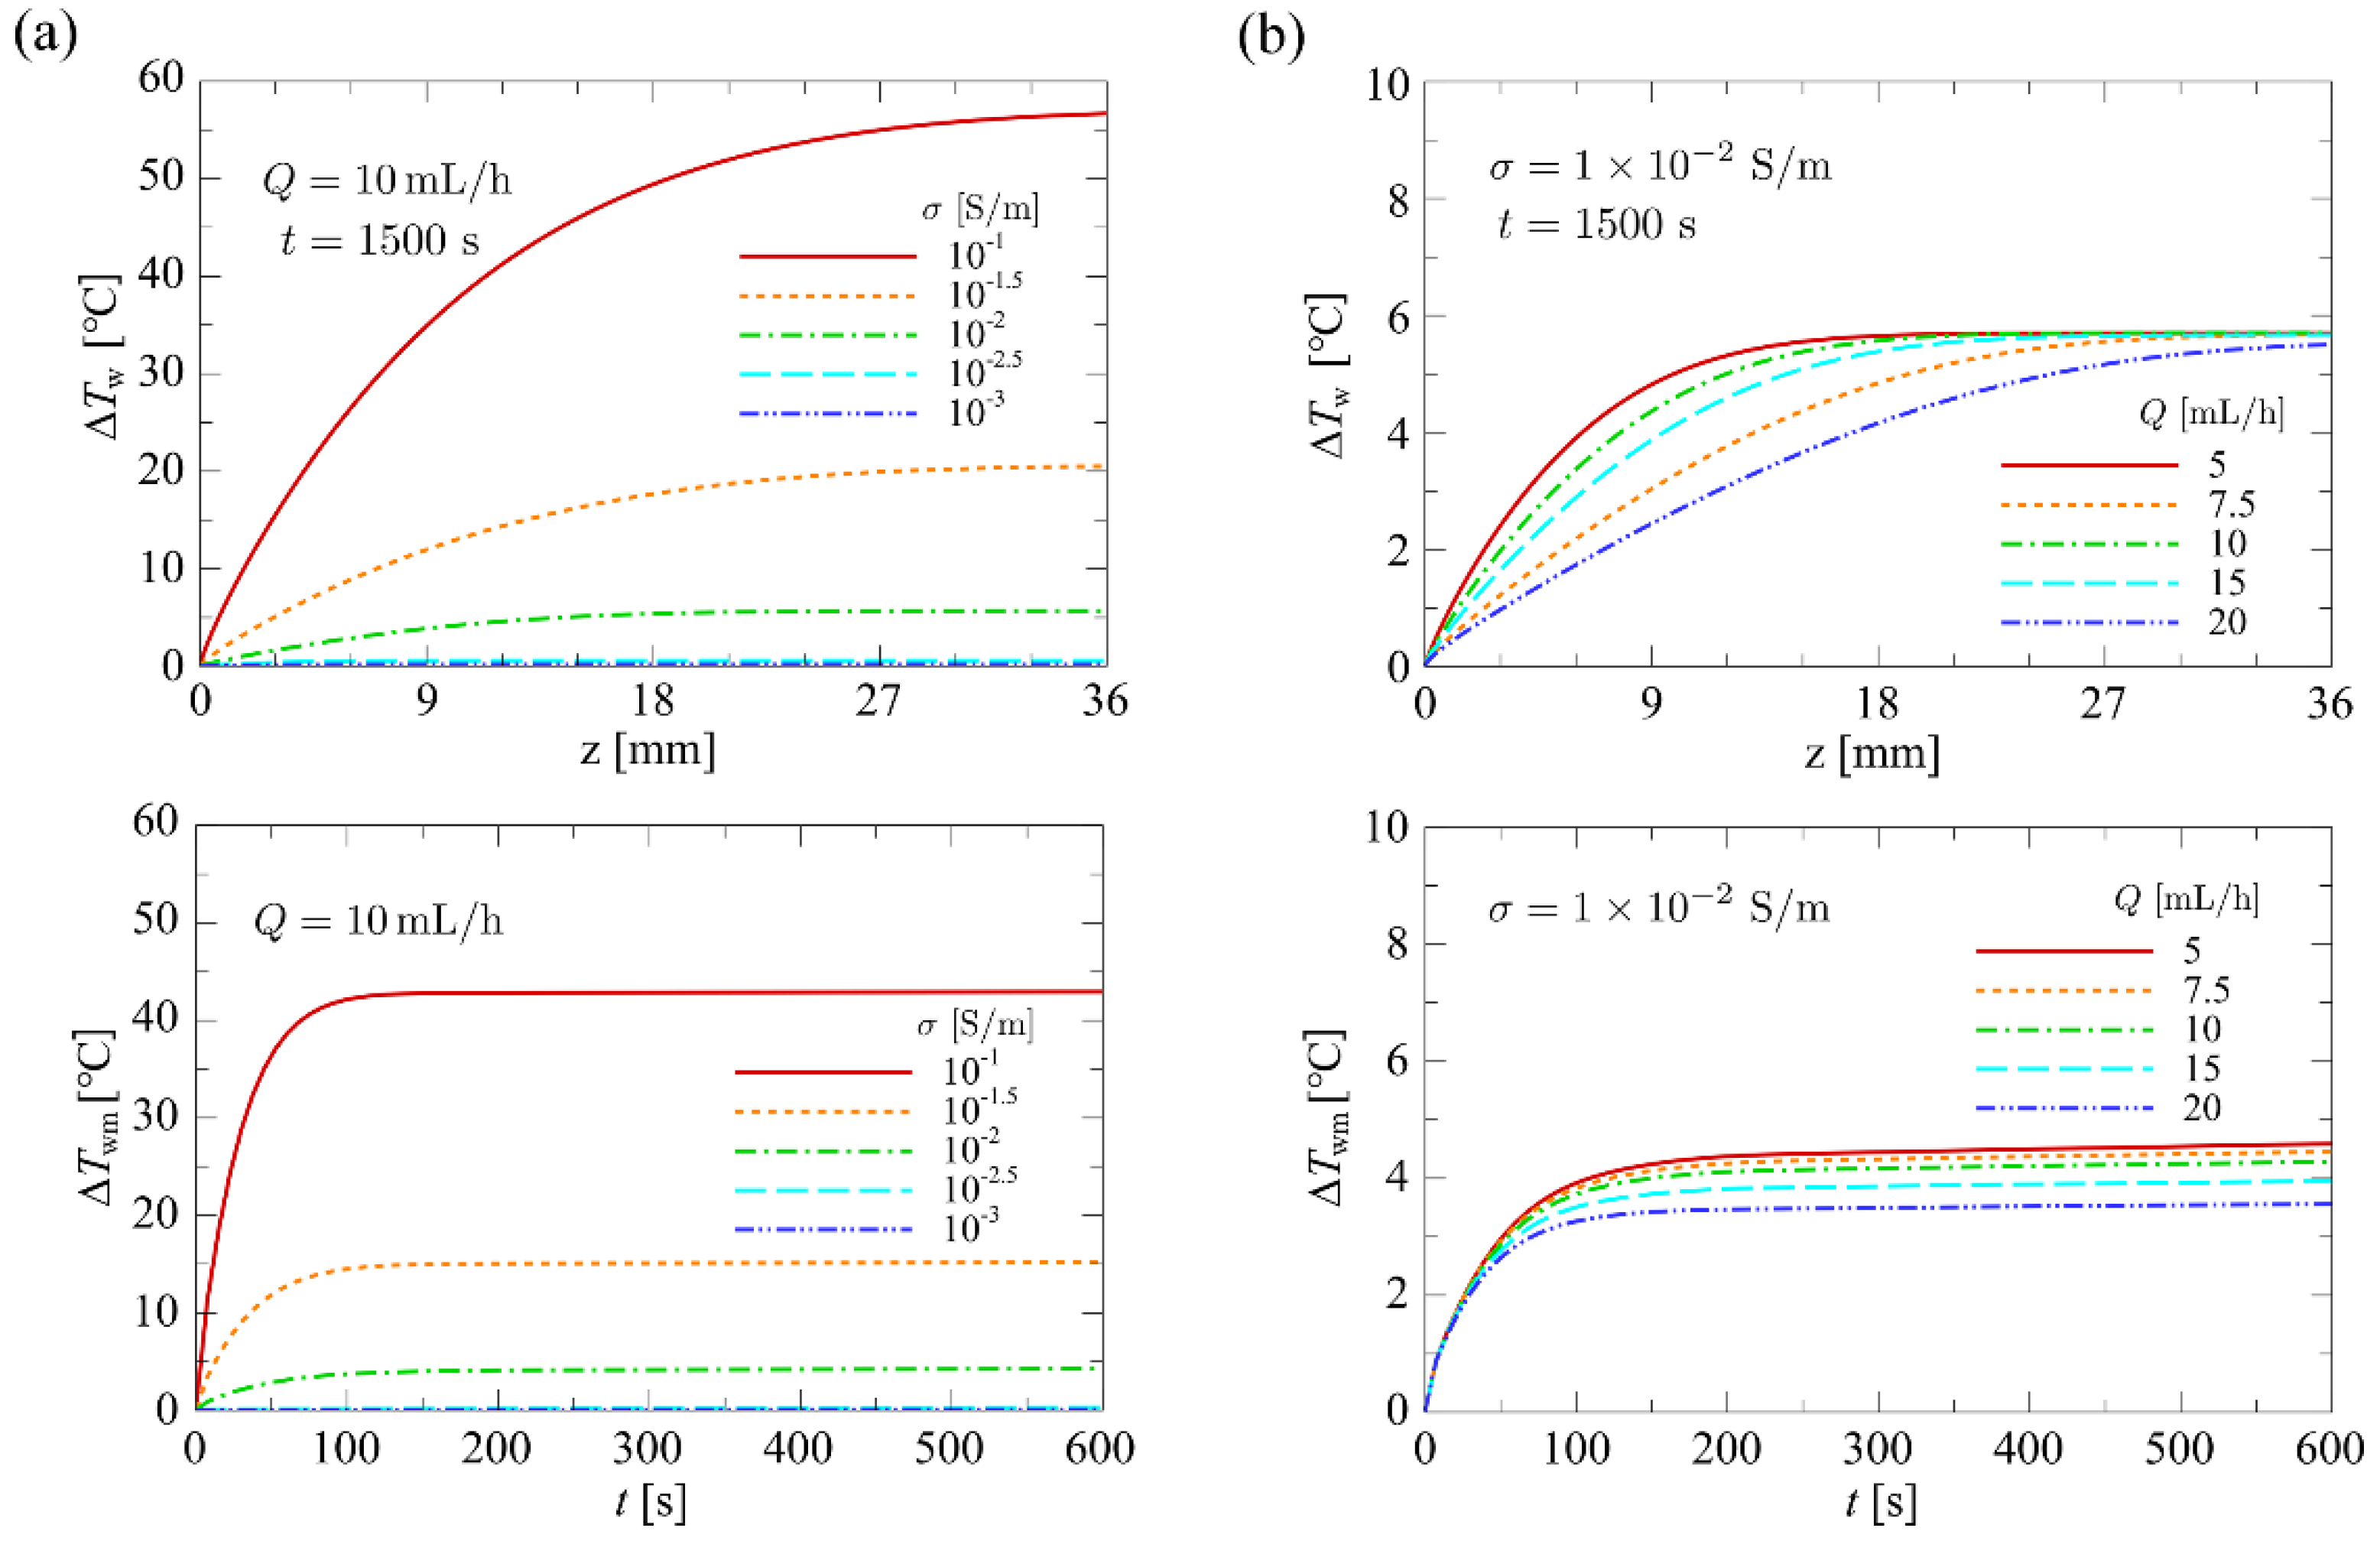
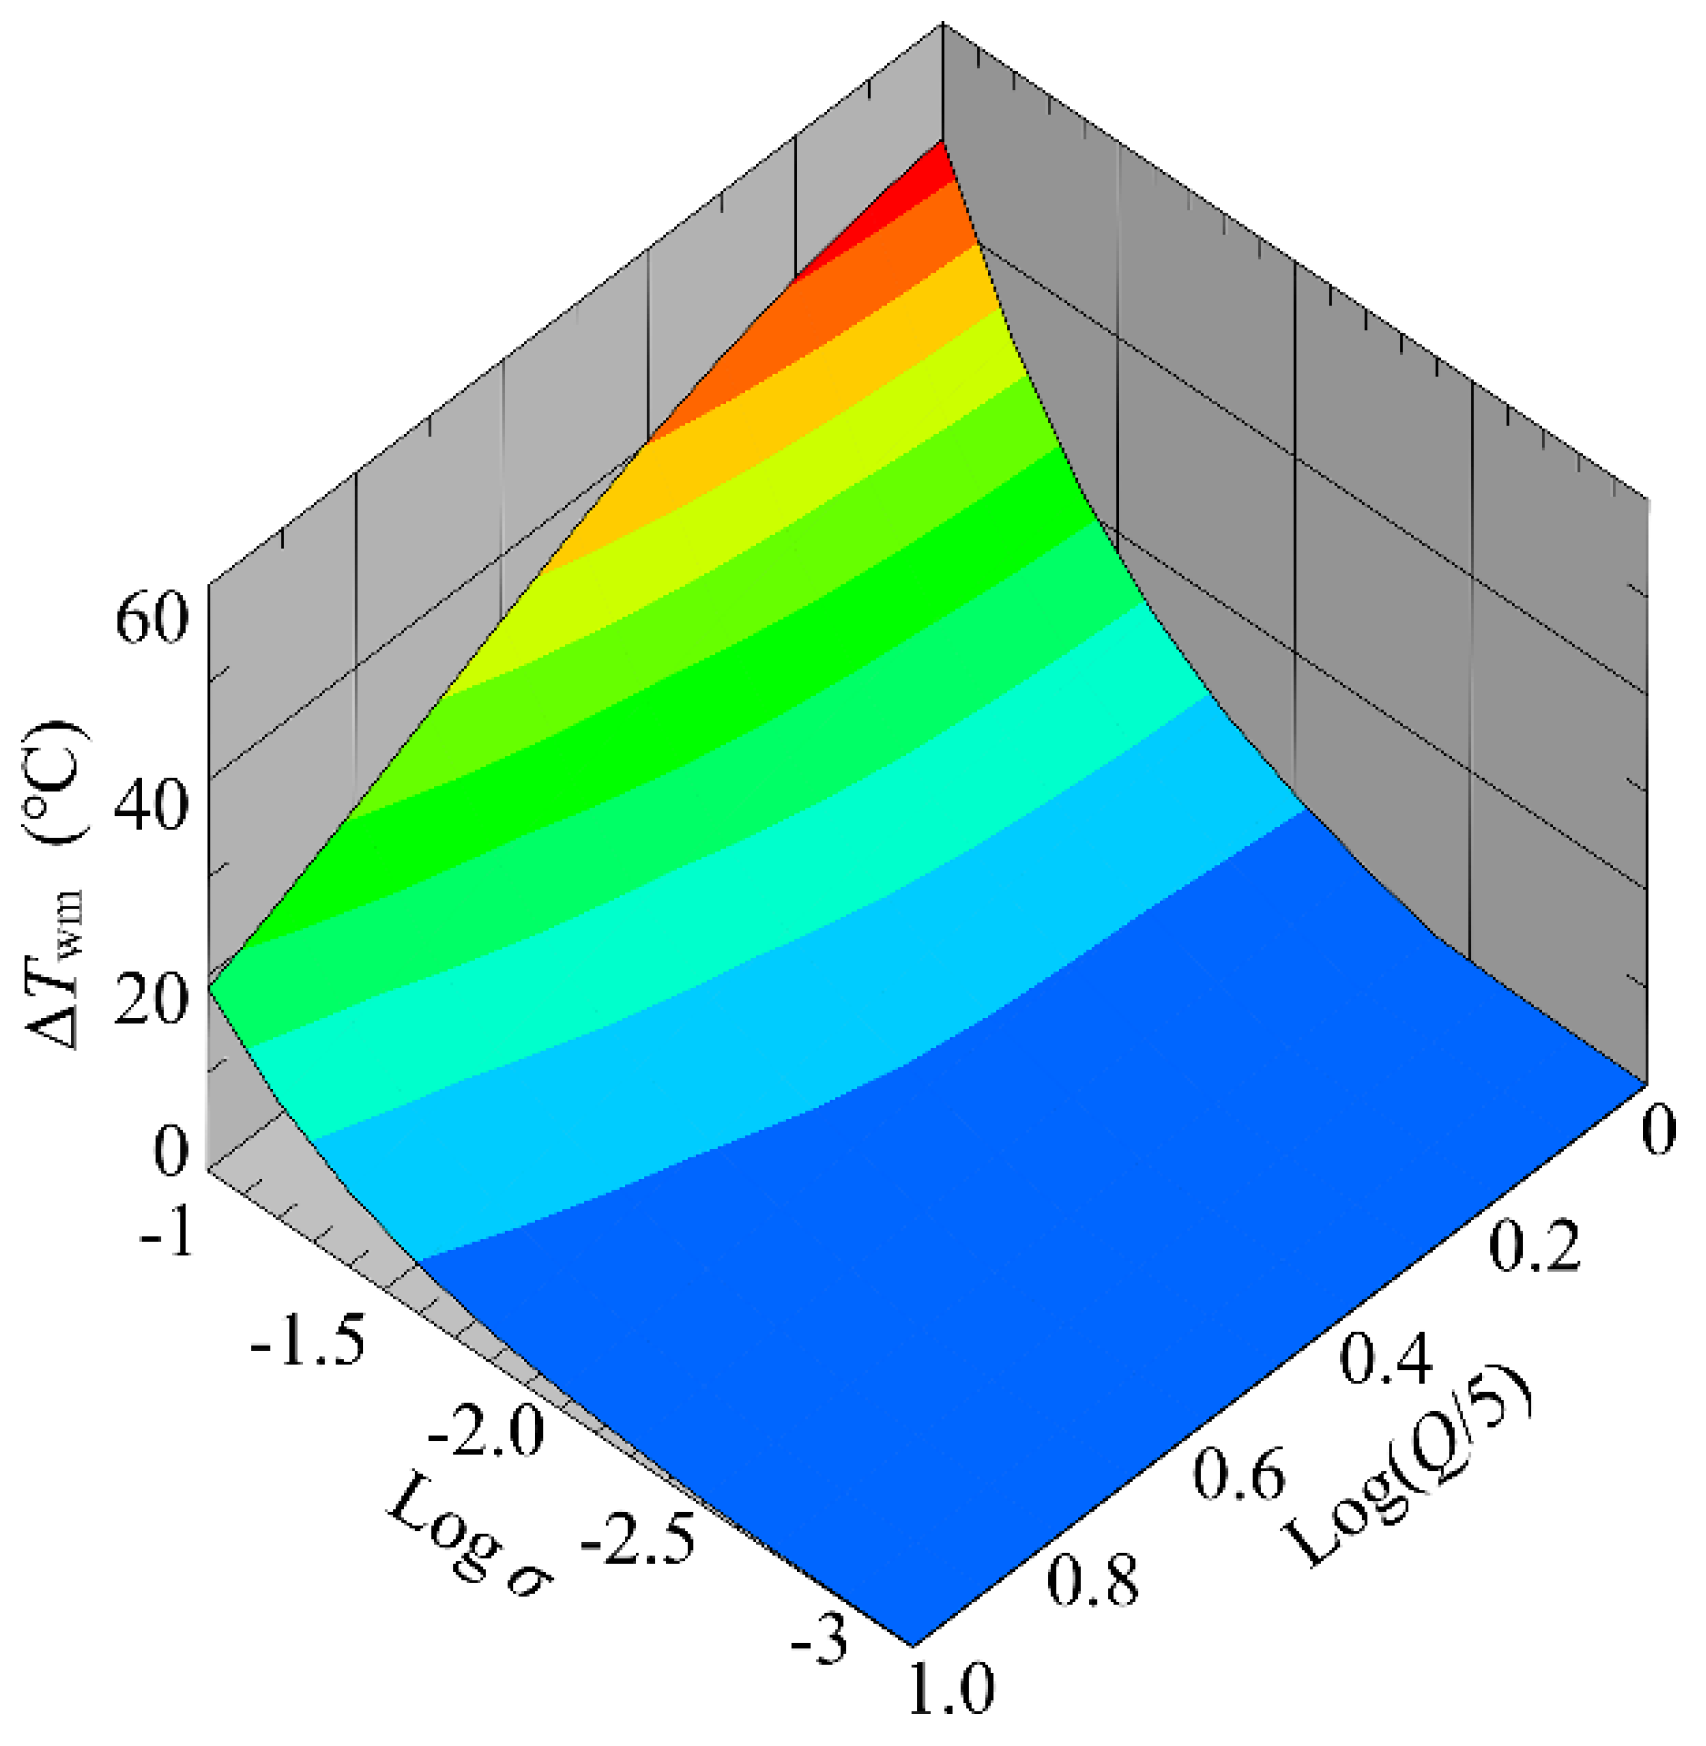
4.1.3. Influence of Flow Rate and Conductivity on Temperature
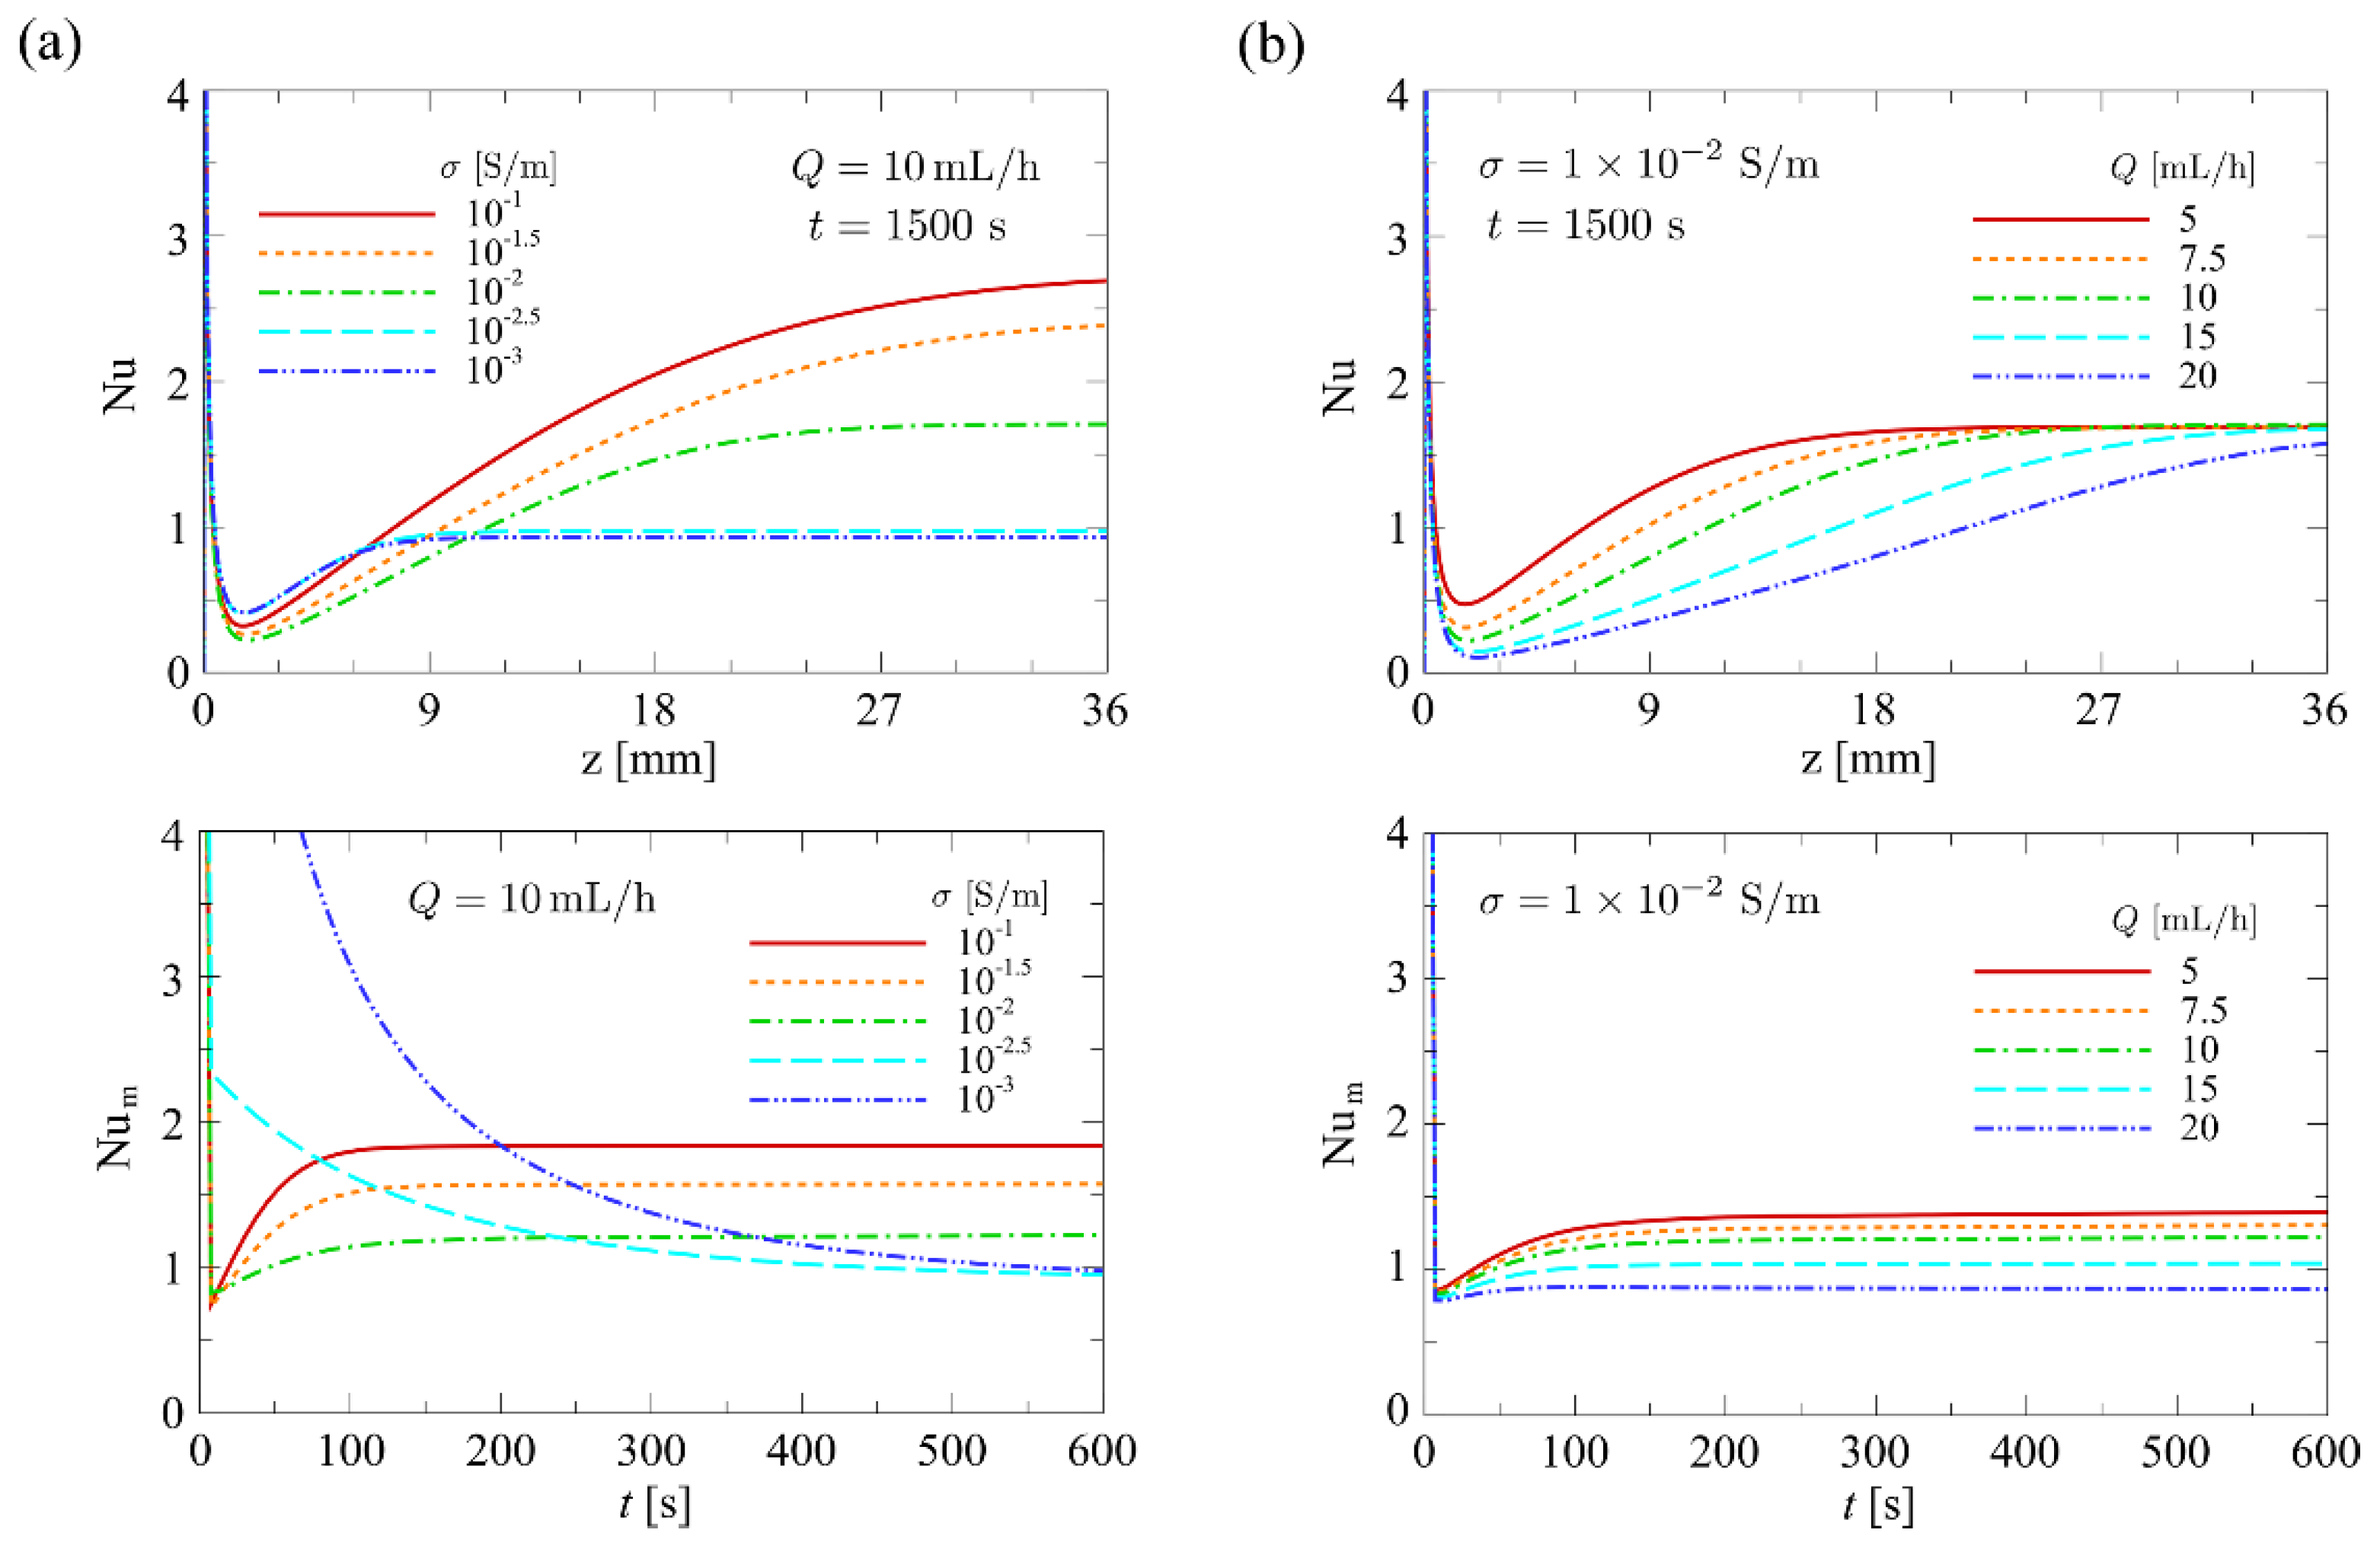
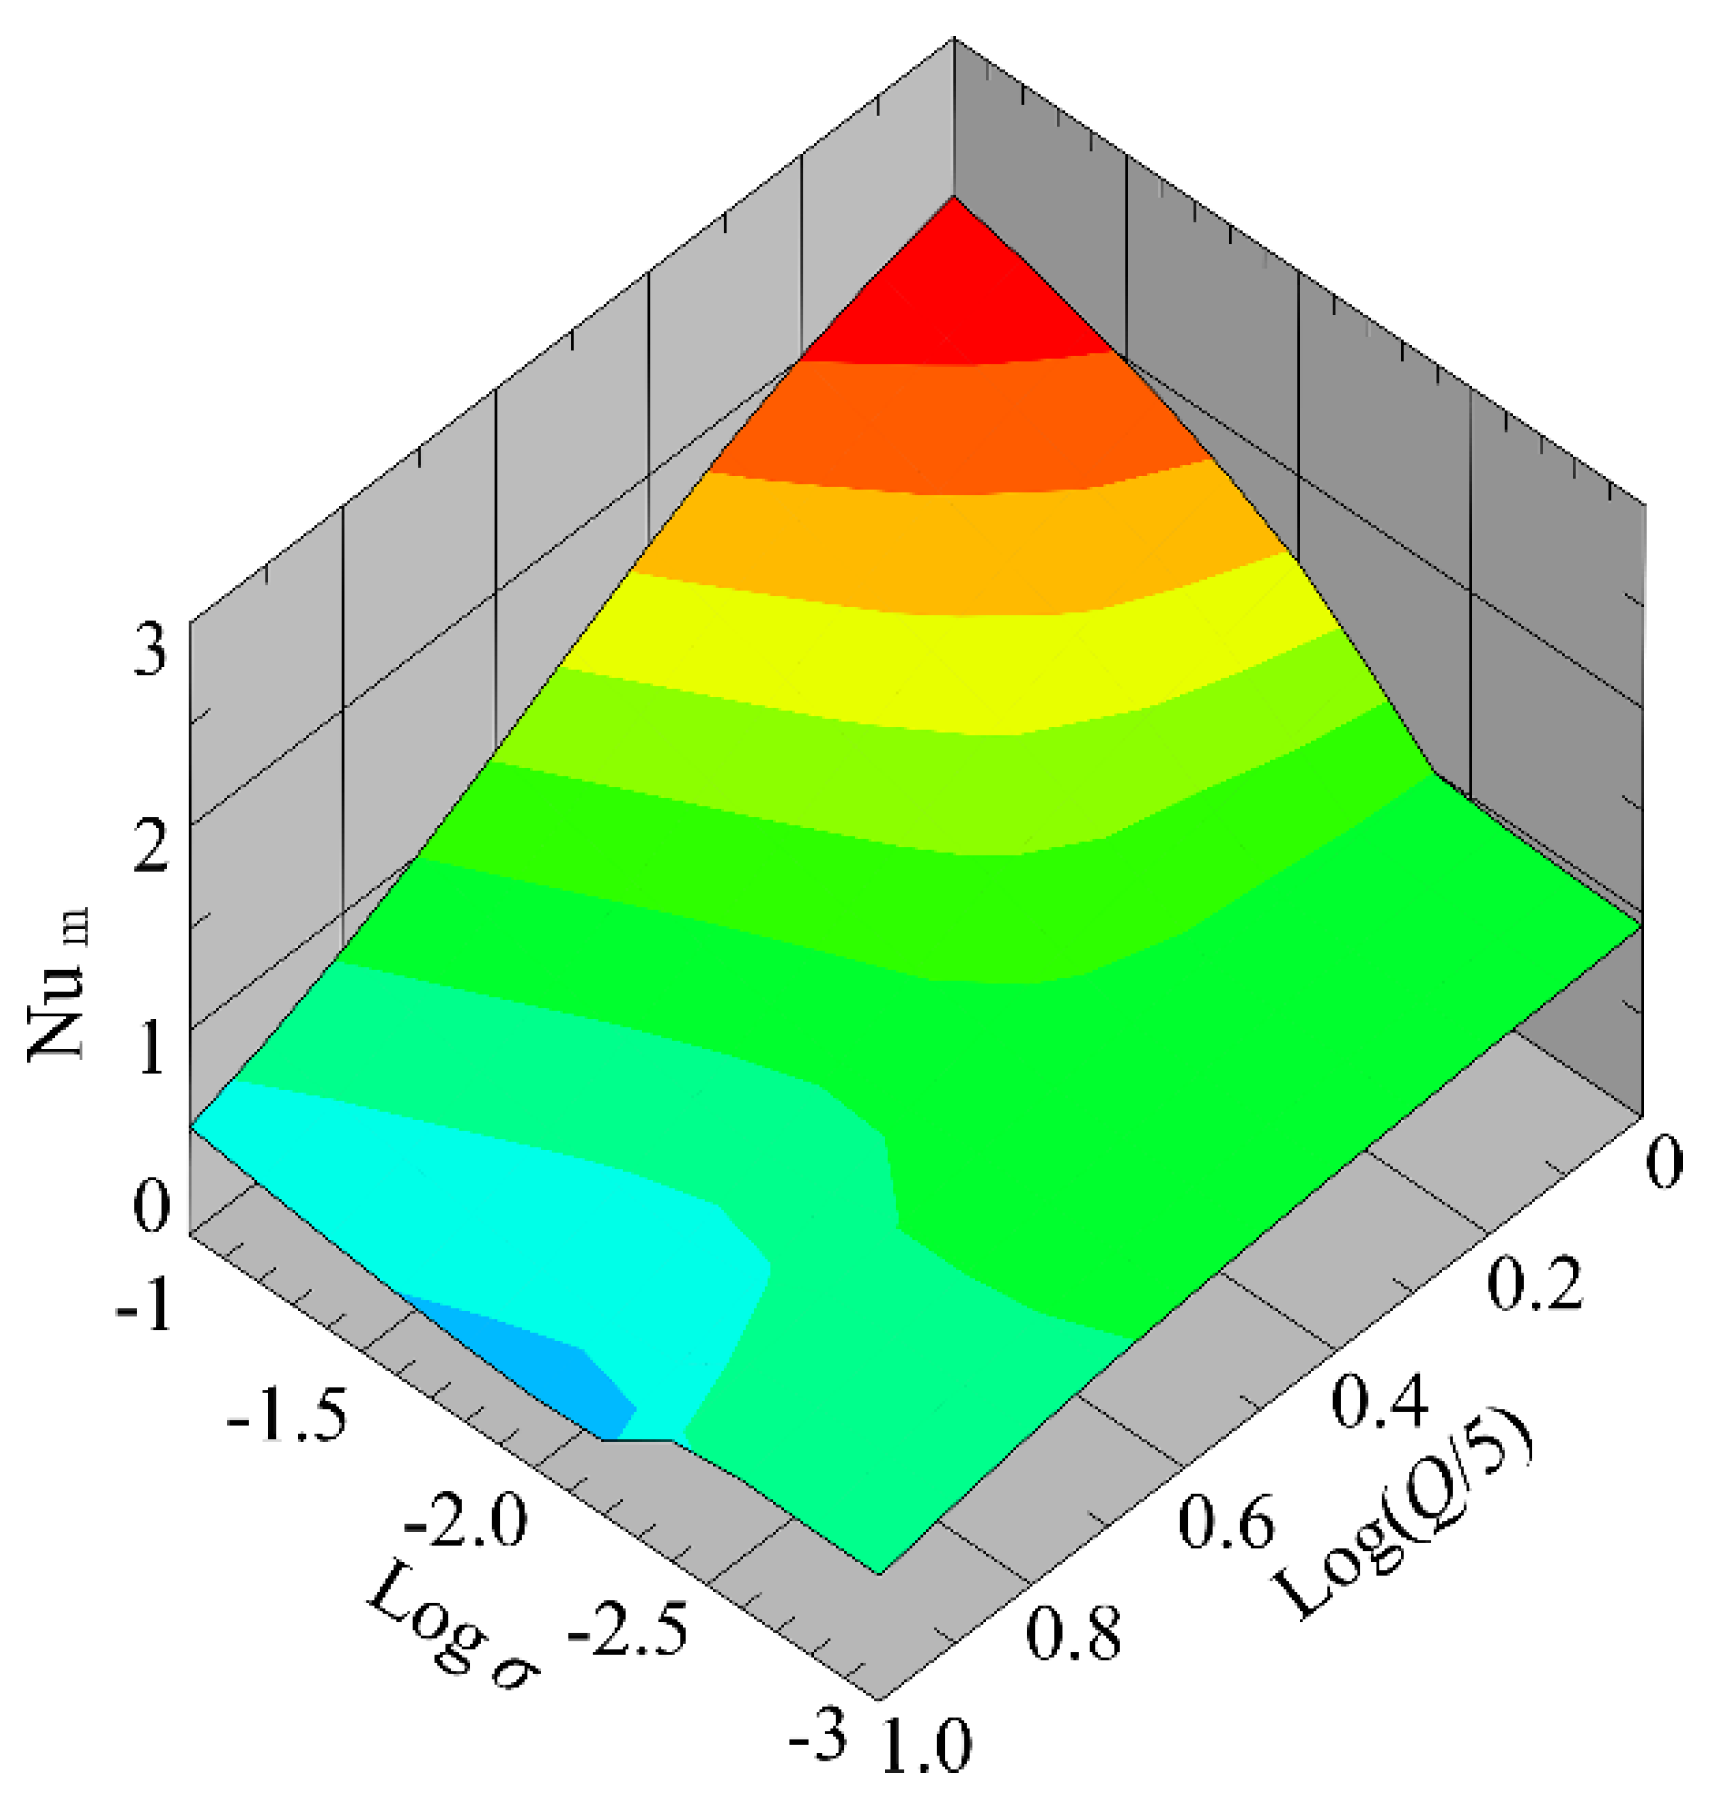
4.1.4. Influence of Flow Rate and Conductivity on the Nusselt Number
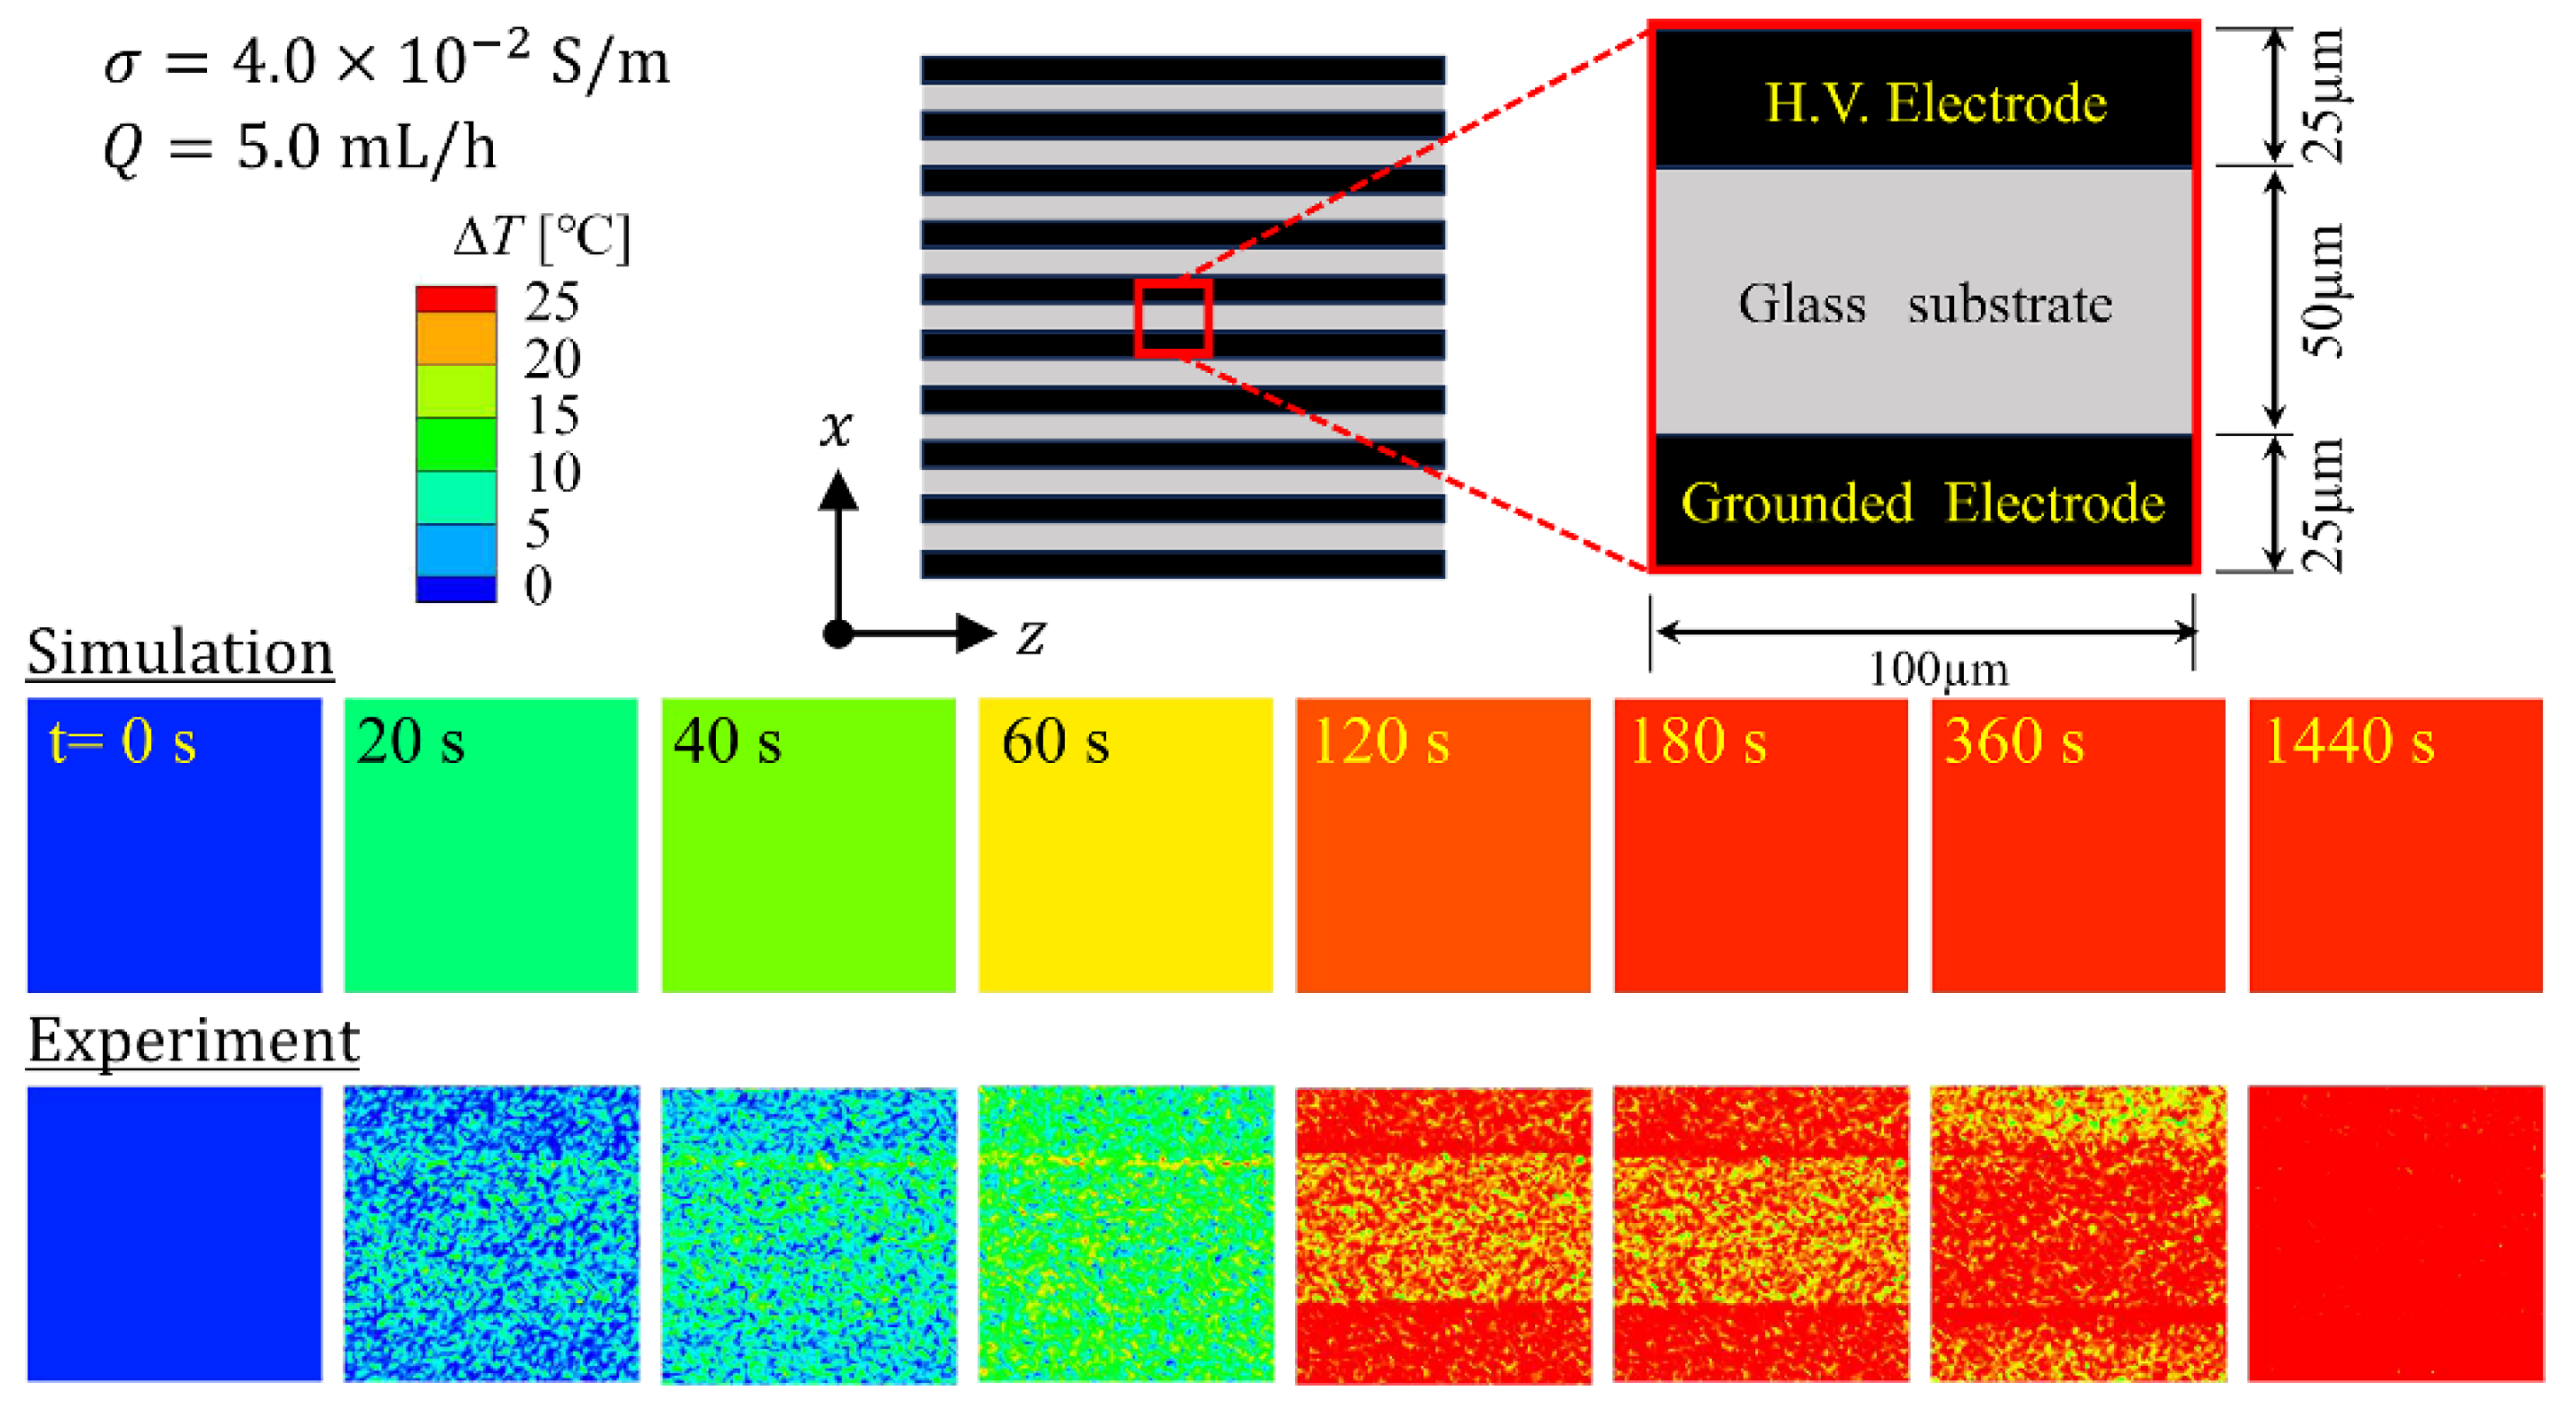
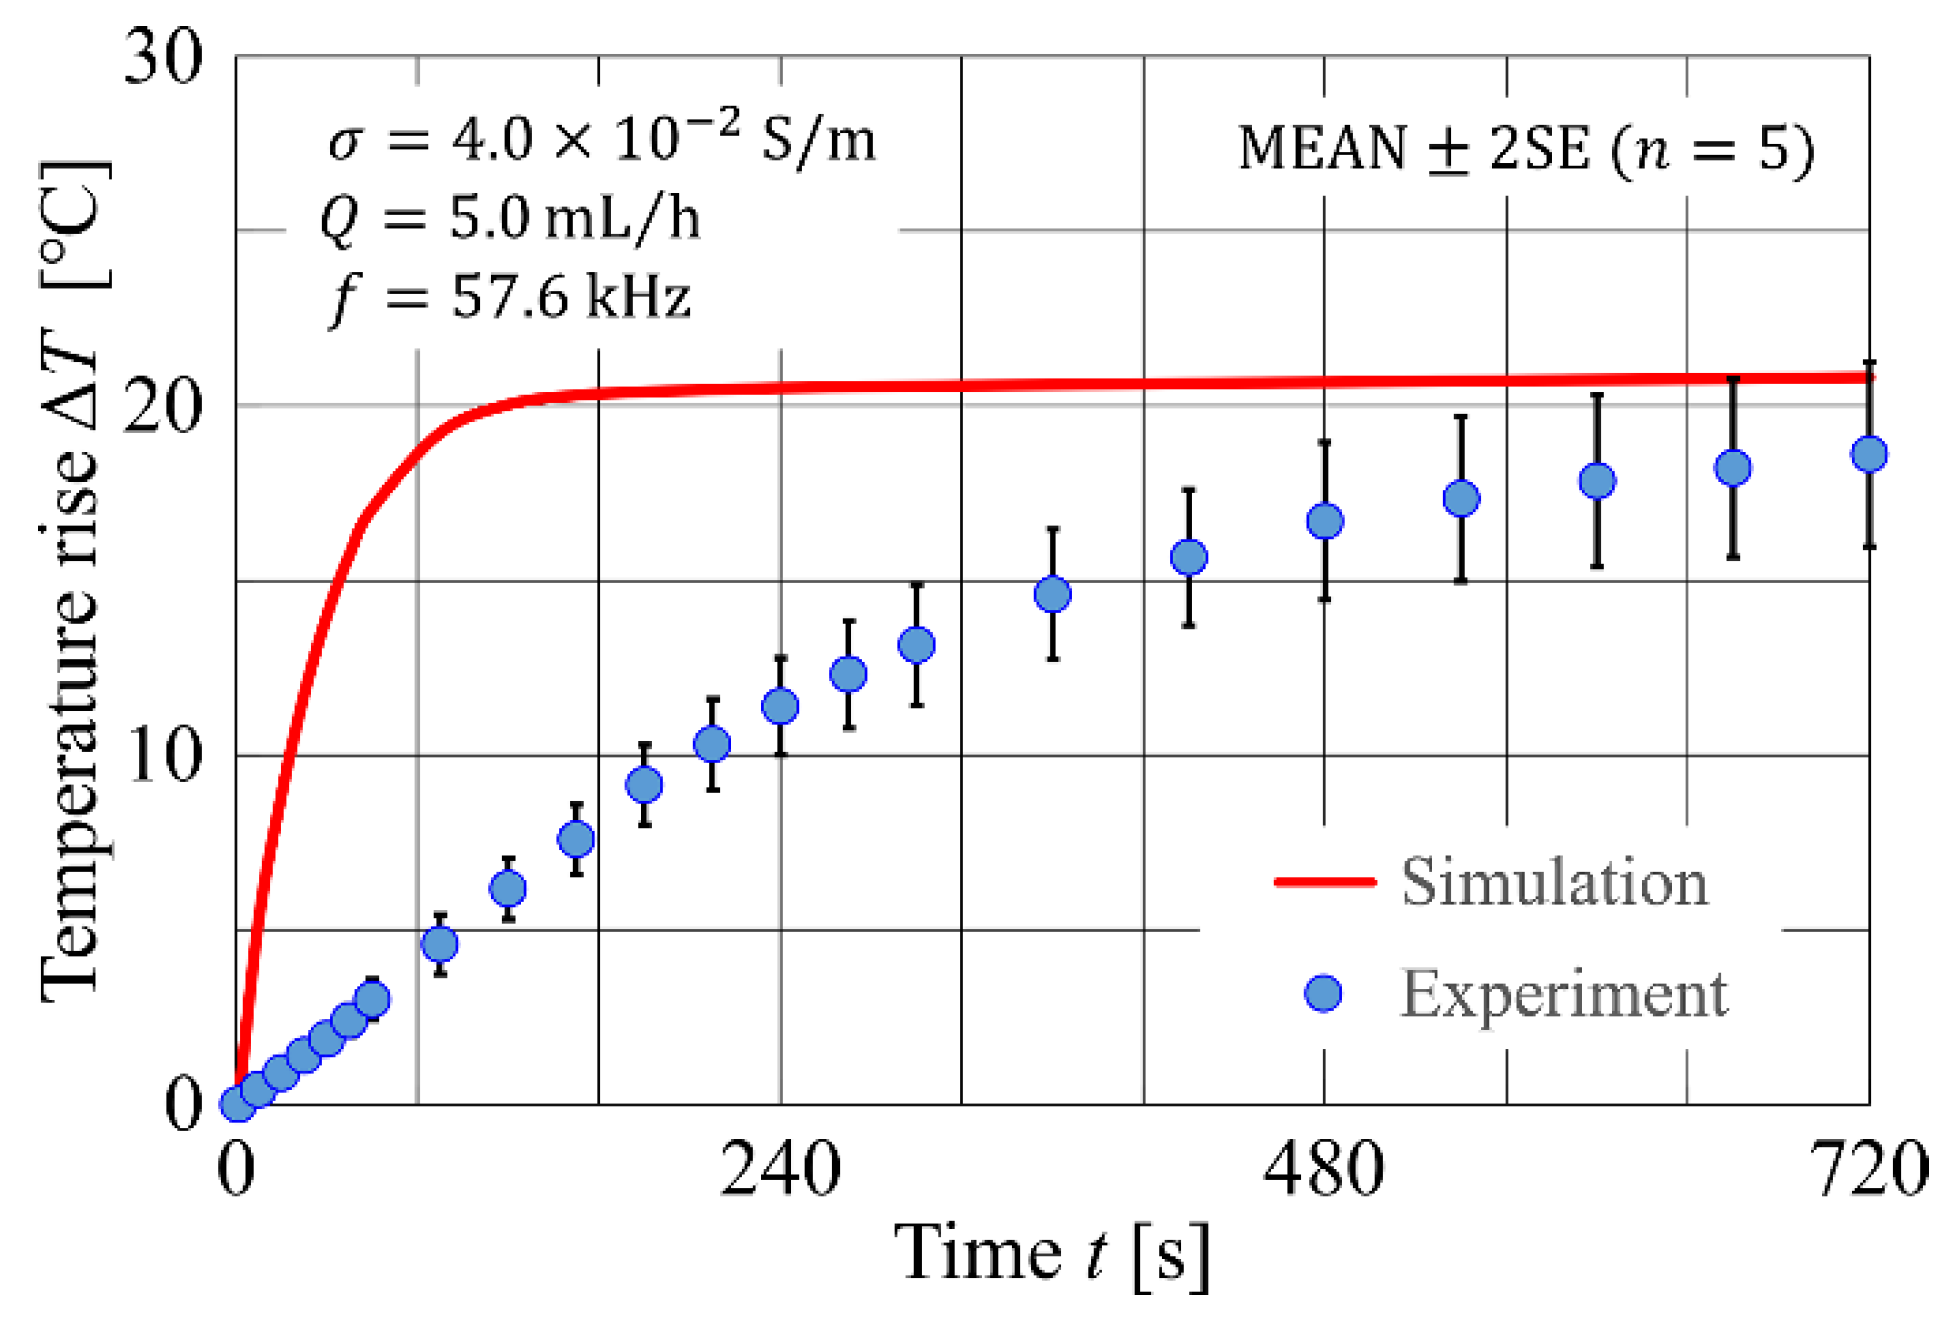
4.2. Experimental Results and Comparison with Numerical Simulation
5. Conclusions
Author Contributions
Funding
Institutional Review Board Statement
Informed Consent Statement
Data Availability Statement
Acknowledgments
Conflicts of Interest
References
- Mustafa, A.; Pedone, E.; Marucci, L.; Moschou, D.; Di Lorenzo, M. A flow-through microfluidic chip for continuous dielec-trophoretic separation of viable and non-viable human T-cells. Electrophoresis 2022, 43(3), 501–508. [CrossRef]
- Puri, P.; Kumar, V.; Belgamwar, S. U.; Ananthasubramanian, M.; Sharma, N. N. Microfluidic platform for dielectrophoretic separation of bio-particles using serpentine microelectrodes. Microsyst Technol 2019, 25(7), 2813–2820. [CrossRef]
- Yildizhan, Y.; Erdem, N.; Islam, M.; Martinez-Duarte, R.; Elitas, M. Dielectrophoretic separation of live and dead monocytes using 3D carbon-electrodes. Sensors 2017, 17(11), 2691. [CrossRef] [PubMed]
- Jones, T. B. Basic theory of dielectrophoresis and electrorotation. IEEE Eng Med Biol Mag 2003, 22(6), 33–42. [CrossRef] [PubMed]
- Aghaamoo, M.; Aghilinejad, A.; Chen, X. L.; Xu, J. On the design of deterministic dielectrophoresis for continuous separation of circulating tumor cells from peripheral blood cells. Electrophoresis 2019, 40(10), 1486–1493. [CrossRef]
- Ayala-Mar, S.; Perez-Gonzalez, V. H.; Mata-Gomez, M. A.; Gallo-Villanueva, R. C.; Gonzalez-Valdez, J. Electrokinetically driven exosome separation and concentration using dielectrophoretic-enhanced PDMS-based microfluidics. Anal Chem 2019, 91(23), 14975–14982. [CrossRef] [PubMed]
- Jiang, A. Y. L.; Yale, A. R.; Aghaamoo, M.; Lee, D. H.; Lee, A. P.; Adams, T. N. G.; Flanagan, L. A. High-throughput continuous dielectrophoretic separation of neural stem cells. Biomicrofluidics 2019, 13(6), 064111. [CrossRef]
- Guerin, N.; Lévesque, M.; Therriault, D. Helical dielectrophoretic particle separator fabricated by conformal spindle printing. J Biomed Sci Eng 2014, 7, 641–650. [CrossRef]
- Martinez-Duarte, R. Microfabrication technologies in dielectrophoresis applications – A review. Electrophoresis 2012, 33(21), 3110–3132. [CrossRef]
- Natu, R.; Martinez-Duarte, R. Numerical model of streaming DEP for stem cell sorting. Micromachines 2016, 7(12), 217. [CrossRef]
- Urdaneta, M.; Smela, E. Multiple frequency dielectrophoresis. Electrophoresis 2007, 28, 3145–3155. [CrossRef] [PubMed]
- Park, S.; Koklu, M.; Beskok, A. Particle trapping in high-conductivity media with electrothermally enhanced negative dielec-trophoresis. Anal Chem 2009, 81(6), 2303–2310. [CrossRef] [PubMed]
- Nedelcu, O. T. A Thermal study on Joule-heating induced effects in dielectrophoretic microfilters. Rom J Inf Sci Technol 2011, 14(4), 309–323.
- Lu, Y.; Ren, Q. L.; Liu, T. T.; Leung, S. L.; Gau, V.; Liao, J. C.; Chan, C. L.; Wong, P. K. Long-range electrothermal fluid motion in microfluidic systems. Int J Heat Mass Transf 2016, 98, 341–349. [CrossRef] [PubMed]
- Pethig, R. Dielectrophoresis: Status of the theory, technology, and applications. Biomicrofluidics 2010, 4(2), 022811. [CrossRef]
- Al-Ahdal, S. A.; Kayani, A. B.; Ali, M. A. M.; Chan, J. Y.; Ali, T.; Adnan, N.; Buyong, M. R.; Noor, E. E. M.; Majlis, B. Y.; Sriram, S. Dielectrophoresis of amyloid-beta proteins as a microfluidic template for Alzheimer’s research. Int J Mol Sci 2019, 20(14), 3595. [CrossRef]
- Seger, U.; Panayiotou, M.; Schnydrig, S.; Jordan, M.; Renaud, P. Temperature measurements in microfluidic systems: Heat dissipation of negative dielectrophoresis barriers. Electrophoresis 2005, 26(11), 2239–2246. [CrossRef]
- Lindquist, S. The heat-shock response. Annu Rev Biochem 1986, 55, 1151–1191. [CrossRef]
- Moritz, A. R. Studies of thermal injury: III. The pathology and pathogenesis of cutaneous burns: An experimental study. Am J Pathol 1947, 23(6), 915–941.
- Harmon, B. V.; Corder, A. M.; Collins, R. J.; Gobe, G. C.; Allen, J.; Allan, D. J.; Kerr, J. F. R. Cell-death induced in a murine mastocytoma by 42–47 degrees heating in vitro: Evidence that the form of death changes from apoptosis to necrosis above a critical heat load. Int J Radiat Biol 1990, 58(5), 845–858. [CrossRef]
- Yamada, K.; Ichikawa, Y.; Okumura, H. Effects of high temperatures on chromosomes of normal and transformed human cells. Hum Cell 1989, 21, 80–85.
- Tay, F. E. H.; Yu, L. M.; Pang, A. J.; Iliescu, C. Electrical and thermal characterization of a dielectrophoretic chip with 3D electrodes for cells manipulation. Electrochim Acta 2007, 52(8), 2862–2868. [CrossRef]
- Sridharan, S.; Zhu, J. J.; Hu, G. Q.; Xuan, X. C. Joule heating effects on electroosmotic flow in insulator-based dielectrophoresis. Electrophoresis 2011, 32(17), 2274–2281. [CrossRef] [PubMed]
- Nakano, A.; Luo, J. H.; Ros, A. Temporal and spatial temperature measurement in insulator-based dielectrophoretic devices. Anal Chem 2014, 86(13), 6516–6524. [CrossRef] [PubMed]
- Williams, S. J.; Chamarthy, P.; Wereley, S. T. Laser-induced Fluorescence Thermometry for Joule Heating in AC Electrokinetic Chips. In Proceedings of the ASME 2008 Fluids Engineering Division Summer Meeting Collocated with the Heat Transfer, Energy Sustainability, and 3rd Energy Nanotechnology Conferences 2008, Florida, USA, 10–14 August 2008.
- Chamarthy, P.; Garimella, S. V.; Wereley, S. T. Non-intrusive temperature measurement using microscale visualization tech-niques. Exp Fluids 2009, 47(1), 159–170. [CrossRef]
- Chamarthy, P.; Garimella, S. V.; Wereley, S. T. Measurement of the temperature non-uniformity in a microchannel heat sink using microscale laser-induced fluorescence. Int J Heat Mass Transf 2010, 53(15–16), 3275–3283. [CrossRef]
- Erickson, D.; Sinton, D.; Li, D. Q. Joule heating and heat transfer in poly (dimethylsiloxane) microfluidic systems. Lab Chip 2003, 3(3), 141–149. [CrossRef]
- Williams, S. J.; Chamarthy, P.; Wereley, S. T. Comparison of experiments and simulation of joule heating in ac electrokinetic chips. Trans ASME J Fluids Eng 2010, 132(2), 021103. [CrossRef]
- Tang, G. Y.; Yang, C. Numerical modeling of Joule heating-induced temperature gradient focusing in microfluidic channels. Electrophoresis 2008, 29(5), 1006–1012. [CrossRef]
- Rasmussen, A.; Mavriplis, C.; Zaghloul, M. E.; Mikulchenko, O.; Mayaram, K. Simulation and optimization of a microfluidic flow sensor. Sens Actuators A 2001, 88(2), 121–132. [CrossRef]
- Gallo-Villanueva, R. C.; Perez-Gonzalez, V. H.; Cardenas-Benitez, B.; Jind, B.; Martinez-Chapa, S. O.; Lapizco-Encinas, B. H. Joule heating effects in optimized insulator-based dielectrophoretic devices: An interplay between post geometry and temper-ature rise. Electrophoresis 2019, 40(10), 1408–1416. [CrossRef]
- Kwak, T. J.; Hossen, I.; Bashir, R.; Chang, W. J.; Lee, C. H. Localized dielectric loss heating in dielectrophoresis devices. Sci Rep 2019, 9, 18977. [CrossRef] [PubMed]
- Wang, Q. R.; Dingari, N. N.; Buie, C. R. Nonlinear electrokinetic effects in insulator-based dielectrophoretic systems. Electro-phoresis 2017, 38(20), 2576–2586. [CrossRef] [PubMed]
- Khoshmanesh, K.; Akagi, J.; Nahavandi, S.; Skommer, J.; Baratchi, S.; Cooper, J. M.; Kalantar-Zadeh, K.; Williams, D. E.; Wlodkowic, D. Dynamic analysis of drug-induced cytotoxicity using chip-based dielectrophoretic cell immobilization technology. Anal Chem 2011, 83(6), 2133–2144. [CrossRef] [PubMed]
- Nagasaka, A.; Seki, Y.; Tomiyama, N.; Mori, U.; Eguchi, M.; Tada, S. Development of High-throughput Cell Separation Micro-fluidic Device Using Dielectrophoresis. In Proceedings of the 9th World Congress of Biomechanics 2022 Taipei, Taipei, Taiwan, 10–14 July 2022.
- Wu, J.; Lian, M.; Yang, K. Micropumping of biofluids by alternating current electrothermal effects. Appl Phys Lett 2007, 90(23), 3. [CrossRef]
- Ren, Y. K.; Liu, W. Y.; Tao, Y.; Hui, M.; Wu, Q. S. On AC-field-induced nonlinear electroosmosis next to the sharp cor-ner-field-singularity of leaky dielectric blocks and its application in on-chip micro-mixing. Micromachines 2018, 9(3), 102. [CrossRef] [PubMed]
- Akutsu, D.; Motosuke, M.; Honami, S. A Study on Particle Manipulation in Microchannel with High Frequency AC Electrokinetics. In Proceedings of the Japan Society of Mechanical Engineers; the Fluids Engineering Conference 2009, Nagoya, Japan, 7–8 November 2009.
- McAdams, W.H. Heat Transmission, 3rd ed.; McGraw-Hill Book Company, NY, USA, 1954.
- Fishenden, M.; Saunders, O. A. An Introduction to Heat Transfer, Oxford University Press, Oxford, UK, 1950.
- Alarabi, M.; Elriedy, M. K. Natural-convection heat-transfer from isothermal horizontal plates of different shapes. Int J Heat Mass Transf 1976, 19(12), 1399–1404. [CrossRef]
- Yousef, W. W.; Tarasuk, J. D.; Mckeen, W. J. Free convection heat transfer from upward-facing isothermal horizontal surfaces. Trans ASME J Heat Transf 1982, 104, 493–500. [CrossRef]
- Shah, R.K.; London, A.L. Laminar flow forced convection in ducts, Advances in Heat Transfer, Supplement 1; Academic Press: New York, NY, USA, 1978.
- Elengoe, A.; Alitheen, N. B. M.; Hamdan, S. B. Hyperthermia effect on human normal breast (MCF-10A) and cancer (MDA-MB 231 and MCF-7) cells. Asian J Pharm Clin Res 2019, 12(3), 512–515. [CrossRef]
- Pulavarthy, R.A.; Alam, M.T.; Haque, M.A. Effect of heated zone size on micro and nanoscale convective heat transfer. Int Commun Heat Mass Transf 2014, 52, 56–60. [CrossRef]

| Parameters | Values |
| Applied voltage [] | 10 |
| Rhodamine B solution [μM] | 20 |
| Solution conductivity [S/m] | |
| Frequency [kHz] | 57.6 |
| Flow rate [mL/h] | 5 |
Disclaimer/Publisher’s Note: The statements, opinions and data contained in all publications are solely those of the individual author(s) and contributor(s) and not of MDPI and/or the editor(s). MDPI and/or the editor(s) disclaim responsibility for any injury to people or property resulting from any ideas, methods, instructions or products referred to in the content. |
© 2024 by the authors. Licensee MDPI, Basel, Switzerland. This article is an open access article distributed under the terms and conditions of the Creative Commons Attribution (CC BY) license (http://creativecommons.org/licenses/by/4.0/).


