Preprint
Article

Inhibition of Aβ Aggregation by Cholesterol-End-Modified PEGs Vesicle and Micelle

Altmetrics

Downloads

92

Views

31

Comments

0

This version is not peer-reviewed

Submitted:

11 October 2024

Posted:

13 October 2024

You are already at the latest version

Alerts
Abstract
We evaluated the inhibitory effects of our developed Chol-PEG2000 micelles and Chol-PEG500 vesicles on amyloid-β (Aβ) aggregation, a key factor in Alzheimer's disease. ThT assay proved that Chol-PEG2000 delayed Aβ fibril elongation by 17 hours and Chol-PEG500 by 40 hours at 10-times molar ratio against Aβ40 peptide. At 50-times molar ratio, both Chol-PEG2000 and Chol-PEG500 significantly inhibited Aβ aggregation, as shown by minimal fluorescence intensity increase over 48 hours.
Keywords: 
Subject: Chemistry and Materials Science  -   Biomaterials

1. Introduction

In the brains of Alzheimer’s disease (AD) patients, amy-loid-beta (Aβ) peptides are produced by sequential proteo-lytic cleavages of a membrane-bound protein called amyloid-beta precursor protein (APP) by proteases known as β-secretase and γ-secretase [1,2]. These Aβ peptides, consisting of around 40 amino acid residues, are known for their high propensity to form β-sheets and aggregate. Aggregated Aβ peptides have been reported in numerous studies to form amyloid plaques, which induce neuronal cell death [3,4]. The neuronal cell death leads to brain atrophy and cognitive impairment, ultimately resulting in the onset of AD [5,6] Such diseases triggered by conformational changes in peptides or proteins are collectively referred to as "conforma-tional dieases" [7]. Therefore, controlling peptide conformation is crucial for the treatment of AD and other conformational diseases. Consequently, significant efforts have been made to develop AD therapeutics targeting Aβ. Various agents, such as secretase inhibitors, anti-Aβ peptides, and anti-Aβ antibodies, have been developed [8,9]. Recently, antibody drugs named aducanumab, lecanemab and donanemab have been approved by regulatory authorities [10]; however, issues such as adverse effects, including ARIA (amyloid-related imaging abnormalities), remain un-resolved, and the therapeutic effects are limited [11]. Additionally, the high cost of antibody drugs makes widespread application among the large population of AD patients impractical. The alteration in cholesterol levels in the brains of AD patients has been reported [12,13,14,15], suggesting a potential link between cholesterol metabolism disorders and AD. Although the brain constitutes only 2% of body weight, it contains approximately one-quarter of the body's total cholesterol [16]. Furthermore, numerous studies have demonstrated that Aβ interacts with lipid membranes, with a particular preference for binding to cholesterol containing lipid membranes [16,17]. C. Duyckaerts research group observed the binding of cholesterol and Aβ in the AD senile plaques [18], J. Fantini and co-workers have reported that cholesterol in a lipid membrane strongly bound to Aβ peptide [19], and J. R. Harris has confirmed that micelle of Chol-PEG ----- also interact to Aβ peptide and fibril by TEM ob-servation [20]. However, whether such an interaction between Aβ and cholesterol inserting to lipid membranes inhibits or promotes the aggregation of Aβ is still under discussion due to the effect by several factors, including cholesterol content, surface charge, and membrane fluidit [21,22]. So far, our laboratory has developed a cholesterol-end-modified PEG, as a drug delivery carrier and bioinert surface coating, which was found to spontaneously form micelles and vesicles (assemblies) in water [23,24]. We successfully obtained not only micelle but also vesicle from cholesterol-end-modified PEG with molecular weights of 2000 and 500, respectively. In this study, we investigated an inhibitory effect of cholesterol-end-modified PEG assemblies on Aβ aggregation.

2. Materials and Methods

2.1. Materials

mPEG-NH2 (molecular weight of 2000, SUNBRIGHT® ME-020EA) was purchased from NOF Corporation (Tokyo, Japan). mPEG-NH2 (molecular weight of 500, 767565) and Thioflavin T (ThT) was purchased from Sigma-Aldrich Co. LLC. (St. Louis, MO, US). Cholesterol chloroformate ()was purchased from TCI Co., Ltd. (Tokyo, Japan). Amyloid β-Protein (Human, 1-40) [HCl Form] (Aβ40) was purchased from PEPTIDE INSTITUTE, INC. (Osaka, Japan). All other chemicals of a special grade were used without further purification.

2.2. Particle Size and Zeta Potential Measurement

A dynamic light scattering (DLS) method by an electrophoresis light scattering spectrophotometer (ELS-Z2, Otsuka Electronics Co., Ltd., Tokyo, Japan) determined the size of the Chol-PEG assembles with each concentration in potassium phosphate buffer at room temperature. The zeta potential of the resulting sample was measured at room temperature by ELS with electrodes.

2.3. Transmission Electron Microscopy (TEM) Observations

Chol-PEG2000 and Chol-PEG500 assemblies were prepared in potassium phosphate buffer to 9.4 μmol and used as sample solutions for TEM observation. A TEM grid (Nisshin EM Co., Tokyo, Japan) was dipped into the sample solution for a few seconds. The excess solution was blotted away by filter paper. The sample was stained by 2% phosphotungstic acid solution. The samples on grids were observed by a JEM-1400 (JEOL Ltd., Tokyo, Japan) at an acceleration voltage of 120 kV.

2.4. ThT Assay

40 was dissolved in a 0.1% aqueous ammonia solution to a concentration of 4.7×10² μM. For each well of a 96-well black PP plate (Greiner Bio-One, Co. Ltd., BW, Germany), 2 μL of this solution was used. ThT was mixed to a final concentration of 9.4×10⁻3 μM, and Chol-PEGs were added at molar ratios of 10 and 50 relative to Aβ40. The total volume was adjusted to 100 μL per well. Each sample was prepared in triplicate (n=3). As controls, NH2-mPEGs with the same molar concentrations as Chol-PEGs were prepared for each PEG molecular weight. Fluorescence intensities were measured every 15 minutes while incubating the prepared samples at 37°C using a SpectraMaxTM mini (Molecular Devices LLC., US). A pre-shake was set for 60 seconds before each measurement. The excitation wavelength was 485 nm, and the emission wavelength was 535 nm.

2.5. Naive Polyacrylamide Gel Electrophoresis (Native-PAGE)

The preparation of Aβ40 and Chol-PEGs was adjusted so that the final concentration and total amount matched those used in the ThT assay. The prepared samples were incubated at 37°C, and gel electrophoresis was performed at 0 and 72 hours. A 7.2 μL aliquot from each sample was taken and mixed with 0.8 μL of 10× loading buffer, then loaded onto an 8% polyacrylamide gel. The prepared gel was run using a buffer (pH 8.3) comprising 50 mM tris(hydroxymethyl)aminomethane (Tris) and 38 mM glycine. Electrophoresis was performed at room temperature for 10 minutes, and the electric current was maintained at 24 W using a WSE-1010 Compact PAGE Ace (ATTO Co., Tokyo, Japan). After electrophoresis, the gel was shaken in a fixing solution (methanol: water: acetic acid = 4: 5: 1) for 30 minutes, followed by staining with coomassie brilliant blue (CBB) for 30 minutes. The gel was then imaged using a GelDoc Go Imaging System (Bio-Rad Laboratories Inc., California, US).

3. Results

3.1. Physical Properties of Chol-PEG Assemblies

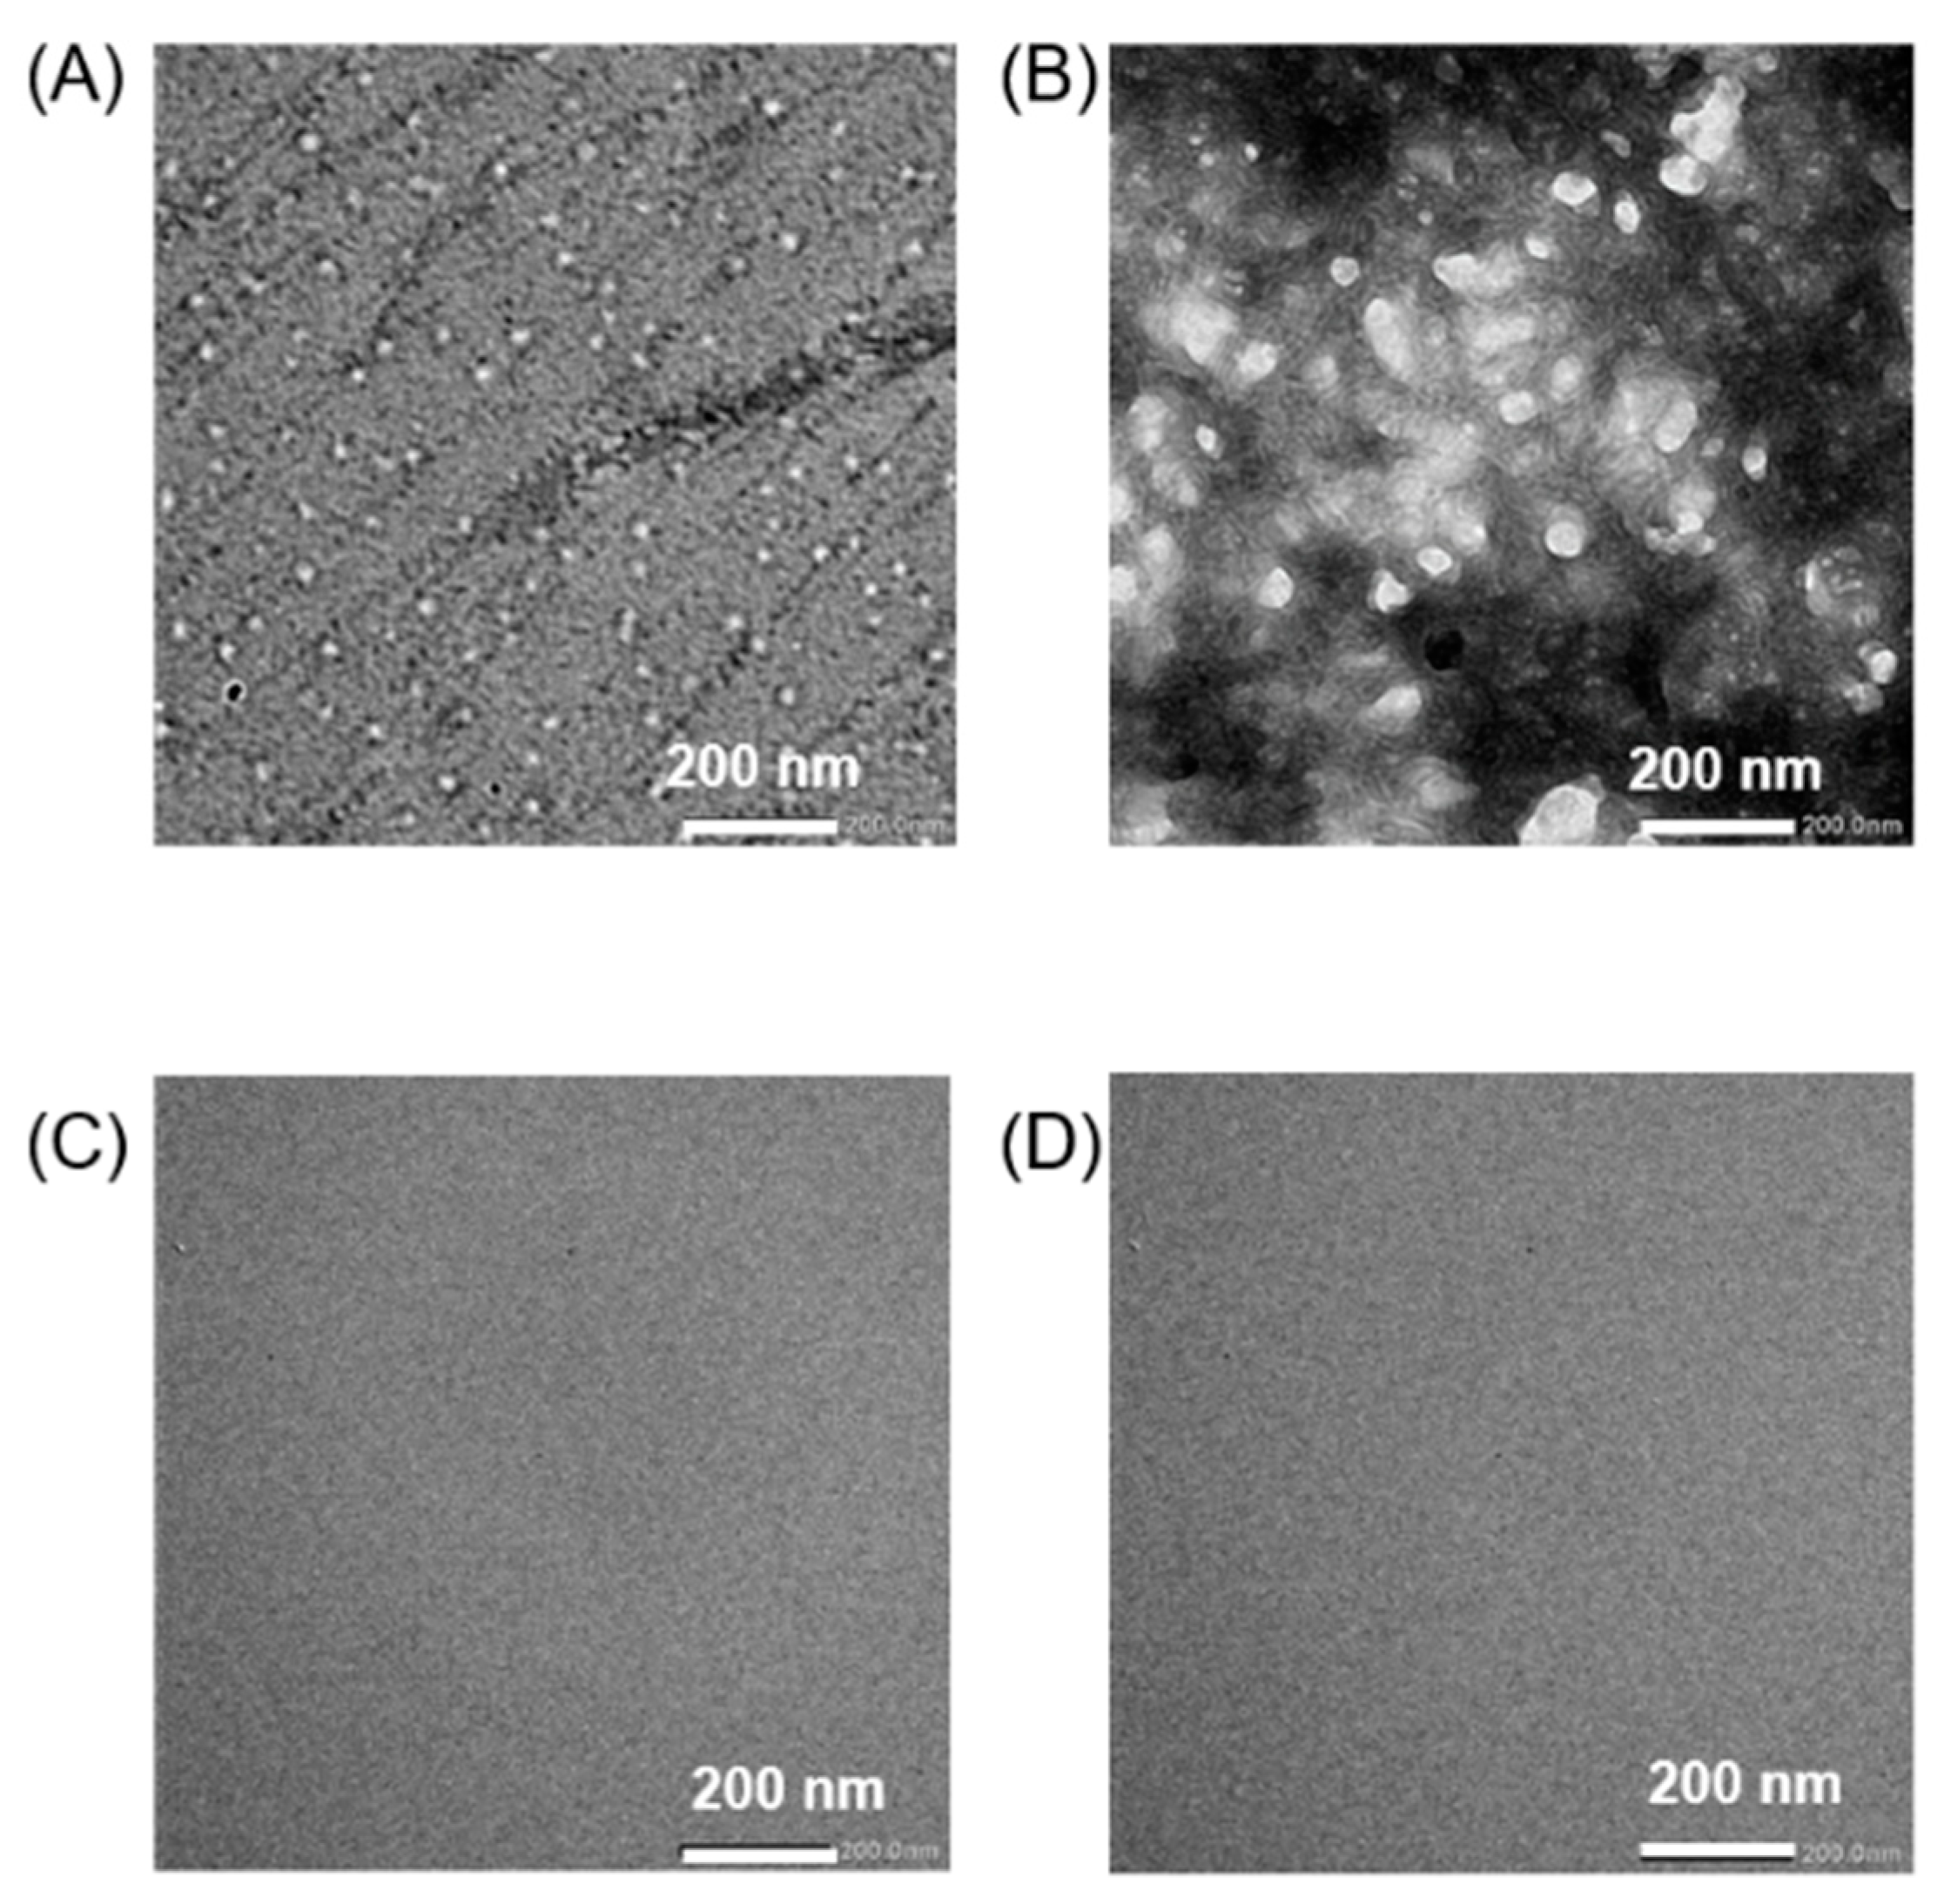
Cholesterol-end-modified PEGs were synthesized as reported previously [24]. Briefly, the synthesis was carried out by a SN2 reaction between cholesteryl chloroformate and methoxy poly(ethylene glycol) amine (mPEG-NH2). Hereafter, cholesterol-end-modified PEGs using PEGs with molecular weights of 2000 and 500 are referred to as Chol-PEG2000 and Chol-PEG500, respectively. Figure. 1 shows the particle size and zeta potential of the Chol-PEG assemblies in potassium phosphate buffer (All solvents using in this study were potassium phosphate buffer of 50 mM, pH 7.4) using dynamic light scattering (DLS) and electrophoretic light scattering (ELS). Measurements were taken for the two concentrations used in the Aβ inhibition experiments that follow. As previously reported, Chol-PEG2000 exhibited a size of approximately 20–30 nm in diameter, while Chol-PEG500 showed a size of approximately 70–80 nm in a diameter at each concentrations. The zeta potential was nearly neutral in both cases (Figure 1). Figures. 2A-D presented the TEM images of the Chol-PEG assemblies s in potassium phosphate buffer. TEM images showed that Chol-PEG2000 formed a uniform micelle and its particle diameter consistent with the DLS results (Figure 2A). On the other hand, Chol-PEG500 self-assembled into a uniform hollow vesicle with the uniform size of around 70–80 nm, which corresponds to DLS results (Figure 1B). As a result, the micelles and vesicles with neutral surface charges, which have been reported to interact with Aβ [16,17], were successfully obtained.

3.2. ThT Assay of Aβ40/Chol-PEG Assemblies

To investigate the aggregation inhibitory effect of Chol-PEGs on Aβ, “ThT assay” [25,26] was performed. Thioflavin T (ThT) is a fluorescent reagent known to specifically bind to β-sheets, resulting in increased fluorescence intensity. Since Aβ forms a β-sheet structure upon aggregation, the fluorescence intensity derived from ThT increases with the aggregation of Aβ. Consequently, the ThT assay is widely used to observe Aβ aggregation. Here, we performed experiments using Aβ40, the most abundant Aβ in the brain. The graph showing the fluorescence intensity of each sample over time is presented in Figure 3. When incubated with Aβ40 alone, the fluorescence intensity began to increase around 3 hours and stabilized at around 6–7 hours, confirming that aggregation was progressing. This is a typical result of ThT assay to show Aβ aggregation [27]. When Aβ40 was incubated with Chol-PEG assemblies at high concentrations (50 times the molar ratio relative to Aβ40), neither Chol-PEG2000 micelle nor Chol-PEG500 vesicle showed a significant increase in fluorescence intensity throughout the measurement period. At low concentrations (10 times the molar ratio relative to Aβ40), the mixture of Aβ40 and Chol-PEG2000 and Chol-PEG500 delayed the onset time of increase in fluorescence intensity and delayed nucleation. In the mixture of Aβ40 and Chol-PEG2000, the fluorescence intensity began to increase at about 20 hours, while that of the mixture with Chol-PEG500 began to increase at about 40 hours, indicating that Chol-PEG500 delayed nucleation longer. Furthermore, when low concentrations of Chol-PEG2000 were added, the value at which the fluorescence intensity plateaued was approximately half that of Aβ40 alone. This suggests that fibril elongation is stopped midway. Further incubation for up to 72 hours showed that when 10 equivalents of Chol-PEG500 were added to Aβ40, the fluorescence intensity at the plateau was 30-40% lower than that of Aβ40 alone and lower than that of the mixture with Chol-PEG2000. (Figure S1). These results indicate that Chol-PEG500 and Chol-PEG2000 suppressed the Aβ40 aggregation at the higher molar ratio than 50 and 10 against Aβ40, respectively. So far, many reports have showed that cholesterol promoted Aβ aggregation, but our results were an opposite result inhibiting Aβ aggregation. In the ThT assay, it is known that the period from when the fluorescence intensity begins to increase until it plateaus reflects the elongation of amyloid fibrils [28]. In this study, no significant changes in elongation rate were observed at high concentrations of Chol-PEG2000 and at all concentrations of Chol-PEG500, suggesting that Chol-PEGs might suppress nucleation before Aβ monomers form oligomers. Next, ThT assays were performed by adding mPEG-NH2 of two molecular weights to Aβ40 as controls. The fluorescence intensity with mPEG-NH2 was reduced by approximately –30% for PEG2000 compared to Aβ40 alone (Figure S2). It has been reported that the presence of polymers such as PEG can inhibit the binding of Aβ to ThT [29,30]. However, such an inhibitory effect of PEG on the binding of Aβ40 to ThT had minimal impact on the results in our case. This means that both of cholesterol moiety and PEG chain has an important role to inhibit Aβ40 fibril formation, supporting our hypothesized mechanism shown above. The mixture of Chol-PEG and ThT (without Aβ40) showed no increase in fluorescence intensity (Figure S2).

3.3. Aggregation Evaluation Using Polyacrylamide Gel Electrophoresis (Native-PAGE)

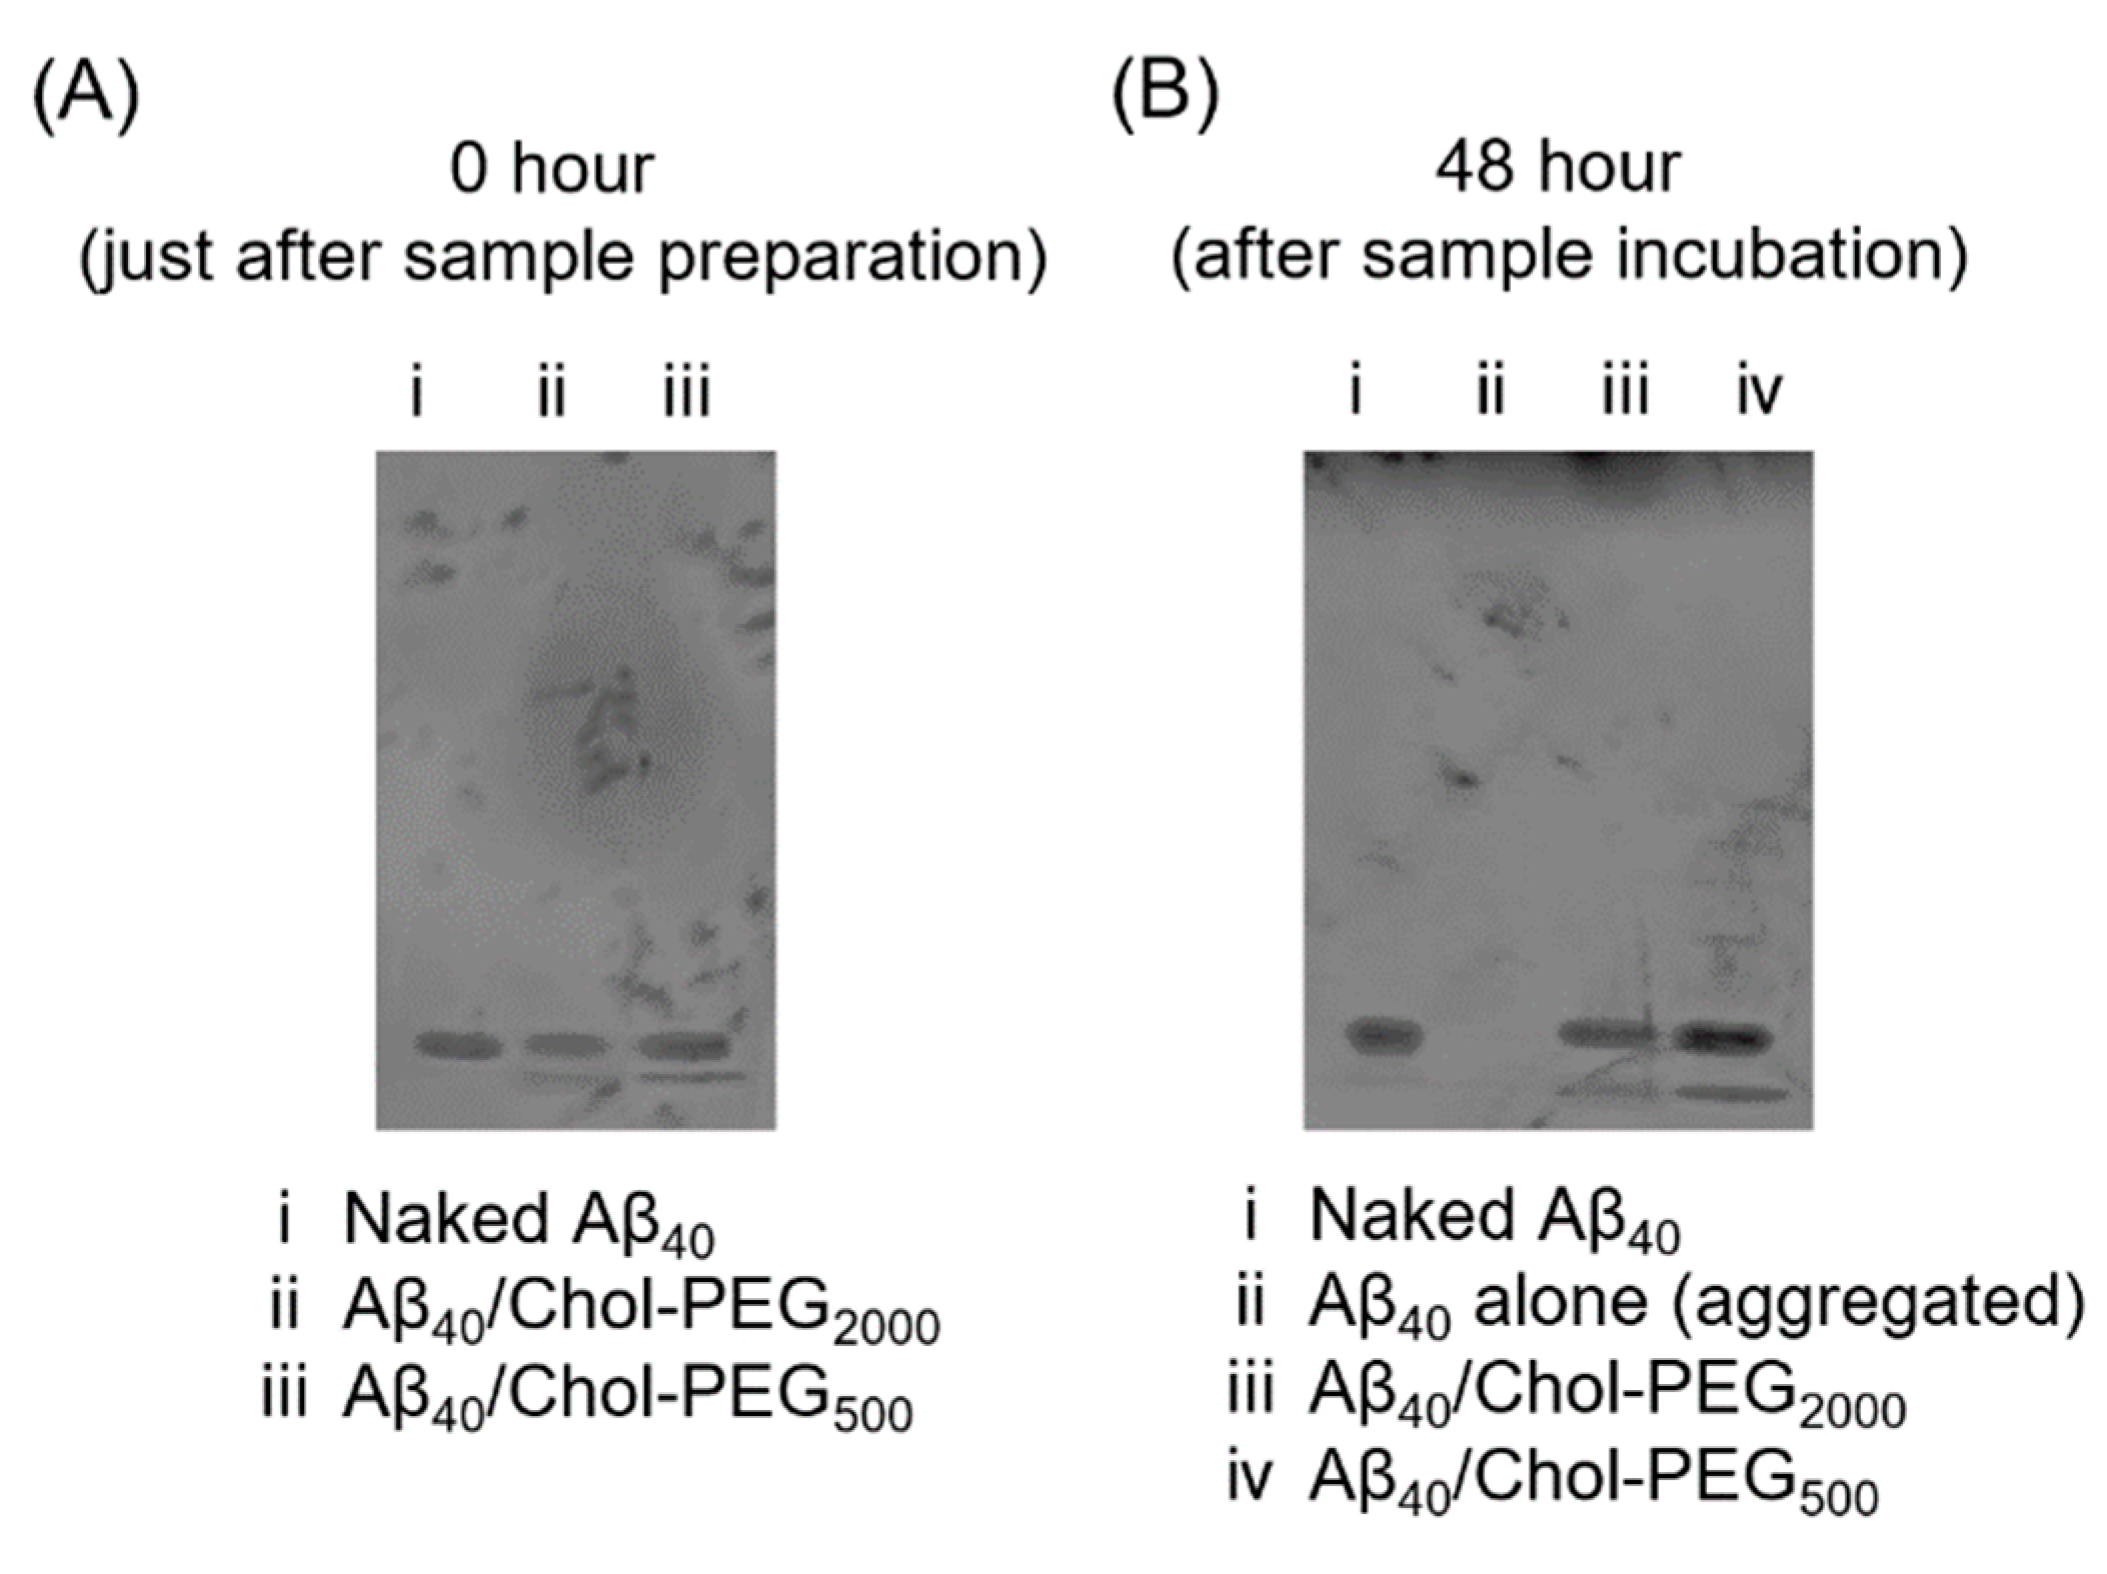
Next, we also evaluated the aggregation inhibitory effect of Chol-PEG assemblies using polyacrylamide gel electrophoresis (Native-PAGE). As shown in Figure 4A, immediately after mixing Aβ40 with Chol-PEG assemblies, the bands were the same. After 48 hours of incubation, The results of a same experiment conducted after 48 hours of aggregation operations are shown in Figure.4B. The sample subjected to aggregation operations with Aβ40 alone became insoluble, so no bands were observed (lane ⅱ). Notably, the bands of the mixture of Aβ40 with Chol-PEG assembly seemed to be retarded very slightly as compared to Aβ40 alone (lanes ⅲand ⅳ). The resulting very slight retardation suggest the binding of Aβ40 to individual Chol-PEG molecules, because more significant retardation would occur in case of the complex formation with large-sized Chol-PEG assemblies. The retardation of this band is minimal, and if Aβ40 were forming a complex with Chol-PEG assemblies, a more significant retardation would be expected. Therefore, it is considered that Aβ40 is interacting with Chol-PEG molecules rather than with micellar or vesicular particles in this case. This indicates that Chol-PEG molecules inhibited an insolubilization of Aβ40 due to aggregation. Additionally, the mixture of mPEG-NH2 and Aβ40 exhibited the same band as naked Aβ40 and the band disappeared after incubation. Furthermore, no changes in the bands were observed before and after incubation for each polymer alone (Figure S3).

4. Discussion

Thinking with ThT assay and native-PAGE together, it clearly demonstrated the inhibitory effect of Chol-PEGs on Aβ40 aggregation. ` Several studies have reported that Aβ40 binds to micelles or vesicles containing negatively charged cholesterol, promoting aggregation. This is because the hydrophobic and electrostatic interactions of cholesterol cause Aβ40 to bind to the membrane, adopting a stable helical structure that facilitates oligomer formation [31,32,33,34,35]. The Chol-PEGs used in this study contain a high amount of cholesterol, but their surface charge is nearly neutral, suggesting that their binding affinity to Aβ40 is lower compared to the negatively charged micelles or vesicles reported in previous studies. Therefore, it is likely that the binding strength was not sufficient to promote Aβ40 aggregation on the membrane. It is known that during the aggregation process, hydrophobic regions of Aβ40 are exposed on the surface [36]. Aβ40 bound to the cholesterol moiety of Chol-PEGs becomes surrounded by the highly hydrophilic PEG chains, which interact with water via non-covalent bonding. This makes it less likely for the hydrophobic regions of Aβ40 to be exposed, thereby inhibiting aggregation. Additionally, in this study, Chol-PEG500 exhibited a higher aggregation inhibitory effect at lower concentrations compared to Chol-PEG2000. PEG can remove hydration water from biopharmaceuticals and is used as a precipitant. Therefore, as the molecular weight of PEG increases, the dehydration of peptides intensifies, potentially triggering aggregation [37]. Moreover, it has been reported that a higher PEG molecular weight leads to increased steric hindrance, reducing interactions between the hydrophobic group and the peptide [38]. The surface of Chol-PEG assemblies are covered by hydrophilic PEG chains, and it is considered that Aβ40 was more likely to interact with cholesterol in Chol-PEG500, which has shorter PEG chains. Therefore, in this study, it is considered that Chol-PEG500, with its shorter PEG chains, inhibited aggregation more effectively compared to Chol-PEG2000. The results of this study suggest that several interactions reported in the literature [31,32,33,34,35,36,37,38,39] contribute to these binding and aggregation inhibitory effects. However, the results of native-PAGE suggest that Aβ40 is binding to Chol-PEG molecules rather than Chol-PEG assemblies, which implies that Aβ40 bound to Chol-PEG assemblies may be pulling out Chol-PEG molecules, resulting in the complex formation of Aβ40 with Chol-PEG molecules.

5. Conclusion

In this study, we found that the vesicle and micelle composed of Chol-PEG had aggregation-inhibiting effects on Aβ40, the causative agent of AD. These Chol-PEG assemblies with a high affinity for Aβ40 resulting to induce the absorption of Aβ40 into the Chol-PEG assemblies and suppress the aggregation of Aβ40. The reasons for this were expected to be that the surface PEG layer of Chol-PEG500 vesicle was thinner than that of Chol-PEG2000 micelles, making Aβ40 more likely to interact with cholesterol. And too long PEG chain length of Chol-PEG2000 cause dehydration [37] from Aβ40, inducing Aβ40 aggregation. Furthermore, the suppression of aggregation was considered to be due to hydrogen bonding with the urethane group of Chol-PEGs, the exclusion volume effect of PEG, and its high hydrophilicity The resulting suppression effect of Chol-PEG assemblies on Aβ40 aggregation is promoted at higher concentration of the dispersion of the Chol-PEG assemblies. Moreover, Chol-PEG500 vesicles, as well as Chol-PEG2000 micelles, can encapsulate hydrophilic and hydrophobic drugs due to its hollow shape with inside water phase and hydrophobic membrane. These Chol-PEG assemblies by encapsulating drugs for other AD-related factors are expected to enable a higher therapeutic efficacy and a multimodal AD therapy.

Supplementary Materials

The following supporting information can be downloaded at the website of this paper posted on Preprints.org, Figure S1: ThT assay results of Aβ40 aggregation in the presence of each concentration of Chol-PEGs; Figure S2: ThT assay results of Aβ40 aggregation in the presence PEGs and Chol-PEGs alone (without Aβ40) as controls; Figure S3: Polyacrylamide gel electrophoresis of each polymer incubate with or without Aβ40.

Author Contributions

Conceptualization, S.A.; methodology, S.W.; data curation, S.A., M.U., and S.W.; writing—original draft preparation, S.W.; writing—review and editing, S.A. and M.U.; supervision, S.A. and M.U.; project administration, S.A.; funding acquisition, S.A. All authors have read and agreed to the published version of the manuscript.

Funding

This work was supported by a Grant-in-Aid for Challenging Research (Exploratory) from Japan Society for the Promotion of Science (JSPS KAKENHI grant no. 21K19921).

Institutional Review Board Statement

Not applicable.

Informed Consent Statement

Not applicable.

Data Availability Statement

All the data supporting the reported results can be found in the main
article and in the Supplementary Materials files.

Acknowledgments

A part of this work was conducted in Institute for Molecular Science, supported by “Advanced Research Infrastructure for Materials and Nanotechnology in Japan (ARIM)” of the Ministry of Education, Culture, Sports, Science and Technology (MEXT). Proposal Number 23UT0090.

Conflicts of Interest

No conflicts of interest.

References

  1. Beshir SA, Hussain N, Menon VB, Al Haddad AHI, Al Zeer RAK, Elnour AA, Int J Alzheimers Dis. 2024, 2052142. [CrossRef]
  2. Hur JY, Exp Mol Med. 2022, 433. [CrossRef]
  3. Grøntvedt GR, Schröder TN, Sando SB, White L, Bråthen G, Doeller CF, Curr Biol. 2018, R645. [CrossRef]
  4. Aleksis R, Oleskovs F, Jaudzems K, Pahnke J, Biverstål H, Biochimie. 2017, 176. [CrossRef]
  5. Leong YQ, Ng KY, Chye SM, Ling APK, Koh RY, Metab Brain Dis. 2020, 11. [CrossRef]
  6. Choi H, Kim C, Song H, Cha MY, Cho HJ, Son SM, Kim HJ, Mook-Jung I, Aging Cell. 2019, e12872. [CrossRef]
  7. Carrell RW, Lomas DA, Lancet. 1997, 134. [CrossRef]
  8. Yamin G, Ono K, Inayathullah M, Teplow DB, Curr Pharm Des. 2008, 3231. [CrossRef]
  9. Kapadia A, Sharma KK, Maurya IK, Singh V, Khullar M, Jain R, Eur J Med Chem. 2021, 212:113126. [CrossRef]
  10. Loeffler DA, J Alzheimers Dis Rep. 2023, 7(1):873. [CrossRef]
  11. Amano A, Sanjo N, Araki W, Anraku Y, Nakakido M, Matsubara E, Tomiyama T, Nagata T, Tsumoto K, Kataoka K, Yokota T, J Nanobiotechnology. 2023, 21(1):36. [CrossRef]
  12. Xiong H, Callaghan D, Jones A, Walker DG, Lue LF, Beach TG, Sue LI, Woulfe J, Xu H, Stanimirovic DB, Zhang W, Neurobiol Dis. 2008, 29(3):422. [CrossRef]
  13. Lazar AN, Bich C, Panchal M, Desbenoit N, Petit VW, Touboul D, Dauphinot L, Marquer C, Laprévote O, Brunelle A, Duyckaerts C, Acta Neuropathol. 2013, 125, 1, 133. [CrossRef]
  14. Ledesma MD, Abad-Rodriguez J, Galvan C, Biondi E, Navarro P, Delacourte A, Dingwall C, Dotti CG, EMBO Rep. 2003, 4, 12, 1190. [CrossRef]
  15. Egawa J, Pearn ML, Lemkuil BP, Patel PM, Head BP, J Physiol. 2016, 594, 16, 4565. [CrossRef]
  16. Rushworth JV, Hooper NM, Int J Alzheimers Dis. 2010, 2011. [CrossRef]
  17. Avdulov NA, Chochina SV, Igbavboa U, Warden CS, Vassiliev AV, Wood WG, J Neurochem. 1997, 69, 4, 746. [CrossRef]
  18. Panchal M, Loeper J, Cossec JC, Perruchini C, Lazar A, Pompon D, Duyckaerts C, J Lipid Res. 2010, 51, 3, 598. [CrossRef]
  19. Di Scala C, Chahinian H, Yahi N, Garmy N, Fantini J, Biochemistry. 2014, 53, 28, 4489. [CrossRef]
  20. Harris JR, Micron. 2008, 8, 1192. [CrossRef]
  21. Del Mar Martínez-Senac M, Villalaín J, Gómez-Fernández JC, Eur J Biochem. 1999, 265, 2, 744. [CrossRef]
  22. Ahyayauch H, Masserini ME, Alonso A, Goñi FM, Int J Mol Sci. 2024, 25, 12, 6401. [CrossRef]
  23. Asayama S, Nagashima K, Negishi Y, Kawakami H, Bioconjug Chem. 2018, 1, 67. [CrossRef]
  24. Watanabe S, Asayama S, Chemistry Letters. 2024, upae166. [CrossRef]
  25. Groenning M, J Chem Biol. 2010, 1, 1. [CrossRef]
  26. LeVine H 3rd, Methods Enzymol. 1999, 309, 274. [CrossRef]
  27. Batzli KM, Love BJ, Mater Sci Eng C Mater Biol Appl. 2015, 48, 359. [CrossRef]
  28. Arosio P, Knowles TP, Linse S, Phys Chem Chem Phys. 2015, 17, 12, 7606. [CrossRef]
  29. Biancalana M, Koide S, Biochim Biophys Acta. 2010, 1804, 7, 1405. [CrossRef]
  30. Tsuchie Y, Kusuda S, Kawabe H, Mori W, Lindgren M, Watanabe Y, Zako T, Int J Mol Sci. 2024, 25, 6, 3112. [CrossRef]
  31. Cheung DL, Molecules. 2024, 29, 15, 3634. [CrossRef]
  32. Qu L, Fudo S, Matsuzaki K, Hoshino T, Chem Pharm Bull. 2019, 67, 9, 959. [CrossRef]
  33. Ahyayauch H, García-Arribas AB, Masserini ME, Pantano S, Goñi FM, Alonso A, Int J Biol Macromol. 2020, 164, 2651. [CrossRef]
  34. Lockhart C, Klimov DK, Biochim Biophys Acta. 2016, 1858, 6, 1118. [CrossRef]
  35. Dey C, Roy M, Ghosh R, Pal P, Roy D, Ghosh Dey S, Chemistry. 2024, e202401531. [CrossRef]
  36. Salahuddin P, Fatima MT, Abdelhameed AS, Nusrat S, Khan RH, Eur J Med Chem. 2016, 114, 41. [CrossRef]
  37. Mueller C, Capelle MA, Seyrek E, Martel S, Carrupt PA, Arvinte T, Borchard G, J Pharm Sci. 2012, 101, 6, 1995. [CrossRef]
  38. Pozzi D, Colapicchioni V, Caracciolo G, Piovesana S, Capriotti AL, Palchetti S, De Grossi S, Riccioli A, Amenitsch H, Laganà A, Nanoscale. 2014, 6, 5, 2782. [CrossRef]
  39. Yu X, Zheng J, J Mol Biol. 2012, 421, 4, 561. [CrossRef]
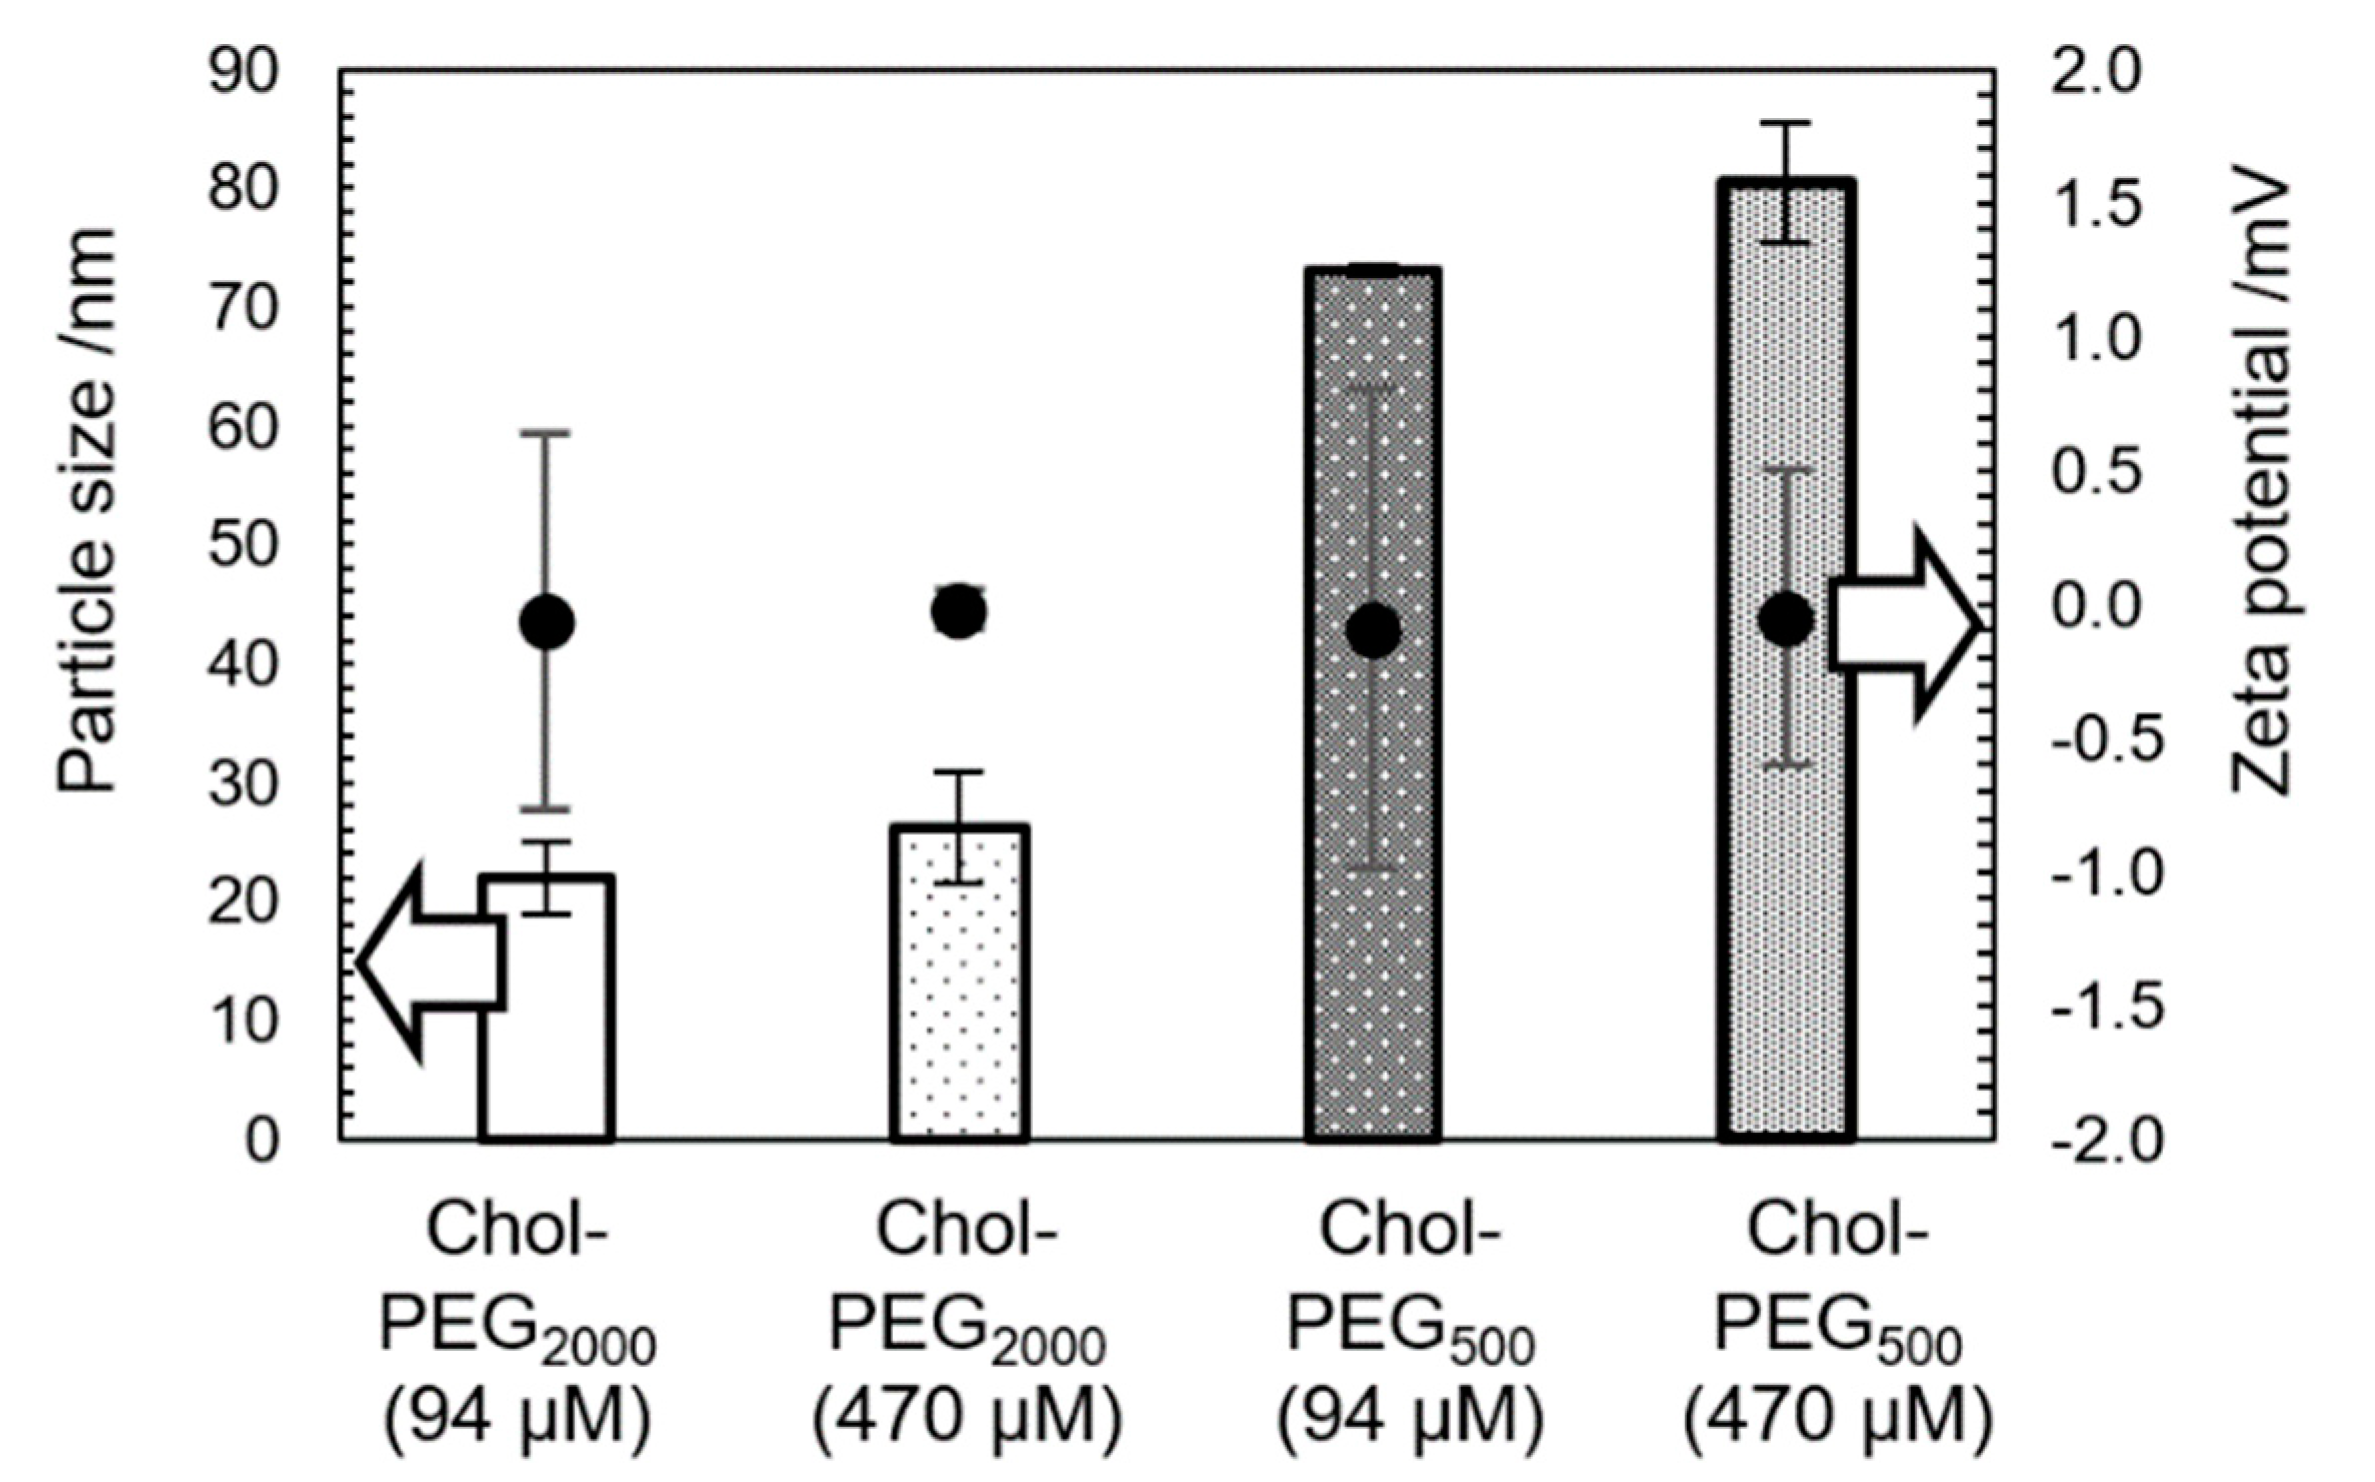
Figure 1. Particle sizes and zeta potentials of Chol-PEGs assemblies at each concentration. All Chol-PEGs assemblies above the critical aggregation concentration (CAC).
Preprints 120982 g001
Figure 2. TEM images of assembly of (A) Chol-PEG2000 and (B) Chol-PEG500 at the concentration of 4.7×10² μM (above CAC), (C) Chol-PEG2000 and (D) Chol-PEG500 at the concentration of 4.7×10⁻⁵ μM (below CAC).
Preprints 120982 g002
Figure 3. ThT assay results of Aβ40 aggregation in the presence of each concentration of Chol-PEGs. (A) Aβ40 incubated with Chol-PEG2000, Chol-PEG/Aβ40 (B) Aβ40 incubated with Chol-PEG500. The final concentration of Chol-PEGs at Chol-PEG/Aβ=10 and Chol-PEG/Aβ=50 is 94 μM and 470 μM respectively.
Preprints 120982 g003
Figure 4. Polyacrylamide gel electrophoresis of Aβ40 incubate with Chol-PEGs. (A) Immediately after sample preparation, (B) After incubate 48 hour.
Preprints 120982 g004
Disclaimer/Publisher’s Note: The statements, opinions and data contained in all publications are solely those of the individual author(s) and contributor(s) and not of MDPI and/or the editor(s). MDPI and/or the editor(s) disclaim responsibility for any injury to people or property resulting from any ideas, methods, instructions or products referred to in the content.
Copyright: This open access article is published under a Creative Commons CC BY 4.0 license, which permit the free download, distribution, and reuse, provided that the author and preprint are cited in any reuse.
Prerpints.org logo

Preprints.org is a free preprint server supported by MDPI in Basel, Switzerland.

Subscribe

© 2024 MDPI (Basel, Switzerland) unless otherwise stated