1. Summary
Investor sentiment plays a vital role in stock market performance. It refers to the overall attitude, mood, and opinion of investors toward a specific stock or the market as a whole. While fundamental analysis and economic indicators provide valuable insights, investor sentiment often has a significant impact on short-term market movements [
1]. By staying informed and monitoring market sentiment, investors can make decisions that are more informed and have more confidence in navigating a complex stock market. Investor sentiment is influenced by various factors, including market news, company performance, and general economic conditions. Positive sentiment can lead to increased buying activity and push up stock prices, while negative sentiment can lead to selling pressure and lower prices [
2]. The collective sentiment of investors can add momentum to the market, influencing trading volume and price trends. Investors must be aware of the impact of sentiment on market movements and consider both rational analysis and emotional factors when making investment decisions. While it is impossible to predict market sentiment, understanding investor psychology accurately can provide valuable insights into potential market trends.
The Autoregressive Distributed Lag (ARDL) model is a powerful tool in econometrics for analyzing both long-term and short-term dynamics between variables. By including both lagged values of the dependent variable and lagged values of the independent variables, the ARDL model can capture complex relationships that may be miss by traditional regression models [
3].
One of the main advantages of using linear ARDL analysis is its ability to account for both intrinsic and dynamic aspects of the data. By including lagged values of the variables, the model can control for autocorrelation and capture dynamic adjustments that occur over time. This makes the ARDL model particularly useful for analyzing time series data, where the variables may be correlated and evolve over time.
In addition, the ARDL model allows researchers to test whether there is a long-term relationship between the variables. By testing the significance of the coefficients of the lagged variables, researchers can determine whether there is a stable equilibrium relationship between the variables in the long-run. This can provide valuable insights into the underlying dynamics of the data and aid in policy decisions [
4].
In addition, the ARDL model is very flexible and can accommodate different types of data and relationships. Whether the data exhibits stationary or non-stationary behavior, the ARDL model can been applied without hesitation. This versatility makes ARDL models a valuable tool for researchers working with different datasets and research questions.
Linear ARDL analysis is a complex but easy-to-use method for analyzing the dynamics between variables in econometric studies. By incorporating lagged values of variables and testing long-term relationships, ARDL models provide valuable insights into the complex dynamics of the data. Researchers from a variety of fields can benefit from using ARDL models to uncover hidden relationships and inform their decision-making processes.
In behavioral economics, investor sentiment reflects general investor attitudes, which are determined by psychological factors, experience, or environmental [
5,
6]. Through contagion effects, investor sentiment is incorporate into asset valuations and expected returns. This study explores this relationship in the unique context of the Saudi Arabian stock market.
The Saudi market provides an interesting context due to the strong presence of retail investors, its dependence on oil revenues, and its sensitivity to regional stability [
7].With more than 6 million active retail investors, the Saudi market has one of the highest rates of retail investor participation in the world [
8]. This makes the market more susceptible to sentiment-related mispricing. Furthermore, oil exports account for more than 70% of Saudi Arabia’s revenue, linking market developments to global oil dynamics [
9]. Geopolitical events such as the 2017 Qatar crisis and oil price volatility also affect market volatility.
The role of investor sentiment in driving stock market returns has received considerable attention in behavioral finance research. Theoretical models suggest that sentiment can affect returns through two main channels [
5,
7]. The price pressure hypothesis assumes that sentiment directly affects stock prices, with optimistic investors pushing prices higher and pessimistic investors pushing prices lower. The risk premium perspective assumes that sentiment affects expected returns by changing risk perceptions in pricing.
Empirically, the evidence on the relationship between investor sentiment and returns remains inconclusive. Previous seminal research (see also [
10]) provided one of the earliest large-sample studies showing that high investor sentiment predicts lower market returns. By applying an error correction model, they found that sentiment has a long-term effect on returns. Subsequent studies have found that sentiment has a significant effect on various international markets. [
11] Showed that consumer confidence, as a sentiment indicator, can predict returns in 18 countries. [
5] documented a negative relationship between sentiment and returns in six major stock markets. [
5,
12] showed at a cross-sectional level that stocks that are difficult to arbitrate and difficult to value are most affected by investor sentiment. Subsequent work confirmed these results in other markets [
13]. also demonstrated that highly subjective stocks are more susceptible to sentiment-related mispricing. [
14] showed that the sentiment effect is stronger for stocks with high idiosyncratic volatility.
However, other studies have provided conflicting evidence on the role of sentiment [
14,
15] found that sentiment has no consistent predictive power for US stock returns [
16] document that the causal effect of sentiment on returns in European markets excluding the UK is not significant. [
17,
18] show that sentiment has a limited impact on US sector returns. While emerging markets appear to be more vulnerable (Schmeling, 2009), Li and Kong (2017) recently found that sentiment does not play a significant role in determining Chinese stock returns.
Empirical evidence from the Middle East remains scarce. [
19]conducted an early qualitative study on how investor sentiment affected market activity in Saudi Arabia during the 2008 global financial crisis. Using more advanced techniques, [
20] use a Markov switching model to demonstrate that investor sentiment mechanisms help predict returns in the UAE. For the Saudi market, [
21] recently studied the impact of sentiment shocks through VAR models, while [
22] focused on the predictability of returns using quantile regression.
Methodologically, the autoregressive distributed lag (ARDL) technique is increasingly use for sentiment-return analysis, [
23] use the ARDL model to capture the dynamic interaction between investor sentiment and industry stock returns in Saudi Arabia. ARDL and nonlinear ARDL have also used to study the relationship between real estate and stock returns and sentiment in India [
24]. In addition to linear methods, Markov switching models have shown promise for modeling emotional states [
25].
Recent studies have used sophisticated machine learning techniques. [
9] show significant predictability of sentiment at the industry level in China using a long short-term memory (LSTM) approach. [
26] applied a random forest algorithm to demonstrate the significant impact of investor attention on Turkish stock returns. By combining sentiment with technical indicators, [
13,
17] demonstrated improved accuracy of stock return forecasts using deep learning neural networks.
Despite the growing body of research, there remains a gap in the contextual role of investor sentiment in emerging Middle Eastern markets such as Saudi Arabia. Previous studies have limitations in using subjective sentiment measures, simplified empirical models without temporal dynamics, or lack of asymmetric and nonlinear analysis. Advanced computational methods are also not fully utilized. This highlights the need to use sophisticated time series techniques tailored to the Saudi market context to provide strong evidence.
This study uses monthly data from September 2009 to September 2022, covering large fluctuations in the Saudi stock market. The stock return series is from the Tadawul All-Share Index, which reflects the overall market performance.
The composite investor sentiment index is constructed from ten basic financial market variables using principal component analysis. The variables include trading volume, market turnover, number of shares traded, number of trades, stock price volatility, price increase to price decrease ratio, new investor subscription, investor asset size, number of companies with prices above the 20-day moving average, and number of companies with prices above the 50-day average ([
5,
7,
26])
The principal component analysis extracts the relevant information from the ten indicators into orthogonal principal components. The first principal component explains the largest variation in the data and represents the composite sentiment index. Previous studies have shown that this approach can effectively summarize the sentiment information in the indicators compared to simple averaging ([
5,
7].
The stationarity of stock returns and sentiment indices is test using extended Dickey-Fuller and Phillips-Perron unit root tests. The identification of the unit root guides the selection of the long-term cointegration framework.
The absence of cointegration would justify modeling the relationship via an unconstrained VAR in first differences. The presence of cointegration requires the use of a vector error correction model (VECM) to explain the long-run equilibrium or an autoregressive distributed lag (ARDL) approach. ARDL models are often use to study the dynamic interactions between short-run and long run time series ([
23]. The ARDL framework estimates short-run dynamics and long-run equilibrium simultaneously in a databased general-to-specific modeling approach.
The ARDL model has the following form:
Where SR and SI are stock returns and investor sentiment; MS, IPI, CCI and GEPU are control variables; Δ represents the first-order difference to capture short-term dynamics; α is a constant; β1 and β2 represent long-term multipliers; γ and δ are short-term coefficients; et is the error term [
15].
The best model is selected by sequential elimination and diagnostic tests. The residuals are verified for normality, serial correlation, heteroscedasticity and stability. CUSUM and CUSUMSQ tests check parameter stability. The significance of the error correction term confirms cointegration.
This rigorous empirical modeling approach will provide targeted insights into the relationship between investor sentiment and Saudi stock returns. It goes beyond simple correlations or qualitative surveys, thus improving on the limitations of previous Saudi research. Modeling both short-term and long-term dynamics is also an advance as it can capture combined effects based on the data.
The findings will have important practical implications for investors, managers, and policymakers in Saudi Arabia. Evidence that sentiment plays an important role will highlight the need to curb excessive risk-taking during market uptrends. This can help inform the design of circuit breakers, margin-lending limits, and other preventive measures. Portfolio managers can improve their market timing skills and alpha through sentiment analysis. Overall, targeted insights specific to the Saudi context will help better understand and manage behavioral risk.
This study attempts to address this gap through rigorous time series analysis. The ARDL framework allows for databased exploration of both long-term and short-term components. Such targeted insights are important for Saudi market participants.
2. Data Description
This section presents the key empirical findings from the time series analysis examining the relationship between investor sentiment and stock market returns as well as real estate market returns in Saudi Arabia. The results are structured around the research objectives and employ a multitude of statistical techniques including unit root tests, cointegration tests, ARDL models and various diagnostic tests.
2.1. Data
The sample of the current study is a daily data from September 2009 to September 2022 to cover enough sample in order to estimate reliable results. The stock market returns are estimated from the Tadawul All Share Index and the real estate market returns from real estate price index. The Tadawul All Share Index is provided by the Saudi Arabia stock exchange (Tadawul:
https://www.saudiexchange.sa/) and real estate price index data is provided by ‘General Authority for Statistics of the Kingdom of Saudi Arabia (
https://www.stats.gov.sa/en/843).
The data series of international crude oil is taken from the World Bank-Data Bank. The International Crude Oil Volatility series will been created from the crude oil price using the GARCH (p.q) model. As for the control variables, the data on money supply (MS) is gleaned from Saudi Arabia’s central bank (
https://www.sama.gov.sa/en).
2.1.1. Variables Description
Dependent Variables (Market Returns):
Independent Variables (Sentiment Index Proxies):
Housing Market;
Stock Market;
Energy Market.
Control Variables (Macroeconomy).
A composite investor sentiment index was construct from ten underlying financial market variables using principal component analysis (PCA).
The included variables were: international crude oil price (ICOP), international crude oil volatility (ICOV), real estate primary trading value (REPTVA), real estate secondary trading value (RESTVA), real estate primary trading volume (REPTVO), real estate secondary trading volume (RESTVO), Tadawul All Share Index (TASI), Tadawul Energy Index (TEI), Tadawul real estate management and development trading volume (TREMDITVO), and Tadawul real estate management and development trading value (TREMDITVA).
2.2. Models Estimation
The study used model, the Autoregressive distributive lag model (ARDL):
In the given equation (2), y is the outcome variable at time t. y_(t-i) is the value of each lag i (from 1 to n) of the dependent variable. The p in equation is the indicator of number of lags followed by the endogenous variable and q expressing the lags number of exogenous variables. Further, x_t is a k×1 vector of explanatory variable and β is a k×1 coefficient vector of independent variables. The given a_i is the vector of scalar and ε_t is the equation white noise term with zero mean and finite variance. Given the objective of current study, the basic specification of the ARDL model are as follows:
In the given equation (3.2), MR is the market return i which changes between stock market and housing market returns at time t. On the right-hand side of the equation, β_0 is the equation intercept term and ε_t is the error term with zero mean and finite variance. The p denotes the lag length followed by dependent variable (autoregressive term) and q denotes the independent variables lag length (distributive lags). Further, ECR is capturing control variables at time t. Moreover, γ_1 is obtaining the lag effect (t-1) of the dependent variable (market return of stock and real estate) and δ_1 is carrying the coefficient of sentiment index, SenT, at time t. Likewise, δ_2 capturing the coefficient estimates of control variables during the sample period at time t.
Similar to Equation (3) in Equation (4), MR is the market return at time t and i changes between stock market return and real estate market return. The given ρ_0 is the intercept term, ρ_1 is capturing the long-run effect of the dependent variable; and ρ_2 - ρ_3 are capturing the long-run effects of sentiment index and control variables (exogenous variable), respectively. Further, the variables with ∆ are accommodating for the short-run effects. Where the first is obtaining the short-term level and lag effects (j=number of lags followed by SenT) of market return at time t. The latter (δ_j) are capturing the short-run level and lagged effects of SenT and ECR at time t. lastly, the equation white noise term is indicate with μ_t. In accordance with [
27], the equation (5) specifications can be regroup and summarized as follows:
2.3. Figures, Tables and Schemes
Figure 1.
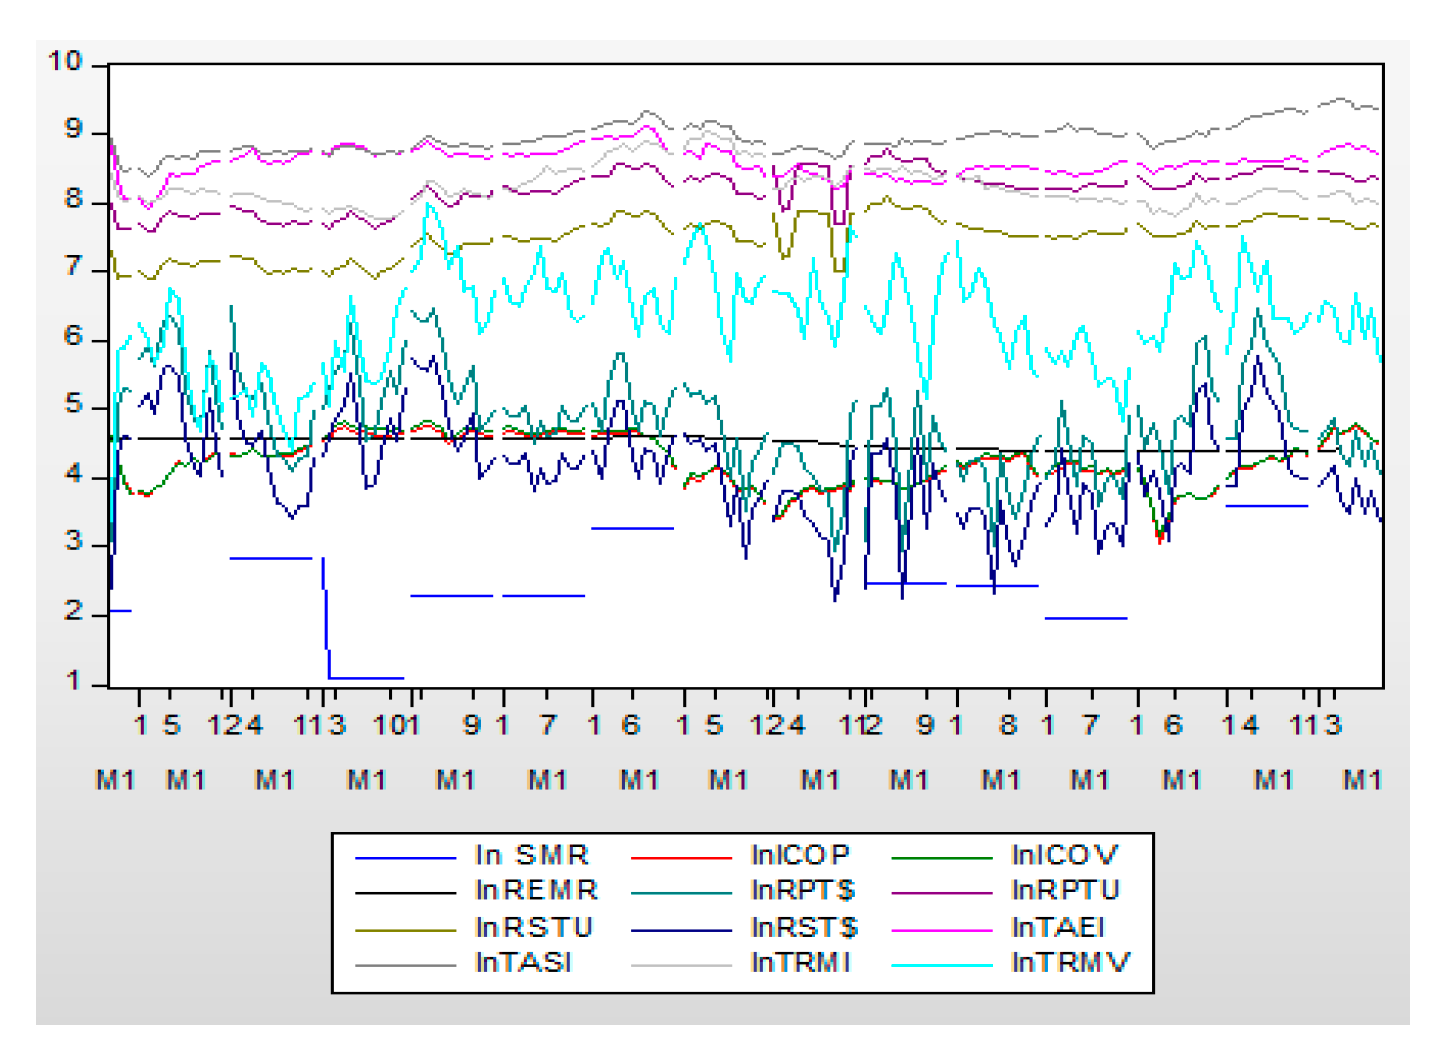
The graph of time series logarithms variables over Sep2009–Sep 2022.
Figure 1.
The graph of time series logarithms variables over Sep2009–Sep 2022.
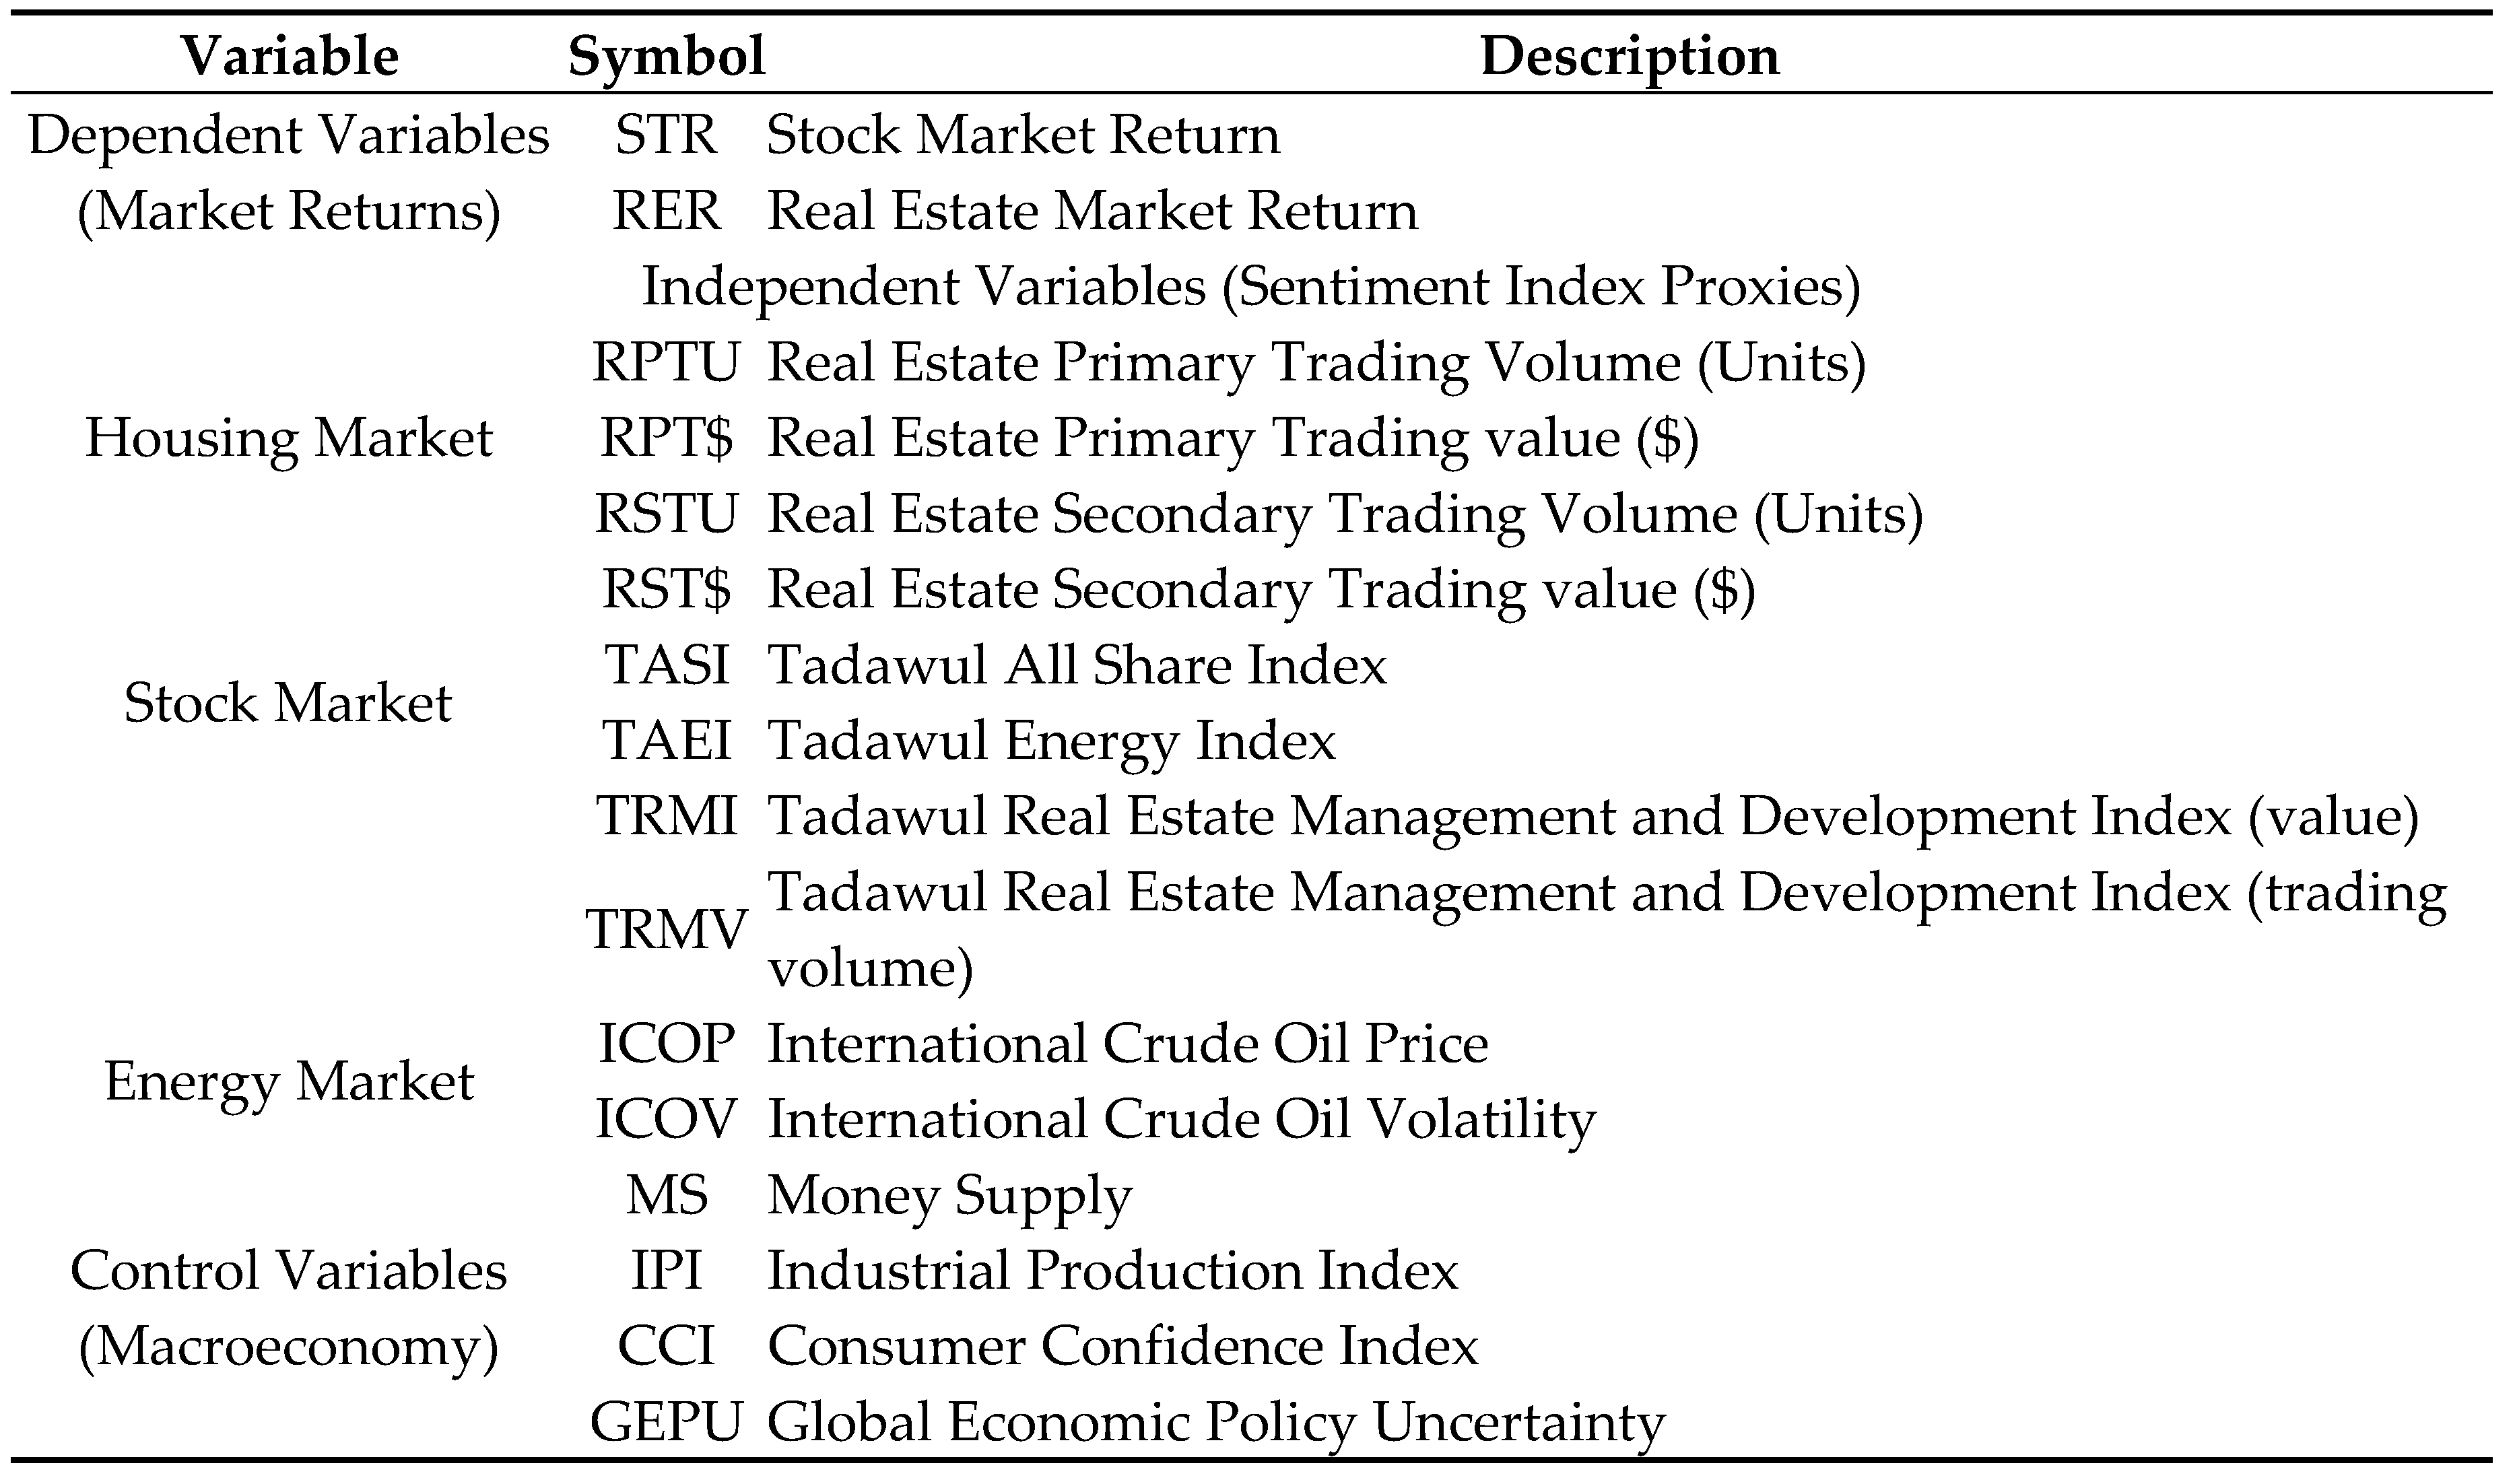
Table 1. This is a table. Variables. A summary of the variables employed in this study is listed in with their respective descriptions.
Table 1.
Variables Description.
Table 1.
Variables Description.
The PCA results in
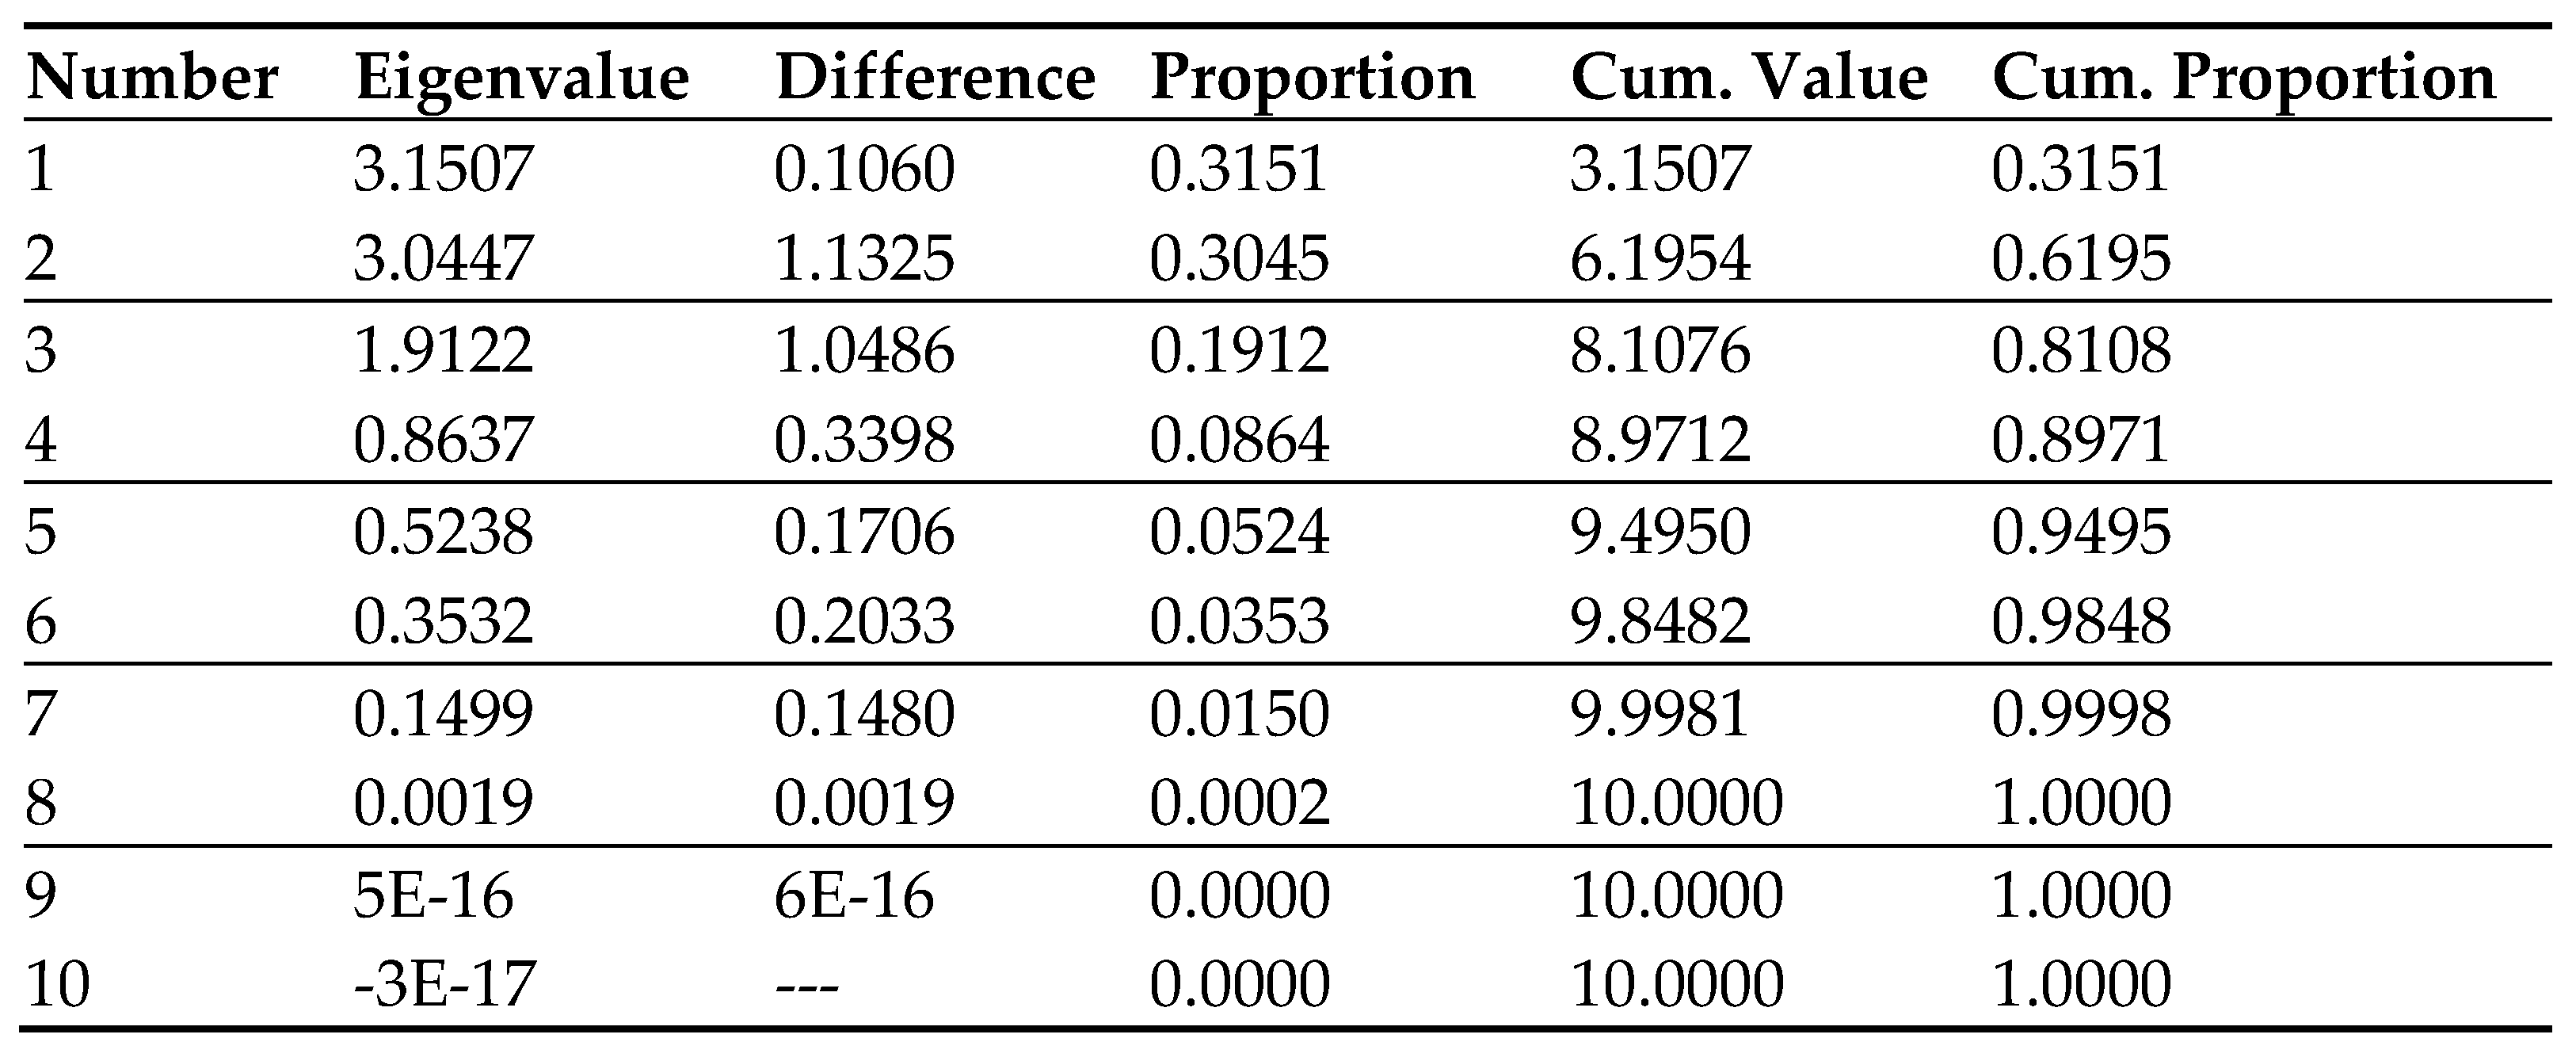
Table 2 demonstrate that the first principal component explained 31.51% of the total variance and was dominant compared to the other components. An examination of the eigenvectors shows that real estate trading volume variables (lnREPTVO and lnRESTVO) had high positive loadings on PC1, while oil prices and volatility (lnICOP and lnICOV) had negative loadings. The crude oil and real estate factors seem to contrast with each other. Overall, the PCA efficiently summarizes the diverse information from the ten indicators into orthogonal principal components that represent different dimensions of investor sentiment.
The composite sentiment index (SENT) was constructed by extracting the first principal component. To facilitate valid statistical transformations, an adjustment was made by adding 14.33 to the SENT values before taking natural logarithms.
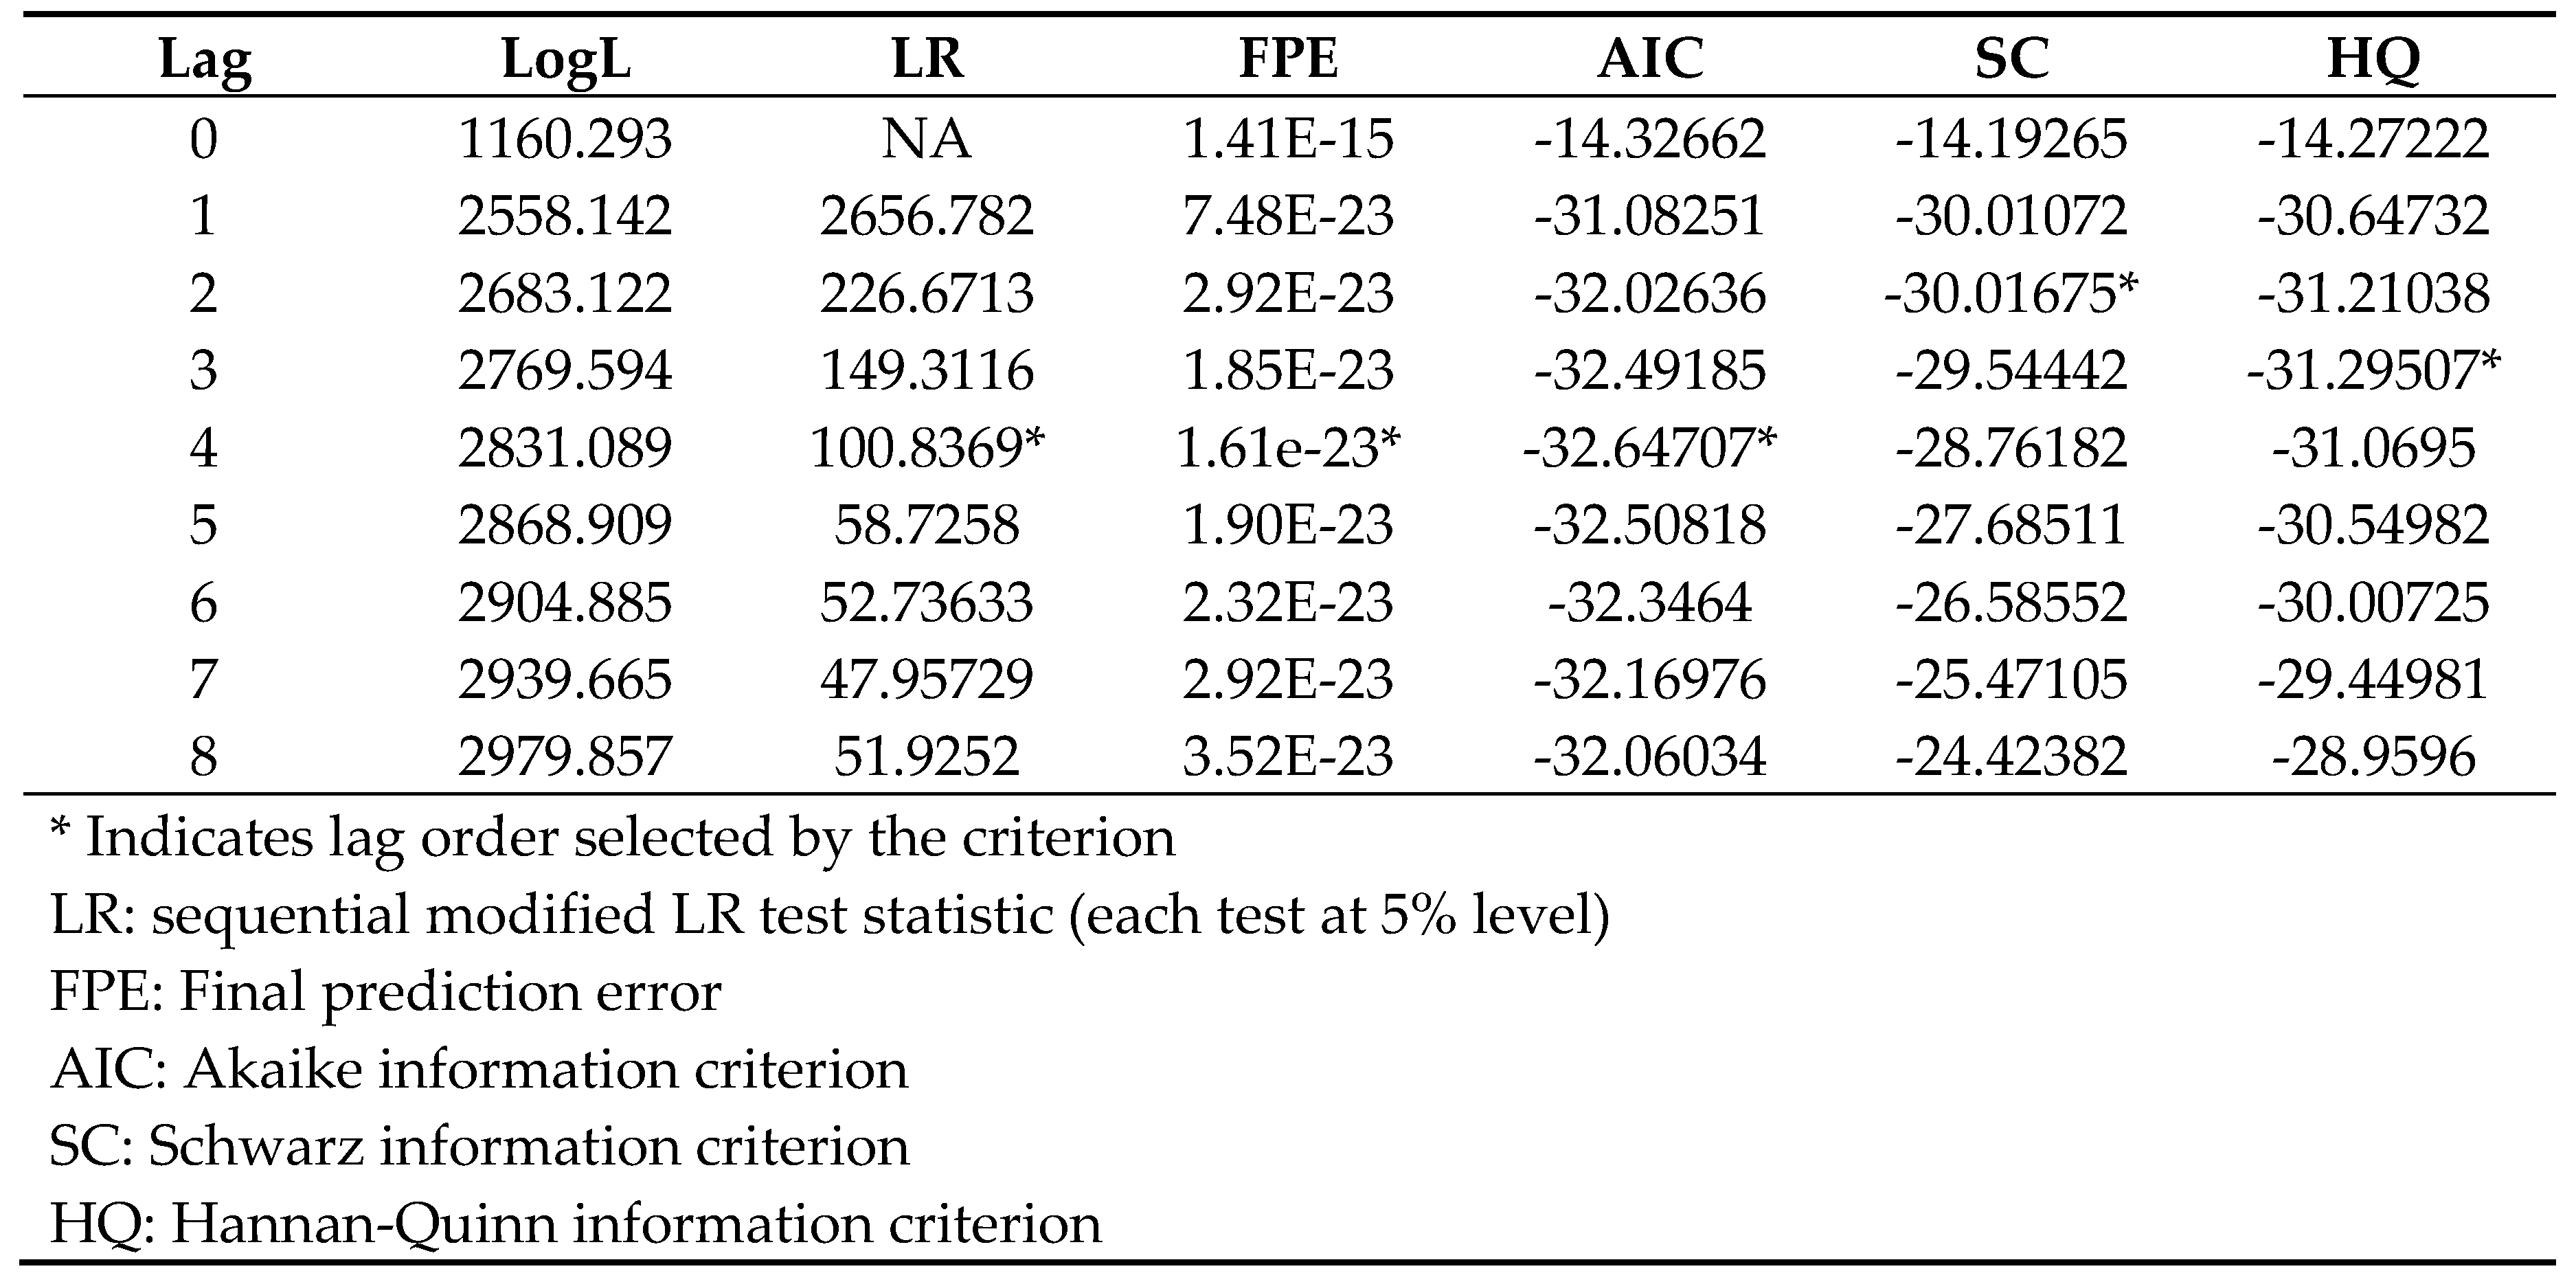
The optimal lag length for the time series modeling was determined through multiple model selection criteria. The techniques applied were Final Prediction Error (FPE), Akaike Information Criterion (AIC), Schwarz Information Criterion (SC) and Hannan-Quinn Information Criterion (HQIC). The results in
Table 3, show that AIC, FPE and LR statistics favored 4 lags, SC indicated 2 lags, while HQIC suggested an intermediate 3 lags. By weighing statistical evidence and economic reasoning, a lag length of 4 was selected for the subsequent ARDL modeling. The choice balances model adequacy with parsimony. The sensitivity analysis considering multiple criteria underscores the complexity of an appropriate lag order selection. Overall, the decision aimed for a dynamically sufficient model that incorporates meaningful economic relationships.
The results in
Table 4, indicate a mix of stationary and non-stationary series. Stock market returns (lnSMR) were stationary at level. Real estate returns (lnREMR) and sentiment index (lnSENT) were non-stationary at level but became stationary after first differencing, implying they were integrated of order one, I(1). Other variables like money supply (lnMS) and consumer confidence (lnCCI) demonstrated similar dynamics. The finding of both I(0) and I(1) series provides an appropriate setting for using ARDL-based frameworks.
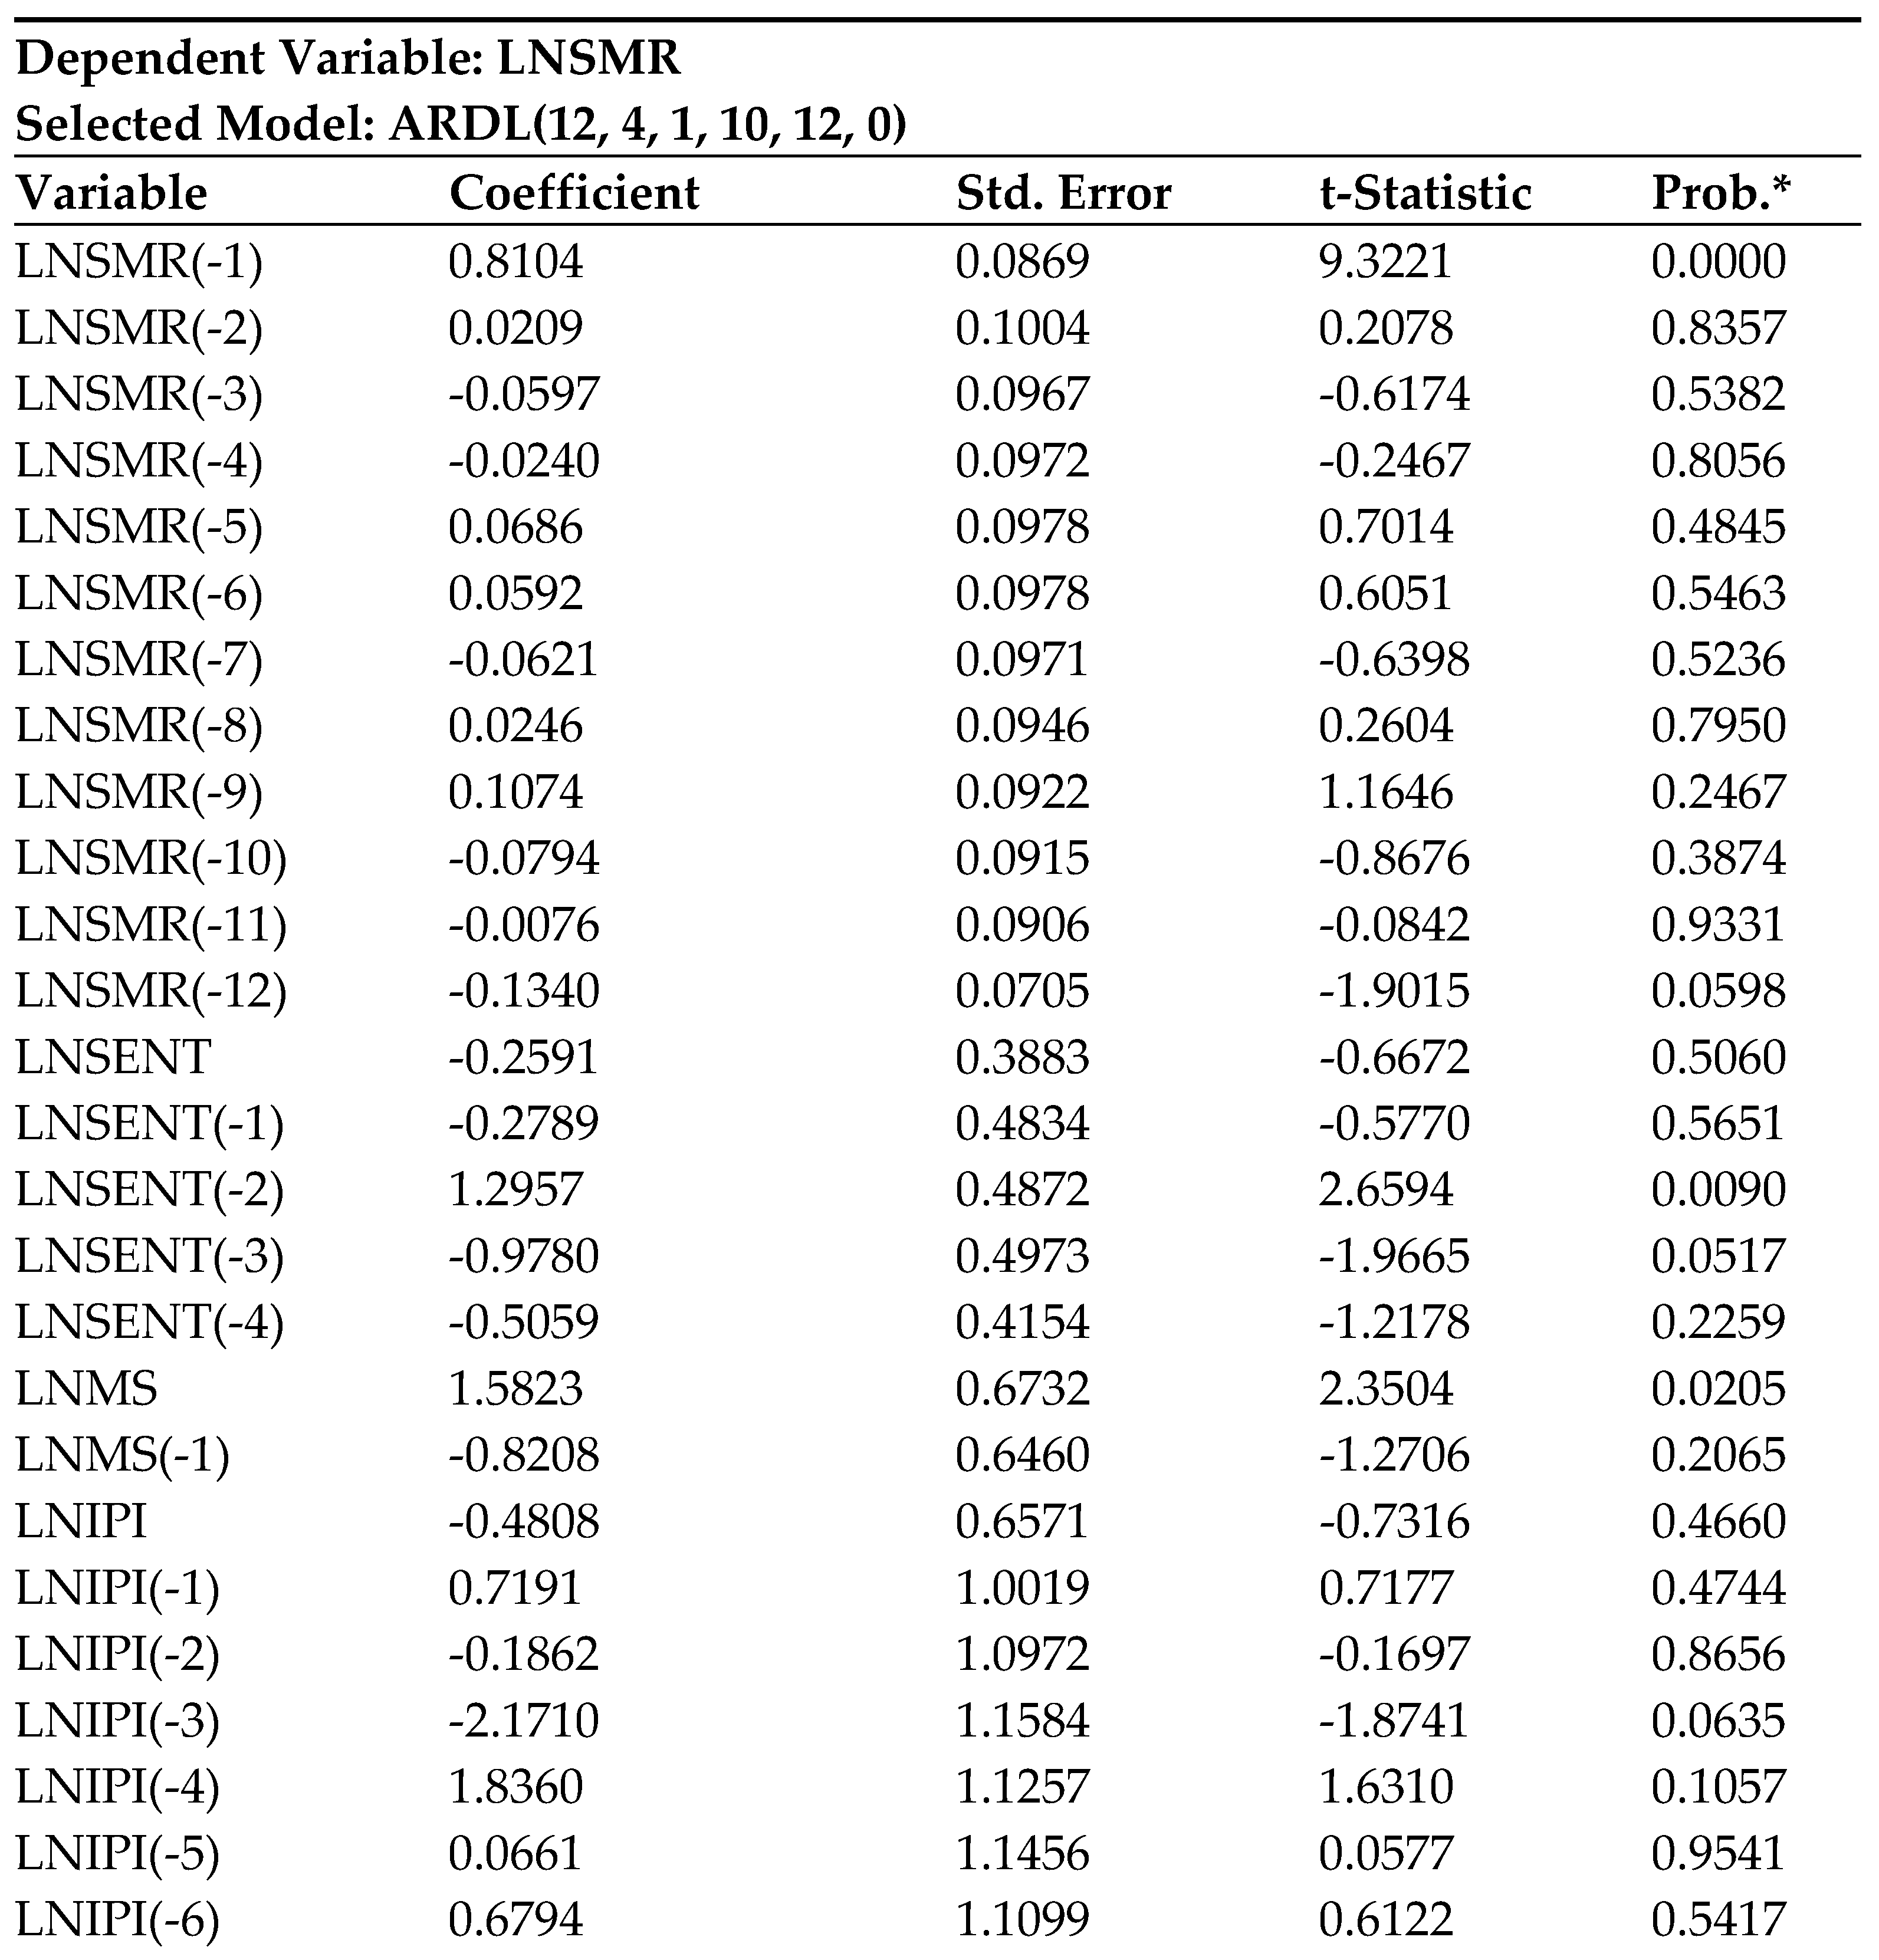
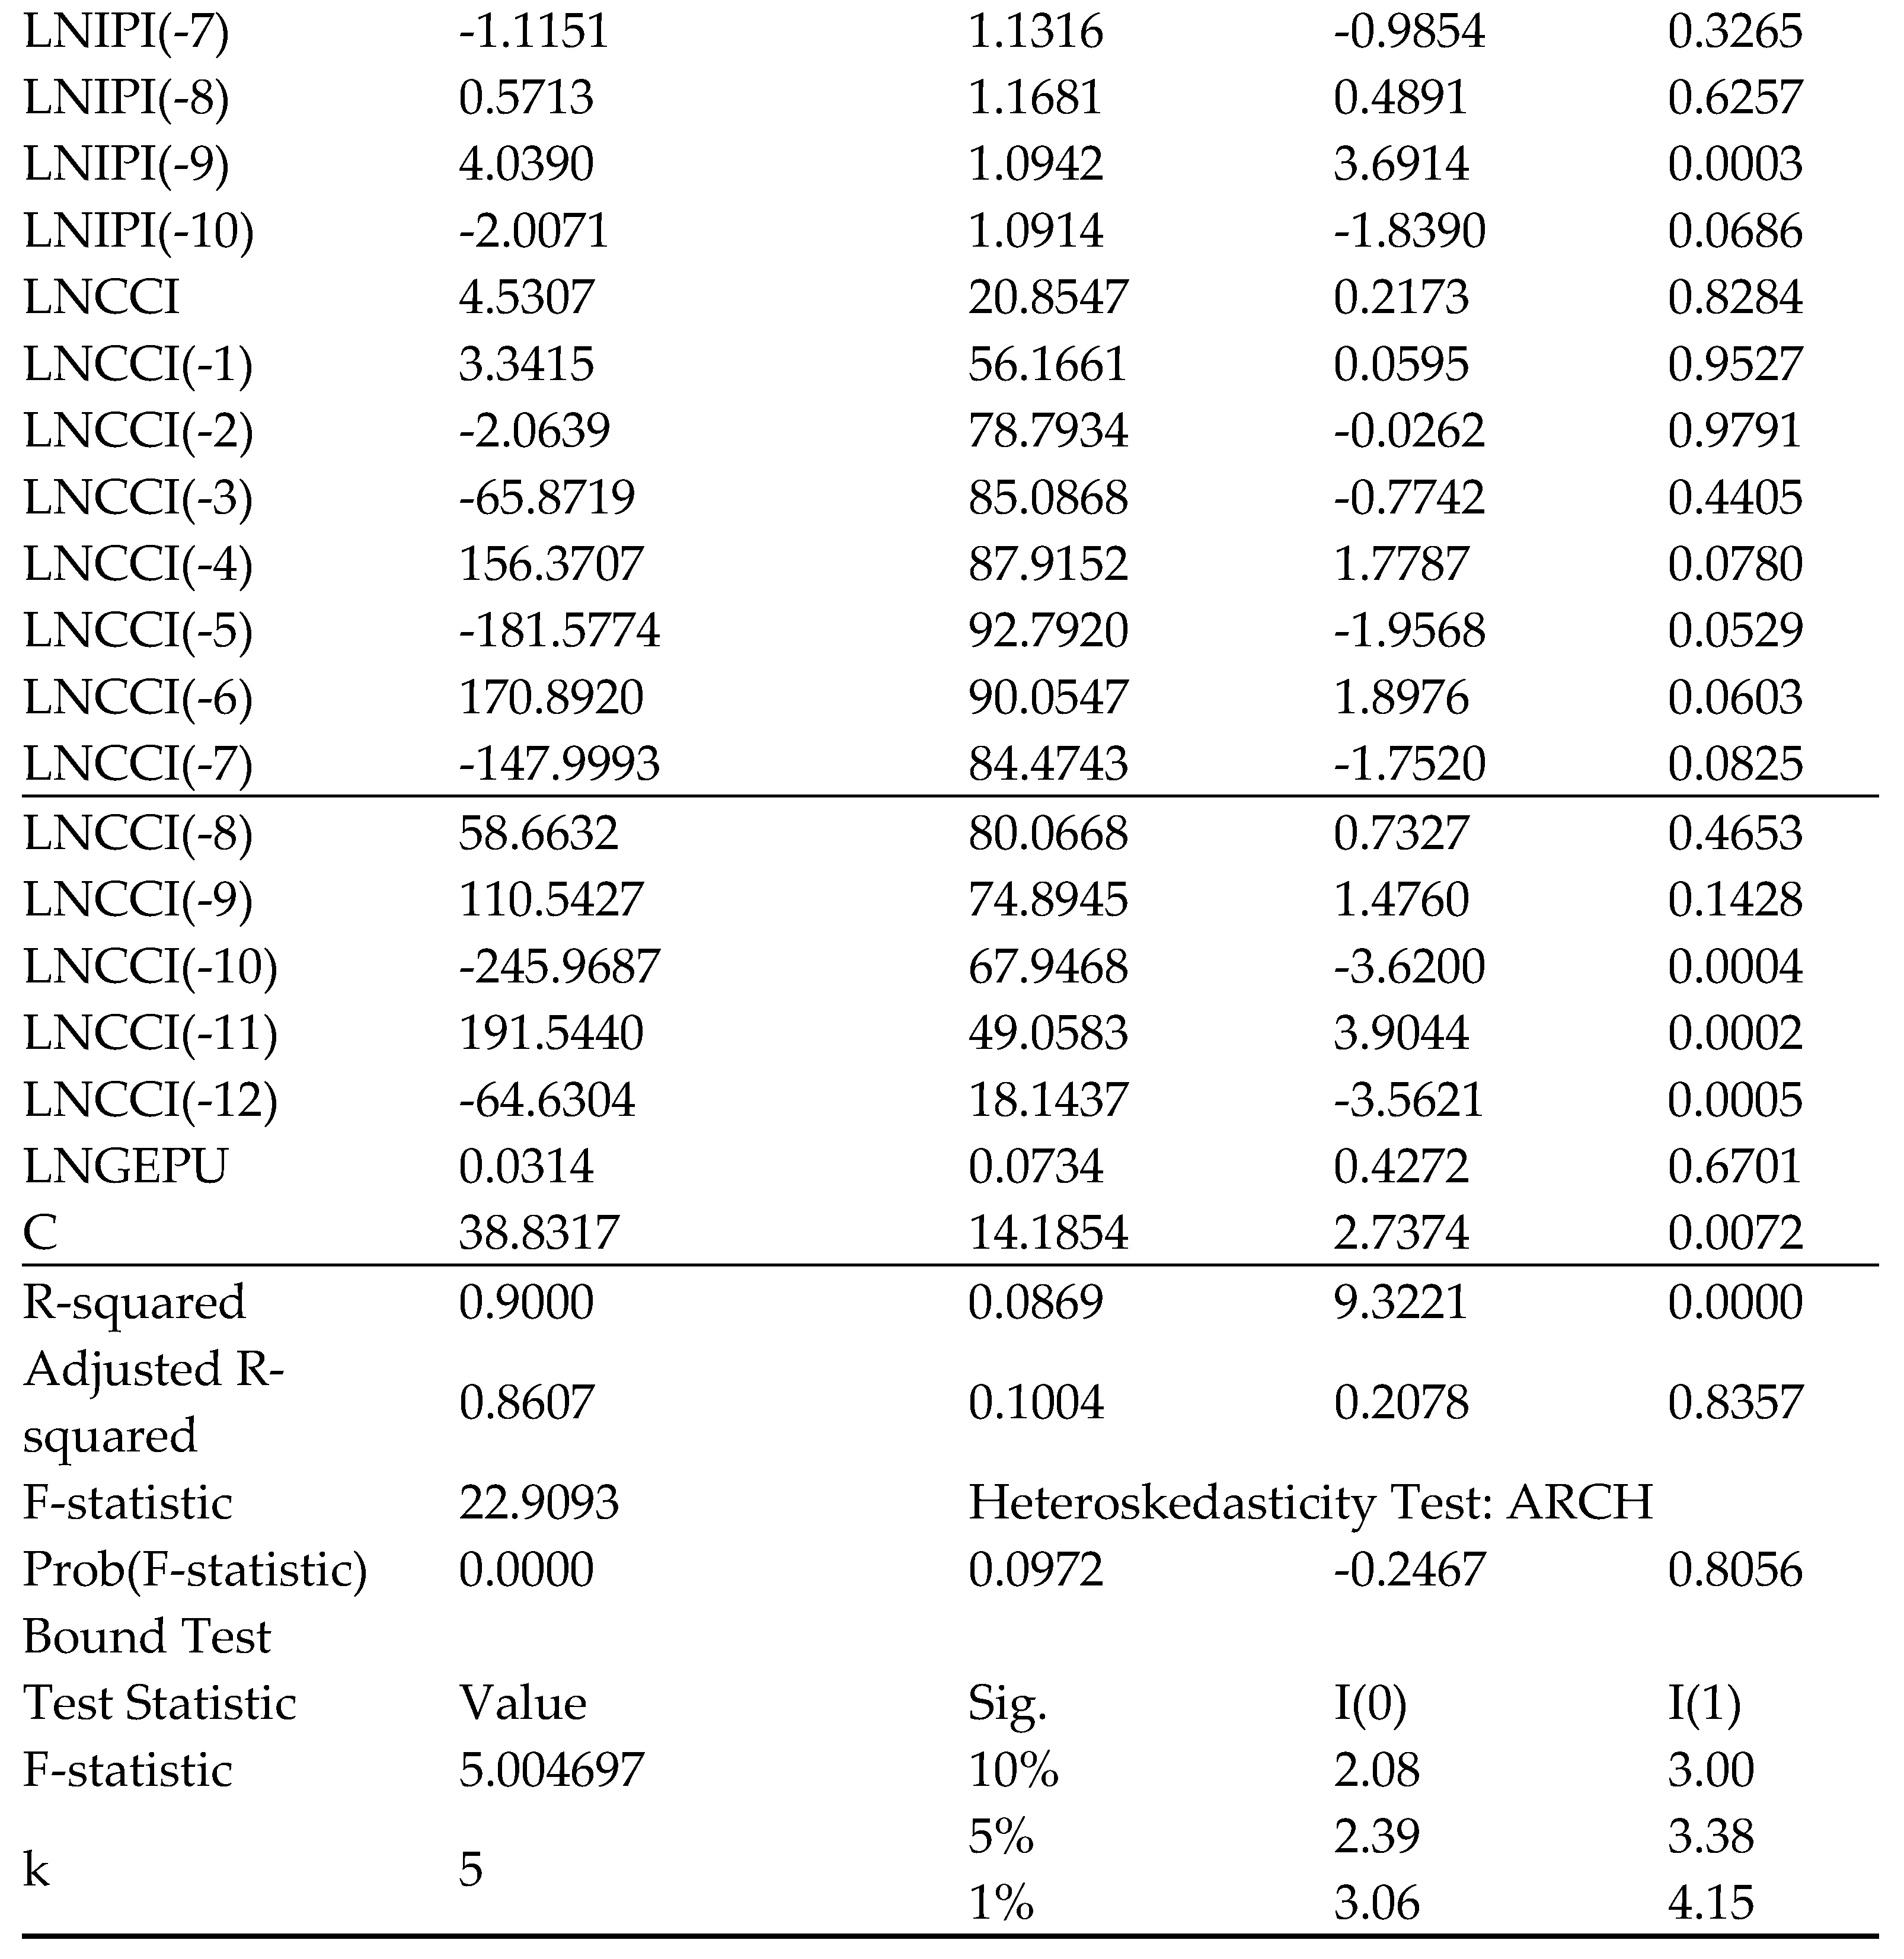
After the preliminary analysis, ARDL modeling was conducted for stock market returns (LNSMR) as the dependent variable along with sentiment, money supply, industrial production index, consumer confidence index and global uncertainty as predictors. The short-run ARDL model results are presented in
Table 5, showing a statistically significant positive coefficient for lagged sentiment (LNSENT(-2)) at the 1% level. This indicates investor sentiment impacts LNSMR with a lag of two periods. Among controls, money supply (LNMS) positively affects LNSMR contemporaneously. Multiple lags of industrial production and consumer confidence also have significant effects.
Diagnostic tests confirm the absence of serial correlation and heteroscedasticity in the ARDL model residuals. The Bound Test results further verify a long-run cointegrating relationship among the variables at the 1% significance level. This validates proceeding with the long-run ARDL model.
Table 6, show Each coefficient indicates the expected change in the dependent variable (LNSMR) for a one-unit change in the independent variable, holding all other variables constant.
Interpretation of Coefficients:
- For LNSENT: A one-unit increase leads to a decrease of approximately 2.63 units in LNSMR, suggesting that higher sentiment leads to lower market response.
- For LNMS: A one-unit increase results in an increase of approximately 2.76 units in LNSMR, indicating that a higher money supply positively impacts the market.
- For LNIPI: A one-unit increase in the industrial production index results in a rise of about 7.08 units in LNSMR, showing strong positive influence.
- For LNCCI: A one-unit increase in consumer confidence leads to a decrease of approximately 44.35 units in LNSMR, suggesting a strong negative relationship here.
- For LNGEPU: This variable has a negligible effect (0.11), indicating it does not significantly influence LNSMR.
- C (Constant): Represents the intercept of the regression model, indicating the value of LNSMR when all independent variables are zero.
- The coefficient CointEq(-1) indicates the error correction term from a cointegration analysis, which is significant (p < 0.0001). This suggests that deviations from the long-term equilibrium will correct themselves over time, reflecting a stable long-term relationship among the variables.
The final equation for the error correction model is:
Overall, The long-run coefficients show that sentiment has a significant negative effect on stock returns in the long run, contrasting the short-run dynamics. Money supply and industrial production positively affect stock returns in the long run along with a negative influence from consumer confidence. The long-run causal chain is encapsulated in the level’s equation.
The ARDL analysis provides intriguing insights into the temporal effects of investor sentiment on stock returns, with short-term predictive ability but an eventual negative long-run relationship potentially due to market overreaction. Among other variables, money supply demonstrates a consistently positive influence in both the short and long term.
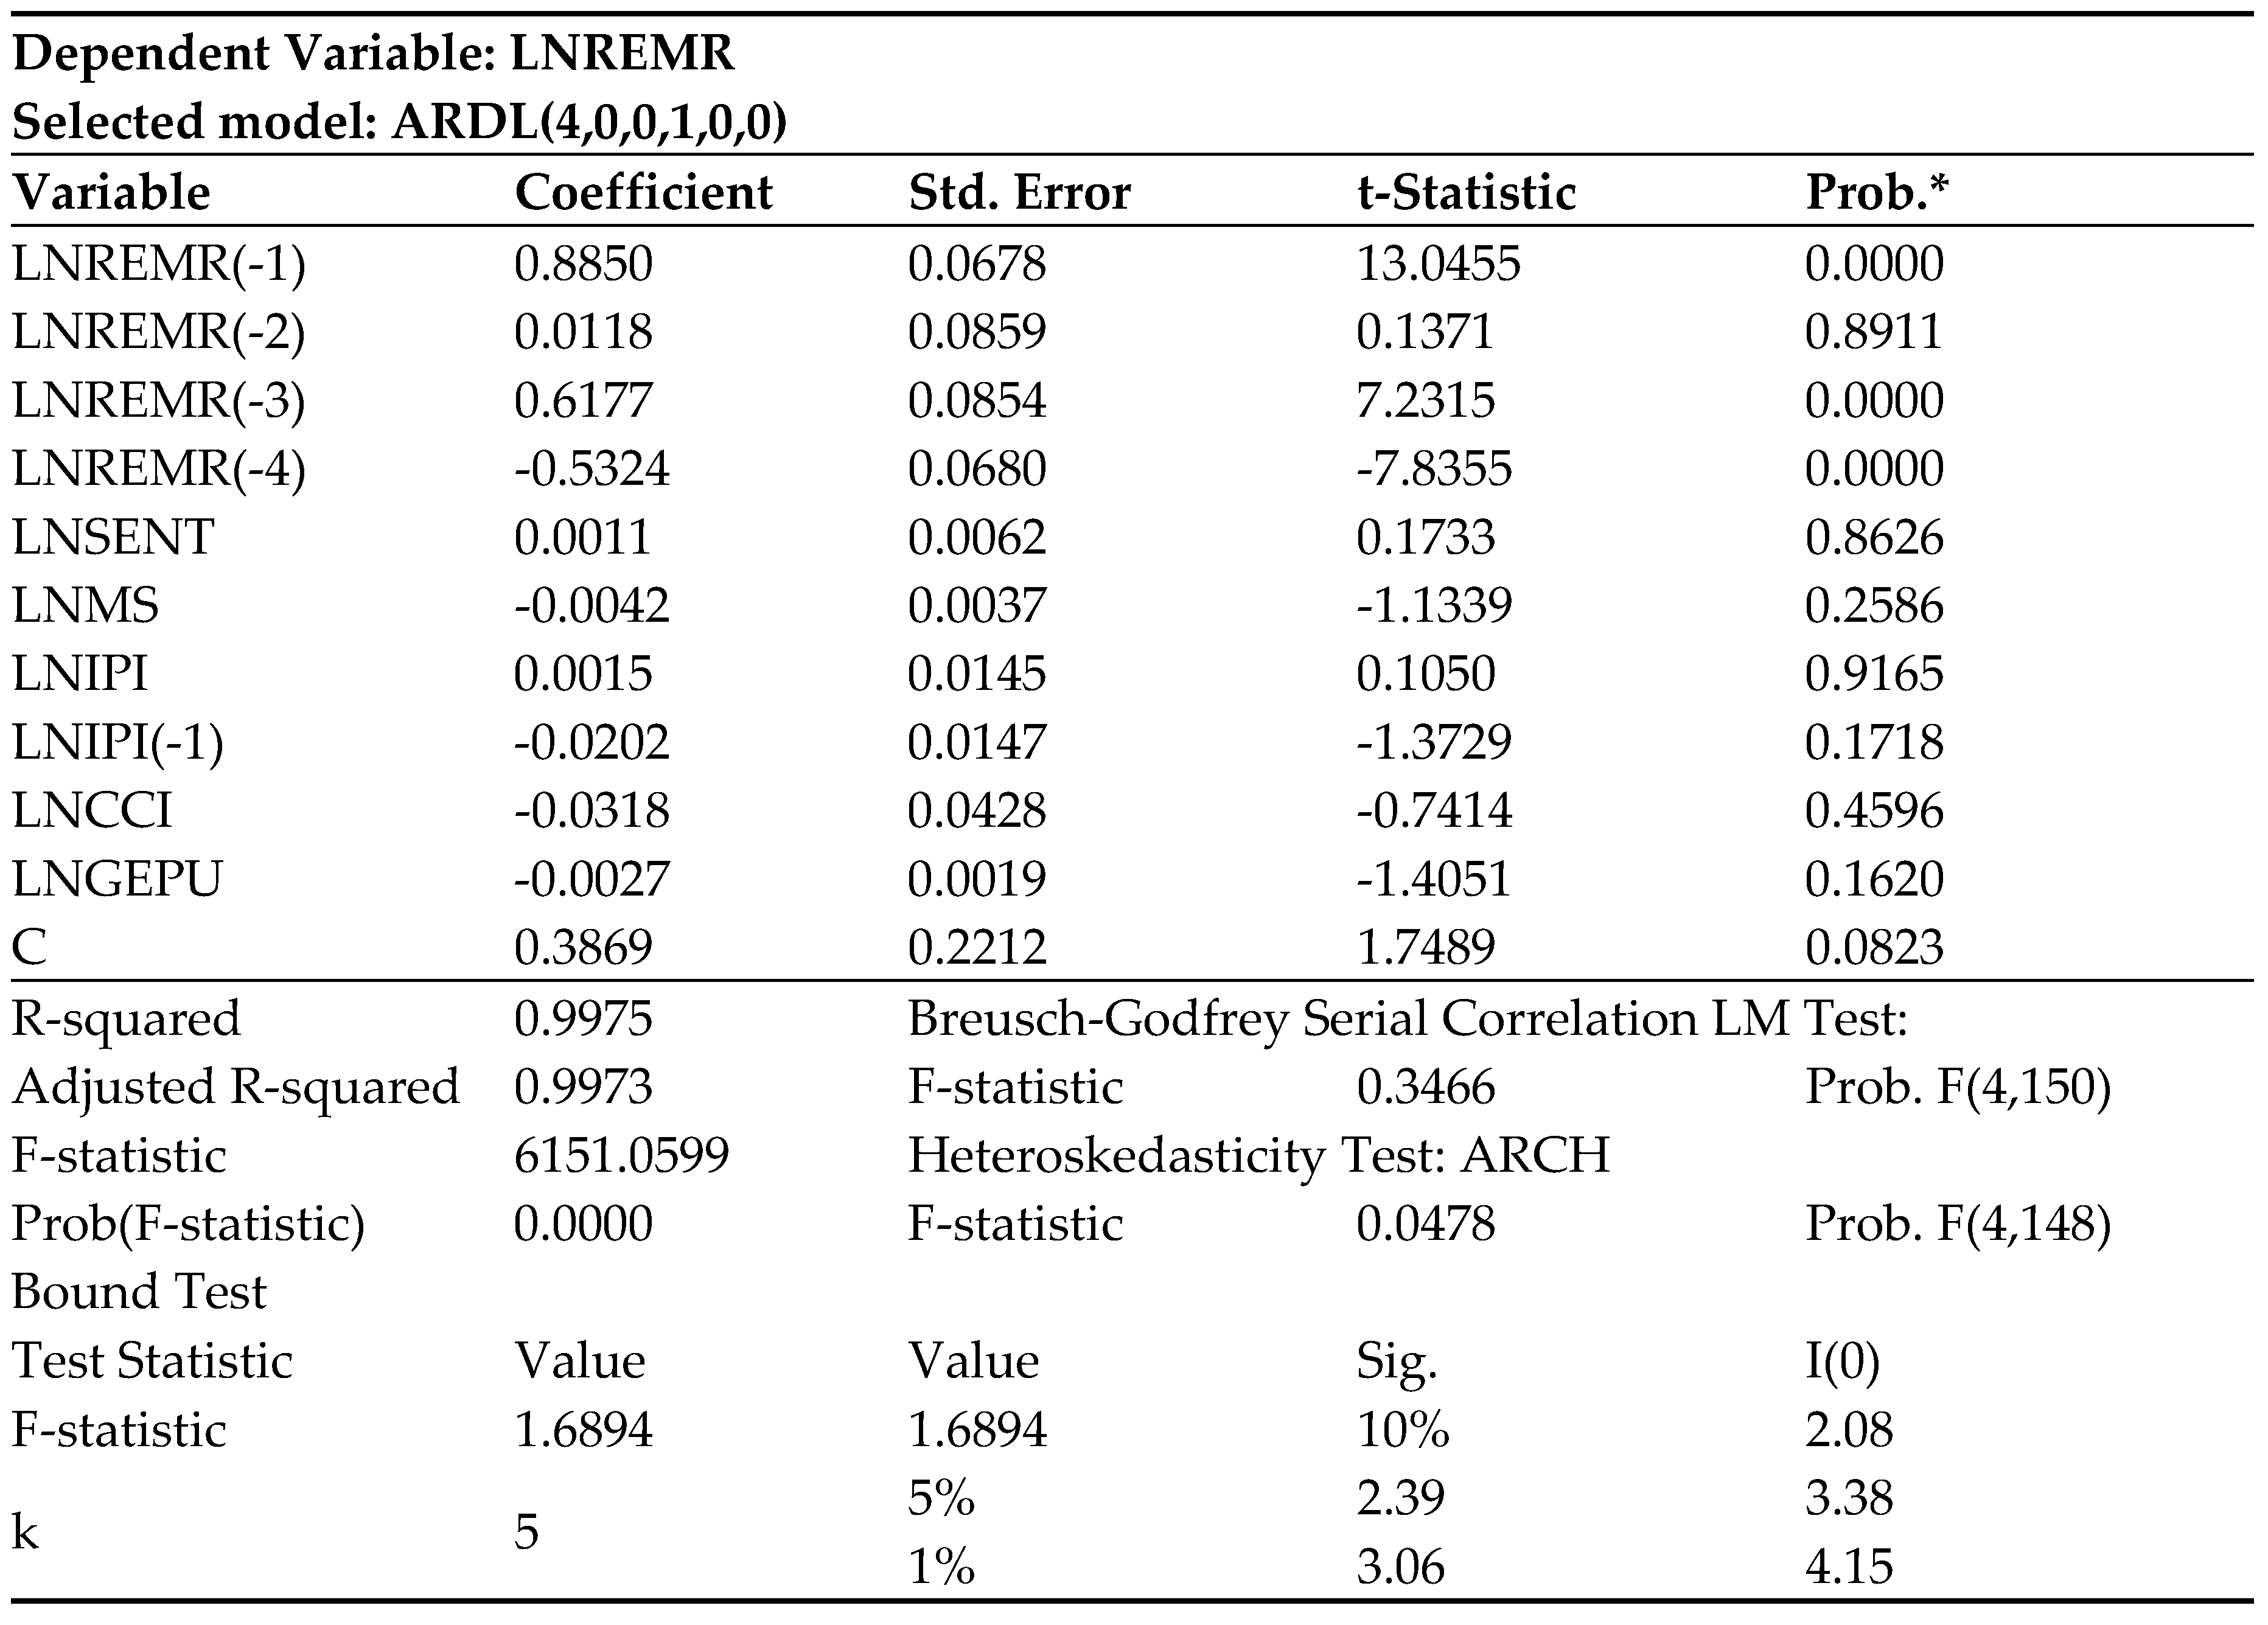
the results in
Table 7, Coefficients and Their Significance:
- LNREMR(-1): Coefficient = 0.8850, p-value = 0.0000 (significant)
- LNREMR(-2): Coefficient = 0.0118, p-value = 0.8911 (not significant)
- LNREMR(-3): Coefficient = 0.6177, p-value = 0.0000 (significant)
- LNREMR(-4): Coefficient = -0.5324, p-value = 0.0000 (significant) - Other variables (LNSENT, LNMS, LNIPI, LNCCI, LNGEPU) have high p-values, indicating they are not statistically significant in this model.
1. Intercept (C): - Coefficient = 0.3869, p-value = 0.0823 (marginally significant)
2. Model Fit:
- R-squared = 0.9975 indicates that the model explains approximately 99.75% of the variance in LNREMR.
- Adjusted R-squared = 0.9973, which is a slightly adjusted value that accounts for the number of predictors in the model.
3. Serial Correlation Test:
- The Breusch-Godfrey Serial Correlation LM Test has a p-value of 0.8460, suggesting no serial correlation in the residuals.
4. Heteroskedasticity Test:
- The Heteroskedasticity Test (ARCH) has a p-value of 0.9533, indicating that there is no significant heteroskedasticity.
5. Bound Test for Cointegration: - The F-statistic value of 1.6894 is compared with critical values for different significance levels: - 10% critical value (I(0) = 2.08, I(1) = 3.00) - 5% critical value (I(0) = 2.39, I(1) = 3.38) - 1% critical value (I(0) = 3.06, I(1) = 4.15) - Since 1.6894 is less than the lower bound at all levels, it suggests that there is no long-term relationship among the variables.
2.4. Discussion
The ARDL analysis offers valuable insights into the relationship between investor sentiment and stock market returns in Saudi Arabia. The finding that positive changes in sentiment boost stock returns with a two-month lag indicates that psychology factors do influence investor behavior and market performance. However, the negative association observed in the long- run implies that sentiment-driven mispricing may be subsequently correct, as sentiment effects are arbitraged away over longer horizons. This contrasts with [
5,
7] who found a persistent negative relationship between lagged sentiment and US stock returns. The Saudi market demonstrates less lasting inefficiencies. The uniformly positive role of money supply aligns with [
25], who showed monetary policy shifts significantly predicted Saudi returns. Expansionary policy appears to consistently drive market gains. Moreover, the absence of any marked real estate return response to sentiment contrasts with [
27], who found depressed Saudi investor optimism, reduced market activity. The resilience seen here could stem from strict government regulations that curb speculative real estate investing. Overall, while psychology shapes Saudi investor behavior, market forces likely limit sustained mispricing. The nuanced temporal effects highlight the merits of ARDL modeling in capturing the complexity of dynamic relationships. Further research should examine regional differences and the role of oil shocks in triggering sentiment-driven return anomalies. Replication with higher frequency data may also elucidate short-run dynamics.
