2. SOFC Models
Pianko-Oprych and Palus (2017) [
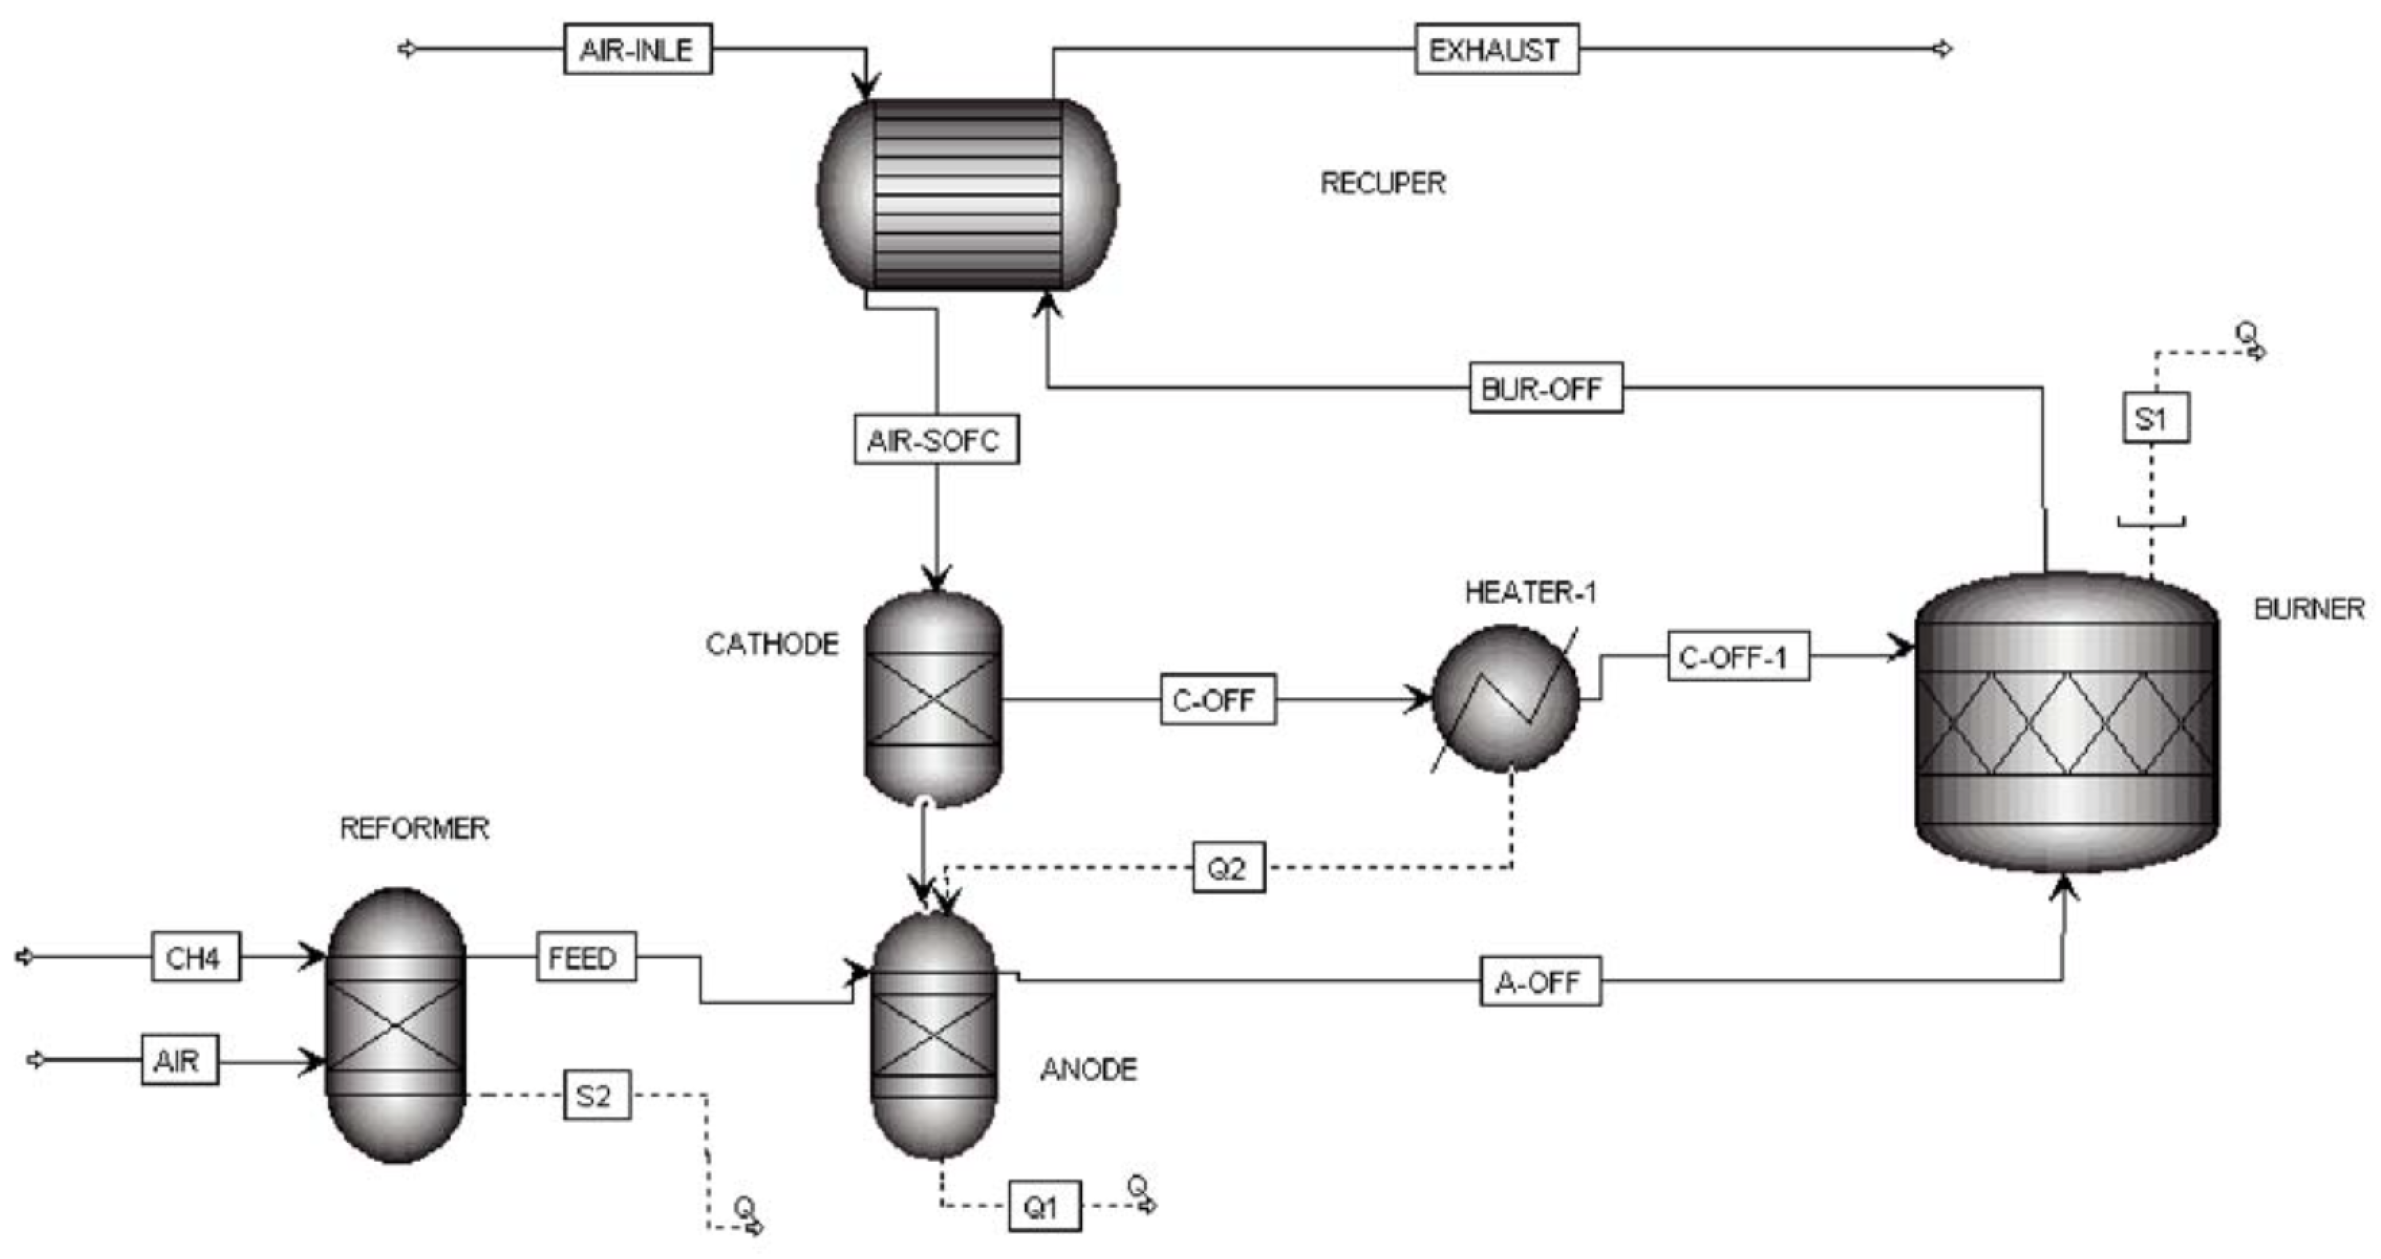
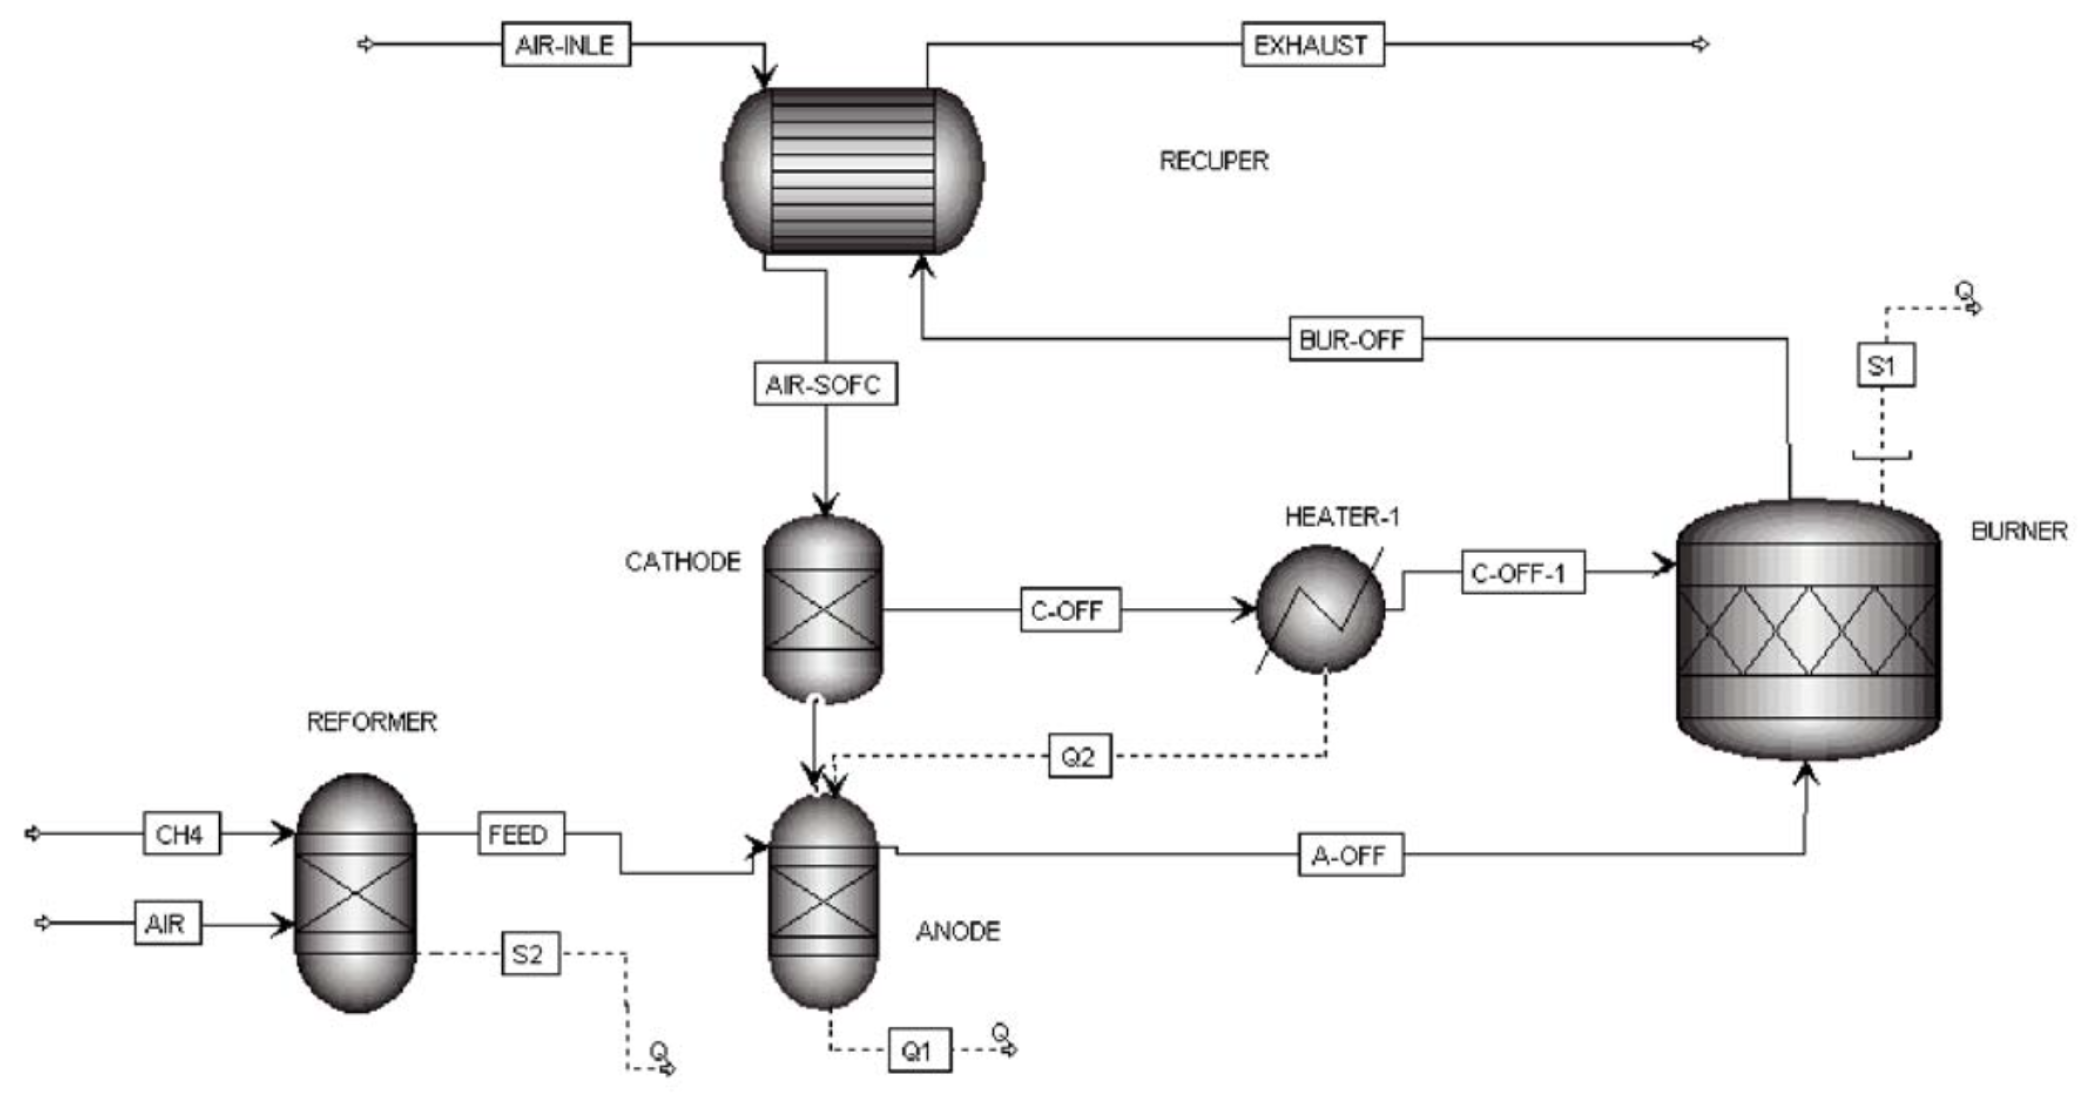
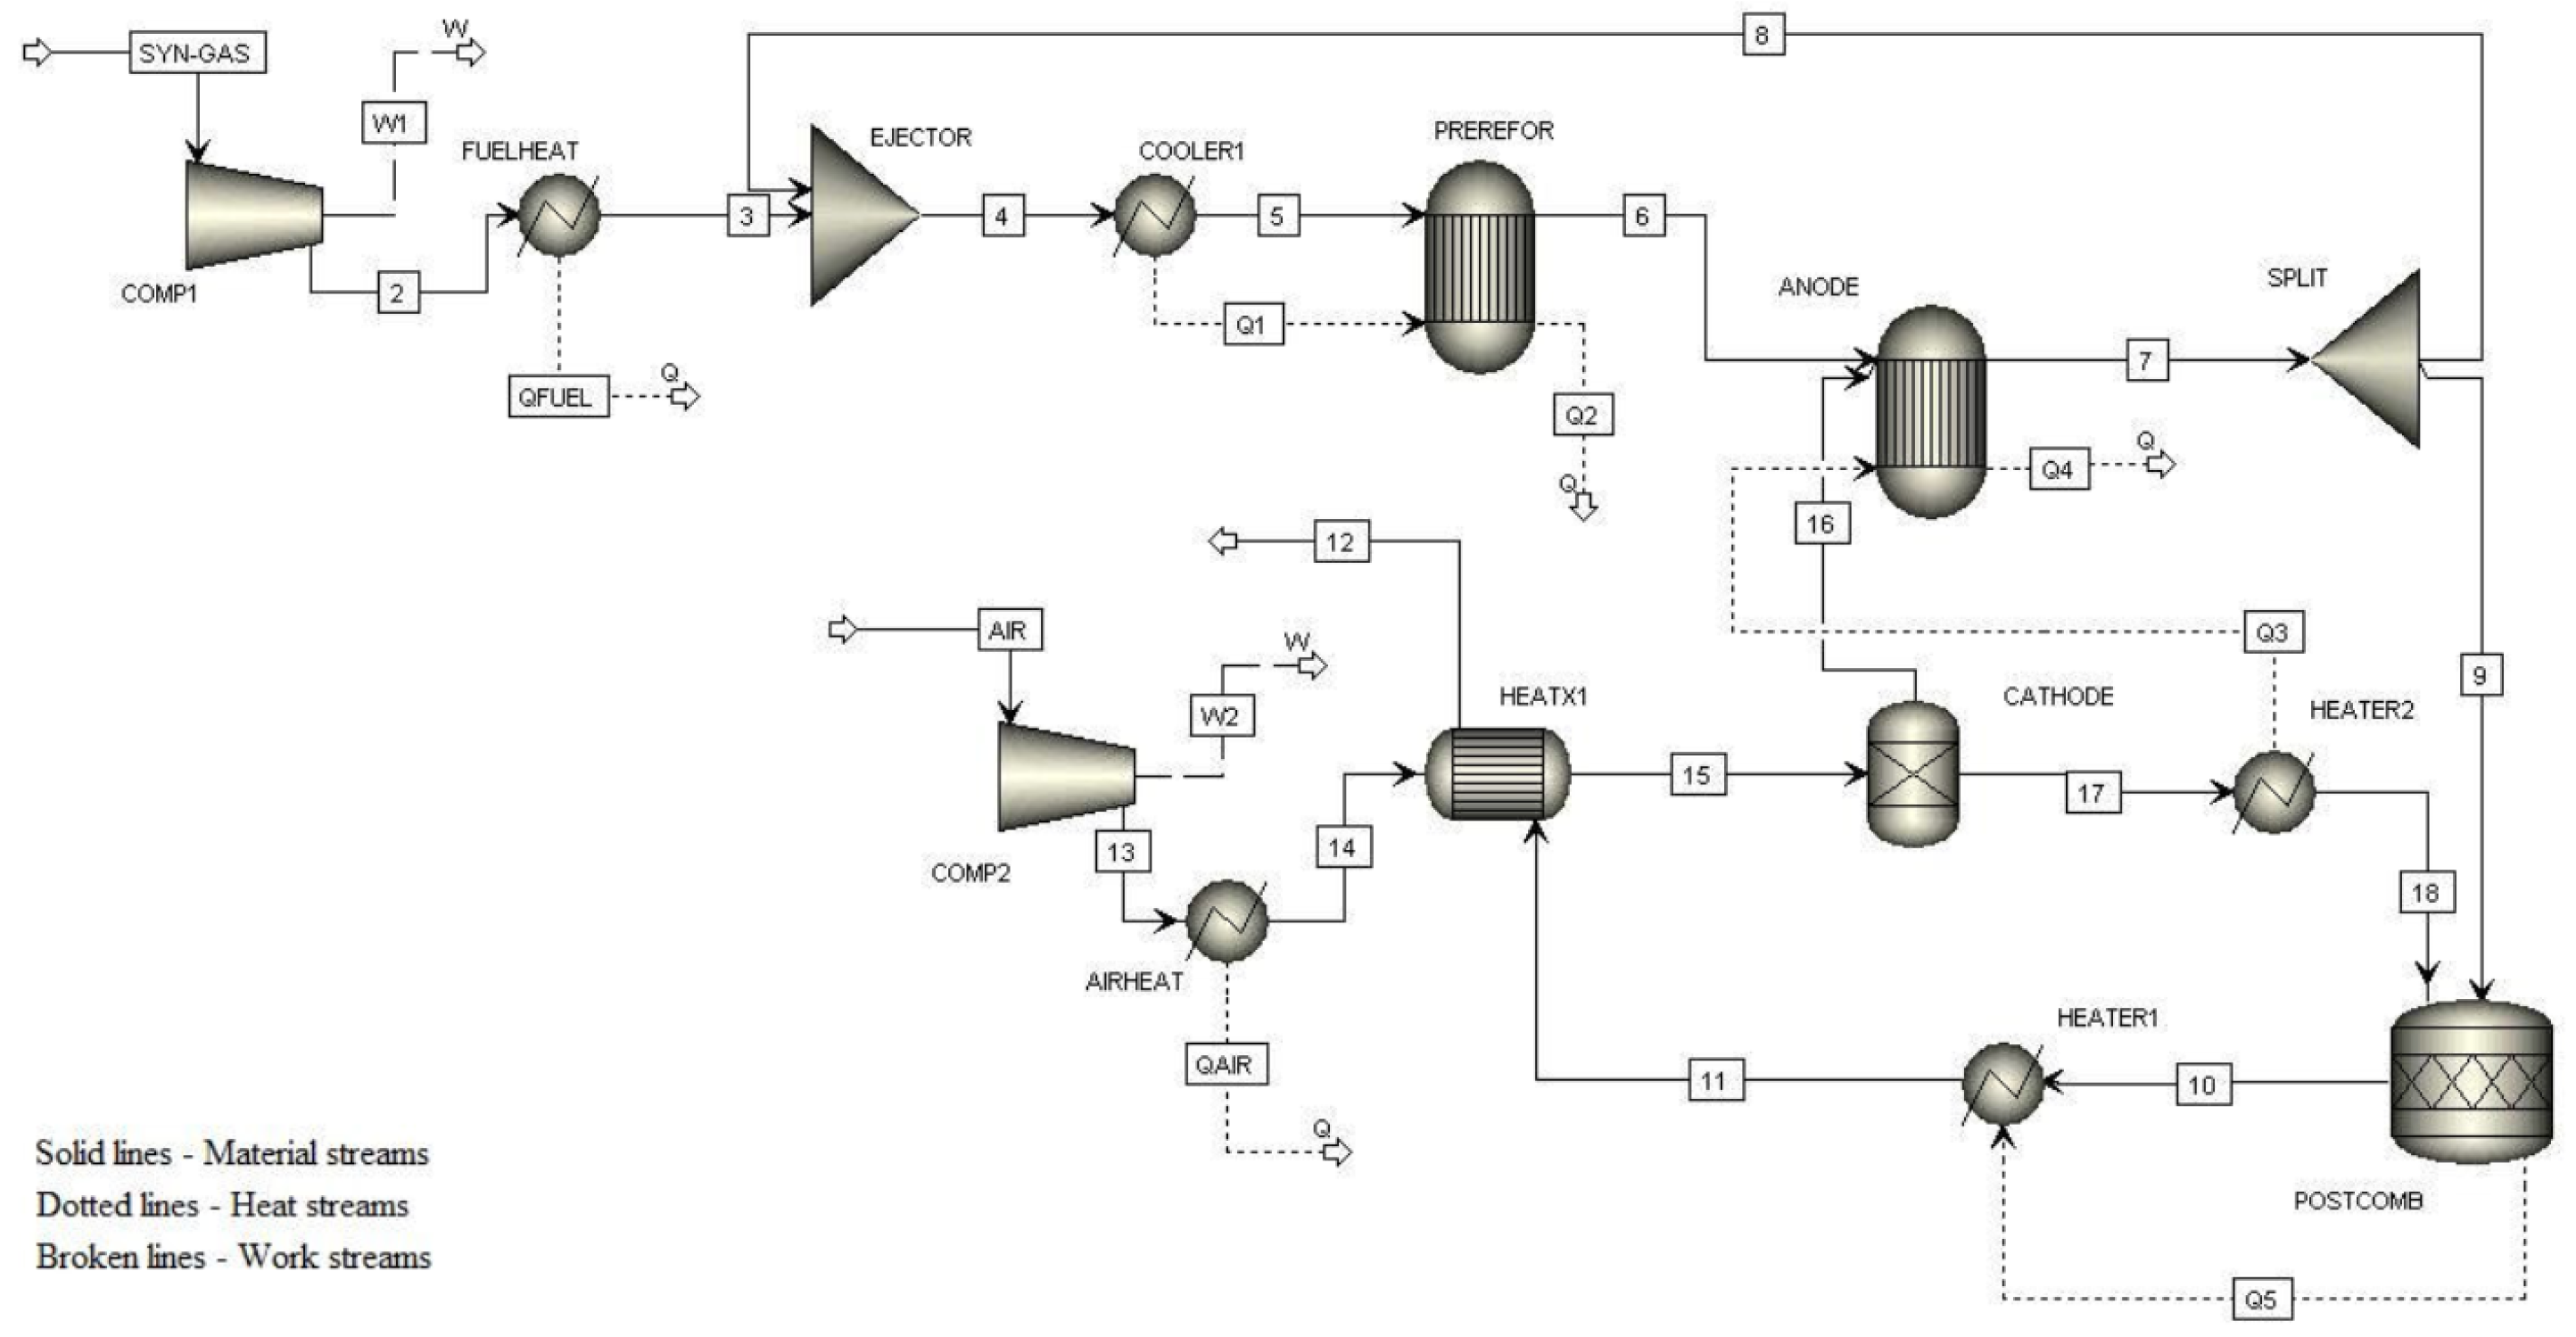
50], developed a thermodynamic simulation model using Aspen Plus for a SOFC-based power generation system, as shown in
Figure 1. The work was carried out in two main phases. In the first phase, a steady-state model was created that integrates electrochemical and diffusion phenomena. Subsequently, a parametric study was conducted to evaluate how the oxygen/carbon (O/C) ratio affects various aspects of the system, such as the reformer and fuel cell temperature, fuel utilization, and overall cell performance. In the second phase, a dynamic analysis was developed to explore the system’s response to variations in the O/C ratio and fuel utilization.
The SOFC block was simulated in Aspen Plus using the following modules, as shown in
Table 1.
The main results are shown in
Figure 2 and
Figure 3, and the power generated by the SOFC is 121 W. Although the model allows for a detailed description of the thermodynamics and electrochemical behavior of SOFCs, it exhibited some significant shortcomings.
In particular, deviations emerged at lower current density points, indicating that the model may not be entirely accurate under these conditions.
Moreover, the integration of existing Aspen Plus/Aspen Dynamics functions with user-defined subroutines added complexity, potentially limiting the model’s ease of use and versatility. These factors raise concerns about the model’s reliability in real-world application scenarios and its ability to accurately predict SOFC system performance under all operating conditions.
As observed from the simulation, increasing the current density leads to a decrease in voltage but an increase in power. However, the voltage decreases significantly due to voltage losses, which are normal in such systems. Fuel utilization is a crucial parameter that influences the cell voltage. When fuel utilization decreases, the voltage decreases as well, and vice versa. Nevertheless, rapid changes may lead to temperature spikes that could damage the cell.
The air-CPOx ratio () was also evaluated, which has a less significant effect on cell voltage compared to fuel utilization. However, there is a balance between efficiency and the risk of carbon formation, limiting the possibility of reducing the air-CPOx ratio too much.
Hauck et al. (2017) [
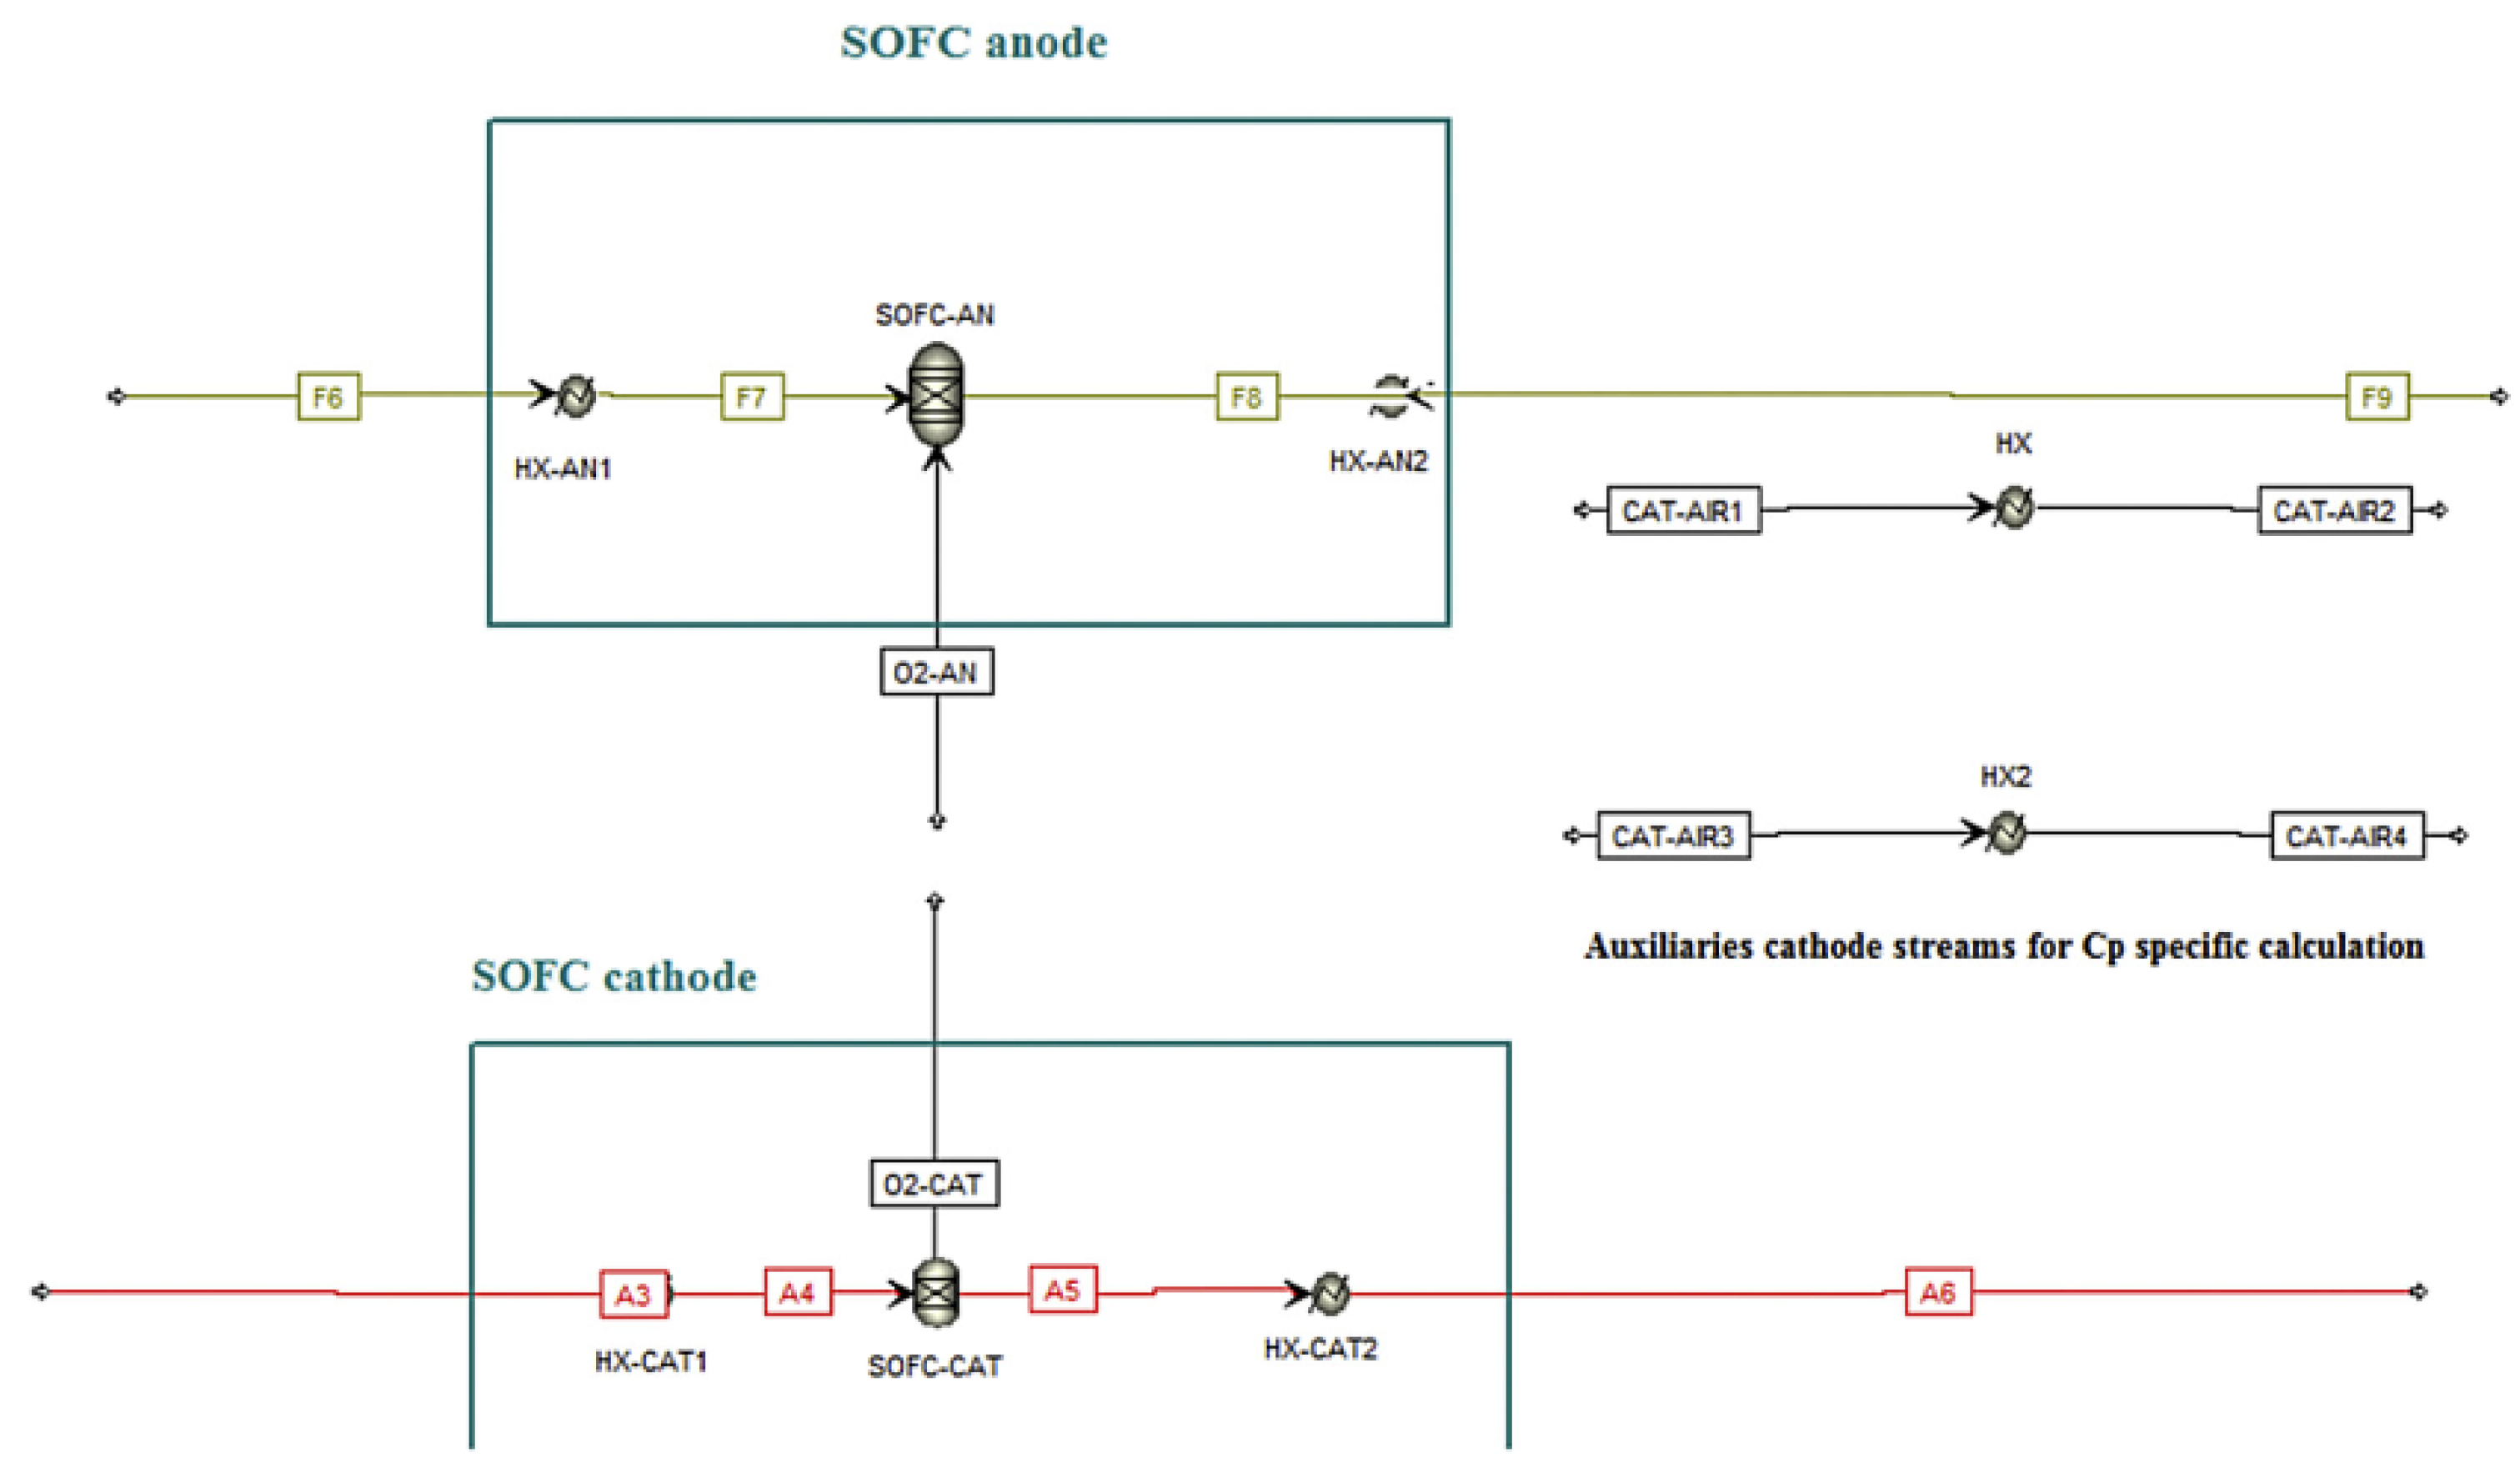
51], developed and evaluated a thermodynamic simulation model in Aspen Plus for a reversible SOFC. This model includes a module for electrolysis and a fuel cell module, the latter based on the existing non-reversible SOFC model by Tjaden et al. (2014) [
52], shown in
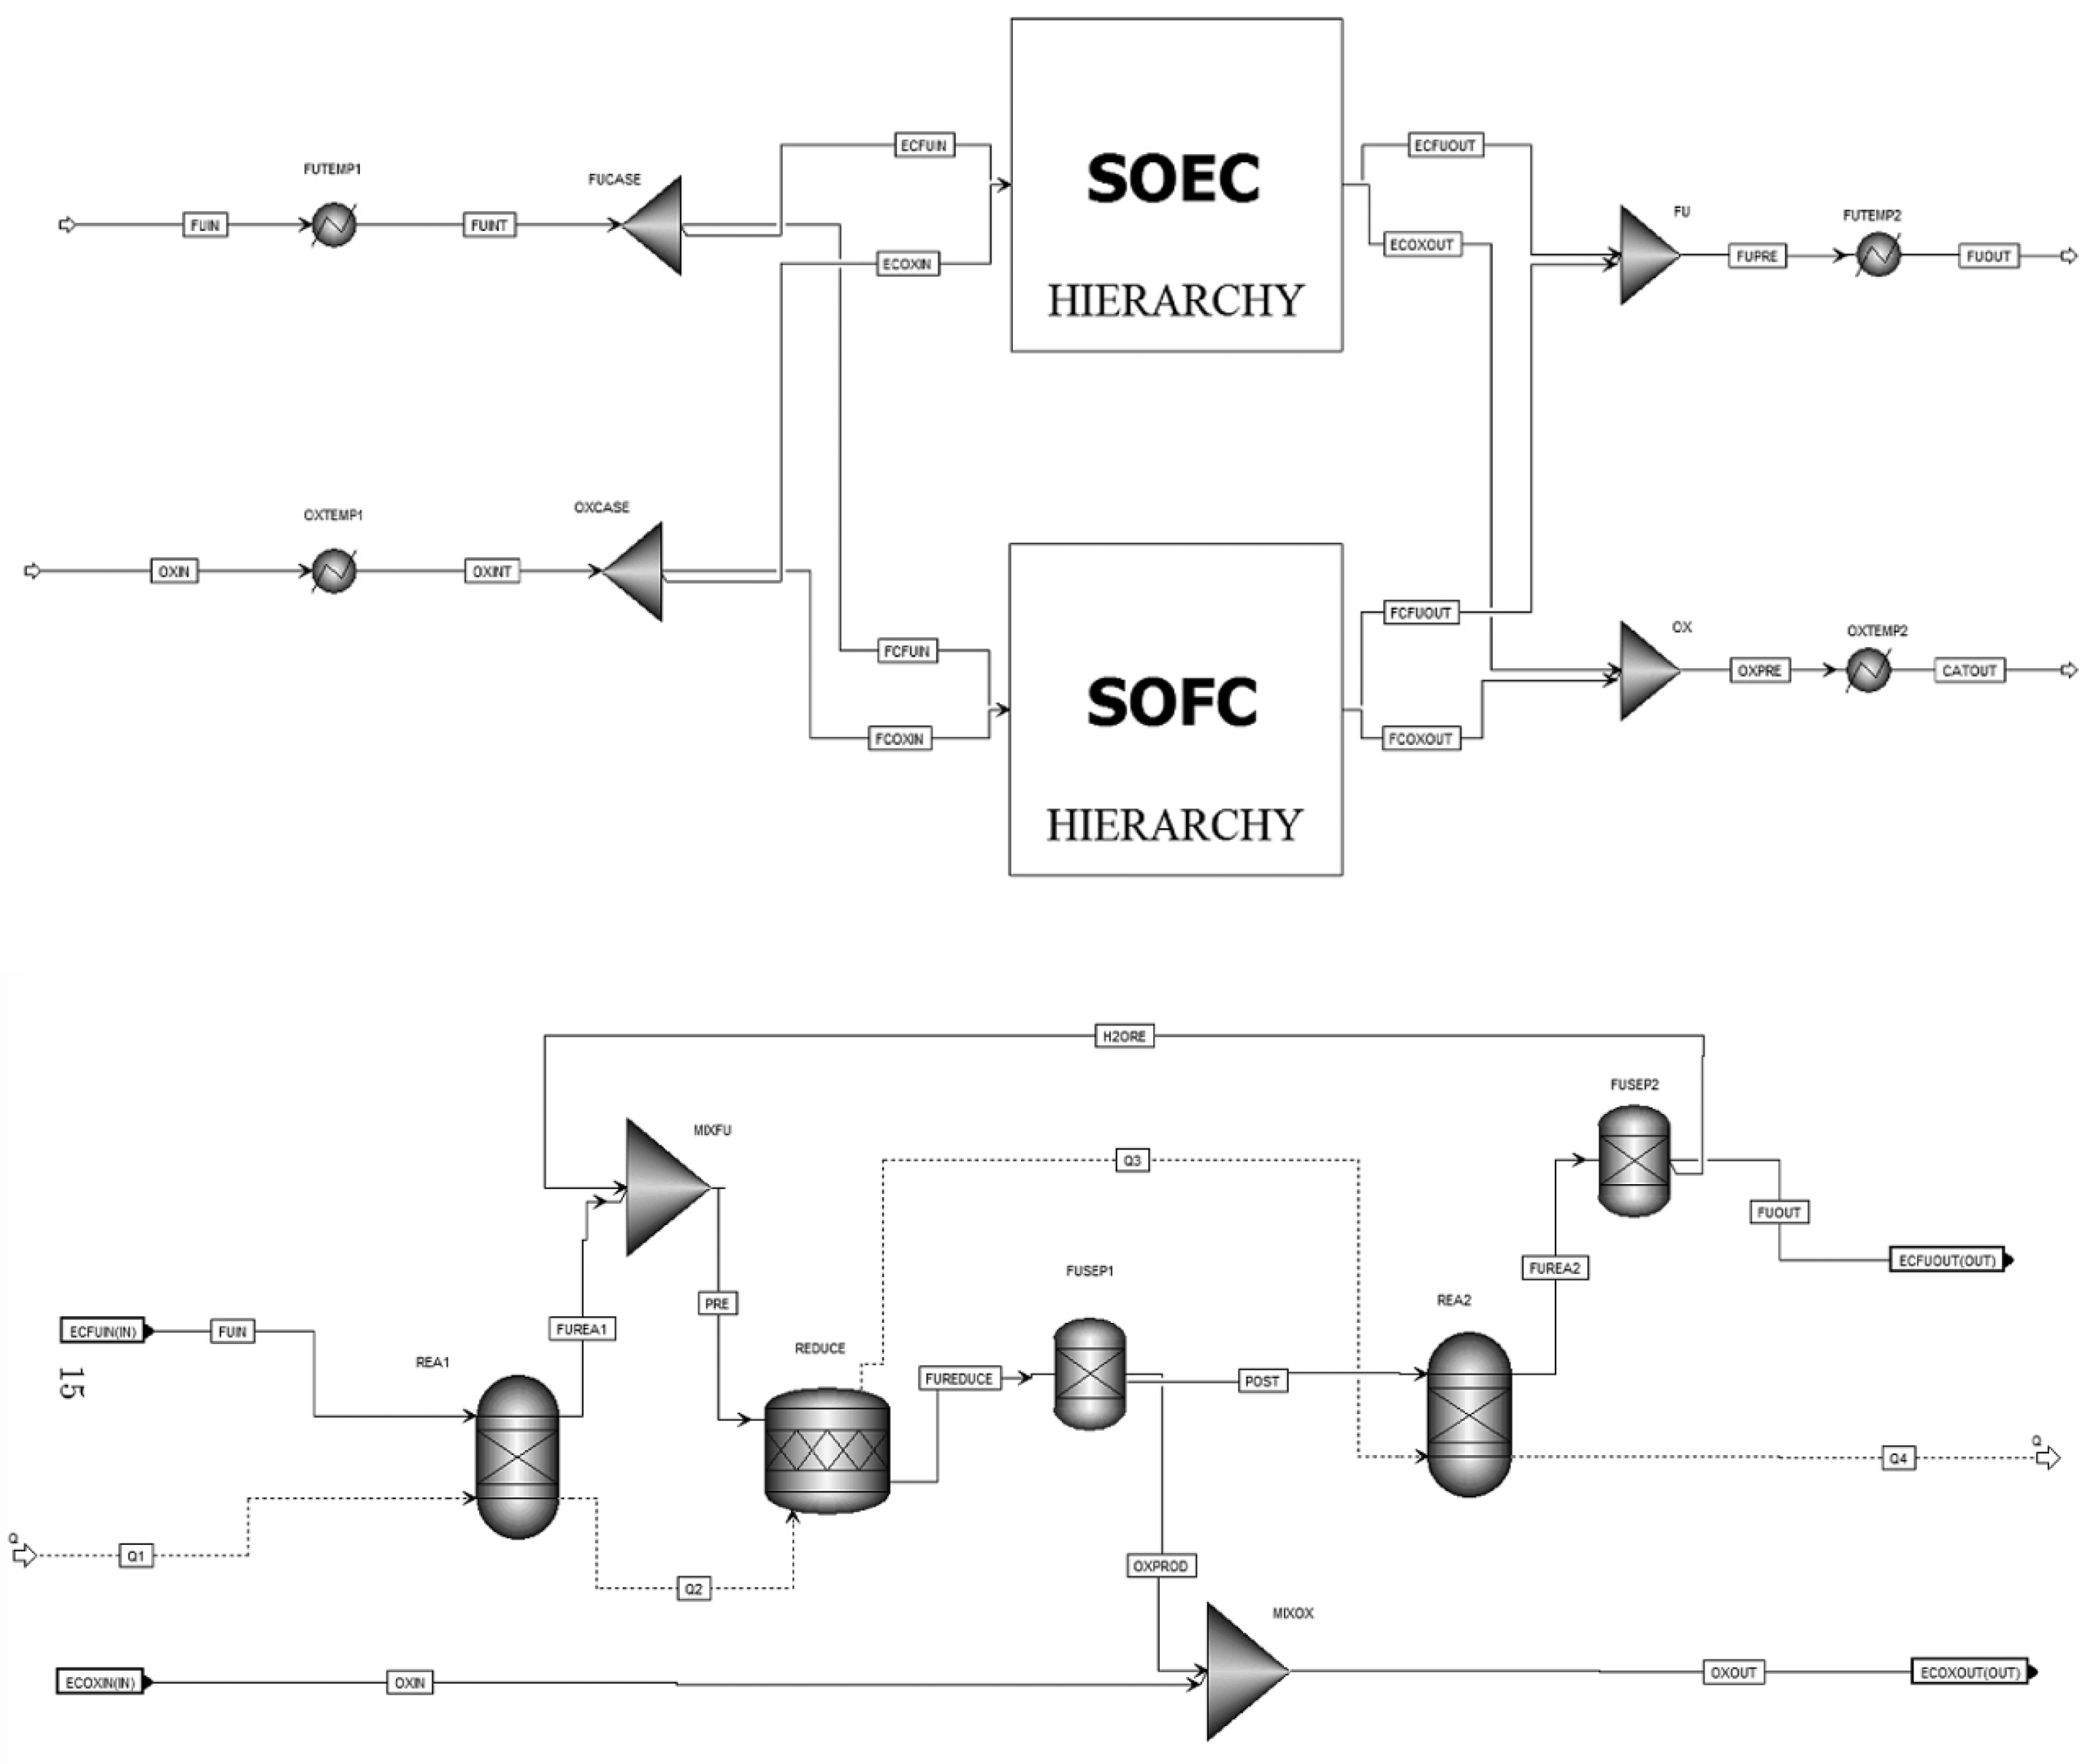
Figure 4. The electrolysis module simulates both water electrolysis and catalytic reactions of the inlet gases.
The reversible SOFC in question was simulated in Aspen Plus, as shown in
Figure 5.
The SOFC block was simulated in Aspen Plus using the following modules, as shown in
Table 2:
In the present study, although the model provides a detailed description of reaction kinetics and has been validated with empirical data, it presents some shortcomings.
Specifically, modeling as REquil, although supported by the results, may not accurately represent the real dynamic behavior of the RSOFC, limiting the accuracy of predictions under variable operating conditions.
Moreover, the simulation neglected CO2 electrolysis, assuming that the reverse WGS reaction is predominant, a simplification that may not apply to all operating conditions.
Another critical point concerns the influence of hydrogen and steam concentration in the inlet stream. While it was observed that increasing hydrogen improves the fuel cell mode at the expense of electrolysis, this complex interaction may require further analysis to avoid undesirable conditions in real-world operations.
Additionally, while increasing the operating temperature showed benefits for most conditions, the model may not adequately account for the impact of these high temperatures on long-term degradation phenomena in the cells, a critical aspect for durability and operational costs.
Finally, operating under pressure, although advantageous for the fuel cell mode, presents uncertainties regarding the ability of kinetic improvements to offset the negative effects of the higher Nernst potential in electrolysis.
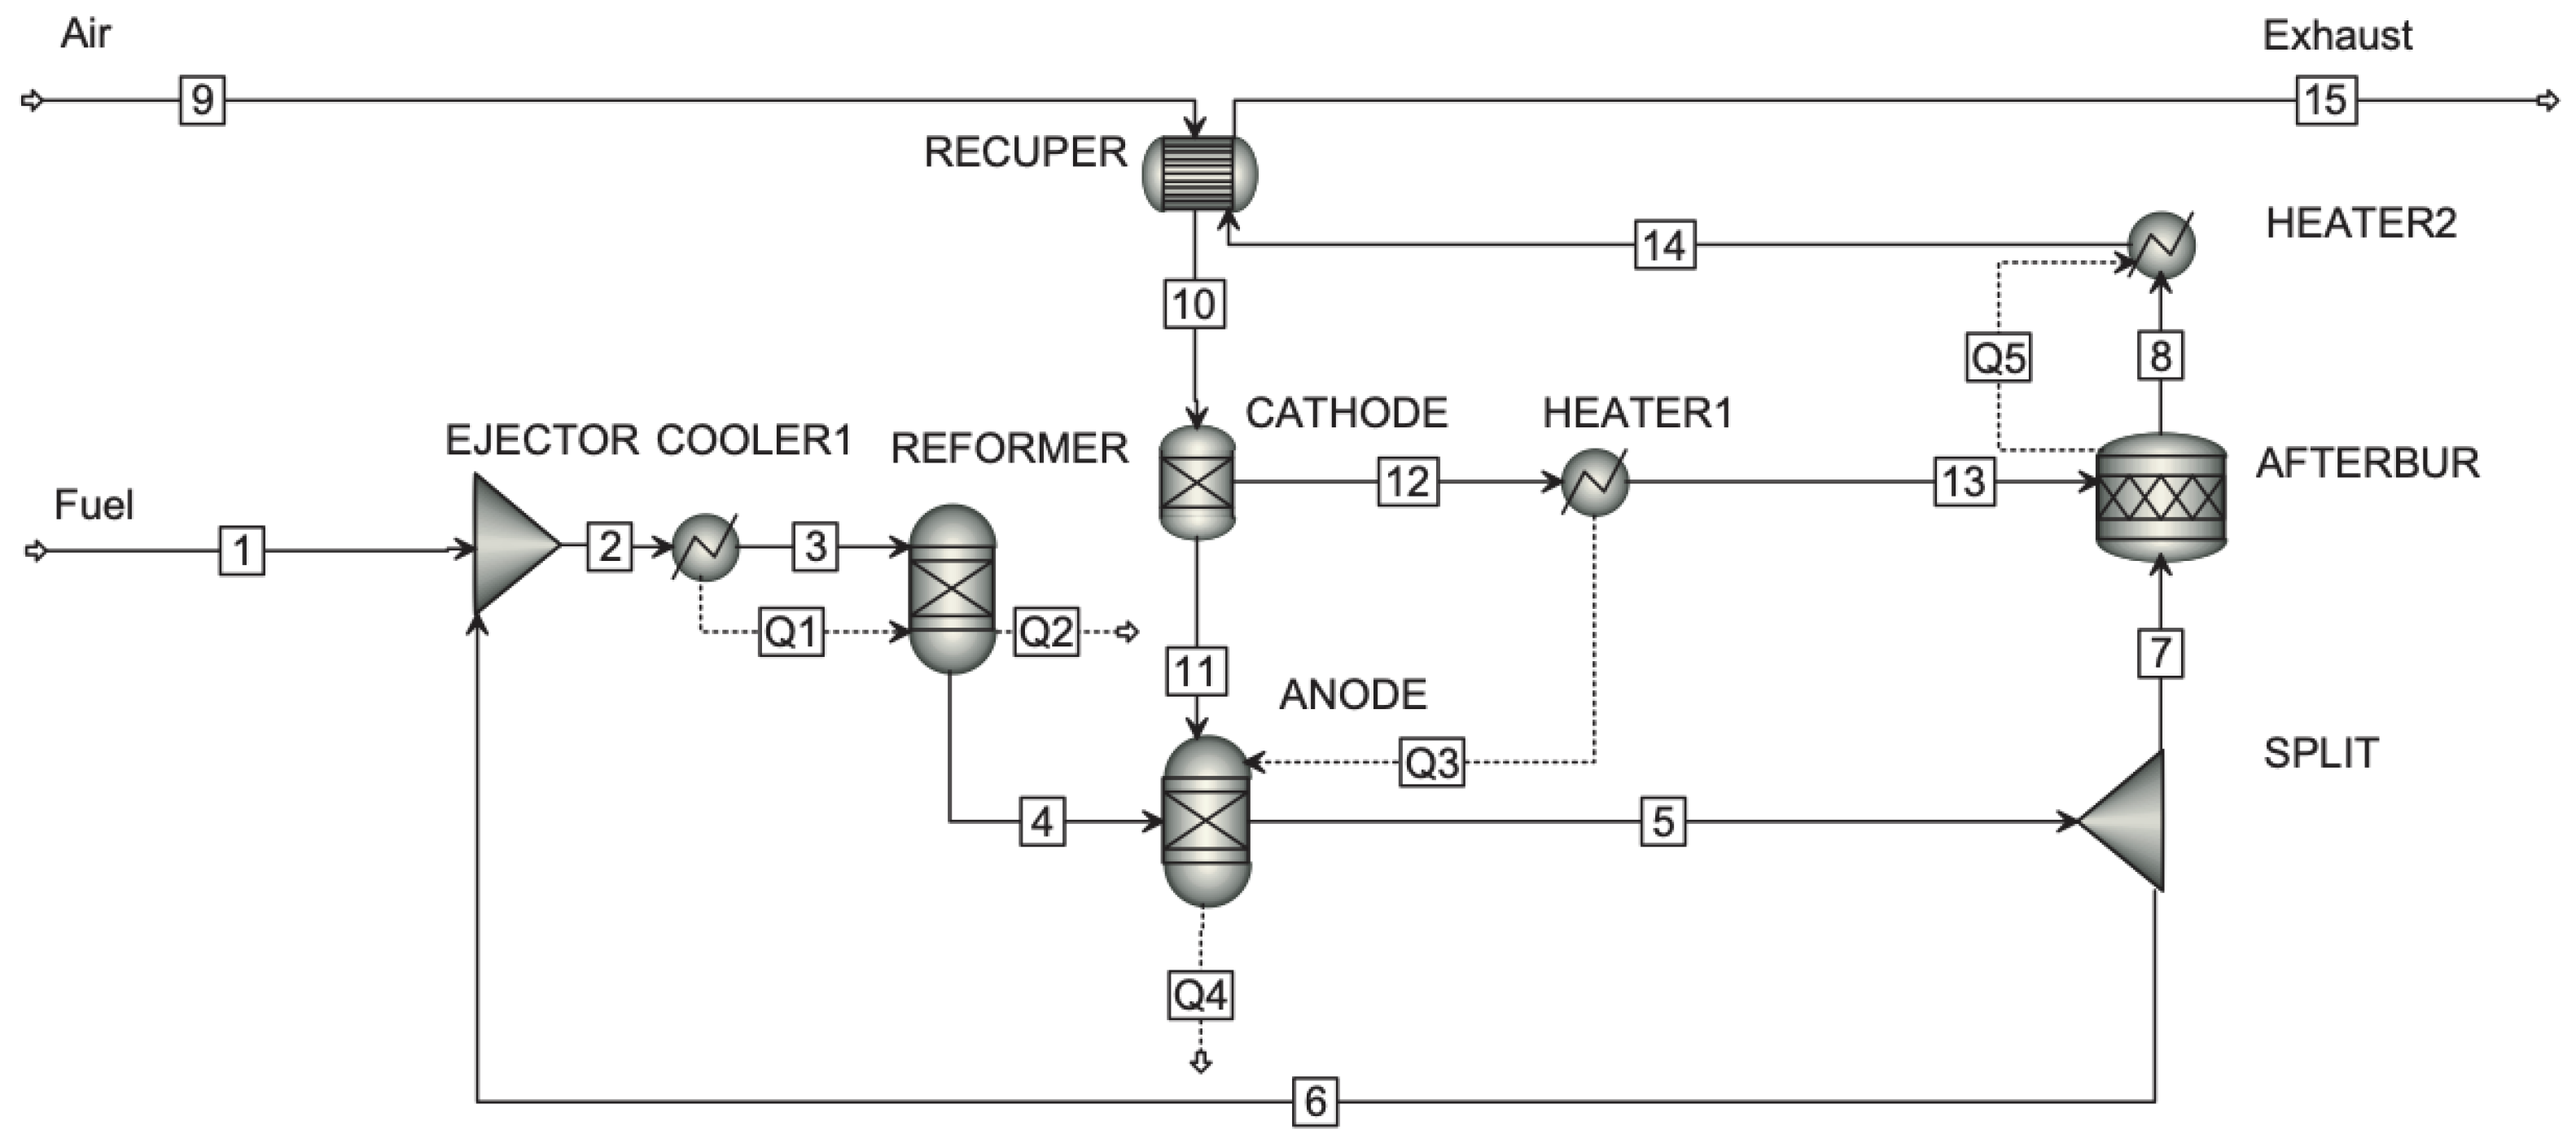
The study by Russo et al. (2023) [
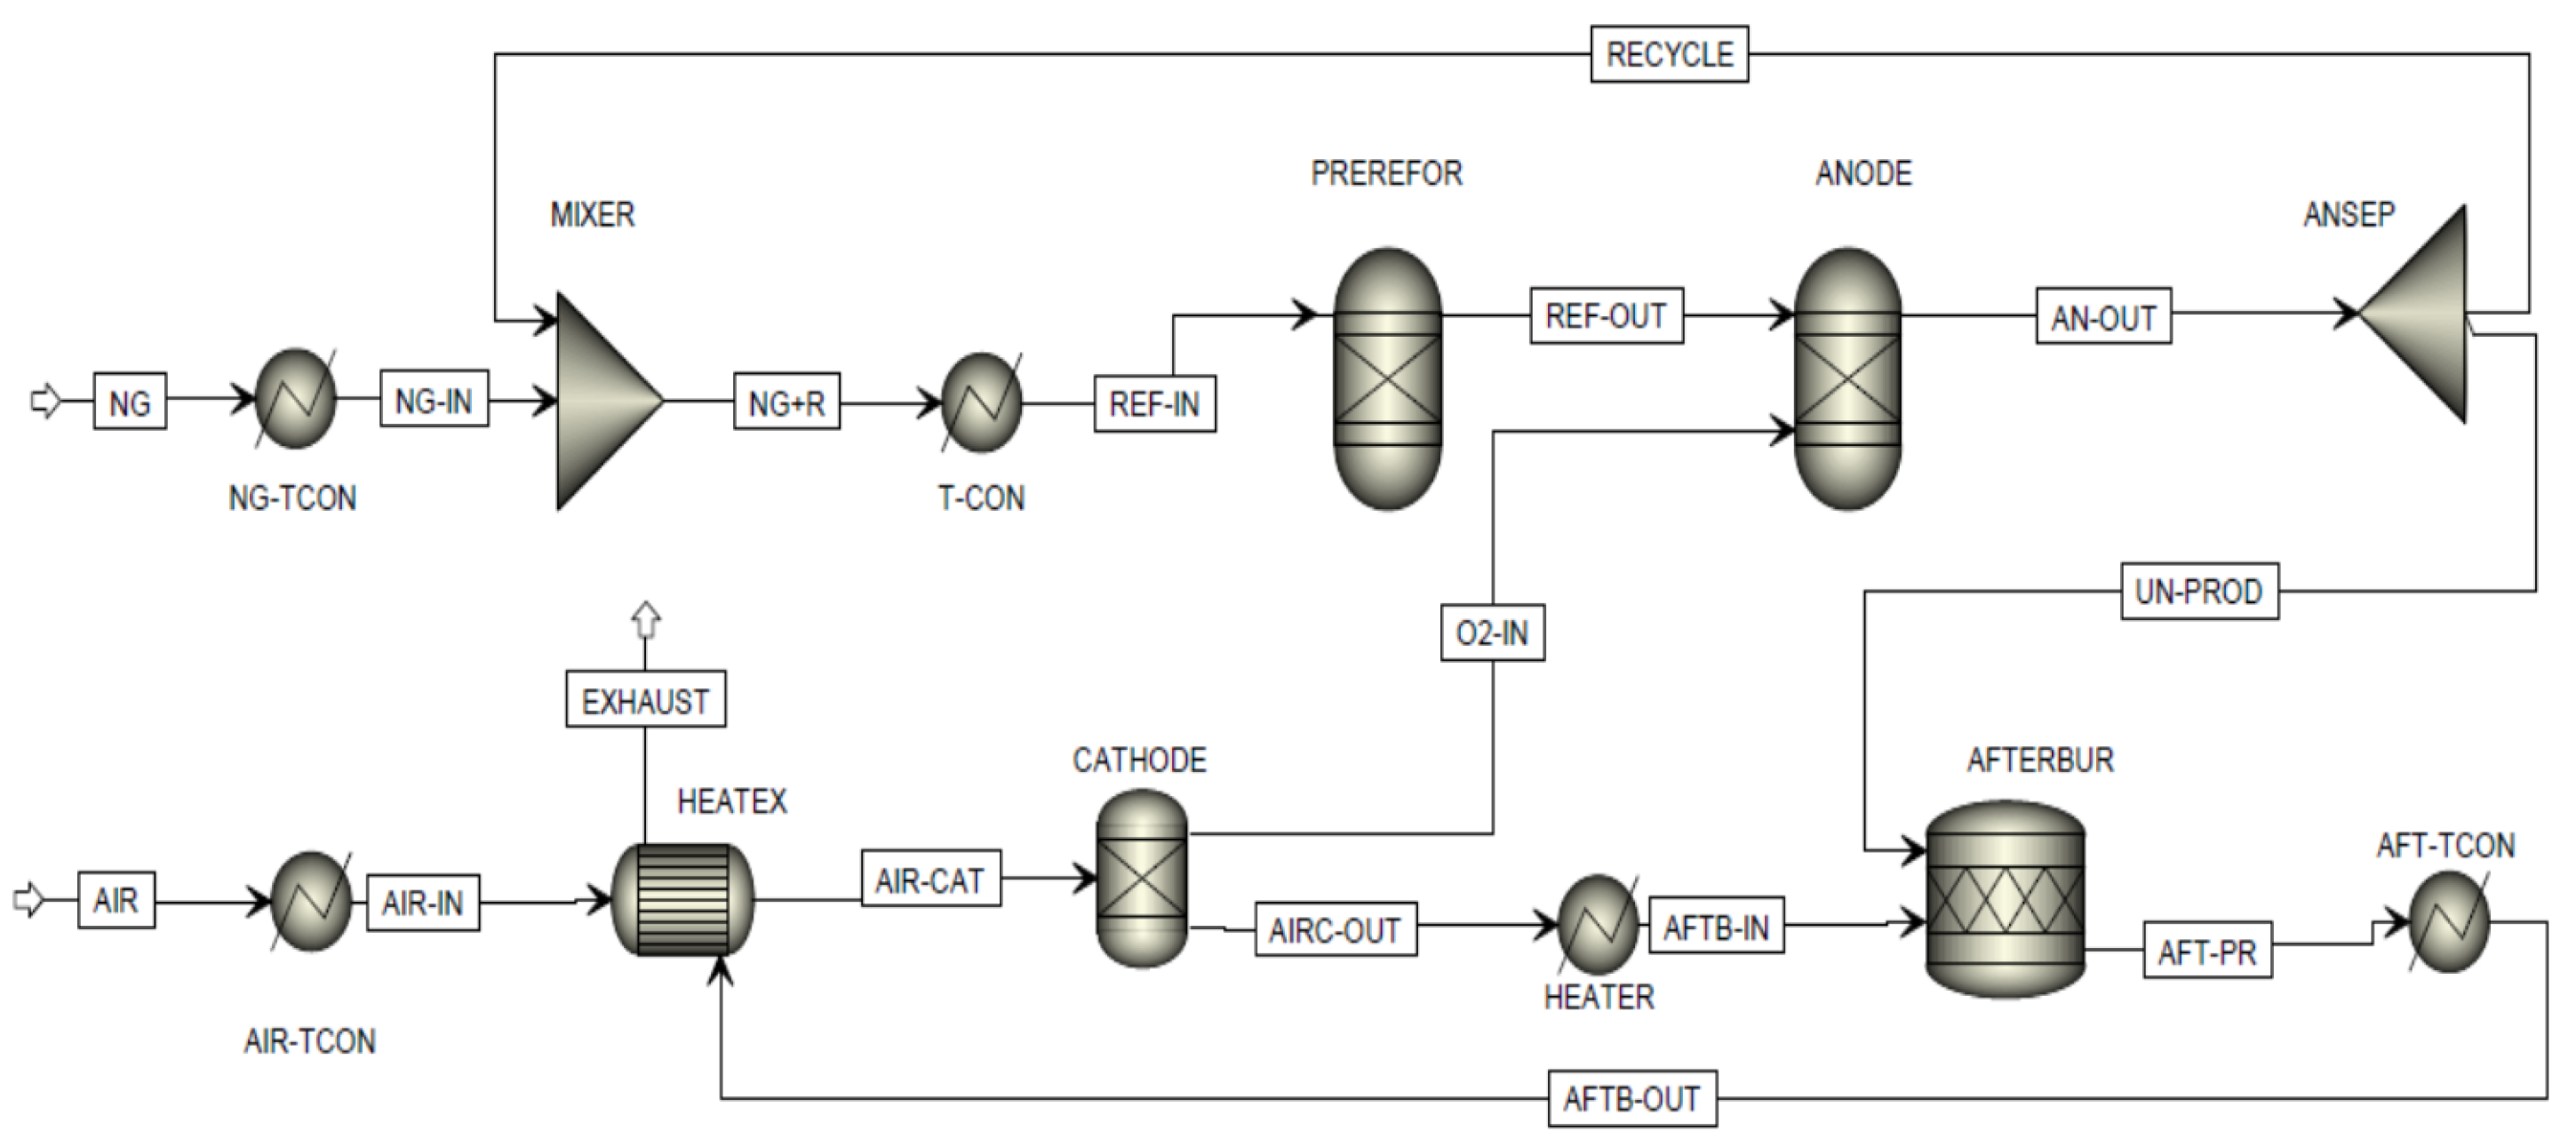
53], proposes the installation of a 12 MW SOFC onboard a large cruise ship, powered by LNG. The SOFC system would not only generate electrical power but also contribute to the ship’s thermal requirements through a heat recovery system. To optimize the onboard layout and predict the performance of the integrated system, a zero-dimensional model was developed using Aspen Plus. The layout is shown in
Figure 6. Various operational parameters, such as the fuel utilization factor, preheated air temperature, anode recycling flow, and exhaust gas temperature, were varied to evaluate the overall plant efficiency. The model was validated with data from literature and commercial SOFC modules, and the plant’s performance was analyzed within an efficiency range of 60-40%.
The SOFC block was simulated in Aspen Plus using the following modules, as shown in
Table 3.
The installation of a 12 MW SOFC on an LNG-powered cruise ship has been evaluated to reduce emissions, particularly during docking in ports. However, the implementation has highlighted several critical issues. The integration of the system onboard proved to be complex, and the model developed in Aspen Plus exhibited efficiency limitations.
Moreover, the SOFC plant, organized in 300 kW modules, requires significantly more space than an internal combustion engine of equivalent power, creating feasibility issues. High costs and concerns about durability have also raised doubts about the practicality of this solution for a cruise ship.
The study by Hentati et al. (2024) [
54], explores the use of a SOFC combined with a gas turbine (GT) simulated in Aspen Plus to recover flared gas and produce electricity, thereby reducing atmospheric emissions and preventing energy loss. A numerical model of the system was developed, showing that the steam reforming (SR) scenario at the anode of the SOFC is the most efficient, ensuring a higher concentration of hydrogen in the reforming gas. By integrating the SOFC with GT technology, the system achieved a maximum power density of approximately 3 kW/m² and a total power output of 1.238 MW. The layout simulated in Aspen Plus is shown in
Figure 7.
The SOFC block was simulated in Aspen Plus using the following modules, as shown in
Table 4.
In this study, a numerical model was developed to valorize flared gas using Aspen Plus and Matlab. A gas turbine was integrated with the SOFC system, achieving a maximum power output of 1238.049 kW for a stack area of 191.2 m². Although the model identifies a promising approach for utilizing flared gas in SOFCs, several significant shortcomings emerge. For instance, while steam reforming (SR) was identified as the optimal scenario for maximizing power, the complexity of the process and the need for accurate steam management may limit the practical effectiveness of this approach, especially under variable operating conditions.
Moreover, integrating a gas turbine has proven to enhance the performance of the hybrid system, but the model does not adequately consider the challenges associated with industrial scalability, such as heat management and long-term reliability of the system.
The economic analysis highlighted a relatively low electricity production cost (0.08 $/kWh), but this estimate may not fully reflect maintenance and management costs of complex systems like SOFCs coupled with a gas turbine. Additionally, the environmental analysis, while showing a reduced CO2 impact, does not address other possible pollutant emissions or the degradation of the cell over time.
Finally, the sensitivity analysis suggests that variations in fuel flow have a significant impact on production costs, but the model does not sufficiently explore how these variations might affect operational stability or failure risks.
In the study by Veluswamy et al. (2019) [
55], biogas and bio-hythane were investigated as renewable energy sources for SOFCs. Bio-hythane, with a composition of 58% CH4, 35% CO2, and 7% H2, proved to be more efficient and produced lower CO2 emissions compared to traditional biogas. The study was conducted on a 120 kW SOFC stack and showed that bio-hythane produces less CO and offers better performance in hybrid SOFC systems. Simulations recommend using bio-hythane with a steam-to-carbon ratio (STCR) of 2.0 and a current of 200 mA/cm².
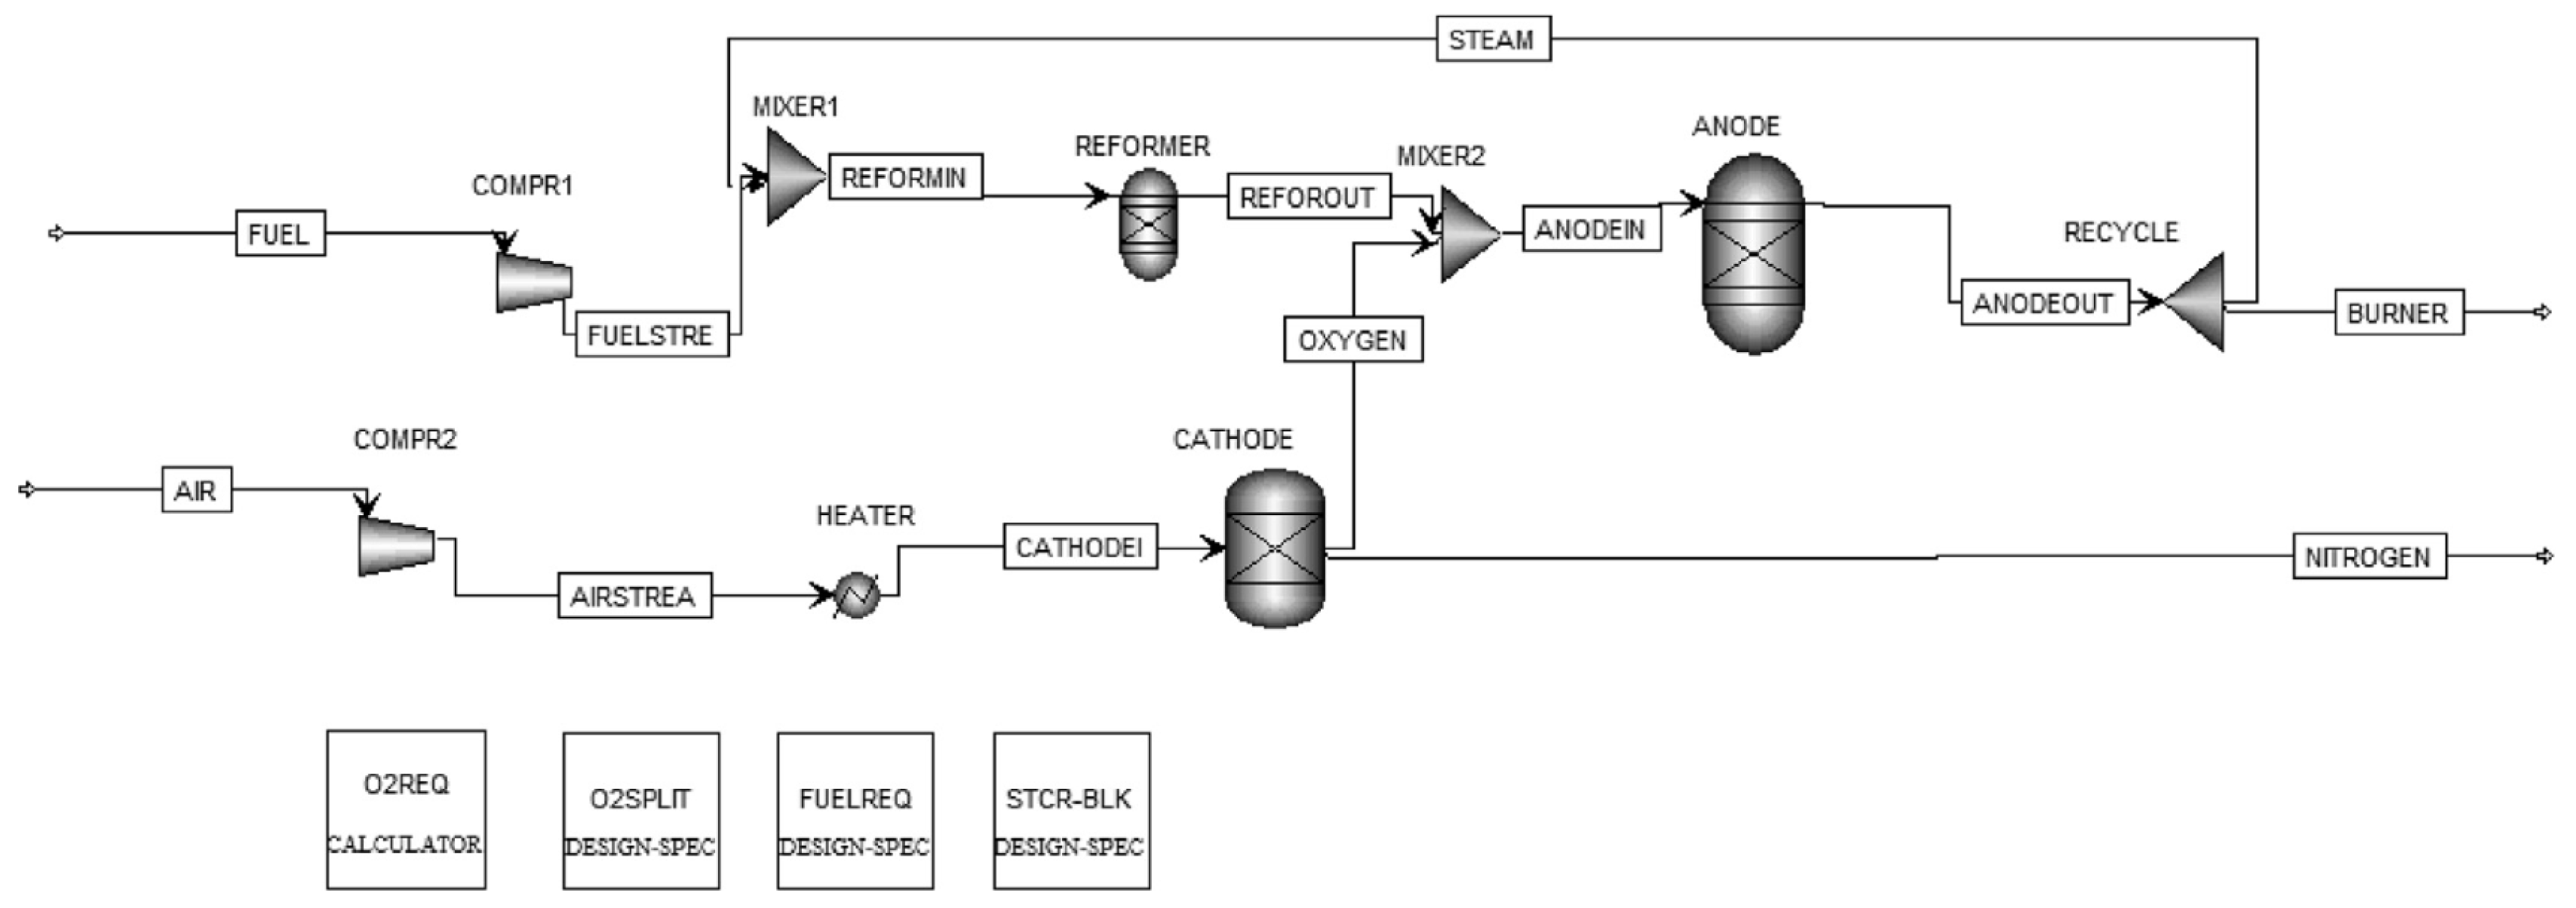
The layout simulated in Aspen Plus is shown in
Figure 8.
The SOFC block was simulated in Aspen Plus using the following modules, as shown in
Table 5.
Bio-hythane derived from two-stage anaerobic digestion has been proposed as a better option compared to traditional biogas for SOFC systems. However, there are several critical areas that require further attention. Although bio-hythane produces less biogenic CO2 at the anode and less CO in the reformer, the reduction is only 6%, which may not be sufficient to justify the transition to this technology on a large scale, especially considering the additional complexities of two-stage digestion compared to single-stage digestion.
Moreover, the negative effect of H2 in the fuel on the carbon stoichiometric coefficient could pose a significant challenge to the overall efficiency of the SOFC system, as it may lead to more complicated fuel balancing management and increased operational instability. The limited impact on WGS reactions also raises doubts about the effectiveness of this fuel blend in enhancing overall energy conversion.
Finally, while bio-hythane is considered a potentially sustainable renewable energy resource in the long term, the model does not adequately address the challenges related to the production, storage, and distribution of this fuel, which could limit its practical applicability on a large scale.
The study by Saebea et al. (2021) [
56] proposes an energy generation system that integrates a steam reformer with a SOFC powered by various fuels, including ethanol, glycerol, and biogas. The thermodynamic simulations performed with Aspen Plus show that the SOFC system powered by glycerol offers the best performance in terms of cell and system efficiency, as well as optimal fuel utilization. Moreover, the integrated system produces low CO emissions and generates more useful heat for the surrounding environment.
The layout simulated in Aspen Plus is shown in
Figure 9.
The SOFC block was simulated in Aspen Plus using the following modules, as shown in
Table 6.
The analysis has shown that the current density affects the composition of the exhaust gases and the energy consumption of the SOFC-H+ system. However, the results highlight some weaknesses. Although a moderate current density value (1 A/cm2) was selected to balance the system’s performance and the composition of the exhaust gases, the increase in CO concentration in the exhaust gases at higher current densities could pose an environmental issue that was not sufficiently explored in the study.
Furthermore, while the use of glycerol as a fuel has demonstrated superior efficiency and a capacity to generate more heat compared to other fuels, the research does not delve into the potential challenges associated with the sustainable production and treatment of glycerol as a fuel on a large scale. This could limit the practical applicability of glycerol in the SOFC context.
Finally, the study does not examine in detail the long-term impact of using glycerol on the durability of the SOFCs, nor the possible issues related to fouling or catalyst poisoning, which could compromise the reliability and efficiency of the system over time.
The article by Sadhukhan et al. (2010) [
57] explores the design of micro-CHP systems based on SOFC, integrated with syngas derived from biomass, for use in residential buildings. Using models developed with Aspen Plus, the study demonstrates that effective thermal integration between the SOFC’s inlet and outlet gases can significantly improve the system’s overall efficiency. The micro-CHP SOFC system, when integrated into homes with a community-scale gasification plant, can achieve an overall energy efficiency of 85%, compared to 42% without such integration. Furthermore, the article suggests that optimal SOFC operation should focus on maximizing electrical efficiency, but to meet the high residential heat demands in the UK, integration with other heat-based renewable technologies is necessary.
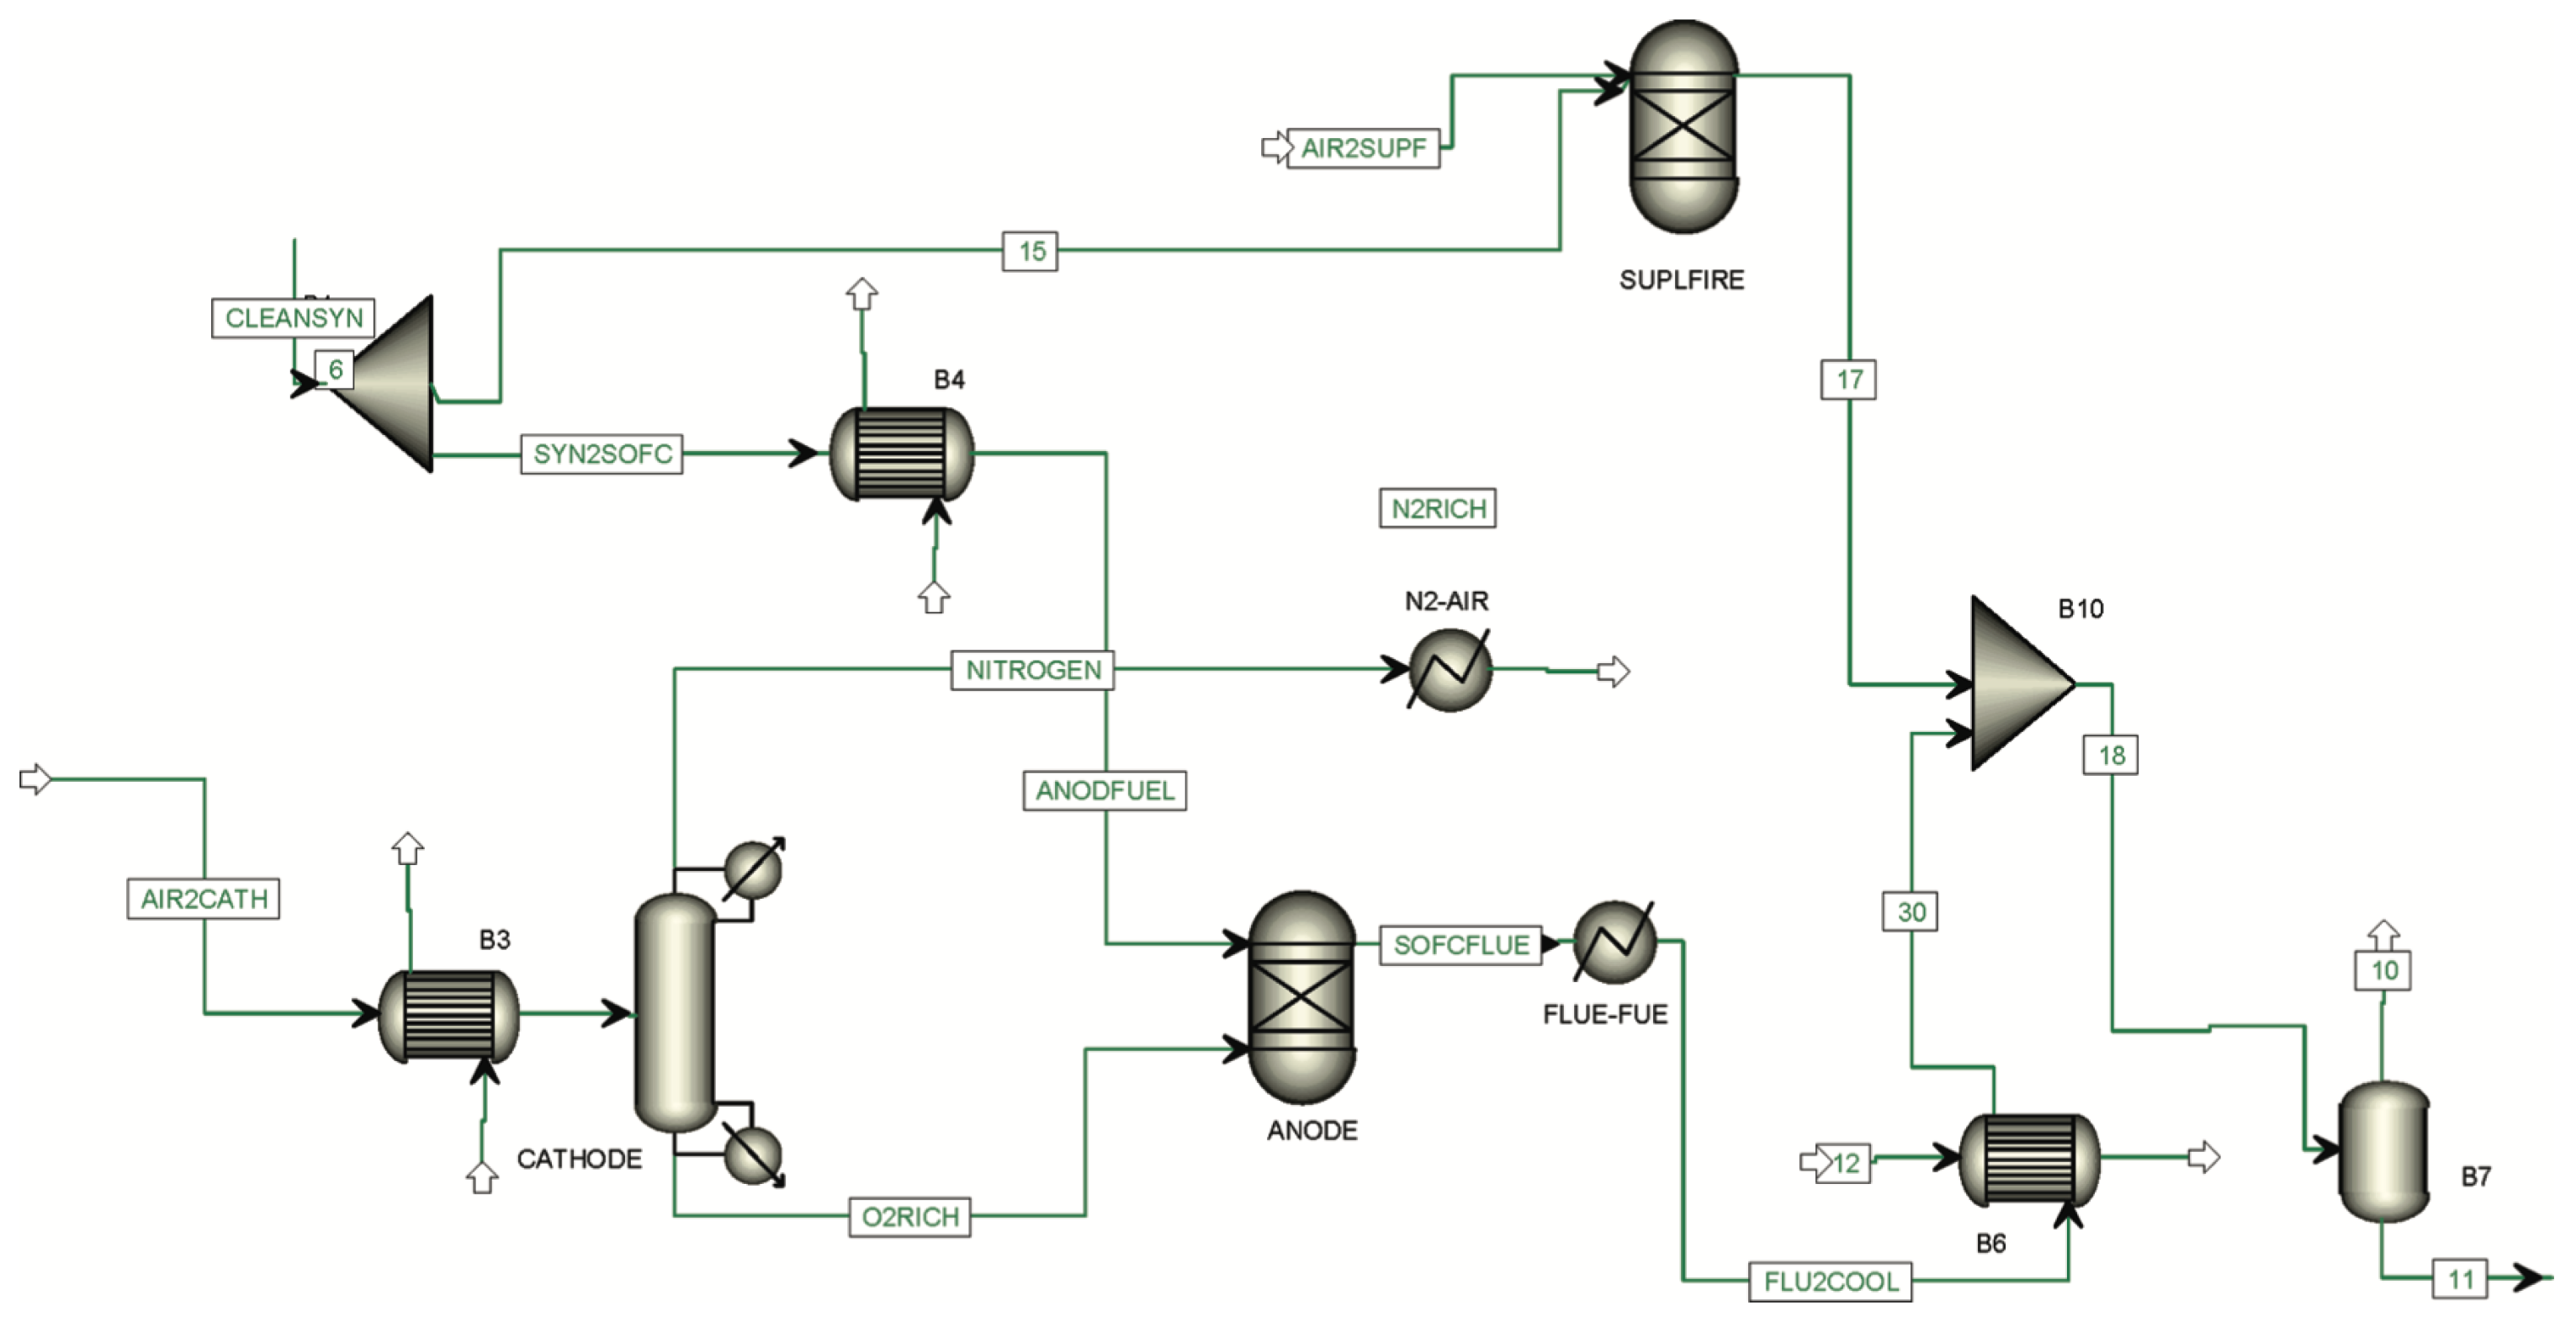
The simulated scheme in Aspen Plus is shown in
Figure 10.
The block concerning the SOFC was simulated in Aspen Plus with the following modules, as shown in
Table 7.
The presented analysis highlights the potential of micro-CHP systems based on SOFC integrated with syngas derived from straw, but several critical issues clearly emerge. Despite the high energy efficiency achievable by SOFCs compared to conventional gas turbines, the study does not adequately address the problems of intermittent electricity supply associated with heat-driven CHP technologies, especially during the summer months when heat demand is low. This could limit the reliability and continuity of the energy system.
Moreover, integration with other renewable technologies such as syngas boilers, geothermal (GSHP) and air-source (ASHP) heat pumps seems to be a proposed solution to balance energy demand, but the study does not explore the technical and operational complexities of such integrations in depth.
Lastly, the proposal to use syngas derived from straw as the primary fuel raises questions about the long-term availability and sustainability of this resource, as well as the potential emissions and environmental impacts associated with its large-scale production and use. Despite the final recommendations to maximize electrical efficiency through full energy integration, the lack of a detailed analysis of operational challenges and environmental issues limits the study’s conclusion, suggesting that further research is needed to validate the real feasibility and sustainability of the project.
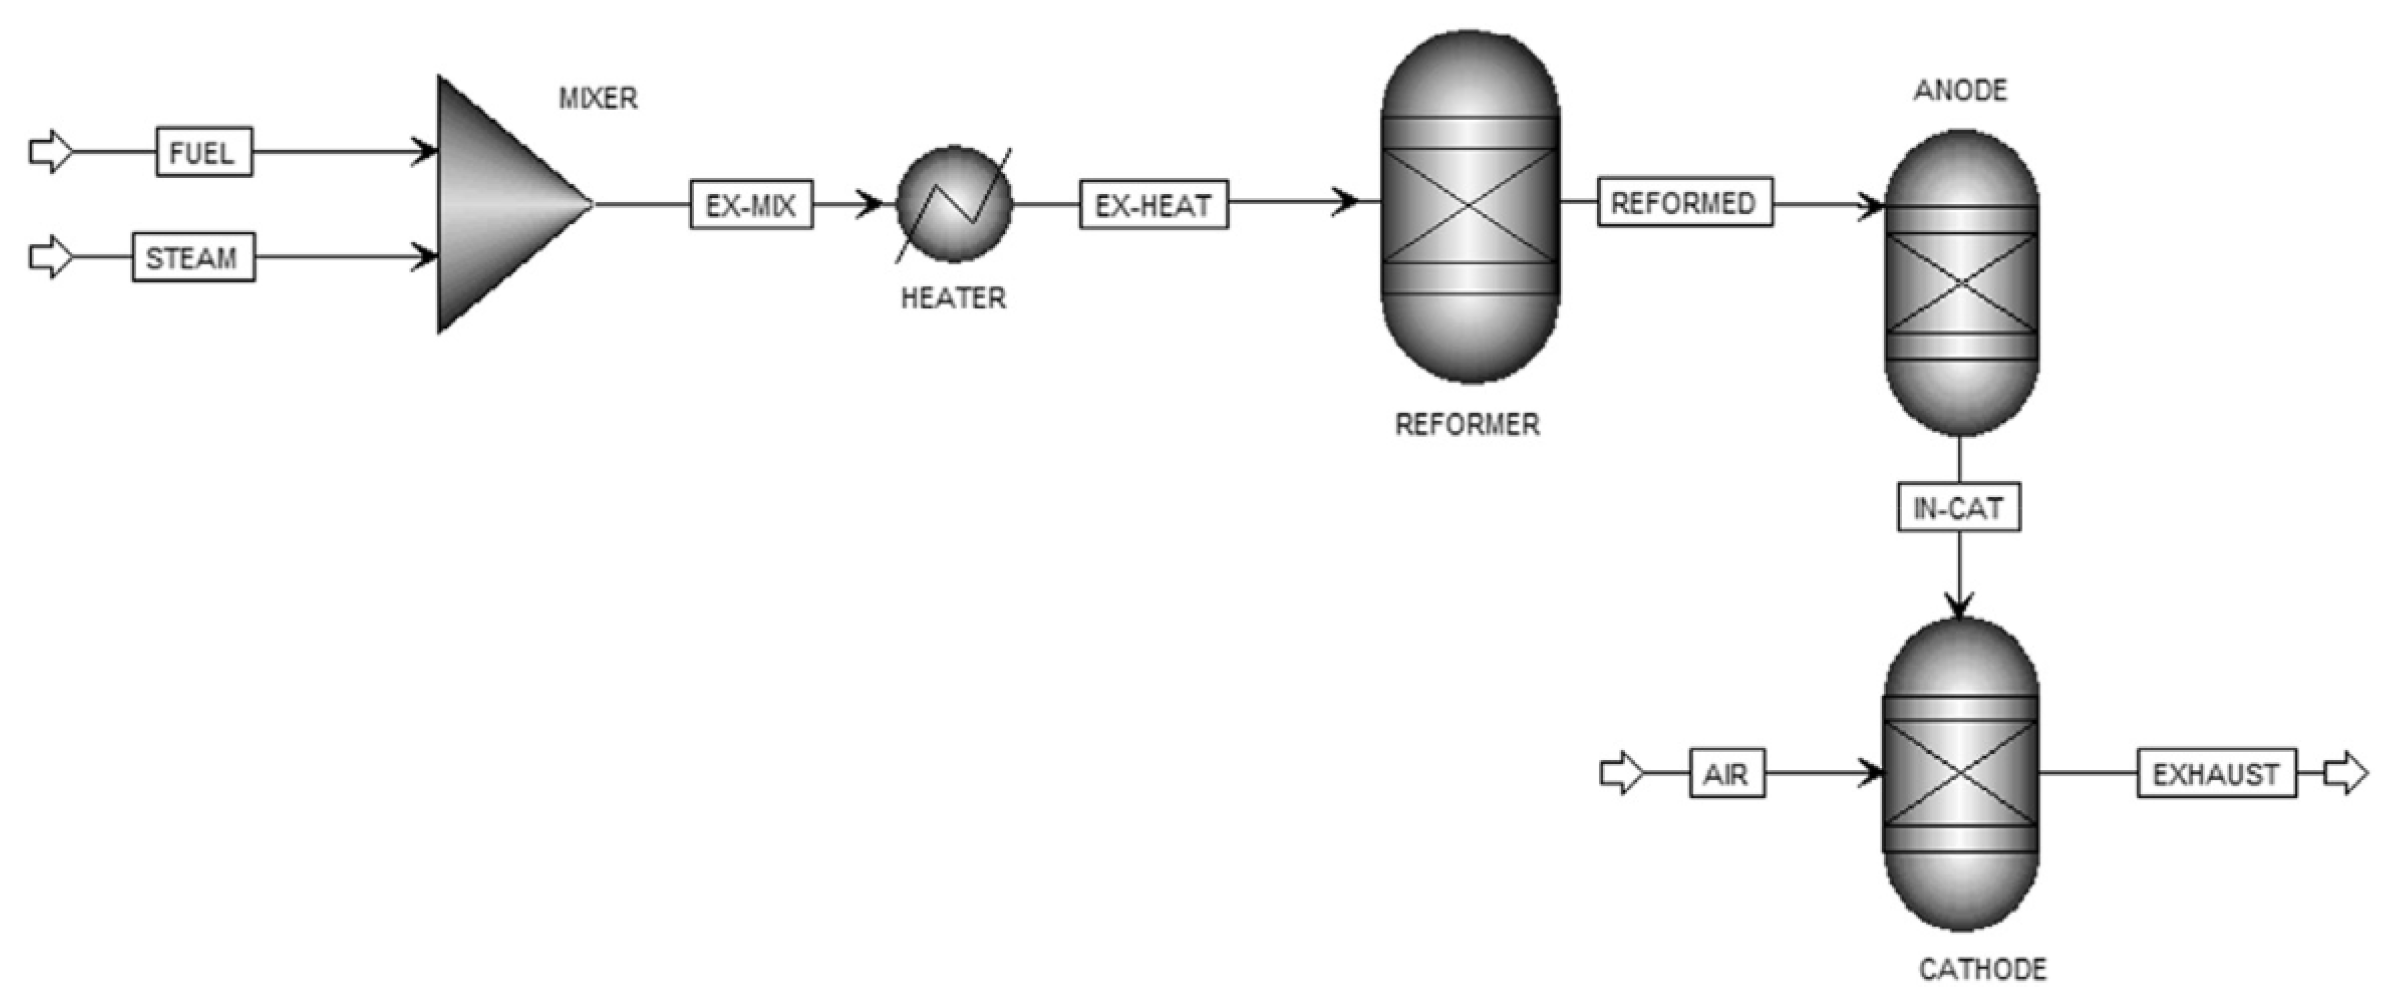
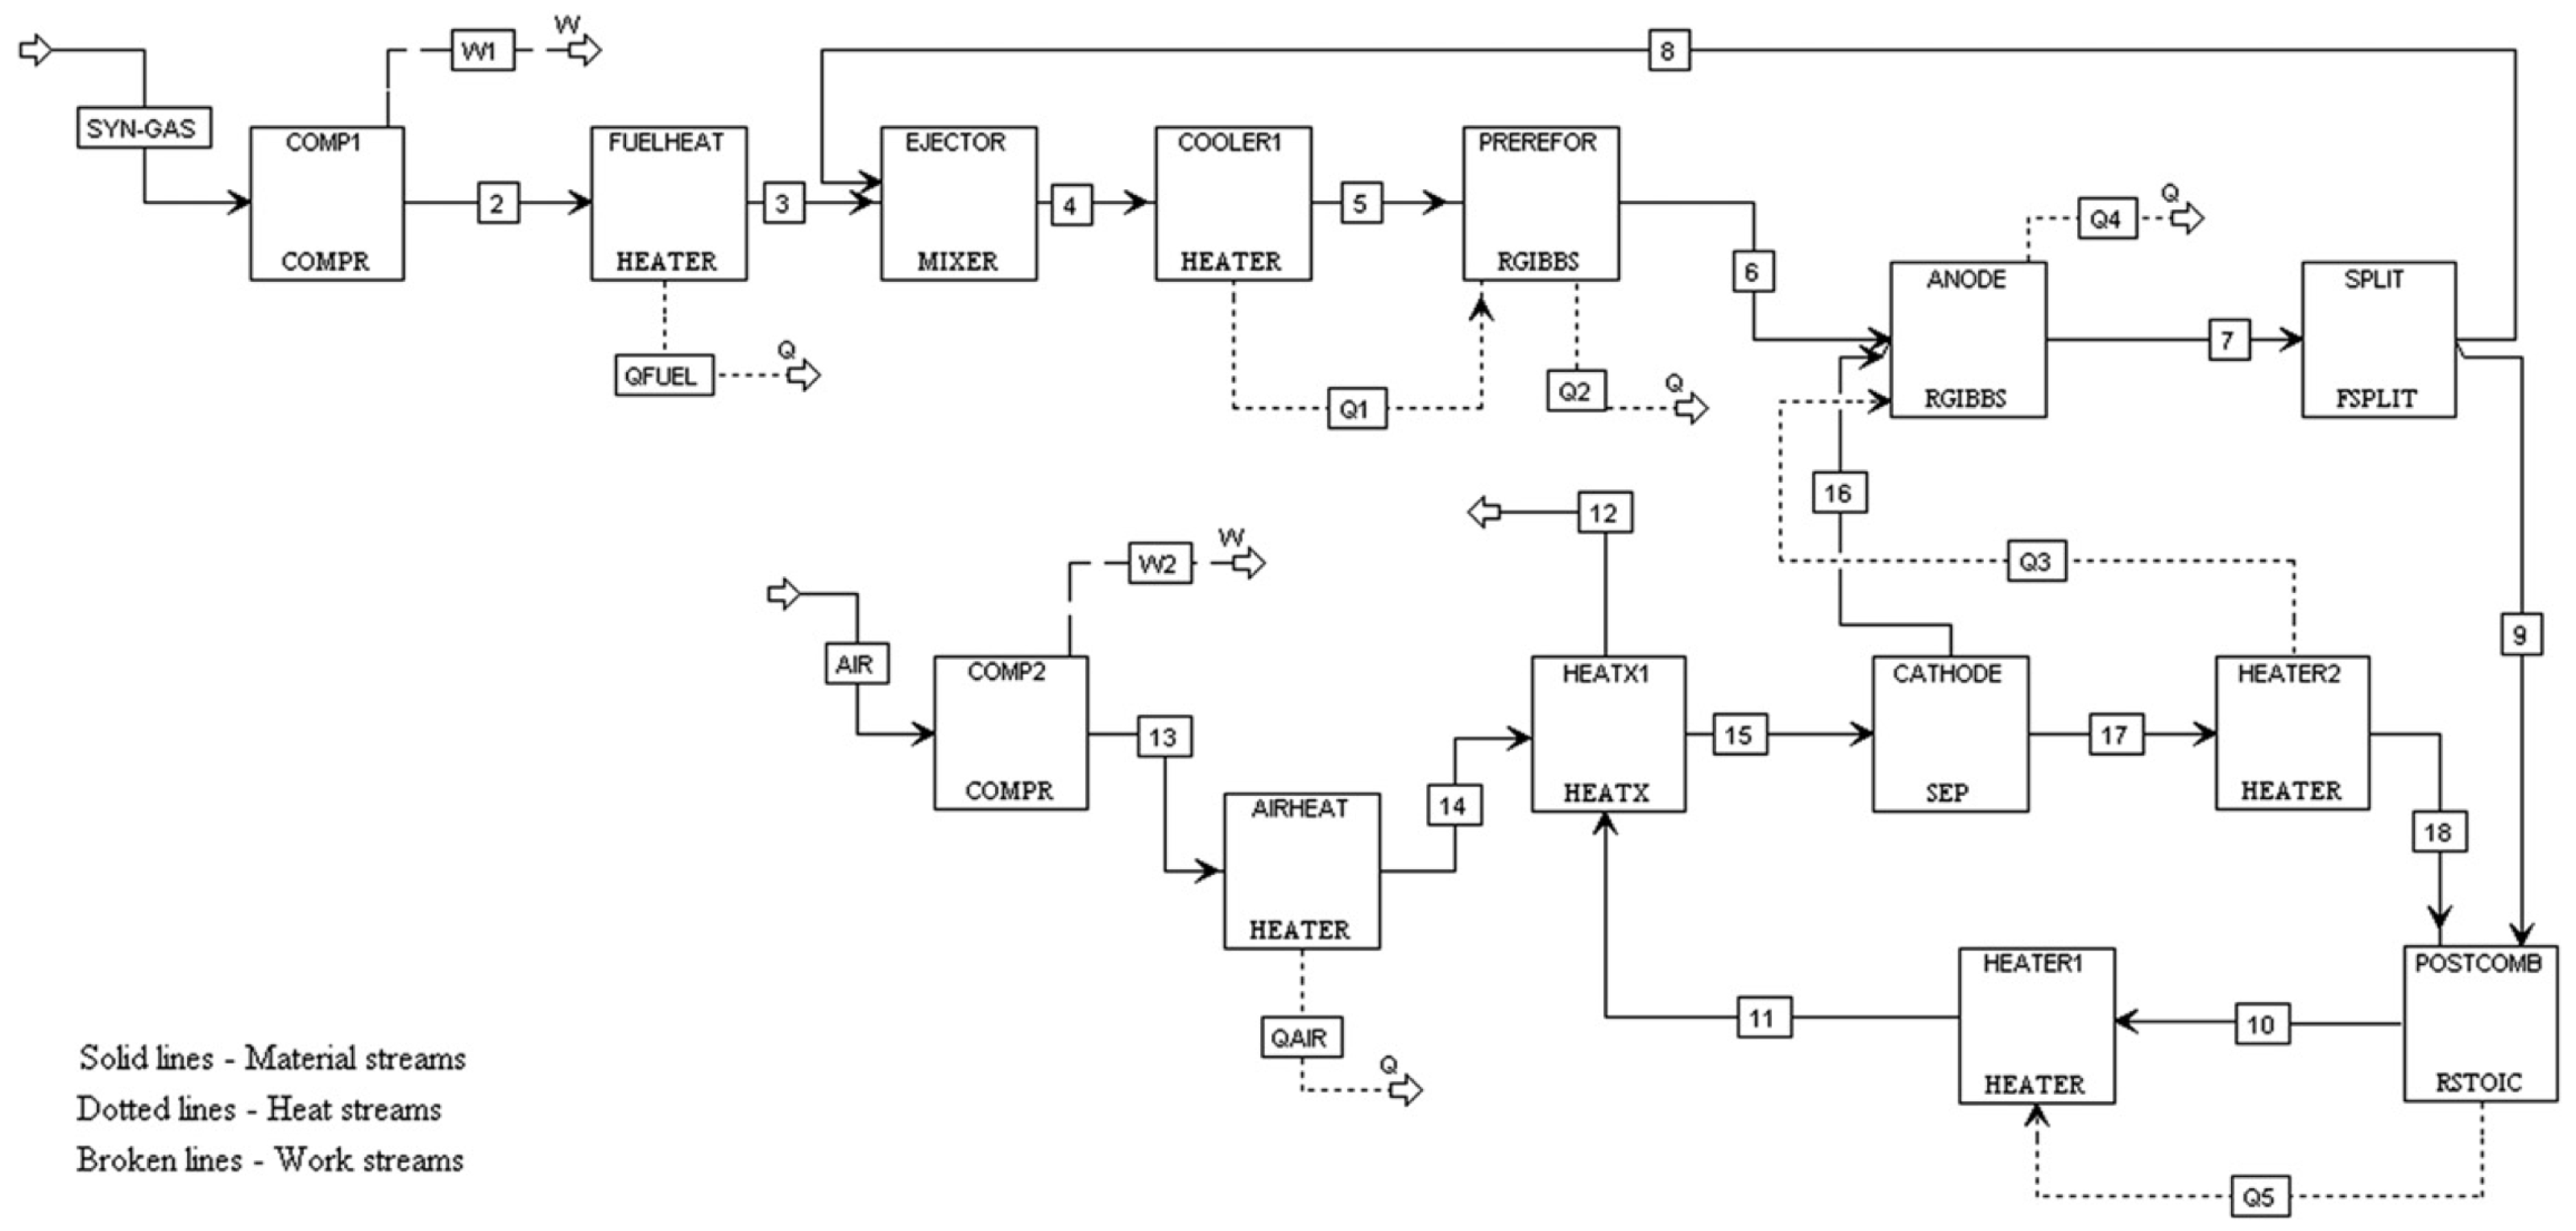
The study by Doherty et al. (2009) [
58], on the other hand, analyzes the performance of a tubular SOFC, using biomass-derived syngas in a CHP system. The SOFC, modeled through Aspen Plus and validated with literature data, shows that its operation with biomass syngas results in a drop in performance compared to the use of natural gas, mainly due to the lower quality of the syngas. However, the analysis identifies optimal operating conditions that maximize electrical efficiency, indicating that SOFCs powered by biomass syngas are technically feasible and can achieve high efficiencies, making them ideal for CHP applications.
The simulated scheme in Aspen Plus is shown in
Figure 11.
The block concerning the SOFC was simulated in Aspen Plus with the following modules, as shown in
Table 8.
The model was validated by comparing the results with available data for natural gas and underwent sensitivity analyses to examine the impact of parameters such as current density, steam-to-carbon ratio (STCR), and fuel utilization factor (Uf). It emerged that the use of biomass syngas, compared to natural gas, leads to a reduction in efficiency. This decrease is due to the lower quality of the gas and the increased fuel and air flow rates required. The cell voltage, gross and net efficiency, and DC power are all lower with biomass syngas, although the efficiency remains higher than that of traditional biomass systems.
Another critical issue is the trade-off between operating parameters. Current density negatively affects both efficiency and system power, requiring a balance between these parameters to optimize performance. Furthermore, maintaining a low steam-to-carbon ratio is essential to prevent carbon formation, but this may compromise the system’s long-term stability and efficiency. Similarly, while a high fuel utilization factor improves efficiency, if too high, it causes significant concentration losses, reducing overall efficiency.
The study by Zhang et al. (2005) [
59], simulates a tubular SOFC plant using unit operation models in Aspen Plus. Since commercial simulators do not have a built-in SOFC stack model, the authors propose an alternative approach by developing an SOFC model directly within Aspen Plus using existing functions. The model was validated, and sensitivity analyses were conducted on various operating parameters.
The simulated scheme in Aspen Plus is shown in
Figure 12.
The block concerning the SOFC was simulated in Aspen Plus with the following modules, as shown in
Table 9.
The model was developed based on literature descriptions of the Siemens-Westinghouse tubular SOFC technology. It was calibrated with published performance data. Sensitivity analyses showed that the electrical efficiency of the cell reaches a maximum value of 52% when the fuel utilization factor (Uf) is 0.85. Furthermore, an increase in Uf leads to a rise in the concentration of CO2 in the anode outlet flow.
A critical issue in this research is the method and correlations used to calculate the cell voltage, which are the main limiting factors of the flexibility and accuracy of the developed model. The model could be improved by developing a model based on fundamental phenomena rather than semi-empirical relationships.
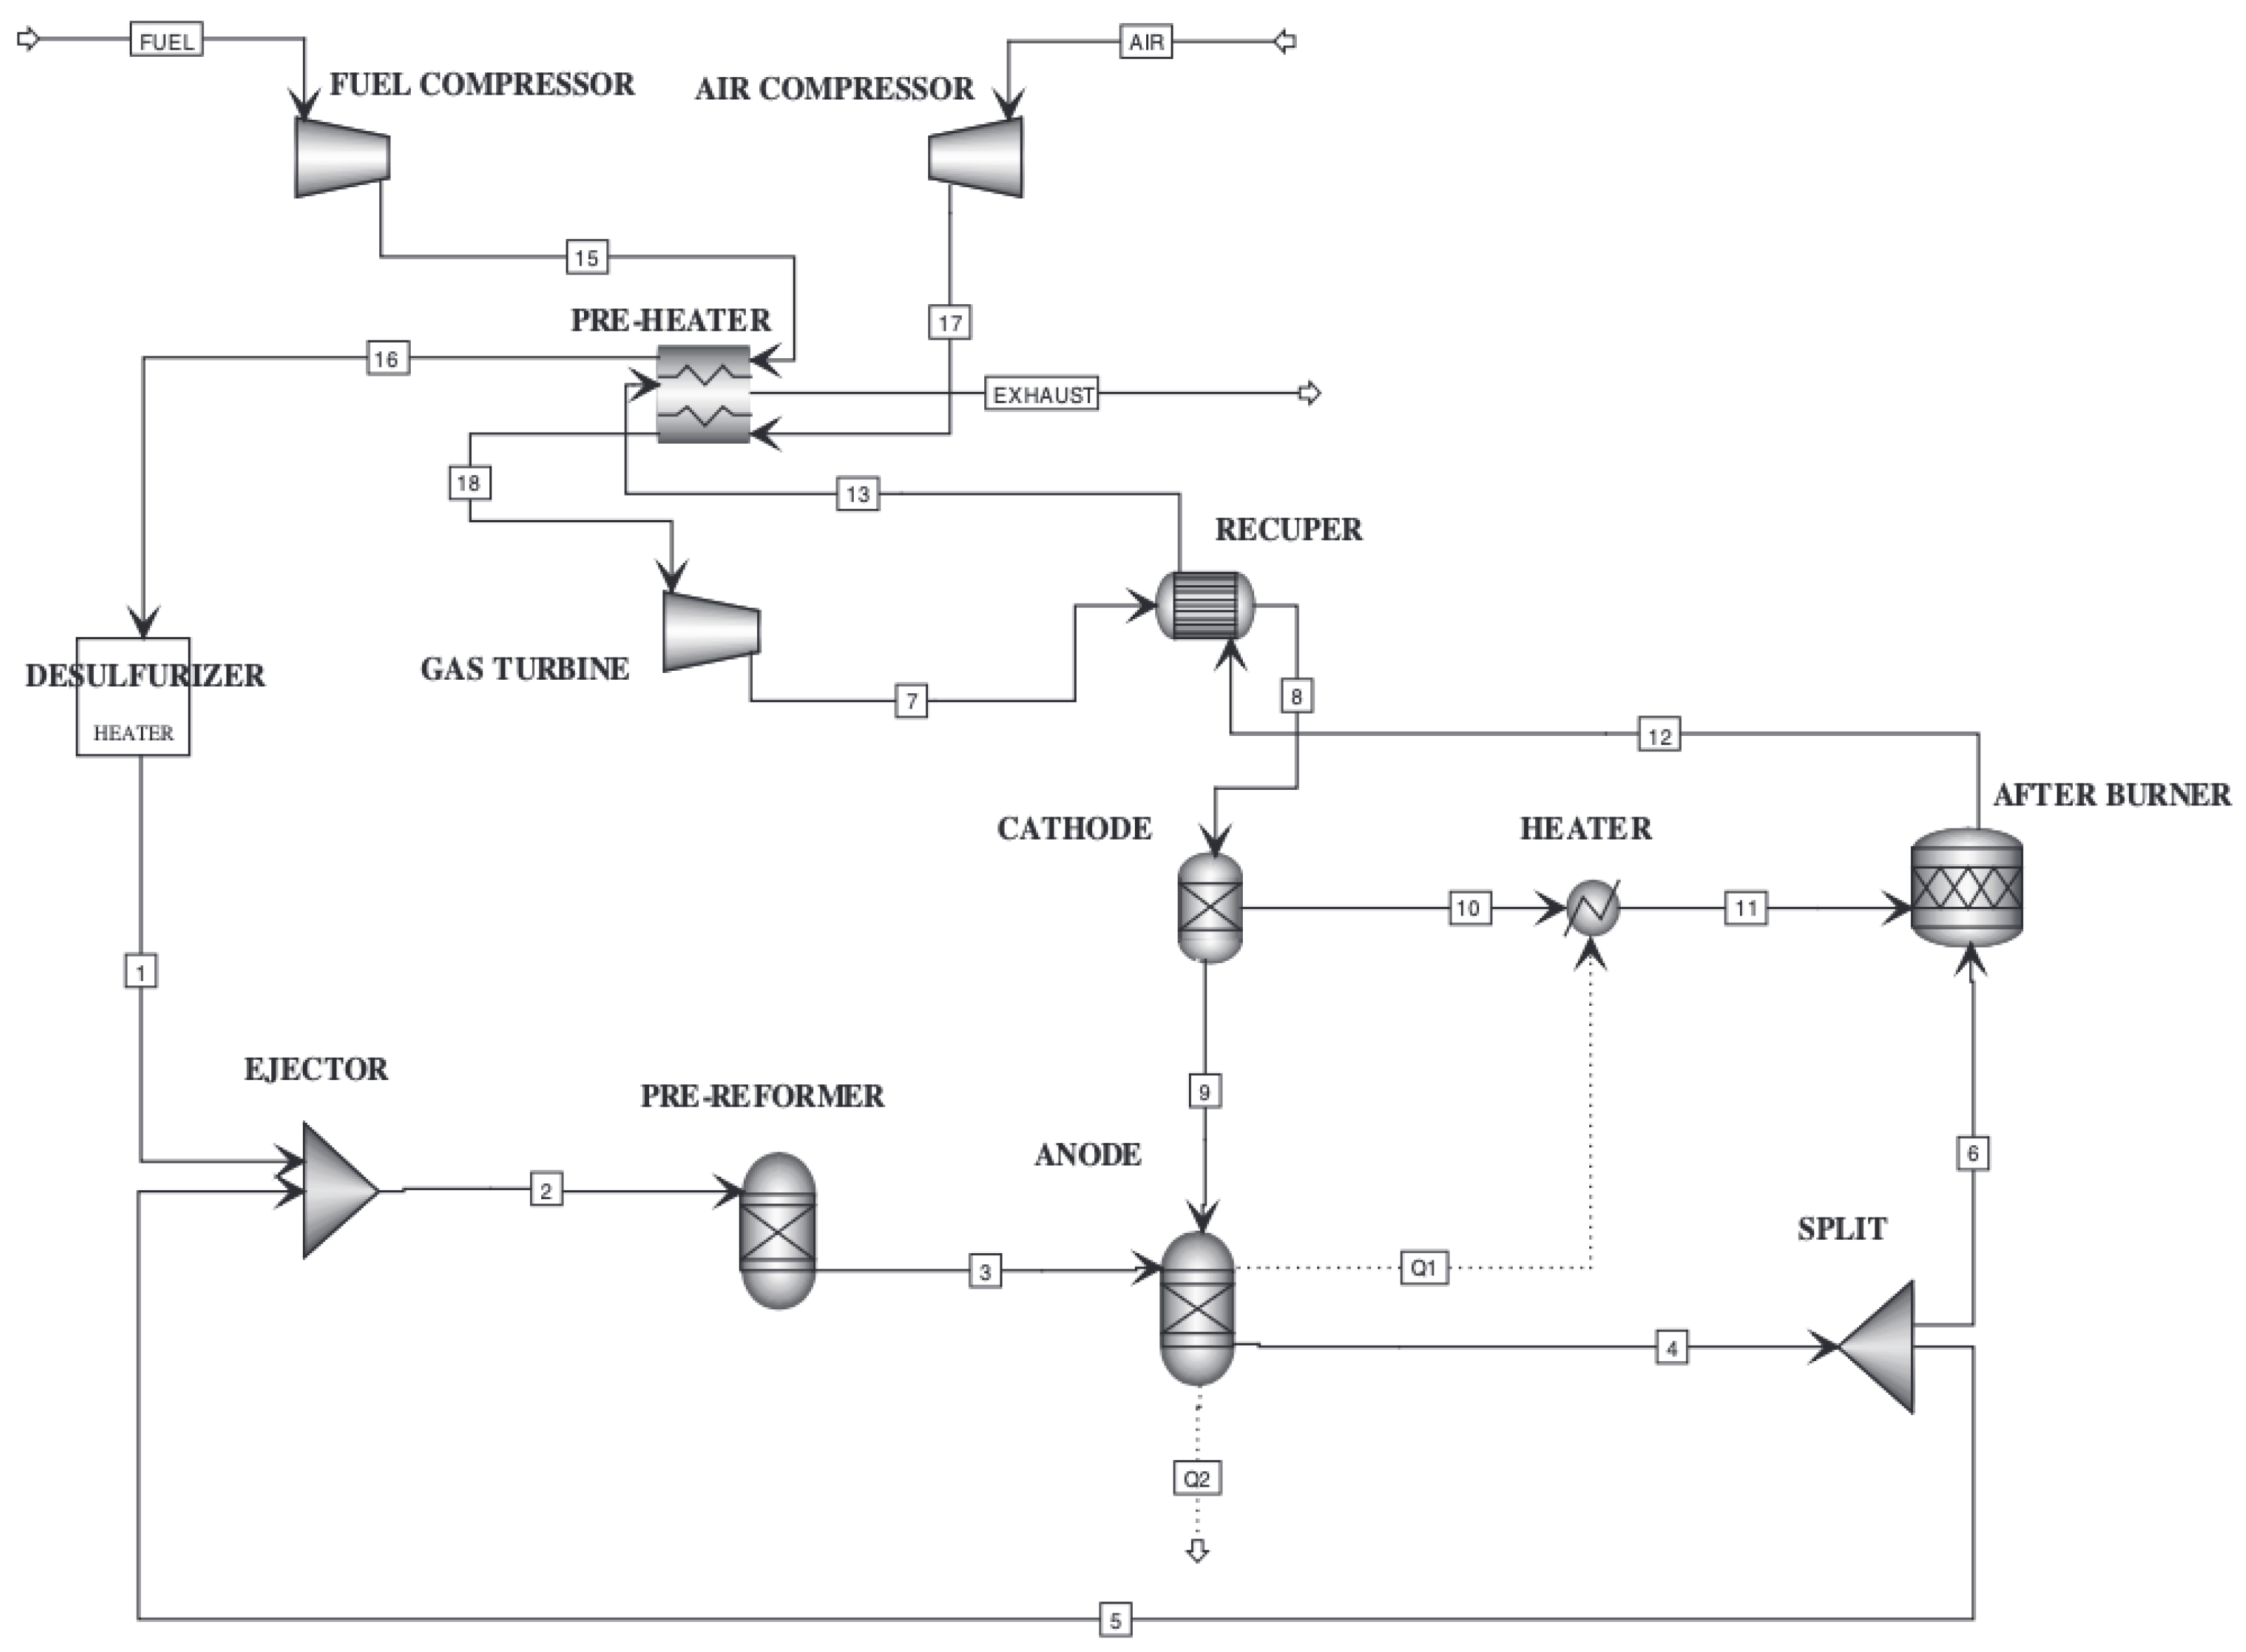
The study by Ameri and Mohammadi (2013) [
60] simulates a hybrid system of SOFC and atmospheric gas turbine using Aspen Plus software. Additionally, a parametric analysis was performed to evaluate the effects of variations in operating conditions on system performance.
The schematic simulated in Aspen Plus is shown in
Figure 13.
The SOFC block was simulated in Aspen Plus using the following modules, which are reported in
Table 10.
The model developed for a hybrid SOFC/GT system, based on Siemens-Westinghouse’s tubular SOFC with internal reforming technology, highlighted several significant challenges.
The simulation showed that increasing the utilization factor (Uf) from 0.6 to 0.95 results in a significant reduction in fuel cell voltage, due to an increase in polarization losses and greater fuel depletion. Although the system efficiency reaches its peak with a Uf of 0.85, exceeding this value leads to a drastic decrease in voltage and overall efficiency, resulting in increased fuel consumption. Therefore, a Uf higher than 0.85 proves to be counterproductive for system efficiency.
One of the critical issues identified is the management of current density. Increasing the current density from 1600 to 2400 A/m², while maintaining a Uf of 0.85, causes a decrease in system efficiency and voltage due to increased ohmic and concentration losses. This means that, although increasing the current density can enhance the output power, it comes at the cost of efficiency. This trade-off can be problematic in contexts where energy efficiency is a priority.
The main challenge lies in managing the balance between efficiency and generated power. While operating at low current density allows maximizing efficiency, it limits the total power produced. This trade-off represents a significant challenge in designing SOFC/GT systems, as the increased losses from higher operating parameters can reduce the benefits of the cycle’s theoretical high efficiency.
Finally, despite the cycle being able to achieve a very high electrical generation efficiency (68.2%), superior to that of combined cycle plants (50%), the operational management of the system must be carefully calibrated. The issues highlighted by the simulation show the importance of carefully balancing operating parameters to avoid sacrificing efficiency in favor of power or vice versa.
Doherty, Reynolds, and Kennedy (2010) [
61] simulated a biomass gasification and SOFC power system using Aspen Plus. The main goal of the research was to develop a model to predict the system’s performance under different operating conditions. The model, which uses Gibbs free energy minimization to calculate voltage and losses, was validated with natural gas data and considers various operating parameters such as the fuel utilization factor (Uf), current density (j), and steam-to-carbon ratio (STCR). The model allows for heat and mass balances and provides a detailed analysis of the system’s performance.
The schematic simulated in Aspen Plus is shown in
Figure 14.
The SOFC block was simulated in Aspen Plus using the following modules, which are reported in
Table 11.
The model developed for the 100 kW AC CHP tubular SPGI SOFC system using Aspen Plus revealed several significant challenges in predicting the performance of the biomass-SOFC system.
Firstly, increasing the fuel utilization factor (Uf) improves efficiency but leads to a reduction in cell voltage. This means that, to achieve higher efficiency, the system must operate at a high Uf, which can compromise the voltage and thus the overall performance of the system.
Another challenge concerns the current density: as it increases, both the voltage and efficiency decrease, even though the output power increases. Managing this trade-off between power and efficiency is crucial for optimizing the system’s performance.
Additionally, the steam-to-carbon ratio (STCR) must be kept sufficiently low to avoid carbon formation issues but not so low as to compromise the system’s overall performance.
Finally, the comparison between operation with biomass syngas and natural gas highlighted that using syngas results in a significant reduction in voltage and efficiency, due to the lower quality of syngas and the increased fuel and air flows required.
Amiri et al. (2016) [
62] developed a planar SOFC system model in Aspen Plus with a 3D module for the stack. Two cases were examined: the effect of non-uniform flow distribution in the stack collector on internal variables, and the interaction between the stack and the BoP
1, with particular focus on depleted fuel recycling.
The results showed that recycling the anode gas can manage gradients in the stack and improve fuel efficiency and water management.
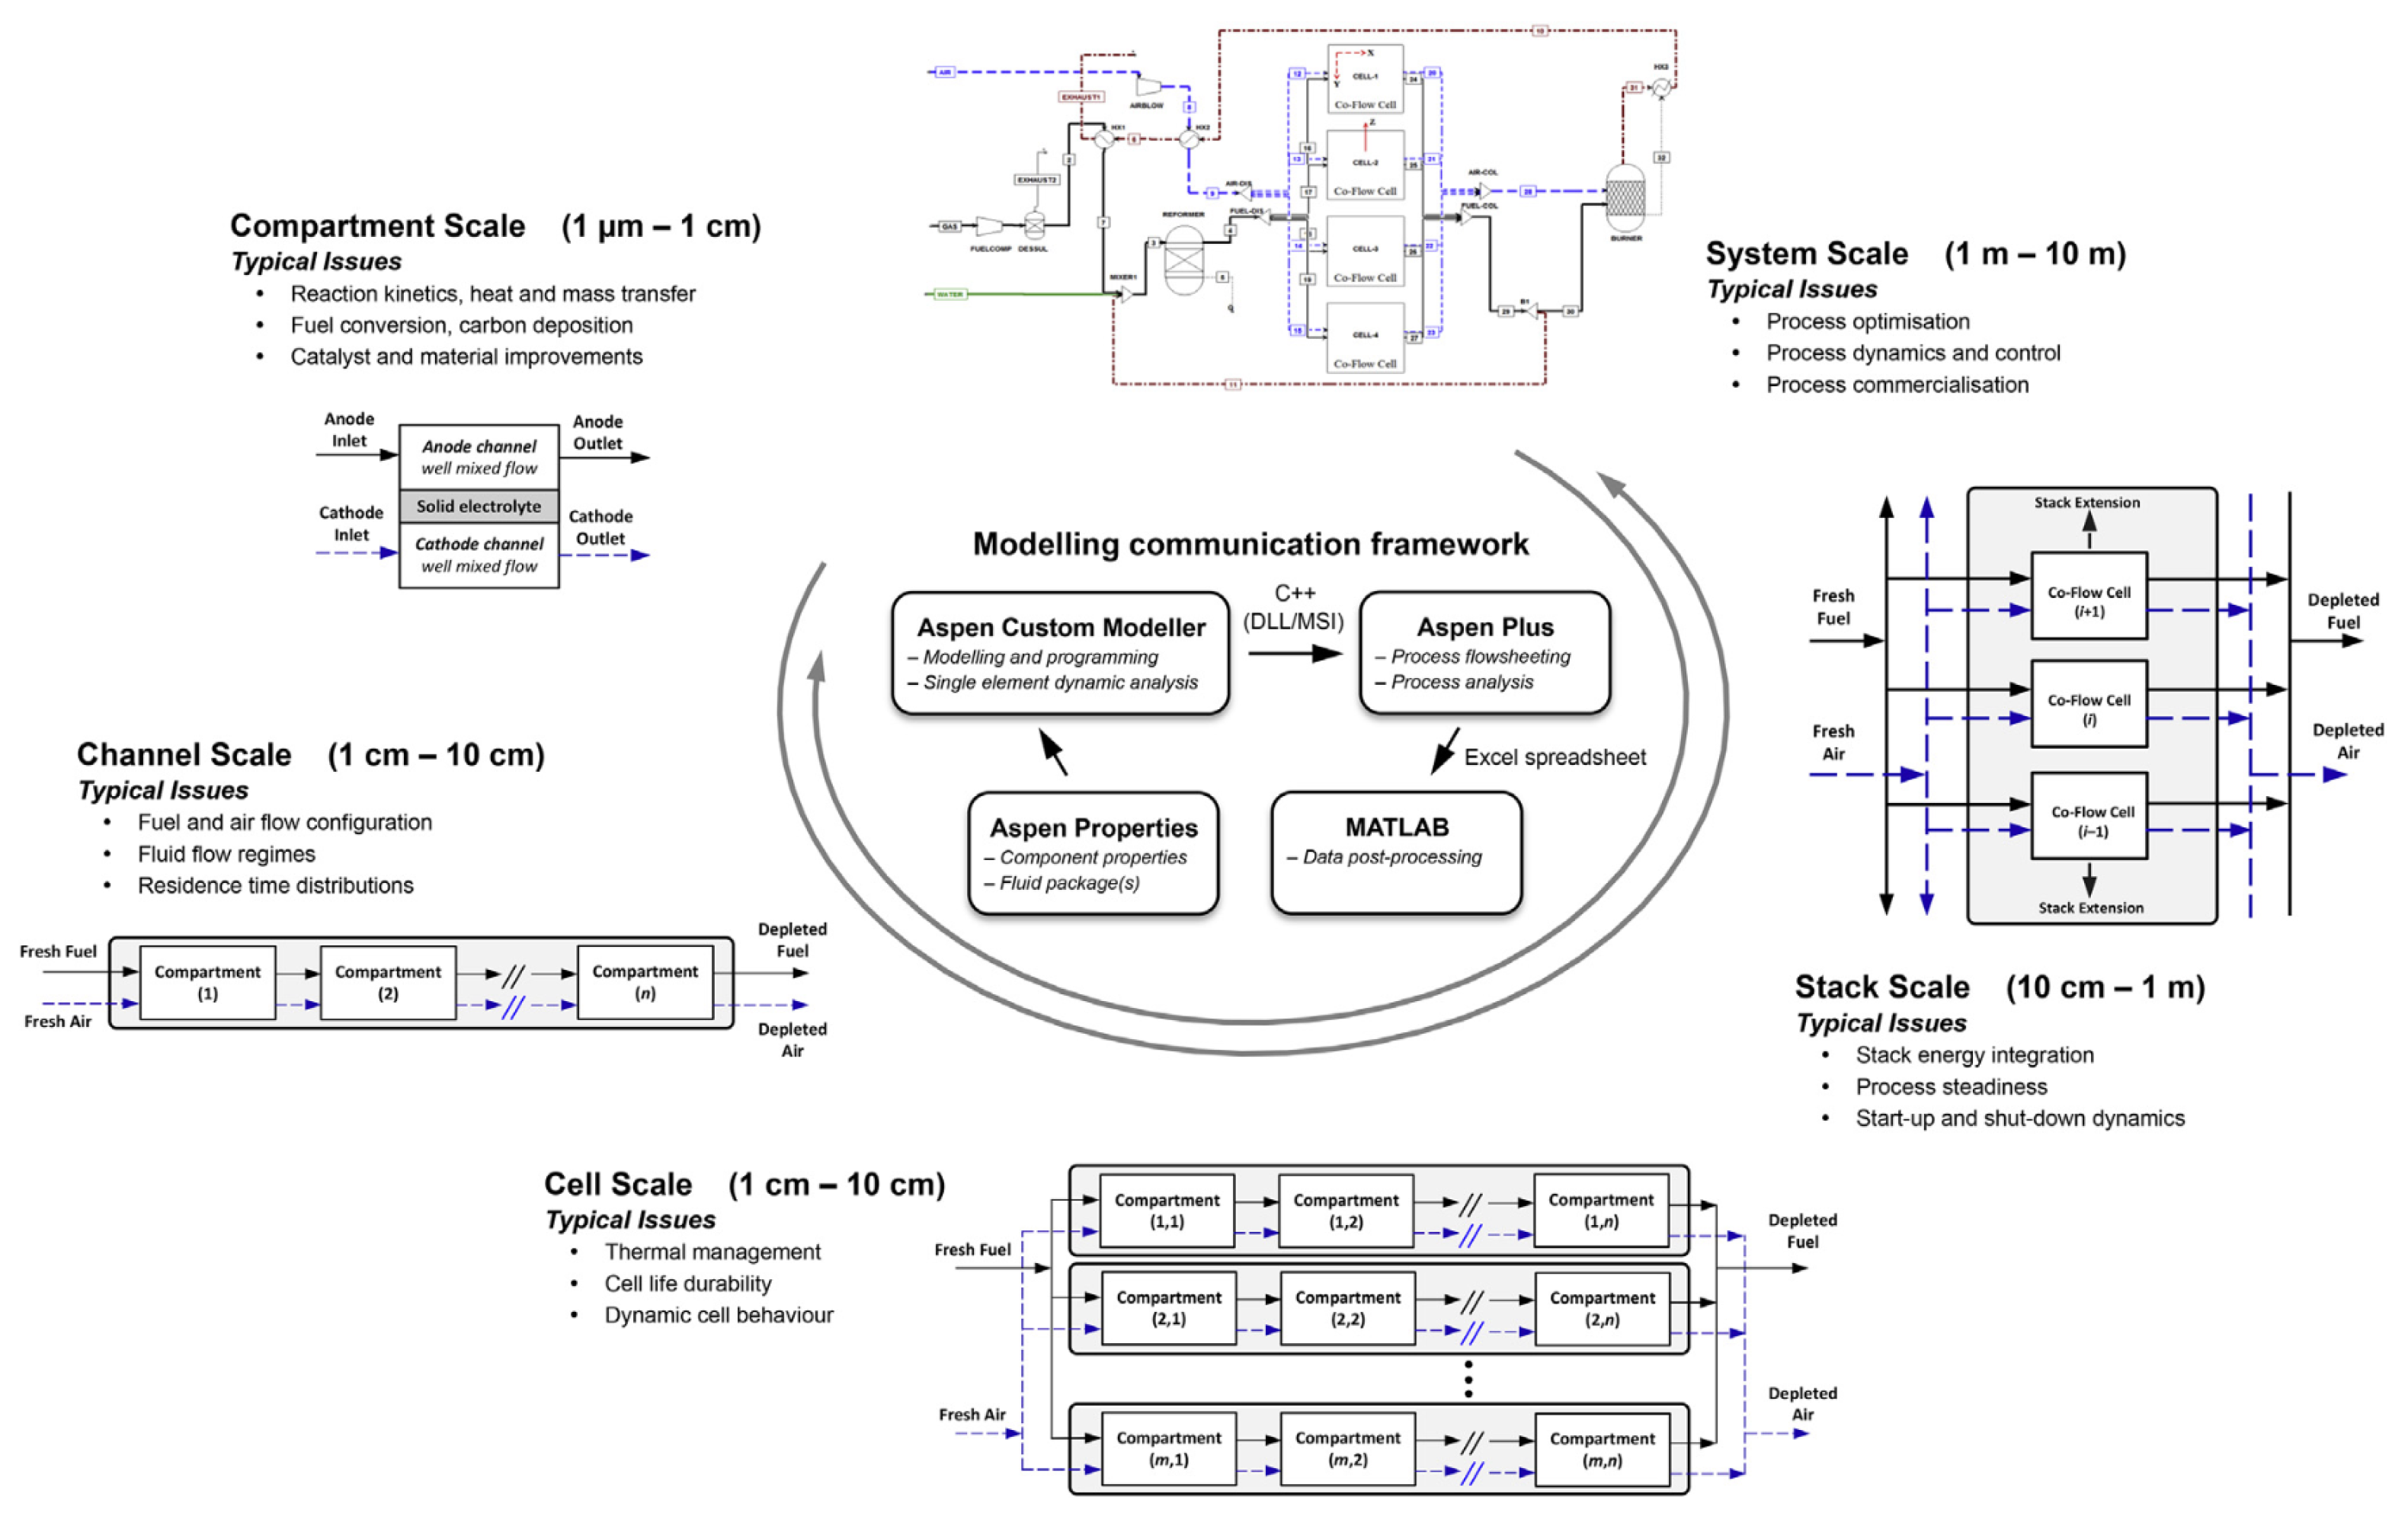
In this research, a modeling framework for an SOFC system was presented before the flowsheet, as shown in
Figure 15, dividing the system into different scales of analysis. These scales help to understand and address specific problems that arise at various levels of the system, from microscopic to macroscopic.
The blocks in
Figure 15 were analyzed as follows:
Compartment Scale (1m – 1 cm): This scale focuses on analyses at a very small level, often at the level of a single compartment within the fuel cell. This compartment could be a single channel or a portion of material within the cell. Typical issues include: reaction kinetics, fuel conversion and carbon deposition, and improvements in materials and catalysts;
Channel Scale (1 cm – 10 cm): This scale analyzes the channels within the cell, where fuel and air flow. It is an intermediate scale that connects the microscopic analysis of compartments with the more macroscopic analysis of entire cells. Typical issues include: configuration of fuel and air flows, flow regimes, and residence time distribution;
Cell Scale (1 cm – 10 cm): This scale deals with the entire fuel cell. Here, the dynamic and thermal behavior of the entire cell is examined. Typical issues include: thermal management, cell durability, and dynamic behavior of the cell;
Stack Scale (10 cm – 1 m): This scale analyzes the stack, which is the combination of multiple fuel cells connected in series or parallel to produce large-scale power. Typical issues include: energy integration of the stack, process stability, and start-up and shutdown dynamics;
System Scale (1 m – 10 m): This is the largest scale, where the entire SOFC system is considered, including auxiliary components known as BoP (Balance of Plant). Typical issues include: process optimization, process dynamics and control, and commercialization of the process.
Moving on to the central part, namely the Modelling Communication Framework. This framework integrates the various software tools used to simulate and analyze the SOFC system at all scales:
Aspen Custom Modeller: Used for detailed modeling and programming of individual elements;
Aspen Properties: Provides component properties and fluid packages needed for the simulations;
Aspen Plus: Employed for process flow simulations and system-level process analysis;
MATLAB: Used for data processing after the simulation, through the use of Excel spreadsheets.
The schematic simulated in Aspen Plus is shown in
Figure 16.
The SOFC block was simulated in Aspen Plus using the following modules, which are reported in
Table 12.
The effectiveness of the model has been demonstrated in previous studies at the compartment and cell levels. This work extends the methodology to higher scales, such as the stack and the system, allowing for the examination of the influence of the BoP on stack performance. The results indicate that it is possible to improve the uniformity of internal temperature and current density profiles by adjusting BoP parameters, such as the AGR fraction. The adopted approach also facilitates the simulation of different fuel-air flow schemes in the cell and stack. However, challenges arise, such as the complexity in managing BoP parameters and the significant computational demand of the multi-scale model. Furthermore, the work requires further developments to be applicable in real operational contexts, suggesting that the model still needs optimizations and additional validations.
The study by Doherty et al. (2015) [
63] analyzes the integration of SOFCs in combined heat and power (CHP) systems based on biomass gasification (BG-SOFC). Using Aspen Plus to simulate different scenarios, the results show that thermal integration, such as using SOFC exhaust gases as an oxidant in the gasifier, is advantageous. Additionally, it is recommended to lower the syngas preheating temperature before it enters the SOFC anodes. The system with anode recycling proves to be better than those with cathode recycling or electric heater integration. The simulations indicate that BG-SOFC CHP systems are technically feasible and can achieve high efficiencies, confirming their potential to improve energy efficiency and reduce emissions.
The schematic simulated in Aspen Plus is shown in
Figure 17.
The SOFC block was simulated in Aspen Plus using the following modules, which are reported in
Table 13.
The research work utilized Aspen Plus to model different configurations of BG-SOFC systems, demonstrating technical feasibility and the influence of operational parameters. However, several challenges arise in the context of SOFCs integrated with biomass gasification:
Cathode air recirculation: The results indicate that cathode air recirculation and the use of an electric heater for syngas preheating do not offer significant advantages over the baseline system with anode recirculation. This suggests that research into alternatives for syngas preheating may not yield significant performance improvements;
Syngas cleaning temperature: Although high-temperature syngas cleaning is advantageous for reducing plant complexity, the system does not specifically address the associated costs and technical challenges related to this research;
Biomass moisture: High biomass moisture negatively affects the plant’s efficiency. However, the study does not thoroughly explore practical solutions for reducing biomass moisture or improving the management of fuels with high moisture content;
Thermal integration: Thermal integration between the gasifier and the SOFC is considered interesting, but the work does not delve into the complexities of such integration and how these may impact the efficiency and practicality of the system in the long run.
In summary, while BG-SOFC systems can offer high efficiencies, it is essential to address the associated issues and costs more thoroughly, as well as to explore solutions for improving biomass management and syngas cleaning.
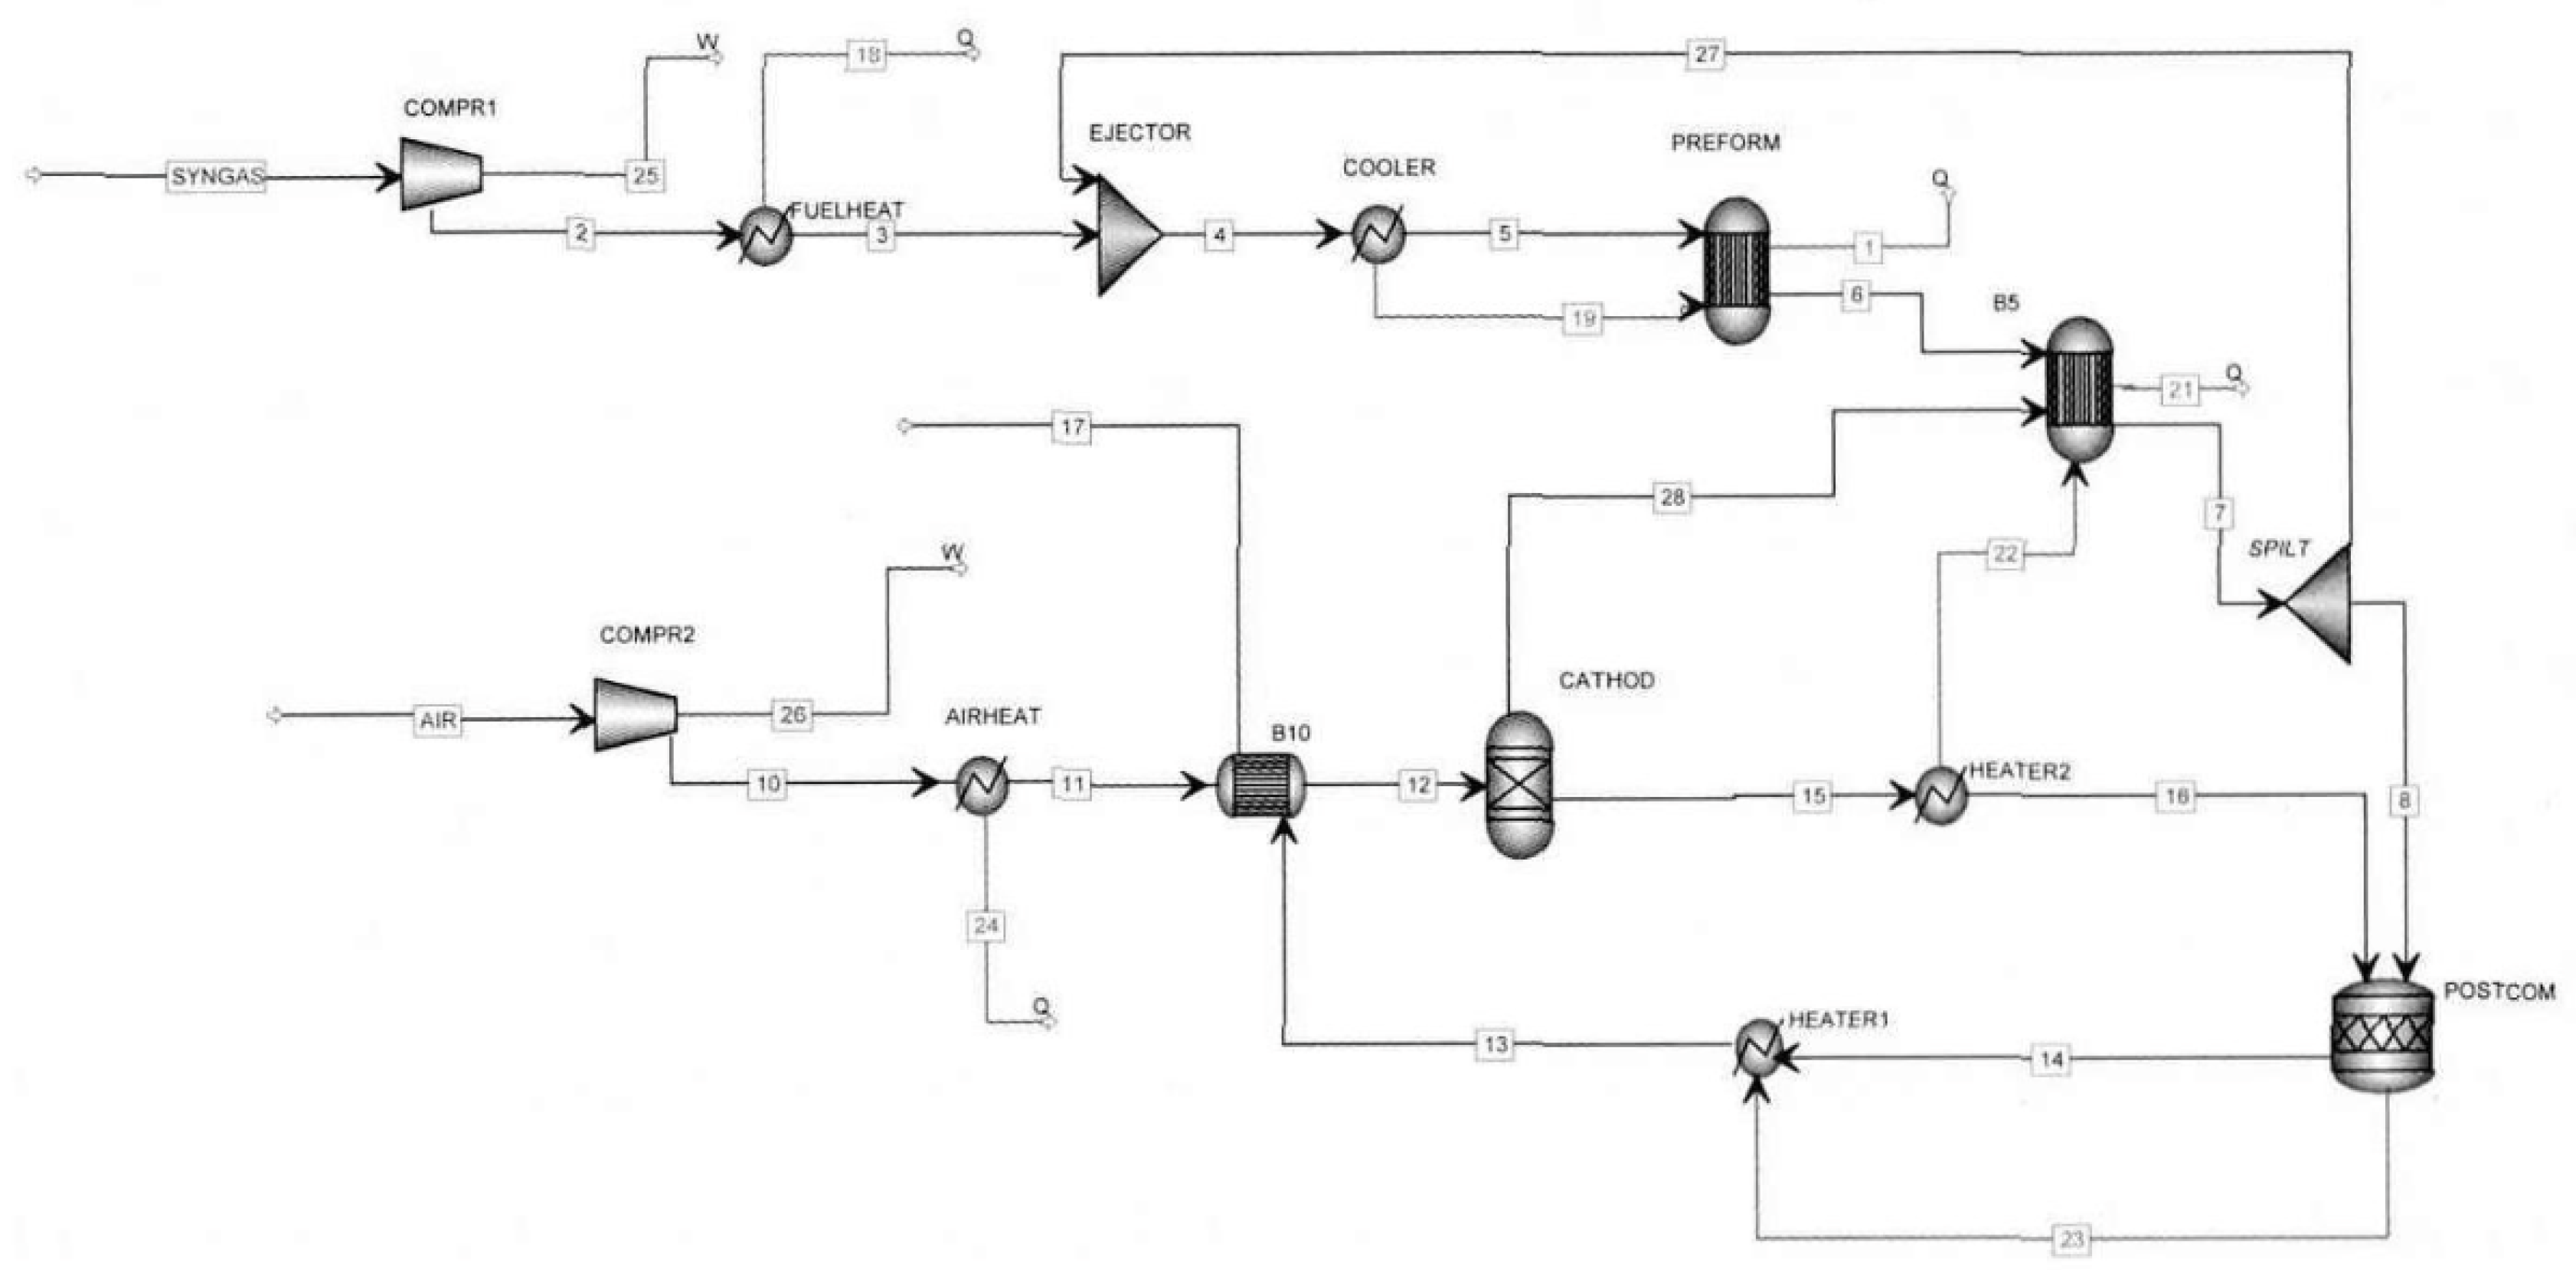
The study by Rudra and Kim (2010) [
64] examines the SOFC as a promising technology for high-efficiency electricity generation. Using sulfur-free syngas as fuel in an IGFC system, the SOFC directly converts chemical energy into electrical energy and can be integrated into cogeneration applications due to its high operating temperature. The authors developed a simulation model of the SOFC using Aspen Plus, taking into account various types of fuels and the different losses in the system.
The results show a trade-off between efficiency and power based on the properties of the syngas and highlight a decline in performance when the SOFC operates with coal compared to syngas.
The schematic simulated in Aspen Plus is shown in
Figure 18.
The SOFC block was simulated in Aspen Plus using the following modules, which are reported in
Table 14.
In the present study, several significant challenges emerged. Although the simulation model developed for the SOFC using Aspen Plus is effective in predicting the system’s performance under various operating conditions, some issues have been identified.
Firstly, the accuracy of the model depends on the quality of the data and assumptions used. Furthermore, while simulation method ’A’ demonstrated better results for the operation of the HRSG (Heat Recovery Steam Generator), it is not guaranteed to be applicable under all operating conditions. There may be alternative methods that provide superior results in other situations.
The sensitivity analysis conducted highlighted the importance of using appropriate parameters for evaluating losses and chemical reactions, but the adopted assumptions may not cover the entire real variability of the parameters. Additionally, the models used may not fully reflect the complexity of real processes, such as internal heat exchange and hydrocarbon reforming reactions, necessitating a more detailed and realistic assessment of these aspects.
Finally, the research objectives in the field of coal gasification and fuel cells are ambitious, and achieving them may require further technological developments and advancements in research.
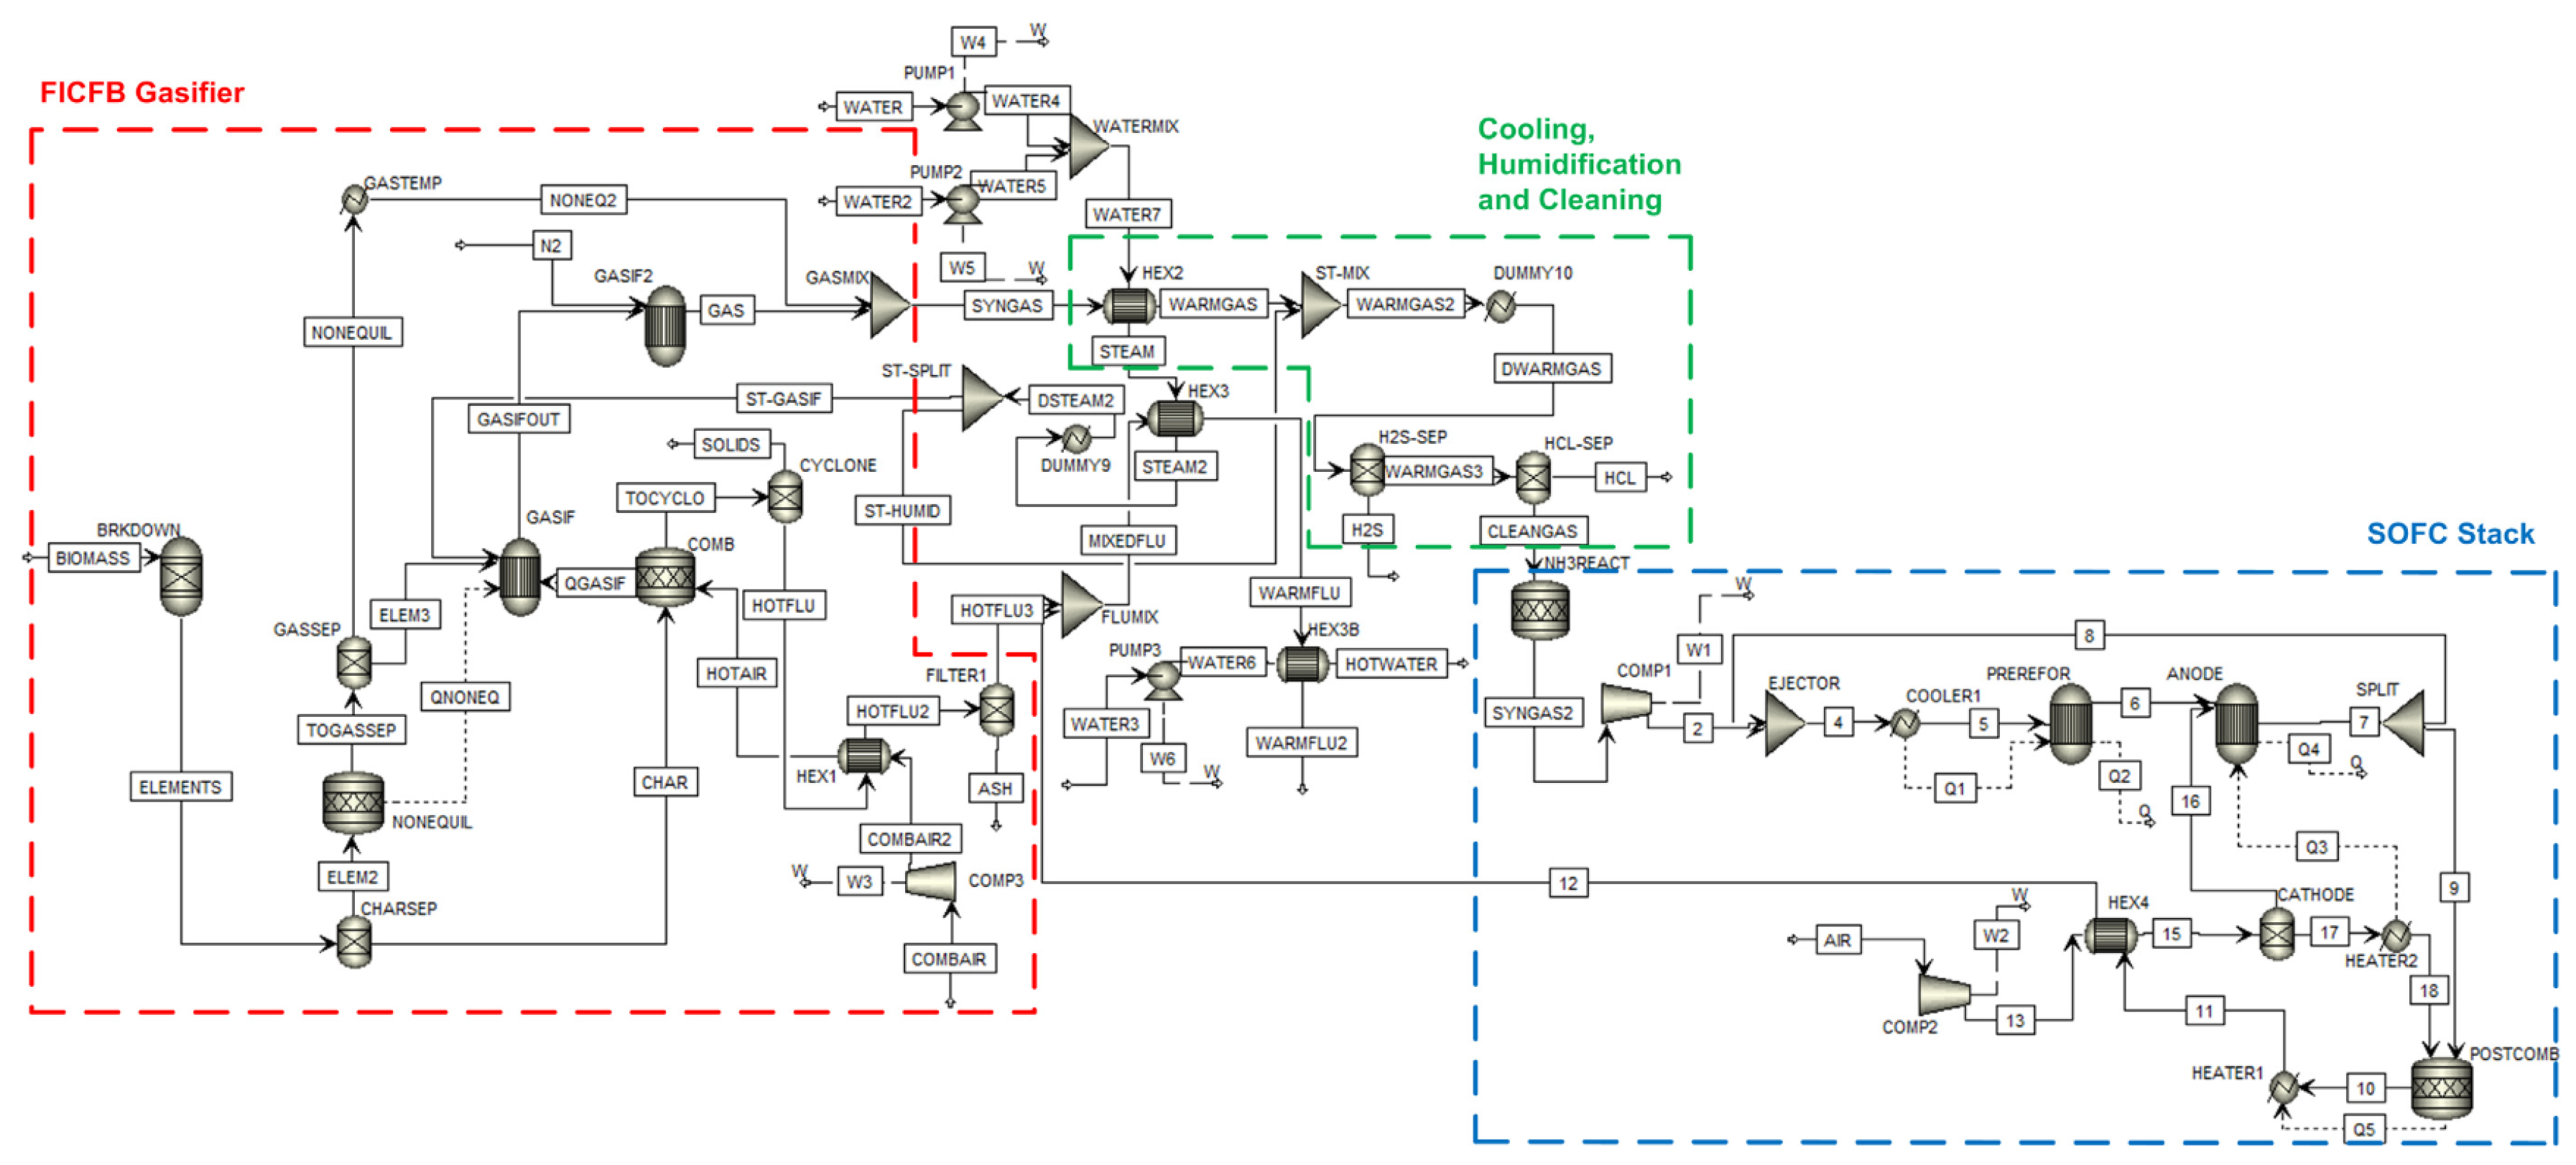
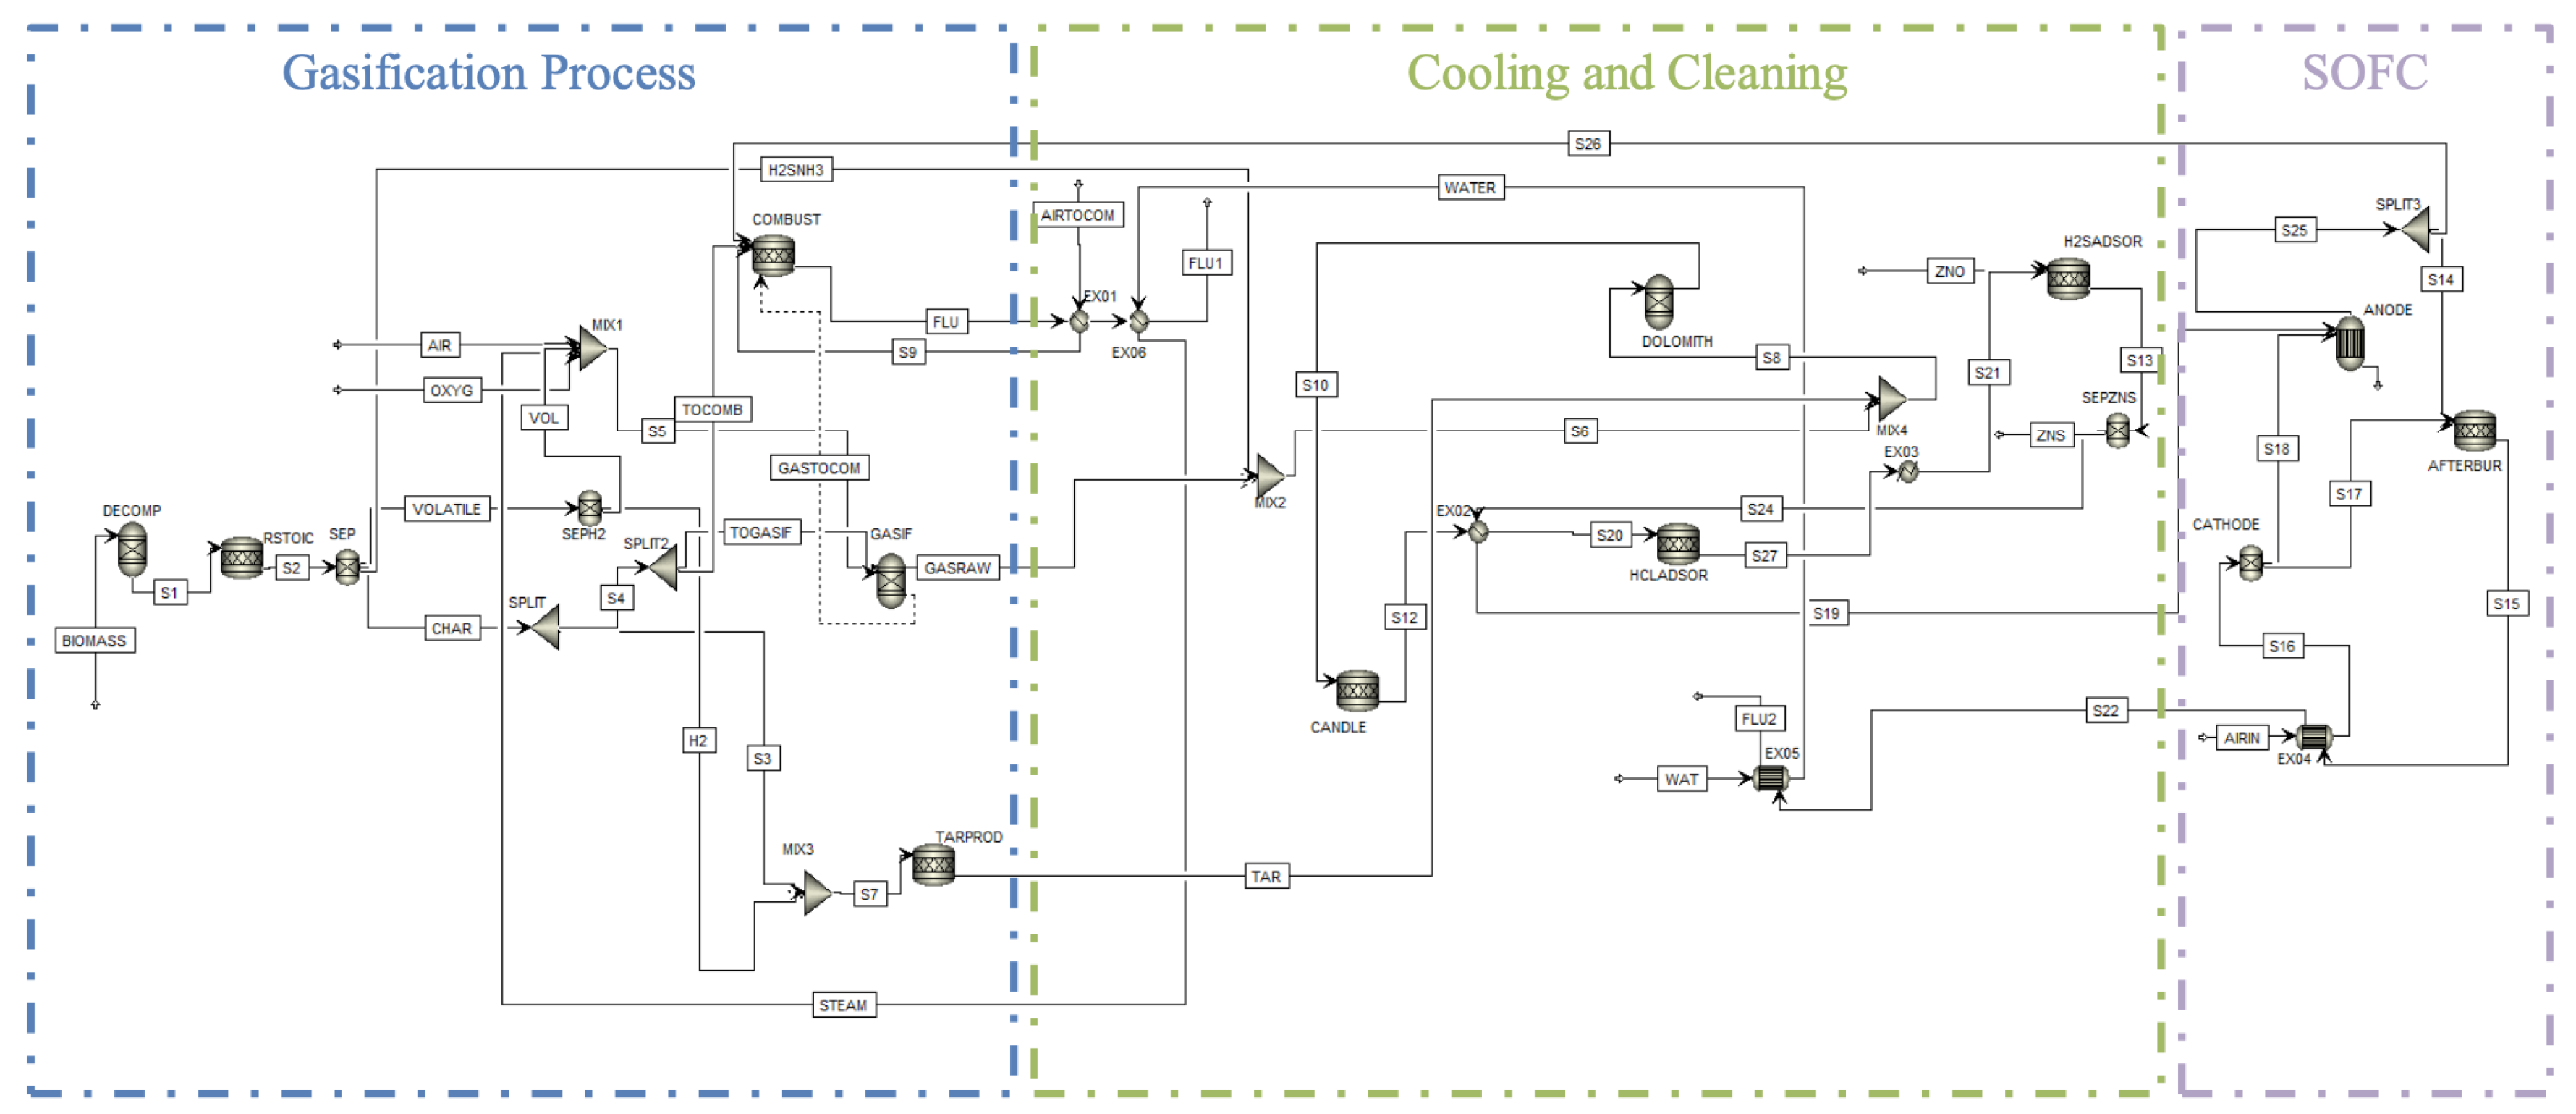
Finally, the work of Marcantonio et al. (2020) [
65] focuses on the design and simulation of a biomass-SOFC system using Aspen Plus. This steady-state model allows for predicting the performance of a SOFC system powered by syngas produced through biomass gasification. The developed model does not use external subroutines but only standard Aspen Plus blocks, making it simpler and more reliable. The results show that the simulation of the syngas composition and the behavior of the system align with available literature data. The sensitivity analysis highlights a trade-off between voltage, electrical efficiency, and power as a function of current density, and suggests maintaining a low steam-biomass ratio. The electrical efficiency of the system, at 57%, is high, making syngas-powered SOFCs a very promising option for energy production.
The schematic simulated in Aspen Plus is reported in
Figure 19.
The block regarding the SOFC was simulated in Aspen Plus with the following modules, which are reported in
Table 15:
The analysis showed that a low steam-to-biomass (S/B) ratio is preferable to improve electrical efficiency and reduce CO2 formation in the exhaust gas. It was highlighted that the current density affects the voltage, power, and electrical efficiency of the SOFC, with optimal current density values between 1800 and 2000 A/m² producing a voltage of 1.1 V, a power output of 850 W/m², and an electrical efficiency of 57%. Furthermore, an increase in the concentration of CO and incoming air to the SOFC can enhance the power output of the SOFC.
Figure 1.
SOFC in Aspen Plus - Paulina Pianko-Oprych & Mateusz Palus. Source: Pianko-Oprych, Paulina, and Mateusz Palus. "Simulation of SOFCs based power generation system using Aspen." Polish Journal of Chemical Technology 19.4 (2017): 8-15.
Figure 1.
SOFC in Aspen Plus - Paulina Pianko-Oprych & Mateusz Palus. Source: Pianko-Oprych, Paulina, and Mateusz Palus. "Simulation of SOFCs based power generation system using Aspen." Polish Journal of Chemical Technology 19.4 (2017): 8-15.
Figure 2.
SOFC results - Pianko-Oprych e Palus (2017). Source: Pianko-Oprych, Paulina, and Mateusz Palus. "Simulation of SOFCs based power generation system using Aspen." Polish Journal of Chemical Technology 19.4 (2017): 8-15.
Figure 2.
SOFC results - Pianko-Oprych e Palus (2017). Source: Pianko-Oprych, Paulina, and Mateusz Palus. "Simulation of SOFCs based power generation system using Aspen." Polish Journal of Chemical Technology 19.4 (2017): 8-15.
Figure 3.
SOFC results 2 - Pianko-Oprych e Palus (2017). Source: Pianko-Oprych, Paulina, and Mateusz Palus. "Simulation of SOFCs based power generation system using Aspen." Polish Journal of Chemical Technology 19.4 (2017): 8-15.
Figure 3.
SOFC results 2 - Pianko-Oprych e Palus (2017). Source: Pianko-Oprych, Paulina, and Mateusz Palus. "Simulation of SOFCs based power generation system using Aspen." Polish Journal of Chemical Technology 19.4 (2017): 8-15.
Figure 4.
No reversible SOFC - Tjaden et al. (2014) Source: Tjaden, B., et al. "Small-scale biogas-SOFC plant: technical analysis and assessment of different fuel reforming options." Energy and fuels 28.6 (2014): 4216-4232.
Figure 4.
No reversible SOFC - Tjaden et al. (2014) Source: Tjaden, B., et al. "Small-scale biogas-SOFC plant: technical analysis and assessment of different fuel reforming options." Energy and fuels 28.6 (2014): 4216-4232.
Figure 5.
Reversible SOFC - Hauck et al. (2017) Source: Hauck, Maximilian, Stephan Herrmann, and Hartmut Spliethoff. "Simulation of a reversible SOFC with Aspen Plus." International Journal of Hydrogen Energy 42.15 (2017): 10329-10340.
Figure 5.
Reversible SOFC - Hauck et al. (2017) Source: Hauck, Maximilian, Stephan Herrmann, and Hartmut Spliethoff. "Simulation of a reversible SOFC with Aspen Plus." International Journal of Hydrogen Energy 42.15 (2017): 10329-10340.
Figure 6.
Cruise ship SOFC - Russo et al. (2023) Source: Russo, Roberta, et al. "Preliminary Investigation of a Multi-MW Solid Oxide Fuel Cell Power Plant to be Installed on Board a Cruise Ship." Chemical Engineering Transactions 99 (2023): 577-582.
Figure 6.
Cruise ship SOFC - Russo et al. (2023) Source: Russo, Roberta, et al. "Preliminary Investigation of a Multi-MW Solid Oxide Fuel Cell Power Plant to be Installed on Board a Cruise Ship." Chemical Engineering Transactions 99 (2023): 577-582.
Figure 7.
SOFC + GT - Hentati et al. (2024) Source: Hentati, Mariem, et al. "Technical, environmental and economic evaluation of a kW-level flared gas-fuel GT-SOFC hybrid system." Energy Conversion and Management 317 (2024): 118825.
Figure 7.
SOFC + GT - Hentati et al. (2024) Source: Hentati, Mariem, et al. "Technical, environmental and economic evaluation of a kW-level flared gas-fuel GT-SOFC hybrid system." Energy Conversion and Management 317 (2024): 118825.
Figure 8.
SOFC - Veluswamy et al. (2019) Source: Veluswamy, G. K., et al. "Biohythane as an energy feedstock for solid oxide fuel cells." International Journal of Hydrogen Energy 44.51 (2019): 27896-27906.
Figure 8.
SOFC - Veluswamy et al. (2019) Source: Veluswamy, G. K., et al. "Biohythane as an energy feedstock for solid oxide fuel cells." International Journal of Hydrogen Energy 44.51 (2019): 27896-27906.
Figure 9.
SOFC & H+ - Saebea et al. (2021) Source: Saebea, Dang, Amornchai Arpornwichanop, and Yaneeporn Patcharavorachot. "Thermodynamic analysis of a proton conducting SOFC integrated system fuelled by different renewable fuels." International Journal of Hydrogen Energy 46.20 (2021): 11445-11457.
Figure 9.
SOFC & H+ - Saebea et al. (2021) Source: Saebea, Dang, Amornchai Arpornwichanop, and Yaneeporn Patcharavorachot. "Thermodynamic analysis of a proton conducting SOFC integrated system fuelled by different renewable fuels." International Journal of Hydrogen Energy 46.20 (2021): 11445-11457.
Figure 10.
SOFC for residential buildings - Sadhukhan et al. (2010) Source: Sadhukhan, Jhuma, et al. "Energy integration and analysis of solid oxide fuel cell based microcombined heat and power systems and other renewable systems using biomass waste derived syngas." Industrial & engineering chemistry research 49.22 (2010): 11506-11516.
Figure 11.
SOFC syngas - Doherty et al. (2009) Source: Doherty, Wayne, Anthony Reynolds, and David Kennedy. "Modelling and simulation of a biomass gasification-solid oxide fuel cell combined heat and power plant using Aspen Plus." (2009).
Figure 11.
SOFC syngas - Doherty et al. (2009) Source: Doherty, Wayne, Anthony Reynolds, and David Kennedy. "Modelling and simulation of a biomass gasification-solid oxide fuel cell combined heat and power plant using Aspen Plus." (2009).
Figure 12.
SOFC - Zhang et al. (2005) Source: Zhang, W., et al. "Simulation of a tubular solid oxide fuel cell stack using AspenPlusTM unit operation models." Energy Conversion and Management 46.2 (2005): 181-196.
Figure 12.
SOFC - Zhang et al. (2005) Source: Zhang, W., et al. "Simulation of a tubular solid oxide fuel cell stack using AspenPlusTM unit operation models." Energy Conversion and Management 46.2 (2005): 181-196.
Figure 13.
SOFC - Ameri e Mohammadi (2013) Source: Ameri, Mohammad, and Rasoul Mohammadi. "Simulation of an atmospheric SOFC and gas turbine hybrid system using Aspen Plus software." International journal of energy research 37.5 (2013): 412-425.
Figure 13.
SOFC - Ameri e Mohammadi (2013) Source: Ameri, Mohammad, and Rasoul Mohammadi. "Simulation of an atmospheric SOFC and gas turbine hybrid system using Aspen Plus software." International journal of energy research 37.5 (2013): 412-425.
Figure 14.
SOFC - Ameri e Mohammadi (2013) Source: Doherty, Wayne, Anthony Reynolds, and David Kennedy. "Computer simulation of a biomass gasification-solid oxide fuel cell power system using Aspen Plus." Energy 35.12 (2010): 4545-4555.
Figure 14.
SOFC - Ameri e Mohammadi (2013) Source: Doherty, Wayne, Anthony Reynolds, and David Kennedy. "Computer simulation of a biomass gasification-solid oxide fuel cell power system using Aspen Plus." Energy 35.12 (2010): 4545-4555.
Figure 15.
Framework Amiri et al. (2016) Source: Amiri, Amirpiran, et al. "Planar SOFC system modelling and simulation including a 3D stack module." International Journal of Hydrogen Energy 41.4 (2016): 2919-2930.
Figure 15.
Framework Amiri et al. (2016) Source: Amiri, Amirpiran, et al. "Planar SOFC system modelling and simulation including a 3D stack module." International Journal of Hydrogen Energy 41.4 (2016): 2919-2930.
Figure 16.
SOFC - Amiri et al. (2016) Source: Amiri, Amirpiran, et al. "Planar SOFC system modelling and simulation including a 3D stack module." International Journal of Hydrogen Energy 41.4 (2016): 2919-2930.
Figure 16.
SOFC - Amiri et al. (2016) Source: Amiri, Amirpiran, et al. "Planar SOFC system modelling and simulation including a 3D stack module." International Journal of Hydrogen Energy 41.4 (2016): 2919-2930.
Figure 17.
BG-SOFC - Doherty et al. (2015) Source: Doherty, Wayne, Anthony Reynolds, and David Kennedy. "Process simulation of biomass gasification integrated with a solid oxide fuel cell stack." Journal of Power Sources 277 (2015): 292-303.
Figure 17.
BG-SOFC - Doherty et al. (2015) Source: Doherty, Wayne, Anthony Reynolds, and David Kennedy. "Process simulation of biomass gasification integrated with a solid oxide fuel cell stack." Journal of Power Sources 277 (2015): 292-303.
Figure 18.
SOFC - Rudra e Kim (2010) Source: Rudra, Souman, and Hyung Taek Kim. "A simulation study of Solid oxide fuel cell (SOFC) for IGFC power generation using Aspen Plus." Journal of Energy and Climate Change 5.2 (2010): 24-35.
Figure 18.
SOFC - Rudra e Kim (2010) Source: Rudra, Souman, and Hyung Taek Kim. "A simulation study of Solid oxide fuel cell (SOFC) for IGFC power generation using Aspen Plus." Journal of Energy and Climate Change 5.2 (2010): 24-35.
Figure 19.
Biomass-SOFC - Marcantonio et al. (2020)
Figure 19.
Biomass-SOFC - Marcantonio et al. (2020)
Table 1.
Aspen Plus modules used by Pianko-Oprych and Palus (2017).
Table 1.
Aspen Plus modules used by Pianko-Oprych and Palus (2017).
| Aspen Plus Module |
Name |
| REFORMER |
RGibbs |
| ANODE |
RGibbs |
| BURNER |
RStoic |
| CATHODE |
Separator |
| HEATER-1 |
Heater |
| RECUPER |
HeatX |
Table 2.
Aspen Plus modules used by Hauck et al. (2017).
Table 2.
Aspen Plus modules used by Hauck et al. (2017).
| Aspen Plus Module |
Name |
| REA1 - REA2 |
RGibbs |
| REDUCE |
RStoic |
| FUSEP1 - FUSEP2 |
Separator |
Table 3.
Aspen Plus modules used by Russo et al. (2023).
Table 3.
Aspen Plus modules used by Russo et al. (2023).
| Aspen Plus Module |
Name |
| PREREFOR |
RGibbs |
| ANODE |
RGibbs |
| AFTERBUR |
RStoic |
| CATHODE |
Separator |
| NG-TCON - T-CON - AFT-TCON - AIR-TCON |
Heater |
| HEATEX |
HeatX |
Table 4.
Aspen Plus modules used by Hentati et al. (2024).
Table 4.
Aspen Plus modules used by Hentati et al. (2024).
| Aspen Plus Module |
Name |
| PREREFOR |
RGibbs |
| ANODE |
RGibbs |
| BURNER |
RStoic |
| CATHODE |
Separator |
| HEATER |
Heater |
| RECUPER |
HeatX |
Table 5.
Aspen Plus modules used by Veluswamy et al. (2019).
Table 5.
Aspen Plus modules used by Veluswamy et al. (2019).
| Aspen Plus Module |
Name |
| PREREFOR |
RGibbs |
| ANODE |
RGibbs |
| BURNER |
RStoic |
| CATHODE |
Separator |
| HEATER |
Heater |
| COMPR1 - COMPR2 |
Compressor |
Table 6.
Aspen Plus modules used by Saebea et al. (2021).
Table 6.
Aspen Plus modules used by Saebea et al. (2021).
| Aspen Plus Module |
Name |
| REFORMER |
RGibbs |
| ANODE |
RGibbs |
| CATHODE |
RGibbs |
| HEATER |
Heater |
Table 7.
Aspen Plus modules used by Sadhukhan et al. (2010).
Table 7.
Aspen Plus modules used by Sadhukhan et al. (2010).
| Aspen Plus Module |
Name |
| ANODE - SULPLFIRE |
RGibbs |
| ANODE |
REquil |
| B7 |
Separator |
| FLUE-FUE - N2-AIR |
Heater |
| B3 - B4 - B6 |
HeatX |
| CATHODE |
Distillation Column |
Table 8.
Aspen Plus modules used by Doherty et al. (2009).
Table 8.
Aspen Plus modules used by Doherty et al. (2009).
| Aspen Plus Module |
Name |
| PREREFOR |
REquil |
| ANODE |
REquil |
| POSTCOMB |
RStoic |
| CATHODE |
Separator |
| HEATER1 - HEATER2 - COOLER1 - FUELHEAT - AIRHEAT |
Heater |
| HEATX1 |
HeatX |
| COMP1 - COMP2 |
Compressor |
Table 9.
Aspen Plus modules used by Zhang et al. (2005).
Table 9.
Aspen Plus modules used by Zhang et al. (2005).
| Aspen Plus Module |
Name |
| REFORMER |
RGibbs |
| ANODE |
RGibbs |
| AFTERBURN |
RStoic |
| CATHODE |
Separator |
| HEATER1 - HEATER2 - COOLER1 |
Heater |
| RECUPER |
HeatX |
| COMP1 - COMP2 |
Compressor |
Table 10.
Aspen Plus modules used by Ameri e Mohammadi (2013).
Table 10.
Aspen Plus modules used by Ameri e Mohammadi (2013).
| Aspen Plus Module |
Name |
| PRE-REFORMER |
RGibbs |
| ANODE |
RGibbs |
| AFTER BURNER |
RStoic |
| CATHODE |
Separator |
| HEATER - DESULFURIZER |
Heater |
| RECUPER |
HeatX |
| PRE-HEATER |
MHeatX |
| FUEL COMPRESSOR - AIR COMPRESSOR |
Compressor |
| GAS TUBRINE |
Turbine |
Table 11.
Aspen Plus modules used by Doherty, Reynolds e Kennedy (2010).
Table 11.
Aspen Plus modules used by Doherty, Reynolds e Kennedy (2010).
| Aspen Plus Module |
Name |
| PREREFORMER |
RGibbs |
| ANODE |
RGibbs |
| POSTCOMB |
RStoic |
| CATHODE |
Separator |
| FUELHEATER - COOLER1 - AIRHEAT - HEATER1 - HEATER2 |
Heater |
| HEATX1 |
HeatX |
| COMP1 - COMP2 |
Compressor |
Table 12.
Aspen Plus modules used by Amiri et al. (2016).
Table 12.
Aspen Plus modules used by Amiri et al. (2016).
| Aspen Plus Module |
Name |
| REFORMER |
RGibbs |
| BURNER |
RGibbs |
| DESSUL |
Separator |
| B3 - B4 - B - HX2 - HX3 |
Heater |
| FUELCOMP - AIRBLOW |
Compressor |
Table 13.
Aspen Plus modules used by Doherty et al. (2015).
Table 13.
Aspen Plus modules used by Doherty et al. (2015).
| Aspen Plus Module |
Name |
| PREREFOR |
REquil |
| ANODE |
REquil |
| NH3REACT - POSTCOMB |
RStoic |
| CATHODE |
Separator |
| HEATER1 - HEATER2 - COOLER1 |
Heater |
| HEX41 |
HeatX |
| COMP1 - COMP2 |
Compressor |
Table 14.
Aspen Plus modules used by Rudra e Kim (2010).
Table 14.
Aspen Plus modules used by Rudra e Kim (2010).
| Aspen Plus Module |
Name |
| PREFORM |
REquil |
| B5(ANODE) |
REquil |
| POSTCOM |
RStoic |
| CATHODE |
SRGibbs |
| FUELHEAT - AIRHEAT - COOLER - HEATER1 - HEATER2 |
Heater |
| B10 |
HeatX |
| COMPR1 - COMP2 |
Compressor |
Table 15.
Aspen Plus modules used by Marcantonio et al. (2020).
Table 15.
Aspen Plus modules used by Marcantonio et al. (2020).
| Aspen Plus Module |
Name |
| AFTERBUR |
RStoic |
| ANODE |
REquil |
| CATHODE |
Separator |
| EX04 |
HeatX |
