1. Introduction
The disposal of palm oil mill effluent (POME) waste is a financial and environmental problem facing industries and local communities. Extracting crude palm oil (CPO) from the fresh fruit bunches (FFB) generates large volumes of POME as wastewater. The untreated discharge of POME is a major environmental problem because of its high content of organic matter and suspended solids, which may be degraded by microorganisms, giving off odorous gases and waste products [
1].The treatment process of the degradation itself is complex and a further challenge [
2]. POME also elevate the level of Biochemical Oxygen Demand (BOD) and Chemical Oxygen Demand (COD) that destroy the water quality [
3]. In 2017, 453 palm oil mills (POMs) were in operation in West Malaysia and 208 in East Malaysia [
4]. The Malaysian Department of Environment (DOE) has enforced stricter regulations on the disposal of POME and reduced the permitted BOD level (BOD 20 mg/L) in East Malaysia [
5]. The application of such stringent regulations had not been fully realized in West Malaysia where treatment technologies are still limited and land constraints are a problem for pond-based systems [
2]. As a result, the development of systematic and practical POME treatment methods is necessary to meet the DOE's discharge standards.
Several studies have therefore been initiated to attempt to develop more effective POME treatment technologies which will address environmental and economic aspects [
6,
7,
8] . Although there have been recent advances in POME treatment, BOD reduction, an important indicator of pollution, has not been amply addressed. Some POME treatment technologies and explore future, potentially more effective techniques to reduce the impact of POME discharge on the environment, notably, the production of renewable biogas. Integrated processes including thermophilic Continuous Stirred Tank Reactor (CSTR) and mesophilic Microbial Electrolysis Cells (MECs) and co-digestion process involving oxidation by hydrogen peroxide (OHP) have shown increased renewable biogas yields [
1,
9]. The production of methane rich biogas from POME treatment is considerable. Estimates are made that for every tonne of Fresh Fruit Bunches (FFB) processed, 20 m³ of biogas may be produced or each tonne of POME produces about 28 m³ of biogas [
10]. In addition, one kilogram of COD in POME equals to 0.238 kg of CH₄ emissions, while other studies have reported 6.54 kg of CH₄ (and 137 kg of CO₂e) and 6.67 kg of CH₄ (and 163 kg of CO₂e) per tonne FFB processed [
11].
Their combined contribution to methane emissions and carbon dioxide (CO₂) to greenhouse gas (GHG) emissions from POME treatment is considerable. The major components of the POME treatment systems are over 90% CH₄ and CO₂ [
12]. Several factors such as harvest season, POM operational methods, organic matter content in POME and treatment system efficiency will determine the amount of methane released [
13]. Second, emissions from treatment depend significantly on the capture or non-capture of methane. Indonesia is the largest CPO producer in the world in 2018 with a production of 40.5 million tonnes of CPO, which results in 121.5 million cubic metres of POME as a source of GHG emissions [
11]. The potential for POME to energy conversion is high, but only a small percentage (5%) of POMs collect biogas from POME [
14]. Optimization of biogas capture and energy recovery from POMs is essential in reducing GHG emissions from POMs. Additionally, more direct field measurements of GHG emissions from WWTPs employing multiple feeding systems are needed because such data is scarce.
Currently available in the technological landscape are many POME treatment systems for mitigating environmental impacts. Under each condition, each technology works in a different way making it difficult to come to optimal POME treatment system (PTS) network decisions given multiple sets of criteria like location and production capacity. Selection of POME treatment system (PTS) networks require the provision of decision support, of which the optimization models play an important role. Unfortunately, studies in this area are still few. An optimization model for selecting the optimal PTS is presented to minimize the environmental impact in this research. In this work, the model evaluates the environmental performance and methane production of three PTS technologies, Anaerobic Digester Tank (ADT) systems, Covered Lagoon (CL) systems, and Open Pond (OP) systems. The study then employs an optimization approach to reconcile environmental objectives with a practical solution to POME-related emission reduction.
2. Materials and Methods
The research methodology followed a series of sequential steps. It began with the definition of the problem, specifically related to the treatment system for palm oil mill effluent (POME). The key issues identified in determining the optimal POME treatment system included environmental impacts, such as biological oxygen demand (BOD), chemical oxygen demand (COD), and CO2 emissions. At this stage, challenges associated with POME management in palm oil mills (POMs) were also recognized.
The second step involved constructing a superstructure diagram to comprehensively represent the problem. This diagram was subsequently simplified. A model, termed the Green Mode Model, was then formulated and developed.
Following this, a case study was selected, involving two palm oil mills: the Barema Palm Oil Mill, which utilizes the Anaerobic Digestion Tank (ADT) and Pond system, and the Kumbango Oil Mill, which employs the Covered Lagoon System. Within this context, specific constraints and assumptions were applied, focusing primarily on the hourly processing capacities of the mills in terms of processed palm kernel oil and POME. Data required for the model were collected from case studies, research articles, and relevant authorities.
The developed model was then coded into the optimization software GAMS, version 40.1.0. Optimization of the POME treatment systems was carried out using this software, which was programmed with the defined mathematical models and associated data. A sensitivity analysis was conducted to assess the impact of variations in input parameters on the model’s objectives. Finally, the model’s outputs were compared across all modes, with a particular emphasis on environmental performance.
2.1. Superstructure Diagram Generation
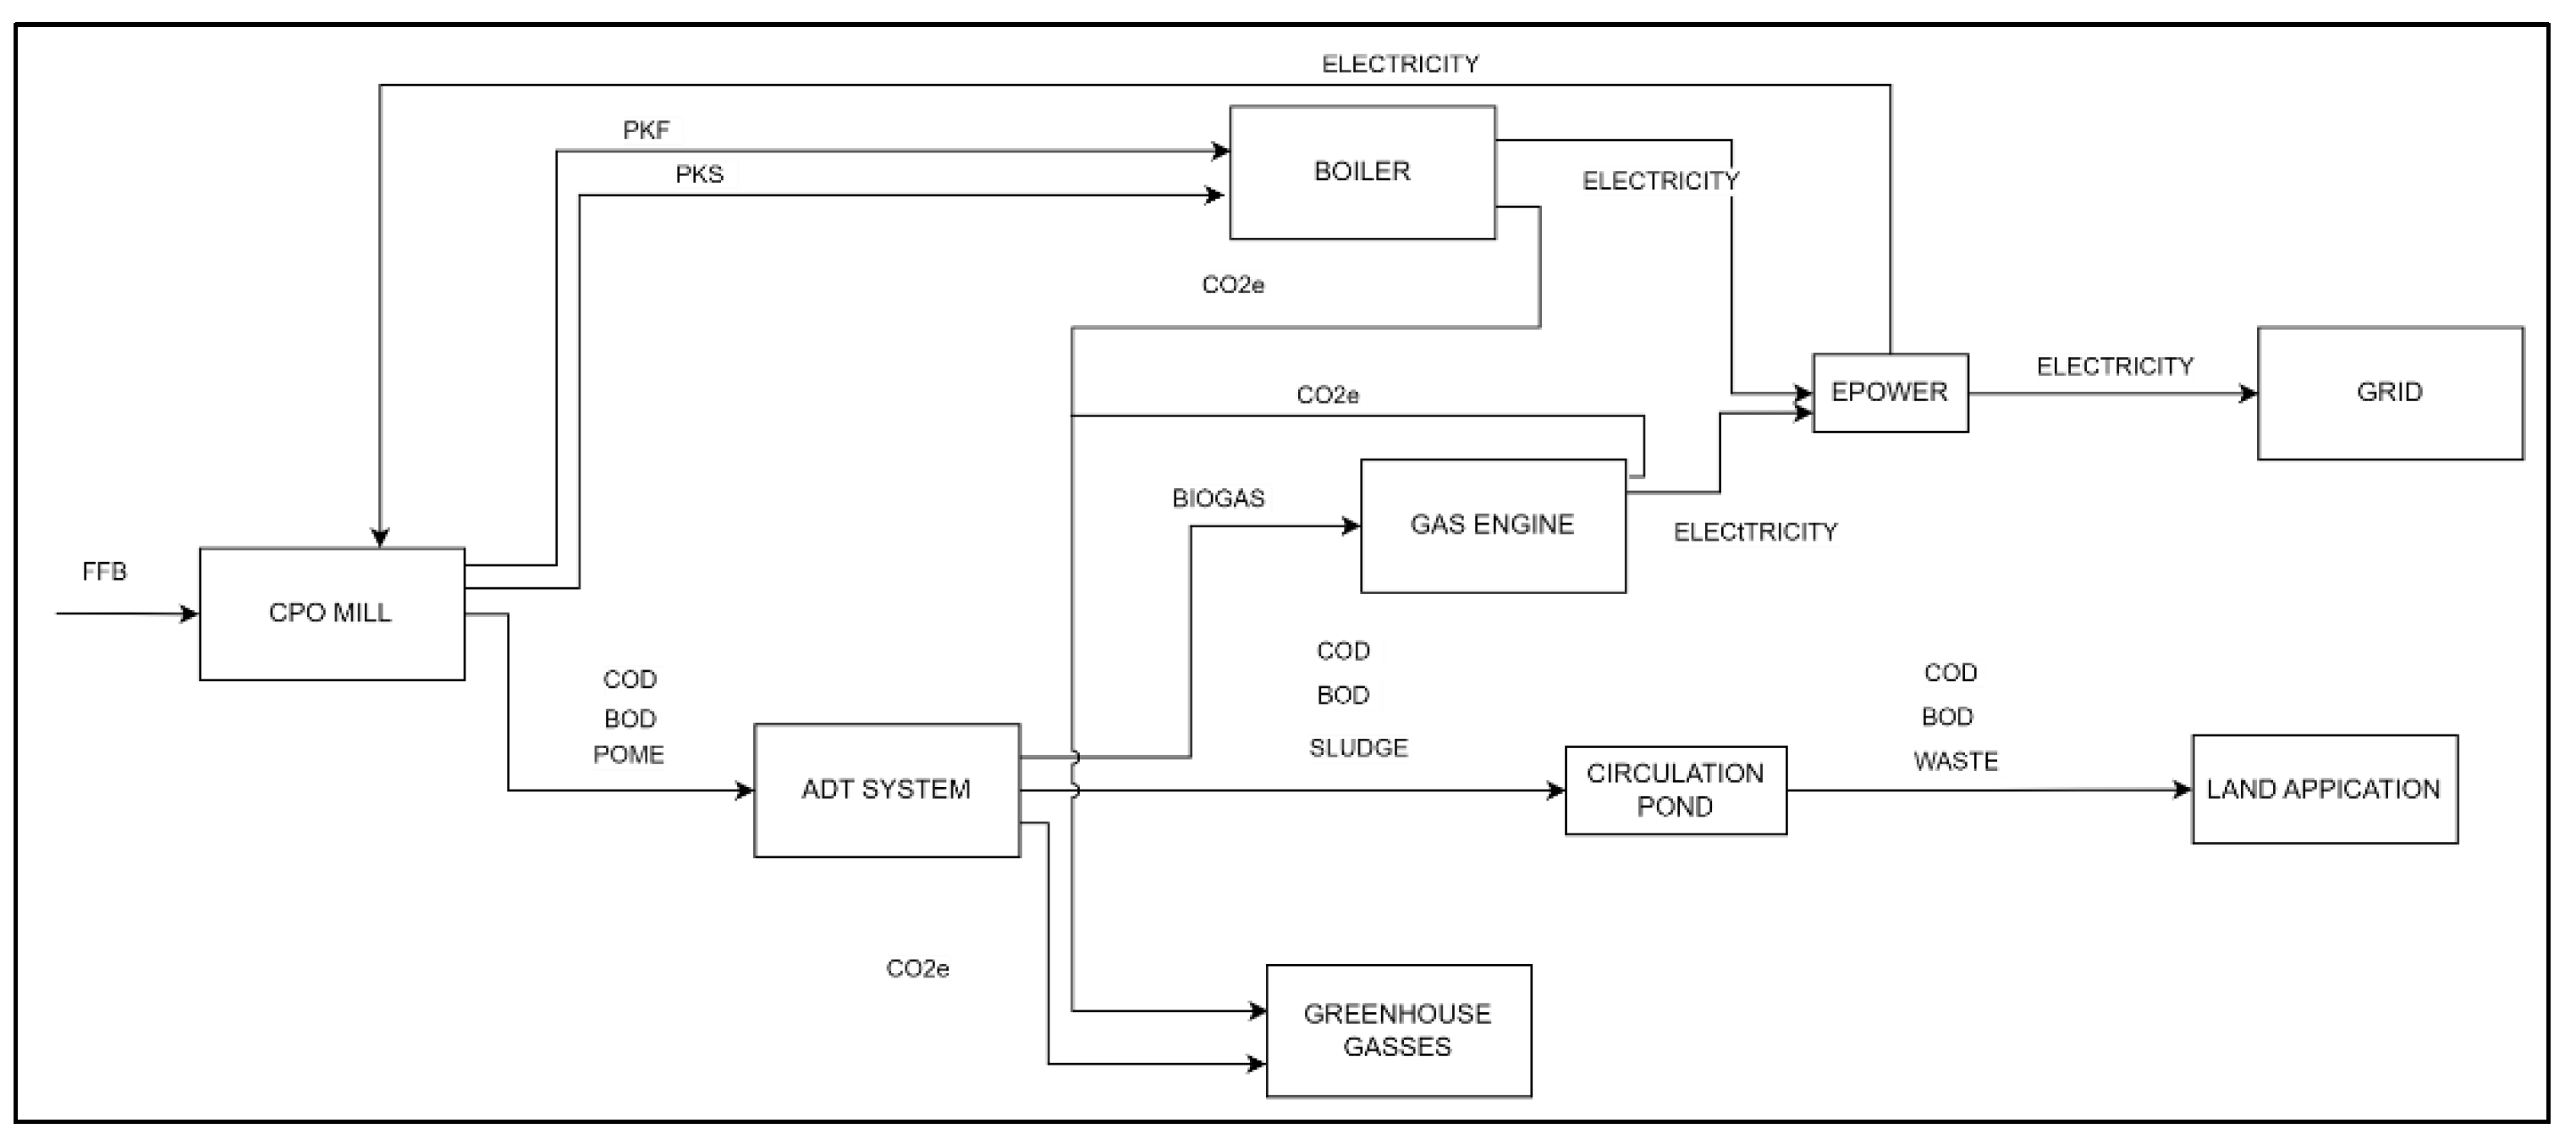
The process begins with the palm oil mill processing Fresh Fruit Bunches (FFB), categorized under set-m. This process generates Palm Oil Mill Effluent (POME), palm kernel shells (PKS), and palm kernel fibre (PKF). The POME is directed to the POME treatment system (set-p), where it serves as a feedstock for biogas production. Simultaneously, PKS and PKF are directed to the boiler (set-n) as boiler feedstock. The total electricity generated from both the biogas production and the boiler is recorded under set-j. This electricity can be sold to the grid, while the resulting digestate can be used as fertilizer for land application, as represented in set-s. The system's impact on CO
2 equivalent emissions (CO
2e) is assessed under set-a. By structuring the process in this manner, a comprehensive analysis and optimization of each component of the POME treatment and by-product utilization system is enabled, ensuring both economic efficiency and environmental sustainability. The developed superstructure diagram is presented in
Figure 1.
2.2. Model Formulation
The objective function is to minimize the total CO
2e emission within the POME treatment system. The variable CO2 is representative of CO
2e emission from the POME treatment system and from the boiler as formulated in Equation 1. While Equation 2 and Equation 3 were formulated to monitor BOD and COD levels of each treatment system.
Equation 4 to Equation 12 encapsulate the material conversion and material balance aspects, specifically addressing the transformation of FFB into various components of oil palm biomass. This comprehensive formulation encompasses the conversion processes at POMs and treatment facilities, accounting for the generation of POME, shell, and fibre. These equations serve as a structured representation of the intricate relationships and transformations involved in the conversion of FFB, providing a systematic approach to modelling and analyzing the material balance within the oil palm biomass conversion process.
Equation 13 to Equation 19 constitute a set of formulations dedicated to material conversion and balance, specifically addressing the conversion of POME into biogas, liquid fertilizer, and waste within the POME treatment facility. These equations meticulously capture the intricate processes involved in transforming POME, providing a systematic representation of the material balance throughout the conversion stages. This formulation is crucial for modelling and analyzing the efficient utilization of POME resources, guiding the optimization of the treatment process for the generation of biogas, liquid fertilizer, and appropriate waste management.
2.3. Case Study and Data Set
A case study was selected involving the Barema Palm Oil Mill, which utilizes the Anaerobic Digestion Tank (ADT) and Pond system, and the Kumbango Oil Mill, which employs the Covered Lagoon System. Within this context, the identified constraints and assumptions were applied, with a particular focus on the hourly processing capacity of the POM in terms of processed palm kernel oil and POME. Data required for the model were gathered from the case studies, research articles, and relevant authorities.
Table 1.
Economic parameters feature of POME treatment system (Case Study).
Table 1.
Economic parameters feature of POME treatment system (Case Study).
| Feature |
Unit |
Open Pond System (OP) |
Covered Lagoon (CL) |
Anaerobic Digestion Tank (ADT) |
| Capital Cost (CAPEX) |
USD |
4,000,000 |
6,000,000 |
9,000,000 |
| Operation and Maintenance Cost |
USD/year |
120,000 |
180,000.00 |
270,000 |
| Potential biogas generation |
m³/m³ of POME |
- |
21 |
21 |
| Potential Electricity generation |
kWh/ m3 biogas |
- |
2.29 |
2.29 |
Table 2.
Environmental parameters feature of POME treatment system (Case Study).
Table 2.
Environmental parameters feature of POME treatment system (Case Study).
| Source/Process |
BOD reduction (%) |
COD reduction (%) |
CO2eValue (CO2e /unit material) |
| Pond System |
57 |
74 |
0.3125 |
| Covered Lagoon System |
72 |
78 |
0.0313 |
| ADT System |
88 |
85 |
0.0156 |
| Biomass Boiler |
- |
- |
1.5085 |
| Biogas Engine |
- |
- |
0.0021 |
2.4. Optimization Tools
For this study, the General Algebraic Modeling System (GAMS) software, version 40.1.0, was used as an optimization tool. As compared to a GAMS based research approach, it is reasonable since the main objective of this research was to address the challenges against the palm oil mills (POMs) by means of an optimization model. One of its strengths is that it can bring relational database theory together with mathematical programming to form an attractive niche for strategic modelers. What optimization does under specific conditions is maximize or minimize some given function, called the objective function, subject to certain constraints.
In addition, GAMS is a highly regulated and highly developed modeling system including a compiler supporting several languages as well as a large set of high-performance solvers. The contextual challenge in this setting is to provide an in tensional description of the technologies and system boundaries. As the number of variables for which the system can model is large, and the linear modeling approach requires compromise between model detail and computational efficiency, a balance is required between model detail and computational efficiency.
3. Results and Discussion
The Green Mode model has been translated into code using the GAMS, focusing on the objective of minimizing the environmental parameters including BOD, COD and CO2e emission within the pome treatment system. This resource offers an in-depth exploration of the model's coding structure, facilitating its application and execution with the primary goal of minimizing the environmental impact of the treatment system.
3.1. Optimal Material and Energy Flow
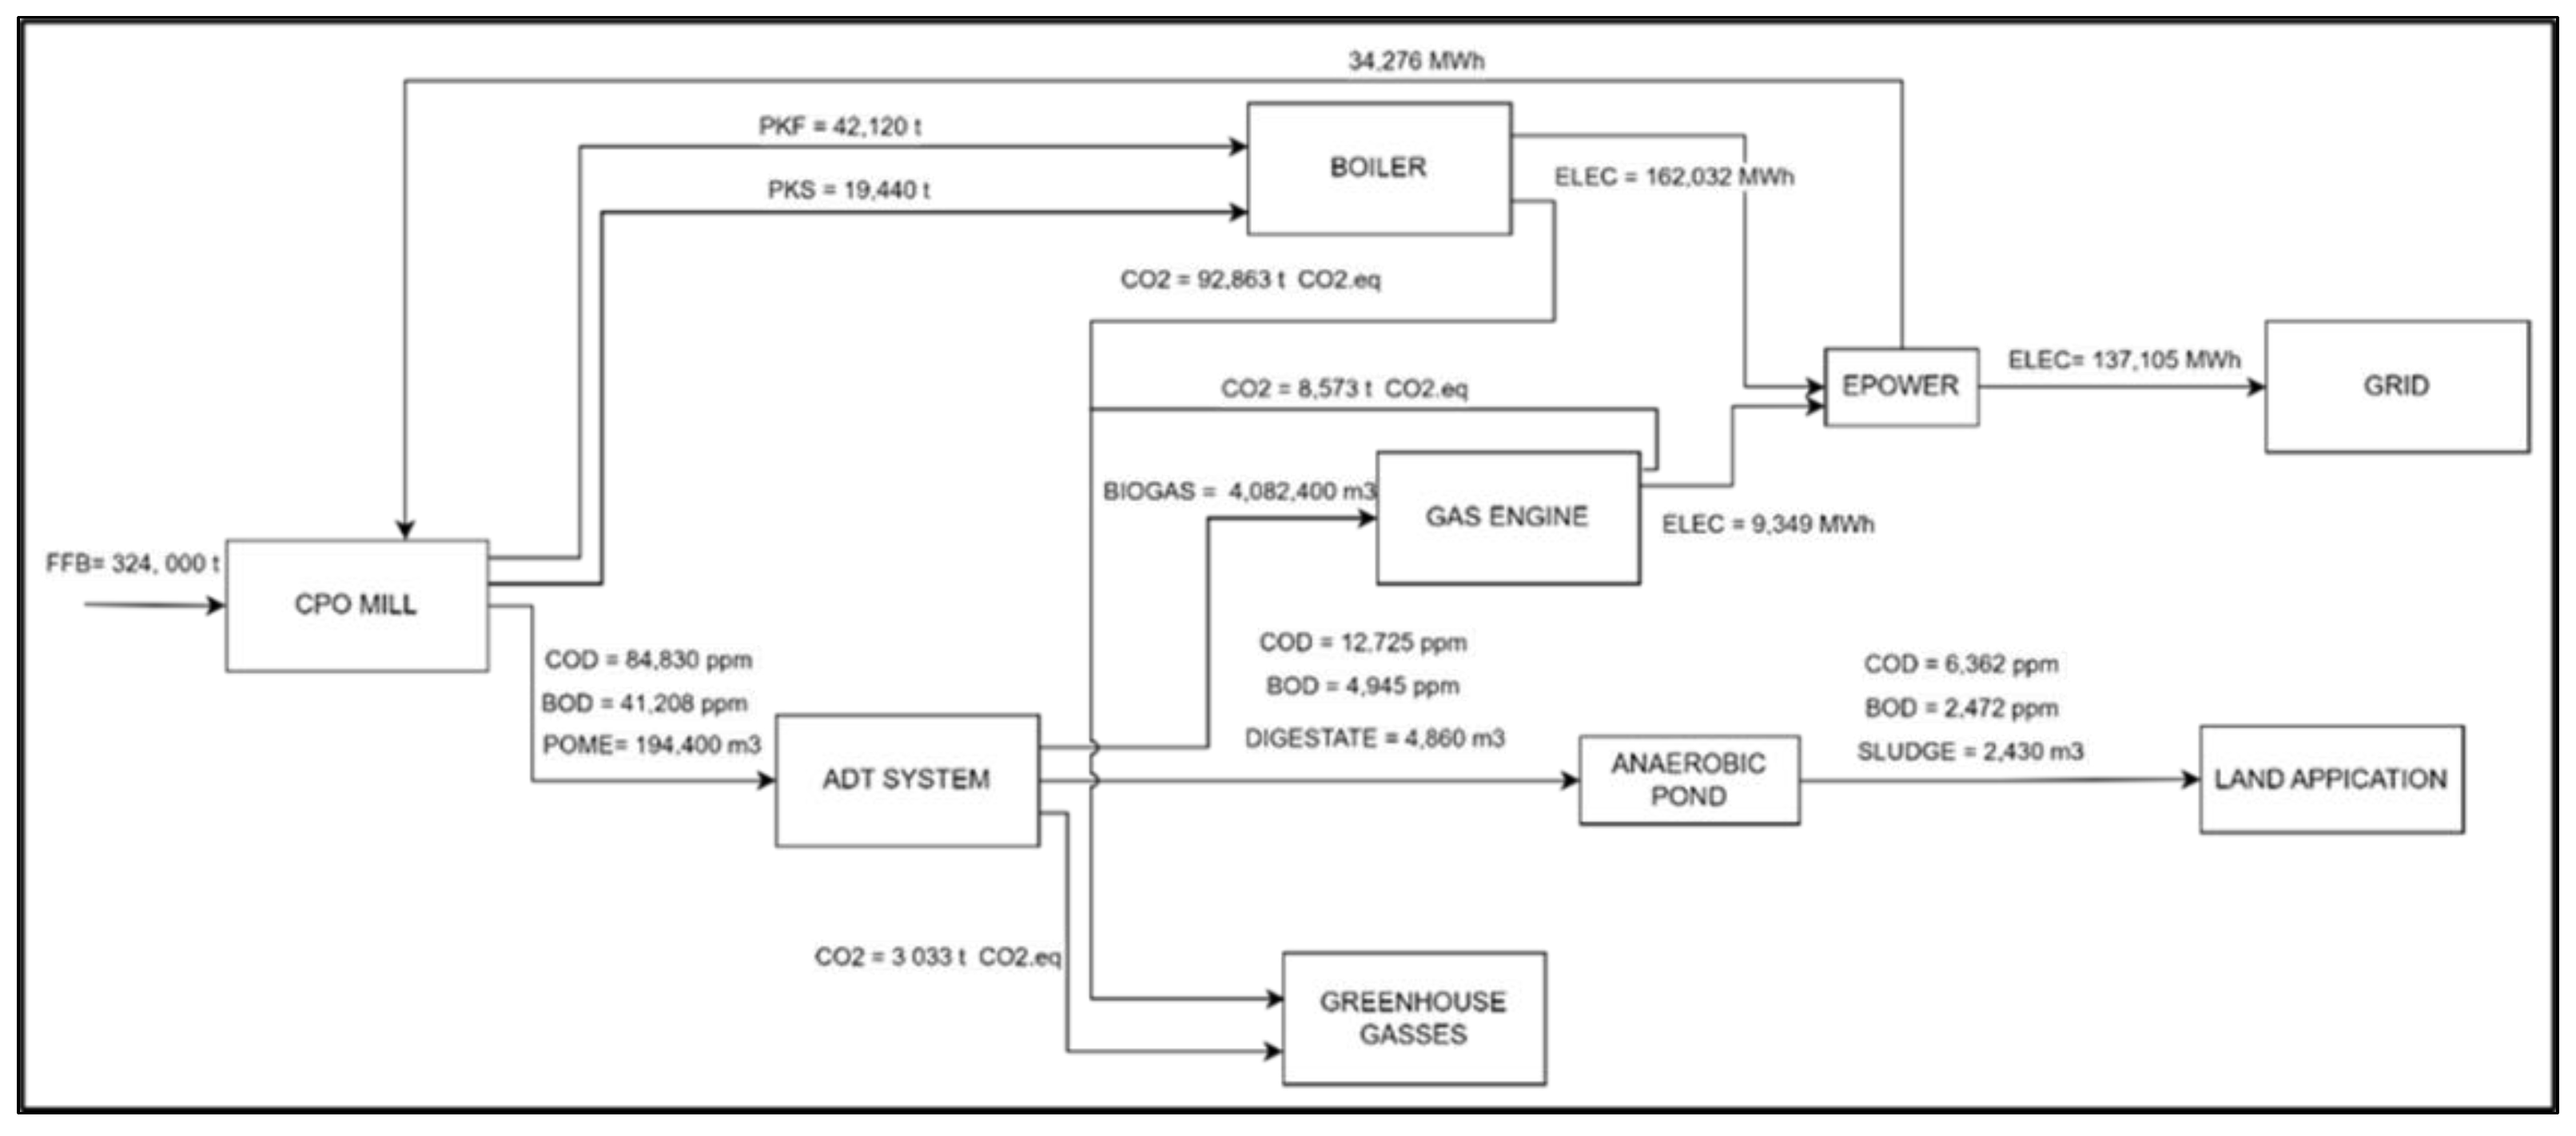
The analysis of environmental parameters, specifically BOD values after the POME treatment systems, reveals distinct outcomes. From
Figure 2, the model has identified the ADT treatment system as optimal for minimizing BOD in environmental impacts. Notably, the ADT system demonstrates an 88% reduction in BOD, resulting in a BOD reduction level from 41,208 mg/L to 4,945 mg/L. The BOD was then reduced from 4,945 mg/L to 2,472 mg/L or 50% through an anaerobic pond system. To minimize the COD parameter, the model output also selected the ADT treatment system, registering an 85% reduction rate from 84,830 mg/L to 12,725 mg/L (see
Figure 3). The final COD was about 6,362 mg/L after anaerobic pond system treatment. This result is proved in the literature review on the performance of different biogas technologies presented by ADT treatment systems in minimizing COD by around 91% [
15]. The optimal flows of BOD and COD parameters were similar as the model designates ADT as the most profitable POME treatment system. With an annual FFB production of 324,000 metric tons, the generated POME tends to be 194,400 m3 with potential yields of 4,082,400 m3 of biogas, translating to a potential electricity generation of 9,349 megawatts (MWh) with a total profit of USD 9,769, 439 annually.
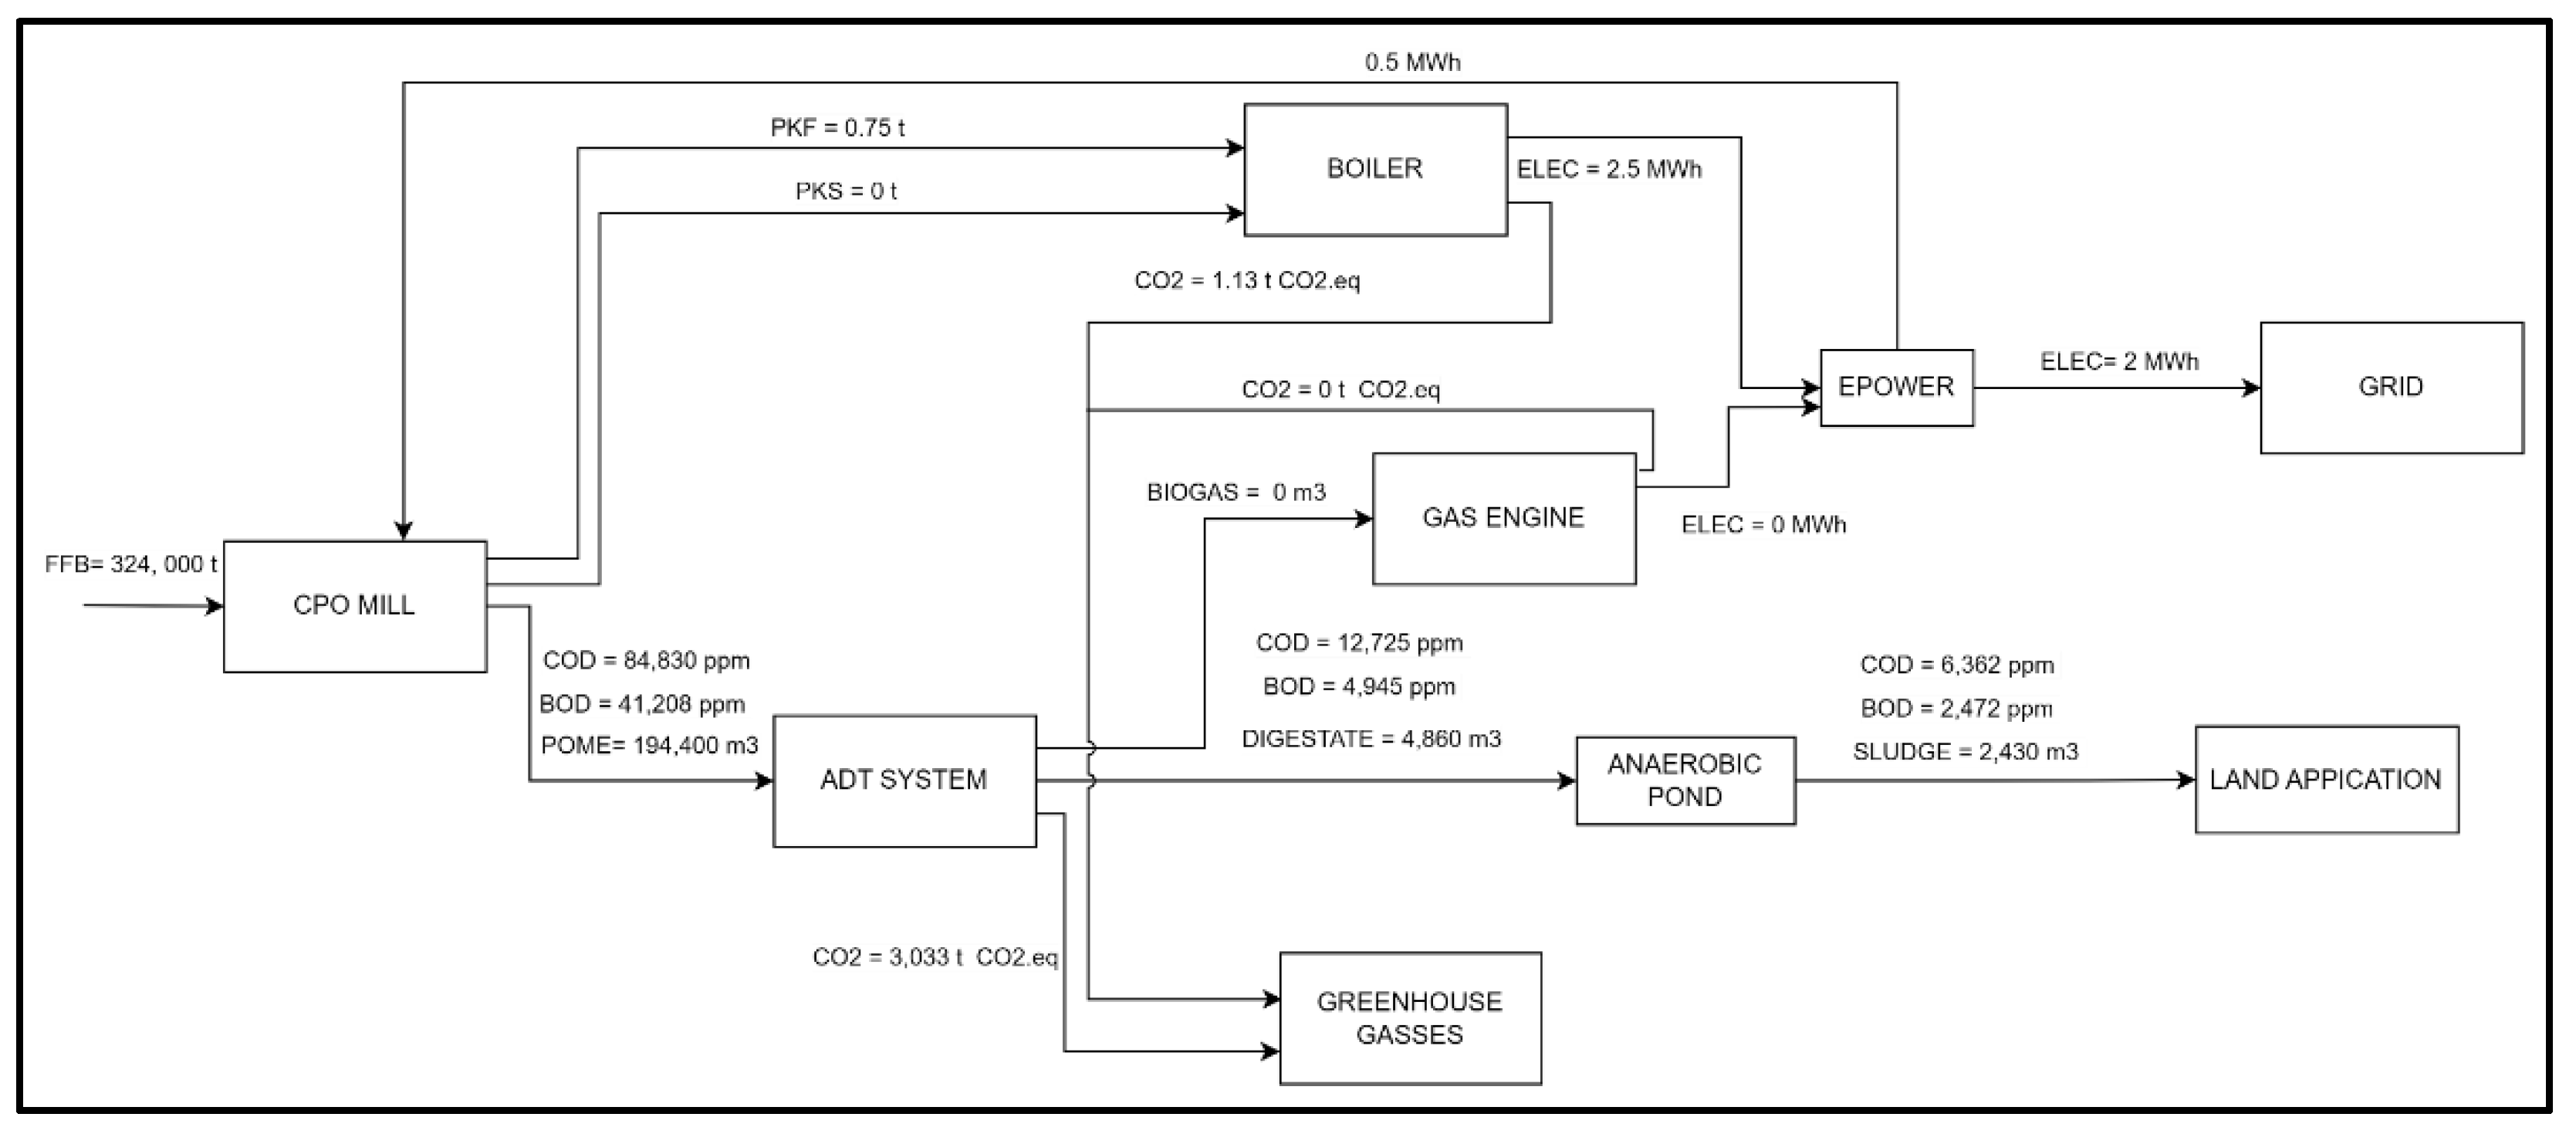
Another crucial environmental parameter to be minimized was the amount of CO2e emission. The minimum CO
2e emission that can be archived was about 3,034 t CO2e per annum. Most of the CO
2e emission was calculated from the selected ADT system, while only less than 1% was measured from the boiler emission as shown in
Figure 4. Compared to previous scenarios of minimizing BOD and COD, the CO
2e emission was slightly reduced from 104,469 t CO2e to 3,034 t CO
2e or about 35 times. This is due to the model suggested to reduce electricity production from the boiler as the model aims to reduce CO2e emissions. Anyhow in other studies showed that up-flow anaerobic sludge blankets is produced 4.76 million tons of CO2e emissions compared with CL and integrated anaerobic-aerobic bioreactor system [
16].
3.2. Economic Parameters
The model has identified the ADT system as the optimal treatment system for minimizing BOD, COD and CO
2e emissions, underscoring its environmental advantages. The profit of 9,769,439 USD/yr was able to be secured even though the model minimized the BOD and COD values. In this context, total sales were about 12,399,439 USD/yr with the capital cost constituting approximately 18.55 % of the total sales, reflecting a cost-effective aspect in the overall profitability of the selected treatment systems (
Table 3). The calculated ROI was about 109 % with a payback period of less than 1 year for both BOD and COD scenarios. Biogas production from the POME is economically viable as similar trend reported by [
7]. However, the model optimally reduces the production of electricity to minimize the CO
2e emission under the minimizing CO
2e emission scenario. Thus, an annual profit was only RM-2.37 million just to meet a minimum electricity supply of 2,000 megawatts to the grid through electricity generation from the boiler. There is negative or no ROI and payback period in the CO
2e emission scenario due to the model focusing the objective on the CO
2e emission rather than profit. The amount of CO
2e emission and profit should find a balance on both environmental and economic goals [
17].
3.3. Sensitivity Analysis on BOD Ratio
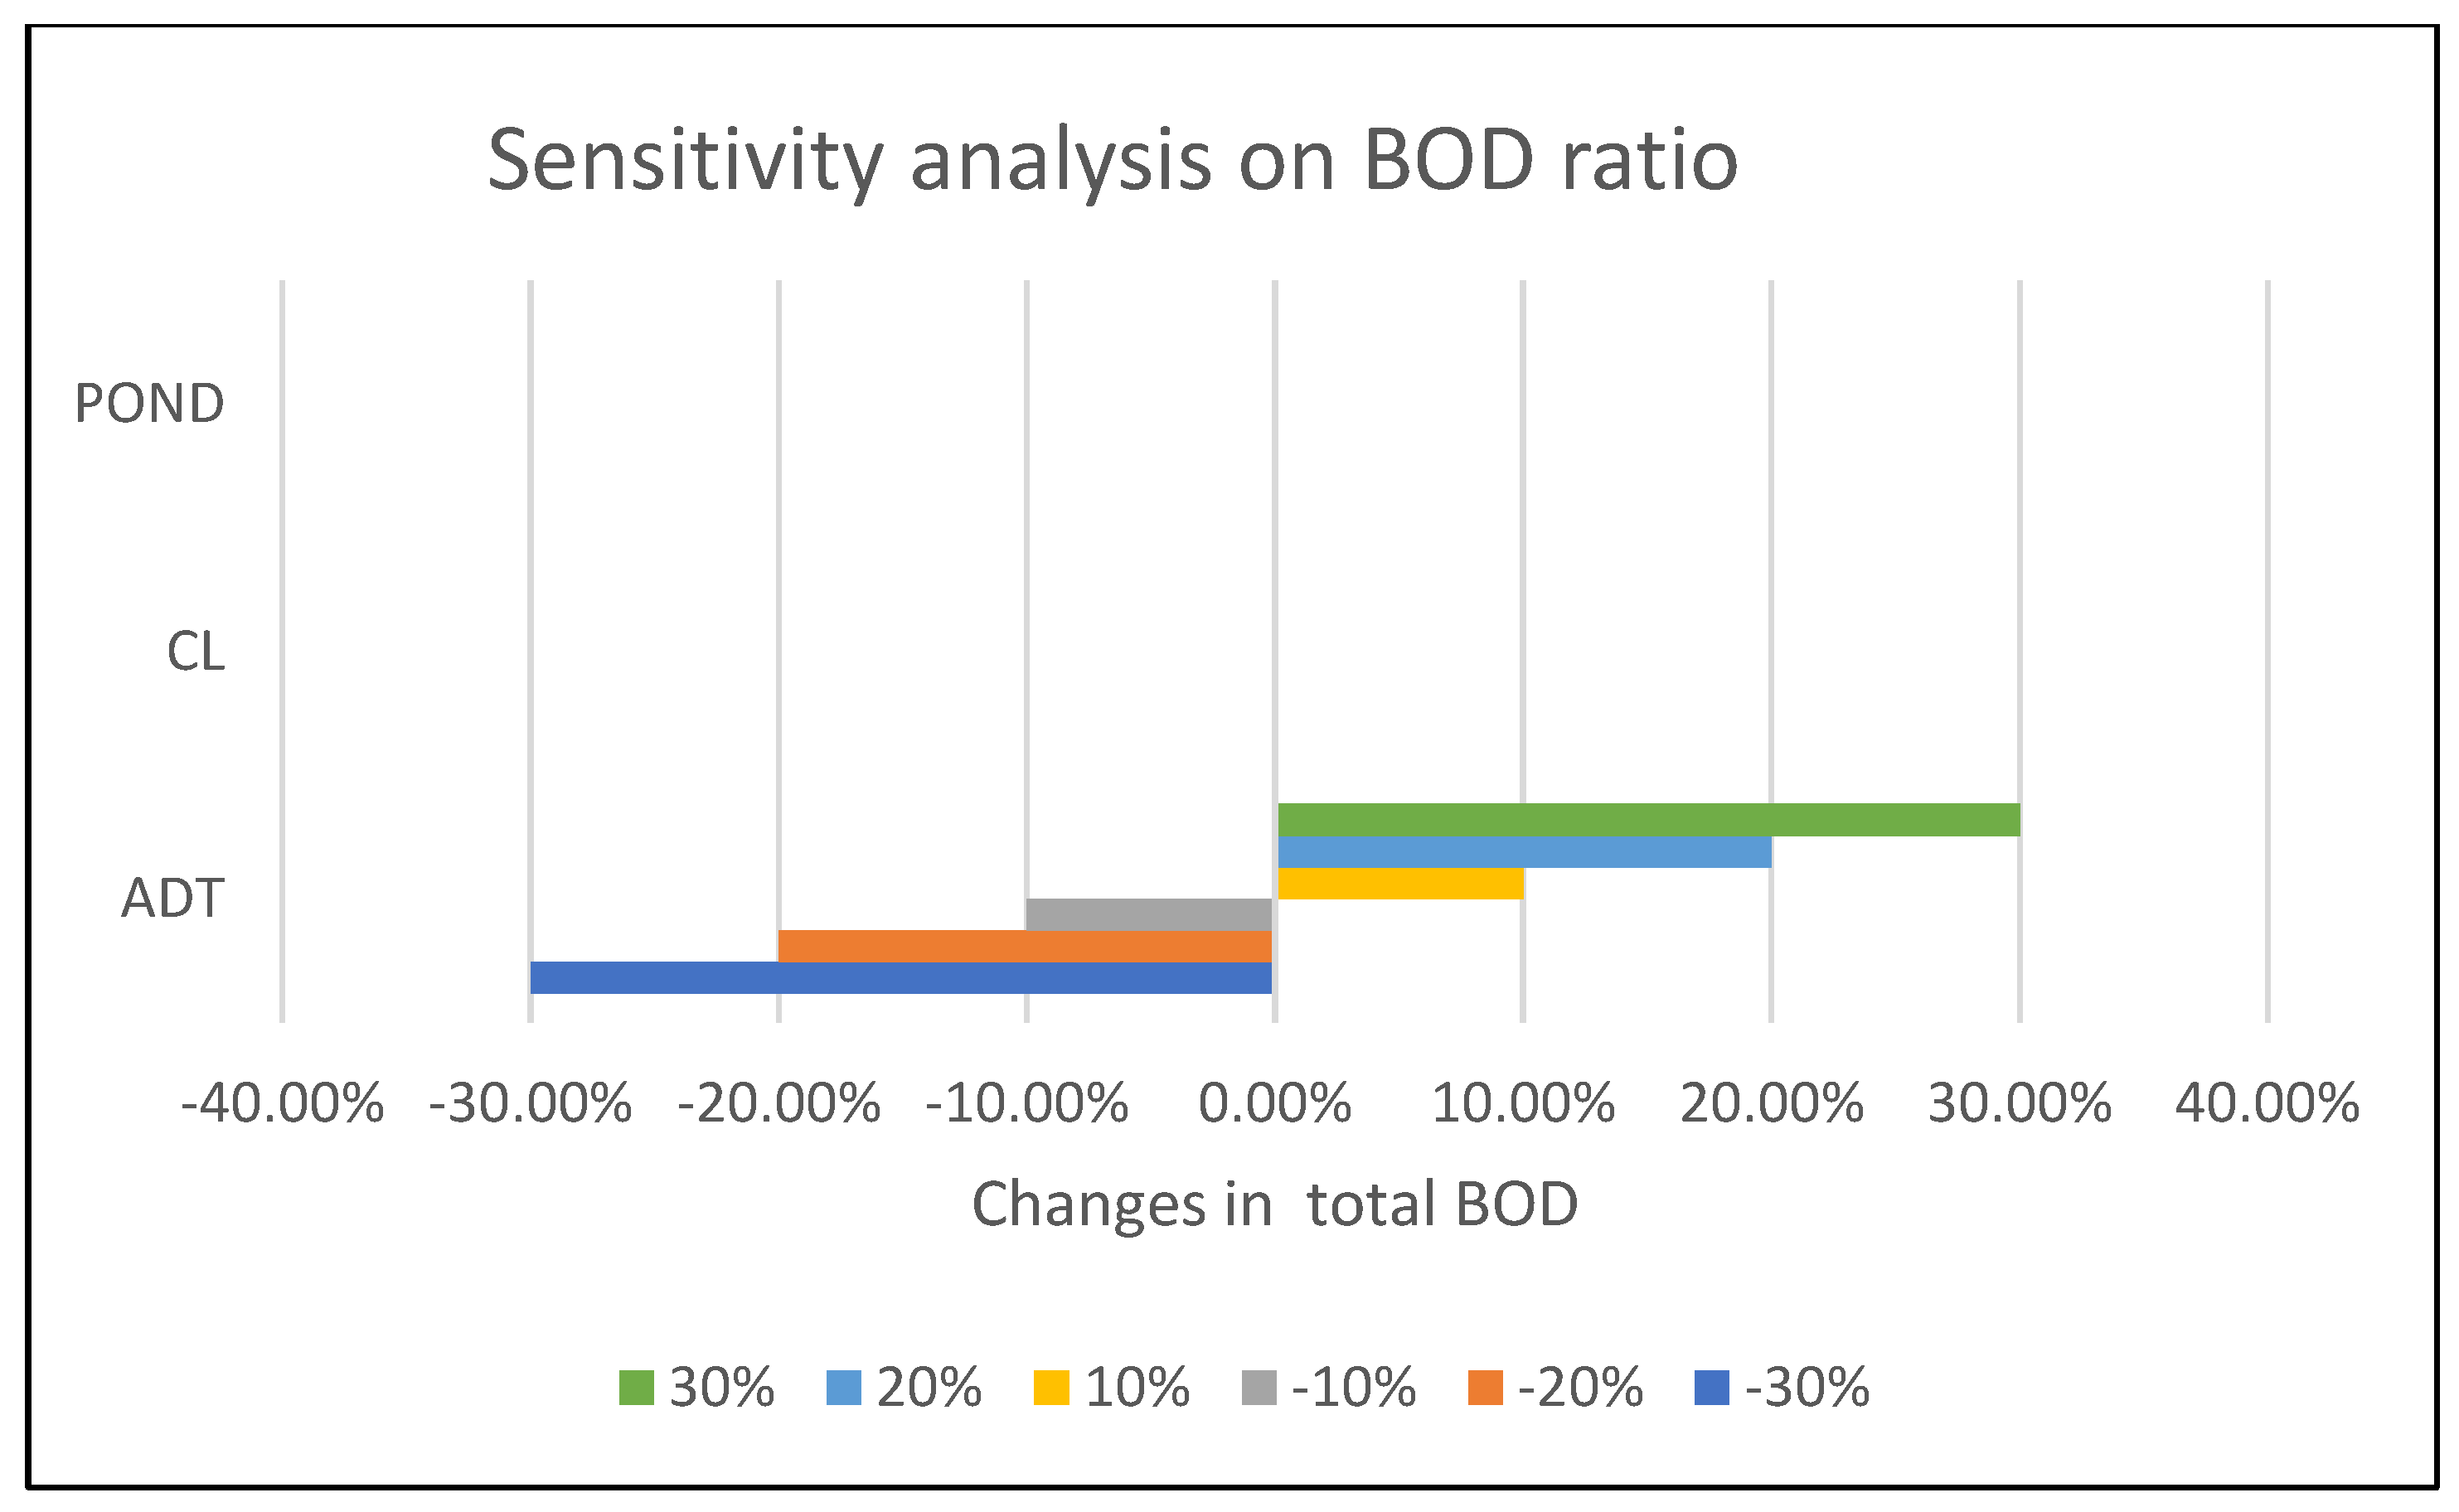
The sensitivity analysis highlights the significant influence of the BOD ratio on the ADT system, as evidenced by a 30% variation in the total BOD. This finding corroborates the model's identification of ADT as the optimal treatment system.
Figure 5 illustrates a linear relationship between the total BOD and the BOD ratio, indicating that a 10% increase in the BOD ratio results in a 10% increase in the total BOD value, and vice versa. Conversely, the total BOD remains relatively constant despite variations in the BOD ratio for the OP and CL systems, demonstrating their insensitivity to changes in this parameter. This insensitivity is further supported by the model's selection of the ADT system, even in the presence of ±30% fluctuations in the BOD parameter for the CL and pond systems.
3.4. Sensitivity Analysis on COD Ratio
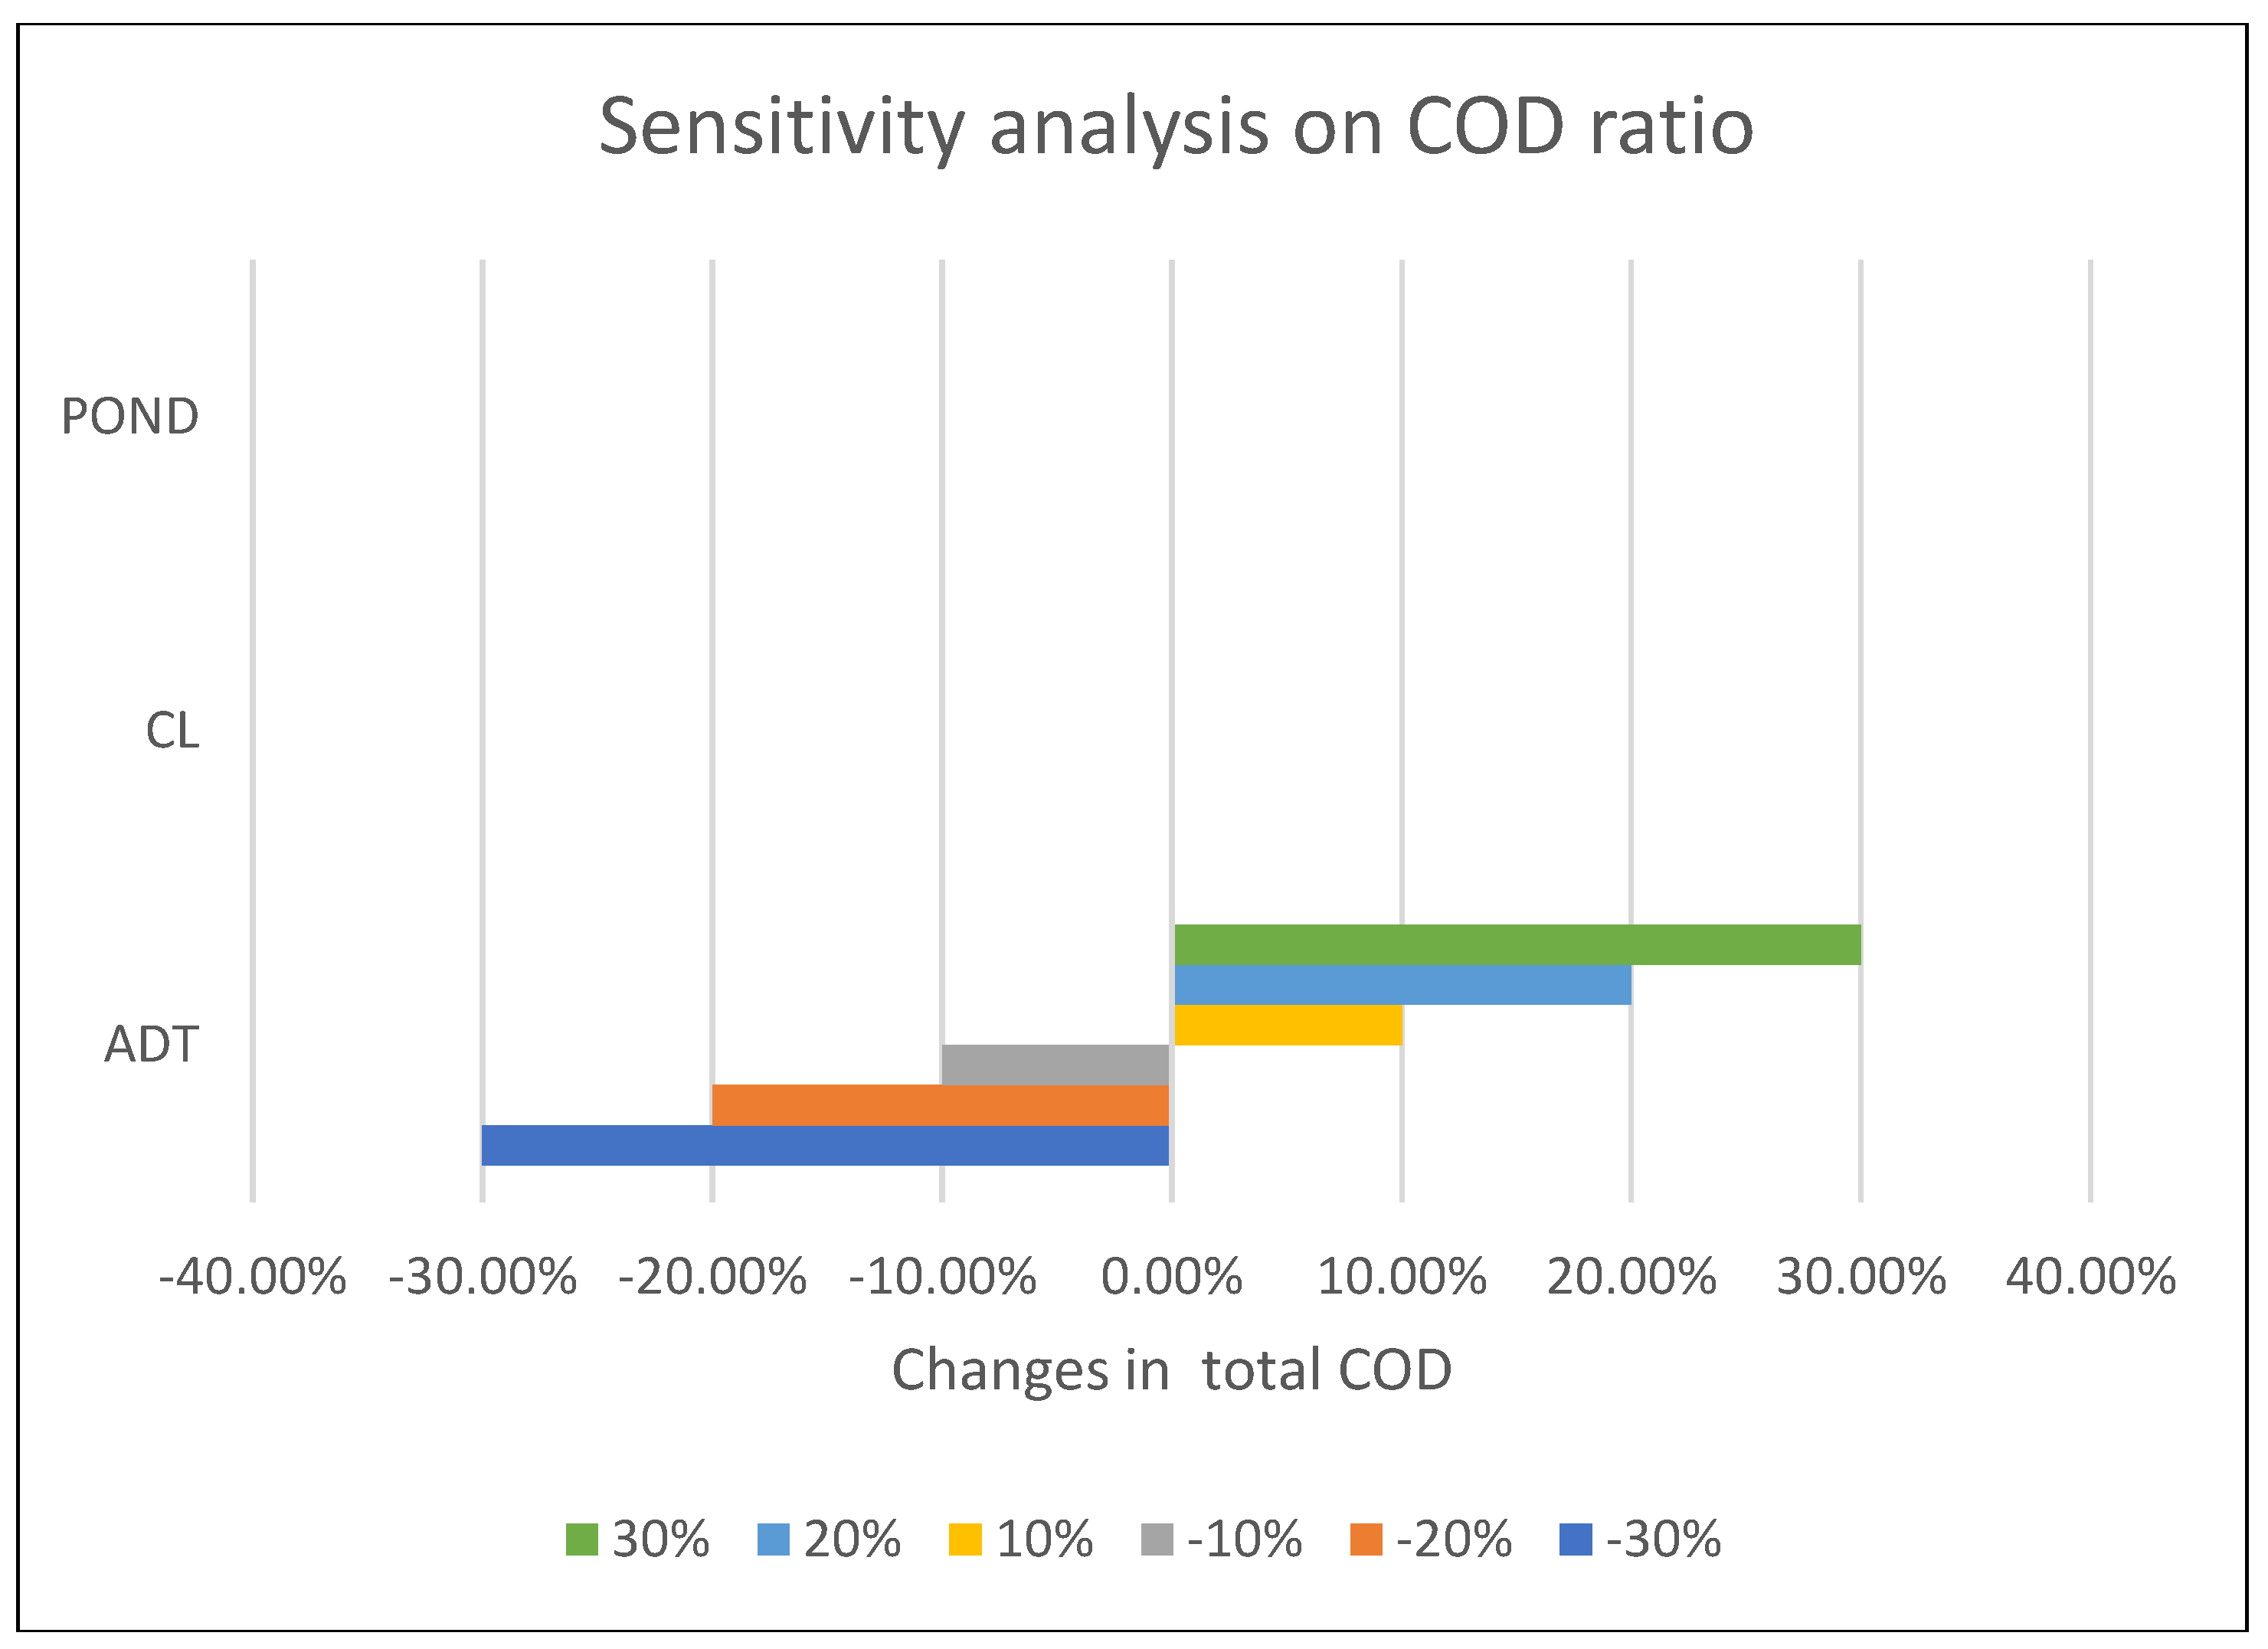
The sensitivity analysis highlights the significant impact of the COD ratio on the ADT system, underscoring its influence on total COD.
Figure 6 illustrates a linear relationship between the total COD and the COD ratio, indicating that a 10% increase in the COD ratio results in a 10% increase in the total COD value, and vice versa. It is noteworthy that the total COD remains unaltered with fluctuations in the COD ratio for the OP and CL systems, indicating their relative insensitivity in terms of the COD parameter. This is due to the model that selects the ADT system even if there are ± 30% changes in the COD parameter for the CL and pond system.
3.5. Sensitivity Analysis on CO2e
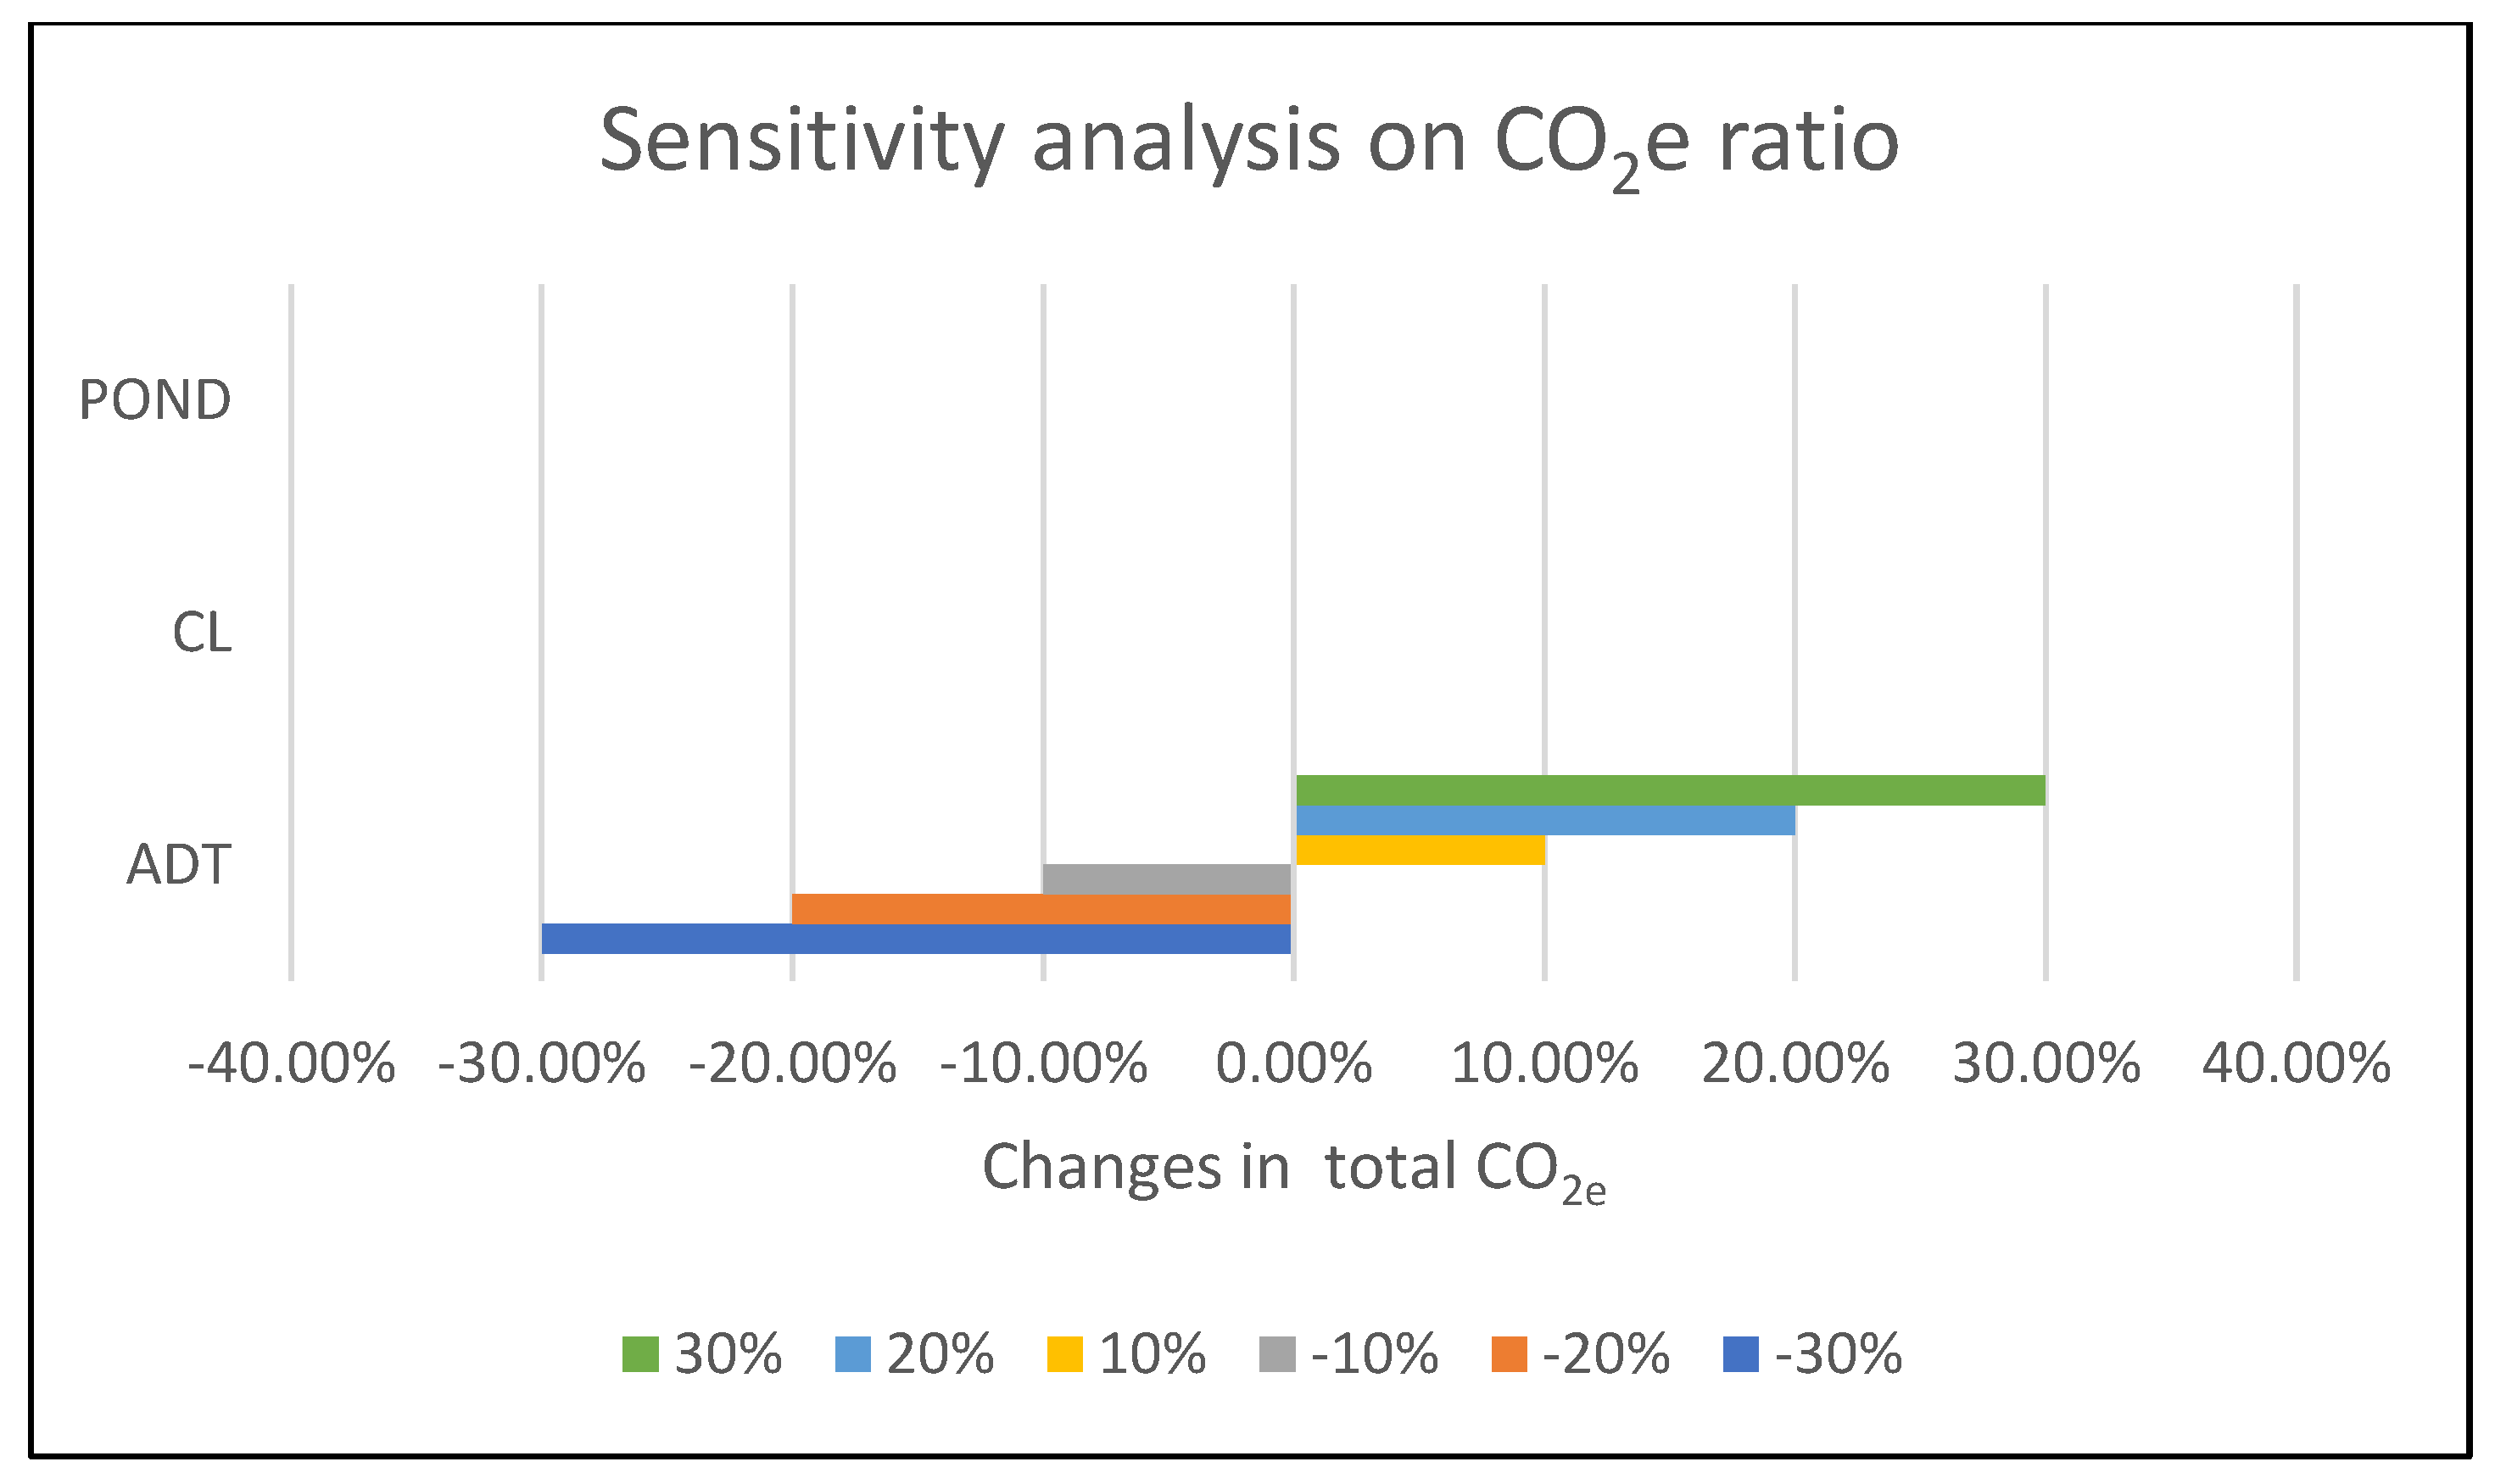
The sensitivity analysis reveals that the ratio of CO
2e emissions in the ADT treatment system exerts the most significant impact, causing a 30% change in total CO
2e emission (
Figure 7). A linear relationship can be found between CO
2e emissions ration and the total CO
2e emissions. Given the model's selection of ADT as the optimal treatment system, the ratio of CO2e emissions for the OP and CL systems does not influence profitability, as biogas production is exclusively derived from the ADT system. This emphasizes the crucial role of the selected treatment system in determining the sensitivity of environmental parameters.
4. Conclusions
The developed model, namely as Green Mode Model has been formulated and optimized to minimize the environmental parameters. The Green Mode Model's pursuit of minimizing environmental parameters included COD, BOD and CO2e. The model has selected the ADT treatment system, which exhibits the lowest COD, BOD and CO2e emissions. Specifically, the COD registered an 85% reduction rate from 84,830 mg/L to 12,725 mg/L. The BOD level was reduced by 88% resulting in a BOD level from 41,208 mg/L to 4,945 mg/L. The minimum CO2e emission that can be archived was about 3,034 t CO2e per annum. The sensitivity analysis highlights the significant influence of the COD, BOD ratio and CO2e ratio on the ADT system, as evidenced by a 30% variation in the total changes.
List of Symbols
| Indices |
Description |
|
Index for primary process |
|
Index for POME treatment system |
|
Index for secondary process |
|
Index for electricity power generation |
|
Index for product/by-product application |
|
Index for CO2eq emission |
| Parameters |
|
|
Capital cost at treatment system p per year in USD/yr |
|
Biogas generation scale at p to n
|
|
Fertilizer generation scalar at p to s
|
|
Waste generation scalar at n to s |
|
Electricity price for internal usage in USD/kWh |
|
Electricity price for external usage in USD/kWh |
|
Amount of fresh fruit bunches at m in tons/yr |
|
Maintenance cost at treatment system p per year in USD/yr |
|
Fibre conversion ratio at m |
|
Shell conversion ratio at m |
|
POME conversion ratio at m |
| Continuous Variables |
|
|
Amount of biogas generates from p to n in m3/yr |
|
Amount of biogas generates at gase in m3/yr |
|
Total annual capital cost in USD/yr |
|
Amount of annual CO2 equivalent |
|
Amount of annual maximum CO2 equivalent |
|
Amount of annual minimum CO2 equivalent |
|
Amount of electricity generates at boiler in kWh/yr |
|
Amount of electricity transfer from j to s in kWh/yr |
|
Amount of electricity transfer from j to m in kWh/yr |
|
Amount of fibre generated at m |
|
Amount of fibre available at n
|
|
Amount of fibre transfer from m to n in tons/year |
|
Amount of liquid fertiliser transferred from pond land in ton/yr |
|
Amount of POME generated at m in ton/yr |
|
Degree of satisfaction |
|
Total annual maintenance cost in USD/yr |
|
Amount of POME at p in ton/yr |
|
Amount of POME at p in ton/yr |
|
Amount of annual profit in USD/yr |
|
Amount of maximum annual profit in USD/yr |
|
Amount of minimum annual profit in USD/yr |
|
Amount of annual sales from electricity generation in USD/yr |
|
Amount of shell produces at m in ton/yr |
|
Amount of shell at n in ton/yr |
|
Amount of shell transfer from m to n in ton/yr |
|
Amount of digestate transfer from p to n in ton/yr |
|
Amount of digestate at n in ton/yr |
| Binary Variables |
|
|
Selection of POME treatment system |
References
- R. T. Ayinla, J. O. Dennis, H. M. Zaid, Y. K. Sanusi, F. Usman, and L. L. Adebayo, ‘A review of technical advances of recent palm bio-waste conversion to activated carbon for energy storage’, J Clean Prod, vol. 229, pp. 1427–1442, 2019. [CrossRef]
- N. A. Lokman, A. M. Ithnin, W. J. Yahya, and M. A. Yuzir, ‘A brief review on biochemical oxygen demand (BOD) treatment methods for palm oil mill effluents (POME)’, Environ Technol Innov, vol. 21, p. 101258, 2021. [CrossRef]
- J. W. R. Chong et al., ‘Simulation and optimisation of integrated anaerobic-aerobic bioreactor (IAAB) for the treatment of palm oil mill effluent’, Processes, vol. 9, no. 7, pp. 1–19, 2021. [CrossRef]
- Kushairi et al., ‘Oil palm economic performance in Malaysia and r&d progress in 2017’, J Oil Palm Res, vol. 30, no. 2, pp. 163–195, 2018. [CrossRef]
- M. M. Bello, A. A. Abdul Raman, and A. Asghar, ‘A review on approaches for addressing the limitations of Fenton oxidation for recalcitrant wastewater treatment’, Process Safety and Environmental Protection, vol. 126, pp. 119–140, 2019. [CrossRef]
- Y. Y. Choong, K. W. Chou, and I. Norli, ‘Strategies for improving biogas production of palm oil mill effluent (POME) anaerobic digestion: A critical review’, Renewable and Sustainable Energy Reviews, vol. 82, no. November 2017, pp. 2993–3006, 2018. [CrossRef]
- X. Lok, Y. J. Chan, and D. C. Y. Foo, ‘Simulation and optimisation of full-scale palm oil mill effluent (POME) treatment plant with biogas production’, Journal of Water Process Engineering, vol. 38, no. August, p. 101558, 2020. [CrossRef]
- N. Sinaga, S. B. Nasution, and M. Mel, ‘Process optimization of biogas production from palm oil mill effluent: A case study of a crude palm oil factory in Muaro Jambi, Indonesia’, Journal of Advanced Research in Fluid Mechanics and Thermal Sciences, vol. 49, no. 2, pp. 155–169, 2018.
- S. Krishnan et al., ‘Accelerated two-stage bioprocess for hydrogen and methane production from palm oil mill effluent using continuous stirred tank reactor and microbial electrolysis cell’, J Clean Prod, vol. 229, pp. 84–93, 2019. [CrossRef]
- Y. M. Alkusma, H. Hermawan, and H. Hadiyanto, ‘Pengembangan Potensi Energi Alternatif Dengan Pemanfaatan Limbah Cair Kelapa Sawit Sebagai Sumber Energi Baru Terbarukan Di Kabupaten Kotawaringin Timur’, Jurnal Ilmu Lingkungan, vol. 14, no. 2, p. 96, 2016. [CrossRef]
- L. H. S. Putro, ‘Emissions of CH4 and CO2 from Wastewater of Palm Oil Mills: A Real Contribution to Increase the Greenhouse Gas and Its Potential as Renewable Energy Sources: 10.32526/ennrj/20/202100149’, Environ Nat Resour J, vol. 20, no. 1 SE-Original Research Articles, pp. 61–72, Nov. 2021, [Online]. Available: https://ph02.tci-thaijo.org/index.php/ennrj/article/view/245510.
- S. E. Hosseini and M. A. Wahid, ‘Pollutant in palm oil production process’, J Air Waste Manage Assoc, vol. 65, no. 7, pp. 773–781, 2015. [CrossRef]
- E. I. Ohimain and S. C. Izah, ‘A review of biogas production from palm oil mill effluents using different configurations of bioreactors’, Renewable and Sustainable Energy Reviews, vol. 70, no. November 2016, pp. 242–253, 2017. [CrossRef]
- W. Y. Lam, M. Kulak, S. Sim, H. King, M. A. J. Huijbregts, and R. Chaplin-Kramer, ‘Greenhouse gas footprints of palm oil production in Indonesia over space and time’, Science of the Total Environment, vol. 688, pp. 827–837, 2019. [CrossRef]
- Sodri and F. E. Septriana, ‘Biogas Power Generation from Palm Oil Mill Effluent (POME): Techno-Economic and Environmental Impact Evaluation’, Energies (Basel), vol. 15, no. 19, 2022. [CrossRef]
- D. K. S. Ng, S. L. X. Wong, V. Andiappan, and L. Y. Ng, ‘Mathematical optimisation for sustainable bio-methane (Bio-CH4) production from palm oil mill effluent (POME)’, Energy, vol. 265, no. November 2022, 2023. [CrossRef]
- M. K. Lee, H. Hashim, J. S. Lim, and M. R. Taib, ‘Spatial planning and optimisation for virtual distribution of BioCNG derived from palm oil mill effluent to meet industrial energy demand’, Renew Energy, vol. 141, pp. 526–540, 2019. [CrossRef]
|
Disclaimer/Publisher’s Note: The statements, opinions and data contained in all publications are solely those of the individual author(s) and contributor(s) and not of MDPI and/or the editor(s). MDPI and/or the editor(s) disclaim responsibility for any injury to people or property resulting from any ideas, methods, instructions or products referred to in the content. |
© 2024 by the authors. Licensee MDPI, Basel, Switzerland. This article is an open access article distributed under the terms and conditions of the Creative Commons Attribution (CC BY) license (http://creativecommons.org/licenses/by/4.0/).
