Preprint
Article

Sepiolite–Chitosan–Acetic Acid Biocomposite Attenuates the Development of Obesity and Nonalcoholic Fatty Liver Disease in Mice Fed a High-Fat Diet

This version is not peer-reviewed.

Submitted:

12 October 2024

Posted:

14 October 2024

You are already at the latest version

A peer-reviewed article of this preprint also exists.

Abstract
Background/Objectives: Obesity and nonalcoholic fatty liver disease (NAFLD) reduce life expectancy; nonoperative interventions show poor results. Individually, chitosan, acetic acid (AA), and sepiolite clay attenuate high-fat diet-induced obesity (DIO) via reduced energy digestibility and increased energy expenditure. We hypothesized that a chitosan–sepiolite biocomposite suspended in AA would attenuate DIO and NAFLD to a greater extent than AA alone via its more substantial adsorption of nonpolar molecules; Methods: We tested this dietary supplement in C57BL/6J mice fed a high-fat diet, compared to supplementation of a bile-acid sequestrant (cholestyramine) and standalone AA; Results: Biocomposite supplementation attenuated DIO rate and NAFLD progression, whereas standalone AA showed mild attenuation of DIO gain and did not prevent HFD-induced hepatic fat accumulation. Biocomposite intake was accompanied by a decreasing digestibility trend counterbalanced by increased intake; hence, it did not affect energy absorption; Conclusions: Therefore, DIO attenuation was suggested to be related to higher energy expenditure, a phenomenon not found with AA alone, as supported by calculated energy expenditure using the energy-balance method. These results support further investigation of the biocomposite’s efficacy in attenuating obesity and NAFLD, specifically when applied with a restricted diet. Future studies are needed to determine this biocomposite's safety, mechanism of action, and efficacy compared to its components given separately or combined with other ingredients.
Keywords: 
Subject: 
Biology and Life Sciences  -   Endocrinology and Metabolism

1. Introduction

The prevalence of metabolic syndrome (MetS), which includes diabetes, obesity, atherogenic hypercholesterolemia, hypertension, and nonalcoholic fatty liver disease (NAFLD), is considered to be at pandemic levels [1]. Due to the syndrome's complexity, drug therapy includes different treatments tackling different mechanisms. For example, obesity is treated by reducing energy (lipid) absorption (e.g., orlistat [2]) or by lowering appetite and increasing energy expenditure (e.g., liraglutide [3]). Similarly, hypercholesterolemia is treated by different mechanisms: reducing endogenous cholesterol production (e.g., statins, which are not well-tolerated at high doses [4]), increasing liver uptake of blood cholesterol (e.g., PCSK9 inhibitors [5]), or reducing intestinal reuptake of cholesterol-based negatively charged bile salts (e.g., positively charged bile acid sequestrants (BAS) such as cholestyramine [6]). For NAFLD, there is no specific approved pharmacological therapy; hence, some of the aforementioned glucose- and lipid-lowering agents have been investigated for NAFLD treatment [7]. Combined therapies suffer from a high potential for drug-drug interactions [8]. Thus, a single drug therapy for MetS would be of high value. Notably, BAS has been recently suggested as a possible treatment for several MetS traits, including hypercholesterolemia, diabetes, obesity, and NAFLD [9,10].
Like BAS, chitosan, a cationic biopolymer produced from chitin and further ionized by acetic acid (AA), has been reported as an indigestible compound that can adsorb bile acids in vitro [11]. In addition, in vivo dietary supplementation of chitosan, even without AA ionization, attenuated high-fat diet (HFD)-induced obesity (DIO), hypercholesterolemia, and hypertriglyceridemia, with a parallel increase in fecal fat and bile acids, without affecting food intake [12,13,14]. However, there is some inconsistency in the reported studies, showing reduced serum cholesterol levels with no increment in fecal bile excretion [15,16]. Moreover, clinical trials have demonstrated similar discrepancies [17,18]. These controversial reports might be explained, at least in part, by an insufficient association between chitosan and bile acids in the gut in vivo, resulting in an altered fecal bile acid profile rather than increased bile acid excretion [15]. Thus, increasing chitosan's affinity may improve its in-vivo efficiency.
The efficiency of chitosan can be increased by generating a chitosan–clay biocomposite (Bc) that exhibits biocompatibility, to serve as a nontoxic Bc for drug delivery [19] and tissue engineering [20]. Nevertheless, even clay alone, e.g., montmorillonite, reduces intestinal cholesterol absorption, plasma cholesterol, and obesity rates in vivo [21,22,23,24,25], and was clinically found to be safe for short-term consumption by adults [26,27,28] and children [29]. Using sepiolite, a needle-like clay, may enhance these anti-MetS properties. Sepiolite is a more efficient sorbent than montmorillonite for crude and edible oils [30,31,32,33]. Moreover, in vivo, dietary sepiolite attenuates DIO and lowers blood cholesterol and triglyceride levels, compared to untreated HFD-fed mice, due to higher fecal extraction of lipids and sterols—supporting its role as a gastrointestinal absorber of these compounds [30]. Generating a chitosan–sepiolite Bc may further increase sepiolite’s anti-MetS properties by reducing intestinal lipid digestion and reabsorption of the polar anionic bile, as indicated by its ability to attenuate emulsification of an oil–bile salt suspension in vitro due to absorption of the bile salts [34].
Notably, chitosan's affinity is known to be enhanced by dissolution in a 1% AA solution, resulting in positively charged chitosan biopolymers [35,36]. In vivo, AA also attenuates MetS independently [37,38,39,40,41,42,43]. For example, dietary supplementation of AA results in reduced hepatic triglyceride and fasting glucose levels in diabetic mice [37], inhibition of DIO [38,43], and a decrease in body weight, fat mass, and blood levels of triglyceride and cholesterol in HFD-fed mice [40]; this is due to an increase in energy expenditure and fat oxidation [42], usually with no change in energy intake [37,38,43] (but see [40]). Therefore, by generating a chitosan–sepiolite Bc suspended in AA to be used as a food supplement, we hypothesized that we would obtain a more pronounced attenuation of MetS. We tested this hypothesis in the following proof-of-concept study that explicitly investigated the dose-response effect of a chitosan–sepiolite–AA Bc food supplement in attenuating the development of several MetS traits, such as obesity, diabetes, and dyslipidemia in C57BL/6J mice fed a HFD for 18 weeks. This effect was compared with the impacts of BAS and AA, each administered alone and used as positive controls.

2. Materials and Methods

2.1. Biocomposite Preparation

A Bc suspension of sepiolite (<200 mesh, 99% purity, Tolsa S.A., Madrid, Spain), chitosan (medium molecular weight, 75–85% deacetylated, Sigma-Aldrich Israel, Jerusalem, Israel), and AA (Sigma-Aldrich Israel) was prepared as described in our previous work [44,45] at a 0.8:1 chitosan-to-sepiolite ratio in 1 N AA, giving final concentrations of 2.5% sepiolite and 2% chitosan (w/v) in 1 N AA. The final solution contained about 10.22% solids (w/v). The solution was mixed overnight at varying speeds to achieve homogeneity. The chitosan-to-sepiolite ratio of 0.8:1 was chosen because it de-emulsifies gut-like emulsions [23] to a greater extent than other ratios (e.g., 0.06:1, 0.2:1, 0.4:1, 0.6:1, and 1:1) [45,46].

2.2. Animals and Diets

The experiment was conducted in full compliance with the strict guidelines of the Israeli Animal Care and Use Committee (permission nos. IL-17-4-161 and IL-18-6-173). Fifty-four 12-week-old C57BL/6J (B6) male mice (Envigo, Jerusalem, Israel) were housed individually in a temperature-controlled facility (21–22 °C) with a 12 h light and 12 h dark cycle, and received water and rodent chow (2018S, Envigo Laboratories; energy density of 3.1 metabolizable kcal/g) ad libitum. Following 2 weeks of acclimation, mice were divided into six groups (n = 9 per group) with similar mean and standard error of the mean (SEM) body weight and body mass composition (i.e., fat percentage, fat mass, and lean mass). Each group was allocated to be fed ad libitum for 18 weeks on one of six custom-prepared diets (Table 1): 1) a low-fat control diet (LFD, with 9.3% metabolizable kcal from fat, based on TD.08806, Envigo); 2) a high-fat control diet (HFD, with 57.8% metabolizable kcal from fat, based on TD.06414, Envigo) to induce DIO; 3) a HFD to which 2% (w/w of dry dietary ingredients) cholestyramine was added (HFD+BAS), to be used as a positive control—having shown attenuated hypercholesterolemia and DIO in B6 mice due to bile acid sequestering [47,48,49]; 4) and 5) two experimental HFDs to which the sepiolite–chitosan–AA Bc was added at different doses [a low concentration of 0.8% Bc and a high concentration of 5% Bc (w/w of dry dietary ingredients, HFD+BcL and HFD+BcH, respectively)]; and 6) a HFD to which 3% (w/w of dry dietary ingredients) AA was added (HD+AA), serving as a control diet to detect the effect of the AA found in BcH.
The high Bc dose (5% w/w; BcH) was selected as it contains 1.2% sepiolite clay, lower than the maximum concentration of 2% in animal feed [50] and similar to the 1.4% dose of montmorillonite clay that has been shown to reduce plasma cholesterol levels in an Apo-E-deficient mouse model with severe hypercholesterolemia (19). BcH also contained 0.8% chitosan, similar to the 1% chitosan found to improve serum lipid profile in rats that consumed a regular diet or a high-fat, high-cholesterol diet [14], and 3% AA—a dose that is midway between the 0.3% and 6.5% doses found to be effective in vivo in reducing MetS symptoms [37,38,39,43]. The low Bc concentration (0.8% w/w; BcL) was chosen in light of preliminary experiments exploring the ratio of active composite to dietary fat that most effectively demulsifies gut-like emulsions [51].

2.3. Measurement of Body Weight and Composition, Energy Intake, Absorption, and Digestibility

Body weight, total 24-h food intake, and total 24-h fecal output were recorded weekly. Weekly food intake was used to calculate the average daily food intake. These intakes were used to calculate the respective combustible energy intakes per diet using their combustible energy content measured by bomb calorimetry [52] (Table 2). Feces were stored at -20 °C and oven-dried at 65 ºC until they reached a constant weight to determine the total 24-h and cumulative fecal output. Combustible energy content, measured by bomb calorimetry, of pooled feces collected in weeks 8, 10, and 14 on a diet (Figure A2A) was used to calculate the apparent absorbed energy and apparent energy digestibility throughout the experiment. These three experimental time points (i.e., week 8, 10, and 14 on a diet) were chosen because they represent the period during which most animal groups demonstrated stable body weight and composition (Figure 1)—that is, they had established an energy balance. Body composition [fat mass (FM), fat-free mass (FFM, i.e., lean mass), and extracellular fluid (fluid)] was measured every other week using time-domain nuclear magnetic resonance (NMR) (Minispec Analyst AD; Bruker Optics, Silberstreifen, Germany) [53]. Energy intake and absorbed energy were adjusted for body weight and composition differences (i.e., FM and FFM), as done previously by us and recommended by others [54,55], rather than for body weight, body weight to the power of 0.67 or 0.75, or only FFM. To do so, we defined the mouse’s ‘metabolic mass’ as its FFM plus 18% of its FM, as we found in previous work that the total energy expenditure (TEE) over 24 h of B6 mice fed ad libitum with LFD or HFD equals 0.34 * FFM + 0.06 * FM + 5.16 (R2 = 0.66, P < 0.01 [55]), i.e., that the covariate of FM is ca. 18% that of FFM.

2.4. Estimating Energy Expenditure Using the Energy-Balance Method

The energy-balance method provides an accurate integrated long-term measurement of TEE in ‘home cages’ while minimizing the potentially confounding stress that may accompany the use of indirect calorimetry systems [56,57]. According to this method, TEE equals the metabolizable energy intake minus the energy stored or gained from changes in body composition, calculated as the final minus initial FM and FFM in a given period. We assigned 13.2 kcal for each gram of FM gained, 9.0 kcal for each gram of FM lost, 2.2 kcal for each gram of FFM gained, and 1.0 kcal for each gram of FFM lost [57,58,59]. These changes in somatic energy content were subtracted from the average daily absorbed energy of the given period and adjusted for the average metabolic mass.

2.5. Blood Glucose and Serum Lipid Profile

Blood samples were collected after 6 h of fasting from the facial vein (using a lancet) at baseline before replacing the chow diet with the different experimental diets, and again at the experimental endpoint. Blood glucose levels were measured immediately using a hand-held FreeStyle glucose meter (Abbott, USA). A ca. 300-µL blood sample was kept on ice until all samples were collected (~3 h); samples were then transferred to room temperature and left to clot for 2 h. The serum was aspirated following centrifugation at 4 °C for 20 min at 1000 RCF and stored at -80 °C. At the experimental endpoint, mice were anesthetized (using isoflurane) for ca. 400-µL blood sampling and sacrificed by cervical dislocation. Blood glucose levels were determined, and serum was collected at baseline. Serum total cholesterol, high-density cholesterol (HDL-C), and triglyceride levels were measured at Rambam Medical Center (Haifa, Israel) and used to estimate low-density cholesterol (LDL-C) and very-low-density cholesterol (VLDL-C) levels.

2.6. Measurement of Dietary, Fecal, and Hepatic Lipids and Fecal Bile Acids

Dietary, fecal, and hepatic lipids were extracted using a modified version of a previously published protocol [60]. Briefly, liver biopsies were weighed immediately after dissection (ca. 300 mg), snap-frozen using liquid nitrogen, and stored at -80 °C. Samples were ground in liquid nitrogen and extracted for 2 h at 40 °C using a hexane–isopropanol (3:2 v/v) mixture. The hexane phase was transferred to a 50-mL tube, the extraction procedure was repeated twice, and sodium sulfate (Chem-Lab NV, Zedelgem, Belgium) was added to absorb water. Following filtration, fluids were transferred to preweighed tubes. Dried ground diets and fecal samples (ca. 400 mg each) were processed similarly. For all samples, the total lipophilic content collected from the repeated extractions was measured gravimetrically following the solvent's evaporation under nitrogen. Fecal lipid content was measured in feces collected at weeks 9, 15, and 16 on a diet (Figure A2A) to calculate the apparent absorbed lipids and their digestibility at these time points and throughout the experiment. These three experimental time points were chosen because they represent the experimental period during which most animal groups demonstrated stable body weight and composition (Figure 1)—that is, they established an energy balance.
Fecal bile acids were extracted using a modified version of previously published protocols [61,62]. In brief, ca. 0.5 g oven-dried fecal sample was ground, supplemented with 20 µL of 2000 ppm 5β-cholanic acid (Sigma-Aldrich Israel), and saponified overnight using KOH (Bio-Lab, Jerusalem, Israel). Lipids were first disposed of by liquid-liquid extraction using hexane (Daejung Chemicals, Siheung-si, South Korea), followed by acidification using HCl (Bio-Lab), and the bile acids were extracted by liquid-liquid extraction using chloroform (Bio-Lab). At each extraction phase, which was repeated three times in total, the solution was centrifuged at 4000 RCF for 10 min to separate the phases, and the relevant phase was collected. Water was absorbed using sodium sulfate (Chem-Lab NV), the solution was filtered through #1 Whatman filter paper, and the chloroform was evaporated using nitrogen. Samples were dissolved in 1 mL of dioxane (Sigma-Aldrich Israel).
Bile acid standards cholic acid (CA), lithocholic acid (LCA), deoxycholic acid (DCA), and chenodioxycholic acid (CDCA) (Sigma-Aldrich Israel) were dissolved in dioxane and used to prepare the standard curve by serial dilution in dioxane. Fecal samples and calibration-curve samples (100 µL) were transferred to 2-mL vials, with an insert for gas chromatography-mass spectrometry (GCMS) and 100 µL N, O-bis(trimethylsilyl) acetamide (Sigma-Aldrich Israel), and heated to 80 °C for 1 h. An Agilent Technologies model 7890A System gas chromatograph equipped with a flame ionization detector and an injector with a split/splitless device for capillary columns, a chromatographic column (CP-Sil 5 CB, part # CP7710, Agilent, Santa Clara, CA, USA), and a mass spectrometer (5975C, VL MSD with triple-axis detector, Agilent) was used for all analyses. The GC operating conditions were as follows: a stable flow of 1 mL/min, a pressure of 10.7 PSI, and injector and detector temperatures of 230 °C and 150 °C, respectively. After injection, the oven temperature was 150 °C, then programmed to increase at a rate of 5 °C/min to a final temperature of 280 °C.

2.7. Measurement of Hepatic Gene Expression

Liver biopsies (~100 mg) were obtained from sacrificed mice at the experimental endpoint, immediately placed in RNAlater solution (Biological Industries, HaEmek, Israel), and stored at -20 oC. Total RNA was isolated using 1 mL TRI Reagent (Thermo Fisher Scientific, Wilmington, NC, USA). After centrifugation, RNA was extracted with chloroform and precipitated with isopropyl alcohol. RNA pellets were washed twice in ethanol and resuspended in RNase-free distilled water. RNA quality and concentration were assessed by Nanodrop spectrophotometry (Thermo Fisher Scientific). A 1-µg aliquot of extracted RNA in each sample was used to obtain reverse-transcribed cDNA with the Verso cDNA Synthesis Kit (AB1453B, Thermo Fisher Scientific) according to the manufacturer's instructions, on the Applied Biosystems ABI-2720 Thermal Cycler platform (Thermo Fisher Scientific). Target quantification was done on the ABI-7000 Sequence Detection System platform using 2x qPCRBIO Fast qPCR SyGreen Blue Mix (PCR Biosystems Inc., Wayne, PA, USA). All primers (see Table 3) were tested for efficiency by serial dilutions, and specificity by melting-curve analysis. Each reaction was performed with the thermocycling program according to the manufacturer's instructions, with a final volume of 20 μL, including 1 μL of cDNA and 200 nM of each primer, in four technical replicates. Results were analyzed using the comparative Ct approach in SDS 2.3 (Thermo Fisher, Warrington, UK), with GAPDH as the housekeeping gene, and by Microsoft Excel software.

2.8. Hepatic Histopathological Analysis

After dissection, liver biopsies were placed in 4% paraformaldehyde–phosphate buffered saline solution and transferred to overnight incubation at 4 °C with gentle shaking. Samples were rinsed three times in double-distilled water and embedded with paraffin using a dehydration protocol of increasing ethanol concentrations up to 100% and ending in xylene. Tissues were embedded in paraffin and sliced into 6-µm thick sections using a microtome (2030-RM, Leica, Wetzlar, Germany). Sections were dewaxed, stained with hematoxylin and eosin solution using a standard protocol, and imaged with a Dino-Lite Microscope camera (AnMo Electronics, Taipei, Taiwan) at x20 magnification.

2.9. Statistical Analysis

All data are expressed as mean ± SEM. Statistical analysis was conducted using GraphPad Prism v8.0 (La Jolla, CA, USA). We used two-way repeated measures or one-way ANOVA, followed by false discovery rate (FDR) correction for multiple comparisons, to assess the statistical significance of the results. P < 0.05 was considered significant.

3. Results

3.1. Biocomposite Supplementation Decreases HFD-Induced Fat Gain and Prevents Lean-Mass Loss

Compared to LFD, HFD resulted in higher glucose and total cholesterol but lower triglyceride levels (Table 4). The increment in total cholesterol was due to increased HDL-C and LDL-C levels. BAS supplementation prevented HFD-induced hyperglycemia and hypercholesterolemia and further reduced triglyceride levels (Table 4).
Compared to LFD, HFD also caused larger weight gain due to higher fat mass gain that overcompensated for the reduction in lean mass—the latter was absent with LFD, resulting in a larger fat percentage gain (HFD, 28.04 ± 3.7% vs. LFD, -0.8 ± 1.7, P < 0.001, Figure 1B). HFD+BAS-fed mice had a lower gain in body weight and fat percentage than mice fed an unsupplemented HFD (BAS, -2.5 ± 2.6% vs. HFD, 28.04 ± 3.7% vs. LFD, -0.8 ± 1.7, P < 0.001, Figure 1H), resulting in body mass and composition resembling those with LFD feeding (Figure 1). Supplementing BcH to the HFD resulted in a decrease in weight gain (BcH, 4.4 ± 0.7 g vs. HFD, 10.9 ± 0.5 g, P < 0.001), but to a lesser extent than HFD+BAS (P < 0.05, Figure 1B). The BcH vs. HFD weight-gain difference was explained mainly by the lower fat-mass gain with BcH which, together with the lack of lean-mass loss in HFD+BcH-fed mice, resulted in a lower increment in fat percentage (BcH, 12.4 ± 4.2% vs. HFD, 28.4 ± 3.7%, P < 0.05, Figure 1H). cholestyramine; HFD+AA, high-fat diet + 3.0% (w/w) acetic acid; HFD+BcL, high-fat diet + 0.8% (w/w) biocomposite; HFD+BcH, high-fat diet + 5.0% (w/w) biocomposite.
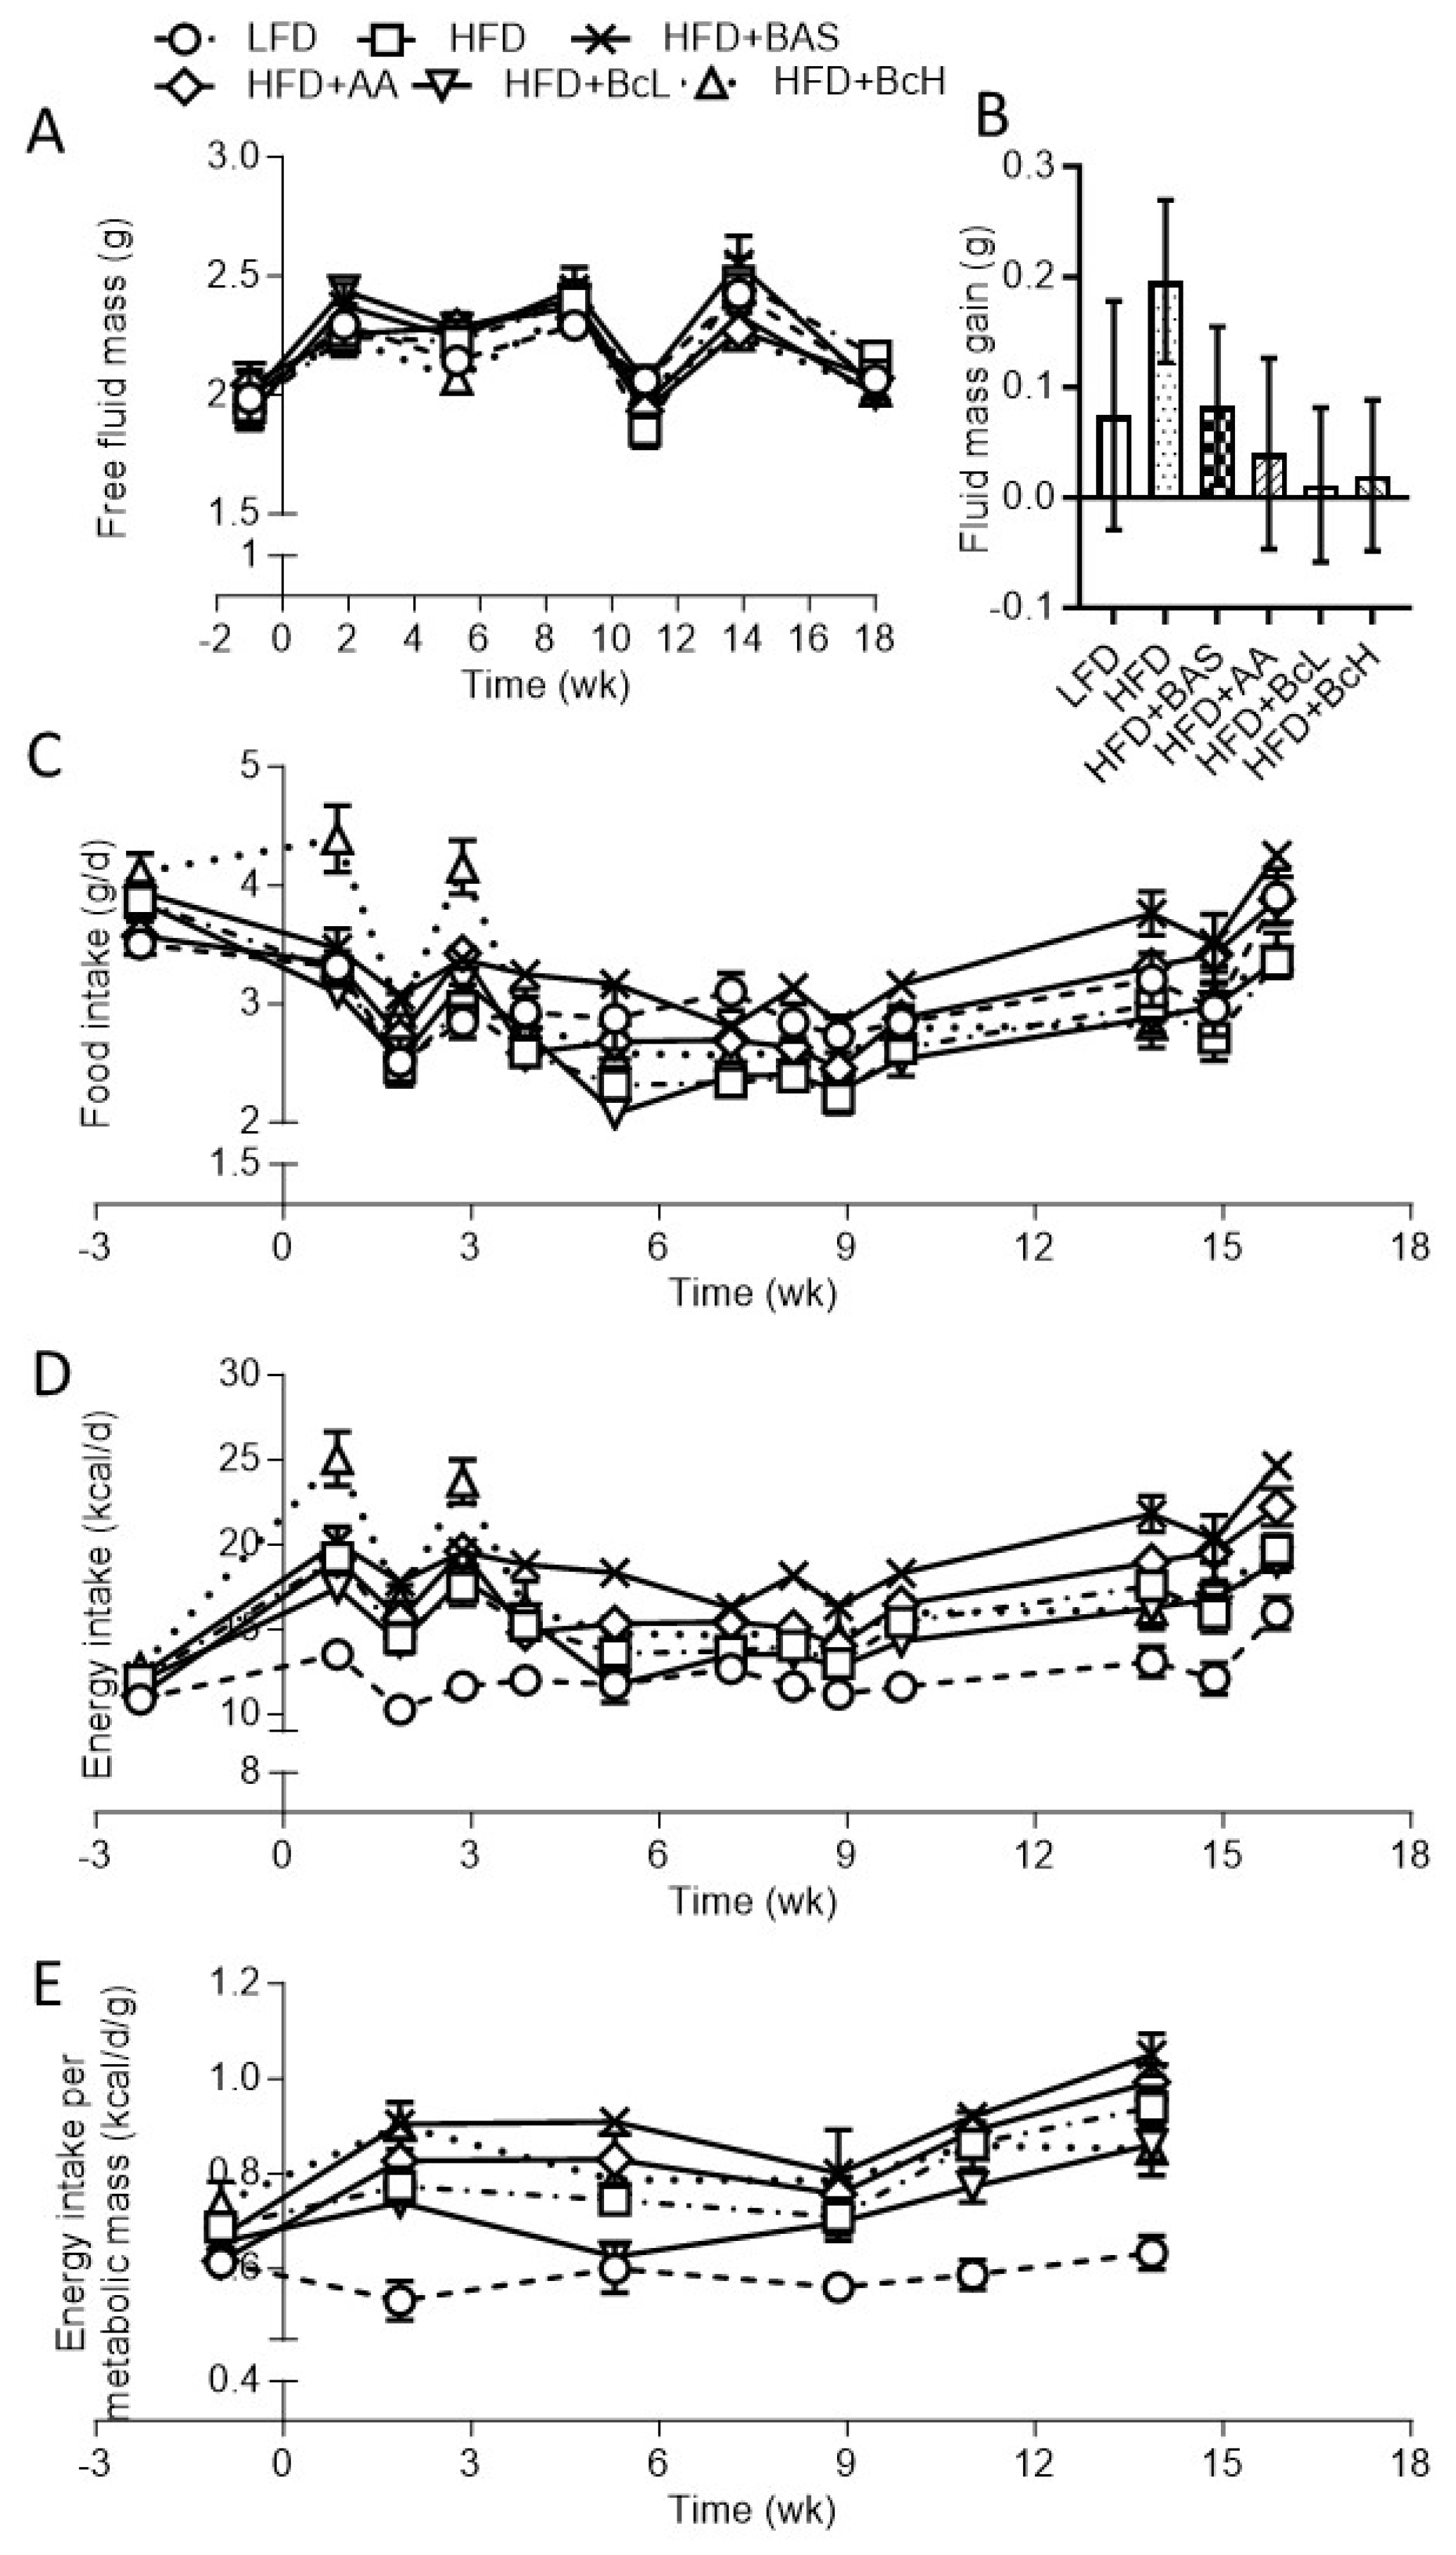
Supplementing HFD with AA (the solvent of the Bc) at the dose given to HFD+BcH-fed mice resulted in lower body weight and fat mass gain than unsupplemented HFD, as found for BcH (Figure 1). AA supplementation, however, did not prevent the HFD-like lean-mass loss, which differed from the LFD-related lean-mass gain (HFD+AA, -0.6 ± 2.7 g. vs. LFD, 2.1 ± 0.5 g, P = 0.05, Figure 1F), contrary to HFD+BcH that showed an intermitted level of lean-mass gain (0.2 ± 0.9 g, Figure 1F). Taken together, fat percentage gain under HFD+AA did not differ statistically from that of HFD-fed mice (HFD+AA, 17.1 ± 5.6% vs. HFD, 28.0 ± 3.7%, Figure 1H). Free-fluid content was not affected by diet or time on the diet (age) (Figure A1A). Overall, the -10.9% difference in fat percentage gain under AA (compared to HFD) explained 69.5% of the -15.7% fat percentage gain of HFD+BcH compared to HFD (Figure 1H). Hence, the effect of the sepiolite–chitosan components accounted for the additional 30.5% of the total impact of BcH (i.e., the total -17% fat percentage gain, Figure 1H). This extra effect of BcH was reflected in the lower fat percentage gain (i.e., obesity gain) compared to unsupplemented HFD, a phenomenon not found in HFD+AA (Figure 1H).

3.2. Biocomposite-Induced DIO Attenuation is Not Due to Reduced Energy Intake or Absorption

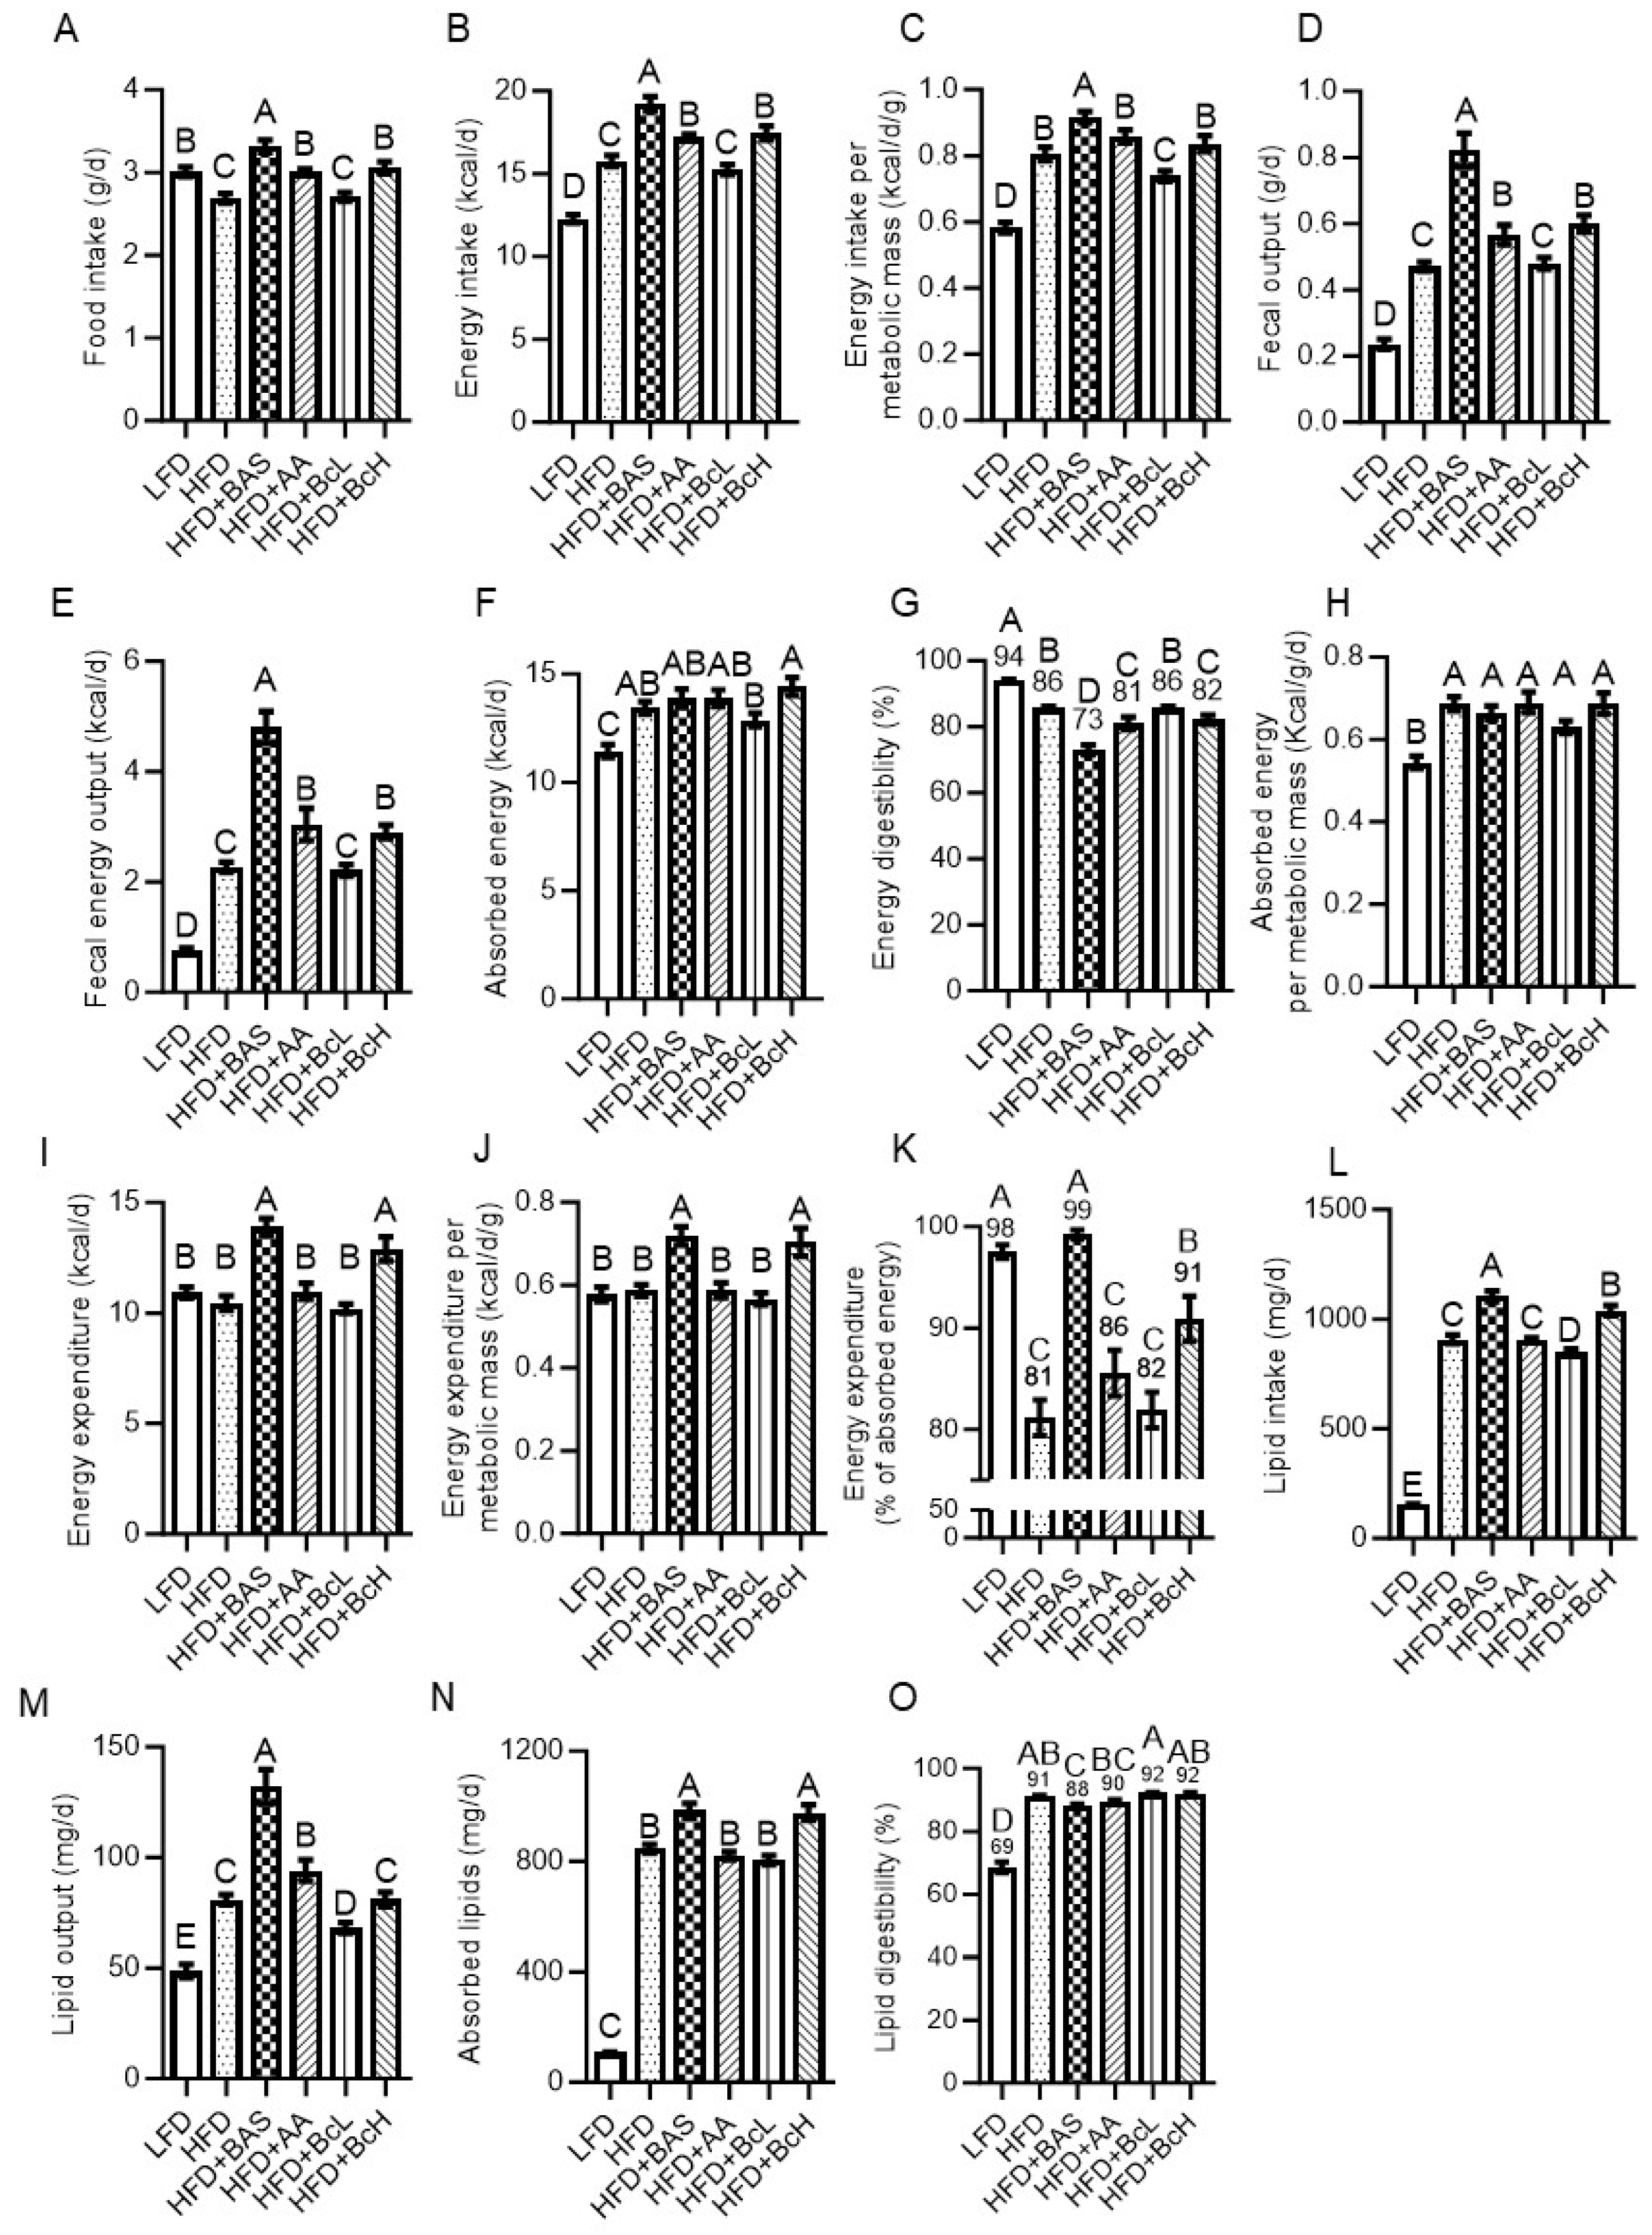
Compared to LFD, HFD resulted in lower food intake but higher energy intake when corrected for metabolic mass (Figure 2A–C and Figure A1C and D). In parallel, HFD-fed mice also showed higher fecal energy output due to higher fecal production and fecal energy content (Figure 2D and E and Figure S2A and B). However, considering the much higher energy intake, HFD feeding resulted in an overall higher level of absorbed energy (Figure 2F) but lower energy digestibility than LFD (HFD, 86 ± 0.4% vs. LFD, 94 ± 0.4%, P < 0.001, Figure 2G and Figure S2D). This higher absorbed energy in HFD-fed mice was even more pronounced when corrected for metabolic mass (Figure 2H)—energetically supporting their more positive energy, i.e., their DIO, compared to LFD-fed mice (Figure 1B and H). Compared to unsupplemented HFD, HFD supplemented with BAS, AA, or BcH resulted in higher rather than lower food intake and, therefore, higher energy intake, even when corrected for metabolic mass in the case of BAS-supplemented mice (Figure 2A–C and Figure A1C–E). These results suggest that DIO attenuation in BAS-, AA-, and BcH-fed mice is due to attenuated energy absorption and/or higher energy expenditure, rather than attenuated energy intake.
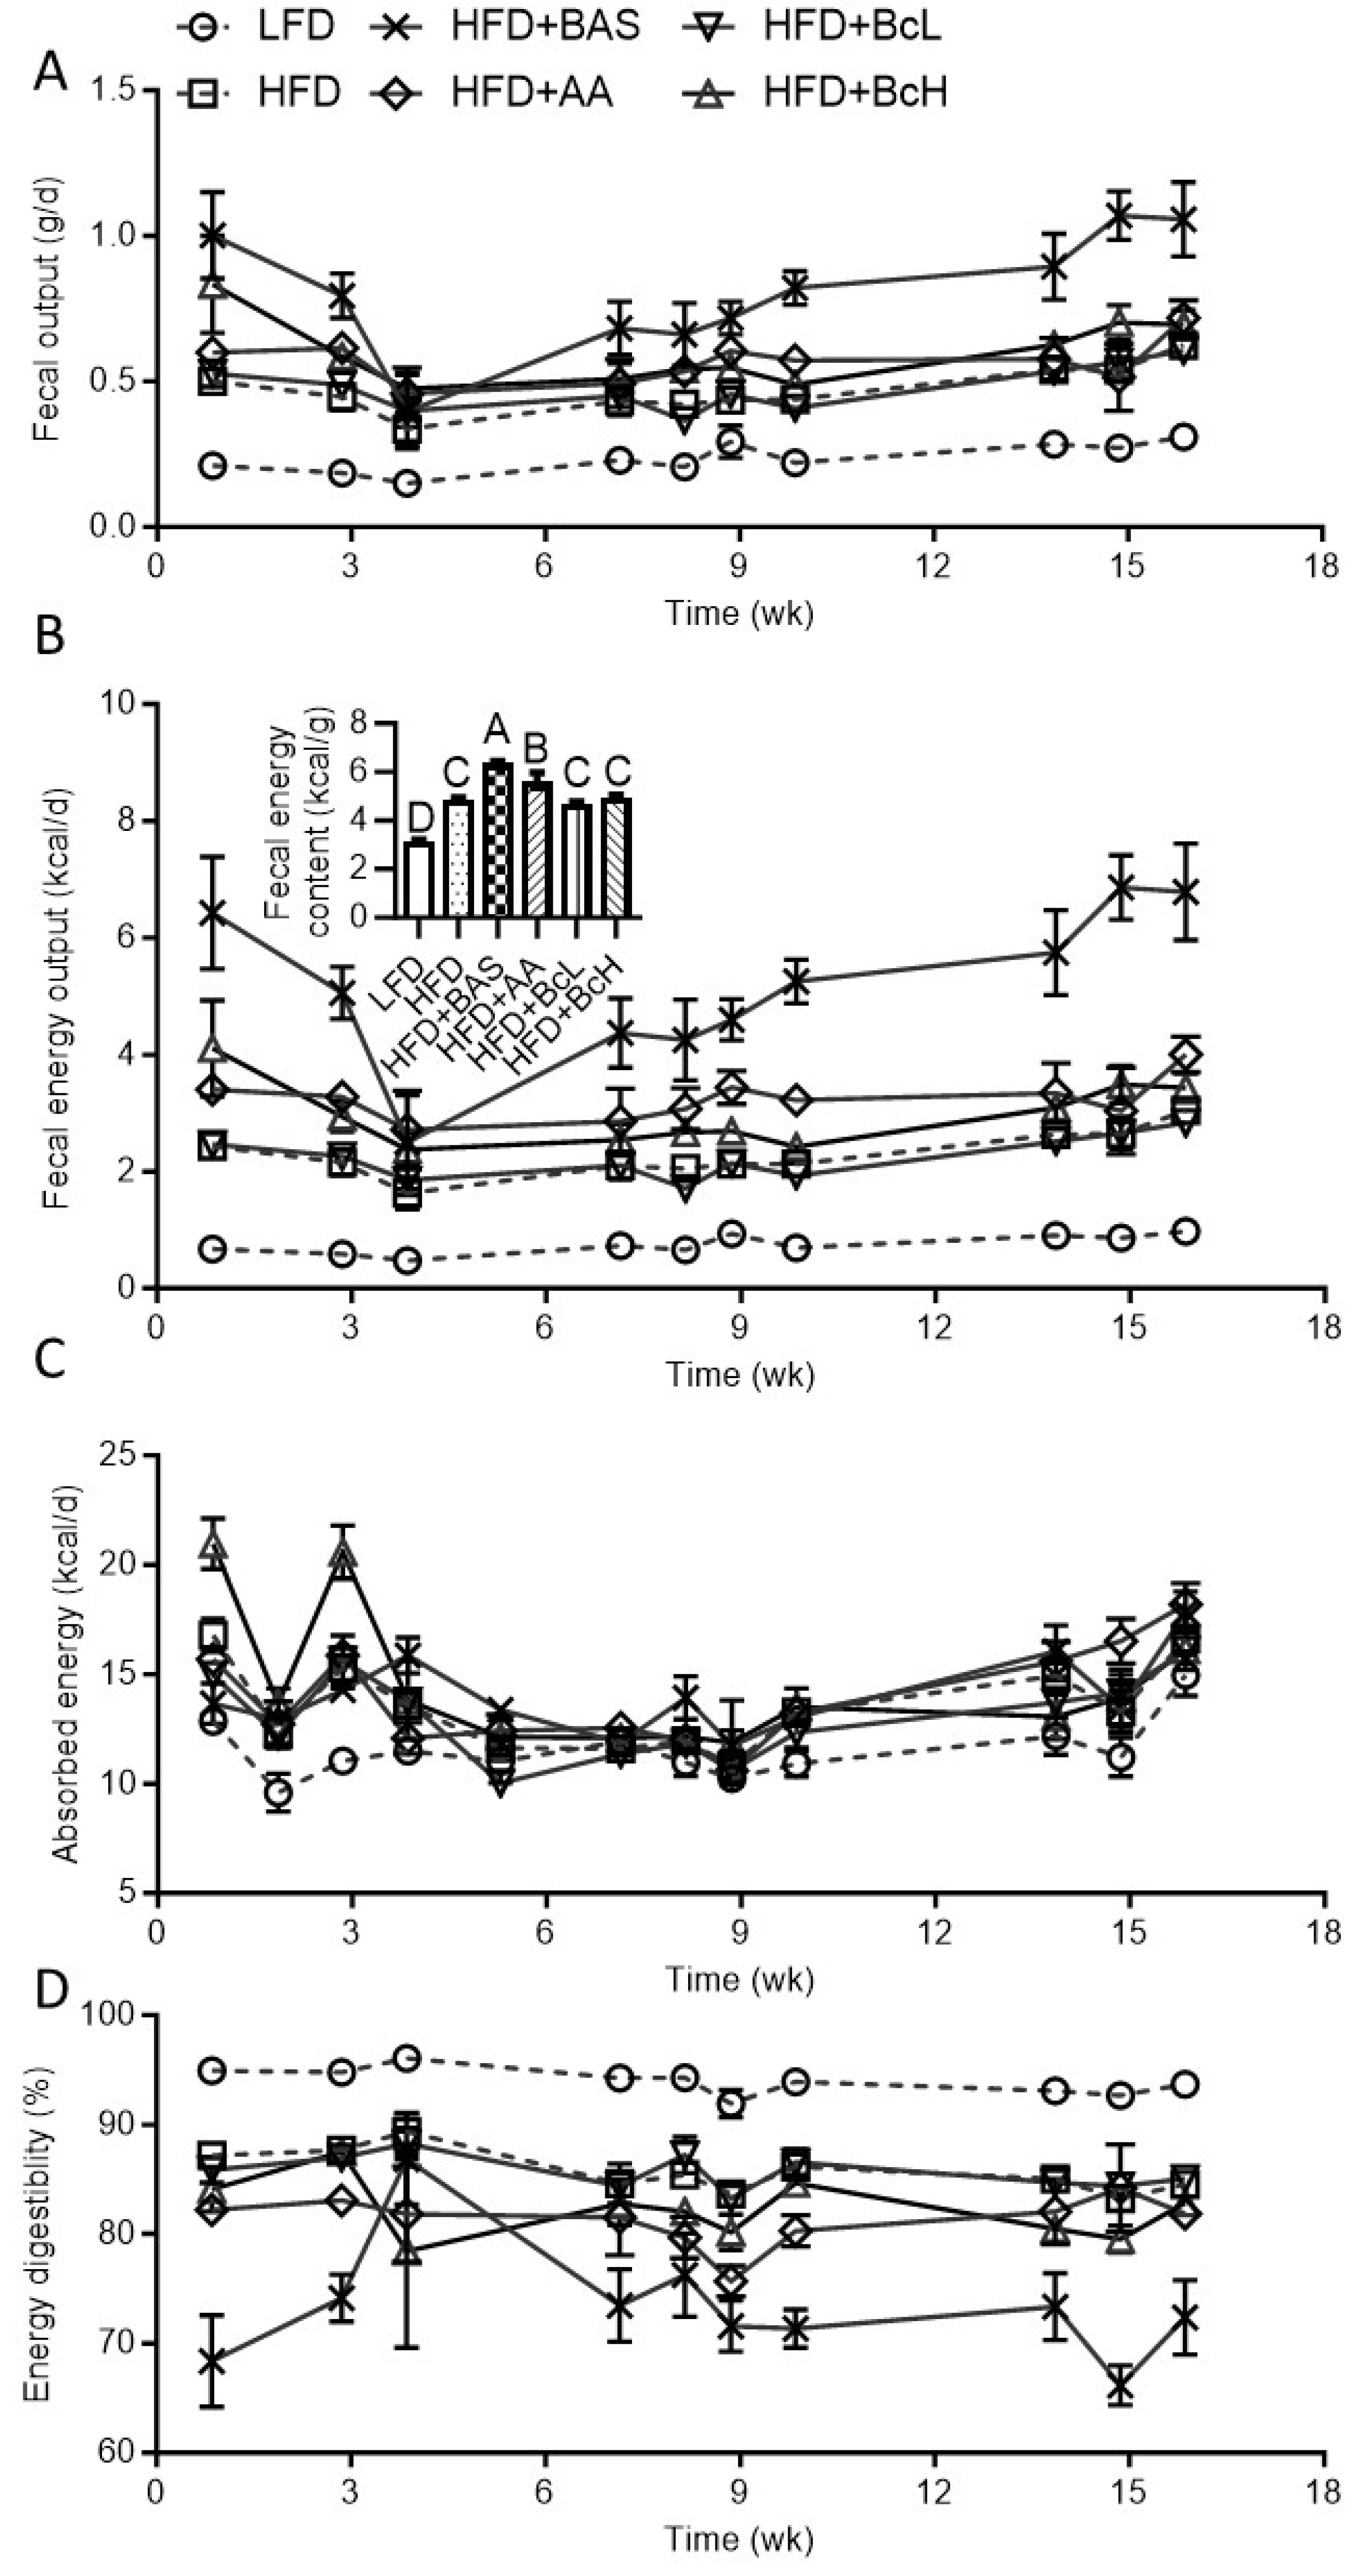
In parallel, these three mouse groups showed higher fecal energy output due to higher fecal production and fecal energy content (except for BcH) than HFD-fed mice (Figure 2D, E, and Figure A2). However, considering their energy intake, they showed a HFD-like level of absorbed energy, indicating decreased energy digestibility (BAS, 73 ± 1.5%; AA, 81 ± 1.9%; and BcH, 82 ± 1.4% vs. HFD, 86 ± 0.4%, Figure 2G and Figure A2). This HFD-similar absorbed energy was also found when corrected for metabolic mass (Figure 2H). In parallel, BAS-fed mice showed higher energy intake and absorbed energy (also when corrected for metabolic mass) than LFD-fed mice (Figure 2C and H). These results indicate that BAS supplementation does not reduce energy intake and can even increase it, followed by lower digestibility, resulting in a HFD-like energy-absorption rate (Figure 2C and F–H). Hence, the attenuation of DIO by BAS supplementation is proposed to be due to higher metabolic-mass-corrected energy expenditure (see section 3.3). This would also explain the LFD-like body mass and composition of HFD+BAS-fed mice, which also showed more elevated (metabolic-mass-corrected) energy intake and absorption rate than LFD-fed mice (Figure 2C and H). Similarly, the attenuated DIO of AA- and BcH-fed mice is suggested to be due to higher energy expenditure rather than reduced energy intake or absorption rates.

3.3. DIO Attenuation is Related to Higher Energy Expenditure, as Calculated by the Energy-Balance Method

Using the change in fat and lean mass during the first 9 weeks of the experiment—after which body composition stabilized (Figure 1)—we calculated the total energy lost or gained (during tissue deposition or catabolism) per diem. This lost or gained energy was subtracted from the per diem absorbed energy (Figure 2F) to give the TEE over 24 h (Figure 2I). DIO did not affect this metabolic-mass-corrected TEE (Figure 2J). In contrast, as suggested above, HFD+BAS and HFD+BcH resulted in higher-than-expected energy expenditures than HFD (Figure 2J). More specifically, HFD-fed mice expended 81 ± 1.8% of their absorbed energy (vs. 98 ± 0.7% for LFD-fed mice, Figure 2K). The remaining 19% was used for and stored as body tissues, mainly fat mass (Figure 1). At the same time, the supplementation of HFD with BAS resulted in LFD-like usage of energy intake (TEE = 99 ± 0.5% of intake, Figure 2K). Supplementation of HFD with BcH resulted in an intermediate value of 91 ± 2.3%, higher than that of HFD+AA (86 ± 2.3%, P < 0.05, Figure 2K). These findings support the notion that DIO is due to higher energy absorption rather than reduced energy expenditure. At the same time, the DIO attenuation rate by the different dietary supplements was related to how closely the increased energy expenditure matched the HFD-induced increment in absorbed energy (Figure 2K).

3.4. DIO Attenuation by Biocomposite Supplementation is Not Due to Attenuated Lipid Digestibility

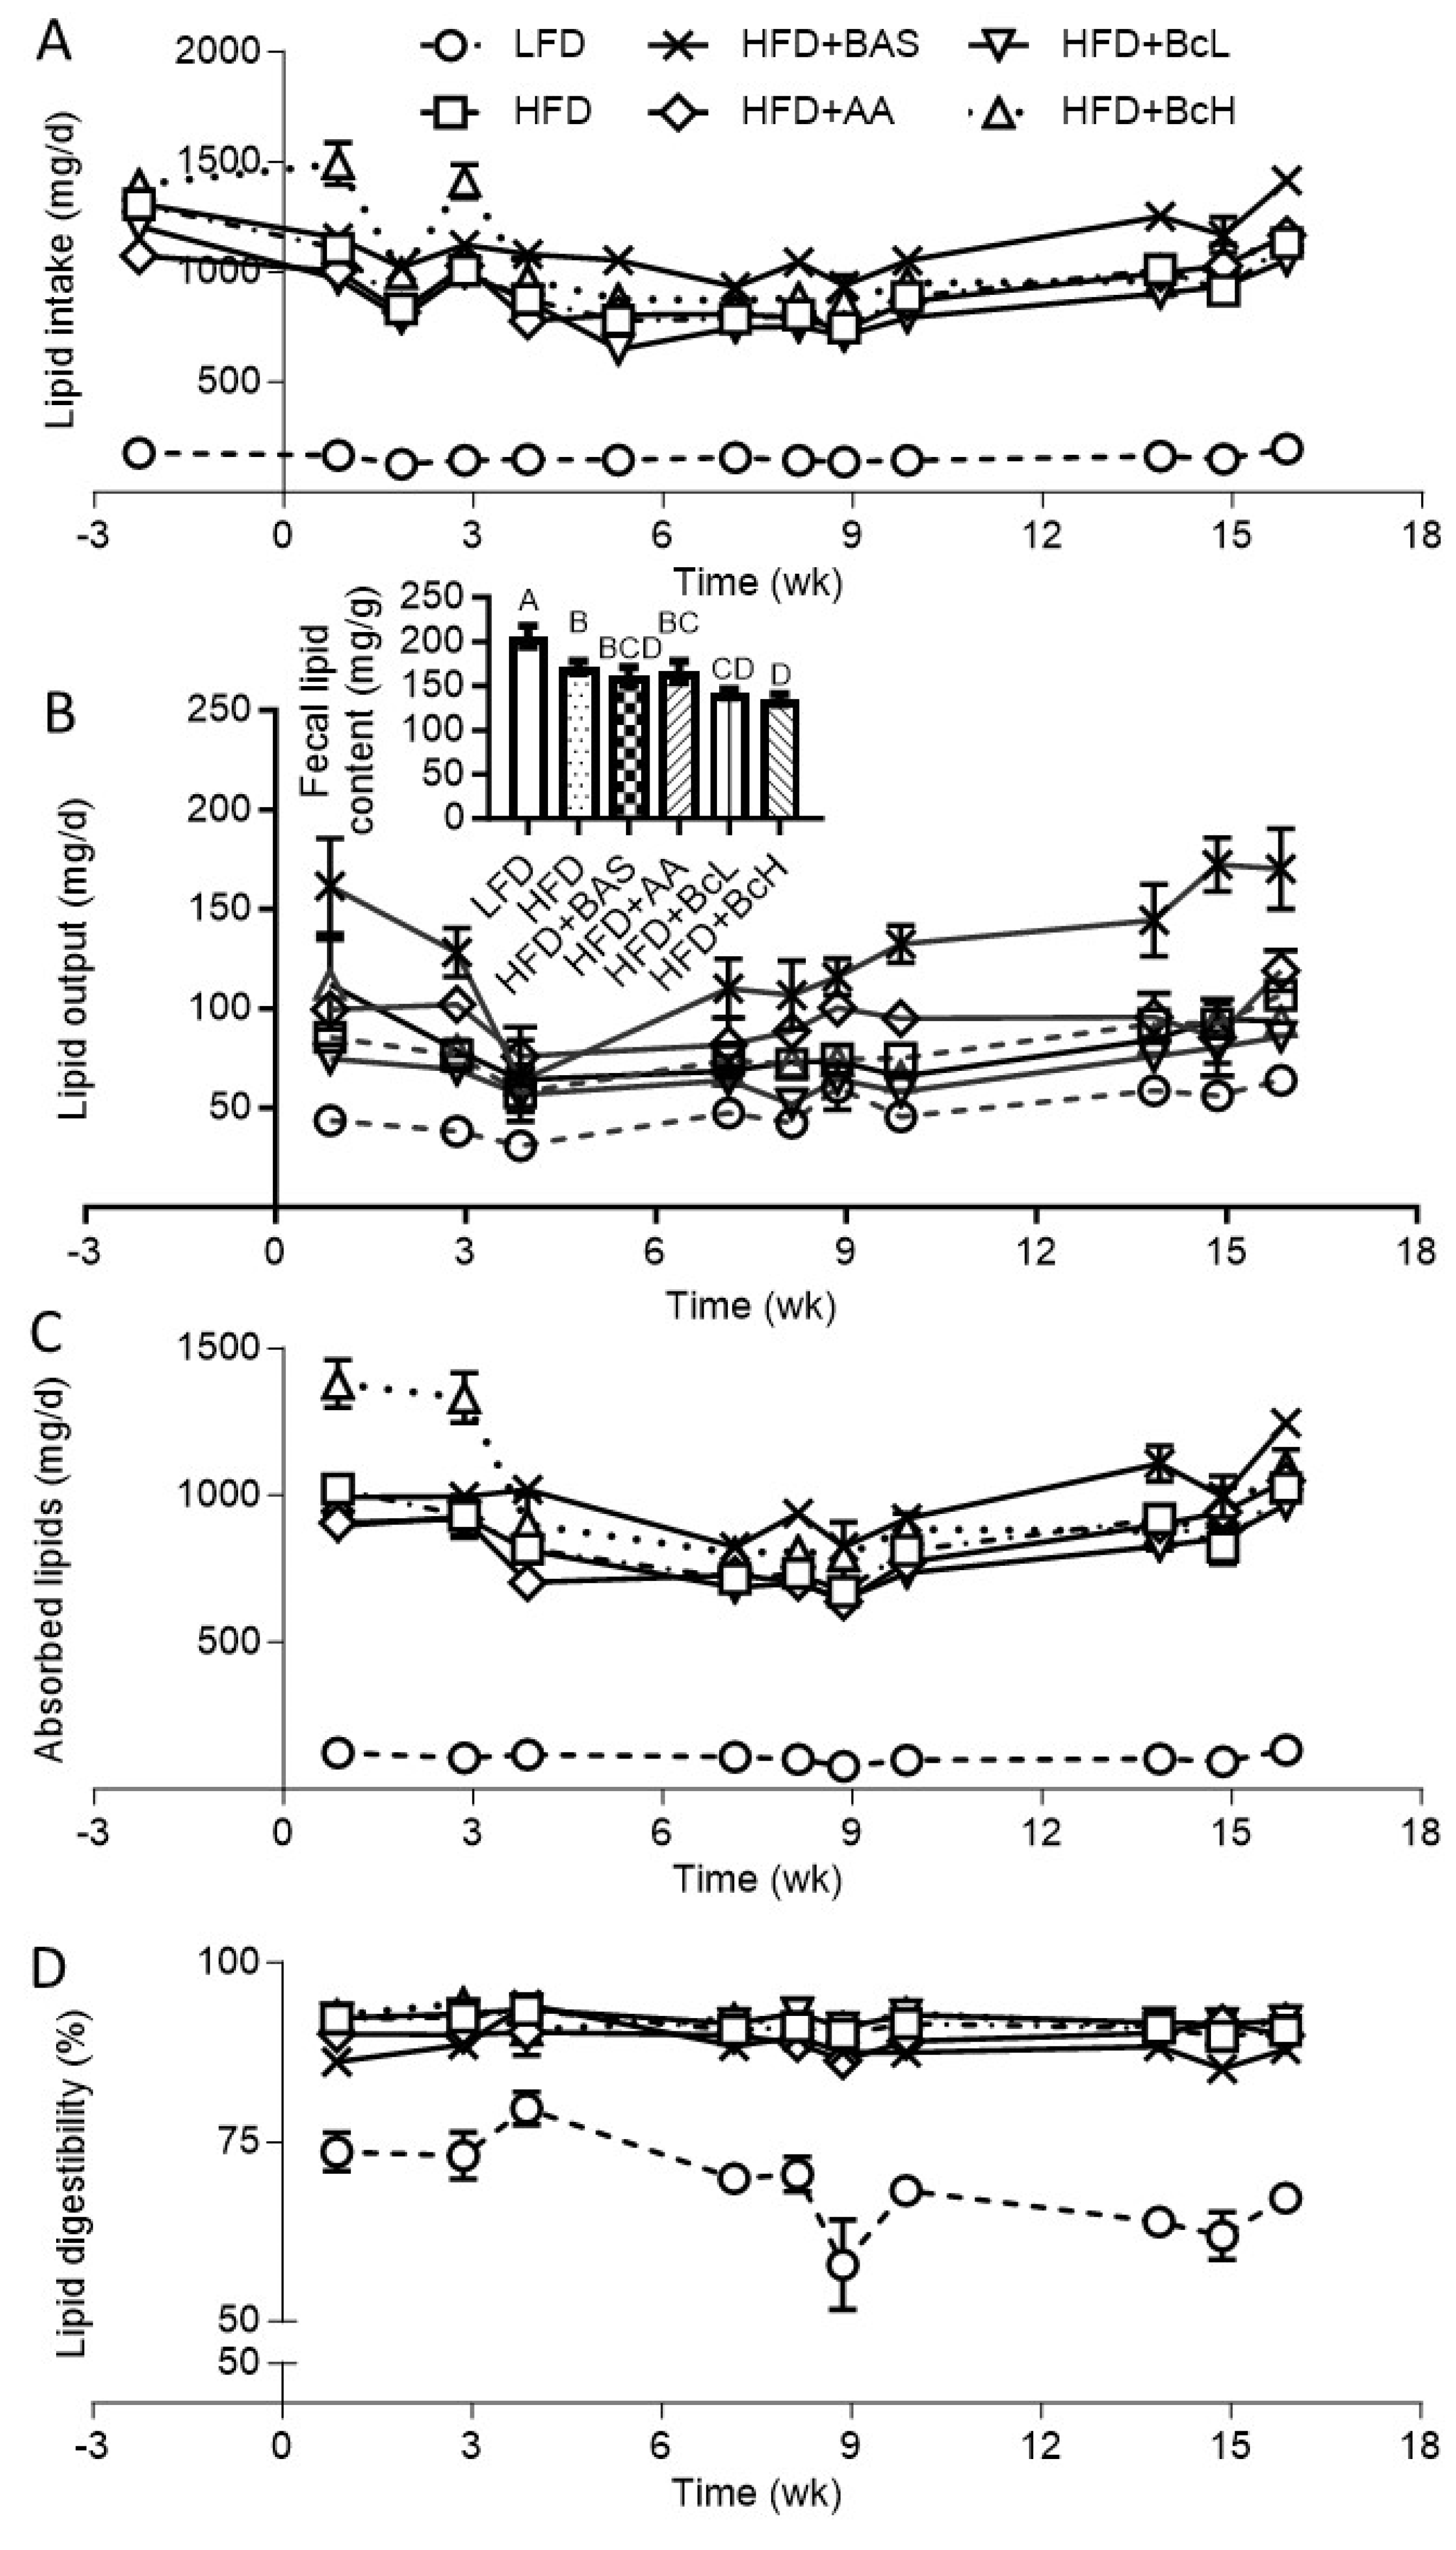
Compared to LFD, feeding on HFD resulted in higher lipid intake, as found for energy intake, due to the HFD’s higher lipid content, which counterbalanced the HFD-induced lower food intake (Table 1, Figure 2L, and Figure A3A). HFD-fed mice also showed higher lipid output due to the higher fecal output that counterbalanced their lower fecal lipid content (Figure 2M and Figure A3B, insert). However, HFD resulted in a higher final level of absorbed lipids, considering the much higher lipid intake, also resulting in higher lipid digestibility than in LFD-fed mice (HFD, 91 ± 0.3% vs. LFD, 69 ± 1.7%, P < 0.01, Figure 2N and O and Figure A3C and D). This HFD-induced increment in lipid digestibility suggests that the above-reported HFD-induced reduction in energy digestibility (Figure 2G) is due to a HFD-induced decrease in non-lipid energy digestibility.
As found for energy intake, HFD supplemented with BAS, AA, or BcH resulted in a higher or similar lipid intake compared to unsupplemented HFD (Figure 3L and Figure A3A). In parallel, HFD supplementation with BAS resulted in a higher output of fecal lipids due to higher fecal output; fecal lipid content was unaffected (Figure 2M and Figure A3B). Considering lipid intake, however, HFD+BAS- and HFD+BcH-fed mice showed higher levels of lipid absorption than those fed HFD (Figure 2N and Figure A3C). Taken together, lipid digestibility was not affected by any of the supplements, except for lower digestibility with BAS supplementation (Figure 2O and Figure A3D). This indicates that the higher lipid absorption under HFD supplemented with BAS or BcH (Figure 2N) was due to the higher food (lipid) intake (Figure 2A and L) rather than increased digestibility. These results also indicate that the observed attenuations in DIO are not solely due to attenuation of lipid digestibility or absorption; they also need to counterbalance their accompanied increment in lipid absorption (due to increased food intake). Moreover, as BAS and BcH show a more subtle reduction (if any) in lipid digestibility than the reduction in total energy digestibility (Figure 2O vs. 2G), their consumption is also suggested to induce a decrease in non-lipid energy digestibility.

3.5. Biocomposite Supplementation Does Not Affect the HFD-Induced Increment in Bile Salt Extraction Rate

Compared to LFD, HFD resulted in a higher fecal output of bile salts due to the HFD-induced increment in fecal production (Figure 2D), while the fecal content of bile salts was unaffected by diet (Figure 3A–E). However, this higher loss in fecal bile salts was lower than expected, according to the increment in lipid intake (Figure 3F). HFD+BAS resulted in an even higher fecal output of bile salts due to the BAS-induced increment in fecal production and fecal DCA, CDCA, and CA concentrations (Figure 2D and 3B–E). This loss in fecal bile salt was higher than expected according to the lipid intake (Figure 3F), indicating its association with the BAS per se and not its associated increment in lipid intake (Figure 2L). BcL, BcH, and AA did not affect fecal bile-salt concentration or output (Figure 3A–E).

3.6. Biocomposite Supplementation Attenuates HFD-Induced Hepatic Lipid Accumulation and Related Gene Expression

Compared to LFD, HFD resulted in the accumulation of hepatic lipids, detected by lipid extraction, and as also shown by hematoxylin and eosin staining, suggesting the development of NAFLD (Figure 3G, I, and J). Compared to HFD, HFD supplemented with either BAS or BcH demonstrated lower lipid content and tissue morphology, similar to LFD (Figure 3G and I–N). Hepatic mRNA-expression analysis of Col1a1, which encodes for collagen-type 1—a gene related to the development of hepatic fibrosis [63,64], showed that compared to LFD, HFD-feeding resulted in a trend toward higher expression (Figure 3H). This trend was reversed by all food supplements, showing lower Col1a1 levels than the HFD-fed mice (Figure 3H).

4. Discussion

Numerous in-vivo and a few human trials have shown the effectiveness of standalone AA [37,38,39,40,41,42,43], chitosan [12,13,14,15,16], and edible montmorillonite clay [21,22,23,24,25] as food supplements attenuating HFD-induced MetS; however, conflicting results have been obtained in clinical studies [17,18,65,66,67,68]. In addition, we recently showed this anti-DIO and hypercholesterolemia effect for edible sepiolite clay [30]. In the present study, we examined the anti-MetS effectiveness of a food supplement combining these three substances, i.e., a Bc combining sepiolite, chitosan, and AA, the latter also ionizing the chitosan for a positively charged Bc, which was hypothesized to serve as a BAS. BcH supplementation attenuated DIO gain and NAFLD development more than was found with standalone AA but less than cholestyramine (a known BAS). BcH resulted in a higher intake that counterbalanced its associated reduced energy digestibility, and a higher energy expenditure—mechanistically explaining the observed amelioration in MetS.
Compared to LFD, HFD feeding resulted in MetS: obesity, hypercholesterolemia, NAFLD, and hyperglycemia, as also shown in other studies [10,30,53,55,69], but paradoxically, it decreased circulating triglycerides, as also demonstrated by others [70,71,72]. This HFD-induced reduction in seral triglycerides is probably due to increased seral triglyceride clearance and its accumulation in the liver (see HFD-induced NAFLD), as suggested by others [70,71,72]. The hypercholesterolemia was due to increased LDL-C and HDL-C, as found for C57BL6 mice chronically fed HFD for 10–16 weeks [73,74,75]. The DIO was underlined by increased adiposity and lean-mass loss and was explained energetically by a higher-than-expected (by metabolic mass) energy intake rather than reduced energy expenditure, as we have shown previously [55]. This higher energy intake, which overcompensated for the known (see [76]) HFD-induced increment in fecal energy output and reduced energy digestibility, resulted in a higher (metabolic-mass-corrected) level of absorbed energy. As expected, BAS supplementation to the HFD prevented DIO, NAFLD, hyperglycemia, and hypercholesterolemia [47,77,78,79,80,81]. The parallel increment in fecal bile acid loss, which exceeded the HFD-induced increment in bile acid loss and was higher than expected based on lipid intake, explains the BAS-induced reduction in serum cholesterol, as also suggested by others [79,81]. As previously reported [79], HFD+BAS also resulted in a higher energy intake, paralleling the reduced energy digestibility, yet it did not affect energy or lipid absorption compared to HFD; hence, the BAS-induced stabilized energy balance can be explained by higher metabolic-mass-corrected energy expenditure, as shown by others [47,78]. The above-described similarities between our and others’ results validate the methods and approaches used to obtain the subsequent results.
Supplementing HFD with BcH attenuated DIO and NAFLD progression more so than AA alone, which has been previously shown to attenuate diet-induced MetS [37,38,39,40,41,42]. The BcH-induced attenuation of the HFD-induced increment in adiposity percentage was due to attenuated fat-mass gain and prevention of lean-mass loss, resulting in a leveled lean-mass that did not differ from the LFD-related lean-mass gain. In contrast, standalone AA only showed the expected fat-gain attenuation [38]. The trend of a lower fat percentage gain under AA (compared to HFD alone) accounted for 70% of the total effect observed under HFD+BcH. BcH, however, also resulted in significantly lower fat percentage gain than HFD (explaining the added 30% difference between HFD+BcH and HFD) due to its more extensive prevention of lean-mass loss and fat-mass gain. BcH is also advantageous over AA in preventing the HFD-induced increase in hepatic lipids (a symptom of NAFLD), a prevention found only with HFD+BcH and HFD+BAS but not with HFD+AA consumption. These dietary attenuations in NAFLD progression were paralleled by lower mRNA expression levels of Col1a1, which encodes for collagen-type 1 and is related to developing hepatic fibrosis [63,64], than found for HFD-fed mice.
BcH supplementation did not attenuate energy intake, as found for AA supplementation in this and other studies [37,38]. BcH supplementation was accompanied by reduced energy digestibility (not attributed to a decrease in lipid digestibility) that, however, did not attenuate energy or lipid absorption due to the parallel increment in their intake. These effects were attributed to the AA supplementation and were unaffected by the additional sepiolite and chitosan found in the BcH. As BcH did not affect absorbed energy, it is suggested that the BcH-induced attenuation in DIO is due to elevated energy expenditure and increased fat oxidation, to an even greater extent than seen for AA alone [42]. Our energy-expenditure estimation using the energy-balance method supports this suggestion; BcH and BAS, the only dietary supplements that significantly attenuated fat percentage gain, showed a higher-than-expected energy expenditure than HFD-fed mice. Hence, the additive effect of sepiolite and chitosan found in the BcH seems to be the increment in energy expenditure. Nevertheless, this result needs to be validated by indirect calorimetry, a method applied in our previous studies [55,69,82]; this is planned for future studies.
Contrary to our hypothesis that BcH can effectively adsorb bile salts in vivo and therefore increase their fecal extraction, feeding of HFD+BcH was not accompanied by higher fecal bile salts than the HFD. This between-diet similarity in fecal bile salt content goes hand in hand with their similarity in blood cholesterol levels, in contrast to the (expected, see [47,48,49]) findings for HFD+BAS showing higher fecal bile salt loss in parallel with lower blood cholesterol levels than for the HFD. In addition, our current results do not support previous ones showing that supplementing sepiolite clay alone to a high-fat, high-cholesterol diet results in attenuated hypercholesterolemia in addition to attenuated DIO [30]. That study, however, used 5% (w/w) sepiolite—twice the sepiolite concentration used in the current study, a difference that could at least partly explain the discrepancy in the results. Moreover, in that previous study, hypercholesterolemia was induced by adding dietary cholesterol to be absorbed by the uncharged lipophilic sepiolite [30]. This study, however, aimed at attenuating hypercholesterolemia by absorption of the cationic fecal bile salts by the presumably anionic Bc. Our current results, which lack a BcH-induced elevation in fecal bile salts, suggest that the Bc lost its AA-conferred in-vitro cationic properties [46] while passing through the gastrointestinal tract. This effect might be induced by the duodenal buffers that maintain a pH of ca. 7 [83]—a pH at which our Bc might lose its cationic properties [46]. This issue will be explored in future studies.
An updated meta-analysis showed that even novel anti-obesity drugs prescribed alongside a control diet show a placebo-subtracted weight reduction that does not exceed 7% over 12 months [2]. Moreover, the only long-term effective over-the-counter oral medication for obesity is orlistat, with an efficacy of up to 3% weight reduction [2], but it does not consistently reverse liver fibrosis [84]. Our results show that supplementing HFD with BcH attenuates body weight gain by 18 ± 2.8%, even under ad-libitum feeding, while simultaneously addressing NAFLD, which was not attenuated under AA.
While the safety of chitosan and AA consumption has been clinically addressed [17,18,65,66,67,68], the safety of clay consumption is the subject of an ongoing investigation. In this preliminary safety assessment, dietary sepiolite (1.2% w/w), part of the BcH, did not appear to cause notable adverse effects, such as chronic fatty diarrhea (steatorrhea). This dose is lower than the maximum 2% concentration of sepiolite (E562) allowed in animal feed by the European Food Safety Authority (EFSA) [50] and four times lower than the 5% dose (w/w) used in our previous study with no notable adverse effects [30]. Further analyses of, for example, seral biochemical indexes and liver histopathology are needed to approve the safety of sepiolite consumption.

5. Conclusions

In conclusion, we show that continuous supplementation of a sepiolite–chitosan–AA Bc to a HFD attenuates its MetS-related outcomes, including obesity and NAFLD. Mechanistically, BcH intake was accompanied by increased energy expenditure and reduced digestibility counterbalanced by increased intake. Hence, these results support further investigation of the Bc’s efficacy as a food supplement that can further attenuate the development of MetS, and may do so to a greater extent if applied with a restricted diet. Future studies should also focus on this Bc's safety, mechanism of action, and relative efficacy compared to its three components, given separately or in combination with the others.

Supplementary Materials

The following supporting information can be downloaded at the website of this paper posted on Preprints.org.

Author Contributions

D. Niv analyzed the data and drafted the paper; E. Anavi, L. Yaval, and A. Abbas conducted the research and analyzed the data; G. Rytwo supervised the preparation of the biocomposites and their analysis; and R. Gutman analyzed the data and wrote the paper. All authors have read and agreed to the published version of the manuscript.

Funding

This research was funded by the Israeli Ministry of Industry, Trade & Labor KAMIN, agreement no. 53860; the Israeli Ministry of Science, Technology, and Space, agreement no. 3-13605; and the European Union’s Seventh Framework Programme FP7-REGPOT-2012-2013-1, agreement no. 316157.

Institutional Review Board Statement

The animal study protocol was approved by the Israeli Animal Care and Use Committee (permission nos. IL-17-4-161 and IL-18-6-173).

Data Availability Statement

The data presented in this study is available on request from the corresponding author.

Acknowledgments

We express our appreciation to Hadar Frank and Annat Neuman from the Laboratory of Integrative Physiology at MIGAL, Aya Sitruk, and Roy Levi from the Environmental Physical Chemistry Laboratory at MIGAL, and Dr. Meir Shlisel and his technicians at Tel Hai College for their assistance in conducting the experiments.

Conflicts of Interest

The authors declare no conflict of interest.

Appendix A

Figure A1. Effect of biocomposite supplementation, compared to control diets, on free fluids (A and B), food and energy intake (C and D), and energy intake corrected for metabolic mass (E). LFD, low-fat diet; HFD, high-fat diet; HFD+BAS, high-fat diet + 2% (w/w) cholestyramine; HFD+AA, high-fat diet + 3.0% (w/w) acetic acid; HFD+BcL, high-fat diet + 0.8% (w/w) biocomposite; HFD+BcH, high-fat diet + 5.0% (w/w) biocomposite. n = 9 per group.
Preprints 121071 g0a1
Figure A2. Effect of biocomposite supplementation, compared to control diets, on fecal output (A), fecal energy output (B), fecal energy content (B, insert), absorbed energy (C), and energy digestibility (D). Different letters represent significant differences by FDR post hoc analysis following one-way ANOVA. For abbreviations, see legend to Figure S1. n = 9 per group.
Preprints 121071 g0a2
Figure A3. Effect of biocomposite supplementation, compared to control diets, on lipid intake (A), fecal lipid output (B), fecal lipid content (B, insert), absorbed lipids (C), and lipid digestibility (D). Different letters represent significant differences by FDR post hoc analysis following one-way ANOVA. n = 9 per group. For abbreviations, see the legend in Figure A1.
Preprints 121071 g0a3

References

  1. Noubiap JJ, Nansseu JR, Lontchi-Yimagou E, Nkeck JR, Nyaga UF, Ngouo AT, et al. Geographic distribution of metabolic syndrome and its components in the general adult population: A meta-analysis of global data from 28 million individuals. Diabetes Res Clin Pract. Diabetes Res Clin Pract; 2022. [CrossRef]
  2. Tak YJ, Lee SY. Long-Term Efficacy and Safety of Anti-Obesity Treatment: Where Do We Stand? Curr Obes Rep. Nature Publishing Group; 2021. p. 14–30.
  3. Pilitsi E, Farr OM, Polyzos SA, Perakakis N, Nolen-Doerr E, Papathanasiou AE, et al. Pharmacotherapy of obesity: Available medications and drugs under investigation. Metabolism: Clinical and Experimental. 2019;92:170–92. [CrossRef]
  4. Armitage J. The safety of statins in clinical practice. Lancet. 2007;370:1781–90. [CrossRef]
  5. Seidah NG, Prat A. The Multifaceted Biology of PCSK9. Endocrine Reviews. 2022;43:558–82. [CrossRef]
  6. Alder M, Bavishi A, Zumpf K, Peterson J, Stone NJ. A Meta-Analysis Assessing Additional LDL-C Reduction from Addition of a Bile Acid Sequestrant to Statin Therapy. American Journal of Medicine. 2020;133:1322–7. [CrossRef]
  7. Mantovani A, Dalbeni A. Treatments for nafld: State of art. International Journal of Molecular Sciences. Int J Mol Sci; 2021. p. 1–27.
  8. Mendrick DL, Diehl AM, Topor LS, Dietert RR, Will Y, La Merrill MA, et al. Metabolic syndrome and associated diseases: From the bench to the clinic. Toxicological Sciences. 2018;162:36–42. [CrossRef]
  9. Mazidi M, Rezaie P, Karimi E, Kengne AP. The effects of bile acid sequestrants on lipid profile and blood glucose concentrations: A systematic review and meta-analysis of randomized controlled trials. International Journal of Cardiology. Elsevier Ireland Ltd; 2017. p. 850–7. [CrossRef]
  10. Zhu A, Chen J, Wu P, Luo M, Zeng Y, Liu Y, et al. Cationic polystyrene resolves nonalcoholic steatohepatitis, obesity, and metabolic disorders by promoting eubiosis of gut microbiota and decreasing endotoxemia. Diabetes. American Diabetes Association Inc.; 2017. p. 2137–43. [CrossRef]
  11. Zhou K, Xia W, Zhang C, (Lucy) Yu L. In vitro binding of bile acids and triglycerides by selected chitosan preparations and their physico-chemical properties. LWT. 2006;39:1087–92. [CrossRef]
  12. Sumiyoshi M, Kimura Y. Low molecular weight chitosan inhibits obesity induced by feeding a high-fat diet long-term in mice. Journal of Pharmacy and Pharmacology. 2010;58:201–7. [CrossRef]
  13. Zhang J, Liu J, Li L, Xia W. Dietary chitosan improves hypercholesterolemia in rats fed high-fat diets. Nutrition Research. 2008;28:383–90. [CrossRef]
  14. Bahijri SM, Alsheikh L, Ajabnoor G, Borai A. Effect of supplementation with chitosan on weight, cardiometabolic, and other risk indices in wistar rats fed normal and high-fat/high-cholesterol diets ad libitum. Nutr Metab Insights. 2017;10.
  15. Fukada Y, Kimura K, Ayaki Y. Effect of chitosan feeding on intestinal bile acid metabolism in rats. Lipids. 1991;26:395–9. [CrossRef]
  16. van Bennekum AM, Nguyen D V., Schulthess G, Hauser H, Phillips MC. Mechanisms of cholesterol-lowering effects of dietary insoluble fibres: relationships with intestinal and hepatic cholesterol parameters. British Journal of Nutrition. 2005;94:331–7. [CrossRef]
  17. Ni Mhurchu C, Poppitt SD, McGill AT, Leahy FE, Bennett DA, Lin RB, et al. The effect of the dietary supplement, Chitosan, on body weight: A randomised controlled trial in 250 overweight and obese adults. Int J Obes. 2004;28:1149–56.
  18. Bessell E, Maunder A, Lauche R, Adams J, Sainsbury A, Fuller NR. Efficacy of dietary supplements containing isolated organic compounds for weight loss: a systematic review and meta-analysis of randomised placebo-controlled trials. Int J Obes. Int J Obes (Lond); 2021. p. 1631–43. [CrossRef]
  19. Yuan Q, Shah J, Hein S, Misra RDK. Controlled and extended drug release behavior of chitosan-based nanoparticle carrier. Acta Biomaterialia. 2010;6:1140–8. [CrossRef]
  20. Katti KS, Katti DR, Dash R. Synthesis and characterization of a novel chitosan/montmorillonite/ hydroxyapatite nanocomposite for bone tissue engineering. Biomedical Materials. 2008;3. [CrossRef]
  21. Sivak O, Darlington J, Gershkovich P, Constantinides PP, Wasan KM. Protonated nanostructured aluminosilicate (NSAS) reduces plasma cholesterol concentrations and atherosclerotic lesions in apolipoprotein E deficient mice fed a high cholesterol and high fat diet. Lipids Health Dis. 2009;8:30. [CrossRef]
  22. Gershkovich P, Darlington J, Sivak O, Constantinides PP, Wasan KM. Inhibition of intestinal absorption of cholesterol by surface-modified nanostructured aluminosilicate compounds. J Pharm Sci. 2009;98:2390–400. [CrossRef]
  23. Gershkovich P, Sivak O, Contreras-Whitney S, Darlington JW, Wasan KM. Assessment of cholesterol absorption inhibitors nanostructured aluminosilicate and cholestyramine using in vitro lipolysis model. J Pharm Sci. 2012;101:291–300. [CrossRef]
  24. Xu P, Dai S, Wang J, Zhang J, Liu J, Wang F, et al. Preventive obesity agent montmorillonite adsorbs dietary lipids and enhances lipid excretion from the digestive tract. Sci Rep. 2016;6. [CrossRef]
  25. Xu P, Hong F, Wang J, Cong Y, Dai S, Wang S, et al. Microbiome Remodeling via the Montmorillonite Adsorption-Excretion Axis Prevents Obesity-related Metabolic Disorders. EBioMedicine. 2017;16:251–61. [CrossRef]
  26. Robinson A, Johnson NM, Strey A, Taylor JF, Marroquin-Cardona A, Mitchell NJ, et al. Calcium montmorillonite clay reduces urinary biomarkers of fumonisin B1 exposure in rats and humans. Food Additives and Contaminants - Part A Chemistry, Analysis, Control, Exposure and Risk Assessment. 2012;29:809–18. [CrossRef]
  27. Afriyie-Gyawu E, Wang Z, Ankrah NA, Xu L, Johnson NM, Tang L, et al. NovaSil clay does not affect the concentrations of vitamins A and E and nutrient minerals in serum samples from Ghanaians at high risk for aflatoxicosis. Food Additives and Contaminants - Part A Chemistry, Analysis, Control, Exposure and Risk Assessment. 2008;25:872–84. [CrossRef]
  28. Wang JS, Luo H, Billam M, Wang Z, Guan H, Tang L, et al. Short-term safety evaluation of processed calcium montmorillonite clay (NovaSil) in humans. Food Additives and Contaminants. 2005;22:270–9. [CrossRef]
  29. Mitchell NJ, Kumi J, Aleser M, Elmore SE, Rychlik KA, Zychowski KE, et al. Short-term safety and efficacy of calcium montmorillonite clay (UPSN) in children. American Journal of Tropical Medicine and Hygiene. 2014;91:777–85. [CrossRef]
  30. Gutman R, Rauch M, Neuman A, Khamaisi H, Jonas-Levi A, Konovalova Y, et al. Sepiolite Clay Attenuates the Development of Hypercholesterolemia and Obesity in Mice Fed a High-Fat High-Cholesterol Diet. J Med Food. 2020;23:289–96. [CrossRef]
  31. Zadaka-Amir D, Bleiman N, Mishael YG. Sepiolite as an effective natural porous adsorbent for surface oil-spill. Microporous and Mesoporous Materials. 2013;169:153–9. [CrossRef]
  32. Shaltiel-Harpaz L, Kreimer T, Dudai N, Kaspi R, Ben-Yakir D, Rytwo G. Sepiolite- rosemary oil combination as an environmentally oriented insecticide. Applied Clay Science. 2023;234:106838. [CrossRef]
  33. Aranda P, Darder M, Wicklein B, Rytwo G, Ruiz-Hitzky E. Clay-Organic Interfaces for Design of Functional Hybrid Materials. Hybrid Organic-Inorganic Interfaces. Weinheim, Germany: Wiley-VCH Verlag GmbH & Co. KGaA; 2017. p. 1–84.
  34. Rytwo G, Sitruk A, Lavi R, Khamaisi H, Gutman R. De-emulsification of oil emulsions by clays and biocomposites. 8th Mid-European Clay Conference. 2016.
  35. Darder M, Colilla M, Ruiz-Hitzky E. Biopolymer-clay nanocomposites based on chitosan intercalated in montmorillonite. Chemistry of Materials. 2003;15:3774–80. [CrossRef]
  36. An J-H, Dultz S. Adsorption of Cr(VI) and As(V) on chitosan-montmorillonite; selectivity and pH dependence. Clays and Clay Minerals. 2008;56:549–57. [CrossRef]
  37. Sakakibara S, Yamauchi T, Oshima Y, Tsukamoto Y, Kadowaki T. Acetic acid activates hepatic AMPK and reduces hyperglycemia in diabetic KK-A(y) mice. Biochem Biophys Res Commun. 2006;344:597–604. [CrossRef]
  38. Kondo T, Kishi M, Fushimi T, Kaga T. Acetic acid upregulates the expression of genes for fatty acid oxidation enzymes in liver to suppress body fat accumulation. J Agric Food Chem. 2009;57:5982–6. [CrossRef]
  39. Fushimi T, Suruga K, Oshima Y, Fukiharu M, Tsukamoto Y, Goda T. Dietary acetic acid reduces serum cholesterol and triacylglycerols in rats fed a cholesterol-rich diet. British Journal of Nutrition. 2006;95:916–24. [CrossRef]
  40. Beh BK, Mohamad NE, Yeap SK, Ky H, Boo SY, Chua JYH, et al. Anti-obesity and anti-inflammatory effects of synthetic acetic acid vinegar and Nipa vinegar on high-fat-diet-induced obese mice. Scientific Reports 2017 7:1. 2017;7:1–9. [CrossRef]
  41. Jalili M, Nazari M, Magkos F. Fermented Foods in the Management of Obesity: Mechanisms of Action and Future Challenges. Int J Mol Sci. Multidisciplinary Digital Publishing Institute; 2023. p. 2665. [CrossRef]
  42. Hattori M, Kondo T, Kishi M, Yamagami K. A single oral administration of acetic acid increased energy expenditure in C57BL/6J mice. Biosci Biotechnol Biochem. 2010;74:2158–9. [CrossRef]
  43. Oh I, Baek EJ, Lee DH, Choi YH, Bae IY. Anti-obesity and anti-inflammatory effects of ginseng vinegar in high-fat diet fed mice. Food Sci Biotechnol. 2019;28:1829–36. [CrossRef]
  44. Rytwo G, Lavi R, Rytwo Y, Monchase H, Dultz S, König TN. Clarification of olive mill and winery wastewater by means of clay-polymer nanocomposites. Science of the Total Environment. 2013;442:134–42. [CrossRef]
  45. Rytwo G, Lavi R, Konovalova Y, Gutman R. Adsorption of olive oil on clay minerals and nanocomposites. 51st Annual Meeting of the Clay Mineral Society. College Station, Texas, USA: The Clay Minerals Society; 2014. p. 199.
  46. Rytwo G, Sitruk A, Lavi R, Khamaisi H, Gutman R. De-emulsification of oil emulsions by clays and biocomposites. 8th Mid-European Clay Conference. 2016.
  47. Watanabe M, Morimoto K, Houten SM, Kaneko-Iwasaki N, Sugizaki T, Horai Y, et al. Bile Acid Binding Resin Improves Metabolic Control through the Induction of Energy Expenditure. PLoS One. 2012;7:e38286. [CrossRef]
  48. Heidker RM, Caiozzi GC, Ricketts ML. Grape seed procyanidins and cholestyramine differentially alter bile acid and cholesterol homeostatic gene expression in mouse intestine and liver. PLoS One. 2016;11. [CrossRef]
  49. Maugeais C, Annema W, Blum D, Mary JL, Tietge UJF. rHDL administration increases reverse cholesterol transport in mice, but is not additive on top of ezetimibe or cholestyramine treatment. Atherosclerosis. 2013;229:94–101. [CrossRef]
  50. Efsa, Aquilina G, Bach A, Bampidis V, Bastos MDL, Flachowsky G, et al. Scientific Opinion on the safety and efficacy of a preparation of bentonite-and sepiolite (Toxfin® Dry) as feed additive for all species. EFSA Journal. 2013;11:1–21.
  51. Gutman R, Rytwo G. Acicular clays and bio-composites based thereon for use in treatment of metabolic syndrome and related disorders. US; 2017.
  52. Gutman R, Choshniak I, Kronfeld-Schor N, Gutman, Choshniak I, Kronfeld-Schor N. Defending body mass during food restriction in Acomys russatus: A desert rodent that does not store food. Am J Physiol Regul Integr Comp Physiol. 2006;290. [CrossRef]
  53. Steckler R, Tamir S, Gutman R. Mice held at an environmental photic cycle oscillating at their tau-like period length do not show the high-fat diet-induced obesity that develops under the 24-hour photic cycle. Chronobiol Int. 2021;1–15. [CrossRef]
  54. Tschöp MH, Speakman JR, Arch JRS, Auwerx J, Brüning JC, Chan L, et al. A guide to analysis of mouse energy metabolism. Nat Methods. 2012;9:57–63.
  55. Ravussin Y, Gutman R, Diano S, Shanabrough M, Borok E, Sarman B, et al. Effects of chronic weight perturbation on energy homeostasis and brain structure in mice. Am J Physiol Regul Integr Comp Physiol. 2011;300:1352–62. [CrossRef]
  56. Ravussin Y, Gutman R, Leduc CA, Leibel RL. Estimating energy expenditure in mice using an energy balance technique. Int J Obes. 2013;37. [CrossRef]
  57. Ravussin Y, Gutman R, Leduc CA, Leibel RL. Erratum: Estimating energy expenditure in mice using an energy balance technique (International Journal of Obesity (2013) 37 (473) DOI: 10.1038/ijo.2012.147). Int J Obes. 2013;37. [CrossRef]
  58. Pullar JD, Webster AJF. The energy cost of fat and protein deposition in the rat. British Journal of Nutrition. 1977/05/01. 1977;37:355–63. [CrossRef]
  59. Schulz LO, Alger S, Harper I, Wilmore JH, Ravussin E. Energy expenditure of elite female runners measured by respiratory chamber and doubly labeled water. J Appl Physiol. 1992/01/01. 1992;72:23–8. [CrossRef]
  60. Hara A, Radin NS. Lipid extraction of tissues with a low-toxicity solvent. Anal Biochem. 1978;90:420–6. [CrossRef]
  61. Perwaiz S, Tuchweber B, Mignault D, Gilat T, Yousef IM. Determination of bile acids in biological fluids by liquid chromatography-electrospray tandem mass spectrometry. J Lipid Res. 2001;42:114–9. [CrossRef]
  62. Batta AK, Salen G, Rapole KR, Batta M, Batta P, Alberts D, et al. Highly simplified method for gas-liquid chromatographic quantitation of bile acids and sterols in human stool. J Lipid Res. 1999;40:1148–54. [CrossRef]
  63. Qi S, Wang C, Li C, Wang P, Liu M. Candidate genes investigation for severe nonalcoholic fatty liver disease based on bioinformatics analysis. Medicine (United States). 2017;96. [CrossRef]
  64. Gensure RC, Mäkitie O, Barclay C, Chan C, DePalma SR, Bastepe M, et al. A novel COL1A1 mutation in infantile cortical hyperostosis (Caffey disease) expands the spectrum of collagen-related disorders. Journal of Clinical Investigation. 2005;115:1250–7.
  65. Jull AB, Ni Mhurchu C, Bennett DA, Dunshea-Mooij CAE, Rodgers A. Chitosan for overweight or obesity. Cochrane Database of Systematic Reviews. John Wiley and Sons Ltd; 2008.
  66. Kondo T, Kishi M, Fushimi T, Ugajin S, Kaga T. Vinegar intake reduces body weight, body fat mass, and serum triglyceride levels in obese Japanese subjects. Biosci Biotechnol Biochem. 2009;73:1837–43. [CrossRef]
  67. Valdes DS, So D, Gill PA, Kellow NJ. Effect of Dietary Acetic Acid Supplementation on Plasma Glucose, Lipid Profiles, and Body Mass Index in Human Adults: A Systematic Review and Meta-analysis. J Acad Nutr Diet. 2021;121:895–914. [CrossRef]
  68. Petsiou EI, Mitrou PI, Raptis SA, Dimitriadis GD. Effect and mechanisms of action of vinegar on glucose metabolism, lipid profile, and body weight. Nutr Rev. 2014;72:651–61. [CrossRef]
  69. Zecharia D, Rauch M, Sharabi-Nov A, Tamir S, Gutman R. Postnatal administration of leptin antagonist mitigates susceptibility to obesity under high-fat diet in male αMUPA mice. Am J Physiol Endocrinol Metab. 2019;317:E783–93. [CrossRef]
  70. Biddinger SB, Almind K, Miyazaki M, Kokkotou E, Ntambi JM, Kahn CR. Effects of Diet and Genetic Background on Sterol Regulatory Element-Binding Protein-1c, Stearoyl-CoA Desaturase 1, and the Development of the Metabolic Syndrome. Diabetes. 2005;54:1314–23. [CrossRef]
  71. Podrini C, Cambridge EL, Lelliott CJ, Carragher DM, Estabel J, Gerdin A-K, et al. High-fat feeding rapidly induces obesity and lipid derangements in C57BL/6N mice. Mamm Genome. 2013;24:240–51. [CrossRef]
  72. Guo J, Jou W, Gavrilova O, Hall KD. Persistent diet-induced obesity in male C57BL/6 mice resulting from temporary obesigenic diets. PLoS One. 2009/04/30. 2009;4:e5370. [CrossRef]
  73. Williams LM, Campbell FM, Drew JE, Koch C, Hoggard N, Rees WD, et al. The development of diet-induced obesity and glucose intolerance in C57Bl/6 mice on a high-fat diet consists of distinct phases. PLoS One. 2014;9:e106159. [CrossRef]
  74. Fraulob JC, Ogg-Diamantino R, Fernandes-Santos C, Aguila MB, Mandarim-de-Lacerda CA. A mouse model of metabolic syndrome: Insulin resistance, fatty liver and Non-Alcoholic Fatty Pancreas Disease (NAFPD) in C57BL/6 mice fed a high fat diet. J Clin Biochem Nutr. 2010;46:212–23. [CrossRef]
  75. Li J, Wu H, Liu Y, Yang L. High fat diet induced obesity model using four strains of mice: kunming, c57bl/6, balb/c and icr. Exp Anim. 2020;69:326–35. [CrossRef]
  76. Murphy EF, Cotter PD, Healy S, Marques TM, O’Sullivan O, Fouhy F, et al. Composition and energy harvesting capacity of the gut microbiota: Relationship to diet, obesity and time in mouse models. Gut. 2010;59:1635–42. [CrossRef]
  77. Park S, Zhang T, Yue Y, Wu X. Effects of Bile Acid Modulation by Dietary Fat, Cholecystectomy, and Bile Acid Sequestrant on Energy, Glucose, and Lipid Metabolism and Gut Microbiota in Mice. Int J Mol Sci. 2022;23:5935. [CrossRef]
  78. Kusumoto Y, Irie J, Iwabu K, Tagawa H, Itoh A, Kato M, et al. Bile acid binding resin prevents fat accumulation through intestinal microbiota in high-fat diet-induced obesity in mice. Metabolism. 2017;71:1–6. [CrossRef]
  79. Kobayashi M, Ikegami H, Fujisawa T, Nojima K, Kawabata Y, Noso S, et al. Prevention and treatment of obesity, insulin resistance, and diabetes by bile acid-binding resin. Diabetes. 2007;56:239–47.
  80. Li X, Wang L, Li Y, Ho Y, Yang D, Chen Y, et al. Polysorbates as novel lipid-modulating candidates for reducing serum total cholesterol and low-density lipoprotein levels in hyperlipidemic C57BL/6J mice and rats. Eur J Pharmacol. 2011;660:468–75. [CrossRef]
  81. Nishida S, Horinouchi A, Higashimura Y, Akahori R, Matsumoto K. Cholestyramine, a bile acid sequestrant, increases cecal short chain fatty acids and intestinal immunoglobulin A in mice. Biol Pharm Bull. 2020;43:565–8. [CrossRef]
  82. Binyamin D, Werbner N, Nuriel-Ohayon M, Uzan A, Mor H, Abbas A, et al. The aging mouse microbiome has obesogenic characteristics. Genome Med. 2020;12. [CrossRef]
  83. Brodkorb A, Egger L, Alminger M, Alvito P, Assunção R, Ballance S, et al. INFOGEST static in vitro simulation of gastrointestinal food digestion. Nat Protoc. 2019;14:991–1014. [CrossRef]
  84. Wang H, Wang L, Cheng Y, Xia Z, Liao Y, Cao J. Efficacy of orlistat in non-alcoholic fatty liver disease: A systematic review and meta-analysis. Biomed Rep. Spandidos Publications; 2018. p. 90–6. [CrossRef]
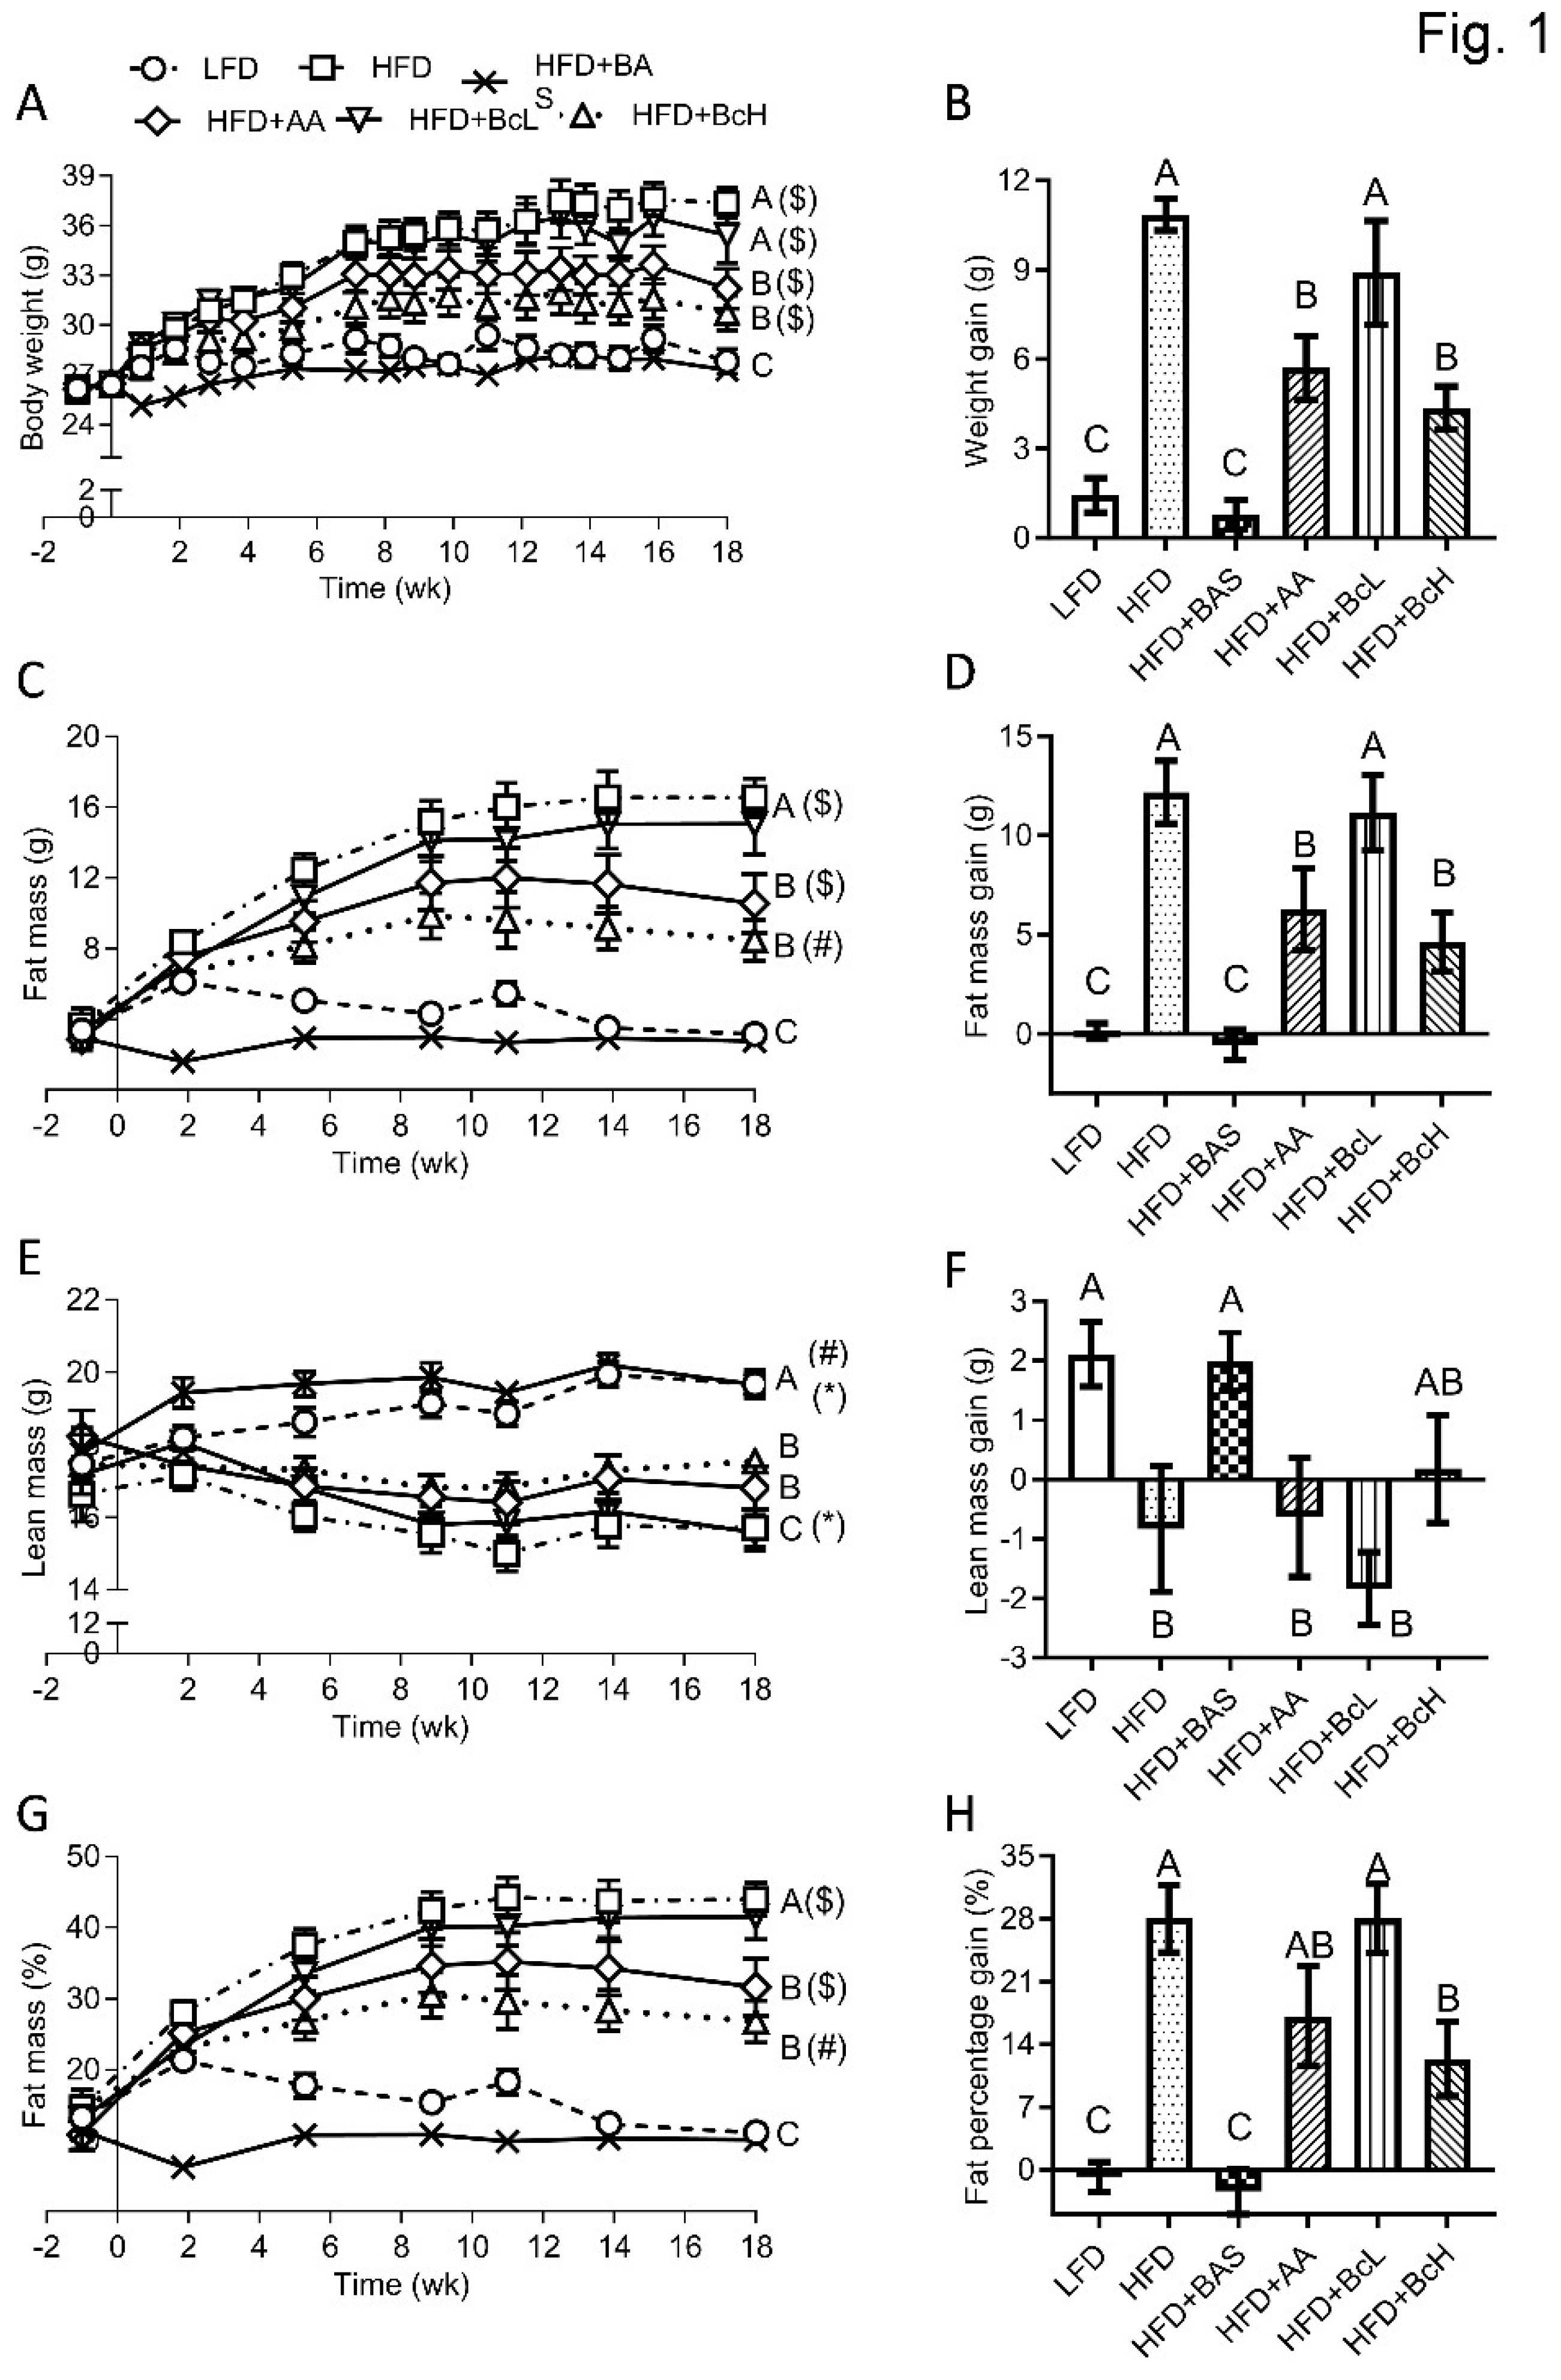
Figure 1. Effect of biocomposite supplementation, compared to control diets, on body weight (A), fat mass (C), lean mass (E), and fat percentage (G). Figures on the right (B, D, F, H) show the net change in the parameters through the 18-week follow-up. Different letters represent significant differences by FDR post hoc analysis following one-way ANOVA. n = 9 per group. Symbols in parentheses indicate endpoint vs. baseline comparison by FDR post hoc analysis following two-way repeated measures ANOVA, *, P < 0.05, #, P < 0.01, $, P < 0.001. LFD, low-fat diet; HFD+BAS, high-fat diet + 2% (w/w).
Preprints 121071 g001
Figure 2. Effect of biocomposite supplementation on energy homeostasis-related parameters compared to control diets. Food and energy intake (A and B), and energy intake corrected for metabolic mass (C); fecal output and fecal energy output (D and E); absorbed energy and its digestibility (F and G), and absorbed energy corrected for metabolic mass (H); energy expenditure (I), corrected for metabolic mass (J) and as a percentage of absorbed energy (K); and lipid intake (L), output (M), absorption (N), and digestibility (O). Different letters represent significant differences by FDR post hoc analysis following one-way ANOVA. n = 9 per group. For abbreviations, see the legend in Figure 1.
Preprints 121071 g002
Figure 3. Effect of biocomposite supplementation, compared to control diets, on daily output and composition of fecal bile salts (A–E), and corrected to lipid intake (F); hepatic lipid content (G); mRNA expression of collagen type 1 gene (Col1a1, H); and hepatic histology (I–N; I, LFD; J, HFD; K, HFD+BAS; L, HFD+AA; M, HFD+BcL; and N, HFD+BcH). Hepatic sections were imaged at x20 magnification. Scale bar, 200 µm. Arrows indicate lipid droplets. Different letters represent significant differences by FDR post hoc analysis following one-way ANOVA. n = 8–9 per group for bile data, n = 6 for hepatic histology and gene expression. LCA, lithocholic acid; DCA, deoxycholic acid; CDCA, chenodeoxycholic acid; CA, cholic acid. For other abbreviations, see the legend in Figure 1.
Preprints 121071 g003
Table 1. Formulation of the custom-prepared diets.
A. 
Formulation
Diets (g/kg of ingredients)
Ingredient Manufacturer, catalog no. Humidity (%)1 LFD HFD HFD+ּBAS2 HFD+AA3 HFD+BcL4 HFD+BcH4
Casein Frutarom, 9500682599 7.5 210 265 265 265 265 265
L-Cysteine MP Biomedicals, 210144490 <0.1 3 4 4 4 4 4
Maltodextrin Zhucheng Dongxiao Biotec. 4.6 465 160 160 160 160 160
Cornstarch Galam 7.8 100 0 0 0 0 0
Sucrose Sugat, 290000211503 <0.1 90 90 90 90 90 90
Beef fat Local slaughterhouse 7.3 20 310 310 310 310 310
Soybean oil Supersal, 2900024317 <0.1 20 30 30 30 30 30
Cellulose MP Biomedicals, 0219149991 5.9 37.25 65.6 65.6 65.6 65.6 65.6
Mineral mix MP Biomedicals, 0296040002 0.3 35 48 48 48 48 48
Calcium phosphate Sigma, c7263 0.1 2 3.4 3.4 3.4 3.4 3.4
Vitamin mix MP Biomedicals, 0296040201 0.8 15 21 21 21 21 21
Choline bitartrate MP Biomedicals, 0210138483 0.1 2.75 3 3 3 3 3
Total ingredients (g) 1000 1000 1000 1000 1000 1000
Abbreviations: LFD, low-fat diet based on TD.08806 (Envigo); HFD, high-fat diet based on TD.06414 (Envigo); HFD+BAS, HFD + 2% (w/w) cholestyramine; HFD+AA, HFD+3.0% (w/w) acetic acid; HFD+BcL, high-fat diet + 0.8% (w/w) biocomposite; HFD+BcH, high-fat diet + 5.0% (w/w) biocomposite. 1Humidity in ingredients (%) measured by oven-drying for at least 72 h or until constant weight at 65 ºC. 2Bile acid sequestrant (cholestyramine). 3Acetic acid. 4Chitosan and sepiolite at a 0.8:1 ratio in 1 N acetic acid, resulting in final concentrations of 2.5% sepiolite and 2% chitosan (w/v) in 1 N acetic acid.
Table 2. Dietary compounds and nutritional composition of the custom-prepared diets.
Supplemented compounds, on top (g) Humidity (%) LFD HFD HFD + ּBAS HFD + AA HFD + BcL HFD + BcH
Cholestyramine (2% w/w) 7 201
Acetic acid, 1 N (3% w/w) 94.0 4802
Biocomposite3 (0.8% w/w) 98.3 803
Biocomposite3 (5% w/w) 90.0 4803
Added water 540 80 80
Total weight (g) 1540 1080 1100 1480 1080 1480
Selected nutritional information
Humidity in diet (%)4 20.8 11.5 8.7 14.1 11.2 11.1
Carbohydrates (%, w/w)5 65.8 28.9 28.4 28.9 28.7 27.7
Protein (%, w/w)5 20.7 26.3 25.8 25.6 26.1 25.1
Fat (%, w/w)5 4.1 33.5 32.9 32.6 33.3 31.9
Carbohydrates (% of MEI)6,7 69.5 22.1 22.1 21.8 22.1 21.9
Protein (% of MEI)6,7 21.2 20.1 20.1 19.9 20.1 19.9
Fat (% of MEI)6,7 9.3 57.8 57.8 58.2 57.8 58.2
Metabolizable energy (kcal/g)7 3.9 5.2 5.1 5.1 5.2 5.0
Combustible energy (kcal/g; mean ± SE)8 4.1±0.25 5.9±0.1 5.8±0.03 5.7±0.04 5.6±0.08 5.7±0.06
Lipids (%)9 5.1±0.04 33.8±0.1 33.3±0.1 30.1±0.1 31.3±0.1 34.0±0.2
Abbreviations: LFD, low-fat diet based on TD.08806 (Envigo); HFD, high-fat diet based on TD.06414 (Envigo); HFD+BAS, HFD+2% (w/w) cholestyramine; HFD+AA, HFD+3.0% (w/w) acetic acid; HFD+BcL, HFD+0.8% (w/w) biocomposite; HFD+BcH, HFD+5.0% (w/w) biocomposite, MEI, metabolizable energy intake. 3Chitosan and sepiolite at a 0.8:1 ratio in 1 N acetic acid, resulting in final concentrations of 2.5% sepiolite and 2% chitosan (w/v) in 1 N acetic acid. 4Humidity in ingredients (%) measured by oven-drying for at least 72 h or until constant weight at 65 ºC. 5Calculated for 1 kg final dry diet, including food supplements, considering the humidity in each ingredient and the total diet. 6Calculated percentage of metabolizable energy intake (kcal) in the final dry diet considering the humidity in each ingredient and the total diet. 7Calculated metabolizable energy content, considering the humidity in each ingredient, including food supplements, in the final diet. Estimated based on Atwater factors assigning 4 kcal/g to dry protein, 9 kcal/g to dry fat, 4 kcal/g to dry available carbohydrate, 0.89 kcal/g to dry mineral mix as it contains 22.1% sucrose, 3.84 kcal/g to dry vitamin mix as it contains 96.0% sucrose, and 0.11994 kcal/g 1 N acetic acid. 8Combustible energy content, measured by bomb calorimetry following oven-drying for at least 72 h or until constant weight at 65 ºC. 9Dietary lipids, measured by extraction for 2 h at 40 °C using a hexane–isopropanol (3:2 v/v) mixture.
Table 3. List of primers used for quantitative real-time PCR.
Gene Forward primer Reverse primer
Col1a1 GCTCCTCTTAGGGGCCACT CCACGTCTCACCATTGGGG
Gapdh GGTCTACATGTTCCAGTA CCCATTTGATGTTAGTGG
Table 4. Characteristics of mice’s blood glucose and seral lipid (mg/dL).
Parameter Time point LFD HFD HFD+ּBAS1 HFD+AA2 HFD+BcL3 HFD+BcH3
Glucose Baseline 130.3±5.0 130±5.5 129.8±7.9 137.8±6.7 135.8±3.5 130.8±3.7
End 144.2±4.1BC 173.8±7.6A$ 135.6±2.7C 155.7±5.8AB* 166±6.3A$ 159.4±7AB$
Tri Baseline 72.9±3.7 80.1±3.7 68.9±1.1 72.1±3.3 72.3±4.8 77.1±2.6
End 75.6±3.0A 69.7±2.9AB* 46.8±4.0C$ 68.7±4.1AB 68±4.4AB 62.2±4.2B#
Total
Cholesterol
Baseline 162.2±5.4 137.8±10.4 167.9±5.4 164.1±12.9 153.3±6 139.0±5.6
End 147.7±20.5 182.0±21.2# 158.0±8.4 180.2±15.1 193±13# 174.6±7.8#
HDL
Cholesterol
Baseline 104.9±3.3 92.9±7.7 104.5±3.4 100.9±5.4 102±2.6 96.4±2.6
End 85.2±9.0B* 116.6±12.6A* 105.2±4.6A 117.3±8.5A* 129±8.6A* 109±5.7AB
LDL
Cholesterol
Baseline 41.3±2.5 28.8±2.7 49.4±3.6 36.0±3.7 36.6±4.6 29.7±2.6
End 33.5±5.4 51.4±9.2$ 43.3±3.9 42.4±6.4 50±10.8 53.6±6.9$
VLDL
Cholesterol
Baseline 14.7±0.8 15.9±0.8 13.8±0.2 14.1±0.7 13.6±0.6 15.3±0.6
End 15.0±0.7A 13.9±0.6AB* 9.2±0.8C$ 13.8±0.8AB 14±1AB 12.3±0.8B#
Abbreviations: LFD, low-fat diet based on TD.08806 (Envigo); HFD, high-fat diet based on TD.06414 (Envigo); HFD+BAS, HFD+2% (w/w) cholestyramine; HFD+AA, HFD+3.0% (w/w) acetic acid; HFD+BcL, HFD+0.8% (w/w) biocomposite; HFD+BcH, HFD+5.0% (w/w) biocomposite; Tri, triglycerides; HDL, high-density lipoprotein; LDL low-density lipoprotein; VLDL, very-low-density lipoprotein. n = 5–9 per group. Different letters represent significant differences between diets at the endpoint by FDR post hoc analysis following two-way repeated measures ANOVA. *, P < 0.05, #, P < 0.01, $, P < 0.001 vs. baseline by FDR post hoc analysis following two-way repeated measures ANOVA. 1Bile acid sequestrant (cholestyramine). 2Acetic acid. 3Chitosan and sepiolite at a 0.8:1 ratio in 1 N acetic acid, resulting in final concentrations of 2.5% sepiolite and 2% chitosan (w/v).
Disclaimer/Publisher’s Note: The statements, opinions and data contained in all publications are solely those of the individual author(s) and contributor(s) and not of MDPI and/or the editor(s). MDPI and/or the editor(s) disclaim responsibility for any injury to people or property resulting from any ideas, methods, instructions or products referred to in the content.
Copyright: This open access article is published under a Creative Commons CC BY 4.0 license, which permit the free download, distribution, and reuse, provided that the author and preprint are cited in any reuse.
Alerts
Prerpints.org logo

Preprints.org is a free preprint server supported by MDPI in Basel, Switzerland.

Subscribe

© 2025 MDPI (Basel, Switzerland) unless otherwise stated