Preprint
Article

A Hybrid Improved Particle Swarm Optimization and Genetic Algorithm for Energy Efficient Task Offloading in Industrial IoT Edge Computing Network

Altmetrics

Downloads

45

Views

27

Comments

0

This version is not peer-reviewed

Submitted:

14 October 2024

Posted:

15 October 2024

You are already at the latest version

Alerts
Abstract
Mobile Edge Computing (MEC) is a growing concept that expands on cloud computing technology. It leverages edge infrastructure to efficiently manage computationally intensive and time-sensitive tasks. By tapping into the capabilities of 7G network infrastructure, MEC can effectively reduce latency by transferring computing tasks from edge devices to edge servers. As part of Industrial 4.0 revolution, the use of large number of IOT sensors, edge devices, and edge servers are increasing at rapid phase. To effectively process these sensor and device data with less power and low latency is a key challenge. Here comes the need for an effective task offloading strategy to edge servers. This strategy must meet the industrial automation requirements of reduced energy usage and faster processing. A solution based on an Improved Particle Swarm Optimization with Genetic Algorithm (IPSOGA) is designed. It harnesses the power of effective exploration using Particle Swarm Optimization (PSO) and maintain genetic diversity within the population using Genetic Algorithm (GA). This hybrid approach is powerful in solving complex optimization problems with the aims to effective resource allocation, faster task offloading decisions, and consequently reduce processing delays. The proposed IPSOGA is compared with popular metaheuristic algorithms like Genetic Algorithm (GA) and Simulated Annealing (SA), and it has been proven to be superior in task offloading strategy by effectively reducing processing delays, energy consumption, and optimizing resource allocation efficiently.
Keywords: 
Subject: Computer Science and Mathematics  -   Computational Mathematics

1. Introduction

The era of seventh generation (7G) mobile communications has already begun in many countries, and people are benefiting from the improvements it brings compared to 6G networks. 7G networks introduce higher frequency ranges and provide higher capacity with ultra-low latency communications. The 7G era will see the emergence of applications with advanced data processing requirements, such as autonomous systems, smart cities, smart agriculture, smart homes, wearables, industrial IoT, next generation healthcare, Immersive Extended Reality (XR), Satellite Integration, etc. Data processing from these applications generates a huge amount of traffic. This influx not only puts a huge strain on network bandwidth, but also poses challenges associated with central processing. Along with 7G technology, edge computing is being used in IIoT applications where data is processed closer to the production line and edge devices. Commonly used data is processed in MEC servers deployed in industrial networks near production lines to reduce latency and energy consumptions. With the increasing use of resource- and energy-constrained IoT sensors and devices in edge processing, it is becoming increasingly challenging to manage time-delay-sensitive sensor data for decision-making at the edge. This has led to the use of MEC [1,2] in IIoT where edge sensor data is delegated to nearby MEC servers for computation. The main research focus in current edge computing revolves around efficient offloading of tasks from smart devices to edge servers to ensure effective and rational offloading decisions to utilize edge network services. IIoT is nothing but the use of various industrial control sensors to collect and process sensor data over industrial private 7G-enabled cellular networks. It also includes sensor data analysis in the production process to improve production efficiency, costs and resource consumption. Ultra-low latency and reliable data processing are two key criteria for industrial processing [3,4]. In the industrial environment huge amounts of sensor data are generated for processing at edge, but due to its low memory and capacity it must offload to central server or cloud for heavy processing which will introduce high processing time and energy. Therefore, a key challenge for IIOT is effective resource utilization for delay sensitive processing. In this research, we considered IIoT environment, where smart edge devices and sensors offload heavy computing tasks to MEC servers in smart factories.
Figure 1 depicts high level industrial layers with various sensors, devices and servers used in smart building energy management system with environment sensors. For example, if the data from the temperature monitoring sensor is always high, you may need to check the nearby camera for fire, check the optimal operating range of the equipment to control the smoke level, take alarm measures, or adjust the heating and ventilation system in the industry. Such kinds of intelligent decision making requires aggregated sensor data processing. The main challenge is to efficiently offload tasks from edge sensors to nearby MEC servers, optimize the allocation of computing resources of MEC servers to ensure processing efficiency, and meet the latency criteria of critical tasks. Considering the increasing requirements for task processing latency without compromising energy consumption, finding an optimal task offloading strategy is of utmost importance.

2. Related Work

A new paradigm MEC is introduced as a smarter computing choice for industrial IoT computing strategies [1,2]. Various research is carried out in MEC like edge server allocation [5], application or task offloading [6,7], and network topology [8] in IIoT. The general research direction in MEC is to optimize task offloading of edge devices to nearby edge servers to reduce overall task processing cost by making effective task delegation decisions. In MEC, a resource management method using Multiple Applications in Edge Architecture (RMMAE) has been proposed for performing intelligent resource allocation in heterogeneous networks [9]. However, keeping energy consumption low is a challenge. To address this challenge, T. Tan et al. [10] devised the FastVA method to perform deep learning-based video analytics through edge processing and neural processing units (NPUs) on mobile devices.
Vijayaram et al. [11] proposed intelligent task offloading for wireless edge devices in MEC using hyper-heuristics, including low-level heuristic algorithms such as Gray Wolf Optimization (GWO), Cuckoo Search (CS), and Tabu Search (TS) used to optimize energy consumption and computing time in 5G environments. Yung-Ting et al. [12] proposed a Real Time two stage Ant Colony Optimization strategy (RTACO) to decreases make span and processing time in MEC environment. Liu et al. [13] presented a visual tracking approach by introducing target matching in computer vision to get highly reliable exact and quick object tracing for automotive industry using MEC. Sun et al. [14] proposed an evolutionary method called multi population multi objective genetic algorithm (MMOGA) focusing on reducing energy consumption and latency in IIoT. Furthermore, a Deep Reinforcement based Learning (DRL) based computing offloading based on Software Defined Edge Computing (SDEC) approach was investigated in IIoT [15].
In summary, previous research on task offloading has mainly focused on aspects such as decomposing a task into subtasks, deciding whether to do remote task computation or to do local computation, deciding the number of tasks to offload, and exploring similar edge server environments. However, in IIOT environment where huge number of sensors and servers are involved, effectively offloading tasks from edge sensors or devices to heterogeneous edge servers considering multiple objectives like faster task processing, low latency and low energy consumption is difficult. Current literature does not adequately model this multidisciplinary problem, nor does it effectively address direct influence of overall cost with time delay and energy constraint. This paper aims to address these issues precisely.

3. Problem Definition

For IIoT scenarios in the 7G environment, factory production lines are equipped with multiple edge devices, such as wireless mobile devices, wireless IP cameras, and augmented reality devices, referred to as “multi-user.” Due to the substantial amount of data that needs processing in factory environments, more than one MEC servers are always required to manage tasks from these smart sensors, referred to as “multi-MEC.” In this paper we experimented our proposed IPSOGA algorithm to find the optimal solution for offloading edge sensors data and edge device task to edge server with minimum delay and task processing time.
In this study, the IIoT environment is considered, assuming there are N Edge servers and M smart sensors or devices which will be offloading task to a nearby MEC servers for processing. Tasks considered are non-sharable, where each edge device submits only one task at a time until it gets the computation results back. There are two possibilities, either task can be self-processed by edge device or delegated to one of MEC servers, resulting in N + 1 possible computation options (N MEC servers + 1 local execution). This paper focuses on three critical objectives namely time delay, processing time and energy consumption.

4. Processing Delay Formulation

Total processing delay ( T o D i j ) to finish i t h task on j t h server involves task processing delay ( P D i j ) and task transmission delay ( T r D i j ) , which can be calculated as
T o D i j = P D i j + T r D i j
Fi is defined as the CPU cycles required to handle every bit of ith task, Di is defined as the size of ith task and F s , j is defined as the CPU frequency of the jth server. Thus, the task total size is calculated as DiFi, and the task processing delay is calculated as:
P D i j = D i F i F s , j
The data transmission delay of the edge server is calculated using Shannon’s formula after obtaining the channel transmission rate:
r i , j = W 1 + P i C g i , j W N 0
We define Pi as the network transmission power of each edge sensor or device, Cgi,j as the channel gain for transmission from the ith device to the jth MEC server, while W represent the network transmission capacity, and N0 refers as noise density. Hence, the task transmission delay ( T r D ) can be expressed as:
T r D i j = D i F i r i , j

5. Energy Consumption Formulation

The energy consumption ( E C i j ) for the ith task on the jth MEC server is the sum of processing energy consumption (PEC) and transmission energy consumption (TEC). It is given by:
E C i j = P E C calc   , i j + T E C tran   , i j
The processing energy consumption ( P E C i j ) is influenced by the amount of computing tasks and is calculated as:
P E C i j = S c i V 2 F s , j D i F i
where Sci is switching capacitance, and V is voltage. The TEC of a tasks offloaded to the edge server also includes T r D . Hence, the transmission energy consumption ( T E C i j ) is
T E C i j = P i T r D i j
where Pi represents the ith edge sensor’s network transmission power. Finally, the total energy consumption is
E i j = S c i V 2 F s , j D i F i + D i F i r i , j P i

6. Calculation Model

One of our objectives is to reduce processing delay. Without considering queuing delay, a scenario can arise where some MEC server with higher computing capacity receives more tasks for computation. This can lead to excessive energy consumption by the high-performance server, potentially exceeding its maximum energy capacity. To alleviate this issue, tasks can be load balanced with all edge servers. Therefore, incorporating a penalizing factor to load balance edge servers is considered.
F ( X ) = j = 1 N   i = 1 M   T o D i j +   penalty   ( X )
penalty   ( X ) = g j = 1 N   i = 1 M   E C i j E m a x j
where E m a x j represents the jth edge server’s maximum energy consumption limit, M represents the task count to be processed and OV = {ov1, ov2, …, ovM} represents the offloading vector. Each element ovi is defined as either ovi = 0 for local execution or ovi ∈ [1, N] for edge server execution. To carefully maintain pareto optimality, we considered incorporating weights for both the penalty and delay functions. Then the fitness function will look like:
F X = w 1 j = 1 N   i = 1 M   T o D i j + w 2 g j = 1 N   i = 1 M   E C i j E m a x j
Here, the weights w1 and w2 are used to tune the delay and penalty functions, respectively and g denotes the penalty coefficient factor. The penalty function accounts for the load balancing across all MEC servers to ensure energy constraints are not violated.

7. Algorithm Implementation

Improved Particle Coding

PSO is a computational method used for optimization problems, by imitating the way birds or fish move together in groups. The method is based on the idea that individual elements (particles) can work together and interact with their surroundings to produce sophisticated overall outcomes. Each element in the swarm represents a potential solution to the problem being optimized. The PSO algorithm models each bird in a flock as a lightweight particle with two characteristics: velocity (V) and position (P). The rate of movement of particle is denoted as velocity and the direction of particle movement is denoted as position.
Every individual particle in the system examines the available options and selects the most suitable solution for itself, which it stores as its personal best (pbest). This individual best value is shared with other particles in the swarm. The algorithm then identifies the optimum solution among all particles, called the global best (gbest).
All particles adjust their V and P based on their personal best and the global best. This collaborative and iterative process aims to converge on the global optimal solution.
For our experiment let’s have the below assumptions,
  • T as task count,
  • N as edge server count,
  • CFreqs = {CFreqs,1, CFreqs,2, CFreqs,3 … CFreqs,N} represents the edge server CPU frequency, and
  • channel gain matrix Cg as
C g = C g 1,1 C g 1,2 C g 1 , N C g 2,1 C g 2,2 C g 2 , N C g M , 1 C g M , 2 C g M , N
The channel gain Cgi,i for local execution is 0 and channel gain Cgi,j needed for edge device i to transfer the data to edge server j is denoted as (1 ≤ iT, 1 ≤ jN, i = j), Edge device CPU frequency is represented as CFrequ = CFrequ,1, CFrequ,2, CFrequ,3 … CFrequ,T and transmit power of edge device is represented as P = {P1, P2, P3 … PT}.
As part of particle coding, each element of particle is represented within the range 0 to N. Here particle dimension should be same as task sets dimension. The particle position vector (PPV) = {pp1, pp2, …, ppT} is randomly initialized and represent where the tasks are delegated. For example, if a task set has 4 tasks, like CT = {c1, c2, c3, c4} and having the particle code as [0, 2, 4, 5], means that the task c1 is processed in edge device itself, and c2 is delegated to the edge server with id as 2, and so on.
The particle velocity vector (PVV) represents the range of offloading tasks to other edge servers, denoted as PVV = {pv1, pv2, …, pvT}. Initially, each particle is assigned a random velocity keeping the dimension of the PVV matching task count to be offloaded. For example, if particle position vector PPV is [4, 2, 1, 7], and the PVV is [1, 2, 3, 1] then the first item in PPV, 4, indicates that task c1 is computed at the edge server with id as 4. The last item in PVV, 1, means that the task c1 is moved to the next appropriate edge server with id as 7.
The overall cost calculation subject to energy usage limitations, is already expressed in Equation (11) as fitness function.
  • Steps in Algorithm
The detailed steps involved in the proposed IPSOGA algorithm is given as below:
  • S1: Population Initialization
Start by creating the population, assigning initial velocities and positions to the particles.
  • S2: Fitness Value Calculation
From the particle’s position vector calculate the particle’s new fitness value using the fitness function and store it.
  • S3: Identify the Group’s Best Fitness Value
If the particle’s new fitness value is lower than the current best fitness value, update the best fitness value and store the corresponding position vector.
  • S4: Update Particle Position and Velocity
Update the position and velocity of the particles using the below equations:
p v i = W p p v i + l 1 U 1 P best   p p i + l 2 U 2 G best   p p i
p p i = p p i + p v i
where:
  • Wp is the inertia weight, a positive constant to balance the global search (Higher the value improves the exploration) and local search (lower the value improves the exploitation).
  • Pbest is the particle’s personal best position.
  • Gbest is the swam’s global best position.
  • p v i is the ith particle velocity.
  • p p i is the ith particle position.
  • l1 and l2 are cognitive and social learning factors.
  • U1 and U2 are random numbers
To enhance the PSO algorithm’s exploration capability, the acceleration learning factors l1 and l2 are dynamically adjusted from higher value to lower value as follows:
l 1 = l 2 = l _ m a x ( l _ m a x l _ m i n n ) i
where:
  • n is max iteration count.
  • i is current iteration
  • l_max as 2.5 and l_min as 1.5
  • S5: Genetic Algorithm (GA) Operations
  • Selection: Select a collection of particles based on their fitness (e.g., tournament selection or roulette wheel selection).
  • Crossover: Do crossover on selected collection of particles to produce new offsprings.
  • Mutation: Do mutation to the crossover offsprings to maintain diversity.
  • Merge Population: Combine the original particle population with the new mutated offsprings, by replacing least performing particles.
  • Evaluation: Evaluate the fitness of the new population.
  • Update Best Positions: Update the particle’s personal and global best position values if better solutions are found.
  • S6: Termination
Algorithm is terminated if global best solution is found or until the maximum iteration is reached.
Algorithm: IPSOGA
  • initialize population of particles by randomly setting the code for each particle;
  • convergence = 0.001
  • Evaluate initial fitness and set personal bests(pBest) for each particle
  • # Main Optimization Loop
  • Continue loop until termination criterion not met:
  • # PSO Operations
  • for every particle in population:
  • partical velocity is updated using Eq. 13
  • partical position is updated using Eq. 14
  • evaluate the new fitness of the particle
  • particle’s personal best (Pbest) is updated
  • particle’s global best (Gbest) is updated
  • end for
  • # GA Operations
  • selected_particles = subset_selection(particles)
  • offspring = crossover(selected_particles)
  • mutated_offspring = mutation(offspring)

18.
# Merge populations
19.
new_population = least performant particles are replaced in population with mutated_offspring

20.
# Evaluate new population
21.
for every particle in new_population:
22.
do fitness evalution for particle
23.
personal best (Pbest) is updated
24.
global best (Gbest) is updated
25.
end for

26.
#Check for convergence
27.
If swam’s global best (Gbest) <= convergence
28.
Global best soln is found, do task offloading after decoding particle codes
29.
Exit Continue Loop
30.
End if
31.
end Continue loop

8. Results Analysis and Discussion

Experiment Settings

IPSOGA algorithm is implemented using Java and simulates different task offloading scenarios with respect to IIOT use cases. In this experiment 15 MEC servers and M smart sensors and devices are considered for doing the offloading operation. The parameter settings used in our experiment is listed in Table 1.

Baseline Algorithms

(1) Genetic Algorithm (GA)

GA is a computational method which mimics the genetic processes and natural selection described in Darwin’s evolutionary theory. This approach aims to find the best solution by replicating his theory. According to Darwin’s survival of the fittest principle, the individuals with the strongest traits are more likely to pass them on to the next generation; by repeating this process, the initial population is refined, leading to more accurate approximations. In each generation, individuals are selected based on their suitability within the problem context. By applying natural genetic operators like crossover and mutation, fresh population of optimal solutions are generated.
The evolutionary process of a population mirrors natural selection, resulting in a generation better suited to the given environment. The optimal individual identified represents an approximate ideal solution to the problem at hand. The genetic algorithm entails several key steps: encoding, initializing the population, assessing individual fitness, selection, crossover, and mutation.
The selection, or regeneration, step involves retaining superior individuals while discarding inferior ones, either directly passing on fitting individuals to the next generation or new individuals are generated by crossover and pairing. The crossover operation enhances the algorithm’s search capacity by replacing and recombining parts of the parent individuals’ structures to produce new ones. Finally, random alterations are made to certain individuals to maintain diversity within the population.

(2) Simulated Annealing Algorithm (SA)

SA is a metaheuristic optimization technique inspired by the process of heating and gradually cooling a material. This method is based on the idea that at high temperatures, the atoms in the material move rapidly, and as the temperature decreases, their kinetic energy diminishes, allowing the atoms to arrange in a specific ordered structure. This results in the formation of high-density, low-energy regular crystals, which correspond to the global optimal solution in the algorithm. However, if the temperature drops too quickly, the atoms may not have enough time to form a dense crystalline structure, thus leading to an amorphous state with higher energy, which is a local optimal solution.
The SA algorithm follows these steps:
  • Initialization: Temperature (T) initialization and solution state (S) initialization.
  • Iteration: Generate a new solution S′, then calculate the increment ΔE=C(S′)−C(S), where C(S) is the cost function.
  • If ΔE<0, then S′ is accepted as the new current solution.
  • If ΔE≥0,S′ is accepted as the new current solution with a probability of exp(−ΔE/T).
  • Termination: If the termination condition is met, the current solution is output as the optimal solution, and the program terminates.
By using the above two famous algorithms as baselines, the performance of the proposed IPSOGA strategy can be evaluated and compared effectively.

9. Results Analysis

In this research, the proposed IPSOGA offloading strategy different performance metrics are compared with other optimization methods like SA and GA. The experiment settings are given in Table 1. The experiment assumes task processing happens without any queuing to minimize time delay.
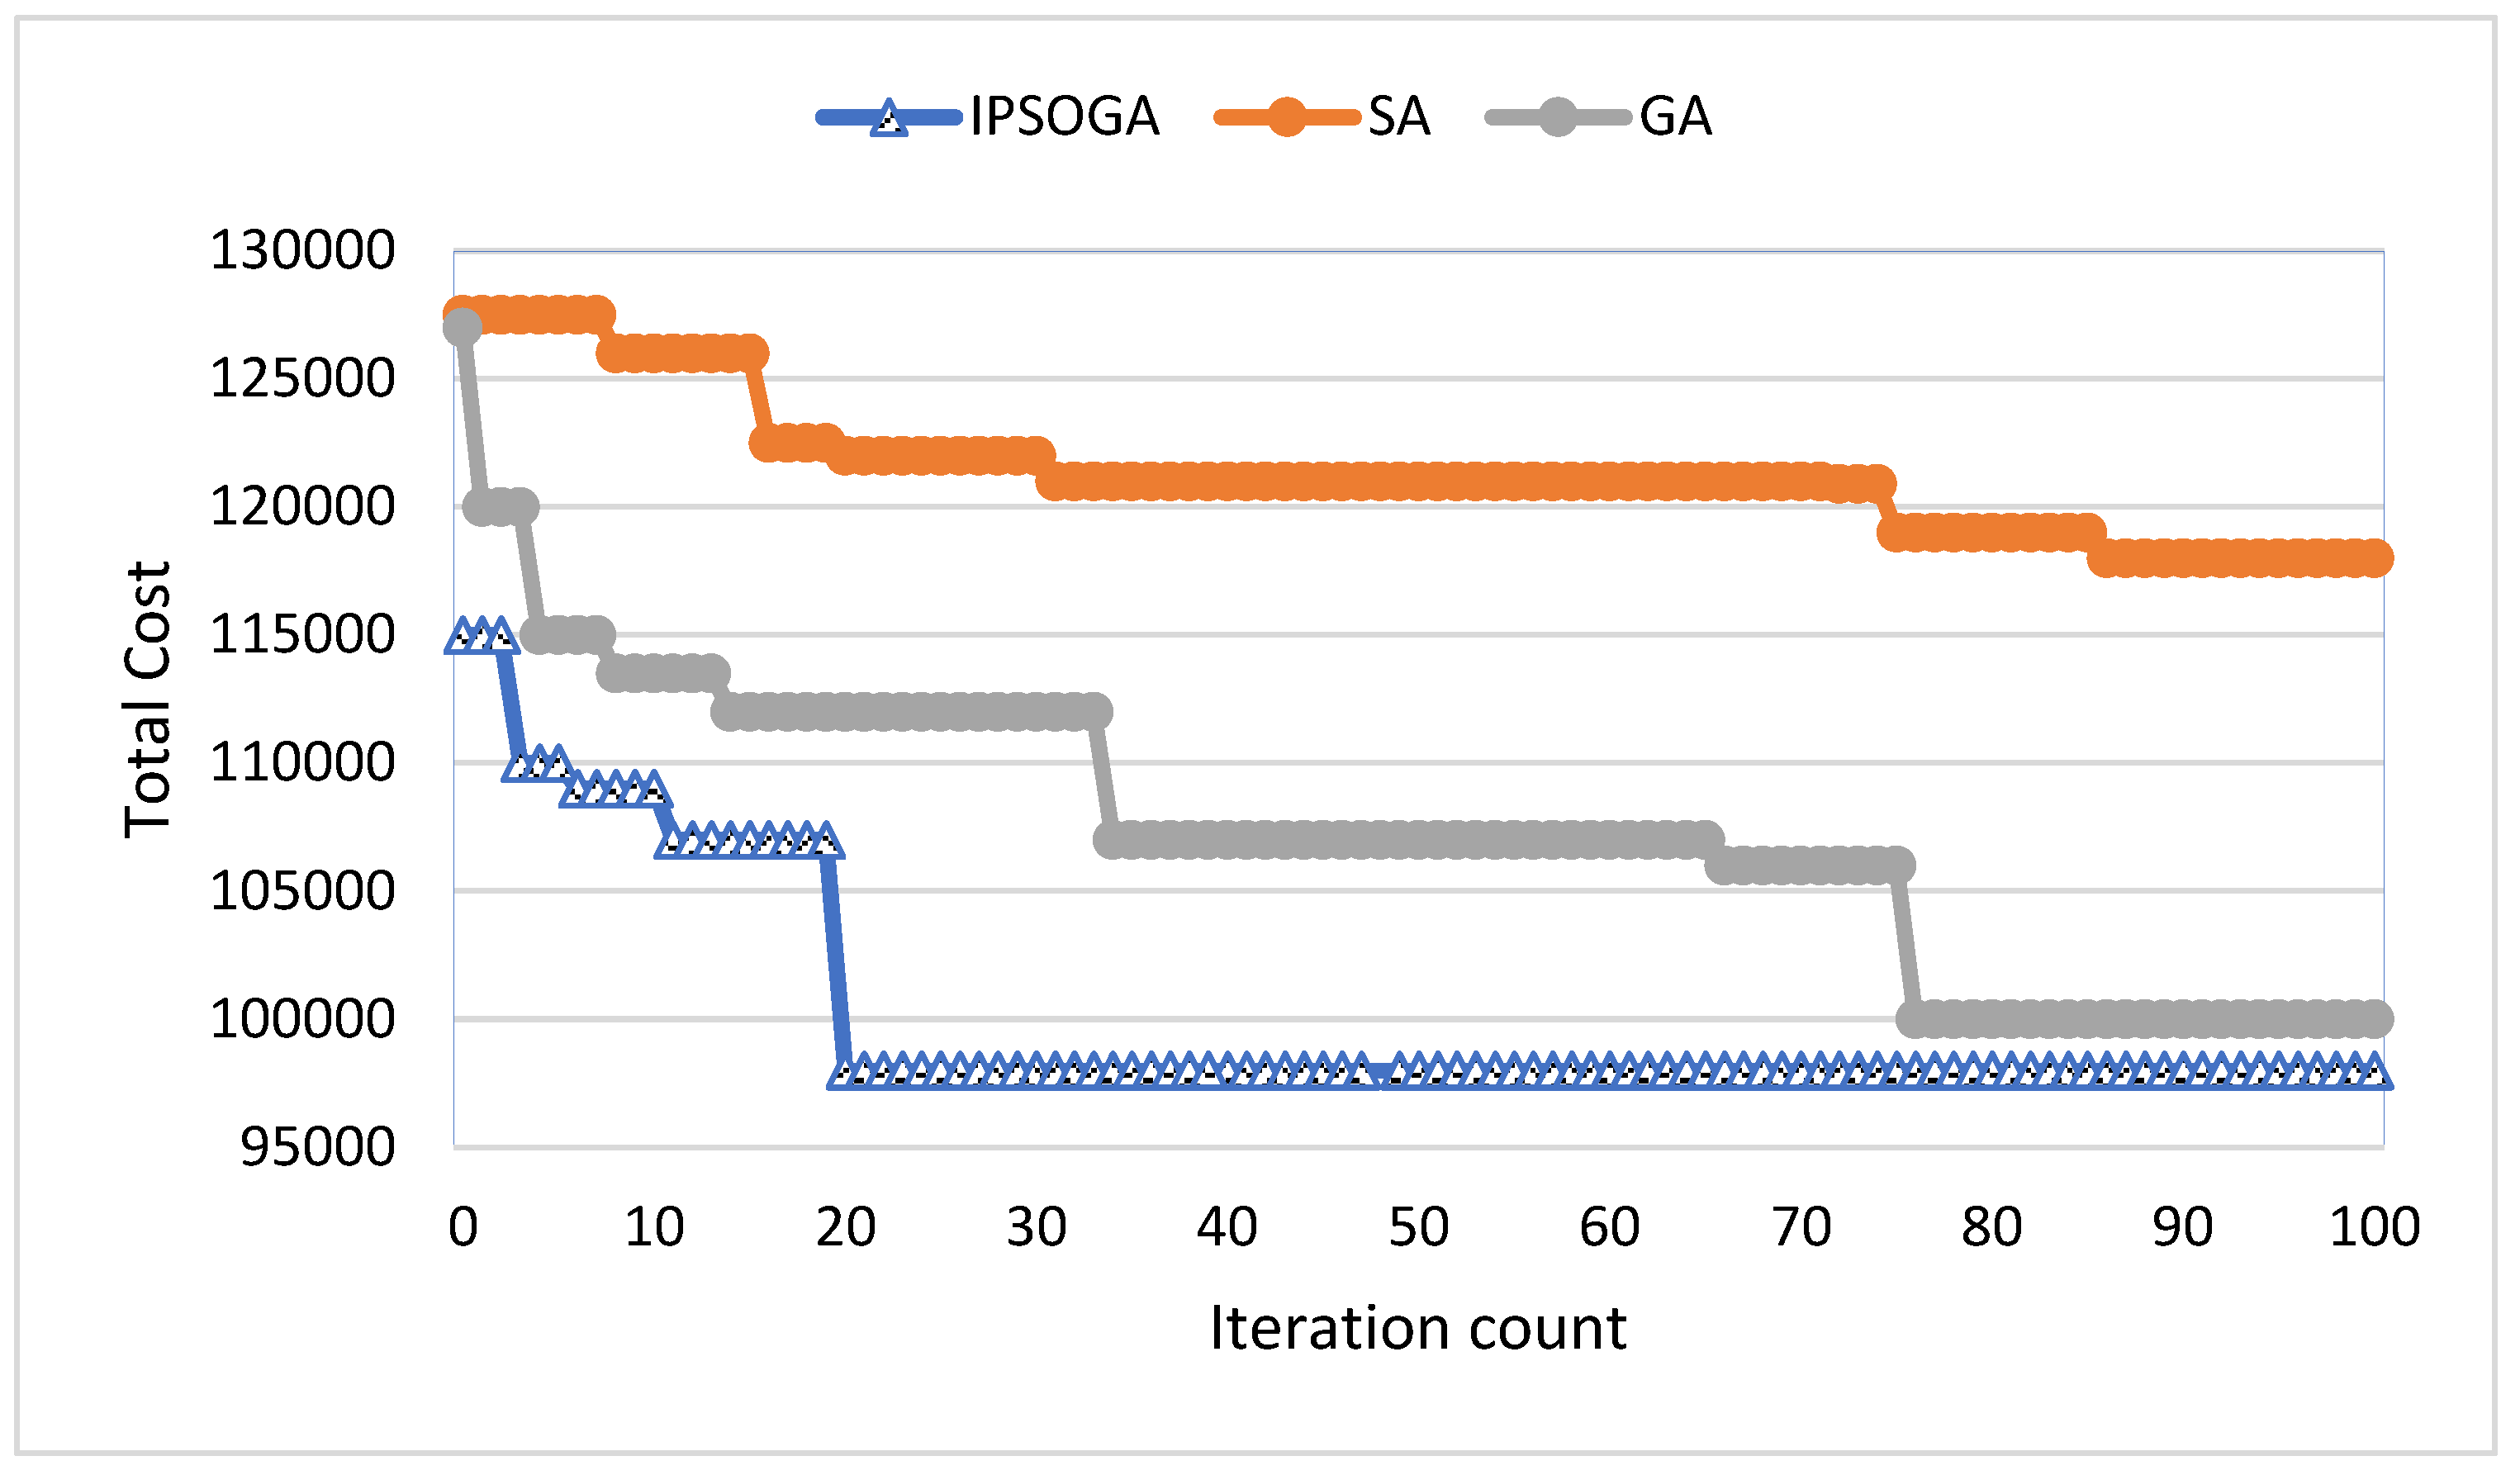
Figure 2 evaluates the convergence performance of three algorithms with the settings defined in the Table 1. As seen from Figure 2 IPSOGA converges faster to optimum solution within 25 iterations, whereas other algorithms take more than 80 iterations to converge. During initial phase, IPSOGA has a strong search for global optimum solution due the hybridization of GA in global search space, demonstrating good exploration and exploitation phases. GA converges faster than SA within the first 35 iterations and found near optimum solution after 75 iterations. Finaly SA algorithm was struggling to find the optimum solution within 100 iterations and does not converge well as compared to the proposed IPSOGA and GA.
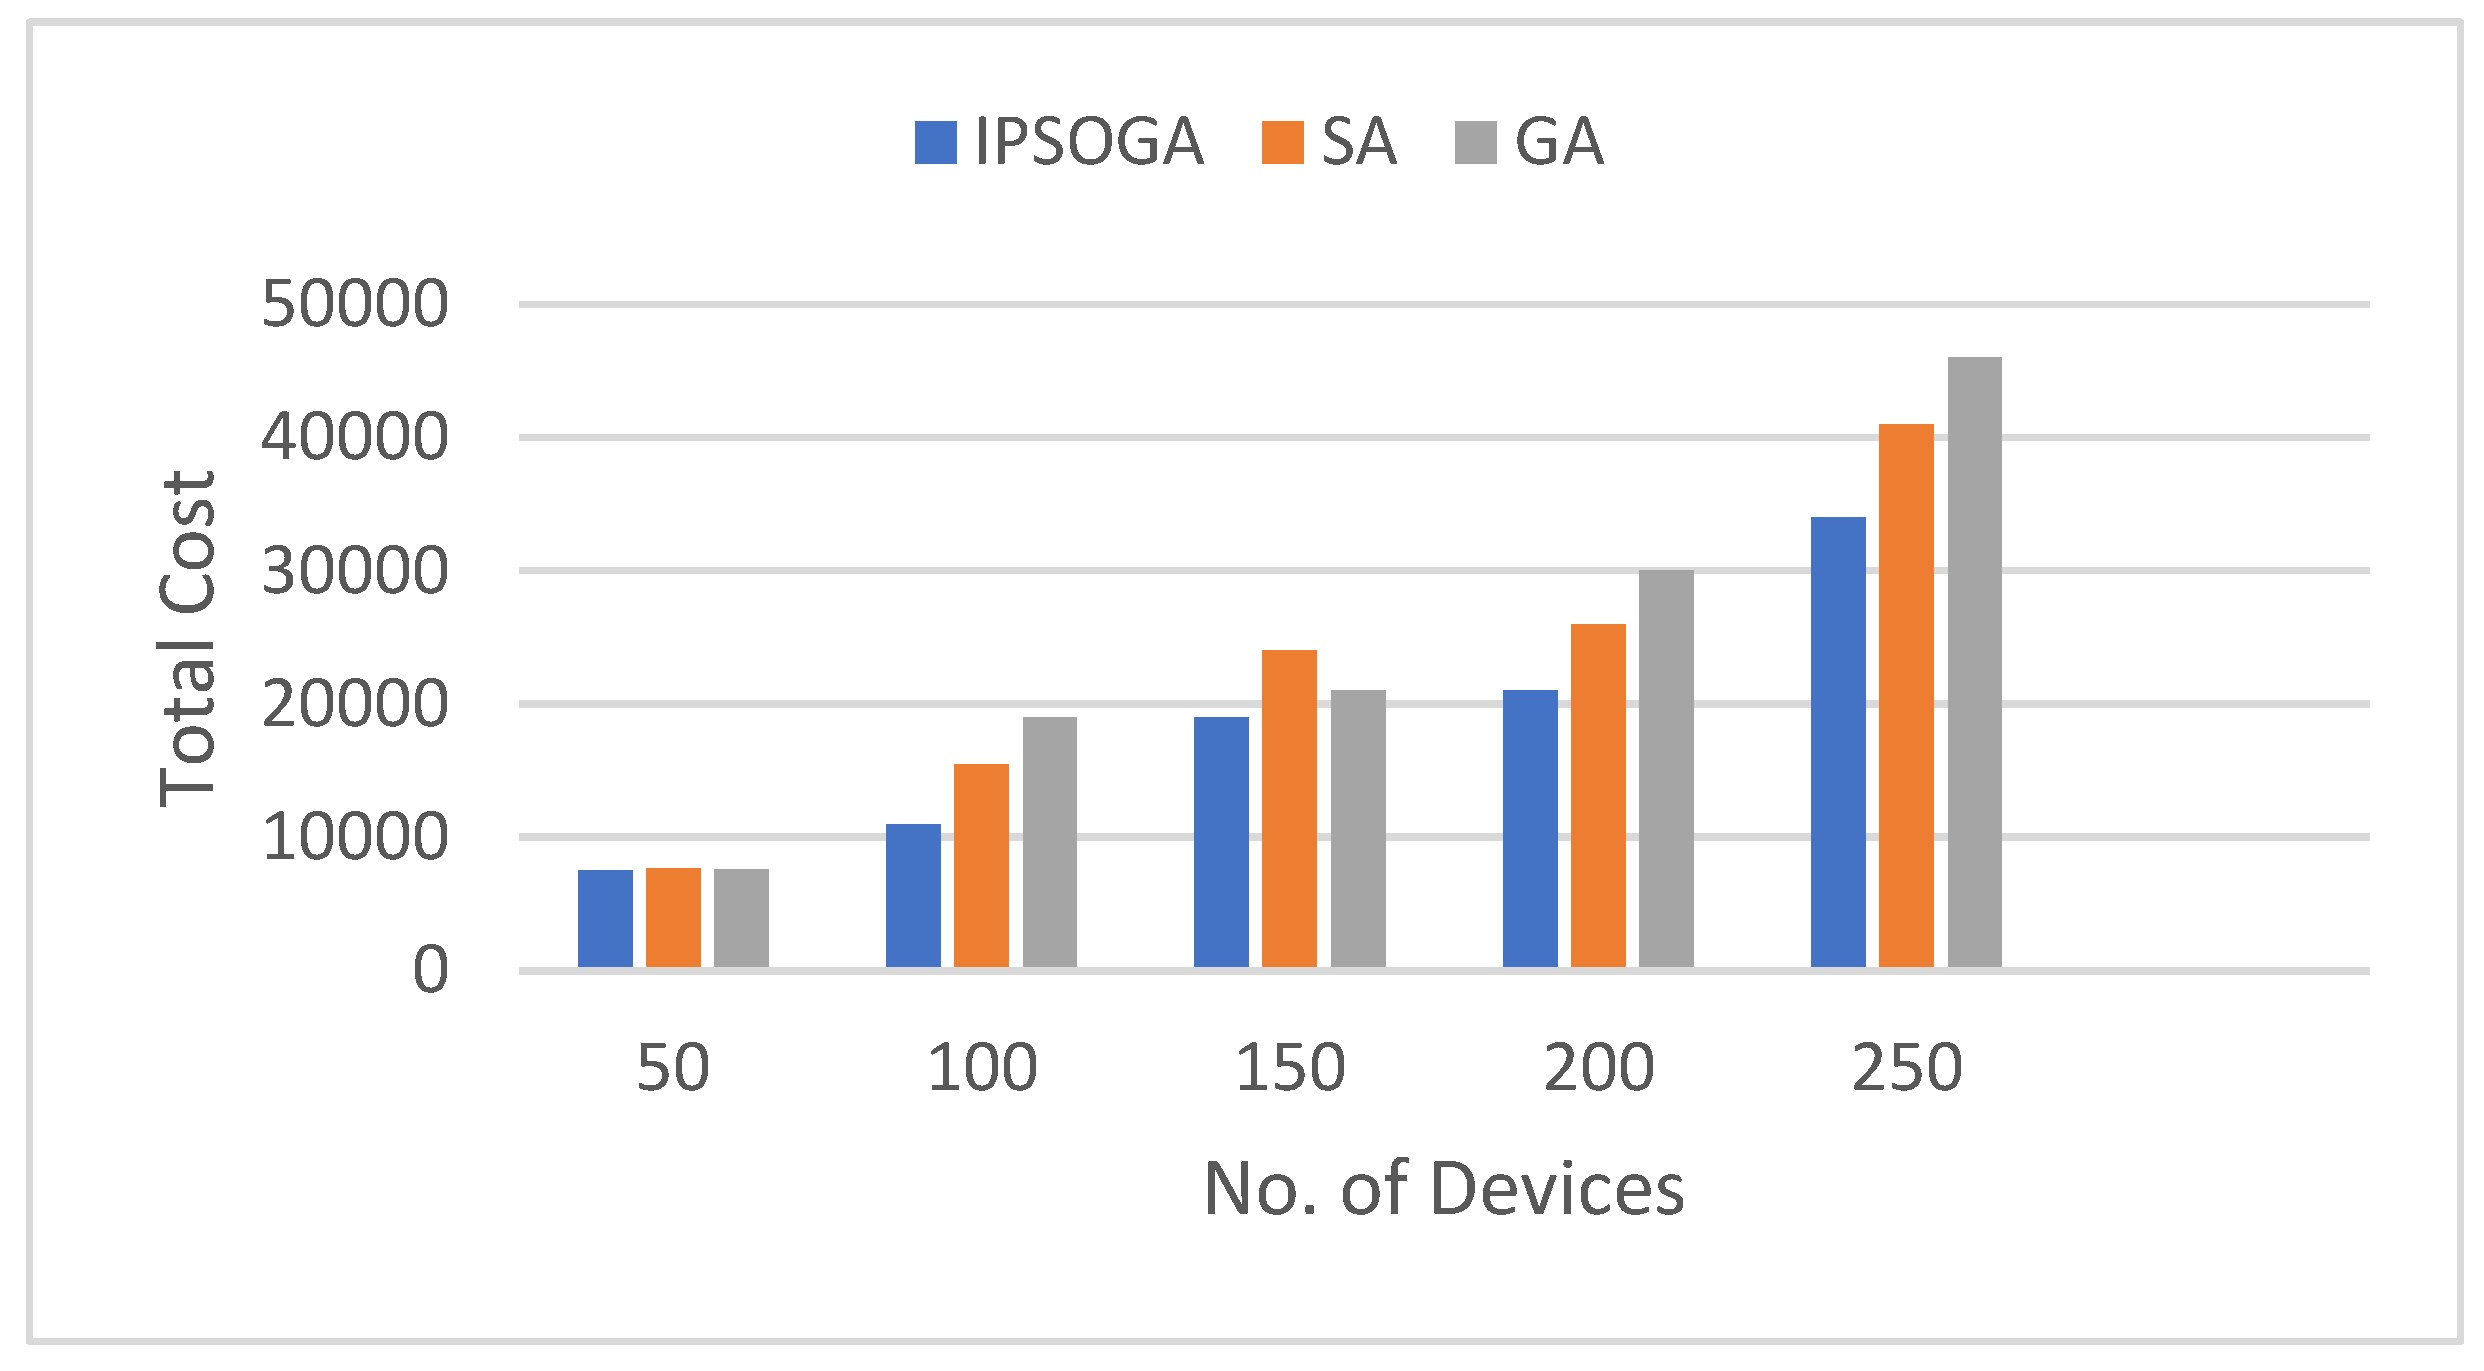
However, the experiment can be configured for a maximum device count, which we set to 250. Figure 3 shows total cost comparison for three algorithms with varying device count with same edge server count and task data size as given in the above Table 1.
It is found that as device count increases, the average total delay also increases due to the higher processing and transmission times required. However, IPSOGA shows a smaller increase in total delay compared to SA and GA as the number of tasks grows. For device counts under 150, the results of SA and GA are not significantly different from those of IPSOGA. The total cost for GA begins to rise rapidly as the device count exceeds 150, going much higher than that of IPSOGA. As shown in the figure, with 250 devices, IPSOGA outperforms other two algorithms.
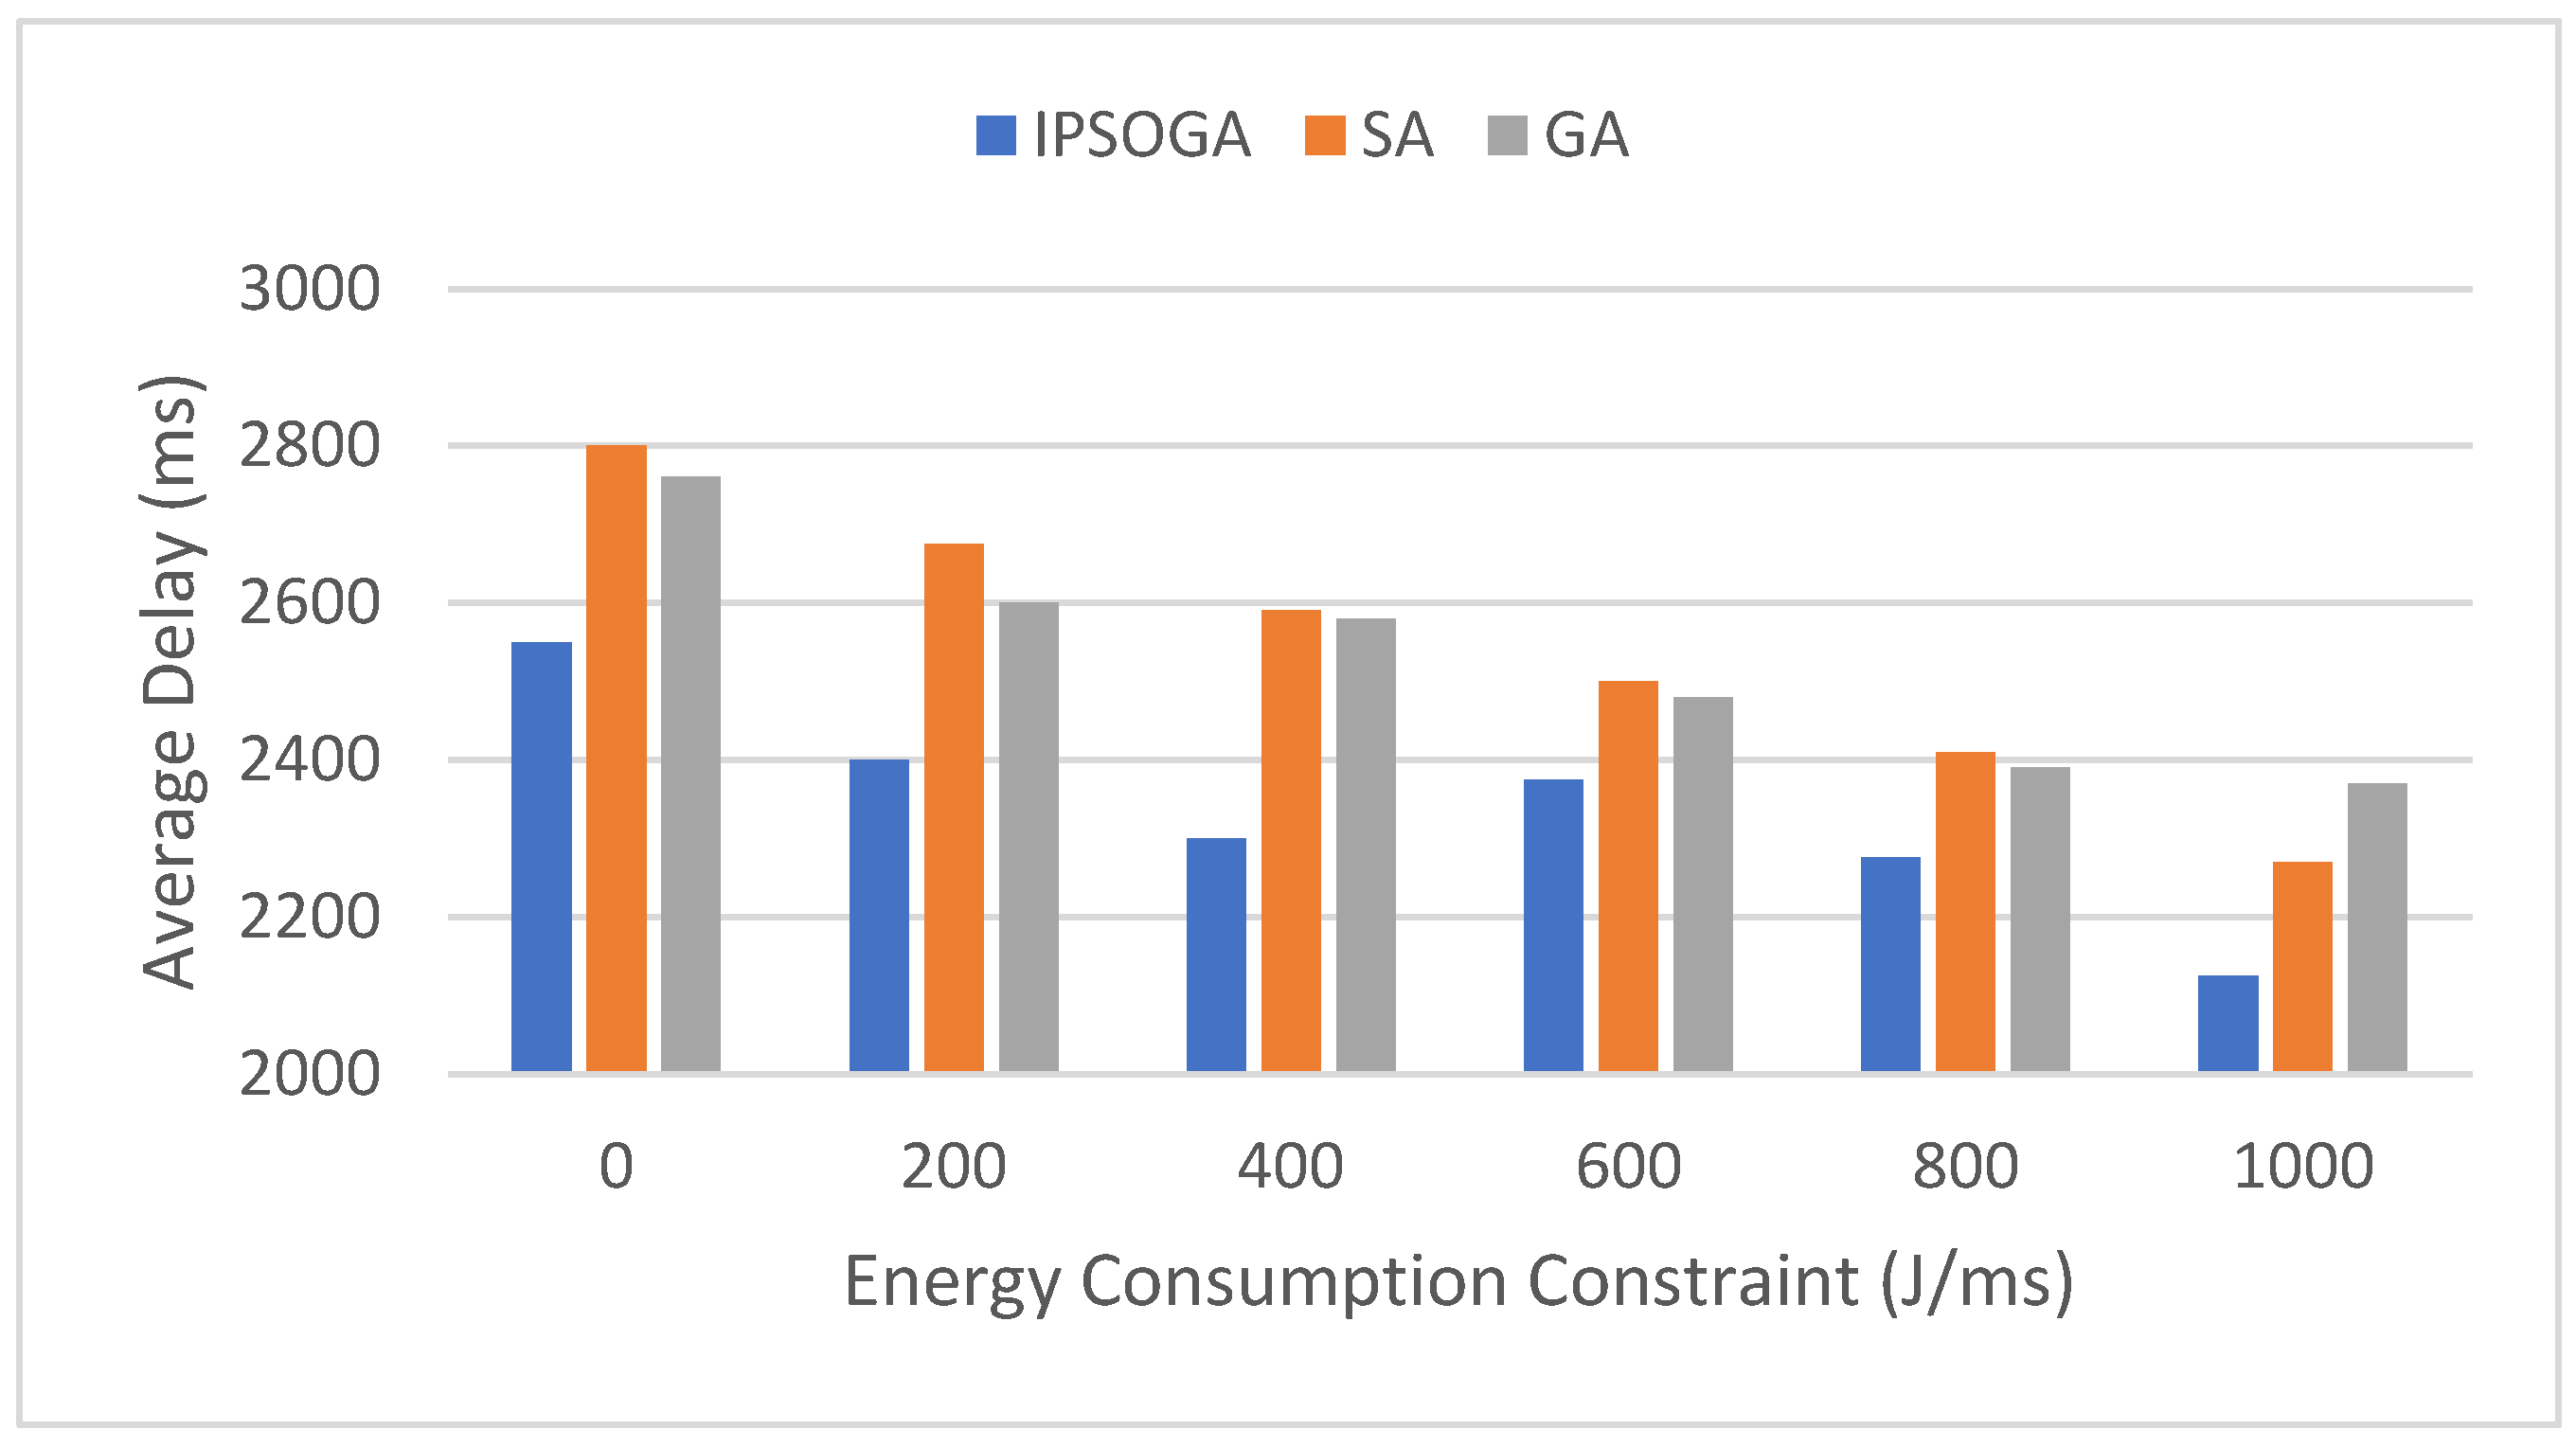
Figure 4 compares the average delays of IPSOGA with SA and GA under different energy consumption constraints. IPSOGA has a significantly lower average delay compared to SA and GA for energy consumption constraint as 0 J/ms. Average delays of all algorithms gradually decrease as the energy consumption constraint increases. However, IPSOGA consistently maintains a much lower average delay than SA and GA. When the energy consumption reaches around 850 J/ms, SA’s average delay becomes lower than GA’s. At 0 J/ms, IPSOGA outperforms SA and GA by approximately 10% in terms of average delay.
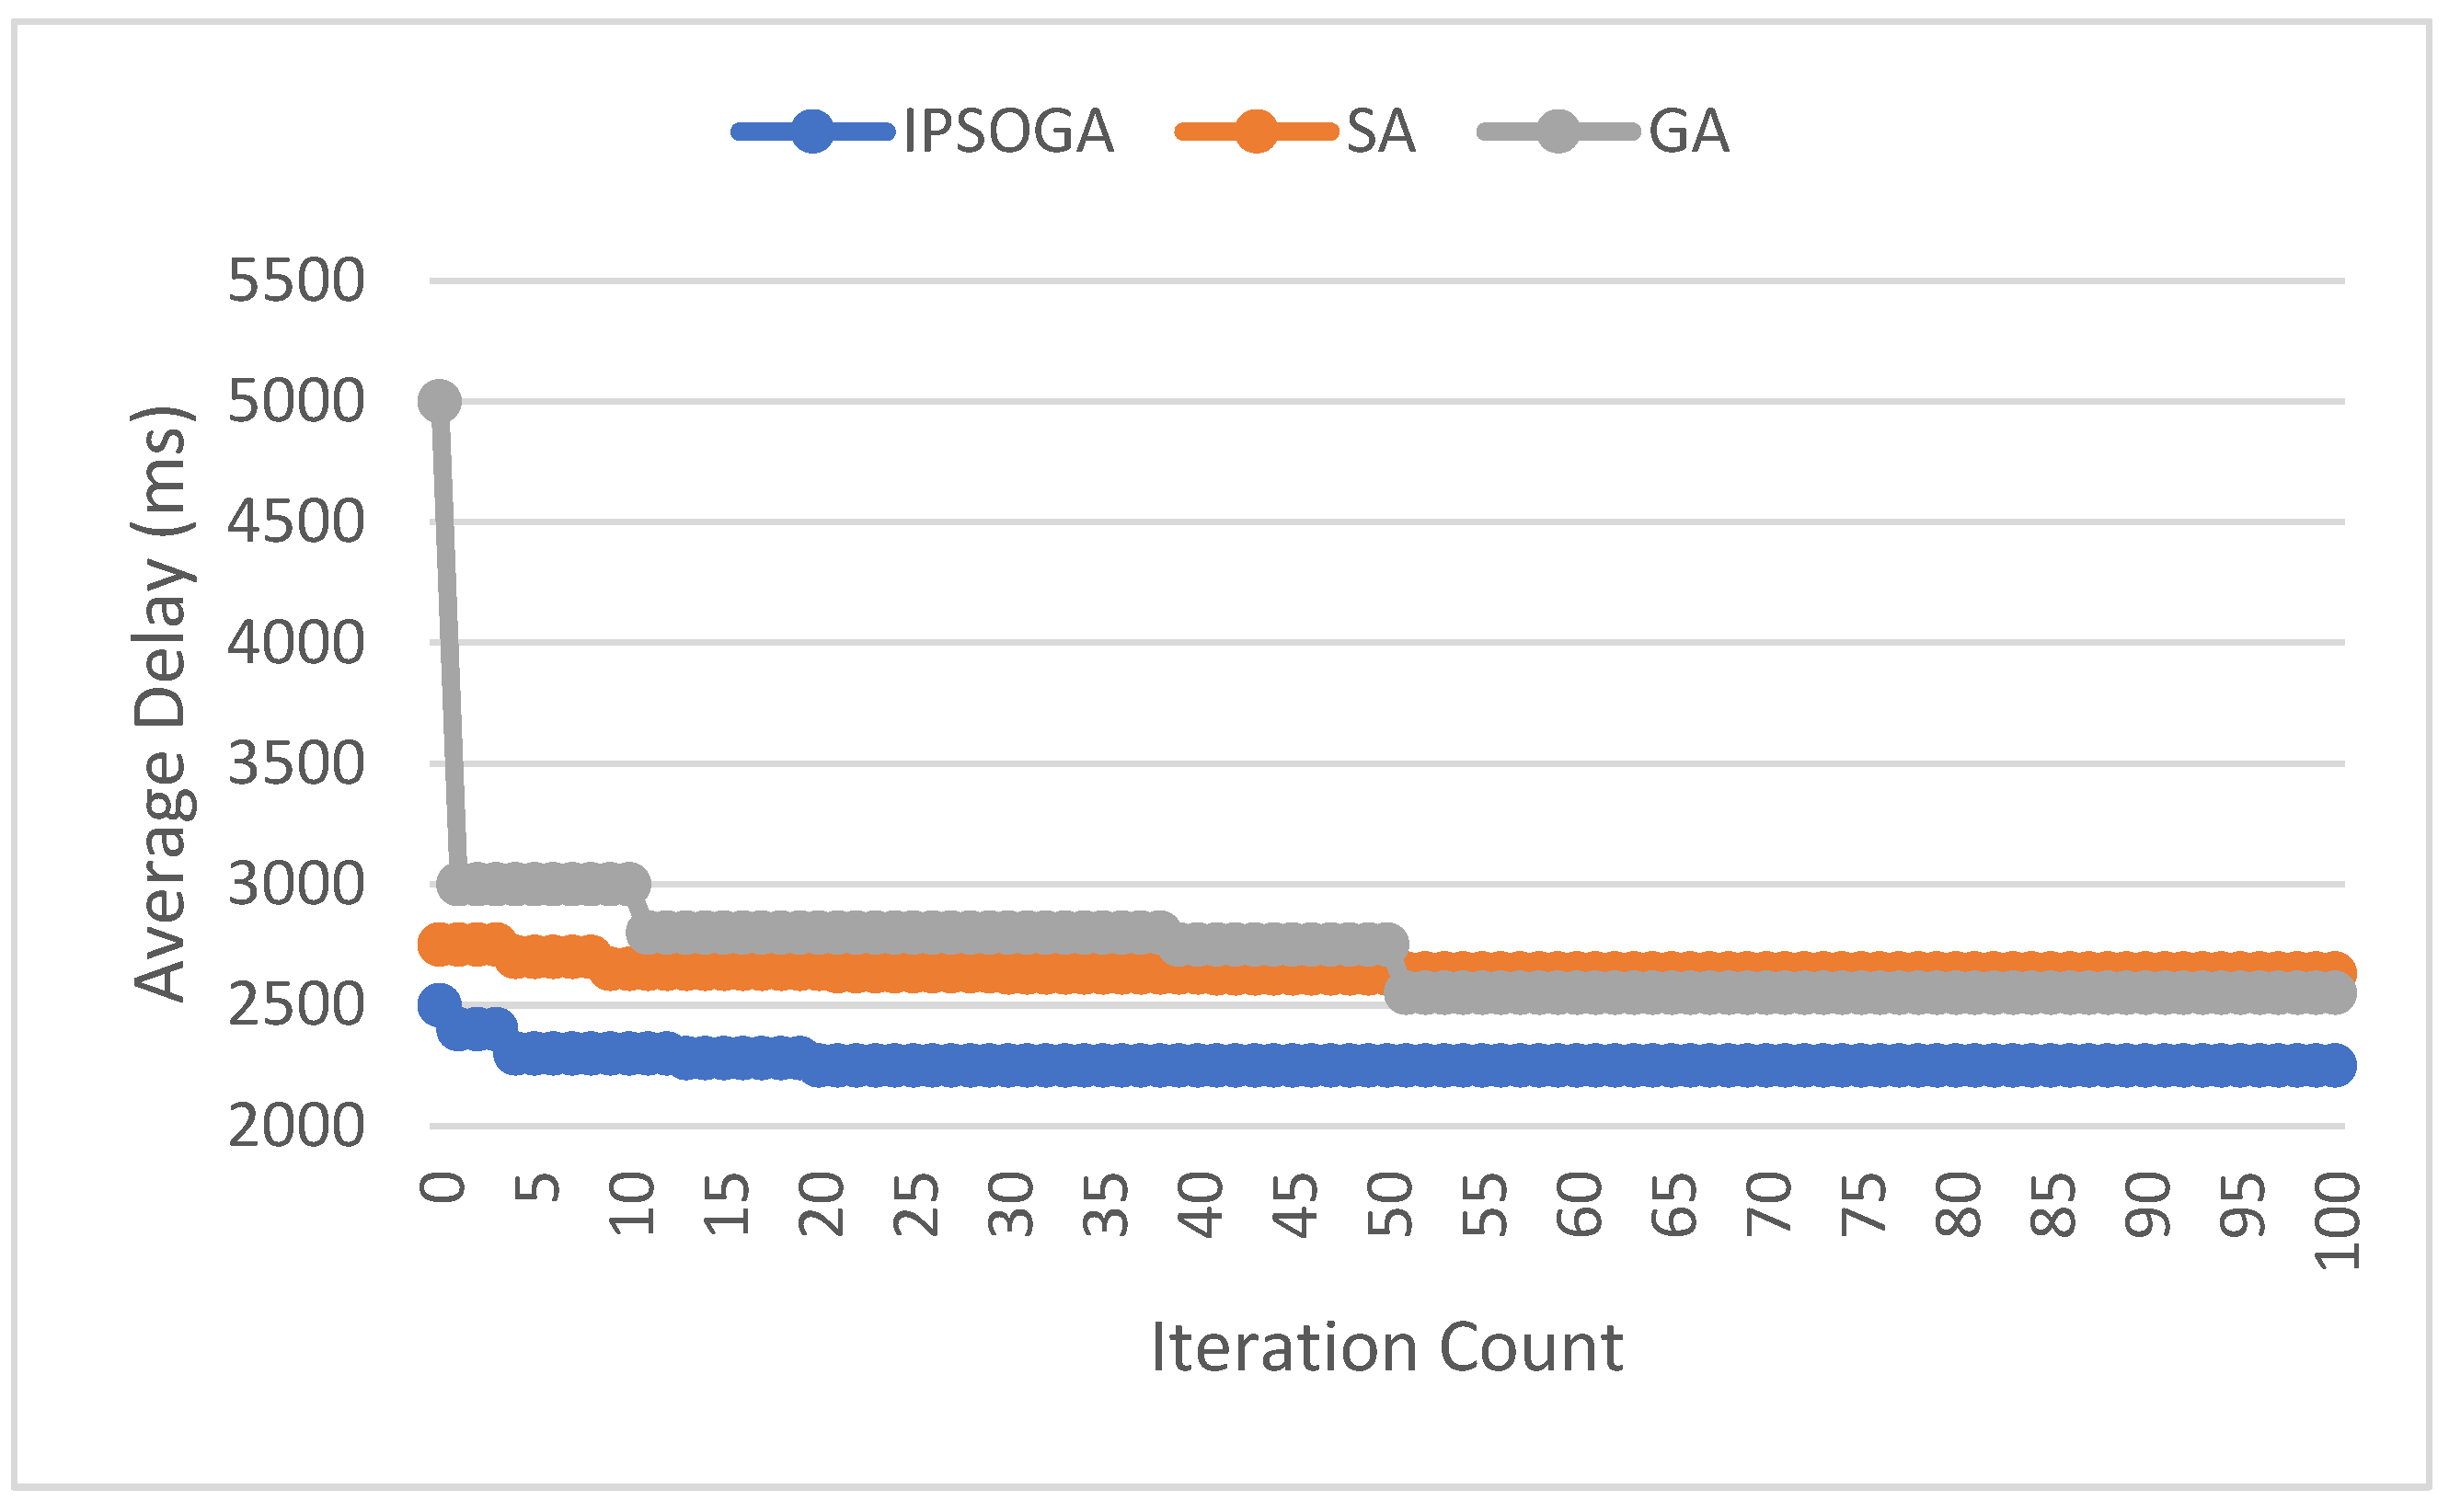
Figure 5 compares the convergence performance of IPSOGA with other two algorithms based on average delay. Within the first 5 iterations, GA shows a faster convergence speed but fails to identify the global optimal solution. But IPSOGA identifies the optimal solution within 22 iterations, while both SA and GA only stabilize after 45 iterations. Throughout the iterative process, IPSOGA maintains a lower average delay compared to SA and GA, highlighting its advantages.
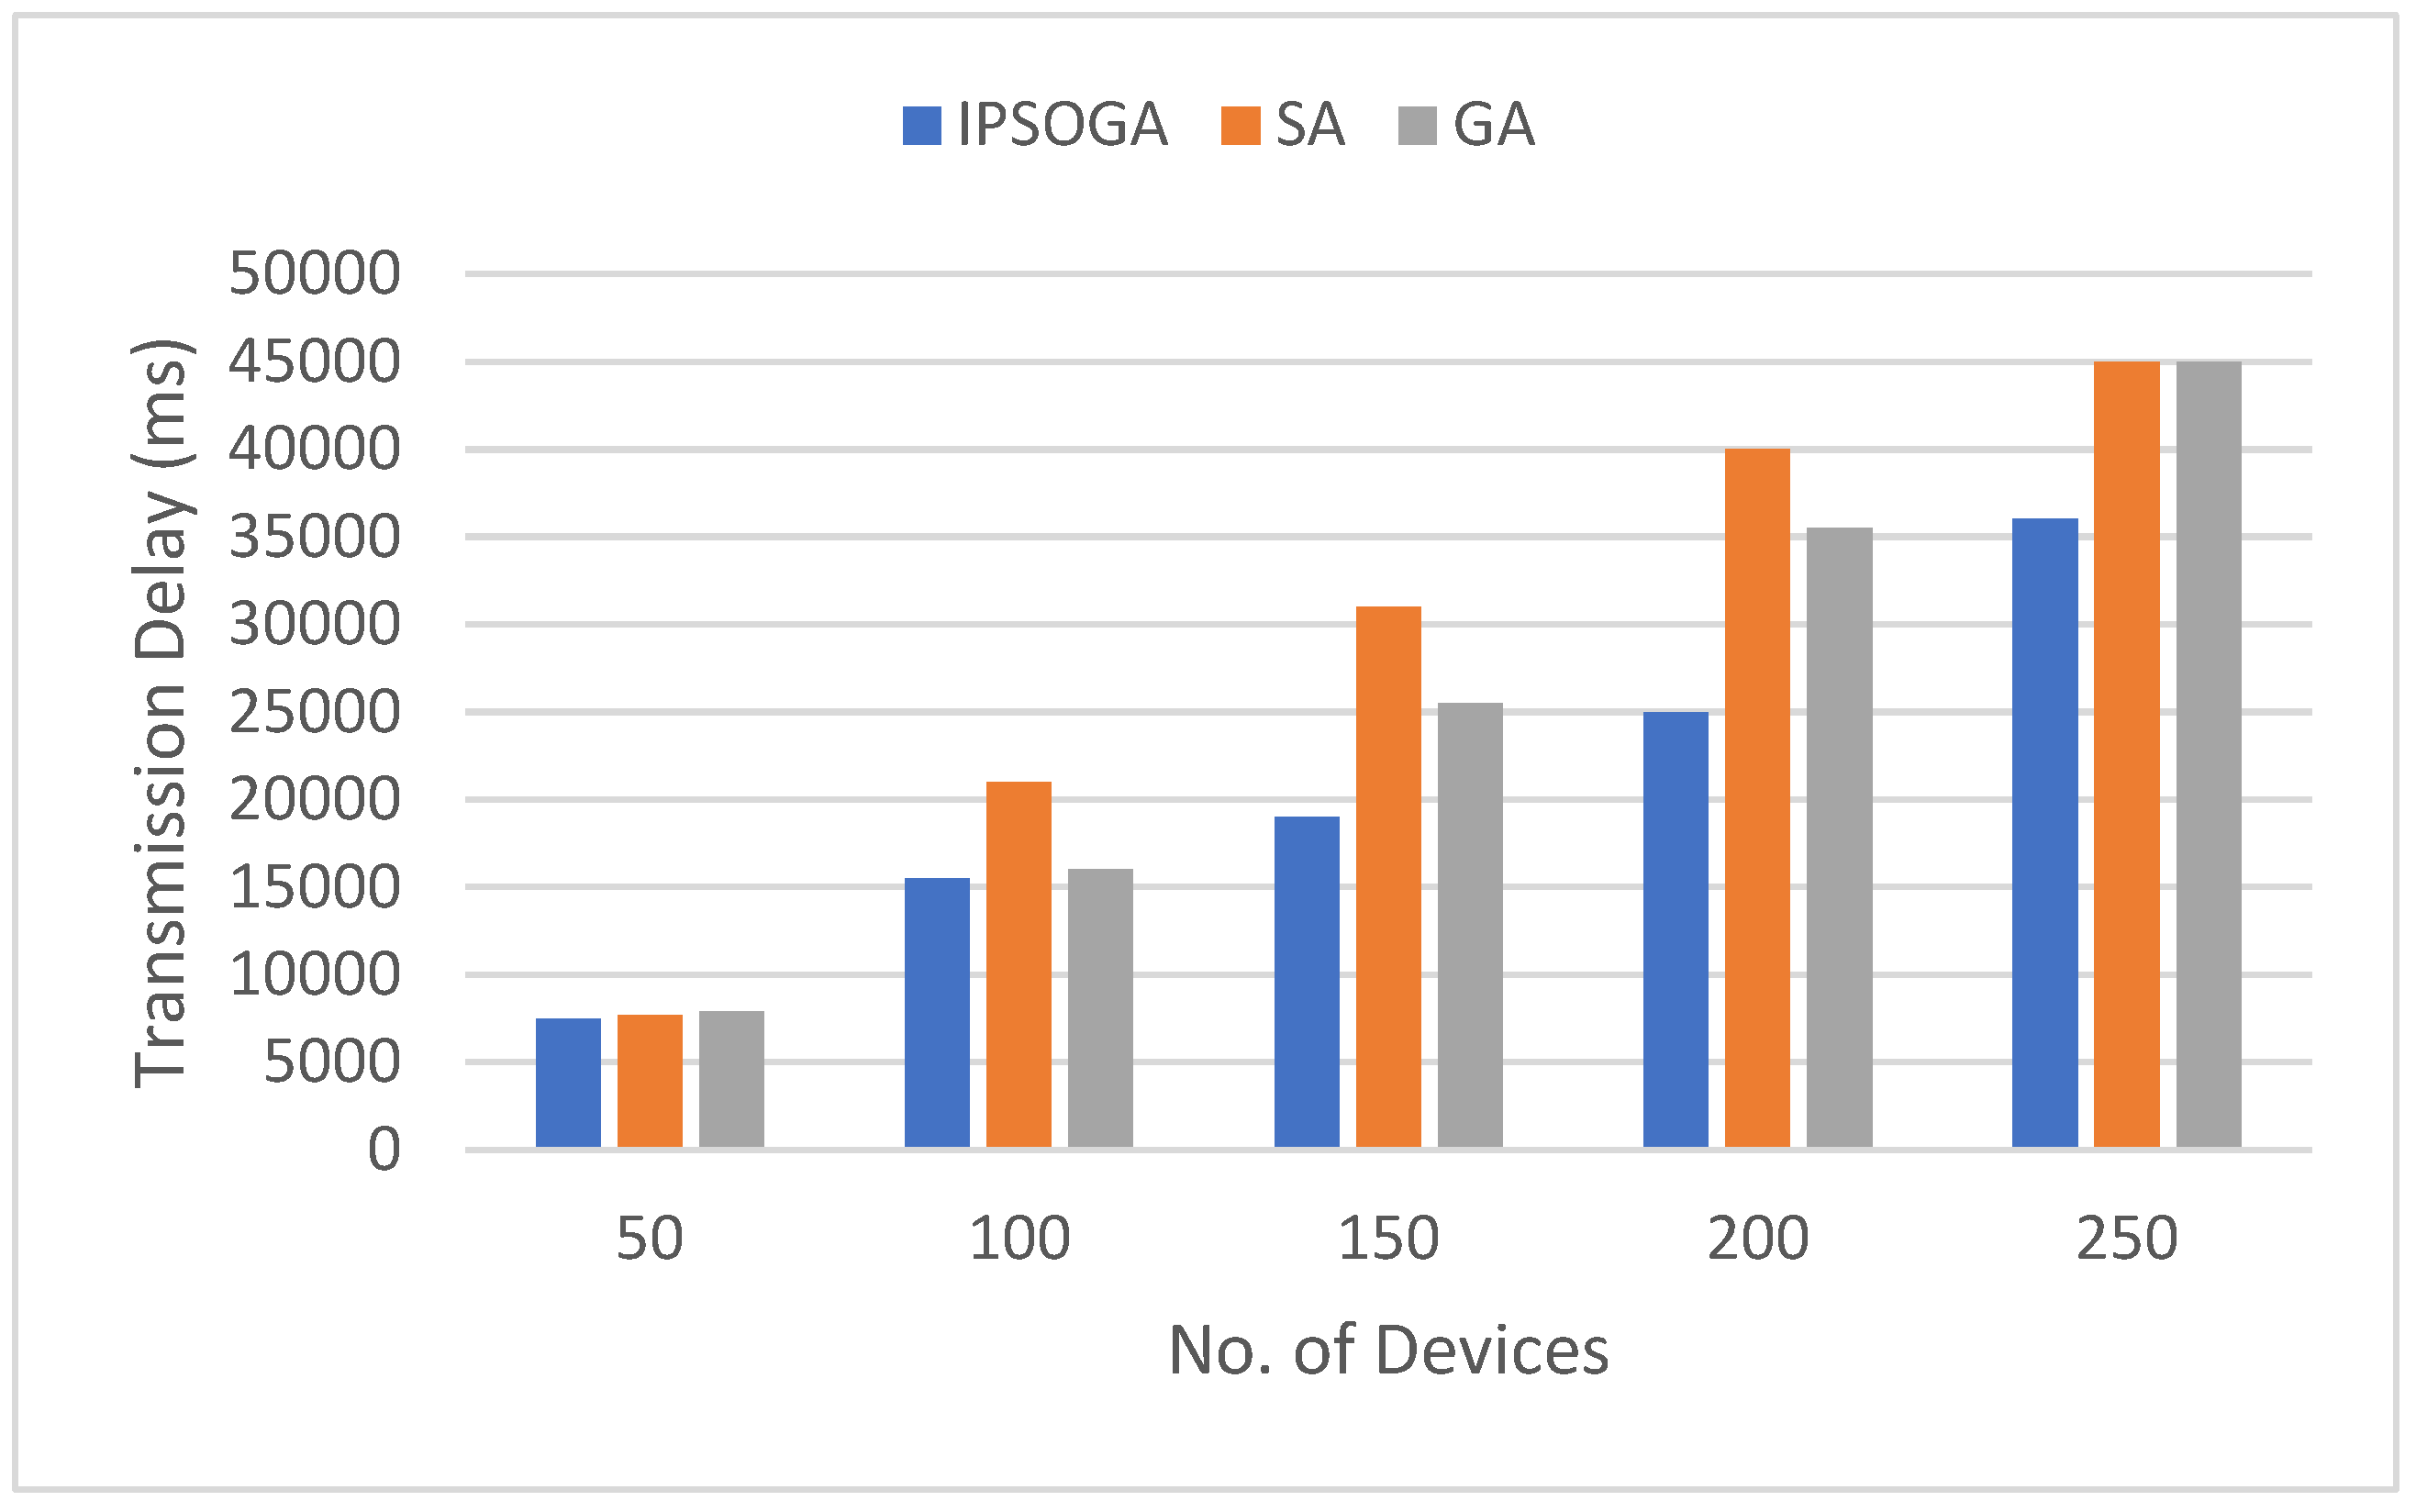
Delay in MEC can be categorized into two types one is transmission delay and another one is execution delay. Figure 6 compares the transmission delays of the proposed IPSOGA with other methods like SA and GA. As the device count increases incrementally from 50 to 250. As shown in Figure 6, when the device count ranges from 50 to 100, the transmission delays of all three algorithms performance are nearly equivalent. However, as the device count increases, the advantage of the IPSOGA algorithm becomes evident. Although delays inevitably rise with more devices and data transmission, when the device count exceeds 150, IPSOGA’s execution delay is significantly lower than that of SA and GA. At 200 devices, SA’s transmission delay is up to 35% higher than IPSOGA’s, while GA’s transmission delay is 31% higher than IPSOGA’s.
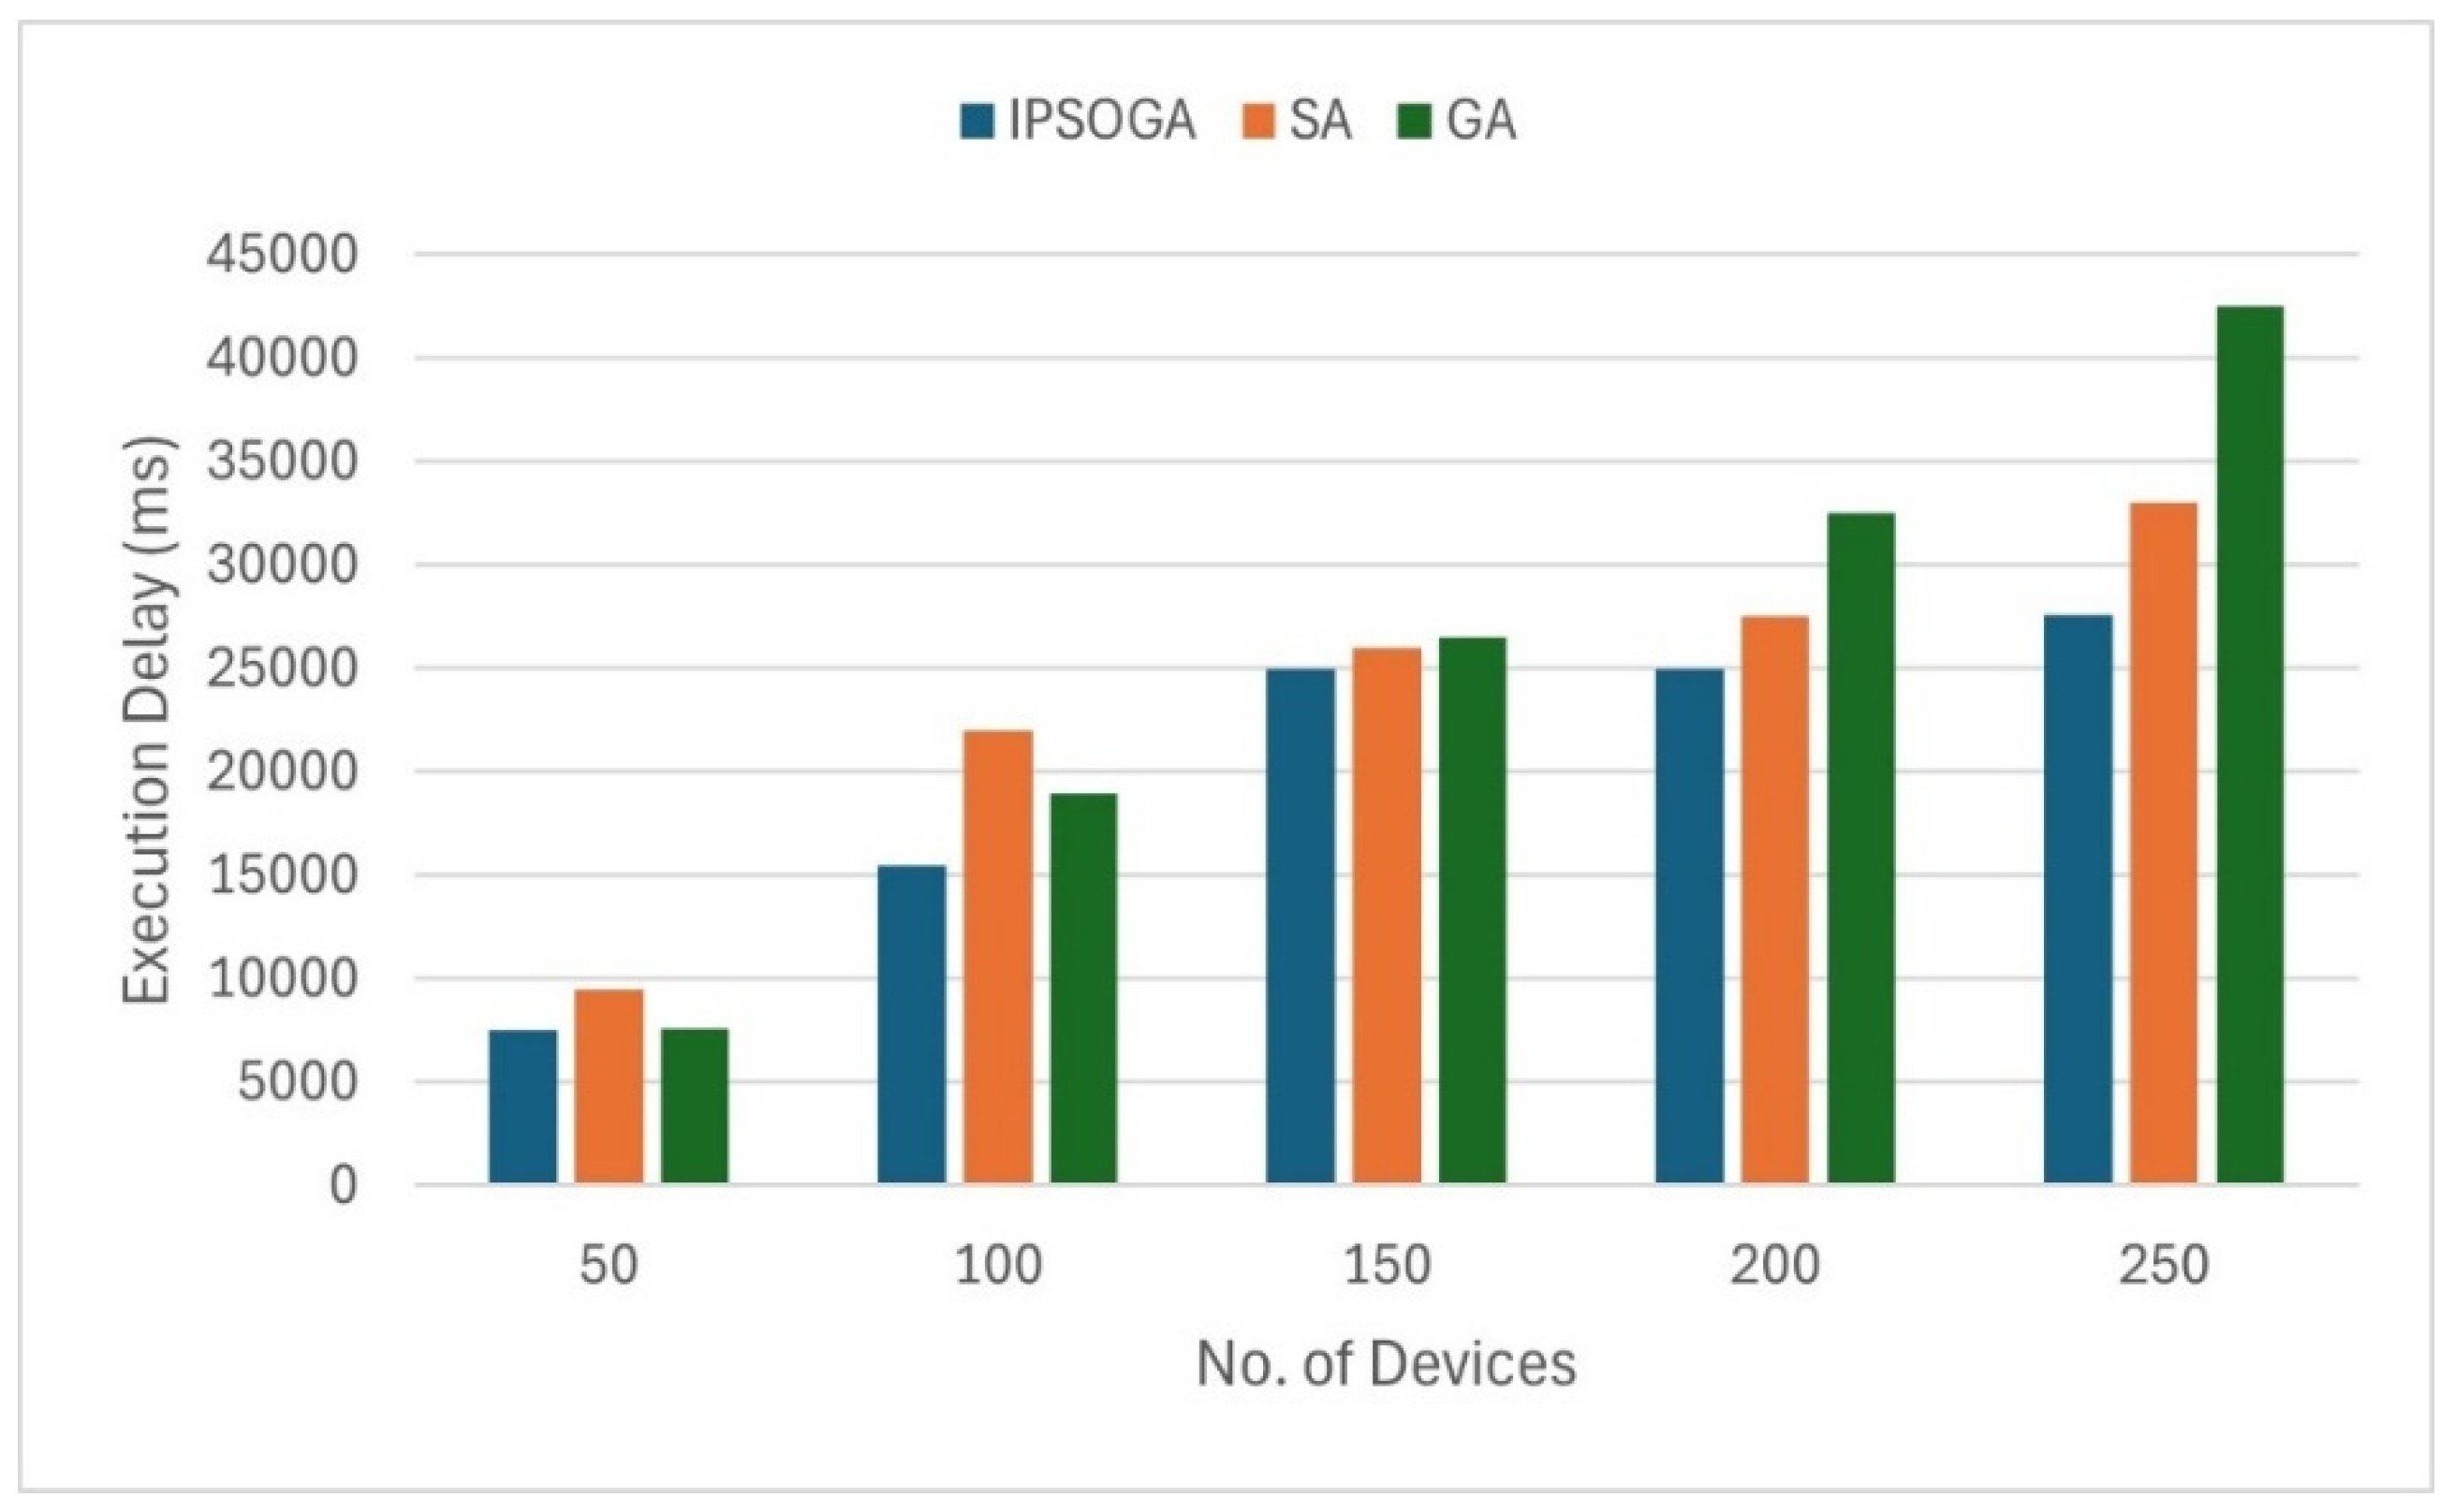
Figure 7 illustrates execution delays comparison of three algorithms with varying device count. When the device count is 50, the execution delays of IPSOGA and GA are similar. As the device count increases, so does the execution delay, due to the increased data processing demands. For device counts under 200, the execution delays of the three algorithms remain comparable, with IPSOGA exhibiting slightly lower delays than the other two algorithms. However, when the device count exceeds 200, GA’s execution delay rises sharply, becoming significantly higher than those of SA and IPSOGA. Specifically, with 100 devices, IPSOGA achieves an execution delay that is 18% lower than GA and 30% lower than SA.

10. Conclusions

Industry 4.0 has brought in modern smart technology and intelligent computing using edge servers to address the resource constraint computation and energy problem at edge sensors and devices in IIoT. In this article, the novel approach IPSOGA is evaluated with well-known existing algorithms SA and GA for various metrics like execution delay, transmission delay and energy cost and their results are analyzed. We devised the task computation problem as a multiple objective optimization problem. A penalty function in introduced to achieve pareto optimality. Upon comparing the proposed IPSOGA algorithm with SA and GA with the experimental results, it shows that as the device count and tasks increases, the IPSOGA algorithm outperforms both the SA and GA algorithms, meeting the low latency requirements of task processing in the context of the IIoT. However, tuning weighted parameters in IPSOGA to achieve pareto optimality is difficult, and experience is required to select the appropriate parameters to achieve optimal results for different problems. Here, we mainly focused on minimizing energy consumption and latency while doing task offloading.

Author Contributions

Article Writing: B. Vijayaram; Methodology: B. Vijayaram; Detail Analysis: B. Vijayaram; Conceptualization: B. Vijayaram; Data and Result Investigation: B. Vijayaram; Guidance: V. Vasudevan.

Funding

Not Applicable.

Institutional Review Board Statement

Not Applicable.

Data Availability Statement

There is no data to share in relation to this article, as no information or materials were produced or evaluated as part of the present investigation.

Acknowledgments

The researchers are grateful for the guidance and assistance provided by the instructors and professors at the Kalasalingam Academy of Research and Education, which is part of Kalasalingam University, located in Krishnan Koil, Tamil Nadu, India.

Conflicts of Interest

The researchers affirm that they don’t have conflicting interests to disclose.

Abbreviations

IIoT: Industrial internet of things; IPSOGA: Improved Particle Swarm Optimization with Genetic Algorithm; GA: Genetic algorithm; SA: Simulated annealing algorithm; MEC: Mobile edge computing; RTACO: Real Time two stage Ant Colony Optimization; DRL: Deep Reinforcement Learning; SDEC: Software Defined Edge Computing; XR: Extended Reality

Authors Biography

B. Vijayaram, a research scholar at Kalasalingam Academy of Research and Education in Tamilnadu, India, has over 18 years of industry experience in various domains, including aerospace, smart city, security, industrial automation, and medical radiology.
Dr. V. Vasudevan, the secondary author, serves as the Registrar at the same institution. With a Ph.D. in Mathematics, Dr. Vasudevan has a diverse academic background. He headed the MCA department from 1997 to 2003 and the IT department for over a decade. Additionally, he held various leadership roles, such as Chief Superintendent of University Exams for 6 years, Dean of Hostels for 4 years, and Dean of Admissions and Placements for 3 years from 2011 to 2014. Currently, he has been working as the Registrar since 2013. During his tenure, he has supervised the completion of 27 Ph.D. students and has published 67 international publications, reflecting his extensive teaching and research experience.

References

  1. T. Qiu, J. Chi, X. Zhou, Z. Ning, M. Atiquzzaman and D. O. Wu, “Edge Computing in Industrial Internet of Things: Architecture, Advances and Challenges,” in IEEE Communications Surveys & Tutorials, vol. 22, no. 4, pp. 2462-2488, Fourthquarter 2020. [CrossRef]
  2. F. Spinelli and V. Mancuso, “Toward Enabled Industrial Verticals in 5G: A Survey on MEC-Based Approaches to Provisioning and Flexibility,” in IEEE Communications Surveys & Tutorials, vol. 23, no. 1, pp. 596-630, Firstquarter 2021. [CrossRef]
  3. J. Chi, T. Qiu, F. Xiao and X. Zhou, “ATOM: Adaptive Task Offloading With Two-Stage Hybrid Matching in MEC-Enabled Industrial IoT,” in IEEE Transactions on Mobile Computing, vol. 23, no. 5, pp. 4861-4877, May 2024. [CrossRef]
  4. L. Lyu et al., “Adaptive Edge Sensing for Industrial IoT Systems: Estimation Task Offloading and Sensor Scheduling,” in IEEE Internet of Things Journal, vol. 10, no. 1, pp. 391-402, 1 Jan.1, 2023. [CrossRef]
  5. S. K. Kasi et al., “Heuristic Edge Server Placement in Industrial Internet of Things and Cellular Networks,” in IEEE Internet of Things Journal, vol. 8, no. 13, pp. 10308-10317, 1 July1, 2021. [CrossRef]
  6. X. Dai et al., “Task Co-Offloading for D2D-Assisted Mobile Edge Computing in Industrial Internet of Things,” in IEEE Transactions on Industrial Informatics, vol. 19, no. 1, pp. 480-490, Jan. 2023. [CrossRef]
  7. X. Deng, J. Yin, P. Guan, N. N. Xiong, L. Zhang and S. Mumtaz, “Intelligent Delay-Aware Partial Computing Task Offloading for Multiuser Industrial Internet of Things Through Edge Computing,” in IEEE Internet of Things Journal, vol. 10, no. 4, pp. 2954-2966, 15 Feb.15, 2023. [CrossRef]
  8. Mahmood et al., “Industrial IoT in 5G-and-Beyond Networks: Vision, Architecture, and Design Trends,” in IEEE Transactions on Industrial Informatics, vol. 18, no. 6, pp. 4122-4137, June 2022. [CrossRef]
  9. T. -H. Chao, J. -H. Wu, Y. Chiang and H. -Y. Wei, “5G Edge Computing Experiments with Intelligent Resource Allocation for Multi-Application Video Analytics,” 2021 30th Wireless and Optical Communications Conference (WOCC), Taipei, Taiwan, 2021, pp. 80-84. [CrossRef]
  10. T. Tan and G. Cao, “Deep Learning Video Analytics Through Edge Computing and Neural Processing Units on Mobile Devices,” in IEEE Transactions on Mobile Computing, vol. 22, no. 3, pp. 1433-1448, 1 March 2023. [CrossRef]
  11. Vijayaram, B., Vasudevan, V. Wireless edge device intelligent task offloading in mobile edge computing using hyper-heuristics. EURASIP J. Adv. Signal Process. 2022, 126 (2022). [CrossRef]
  12. Yung-Ting Chuang, Yuan-Tsang Hung, A real-time and ACO-based offloading algorithm in edge computing, Journal of Parallel and Distributed Computing, Volume 179, 2023, 104703, ISSN 0743-7315. [CrossRef]
  13. Shuai Liu, Chunli Guo, Fadi Al-Turjman, Khan Muhammad, Victor Hugo C. de Albuquerque, Reliability of response region: A novel mechanism in visual tracking by edge computing for IIoT environments, Mechanical Systems and Signal Processing, Volume 138, 2020, 106537, ISSN 0888-3270. [CrossRef]
  14. Bao-Shan Sun, Hao Huang, Zheng-Yi Chai, Ying-Jie Zhao, Hong-Shen Kang, Multi-objective optimization algorithm for multi-workflow computation offloading in resource-limited IIoT, Swarm and Evolutionary Computation, Volume 89, 2024, 101646, ISSN 2210-6502. [CrossRef]
  15. Xiaojuan Zhu, Tianhao Zhang, Jinwei Zhang, Bao Zhao, Shunxiang Zhang, Cai Wu, Deep reinforcement learning-based edge computing offloading algorithm for software-defined IoT, Computer Networks, Volume 235, 2023, 110006, ISSN 1389-1286. [CrossRef]
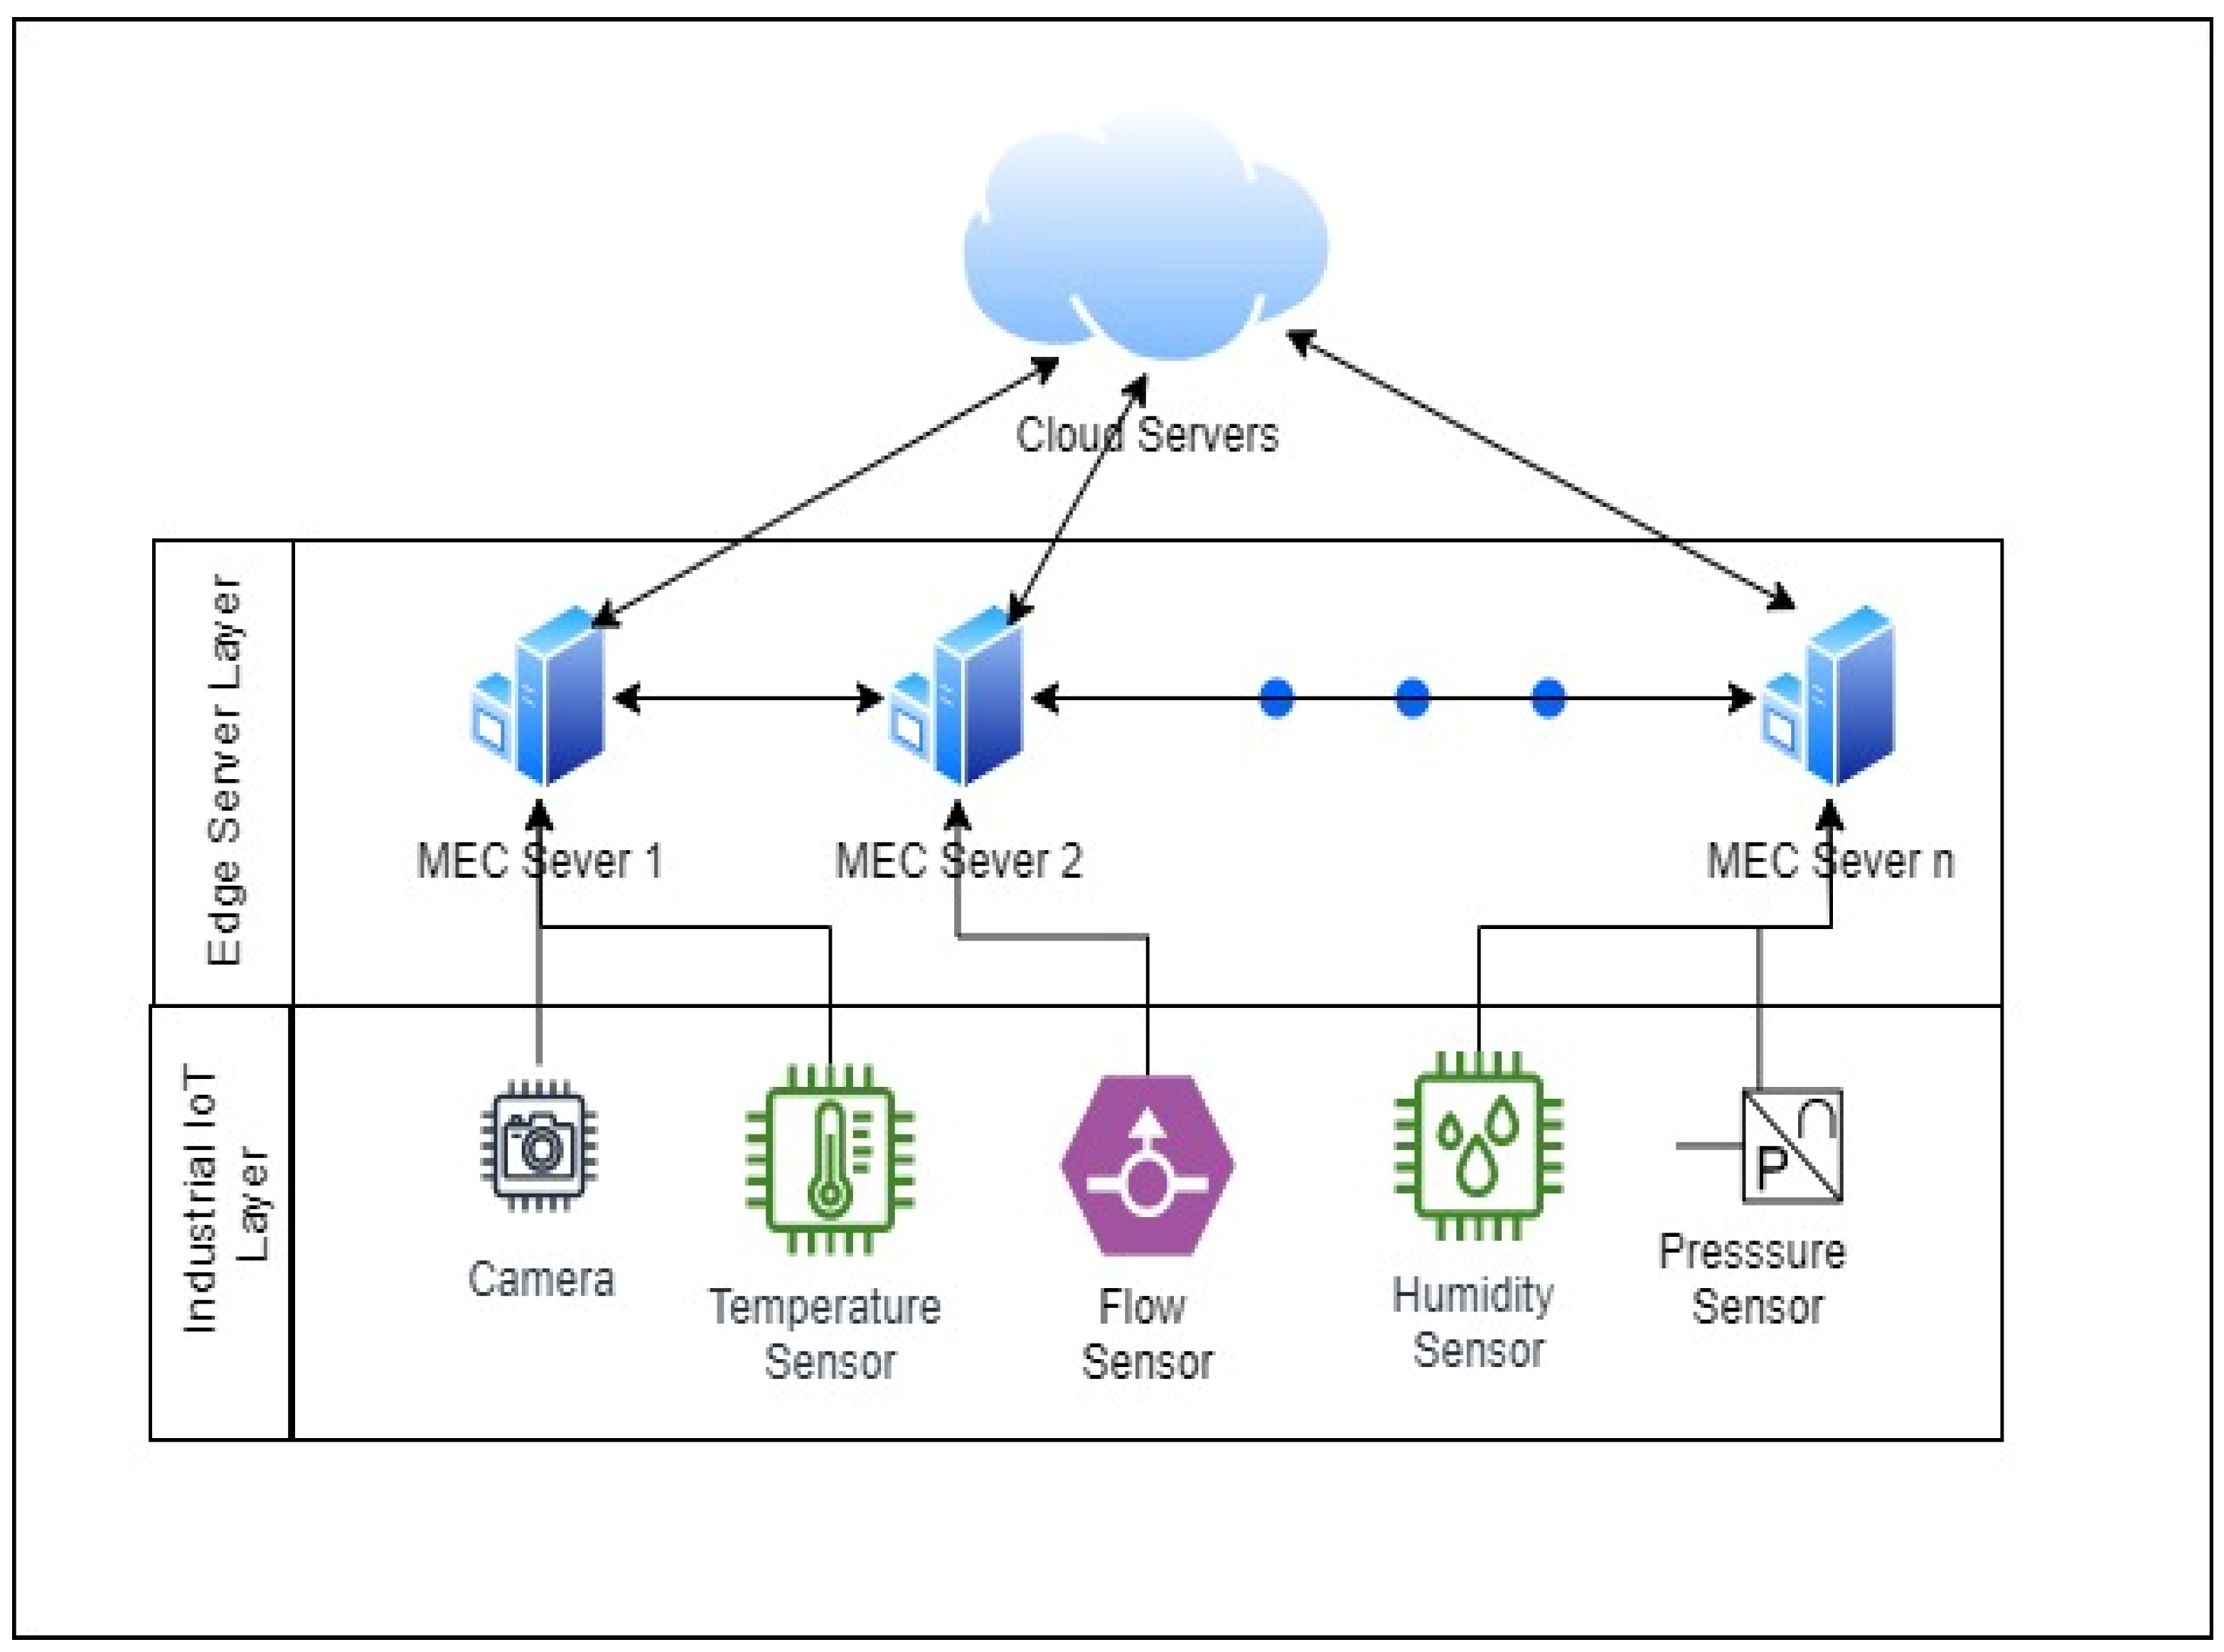
Figure 1. IIoT Edge Computing in 7G Environment.
Preprints 121198 g001
Figure 2. Convergence comparison.
Preprints 121198 g002
Figure 3. Total cost comparison with varying numbers of devices.
Preprints 121198 g003
Figure 4. Average delay comparison with varying energy consumption constraints.
Preprints 121198 g004
Figure 5. Convergence comparison based on average delay.
Preprints 121198 g005
Figure 6. Delay comparison with varying numbers of devices.
Preprints 121198 g006
Figure 7. Execution delay comparison with varying device count.
Preprints 121198 g007
Table 1. Experiment settings.
Parameter Value
N (Edge Server) 10
M (Device Count) 50
Di 5−50 Mbit
Fi 500−1500 Cycles/bit
Fu,i 1 GHz−5 GHz
Fs,j 5 GHz−10 GHz
W 2 MHz
Pi 50−600 mW
Cgi,j 2 × 10⁻⁶−2 × 10⁻⁵
W∗ N0 1 × 10⁻⁸ W
E m a x j 1100J
g 10−3
Disclaimer/Publisher’s Note: The statements, opinions and data contained in all publications are solely those of the individual author(s) and contributor(s) and not of MDPI and/or the editor(s). MDPI and/or the editor(s) disclaim responsibility for any injury to people or property resulting from any ideas, methods, instructions or products referred to in the content.
Copyright: This open access article is published under a Creative Commons CC BY 4.0 license, which permit the free download, distribution, and reuse, provided that the author and preprint are cited in any reuse.
Prerpints.org logo

Preprints.org is a free preprint server supported by MDPI in Basel, Switzerland.

Subscribe

© 2024 MDPI (Basel, Switzerland) unless otherwise stated