Submitted:
14 October 2024
Posted:
15 October 2024
You are already at the latest version
Abstract
Keywords:
1. Introduction
2. Materials and Methods
2.1. Chemicals, Microbial Strains and Culture Conditions
2.2. Dataset Collection
2.3. Data Processing and DEG Screening
2.4. Gene Ontology and Pathway Analysis
2.5. Virtual Screening for Identification of Drug Candidate
2.6. Antibacterial Activity of Dexamethasone against P. aeruginosa
2.7. Minimal Inhibitory Concentration (MIC)
2.8. Inhibition Assay in Biofilm Formation
2.9. Fluorescent Microscopic Analysis of Biofilm
2.10. Statistical Analysis
3. Results
3.1. Dataset Selection and Quality Control
3.2. Meta-Analysis and DEG Identification
3.3. Functional Classification of DEGs Using Gene Ontology and KEGG Pathways Analysis
3.4. Structure-Based Virtual Screening
3.5. Antibacterial Activity of Dexamethasone against P. aeruginosa
3.6. Metabolic and Biomass Inhibitory Potential of Dexamethasone against P. aeruginosa Biofilm
4. Discussion
5. Conclusions
Supplementary Materials
Author Contributions
Funding
Institutional Review Board Statement
Informed Consent Statement
Data Availability Statement
Acknowledgments
Conflicts of Interest
References
- Dave, A.; Samarth, A.; Karolia, R.; Sharma, S.; Karunakaran, E.; Partridge, L.; MacNeil, S.; Monk, P.N.; Garg, P.; Roy, S. Characterization of Ocular Clinical Isolates of Pseudomonas Aeruginosa from Non-Contact Lens Related Keratitis Patients from South India. Microorganisms 2020, 8, 260. [Google Scholar] [CrossRef] [PubMed]
- Mann, E.E.; Wozniak, D.J. Pseudomonas Biofilm Matrix Composition and Niche Biology. FEMS Microbiol. Rev. 2012, 36, 893–916. [Google Scholar] [CrossRef] [PubMed]
- Crouzet, M.; Le Senechal, C.; Brözel, V.S.; Costaglioli, P.; Barthe, C.; Bonneu, M.; Garbay, B.; Vilain, S. Exploring Early Steps in Biofilm Formation: Set-up of an Experimental System for Molecular Studies. BMC Microbiol. 2014, 14, 253. [Google Scholar] [CrossRef] [PubMed]
- Kimkes, T.E.P.; Heinemann, M. How Bacteria Recognise and Respond to Surface Contact. FEMS Microbiol. Rev. 2020, 44, 106–122. [Google Scholar] [CrossRef] [PubMed]
- Franklin, M.J.; Nivens, D.E.; Weadge, J.T.; Howell, P.L. Biosynthesis of the Pseudomonas Aeruginosa Extracellular Polysaccharides, Alginate, Pel, and Psl. Front. Microbiol. 2011, 2. [Google Scholar] [CrossRef]
- Ueda, A.; Wood, T.K. Connecting Quorum Sensing, c-Di-GMP, Pel Polysaccharide, and Biofilm Formation in Pseudomonas Aeruginosa through Tyrosine Phosphatase TpbA (PA3885). PLoS Pathog. 2009, 5, e1000483. [Google Scholar] [CrossRef]
- De Kievit, T.R. Quorum Sensing in Pseudomonas Aeruginosa Biofilms. Environ. Microbiol. 2009, 11, 279–288. [Google Scholar] [CrossRef]
- Chang, C.-Y. Surface Sensing for Biofilm Formation in Pseudomonas Aeruginosa. Front. Microbiol. 2018, 8. [Google Scholar] [CrossRef] [PubMed]
- Harmsen, M.; Yang, L.; Pamp, S.J.; Tolker-Nielsen, T. An Update on Pseudomonas Aeruginosa Biofilm Formation, Tolerance, and Dispersal. FEMS Immunol. Med. Microbiol. 2010, 59, 253–268. [Google Scholar] [CrossRef]
- Gupta, K.; Marques, C.N.H.; Petrova, O.E.; Sauer, K. Antimicrobial Tolerance of Pseudomonas Aeruginosa Biofilms Is Activated during an Early Developmental Stage and Requires the Two-Component Hybrid SagS. J. Bacteriol. 2013, 195, 4975–4987. [Google Scholar] [CrossRef]
- Mulcahy, L.R.; Burns, J.L.; Lory, S.; Lewis, K. Emergence of Pseudomonas Aeruginosa Strains Producing High Levels of Persister Cells in Patients with Cystic Fibrosis. J. Bacteriol. 2010, 192, 6191–6199. [Google Scholar] [CrossRef] [PubMed]
- Patel, H.; Buchad, H.; Gajjar, D. Pseudomonas Aeruginosa Persister Cell Formation upon Antibiotic Exposure in Planktonic and Biofilm State. Sci. Rep. 2022, 12, 16151. [Google Scholar] [CrossRef] [PubMed]
- Pattnaik, S.; Barik, S.; Muralitharan, G.; Busi, S. Ferulic Acid Encapsulated Chitosan-tripolyphosphate Nanoparticles Attenuate Quorum Sensing Regulated Virulence and Biofilm Formation in Pseudomonas Aeruginosa PAO1. IET Nanobiotechnology 2018, 12, 1056–1061. [Google Scholar] [CrossRef] [PubMed]
- Ben Hur, D.; Kapach, G.; Wani, N.A.; Kiper, E.; Ashkenazi, M.; Smollan, G.; Keller, N.; Efrati, O.; Shai, Y. Antimicrobial Peptides against Multidrug-Resistant Pseudomonas Aeruginosa Biofilm from Cystic Fibrosis Patients. J. Med. Chem. 2022, 65, 9050–9062. [Google Scholar] [CrossRef]
- Saeki, E.K.; Martins, H.M.; Camargo, L.C. de; Anversa, L.; Tavares, E.R.; Yamada-Ogatta, S.F.; Lioni, L.M.Y.; Kobayashi, R.K.T.; Nakazato, G. Effect of Biogenic Silver Nanoparticles on the Quorum-Sensing System of Pseudomonas Aeruginosa PAO1 and PA14. Microorganisms 2022, 10, 1755. [Google Scholar] [CrossRef]
- Brindhadevi, K.; LewisOscar, F.; Mylonakis, E.; Shanmugam, S.; Verma, T.N.; Pugazhendhi, A. Biofilm and Quorum Sensing Mediated Pathogenicity in Pseudomonas Aeruginosa. Process Biochem. 2020, 96, 49–57. [Google Scholar] [CrossRef]
- Secor, P.R.; James, G.A.; Fleckman, P.; Olerud, J.E.; McInnerney, K.; Stewart, P.S. Staphylococcus Aureus Biofilm and Planktonic Cultures Differentially Impact Gene Expression, Mapk Phosphorylation, and Cytokine Production in Human Keratinocytes. BMC Microbiol. 2011, 11, 143. [Google Scholar] [CrossRef]
- Vallet, I.; Diggle, S.P.; Stacey, R.E.; Cámara, M.; Ventre, I.; Lory, S.; Lazdunski, A.; Williams, P.; Filloux, A. Biofilm Formation in Pseudomonas Aeruginosa: Fimbrial Cup Gene Clusters Are Controlled by the Transcriptional Regulator MvaT. J. Bacteriol. 2004, 186, 2880–2890. [Google Scholar] [CrossRef]
- Li, H.; Li, X.; Wang, Z.; Fu, Y.; Ai, Q.; Dong, Y.; Yu, J. Autoinducer-2 Regulates Pseudomonas Aeruginosa PAO1 Biofilm Formation and Virulence Production in a Dose-Dependent Manner. BMC Microbiol. 2015, 15, 192. [Google Scholar] [CrossRef]
- Dolatshah, L.; Tabatabaei, M. A Phenotypic and Molecular Investigation of Biofilm Formation in Clinical Samples of Pseudomonas Aeruginosa. Mol. Biol. Res. Commun. 2021, 10, 157–163. [Google Scholar] [CrossRef]
- Toyofuku, M.; Roschitzki, B.; Riedel, K.; Eberl, L. Identification of Proteins Associated with the Pseudomonas Aeruginosa Biofilm Extracellular Matrix. J. Proteome Res. 2012, 11, 4906–4915. [Google Scholar] [CrossRef] [PubMed]
- Park, A.J.; Murphy, K.; Krieger, J.R.; Brewer, D.; Taylor, P.; Habash, M.; Khursigara, C.M. A Temporal Examination of the Planktonic and Biofilm Proteome of Whole Cell Pseudomonas Aeruginosa PAO1 Using Quantitative Mass Spectrometry. Mol. Cell. Proteomics 2014, 13, 1095–1105. [Google Scholar] [CrossRef] [PubMed]
- Kaleta, M.F.; Petrova, O.E.; Zampaloni, C.; Garcia-Alcalde, F.; Parker, M.; Sauer, K. A Previously Uncharacterized Gene, PA2146, Contributes to Biofilm Formation and Drug Tolerance across the ɣ-Proteobacteria. npj Biofilms Microbiomes 2022, 8, 54. [Google Scholar] [CrossRef] [PubMed]
- Subramanian, D.; Natarajan, J. Integrated Meta-Analysis and Machine Learning Approach Identifies Acyl-CoA Thioesterase with Other Novel Genes Responsible for Biofilm Development in Staphylococcus Aureus. Infect. Genet. Evol. 2021, 88, 104702. [Google Scholar] [CrossRef]
- Zhou, G.; Soufan, O.; Ewald, J.; Hancock, R.E.W.; Basu, N.; Xia, J. NetworkAnalyst 3.0: A Visual Analytics Platform for Comprehensive Gene Expression Profiling and Meta-Analysis. Nucleic Acids Res. 2019, 47, W234–W241. [Google Scholar] [CrossRef]
- Choi, J.K.; Yu, U.; Kim, S.; Yoo, O.J. Combining Multiple Microarray Studies and Modeling Interstudy Variation. Bioinformatics 2003, 19, i84–i90. [Google Scholar] [CrossRef]
- Zhang, Y.; Jenkins, D.F.; Manimaran, S.; Johnson, W.E. Alternative Empirical Bayes Models for Adjusting for Batch Effects in Genomic Studies. BMC Bioinformatics 2018, 19, 262. [Google Scholar] [CrossRef]
- Huang, D.W.; Sherman, B.T.; Lempicki, R.A. Systematic and Integrative Analysis of Large Gene Lists Using DAVID Bioinformatics Resources. Nat. Protoc. 2009, 4, 44–57. [Google Scholar] [CrossRef]
- Sherman, B.T.; Hao, M.; Qiu, J.; Jiao, X.; Baseler, M.W.; Lane, H.C.; Imamichi, T.; Chang, W. DAVID: A Web Server for Functional Enrichment Analysis and Functional Annotation of Gene Lists (2021 Update). Nucleic Acids Res. 2022, 50, W216–W221. [Google Scholar] [CrossRef]
- Li, J.; Miao, B.; Wang, S.; Dong, W.; Xu, H.; Si, C.; Wang, W.; Duan, S.; Lou, J.; Bao, Z.; et al. Hiplot: A Comprehensive and Easy-to-Use Web Service for Boosting Publication-Ready Biomedical Data Visualization. Brief. Bioinform. 2022, 23. [Google Scholar] [CrossRef]
- Zhou, J.; Gao, Z.; Zhang, H.; Dong, Y. Crystal Structure of the Nucleoid-Associated Protein Fis (PA4853) from Pseudomonas Aeruginosa. Acta Crystallogr. Sect. F Struct. Biol. Commun. 2020, 76, 209–215. [Google Scholar] [CrossRef] [PubMed]
- Pettersen, E.F.; Goddard, T.D.; Huang, C.C.; Couch, G.S.; Greenblatt, D.M.; Meng, E.C.; Ferrin, T.E. UCSF Chimera—A Visualization System for Exploratory Research and Analysis. J. Comput. Chem. 2004, 25, 1605–1612. [Google Scholar] [CrossRef]
- Gan, J.; Liu, J.; Liu, Y.; Chen, S.; Dai, W.; Xiao, Z.-X.; Cao, Y. DrugRep: An Automatic Virtual Screening Server for Drug Repurposing. Acta Pharmacol. Sin. 2023, 44, 888–896. [Google Scholar] [CrossRef] [PubMed]
- Kuriata, A.; Gierut, A.M.; Oleniecki, T.; Ciemny, M.P.; Kolinski, A.; Kurcinski, M.; Kmiecik, S. CABS-Flex 2.0: A Web Server for Fast Simulations of Flexibility of Protein Structures. Nucleic Acids Res. 2018, 46, W338–W343. [Google Scholar] [CrossRef] [PubMed]
- Clinical and Laboratory Standards Institute Performance Standards for Antimicrobial Disk Susceptibility Tests: Approved Standard - Eleventh Edition; 2012; Vol. 32; ISBN 1562384856.
- Pobiega, K.; Kraśniewska, K.; Derewiaka, D.; Gniewosz, M. Comparison of the Antimicrobial Activity of Propolis Extracts Obtained by Means of Various Extraction Methods. J. Food Sci. Technol. 2019, 56, 5386–5395. [Google Scholar] [CrossRef] [PubMed]
- Elshikh, M.; Ahmed, S.; Funston, S.; Dunlop, P.; McGaw, M.; Marchant, R.; Banat, I.M. Resazurin-Based 96-Well Plate Microdilution Method for the Determination of Minimum Inhibitory Concentration of Biosurfactants. Biotechnol. Lett. 2016, 38, 1015–1019. [Google Scholar] [CrossRef]
- Kim, Y.-M.; Son, H.; Park, S.-C.; Lee, J.-K.; Jang, M.-K.; Lee, J.R. Anti-Biofilm Effects of Rationally Designed Peptides against Planktonic Cells and Pre-Formed Biofilm of Pseudomonas Aeruginosa. Antibiotics 2023, 12, 349. [Google Scholar] [CrossRef]
- Roehm, N.W.; Rodgers, G.H.; Hatfield, S.M.; Glasebrook, A.L. An Improved Colorimetric Assay for Cell Proliferation and Viability Utilizing the Tetrazolium Salt XTT. J. Immunol. Methods 1991, 142, 257–265. [Google Scholar] [CrossRef]
- Akshaya, B.S.; Premraj, K.; Iswarya, C.; Muthusamy, S.; Ibrahim, H.-I.M.; Khalil, H.E.; Ashokkumar, V.; Vickram, S.; Senthil Kumar, V.; Palanisamy, S.; et al. Cinnamaldehyde Inhibits Enterococcus Faecalis Biofilm Formation and Promotes Clearance of Its Colonization by Modulation of Phagocytes in Vitro. Microb. Pathog. 2023, 181, 106157. [Google Scholar] [CrossRef]
- Harikrishnan, P.; Arayambath, B.; Jayaraman, V.K.; Ekambaram, K.; Ahmed, E.A.; Senthilkumar, P.; Ibrahim, H.I.M.; Sundaresan, A.; Thirugnanasambantham, K. Thidiazuron, a Phenyl-Urea Cytokinin, Inhibits Ergosterol Synthesis and Attenuates Biofilm Formation of Candida Albicans. World J. Microbiol. Biotechnol. 2022, 38, 1–14. [Google Scholar] [CrossRef]
- Emeka, P.M.; Badger-Emeka, L.I.; Ibrahim, H.I.M.; Thirugnanasambantham, K.; Hussen, J. Inhibitory Potential of Mangiferin on Glucansucrase Producing Streptococcus Mutans Biofilm in Dental Plaque. Appl. Sci. 2020, 10, 1–17. [Google Scholar] [CrossRef]
- Tuon, F.F.; Dantas, L.R.; Suss, P.H.; Tasca Ribeiro, V.S. Pathogenesis of the Pseudomonas Aeruginosa Biofilm: A Review. Pathogens 2022, 11, 300. [Google Scholar] [CrossRef] [PubMed]
- Hojjati, F.; Roointan, A.; Gholaminejad, A.; Eshraghi, Y.; Gheisari, Y. Identification of Key Genes and Biological Regulatory Mechanisms in Diabetic Nephropathy: Meta-Analysis of Gene Expression Datasets. Nefrología 2023, 43, 575–586. [Google Scholar] [CrossRef]
- Ramasamy, A.; Mondry, A.; Holmes, C.C.; Altman, D.G. Key Issues in Conducting a Meta-Analysis of Gene Expression Microarray Datasets. PLoS Med. 2008, 5, e184. [Google Scholar] [CrossRef]
- Cho, H.; Kim, H.; Na, D.; Kim, S.Y.; Jo, D.; Lee, D. Meta-Analysis Method for Discovering Reliable Biomarkers by Integrating Statistical and Biological Approaches: An Application to Liver Toxicity. Biochem. Biophys. Res. Commun. 2016, 471, 274–281. [Google Scholar] [CrossRef] [PubMed]
- Whiteley, M.; Bangera, M.G.; Bumgarner, R.E.; Parsek, M.R.; Teitzel, G.M.; Lory, S.; Greenberg, E.P. Gene Expression in Pseudomonas Aeruginosa Biofilms. Nature 2001, 413, 860–864. [Google Scholar] [CrossRef]
- Schembri, M.A.; Kjærgaard, K.; Klemm, P. Global Gene Expression in Escherichia Coli Biofilms. Mol. Microbiol. 2003, 48, 253–267. [Google Scholar] [CrossRef]
- Resch, A.; Rosenstein, R.; Nerz, C.; Götz, F. Differential Gene Expression Profiling of Staphylococcus Aureus Cultivated under Biofilm and Planktonic Conditions. Appl. Environ. Microbiol. 2005, 71, 2663–2676. [Google Scholar] [CrossRef]
- Post, D.M.; Held, J.M.; Ketterer, M.R.; Phillips, N.J.; Sahu, A.; Apicella, M.A.; Gibson, B.W. Comparative Analyses of Proteins from Haemophilus Influenzae Biofilm and Planktonic Populations Using Metabolic Labeling and Mass Spectrometry. BMC Microbiol. 2014, 14, 329. [Google Scholar] [CrossRef]
- Bottagisio, M.; Barbacini, P.; Bidossi, A.; Torretta, E.; DeLancey-Pulcini, E.; Gelfi, C.; James, G.A.; Lovati, A.B.; Capitanio, D. Phenotypic Modulation of Biofilm Formation in a Staphylococcus Epidermidis Orthopedic Clinical Isolate Grown Under Different Mechanical Stimuli: Contribution From a Combined Proteomic Study. Front. Microbiol. 2020, 11. [Google Scholar] [CrossRef]
- Zemke, A.C.; D’Amico, E.J.; Torres, A.M.; Carreno-Florez, G.P.; Keeley, P.; DuPont, M.; Kasturiarachi, N.; Bomberger, J.M. Bacterial Respiratory Inhibition Triggers Dispersal of Pseudomonas Aeruginosa Biofilms. Appl. Environ. Microbiol. 2023, 89. [Google Scholar] [CrossRef] [PubMed]
- Ueda, A.; Attila, C.; Whiteley, M.; Wood, T.K. Uracil Influences Quorum Sensing and Biofilm Formation in Pseudomonas Aeruginosa and Fluorouracil Is an Antagonist. Microb. Biotechnol. 2009, 2, 62–74. [Google Scholar] [CrossRef] [PubMed]
- Naughton, S.; Parker, D.; Seemann, T.; Thomas, T.; Turnbull, L.; Rose, B.; Bye, P.; Cordwell, S.; Whitchurch, C.; Manos, J. Pseudomonas Aeruginosa AES-1 Exhibits Increased Virulence Gene Expression during Chronic Infection of Cystic Fibrosis Lung. PLoS One 2011, 6, e24526. [Google Scholar] [CrossRef]
- Taylor, P.K.; Zhang, L.; Mah, T.-F. Loss of the Two-Component System TctD-TctE in Pseudomonas Aeruginosa Affects Biofilm Formation and Aminoglycoside Susceptibility in Response to Citric Acid. mSphere 2019, 4. [Google Scholar] [CrossRef] [PubMed]
- Deng, W.; Zhou, C.; Qin, J.; Jiang, Y.; Li, D.; Tang, X.; Luo, J.; Kong, J.; Wang, K. Molecular Mechanisms of DNase Inhibition of Early Biofilm Formation Pseudomonas Aeruginosa or Staphylococcus Aureus: A Transcriptome Analysis. Biofilm 2024, 7, 100174. [Google Scholar] [CrossRef] [PubMed]
- Wang, Y.; Wilks, J.C.; Danhorn, T.; Ramos, I.; Croal, L.; Newman, D.K. Phenazine-1-Carboxylic Acid Promotes Bacterial Biofilm Development via Ferrous Iron Acquisition. J. Bacteriol. 2011, 193, 3606–3617. [Google Scholar] [CrossRef]
- Li, K.; Xu, C.; Jin, Y.; Sun, Z.; Liu, C.; Shi, J.; Chen, G.; Chen, R.; Jin, S.; Wu, W. SuhB Is a Regulator of Multiple Virulence Genes and Essential for Pathogenesis of Pseudomonas Aeruginosa. MBio 2013, 4. [Google Scholar] [CrossRef]
- Shi, J.; Jin, Y.; Bian, T.; Li, K.; Sun, Z.; Cheng, Z.; Jin, S.; Wu, W. <scp>SuhB</Scp> Is a Novel Ribosome Associated Protein That Regulates Expression of <scp>MexXY</Scp> by Modulating Ribosome Stalling in <scp> P </Scp> Seudomonas Aeruginosa. Mol. Microbiol. 2015, 98, 370–383. [Google Scholar] [CrossRef]
- Schinner, S.; Engelhardt, F.; Preusse, M.; Thöming, J.G.; Tomasch, J.; Häussler, S. Genetic Determinants of Pseudomonas Aeruginosa Fitness during Biofilm Growth. Biofilm 2020, 2, 100023. [Google Scholar] [CrossRef]
- Moor, H.; Teppo, A.; Lahesaare, A.; Kivisaar, M.; Teras, R. Fis Overexpression Enhances Pseudomonas Putida Biofilm Formation by Regulating the Ratio of LapA and LapF. Microbiology 2014, 160, 2681–2693. [Google Scholar] [CrossRef]
- Long, Y.; Fu, W.; Wang, S.; Deng, X.; Jin, Y.; Bai, F.; Cheng, Z.; Wu, W. Fis Contributes to Resistance of Pseudomonas Aeruginosa to Ciprofloxacin by Regulating Pyocin Synthesis. J. Bacteriol. 2020, 202. [Google Scholar] [CrossRef] [PubMed]
- Holden, E.R.; Yasir, M.; Turner, A.K.; Wain, J.; Charles, I.G.; Webber, M.A. Massively Parallel Transposon Mutagenesis Identifies Temporally Essential Genes for Biofilm Formation in Escherichia Coli. Microb. Genomics 2021, 7. [Google Scholar] [CrossRef] [PubMed]
- Gélinas, M.; Museau, L.; Milot, A.; Beauregard, P.B. The de Novo Purine Biosynthesis Pathway Is the Only Commonly Regulated Cellular Pathway during Biofilm Formation in TSB-Based Medium in Staphylococcus Aureus and Enterococcus Faecalis. Microbiol. Spectr. 2021, 9. [Google Scholar] [CrossRef] [PubMed]
- Xu, Z.; Fang, X.; Wood, T.K.; Huang, Z.J. A Systems-Level Approach for Investigating Pseudomonas Aeruginosa Biofilm Formation. PLoS One 2013, 8, e57050. [Google Scholar] [CrossRef] [PubMed]
- Mueller, R.S.; McDougald, D.; Cusumano, D.; Sodhi, N.; Kjelleberg, S.; Azam, F.; Bartlett, D.H. Vibrio Cholerae Strains Possess Multiple Strategies for Abiotic and Biotic Surface Colonization. J. Bacteriol. 2007, 189, 5348–5360. [Google Scholar] [CrossRef]
- Li, H.; Du, X.; Chen, C.; Qi, J.; Wang, Y. Integrating Transcriptomics and Metabolomics Analysis on Kojic Acid Combating Acinetobacter Baumannii Biofilm and Its Potential Roles. Microbiol. Res. 2022, 254, 126911. [Google Scholar] [CrossRef]
- Yadav, M.K.; Kwon, S.K.; Cho, C.G.; Park, S.; Chae, S.; Song, J. Gene Expression Profile of Early in Vitro Biofilms of Streptococcus Pneumoniae. Microbiol. Immunol. 2012, 56, 621–629. [Google Scholar] [CrossRef]
- Thöming, J.G.; Tomasch, J.; Preusse, M.; Koska, M.; Grahl, N.; Pohl, S.; Willger, S.D.; Kaever, V.; Müsken, M.; Häussler, S. Parallel Evolutionary Paths to Produce More than One Pseudomonas Aeruginosa Biofilm Phenotype. npj Biofilms Microbiomes 2020, 6, 2. [Google Scholar] [CrossRef]
- Banin, E.; Vasil, M.L.; Greenberg, E.P. Iron and Pseudomonas Aeruginosa Biofilm Formation. Proc. Natl. Acad. Sci. 2005, 102, 11076–11081. [Google Scholar] [CrossRef]
- Kang, D.; Kirienko, N. V. High-Throughput Genetic Screen Reveals That Early Attachment and Biofilm Formation Are Necessary for Full Pyoverdine Production by Pseudomonas Aeruginosa. Front. Microbiol. 2017, 8. [Google Scholar] [CrossRef]
- Novotny, L.A.; Goodman, S.D.; Bakaletz, L.O. Targeting a Bacterial DNABII Protein with a Chimeric Peptide Immunogen or Humanised Monoclonal Antibody to Prevent or Treat Recalcitrant Biofilm-Mediated Infections. eBioMedicine 2020, 59, 102867. [Google Scholar] [CrossRef] [PubMed]
- Saleh, M.M.; Yousef, N.; Shafik, S.M.; Abbas, H.A. Attenuating the Virulence of the Resistant Superbug Staphylococcus Aureus Bacteria Isolated from Neonatal Sepsis by Ascorbic Acid, Dexamethasone, and Sodium Bicarbonate. BMC Microbiol. 2022, 22, 268. [Google Scholar] [CrossRef] [PubMed]
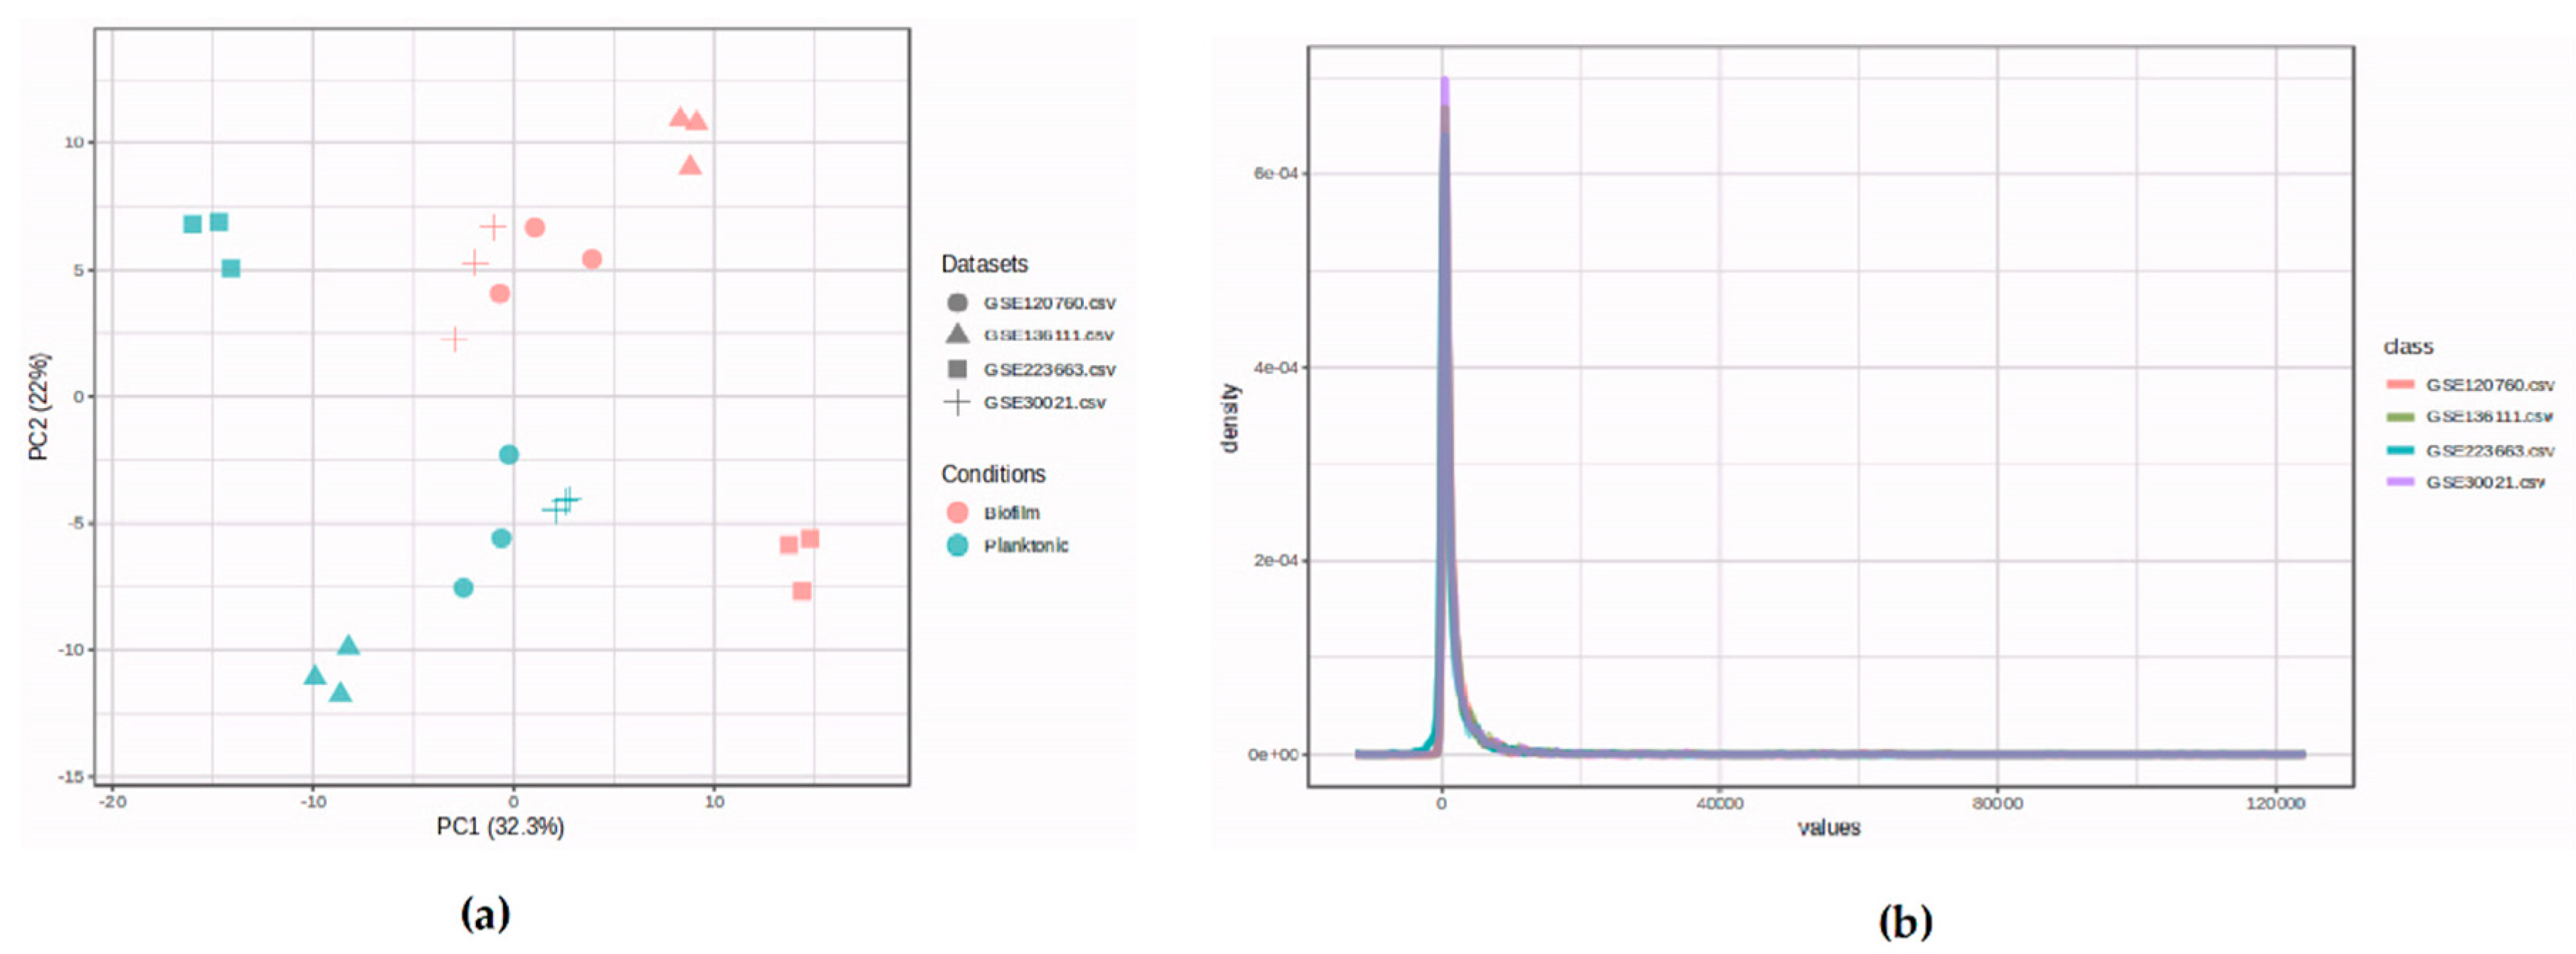
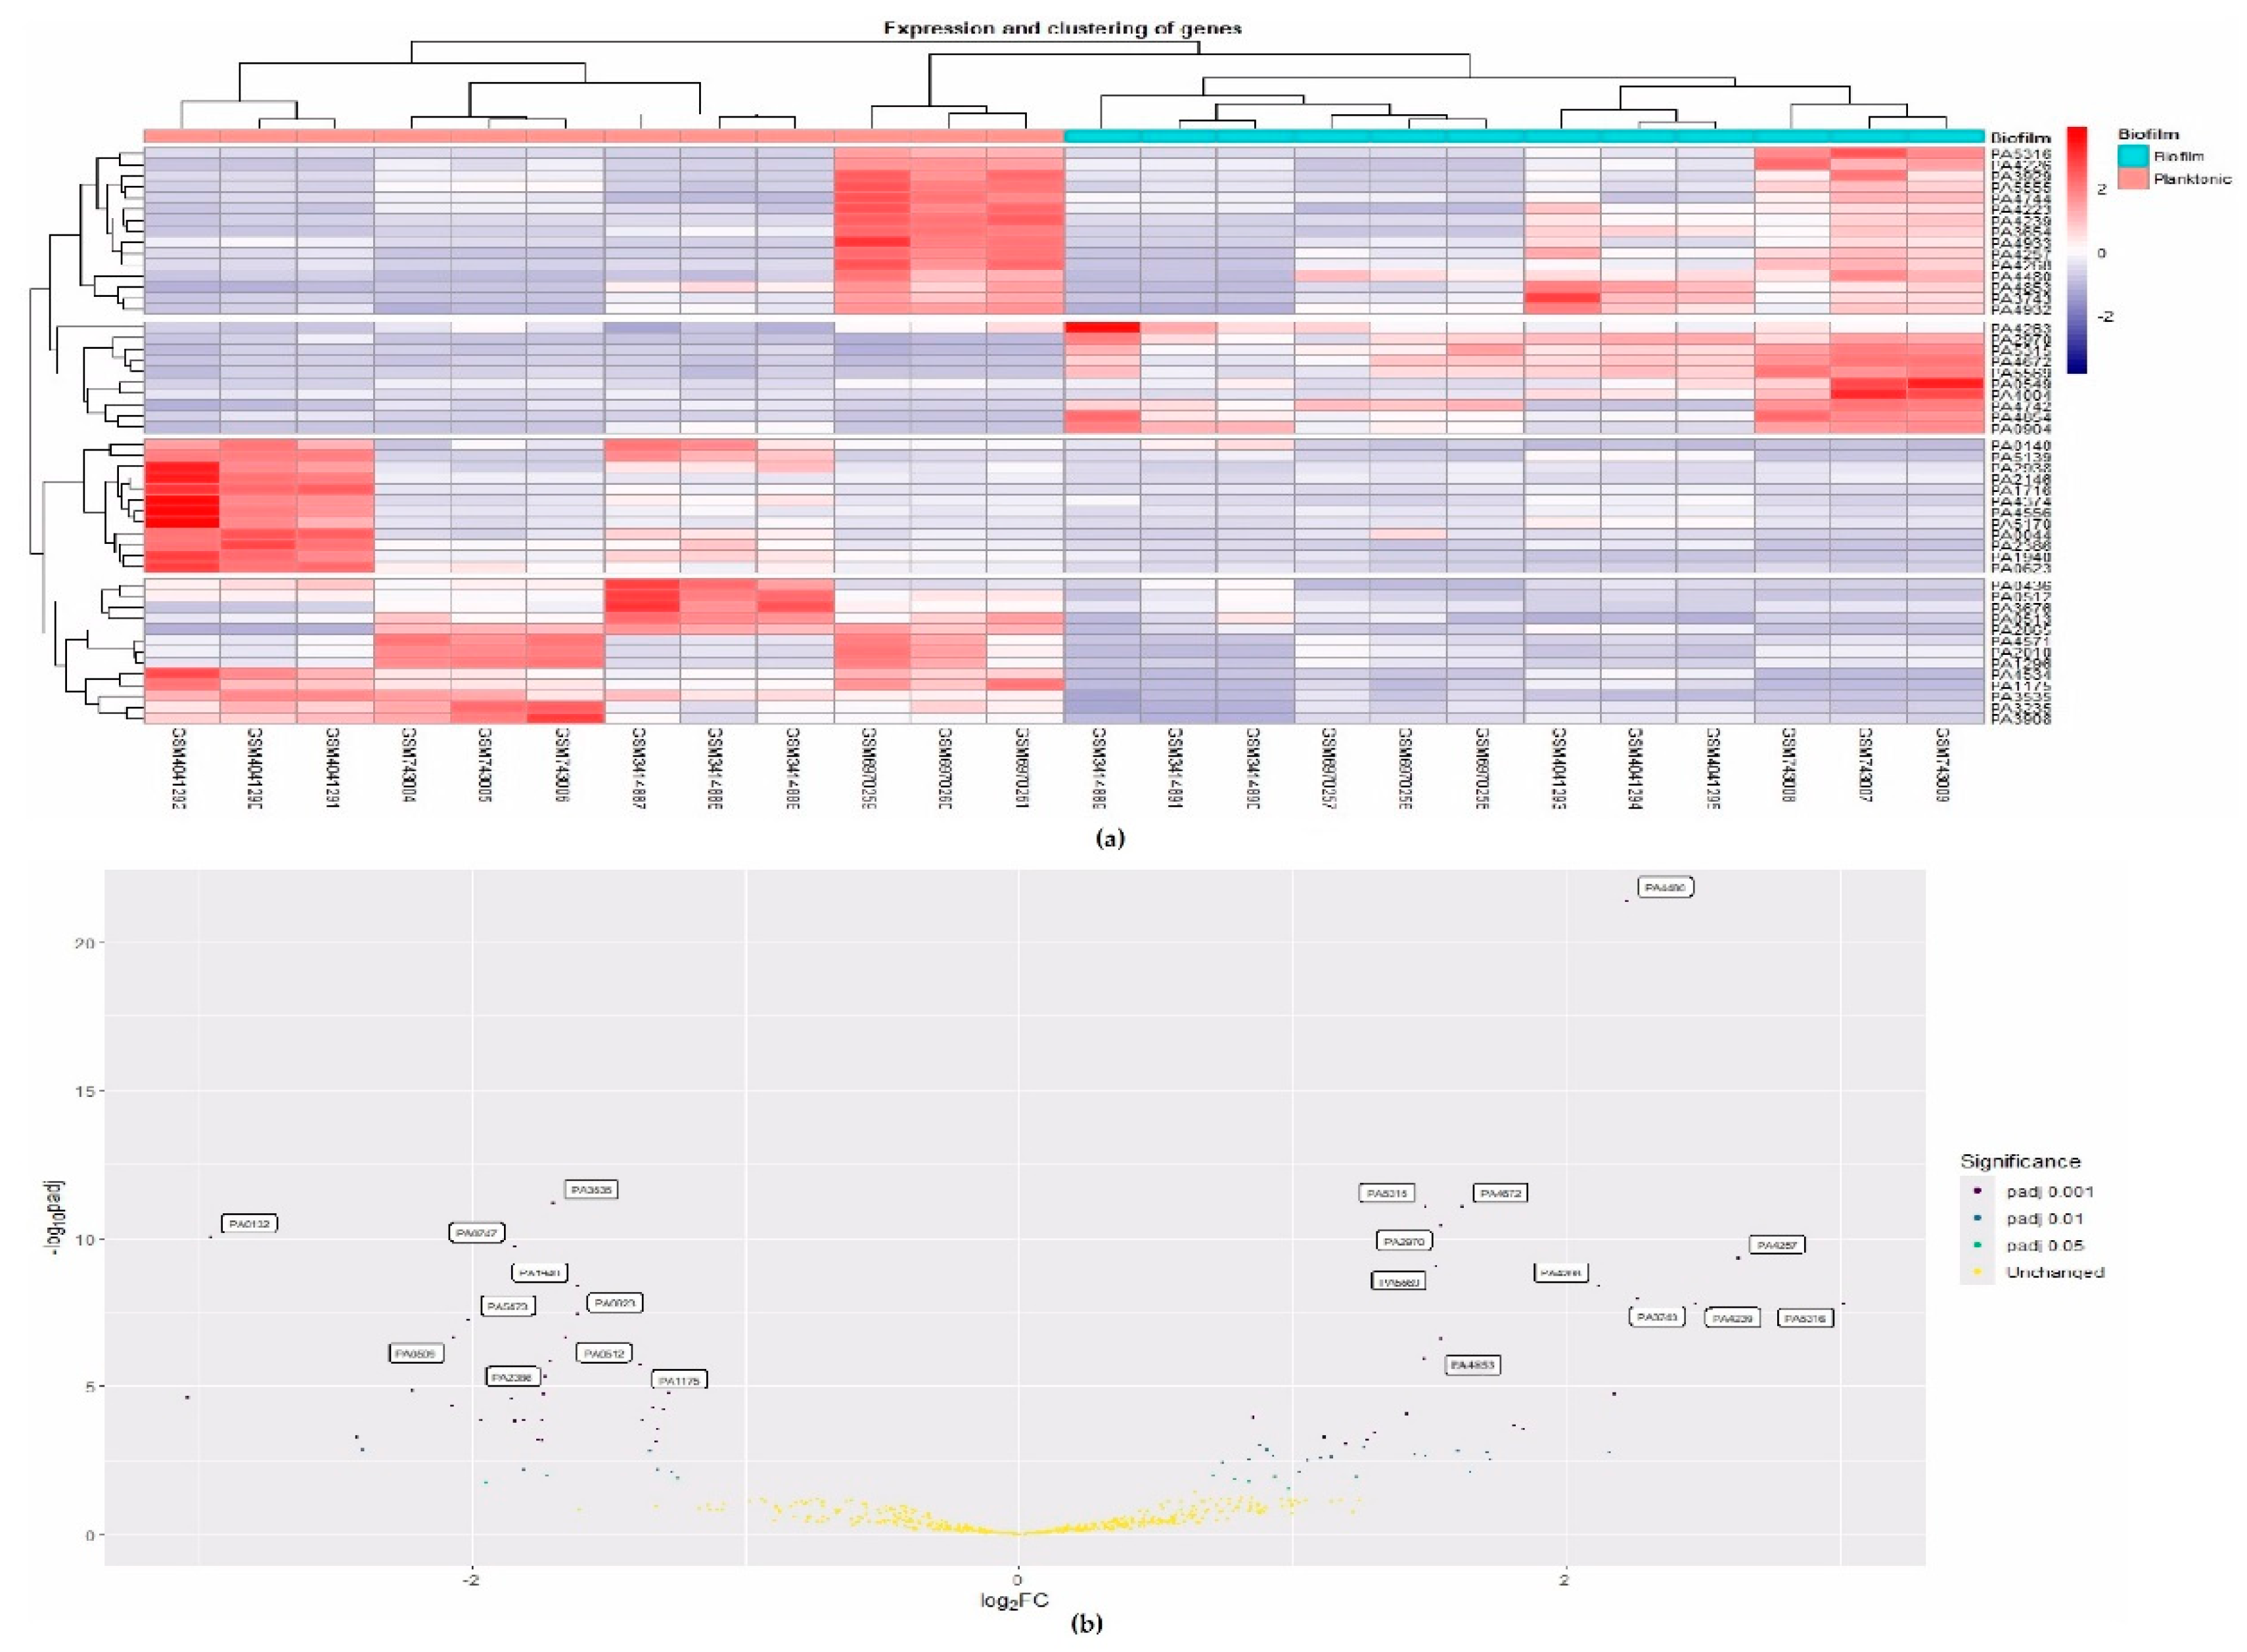
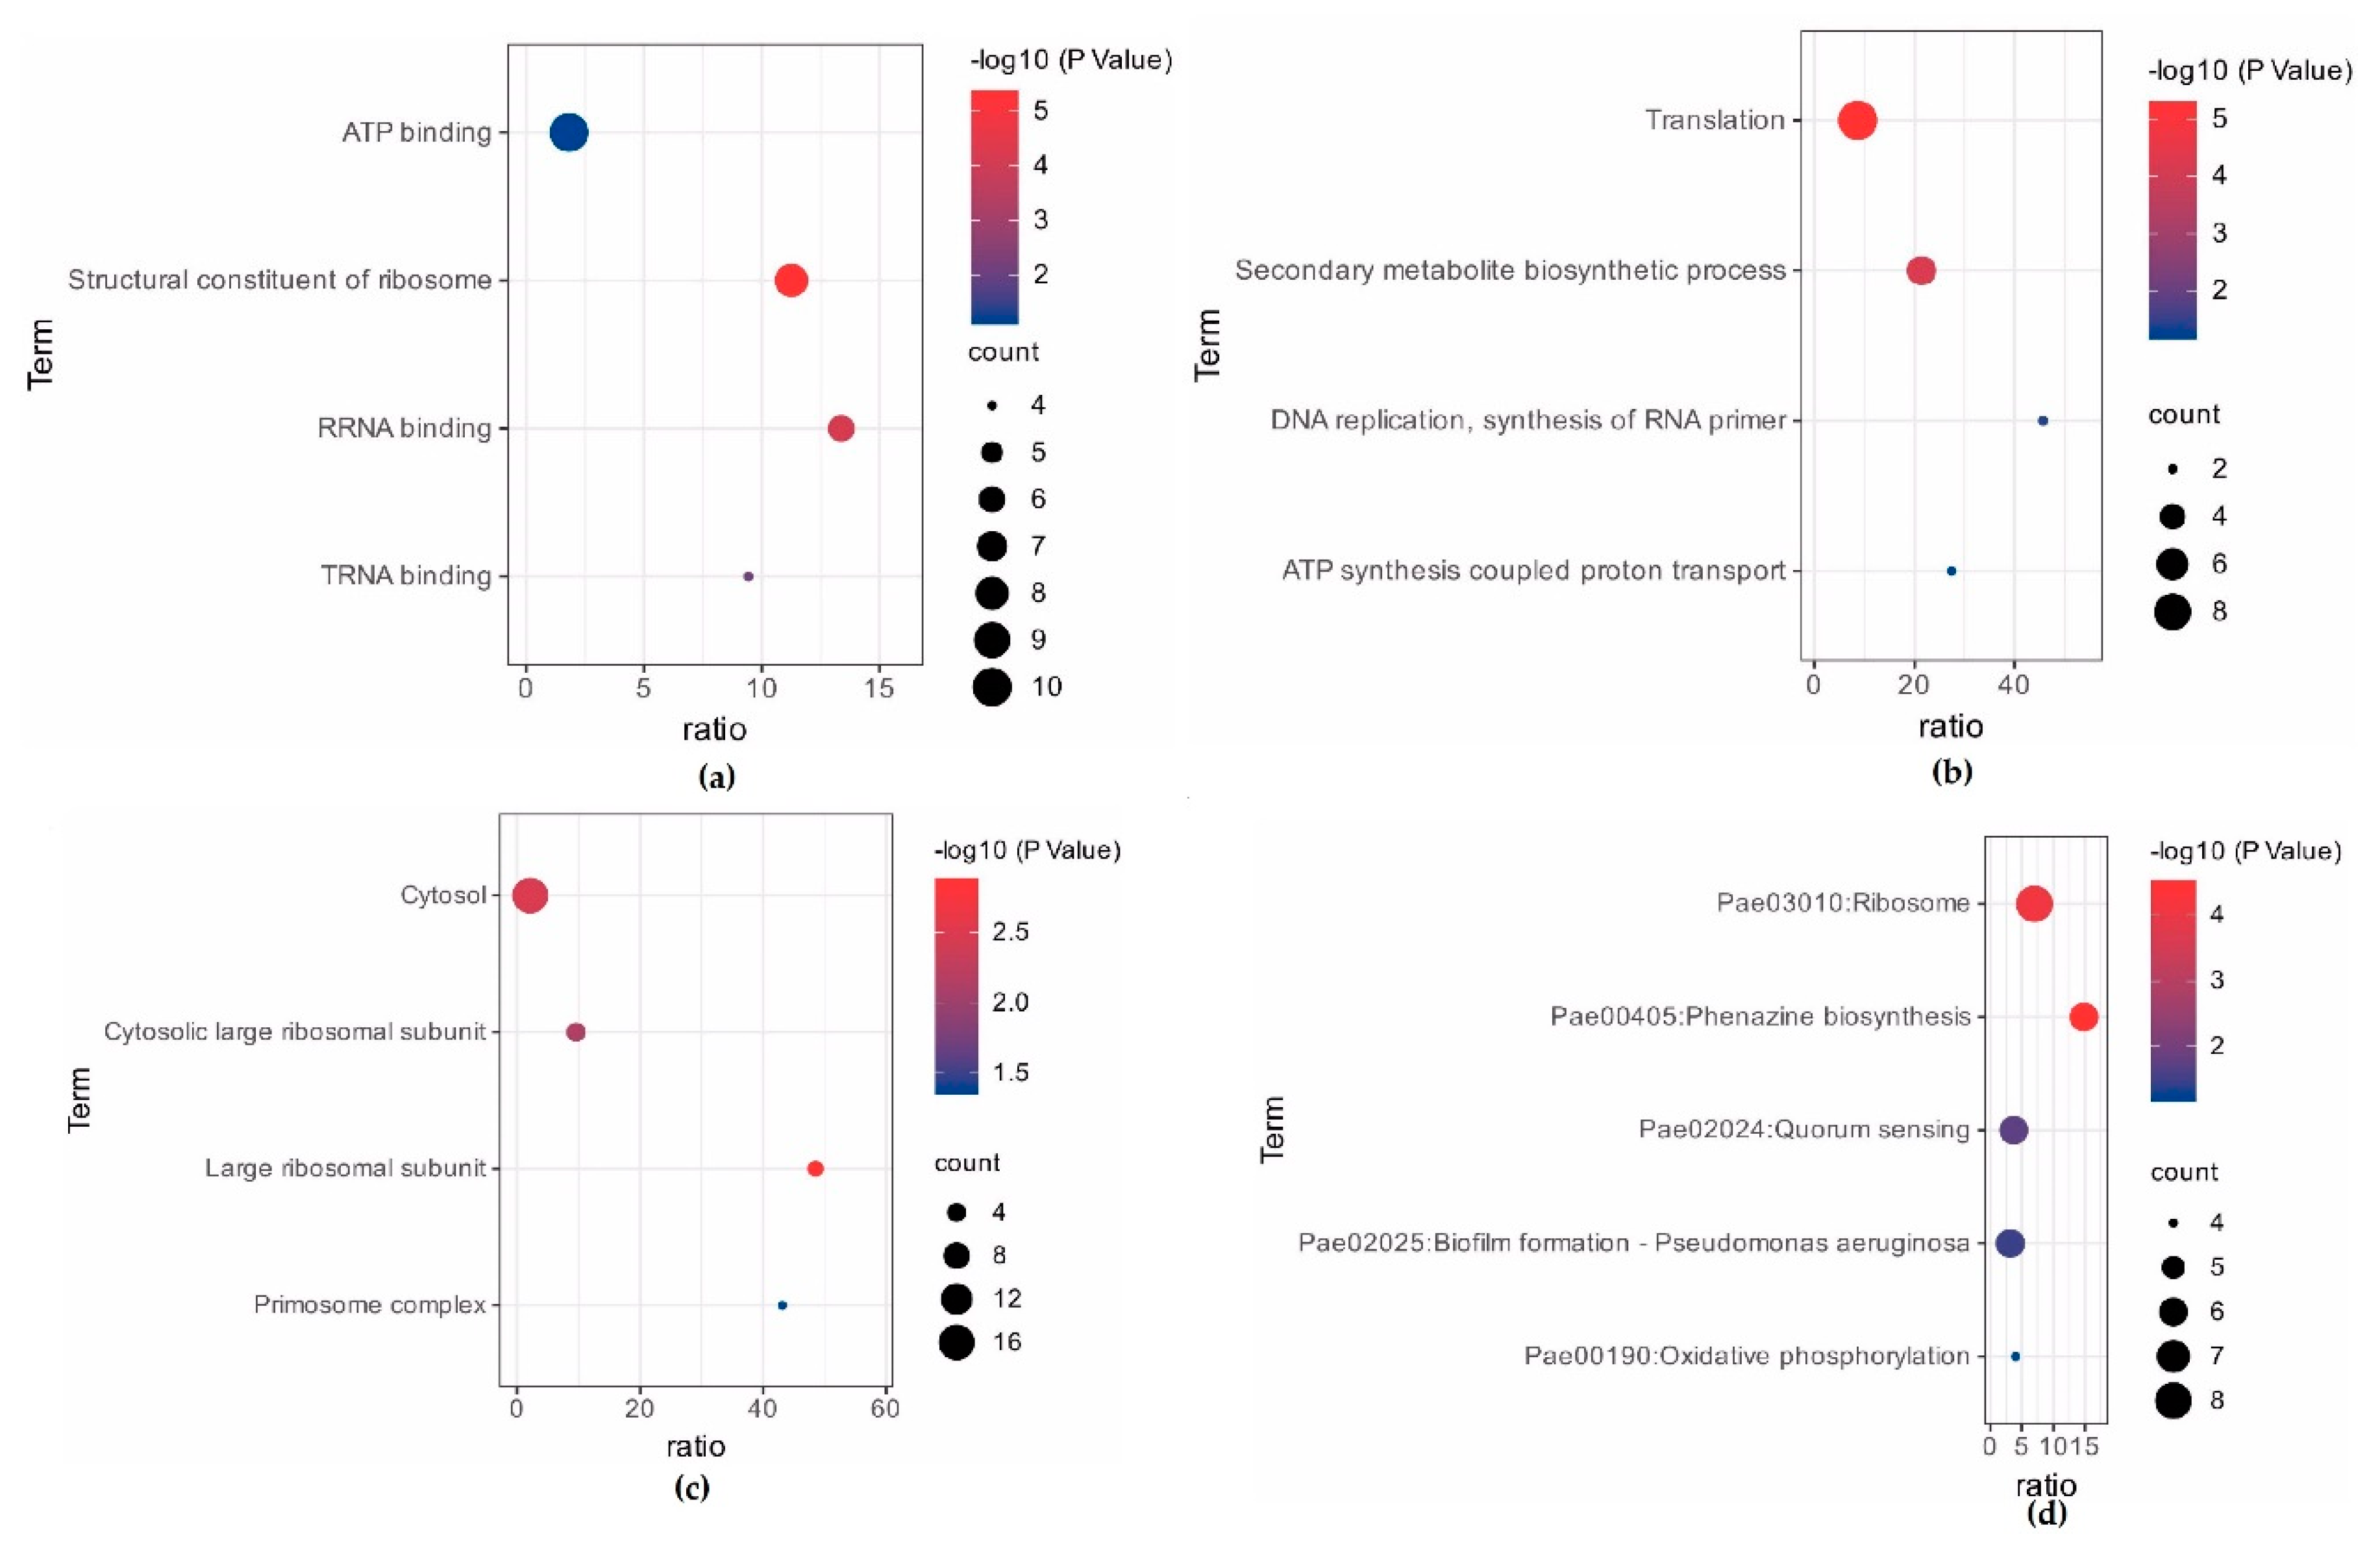
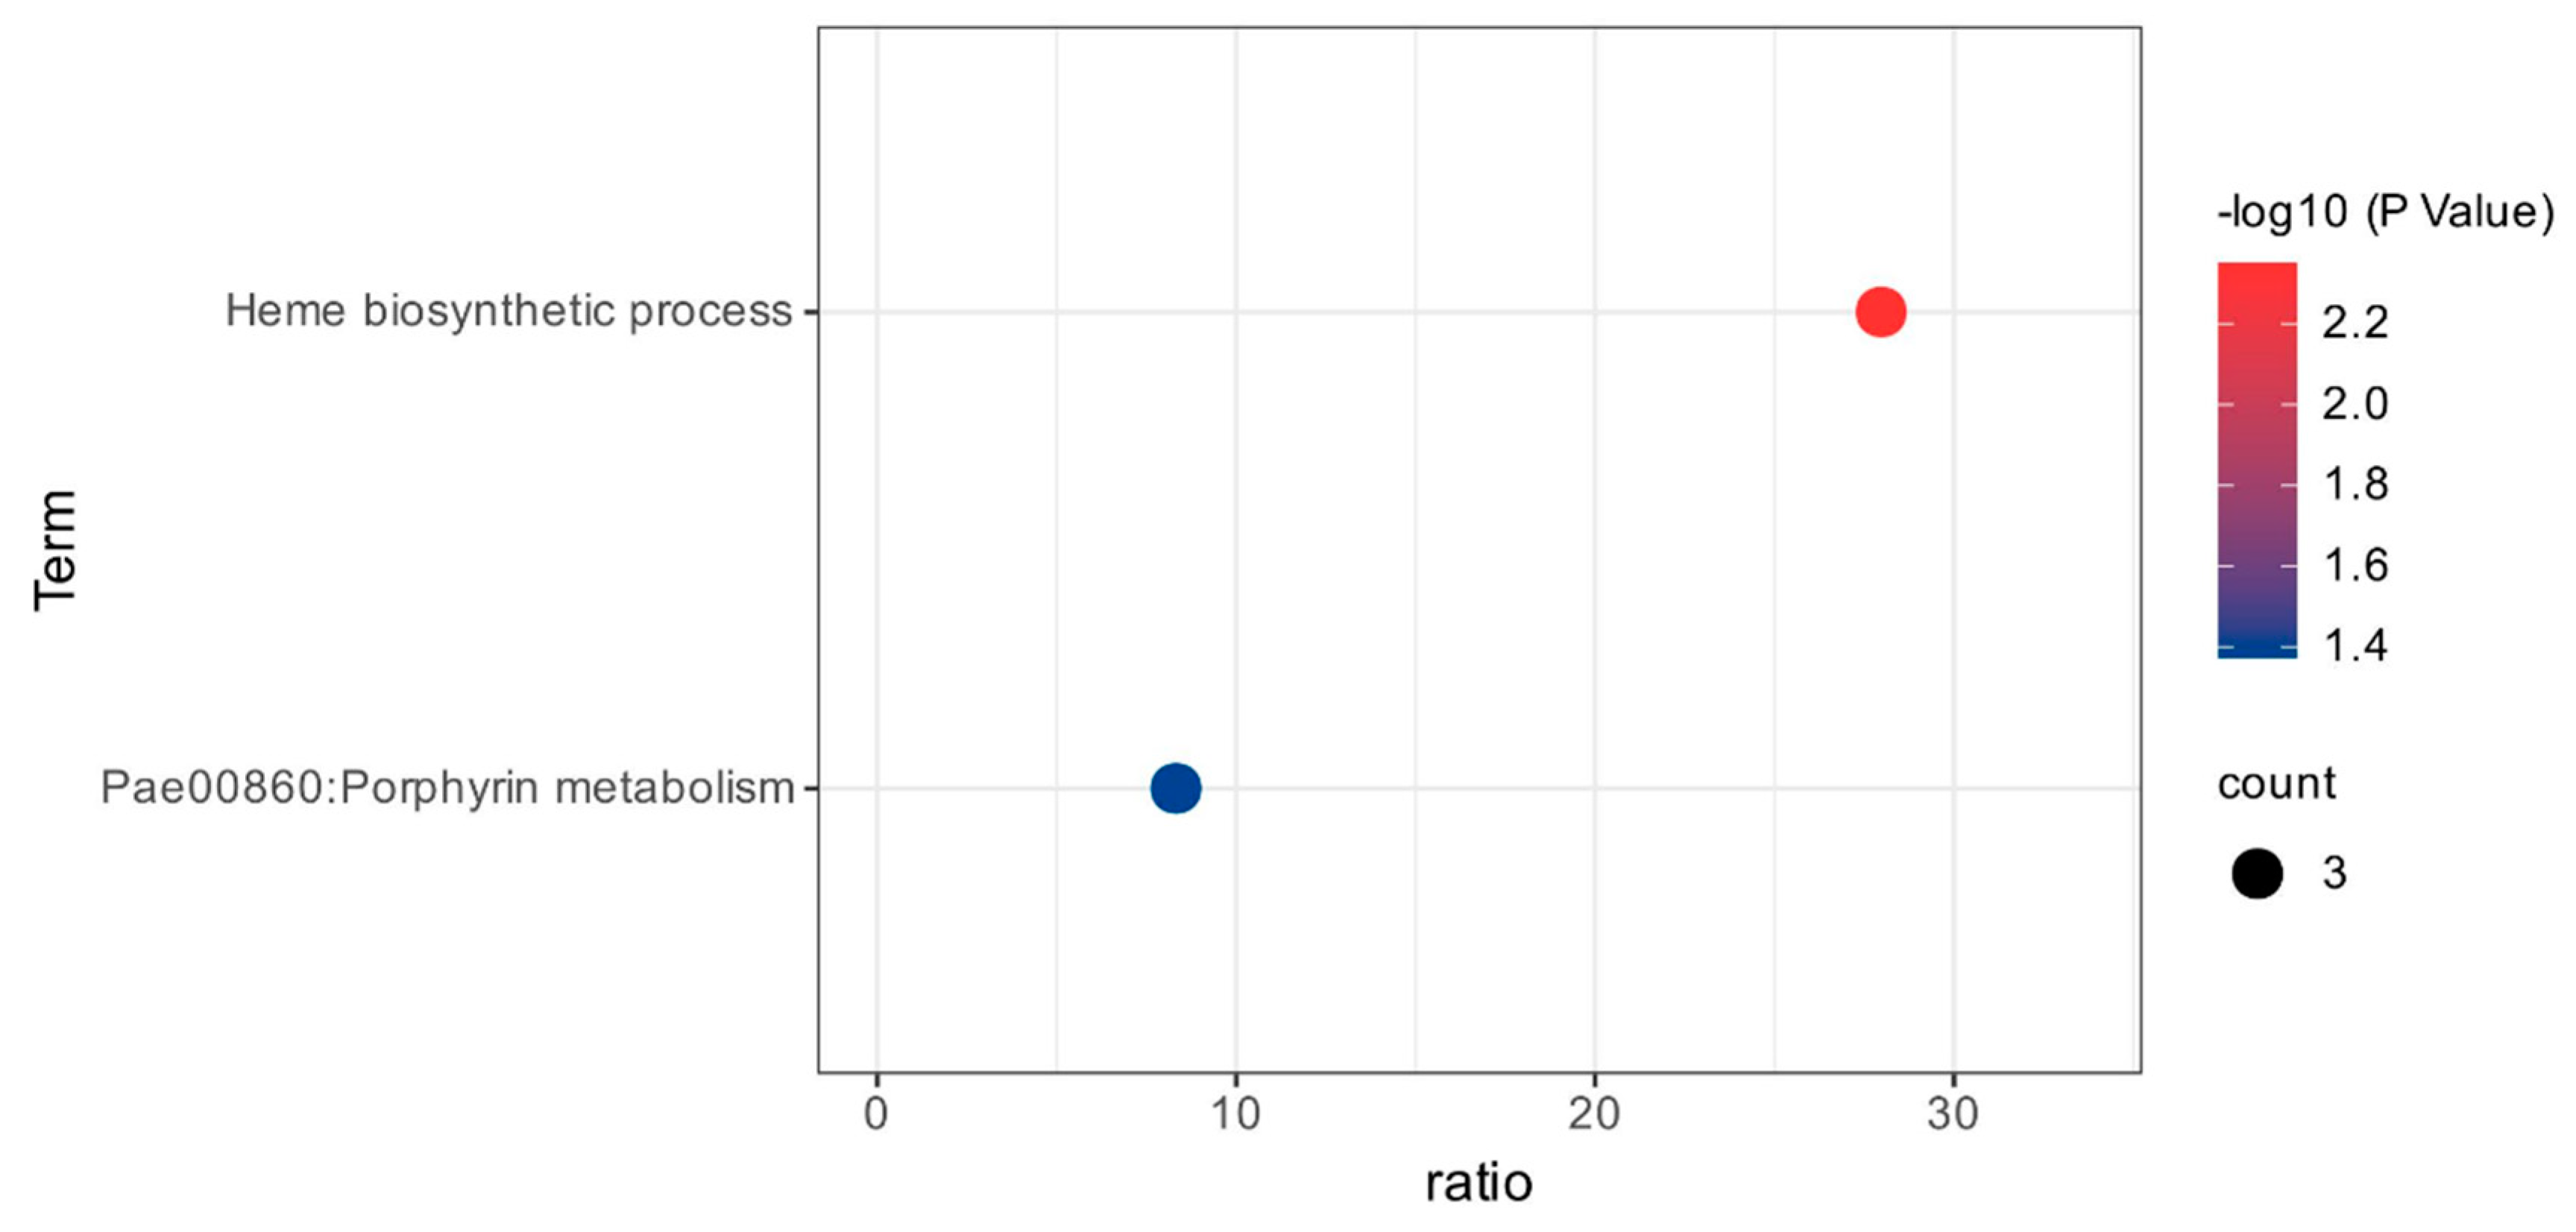
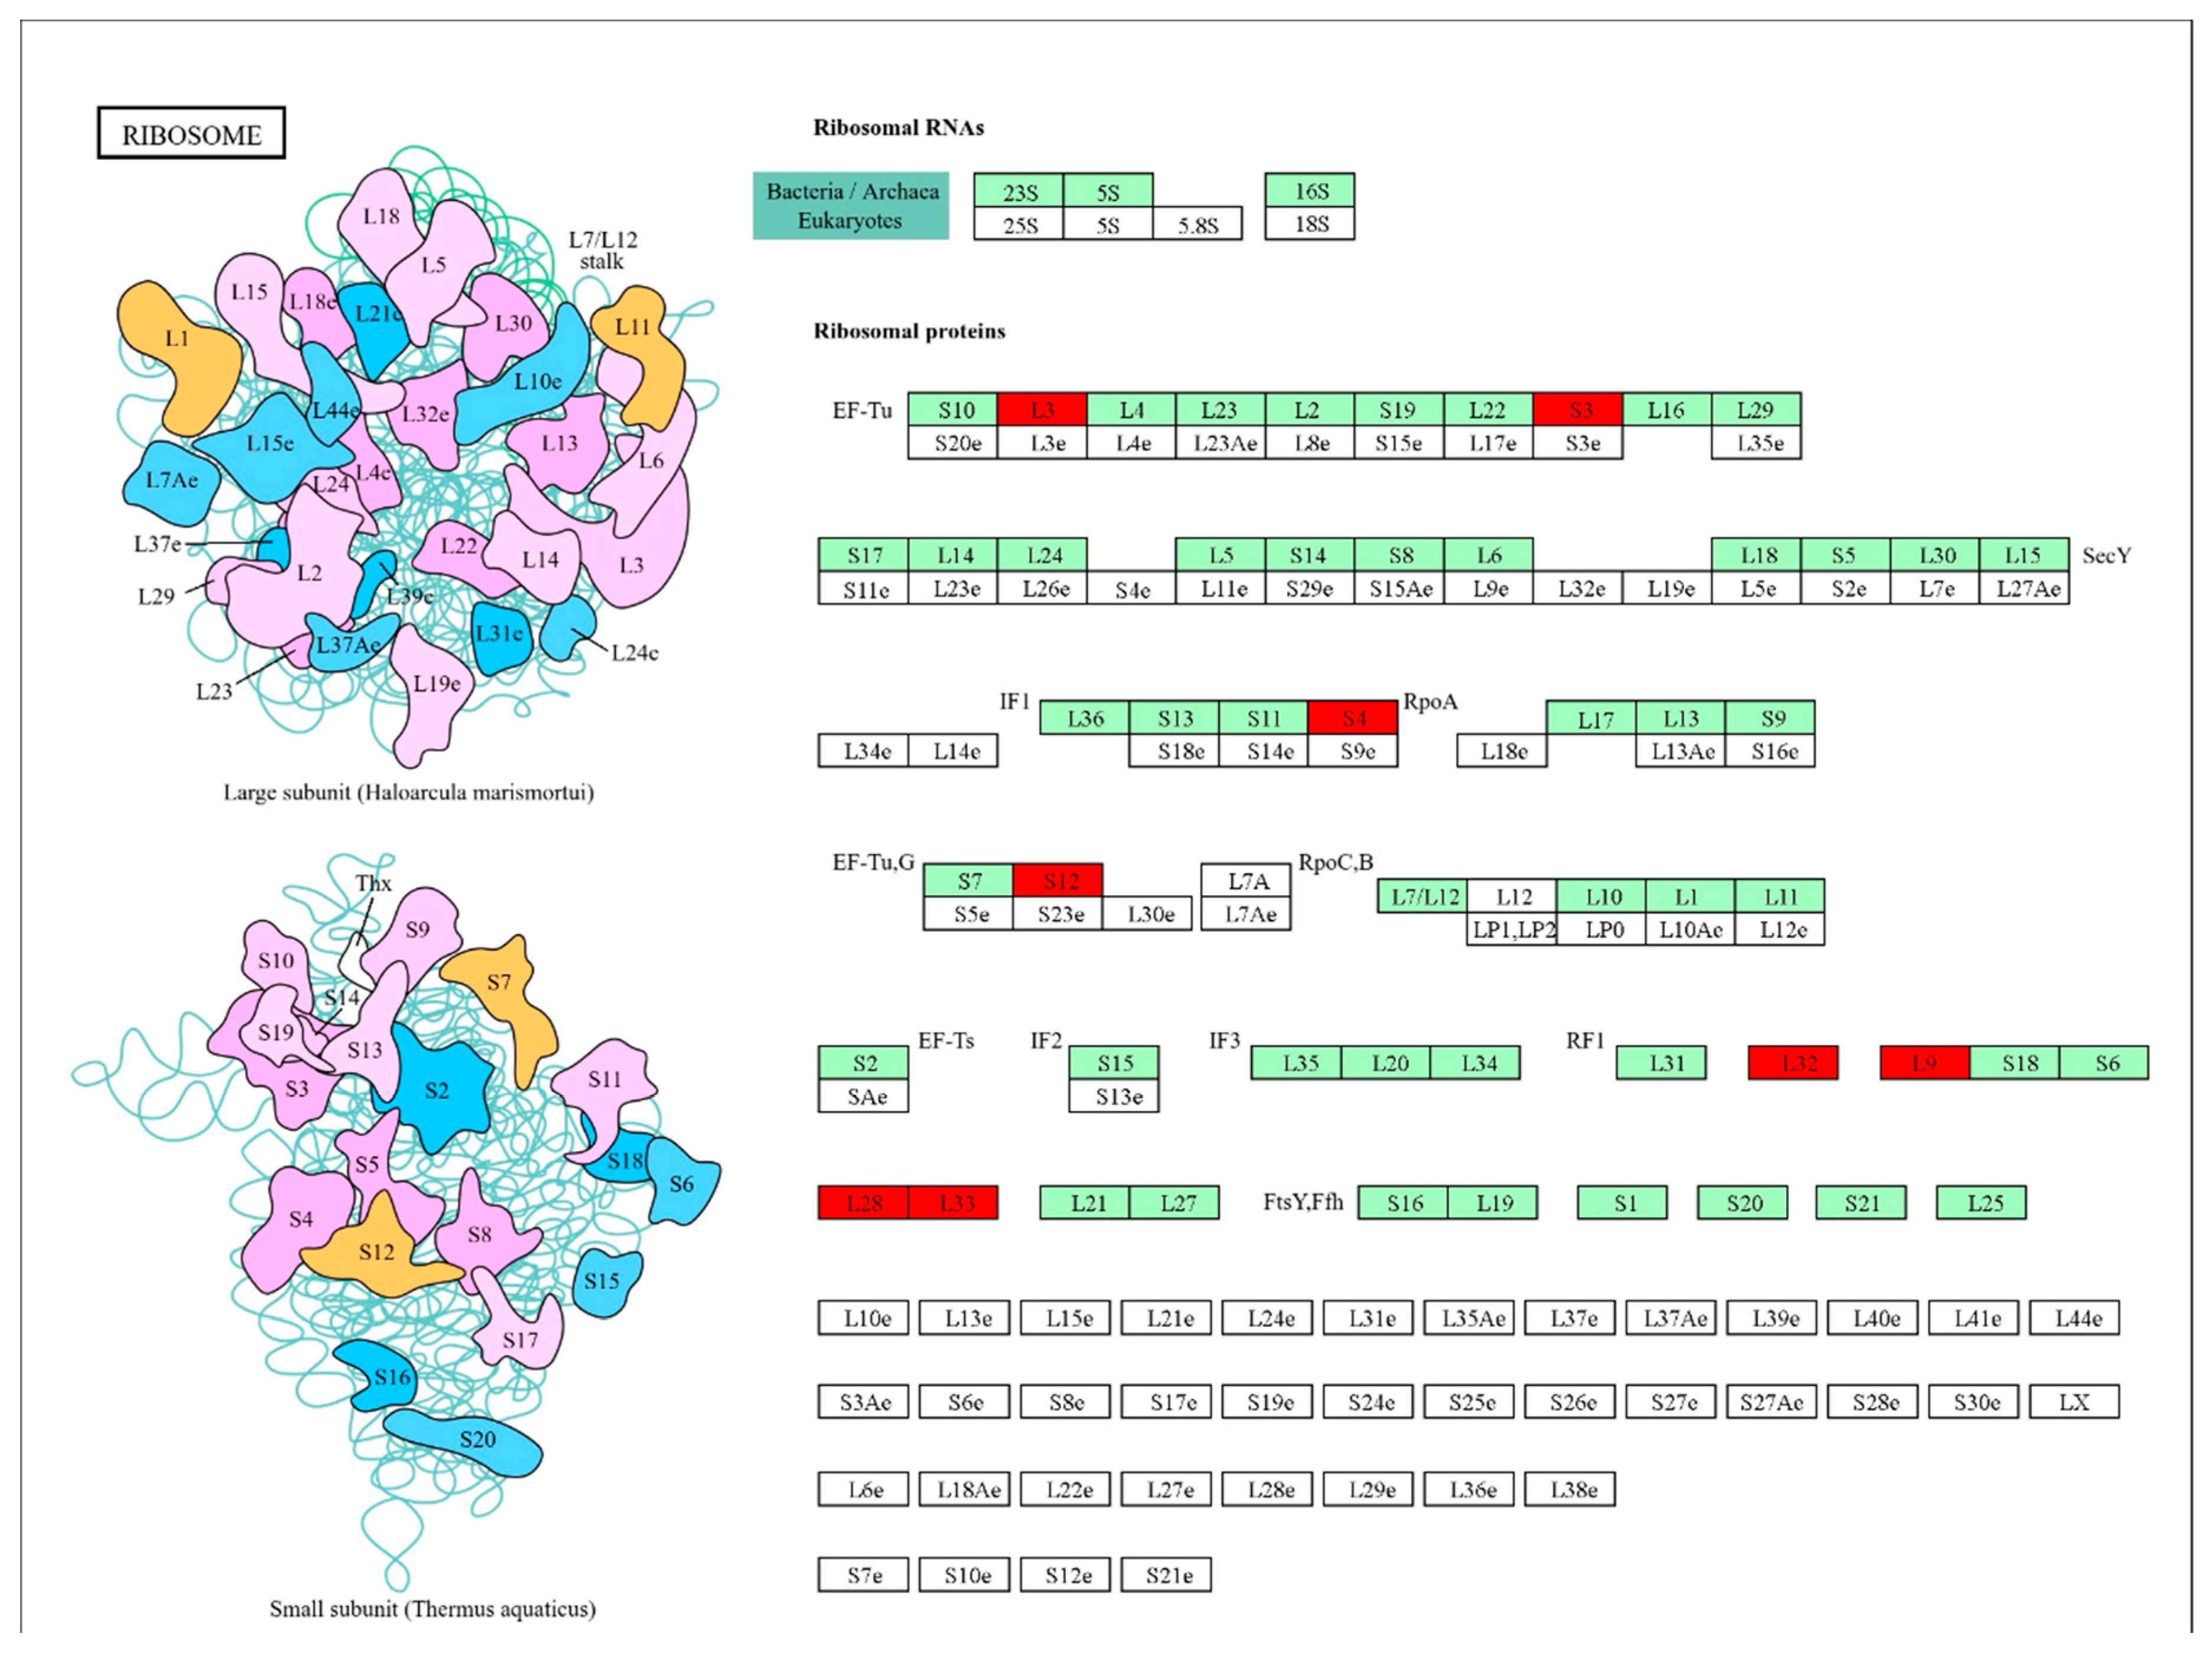
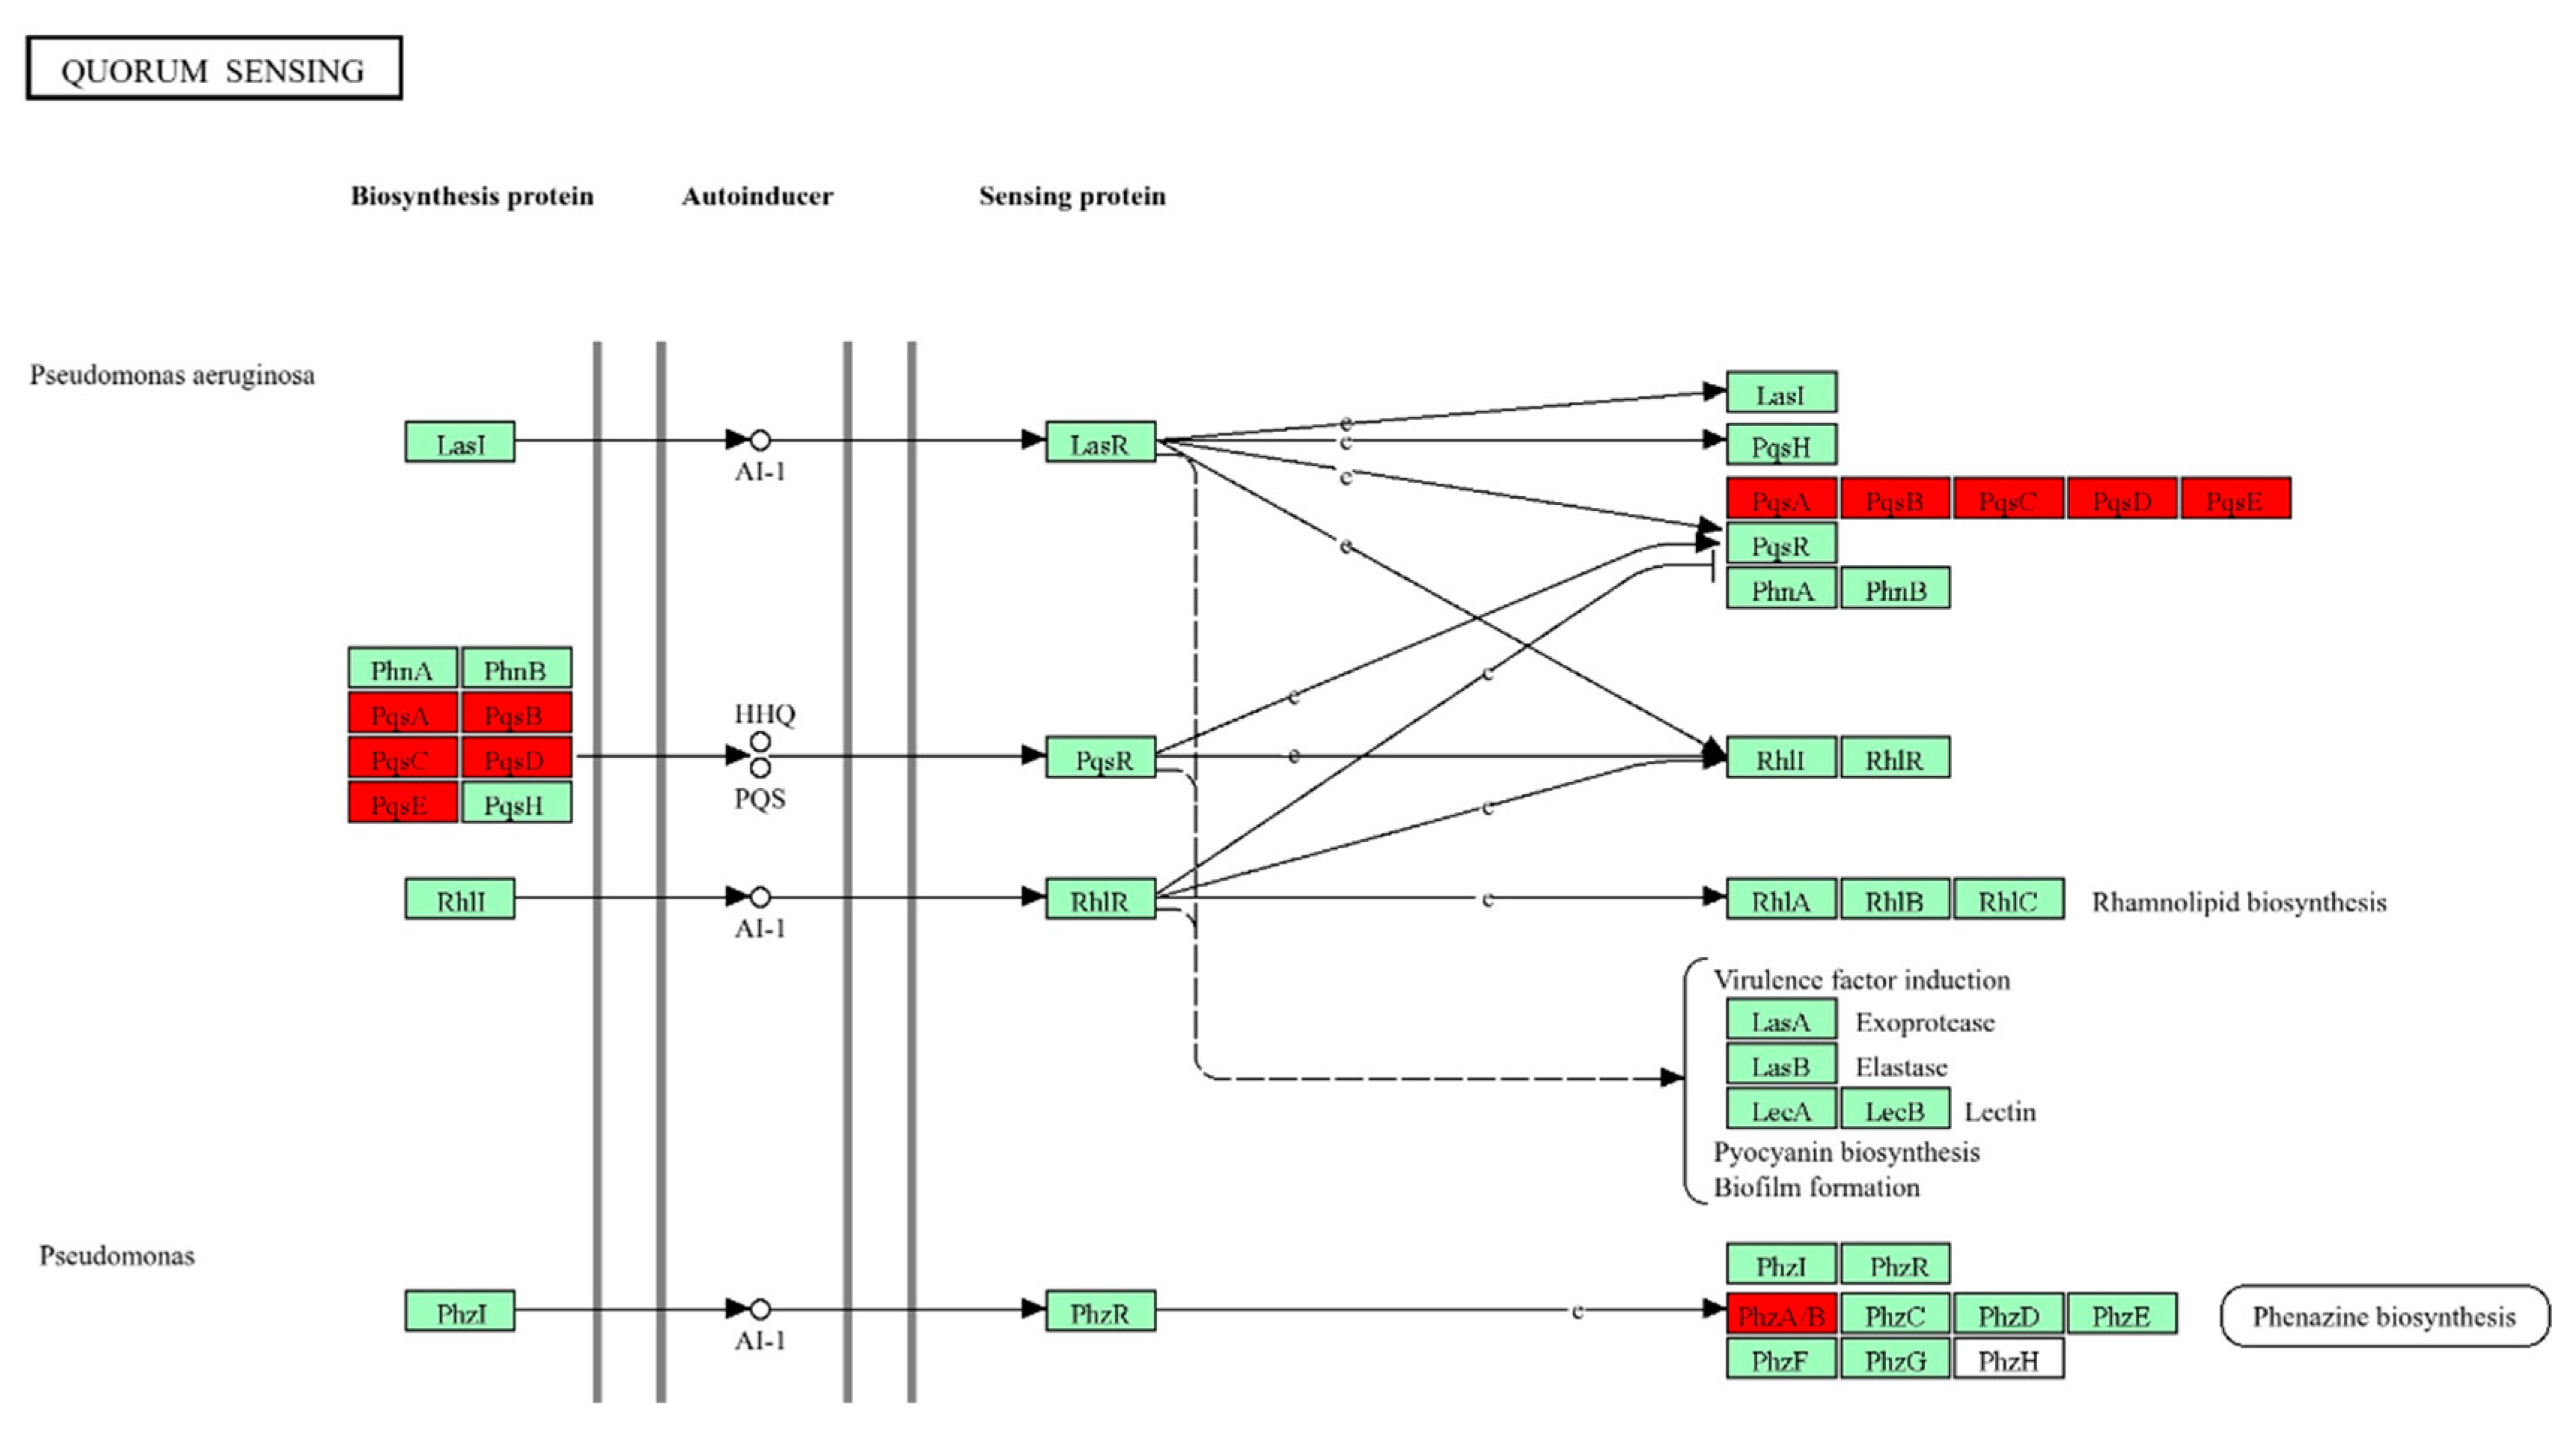
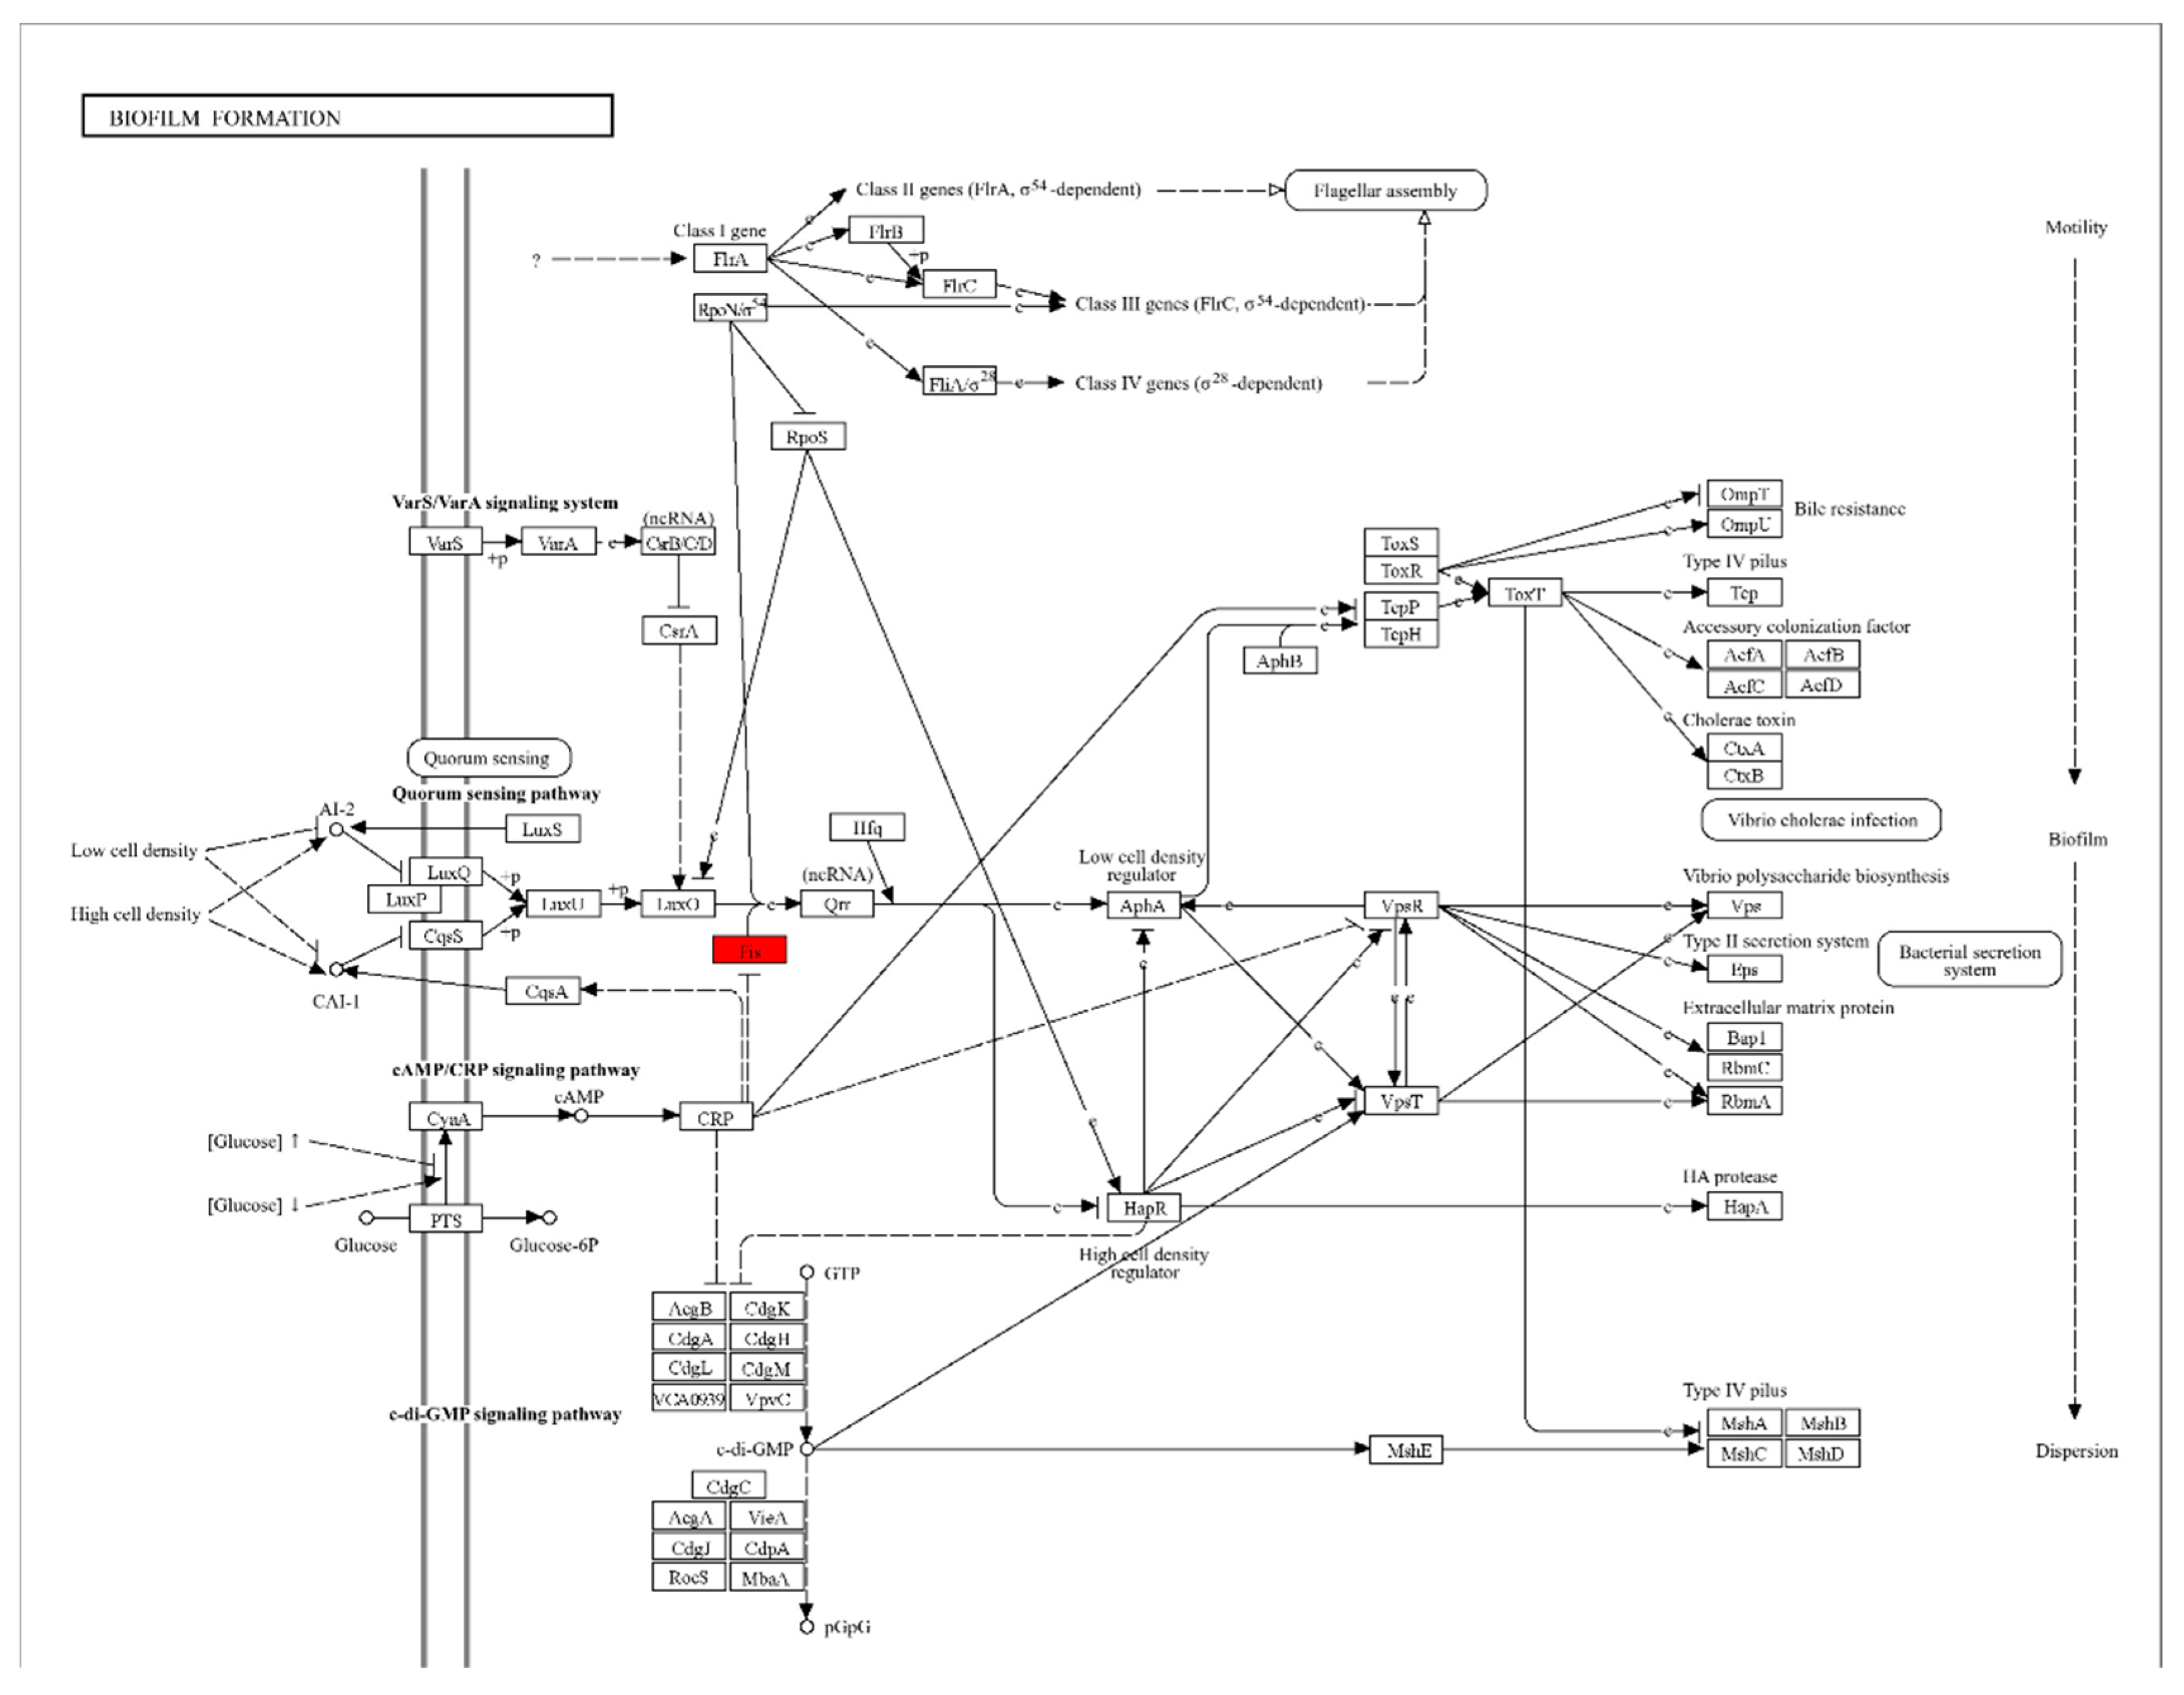

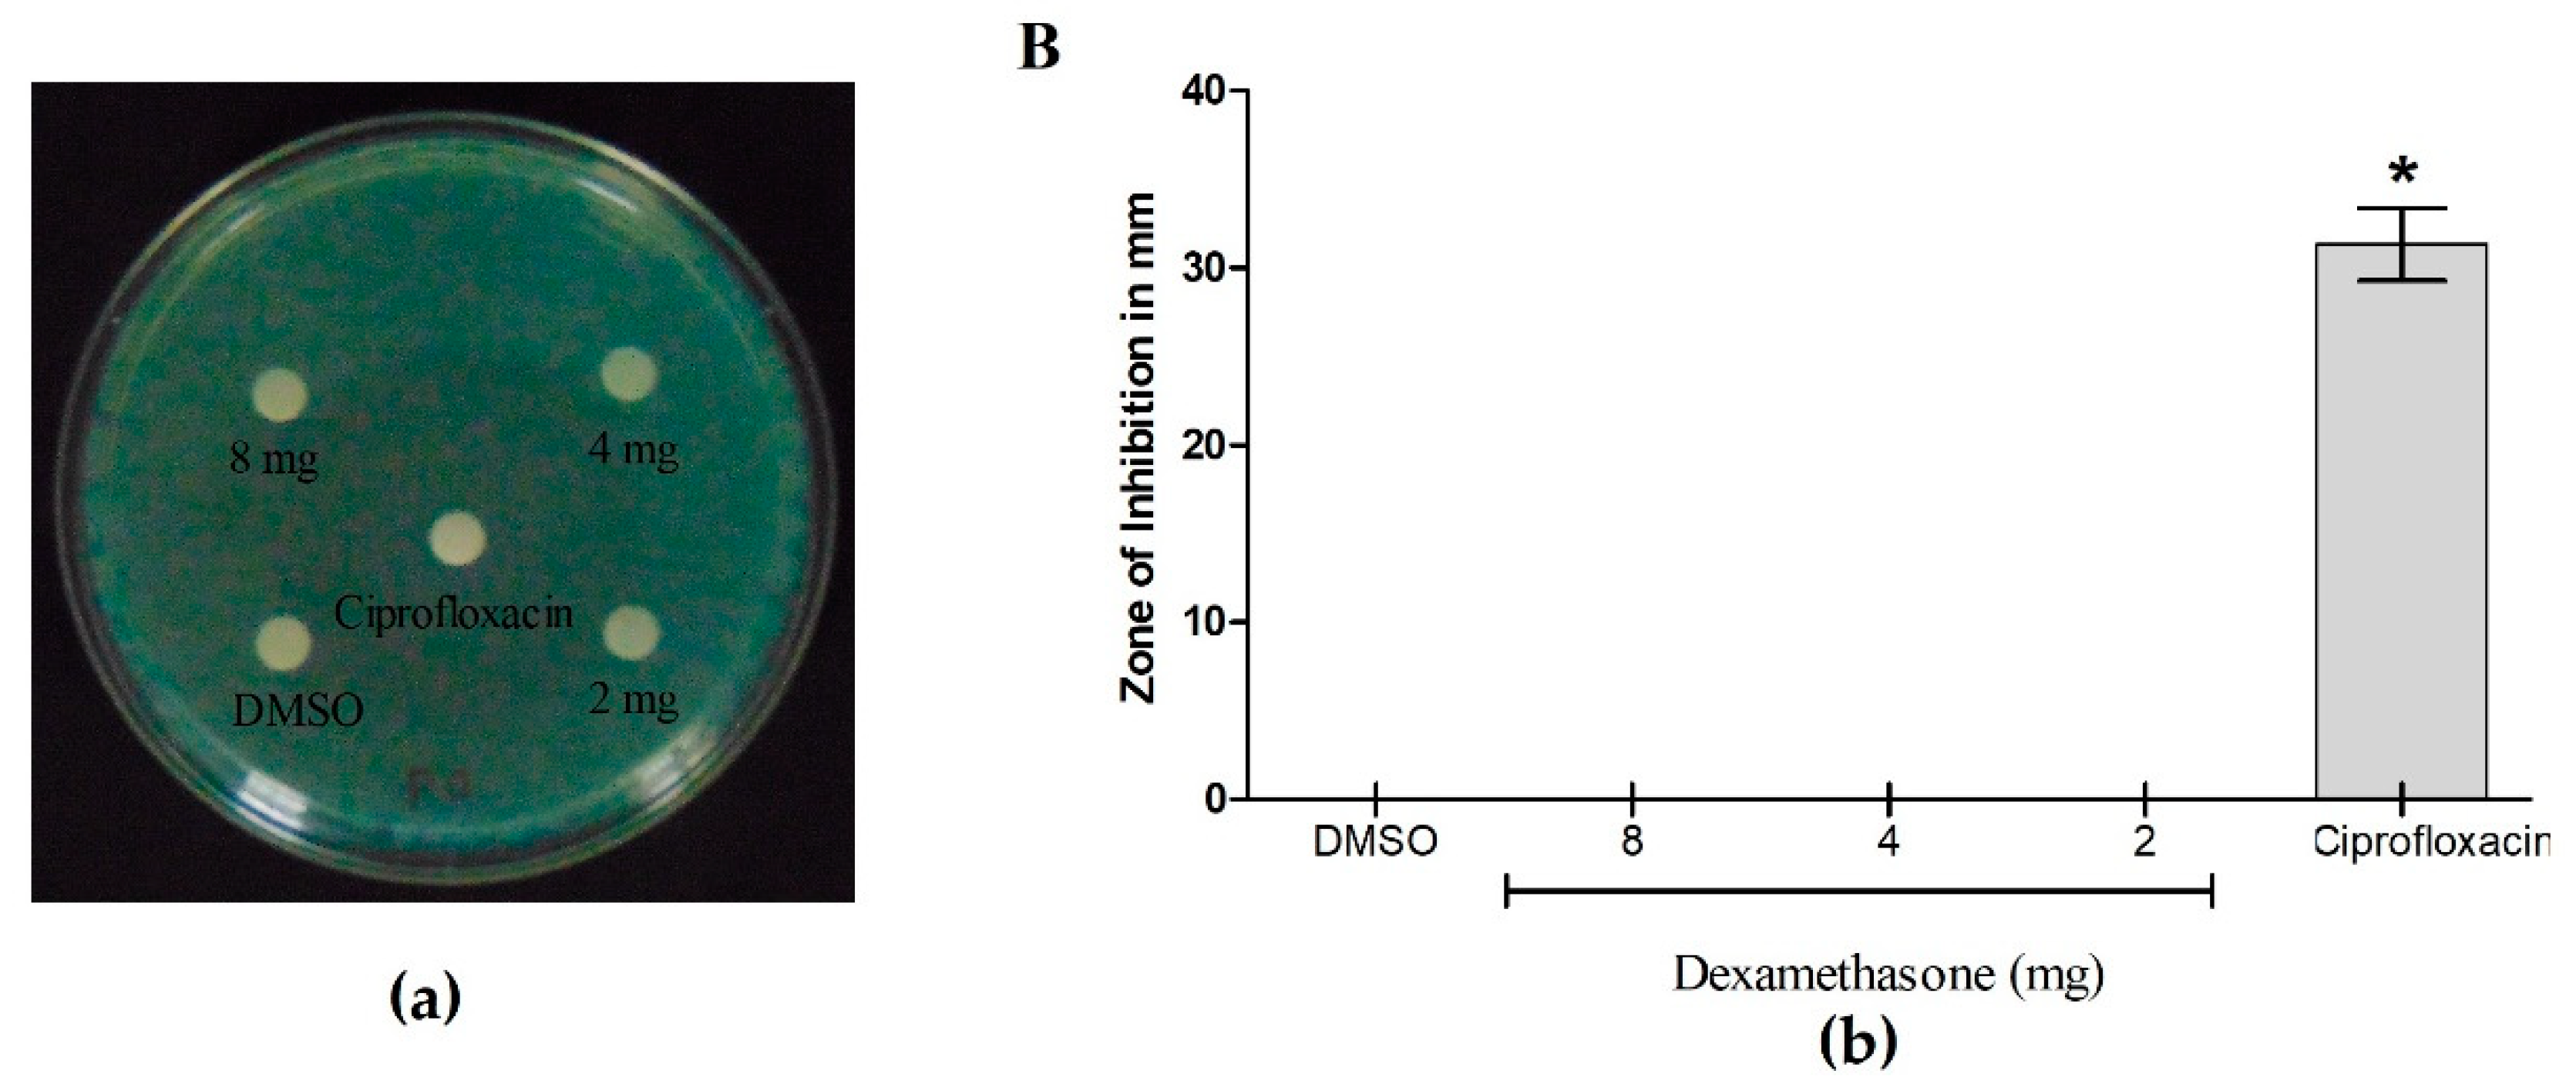

| S.No. | GEO series ID | Total Number of Samples (Control: Test) | Planktonic (Control) | Biofilm (Test) | Study Platform |
| 1 | GSE30021 | 6 (3:3) | GSM743004, GSM743005, GSM743006 | GSM743007, GSM743008, GSM743009 |
GPL84 [Pae_G1a] Affymetrix Pseudomonas aeruginosa Array |
| 2 | GSE120760 | 6 (3:3) | GSM3414886, GSM3414887, GSM3414888 | GSM3414889, GSM3414891, GSM3414890 | GPL84 [Pae_G1a] Affymetrix Pseudomonas aeruginosa Array |
| 3 | GSE136111 | 6 (3:3) | GSM4041290, GSM4041291, GSM4041292 | GSM4041293, GSM4041294, GSM4041295 | Illumina NextSeq 500 (Pseudomonas aeruginosa) |
| 4 | GSE223663 | 6 (3:3) | GSM6970259, GSM6970260, GSM6970261 |
GSM6970256, GSM6970257, GSM6970258 |
Illumina HiSeq 2500 (Pseudomonas aeruginosa) |
| S.No. | Expression | Significance | No. of genes |
| 1 | Down-regulated | padj 0.001 | 30 |
| 2 | Down-regulated | padj 0.01 | 5 |
| 3 | Down-regulated | padj 0.05 | 3 |
| 4 | Unchanged | Unchanged | 447 |
| 5 | Up-regulated | padj 0.001 | 21 |
| 6 | Up-regulated | padj 0.01 | 17 |
| 7 | Up-regulated | padj 0.05 | 7 |
| Locus Tag | Gene symbol | Gene name | Combined effect size | Padj value |
| PA5316 | rpmB | 50S ribosomal protein L28 | 3.01 | 1.57E-08 |
| PA4257 | rpsC | 30S ribosomal protein S3 | 2.63 | 4.86E-10 |
| PA4239 | rpsD | 30S ribosomal protein S4 | 2.47 | 1.58E-08 |
| PA3743 | trmD | tRNA (guanine-N1)-methyltransferase | 2.26 | 1.19E-08 |
| PA4480 | mreC | rod shape-determining protein MreC | 2.22 | 4.06E-22 |
| PA4933 | - | hypothetical protein | 2.17 | 1.86E-05 |
| PA0549 | - | hypothetical protein | 2.15 | 0.0017 |
| PA4268 | rpsL | 30S ribosomal protein S12 | 2.12 | 4.32E-09 |
| PA3929 | cioB | cyanide insensitive terminal oxidase | 1.85 | 0.0003 |
| PA3654 | pyrH | uridylate kinase | 1.81 | 0.0002 |
| PA4004 | - | conserved hypothetical protein | 1.72 | 0.0028 |
| PA4226 | pchE | dihydroaeruginoic acid synthetase | 1.71 | 0.0017 |
| PA4223 | pchH | probable ATP-binding component of ABC transporter | 1.65 | 0.0022 |
| PA4672 | pth | peptidyl-tRNA hydrolase | 1.62 | 5.52E-14 |
| PA4853 | fis | DNA-binding protein Fis | 1.60 | 0.0016 |
| PA2970 | rpmF | 50S ribosomal protein L32 | 1.54 | 3.67E-11 |
| PA4854 | purH | phosphoribosylaminoimidazolecarboxamide formyltransferase | 1.54 | 2.52E-07 |
| PA5569 | rnpA | ribonuclease P protein component | 1.53 | 8.64E-10 |
| PA5555 | atpG | ATP synthase gamma chain | 1.48 | 0.0023 |
| PA5315 | rpmG | 50S ribosomal protein L33 | 1.48 | 8.82E-12 |
| PA4932 | rplI | 50S ribosomal protein L9 | 1.48 | 1.22E-06 |
| PA4744 | infB | translation initiation factor IF-2 | 1.45 | 0.0020 |
| PA0904 | lysC | aspartate kinase alpha and beta chain | 1.42 | 8.08E-05 |
| PA4263 | rplC | 50S ribosomal protein L3 | 1.30 | 0.0004 |
| PA4742 | truB | tRNA pseudouridine 55 synthase | 1.27 | 0.0006 |
| Locus Tag | Gene symbol | Gene name | Combined effect size | Padj value |
| PA3234 | yjcG | sodium:solute symporter | -3.04 | 2.34E-06 |
| PA0132 | bauA | Beta-alanine:pyruvate transaminase | -2.95 | 9.56E-11 |
| PA4931 | dnaB | replicative DNA helicase | -2.42 | 0.0005 |
| PA0459 | clpC | ClpA/B protease ATP binding subunit | -2.40 | 0.0013 |
| PA2413 | pvdH | L-2,4-diaminobutyrate:2-ketoglutarate 4-aminotransferase, PvdH | -2.22 | 1.40E-05 |
| PA3568 | ymmS | acetyl-coa synthetase | -2.07 | 4.76E-05 |
| PA0509 | nirN | Dihydro-Heme d1 Dehydrogenase | -2.06 | 2.42E-07 |
| PA5473 | - | conserved hypothetical protein | -2.01 | 5.86E-08 |
| PA2586 | gacA | response regulator GacA | -1.97 | 0.0001 |
| PA5153 | - | amino acid (lysine/arginine/ornithine/histidine/octopine) ABC transporter periplasmic binding protein | -1.95 | 0.0177 |
| PA3091 | - | hypothetical protein | -1.86 | 2.54E-05 |
| PA0747 | pauC | aldehyde dehydrogenase | -1.84 | 1.91E-10 |
| PA0301 | spuE | polyamine transport protein | -1.84 | 0.00014 |
| PA5139 | - | hypothetical protein | -1.81 | 0.0070 |
| PA1716 | pscC | Type III secretion outer membrane protein PscC precursor | -1.81 | 0.0001 |
| PA1296 | - | 2-hydroxyacid dehydrogenase | -1.75 | 0.0006 |
| PA2146 | - | conserved hypothetical protein | -1.74 | 0.0007 |
| PA0044 | exoT | exoenzyme T | -1.74 | 0.0001 |
| PA4571 | - | cytochrome c | -1.73 | 1.81E-05 |
| PA2938 | - | transporter | -1.73 | 4.82E-06 |
| PA5170 | arcD | arginine/ornithine antiporter | -1.71 | 0.0104 |
| PA2386 | pvdA | L-ornithine N5-oxygenase | -1.71 | 1.45E-06 |
| PA3535 | eprS | serine protease | -1.70 | 6.74E-12 |
| PA0512 | nirH | siroheme decarboxylase subunit | -1.66 | 2.30E-07 |
| PA1940 | - | hypothetical protein | -1.61 | 4.33E-09 |
Disclaimer/Publisher’s Note: The statements, opinions and data contained in all publications are solely those of the individual author(s) and contributor(s) and not of MDPI and/or the editor(s). MDPI and/or the editor(s) disclaim responsibility for any injury to people or property resulting from any ideas, methods, instructions or products referred to in the content. |
© 2024 by the authors. Licensee MDPI, Basel, Switzerland. This article is an open access article distributed under the terms and conditions of the Creative Commons Attribution (CC BY) license (http://creativecommons.org/licenses/by/4.0/).


