Preprint
Article

Customized Weighted Ensemble Based on Modified Transfer Learning Model for Detection of Sugarcane Leaf Diseases

Altmetrics

Downloads

71

Views

34

Comments

0

A peer-reviewed article of this preprint also exists.

This version is not peer-reviewed

Submitted:

14 October 2024

Posted:

15 October 2024

You are already at the latest version

Alerts
Abstract
Sugarcane is the primary crop in the global sugar industry, yet it remains highly susceptible to a wide range of diseases that significantly impact its yield and quality. An effective solution is required to solve the issues given by manual identification of plant diseases, which is time-consuming and wasteful, as well as low detection accuracy. This paper proposes the development of a robust deep ensemble convolutional neural network (DECNN) model for the accurate detection of sugarcane leaf diseases. Initially, several transfer learning (TL) models, including EfficientNetB0, MobileNetV2, DenseNet121, NASNetMobile, and EfficientNetV2B0, were enhanced through the addition of specific layers. A comparative study was then conducted on the improved dataset. The application of data augmentation, along with the addition of dense layers, batchnormalization layers, and dropout layers, led to improved detection accuracy, precision, recall, and F1 score for each model. Among the five enhanced transfer learning models, the modified EfficientNetB0 model demonstrated the highest detection accuracy, ranging from 97.08% to 98.54%. In conclusion, the DECNN model was developed by integrating the modified EfficientNetB0, MobileNetV2, and DenseNet121 models using a distinctive performance-based custom weighted ensemble method, with weight optimization carried out using the Tree-structured Parzen Estimator (TPE) technique. This resulted in a model that achieved a detection accuracy of 99.17%, outperforming the individual performances of the modified EfficientNetB0, MobileNetV2, and DenseNet121 models in detecting sugarcane leaf diseases.
Keywords: 
Subject: Computer Science and Mathematics  -   Artificial Intelligence and Machine Learning

1. Introduction

Sugarcane (Saccharum spp.) is a perennial graminaceous plant belonging to the C4 class, known for its ability to accumulate substantial quantities of sucrose in specialized parenchyma storage cells [1]. As one of the most economically significant crops worldwide, sugarcane contributes approximately 80% of global sugar production, with an estimated annual market value of around US $150 billion [2]. Besides sucrose, other by-products of sugarcane are bagasse, molasses, fiberboard, and different components that are utilized in the manufacturing of butanol, ethanol, and citric acid [3]. China, Thailand, Brazil, and India are the top producers of sugarcane [4]. When the average incidence of sugarcane disease reaches 51.4%, sugarcane stem yield declines by 24.9%, and sugar content decreases by 0.56%. If not detected and treated early, sugarcane diseases can lead to severe economic losses, particularly for smallholder farmers [5].
These diseases often become discernible to the unaided eye only after the plant has already sustained significant damage. Therefore, it is crucial to develop technological advancements that enable early detection, assisting both farmers and agricultural experts in mitigating the impact of these diseases. In response to this challenge, several innovative technological approaches have been introduced. Traditional methods for plant disease detection involve the use of chemical agents and plant maceration, but these processes require expert evaluation in specialized laboratories, making them time-consuming and resource-intensive. Non-invasive methods for tracking and identifying plant diseases have been developed in order to get around these restrictions, including computer-aided detection, remote sensing, spectral imaging, and image processing [6,7]. A variety of techniques have been used, including digital cameras, satellites, and unmanned aerial vehicles (UAVs), to obtain pictures of plant leaf diseases. However, satellite data often lacks the resolution and detail necessary for analyzing individual plants, and the cost of acquiring satellite data is substantial. UAVs, while offering more flexibility, are limited by weather conditions, flight direction constraints, and the risk of crashes, which can degrade image quality. This field has made good use of image processing techniques, which include picture acquisition, pre-processing, segmentation, feature extraction, and classification. Nevertheless, the experimental setups required for optical sensors and spectral imaging are costly, posing challenges for farmers [8,9].
As computational power continues to increase, advanced deep learning (DL) techniques are increasingly employed to enhance the performance of predictive models. Nevertheless, a significant amount of data is needed to train convolutional neural networks (CNNs), and this kind of data is frequently lacking in agricultural research, especially when it comes to the investigation of illnesses that affect sugarcane leaves. A potential solution to this data scarcity is the combination of transfer learning (TL) and data augmentation. Data augmentation techniques help mitigate overfitting during the training phase of deep neural networks [10]. As noted by [11], the main benefits of transfer learning include decreased training times, enhanced neural network functionality, and data consumption. Numerous studies have explored the use of CNNs, CNN-based deep learning techniques, and TL methods. However, the application of ensembles of modified TL models in this field remains relatively unexplored. The ensemble of such models has the potential to significantly improve the performance of crop disease identification systems. This serves as the motivation for this paper, which applies a weighted ensemble technique to various modified transfer learning models.
The main contributions of this paper are as follows:
  • This study aims to enhance transfer learning (TL) models to improve the detection of sugarcane leaf diseases. To achieve this, the TL models have been augmented with the incorporation of dense layers for regularization, batchnormalization layers, and dropout layers to prevent overfitting.
  • A public dataset of sugarcane leaf diseases was used to compare five enhanced transfer learning (TL) models. The results showed a considerable improvement in each model’s test accuracy.
  • A novel deep ensemble convolutional neural network (DECNN) model for the detection of sugarcane leaf diseases is proposed, utilizing a distinctive performance-based custom weighted ensemble method. The model achieves an accuracy of 99.17%, outperforming individual models in detection accuracy.
This is how the rest of the paper is structured. Section 2 gives a summary of the relevant literature. The proposed methodology and dataset are described in Section 3. The conclusions and debates are included in Section 4 and Section 5. A consideration of future views wraps out Section 6.

2. Related Work

In agricultural research, artificial intelligence (AI) is a fast developing field within the larger framework of the Fourth Industrial Revolution. It is frequently used in many different applications, such as yield prediction, pest detection, and disease categorization. In previous years, image classification was primarily conducted using traditional machine learning methods. In machine learning, the Support Vector Machine (SVM) is a traditional binary classification model. An SVM classifier was proposed by Yigit et al. [12] for the binary classification of healthy and damaged sugarcane leaves on a plain background. Through examination of the photos’ color and texture characteristics, the researchers were able to obtain 92.91% accuracy. Additionally, algorithms such as Random Forest (RF) [13], Back Propagation Neural Network (BPNN) [14], and K Nearest Neighbors (KNN) [15] have been extensively utilized for leaf disease classification in various crops.
The application of machine learning in image classification is becoming less prevalent with the rise of artificial neural networks (ANNs) and convolutional neural networks (CNNs), as deep learning has become the dominant approach in this area. With an astounding accuracy of 95.48%, Wu et al. [16] developed a fine-grained disease classification approach based on a CNN to predict and categorize over 20,000 peach and tomato leaf illnesses taken from the Plant Village website. Similarly, Patil et al. [17] introduced "Rice-Fusion," a novel multimodal data fusion framework combining a CNN and a multilayer perceptron (MLP) to diagnose rice diseases. The model was trained and tested on 3,200 manually collected rice samples from four categories, ultimately demonstrating robust performance with a test accuracy of 95.31%. One enduring obstacle in agricultural research is the dearth of extensive databases. This problem has a hopeful remedy in transfer learning. Elfatimi et al. [18] identified the optimal configuration of MobileNetV2 for bean leaf disease classification using parameter tuning and transfer learning techniques. The model was trained on a public dataset of 1,296 bean leaf images across three categories, achieving an average classification accuracy exceeding 92%. In another study by Rahaman Yead et al. [19], five well-known deep learning architectures, including ResNet-50, VGG-16, DenseNet-201, VGG-19, and Inception V3, were utilized to build a dataset of 2,511 images across five sugarcane leaf disease categories. After applying transfer learning and parameter tuning, the ResNet-50 model demonstrated the highest accuracy at 95.69%.In Reference [20], the authors compared state-of-the-art deep learning benchmark models to create a new hybrid model combining EfficientNetB0, a custom-designed neural network, and CSPDarknet53. This hybrid model was tailored to capture the distinctive characteristics of sugarcane diseases, achieving an accuracy of 96.80% on a dataset of 2,522 sugarcane leaf disease images across five categories from Mendeley.The integration of ANNs and feature selection has been a focus for many researchers. Pham et al. [21] developed an ANN-based hybrid meta-heuristic approach for feature selection to detect early-stage diseases in mango leaves. The ANN was trained on a manually collected dataset of 450 mango leaf images from four categories (three diseased and one healthy), achieving superior results (89.41%) compared to prevalent CNN models such as AlexNet, VGG16, and ResNet-50 (78.64%, 79.92%, and 84.88%, respectively). Another method for improving deep learning precision is the incorporation of attention mechanisms. A hybrid SE-ViT model was suggested by Sun et al. [22], which achieved a 97.26% accuracy rate on the PlantVillage dataset for the diagnosis of sugarcane leaf diseases. On a private dataset named SLD, comprising five categories (healthy, red-stripe, ring-spot, brown-stripe, and bacterial diseases), SE-ViT outperformed four classical neural network models, with an accuracy of 89.57%. Ensemble learning is a widely used approach for enhancing model accuracy. A real-time dataset of five sugarcane leaf types—red rot, foliar, yellow leaf, healthy, and rust—was created by Daphal et al. [23]. They conducted a comparative study using transfer learning and ensemble methods to classify the dataset for sugarcane leaf diseases. An accuracy of 86.53% was attained by the ensemble model, which was composed of a sequential CNN and a deep CNN with spatial attention. Table 1 offers a thorough summary of the most recent state-of-the-art research findings in the field of plant leaf disease identification, emphasizing different architectural strategies in particular.
A review of the literature reveals five key machine learning approaches that have been employed for the classification of sugarcane leaf diseases. Initially, traditional machine learning methods were used, but their performance limitations led to the rise in popularity of convolutional neural network (CNN) models. Subsequently, hybrid models combining CNN and multilayer perceptron (MLP) were developed. The third phase involved the implementation of CNN models that incorporated transfer learning. Finally, Daphal et al. [23] successfully classified sugarcane leaf disease using an average ensemble of transfer learning models in a recent study, however their accuracy was only 86.53%.

3. Materials and Methods

In this paper, we propose an ensemble model (DECNN) consisting of three modified transfer learning (TL) models for the high-precision classification of sugarcane leaf diseases. The tests were carried out with an openly accessible dataset; the experimental setup and technique are explained in detail in the next section.

3.1. Dataset

The validity of results from data science research is strongly reliant on the availability of correct and trustworthy data. The more precise and relevant the data in a model’s dataset, the more accurate and useful the model becomes. In this study, a dataset related to sugarcane leaf diseases was obtained from Kaggle [24,25]. The dataset comprises six categories (illustrated in Figure 1), including healthy, foliar, red rot, rust, yellow leaf, and bacterial wilt, with a total of 2,646 images across all categories. To ensure the dataset was both representative and diverse, the images were captured using various smartphones. The number of images per category varied significantly, as did their size and dimensions.

3.2. Data Augmentation and Pre-Processing

An existing dataset can be enhanced with new data points using a variety of methods known as data augmentation, which essentially increases the amount of data that is available artificially. Conventional data augmentation methods help mitigate the issue of overfitting, facilitating smoother classifier training [26]. In the present study, the sugarcane leaf disease dataset was augmented exclusively through the use of the ImageDataGenerator module, a component of Python software [27]. The number of samples in each category was increased to achieve a more balanced dataset. Table 2 outlines the specific augmentation techniques applied. As shown in Table 3, the augmented dataset now comprises 4,800 images, with approximately 800 images per category.Accurate data preprocessing forms the basis of precise data analysis [28]. Using the image processing capabilities of the OpenCV and Pandas libraries, all of the photos in the expanded sugarcane leaf disease dataset were shrunk to 224 x 224 pixels in order to decrease computing costs and fulfill the input criteria of the network model utilized in this study. After then, the dataset was divided in an 80-10-10 ratio into training, validation, and test sets.

3.3. Proposed DECNN Model

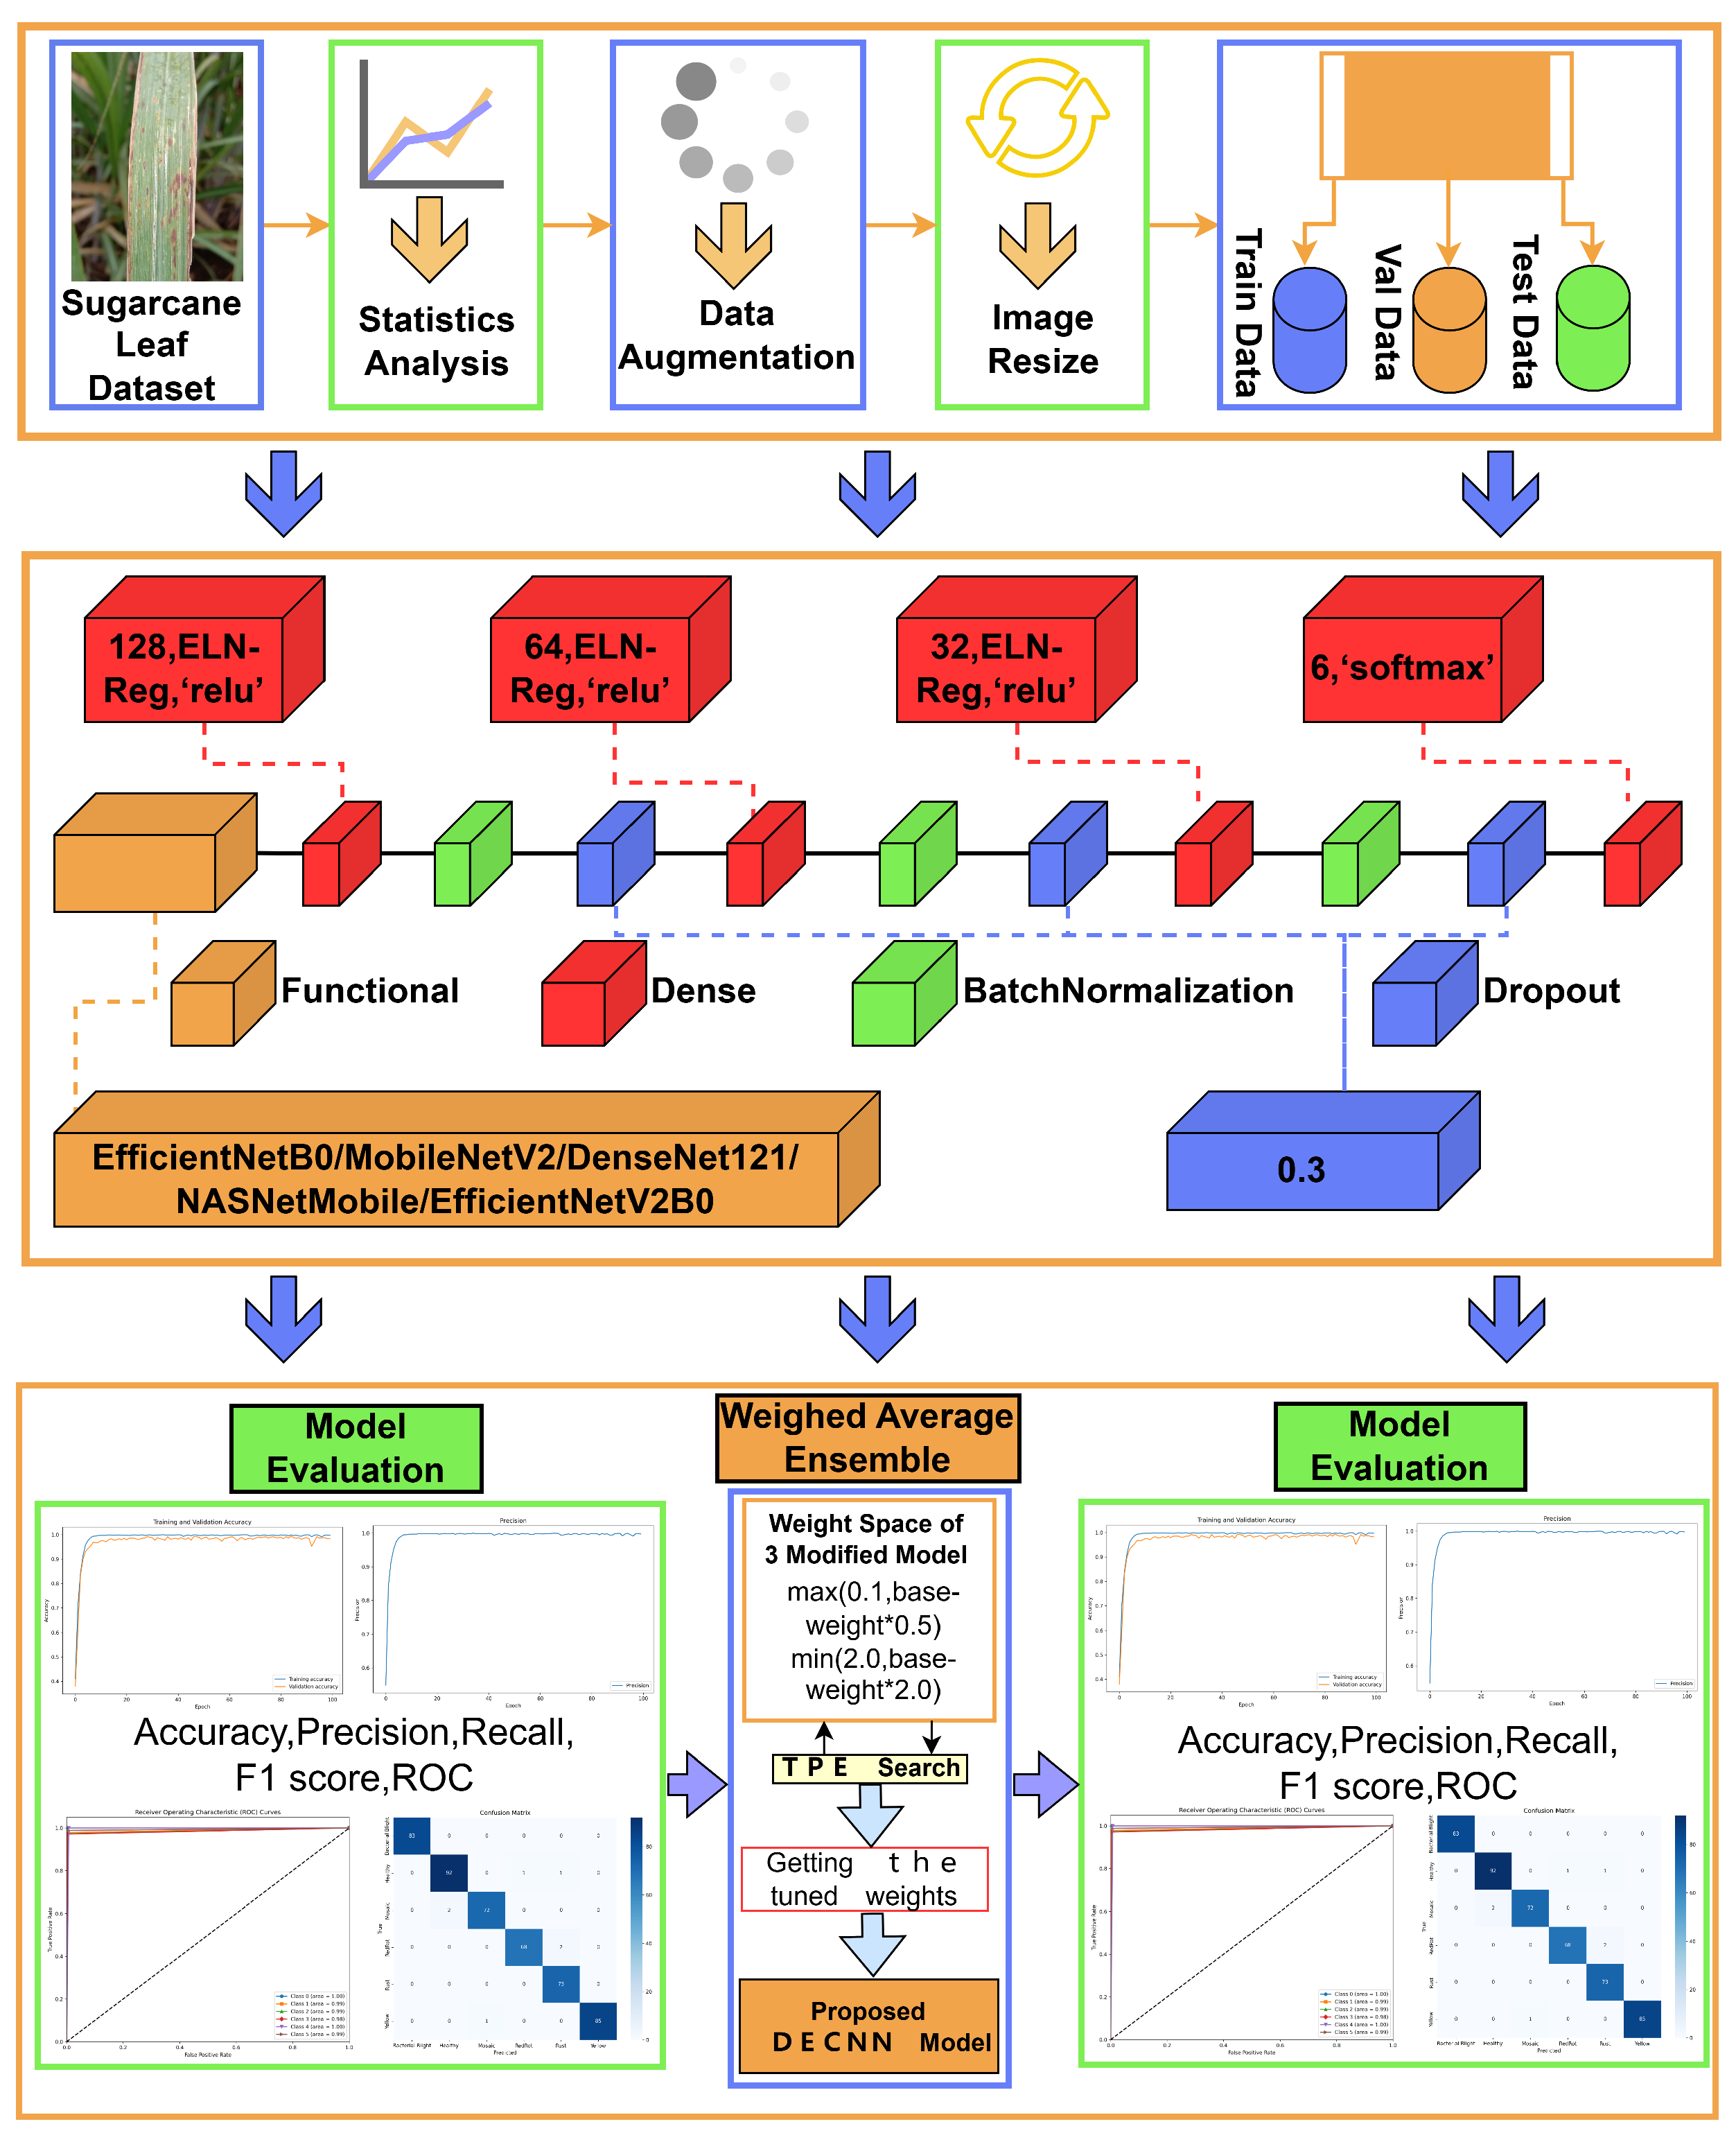
Figure 2 illustrates the customized weighted ensemble of the enhanced transfer learning (TL) model proposed in this study for the detection of sugarcane leaf diseases. Initially, the dataset of sugarcane leaf diseases was obtained from Kaggle, as described earlier. The OpenCV and Pandas libraries were utilized to perform a comprehensive statistical analysis of the dataset. After that, the dataset was increased, as explained in Section 3.2, and every image was adjusted to have a uniform size of 224 by 224 pixels. After that, the dataset was split up into three subsets: testing, validation, and training. Subsequently, five TL models were enhanced by incorporating dense layers with ELN-Reg regularization, batchnormalization layers, and dropout layers, respectively. These models were trained using the RMSprop optimizer and the categorical cross-entropy loss function. Finally, the three most effective modified TL models were combined using a uniquely customized weighted ensemble method to form the DECNN model.

3.3.1. ELN-Reg Regularization

ELN-Reg regularization is a novel technique introduced in this paper that integrates the principles of Elastic Net [29] and DL-Reg regularization [30]. The primary objective of this approach is to enhance the model’s generalization capabilities, particularly in high-dimensional datasets. This method incorporates L1 and L2 penalty terms into the loss function, effectively balancing the advantages of feature selection with model stability. Furthermore, by defining the linear mapping error from input to output as a linear constraint, ELN-Reg improves the model’s linearity to a certain extent. This technique not only facilitates feature selection but also mitigates overfitting, thereby enhancing the predictive performance of the model in complex, high-dimensional environments. ELN-Reg regularization can be expressed mathematically as shown in Equation (1).
R ( x ) = α ρ · x 1 + 1 ρ 2 · x 2 2 + γ · MSE ( x , x ^ )
In this context, R ( x ) represents the total regularization term applied to the parameter x. The value of α determines the strength of the L1 and L2 regularization terms. The term ρ represents the relative weight of the L1 regularization term and the L2 regularization term. The variable x 1 can be understood as the L1 paradigm, which is defined as the sum of the absolute values of the elements of x. Similarly, the variable x 2 2 represents the square of the L2 paradigm. The sum of the squares of the elements of x. The parameter γ controls the strength of the DL-Reg regularization term. MSE ( x , x ^ ) is the mean square error between the input x and its estimate x ^ .
The regularization coefficients α , ρ , and γ are pivotal parameters in ELN-Reg, influencing the efficacy of the network. An increase in the regularization coefficients α , ρ , and γ results in a reduction in the learning capacity of the network. Conversely, as the regularization/generalization coefficients approach zero, the impact of these processes on the learning process is reduced [30]. It is therefore essential to select an appropriate value for α , ρ , and γ in order to achieve optimal performance. This allows the model to benefit from the feature selection power of L1 regularization, the ability of L2 regularization to enhance model stability, and the capacity of DL-Reg regularization to enforce linearity to enhance generalization. In this paper, we employ the hyperparameter tuning tool Optuna [31] to efficiently search for optimal parameter values within a given search space. This paper presents a comparative analysis of ELN-Reg regularization with other common regularization methods and without regularization on a data-augmented sugarcane leaf disease dataset using the EfficientNetB0 base model. Table 4 illustrates the outcomes, demonstrating that ELN-Reg exhibits superior performance on the sugarcane leaf disease dataset. Furthermore, the combination of ELN-Reg and Dropout attained a final test accuracy of 98.54%. Accordingly, the combination of ELN-Reg and Dropout was selected as the regularization method for the present experiment.

3.3.2. Modified Transfer Learning Models

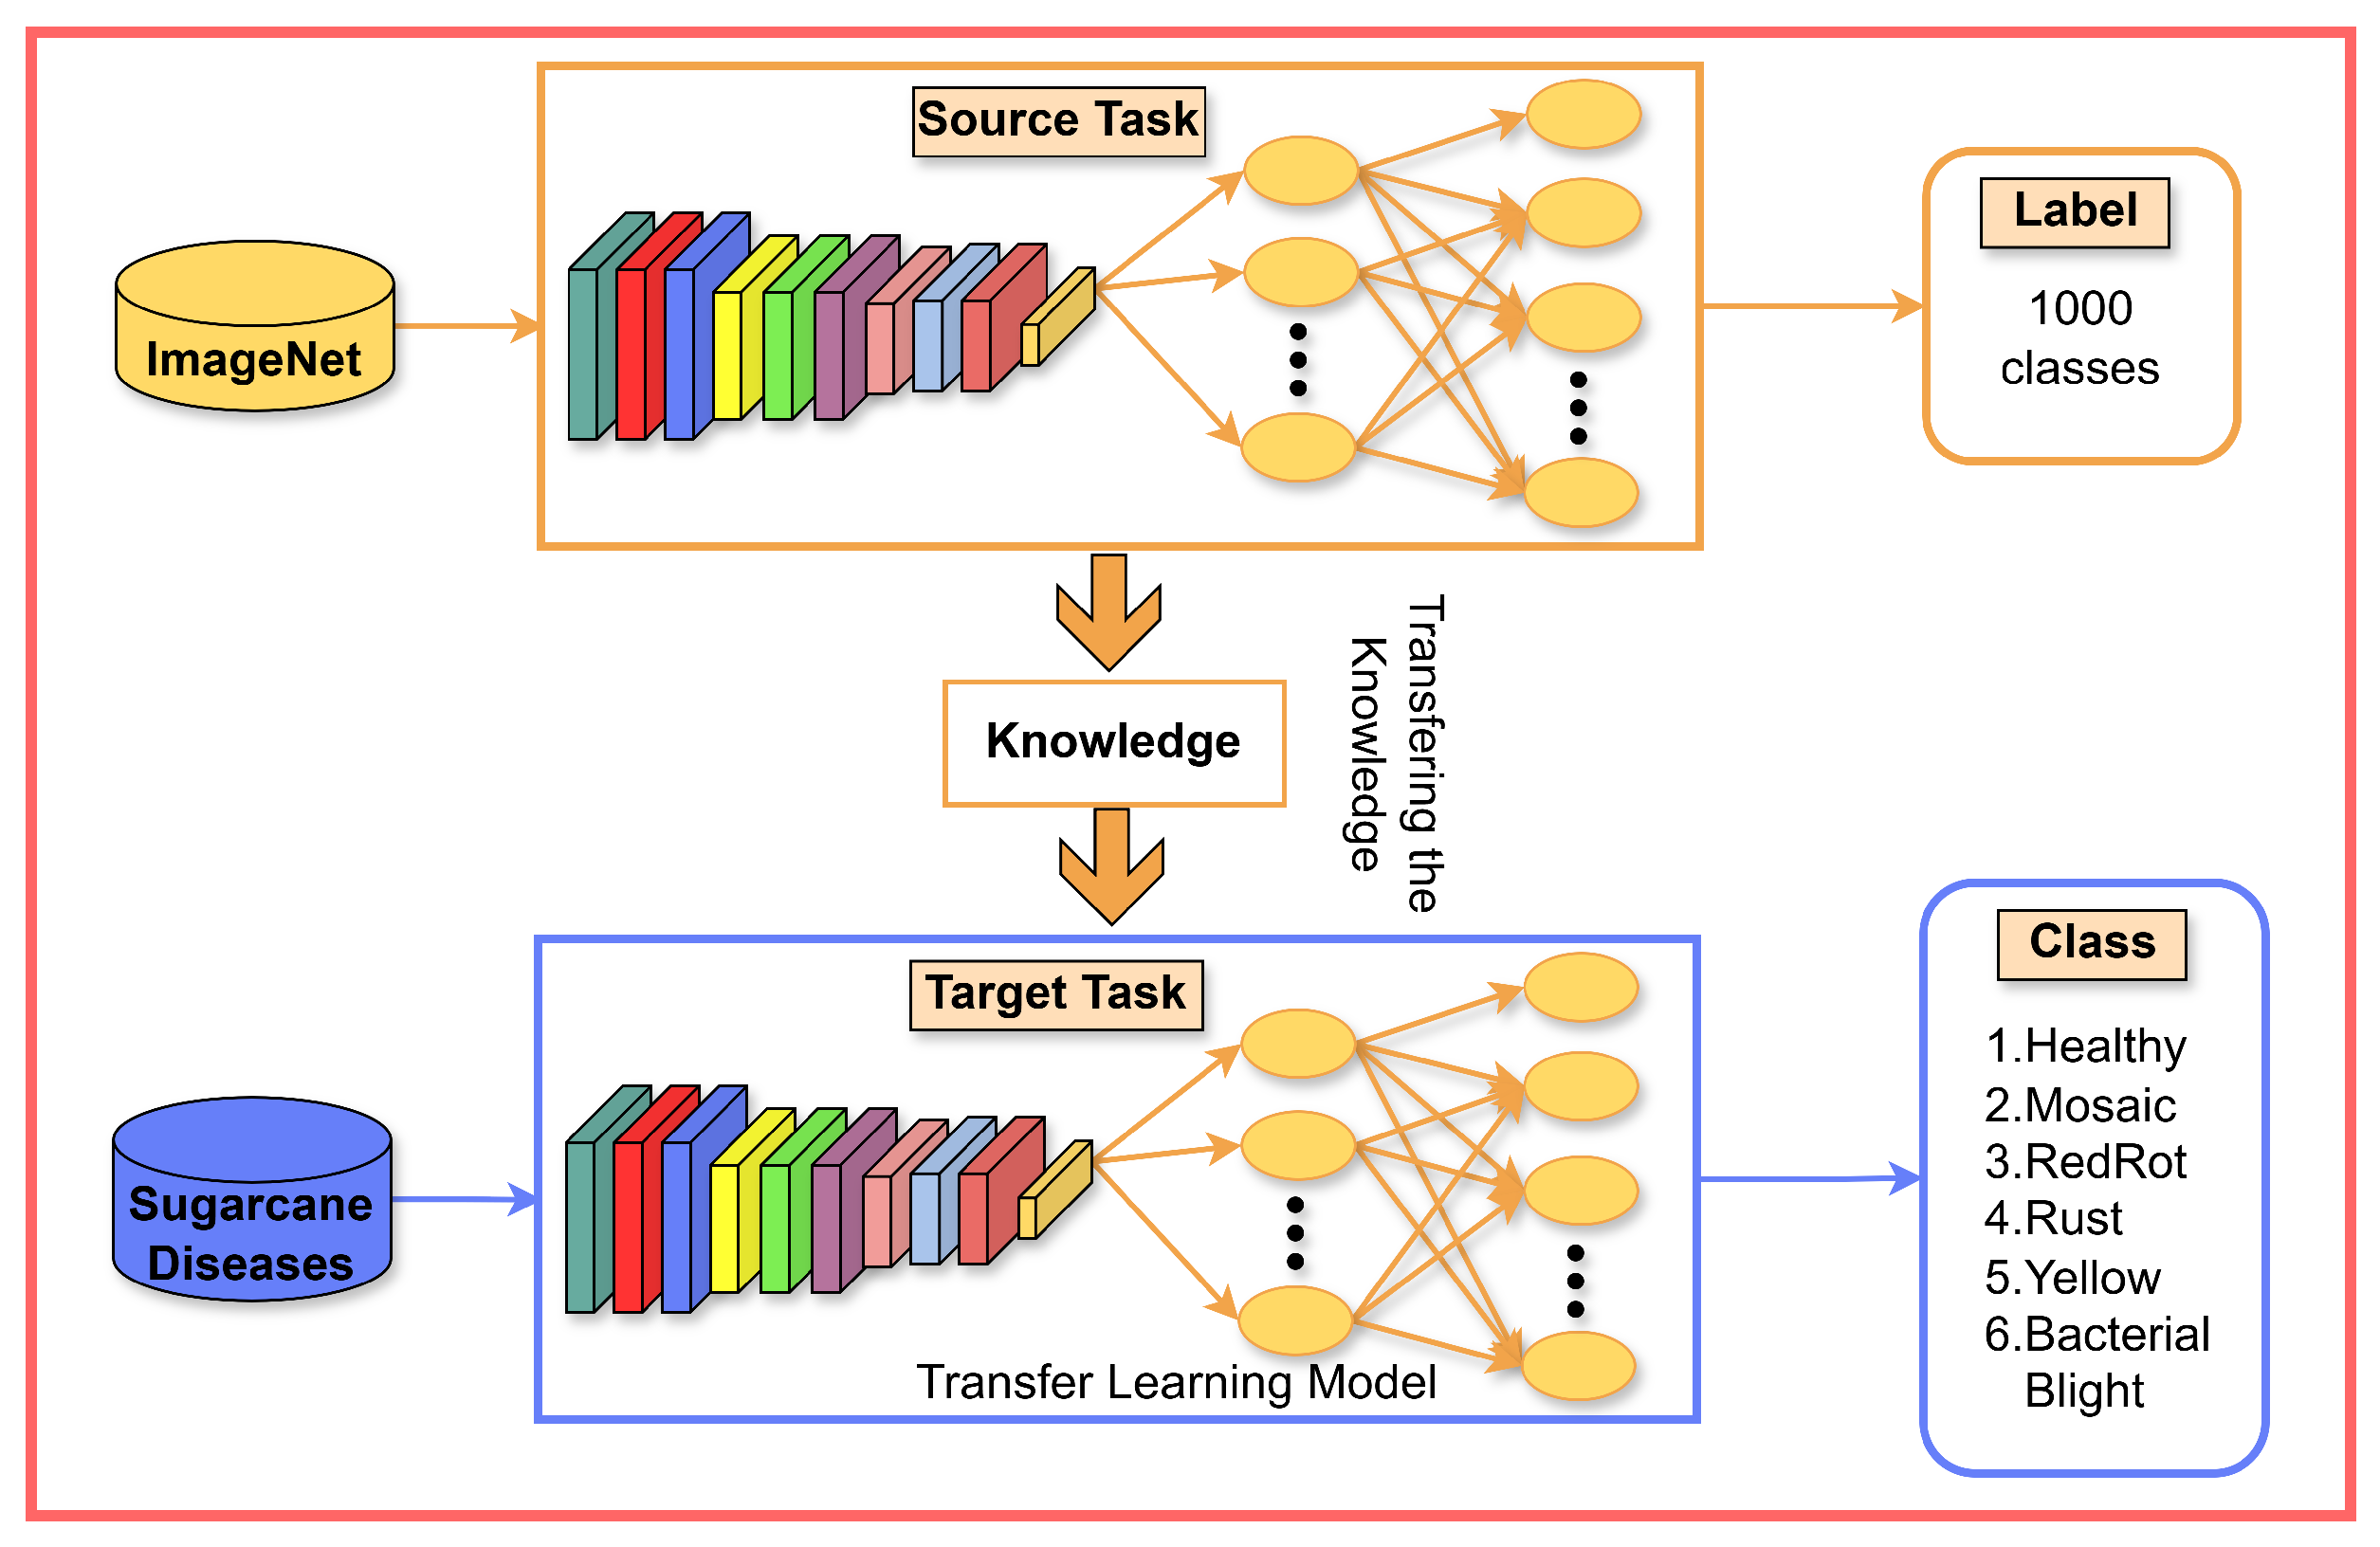
Transfer learning refers to the technique of modifying or reusing a model that has been trained for one task to be used for a similar task (see Figure 3). The objective of transfer learning is to improve the efficiency of target learners by leveraging knowledge from related source domains. It is a commonly used methodology for developing machine learning models without requiring large datasets [32]. The key advantages of transfer learning include reduced training time, improved neural network performance, and the need for only a modest amount of data [33,34,35].
As illustrated in the second section of Figure 2, this research enhances five state-of-the-art transfer learning (TL) models: EfficientNetB0, MobileNetV2, DenseNet121, NASNetMobile, and EfficientNetV2B0 [36,37,38,39,40]. These models were imported directly from the Keras library (Keras applications). Table 5 lists the TL models employed for further enhancement.
Three dropout layers, three batchnormalization layers, and four dense layers were used in place of the classification layers in each of the five models shown in Table 5. After ELN-Reg regularization, the first three dense layers were applied. Additionally, these layers utilized the Rectified Linear Unit (ReLU) activation function to enhance nonlinearity and facilitate feature extraction. The models were trained over 50 epochs, with early stopping techniques applied to obtain optimal weights. To mitigate overfitting, a dropout rate of 0.3 was used. All models were tested and validated using a fixed seed of 42, with a learning rate of 0.0001, RMSprop optimizer, categorical cross-entropy loss function, and a batch size of 32. An exhaustive list of all the layers and learning parameters in the modified EfficientNetB0 model can be found in Table 6.

3.3.3. Ensemble Modified TL Model

It is commonly acknowledged that ensemble learning techniques are a novel way to address many machine learning problems. Individual model predictive performance can be greatly enhanced by ensemble approaches [41] by training numerous models and aggregating their predictions. Two primary strategies are typically employed in the design of ensemble algorithms: the average ensemble and the weighted ensemble [42]. The average ensemble assumes that all models contribute equally and have similar accuracy, while the weighted ensemble acknowledges that some models may outperform others, allowing those with superior performance to have greater influence in the final prediction. In this study, a weighted ensemble was constructed using the modified, high-performing EfficientNetB0, MobileNetV2, and DenseNet121 models.
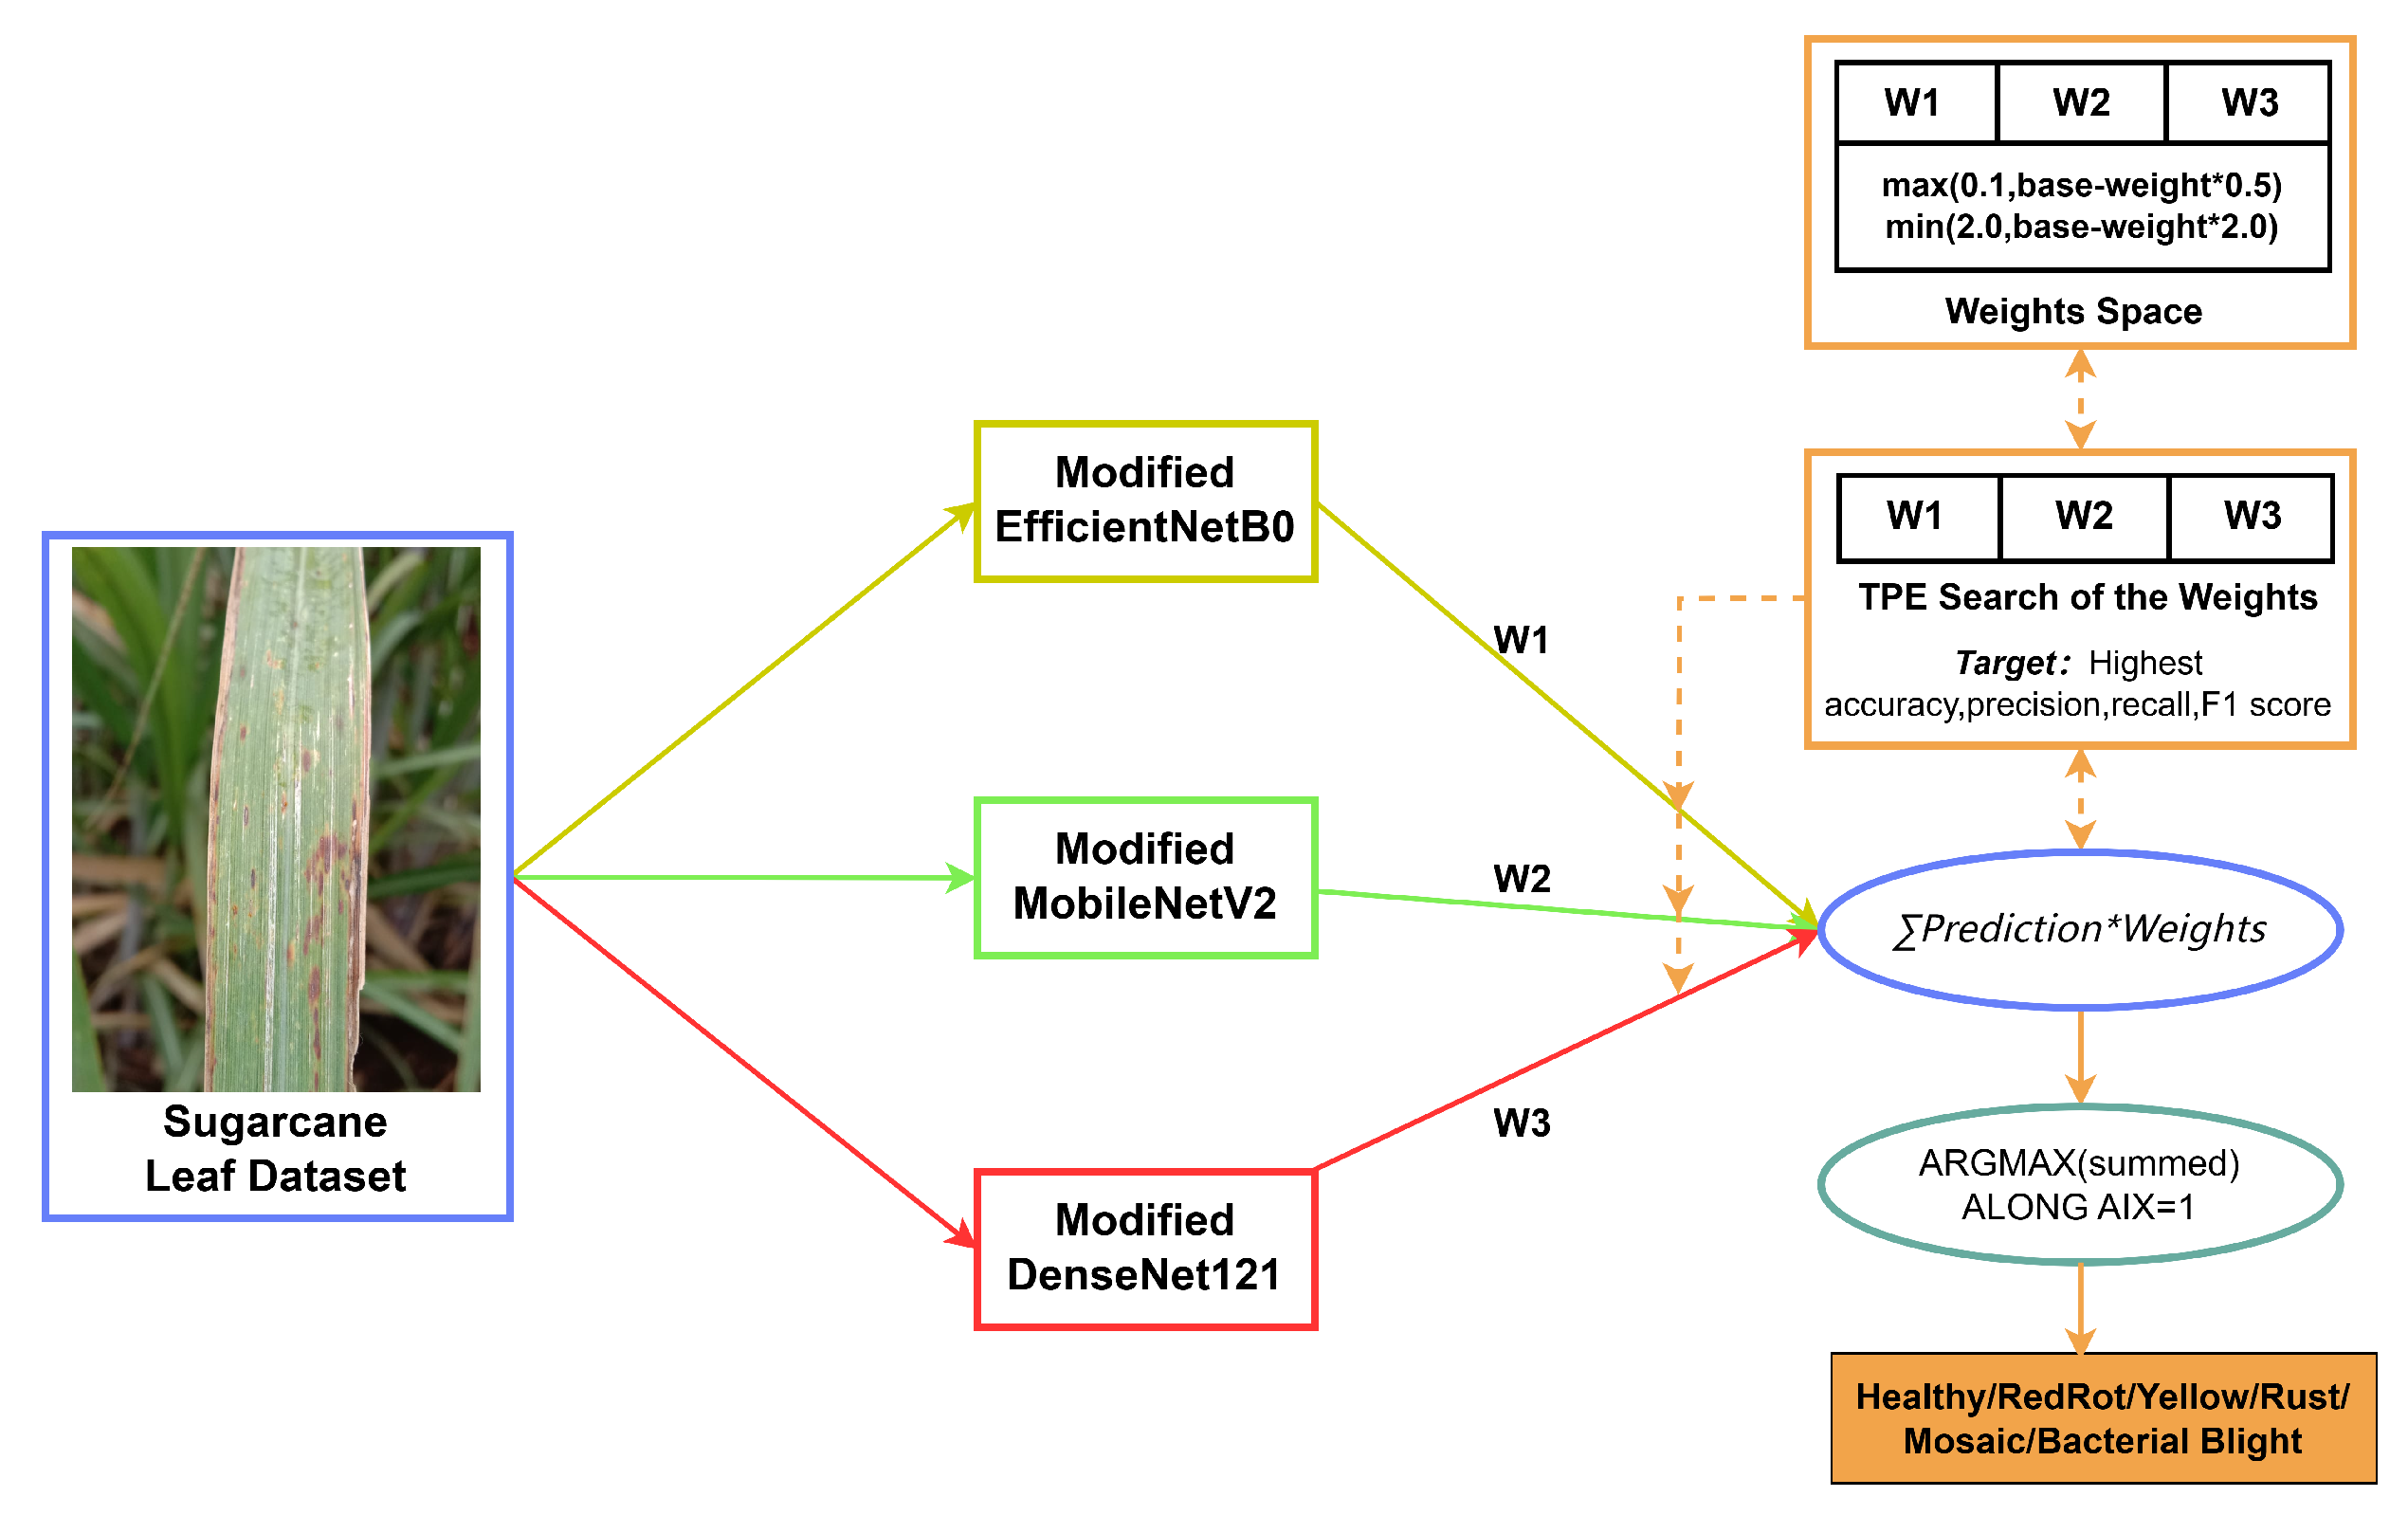
In this paper, a customized weight search space is developed for each model based on its performance on the validation set (see Figure 4). The initial base weights and the corresponding weight search space are determined using the formulas presented in Equations (2) and (3).
b w i = P i j = 1 N P j
W S i = max ( 0.1 , b w i × 0.5 ) , min ( 2.0 , b w i × 2.0 )
In this context, the term b w i represents the base weight of the ith model, i denotes the performance metric of the ith model, N signifies the total number of models, and W S i stands for the weighted search space of the ith model. Algorithm 1 presents the algorithm for learning a weighted ensemble.
Algorithm 1: Weighted ensemble
Input: Test_set T, Models M k and Weight_set W k   ( k = 1 to n ) where k is the number of models
Output: F o
Ensemble_model E = [ M 1 , M 2 , , M k ]
For  i = 1 to k  do
      Predict, P = generate ( T )
       S = add ( P W i , along y axis )
       F o = index _ max ( S , along x axis )
Confusion_matrix ( F o , T )
Classification_matrices ( F o , T )
End
In this paper, the ensemble of models to be ensembled, designated as E, is composed of the Modified EfficientNetB0, MobileNetV2, and DenseNet121, with optimal weights W i , where i = 1, 2, 3, obtained in the search space through the application of the TPE [43] algorithm.

3.4. Model Performance Metrics

Model evaluation is a critical phase in the machine learning pipeline, serving to determine the model’s ability to generalize to unseen data. As mentioned below, a confusion matrix, a receiver operating characteristic (ROC) curve, and a number of performance measures are used in this work to assess the suggested model. These metrics include accuracy, precision, recall, and F1 score.
  • Accuracy: the evaluation of a model heavily depends on the parameter of accuracy. The formula computes this ratio, which is the proportion of accurately anticipated data to all data:
    Accuracy = T P + T N T P + T N + F P + F N × 100 %
  • Precision: the proportion of correct predictions among the samples with positive predictions, as judged by the prediction results, calculated by the formula:
    Precision = T P T P + F P × 100 %
  • Recall: the proportion of correctly predicted positive cases out of the total number of actual positive cases in the sample of actual positive cases, based on the judgment of the actual samples, which is calculated by the formula:
    Recall = T P T P + F N × 100 %
The terms TP, TN, FP, and FN stand for true positive, true negative, and false negative, respectively.
  • F1 score: precision and recall are averaged together to get the F1 score. When comparing several models, it is computed as follows:
    F 1 score = 2 × Precision × Recall Precision + Recall × 100 %
  • Macro average: the arithmetic mean of every category linked to F1 score, precision, and recall is known as the macro average. It is determined by the following formula and is used to assess the multi-class classification’s overall effectiveness:
    Macro Avg Measure = 1 N i = 1 N Measure in class i
  • Weighted average: a multi-category classification’s overall effectiveness can also be assessed using the weighted average. Using the following formula, it is determined as a weighted average for every category:
    Weighted Avg Measure = i = 1 N ( Measure × weight ) in class i Total number of samples

4. Results

The modified transfer learning (TL) models and the proposed DECNN model were trained and validated on Google Colaboratory using Google Compute Engine with an NVIDIA Tesla T4 GPU, which provides 16GB of GDDR6 memory. TensorFlow-Keras version 2.0 served as the deep learning framework for this study. Hyperparameter selection details and other relevant configuration information are available in Section 3.3.2. Table 7 summarizes the accuracy of the modified TL models on the augmented sugarcane leaf disease dataset, indicating the extent of modifications applied. Additionally, Table 8 presents key evaluation metrics, including precision, recall, F1 scores, along with macro and weighted means for each model, assessed on the test set.

4.1. Results of Modified Transfer Learning models

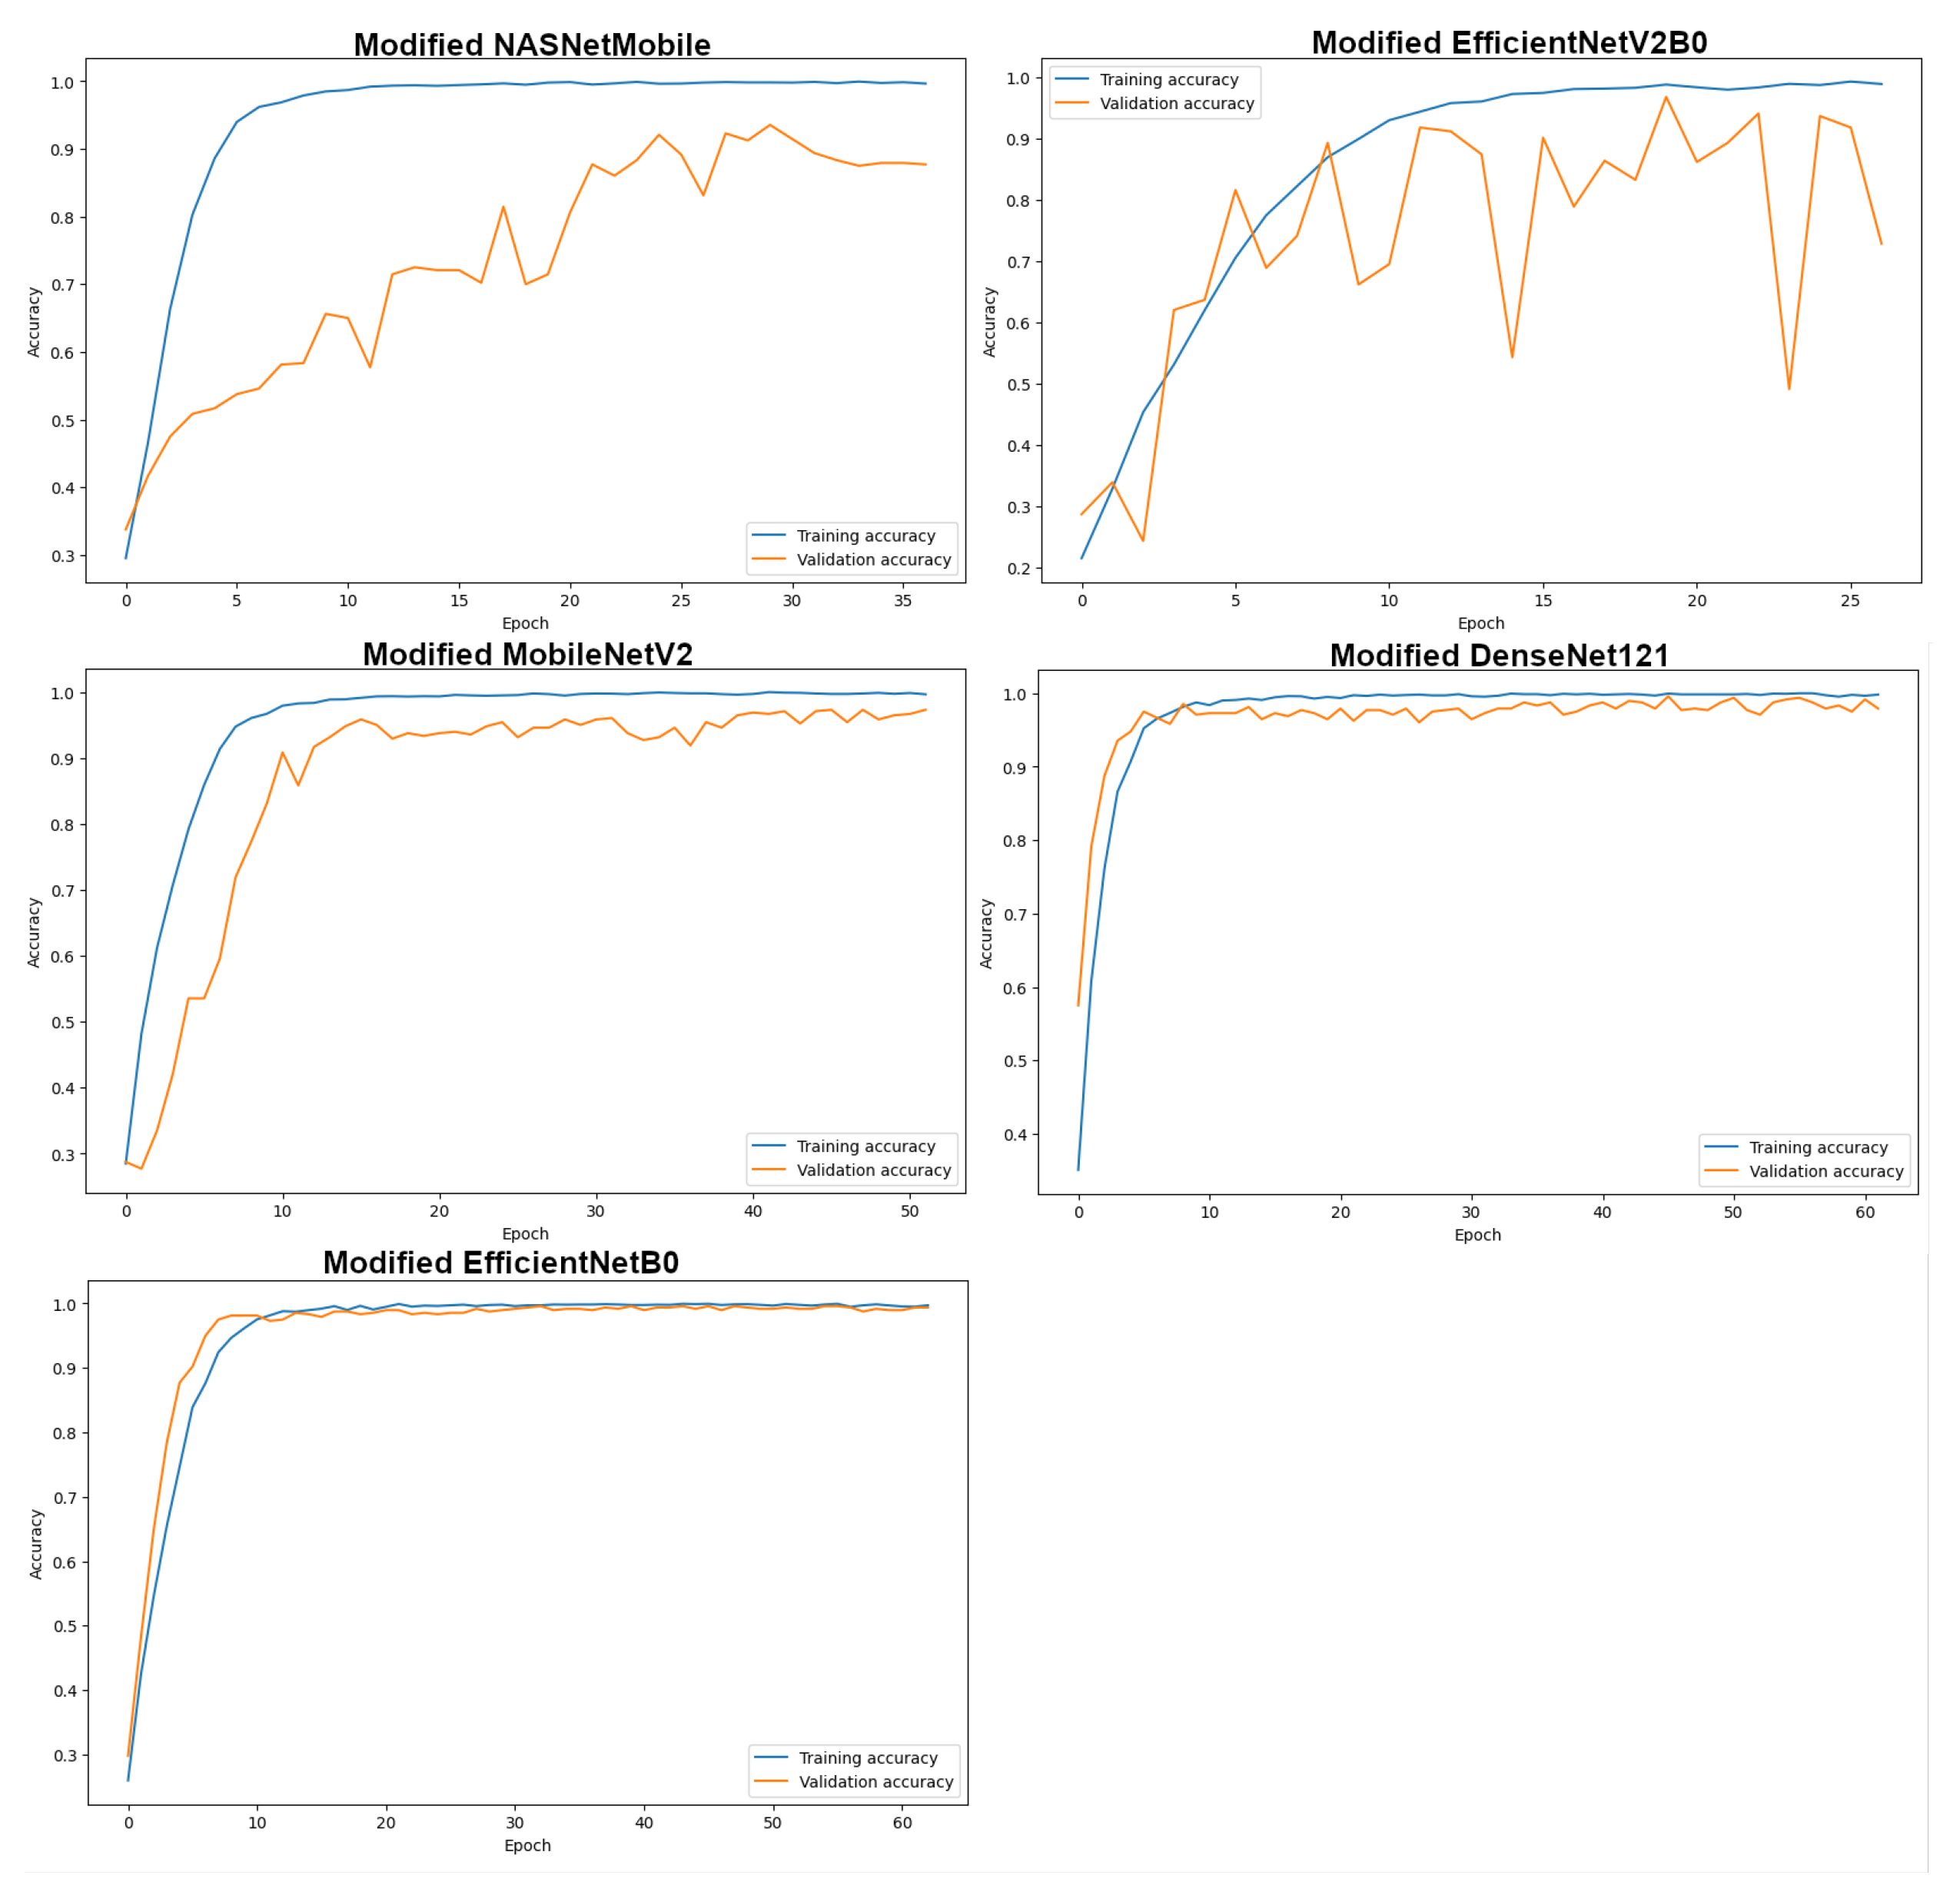
Five modified transfer learning (TL) models, specifically EfficientNetB0, MobileNetV2, DenseNet121, NASNetMobile, and EfficientNetV2B0, were trained on the expanded sugarcane leaf disease dataset. Figure 5 illustrates the accuracy of these modified TL models over time. The accuracy across these models on the dataset ranges from 92.71% to 98.54%. Notably, the modified EfficientNetB0 model exhibits the most linear trajectory, with substantial overlap between the training and validation accuracy curves, indicating superior generalization capability.
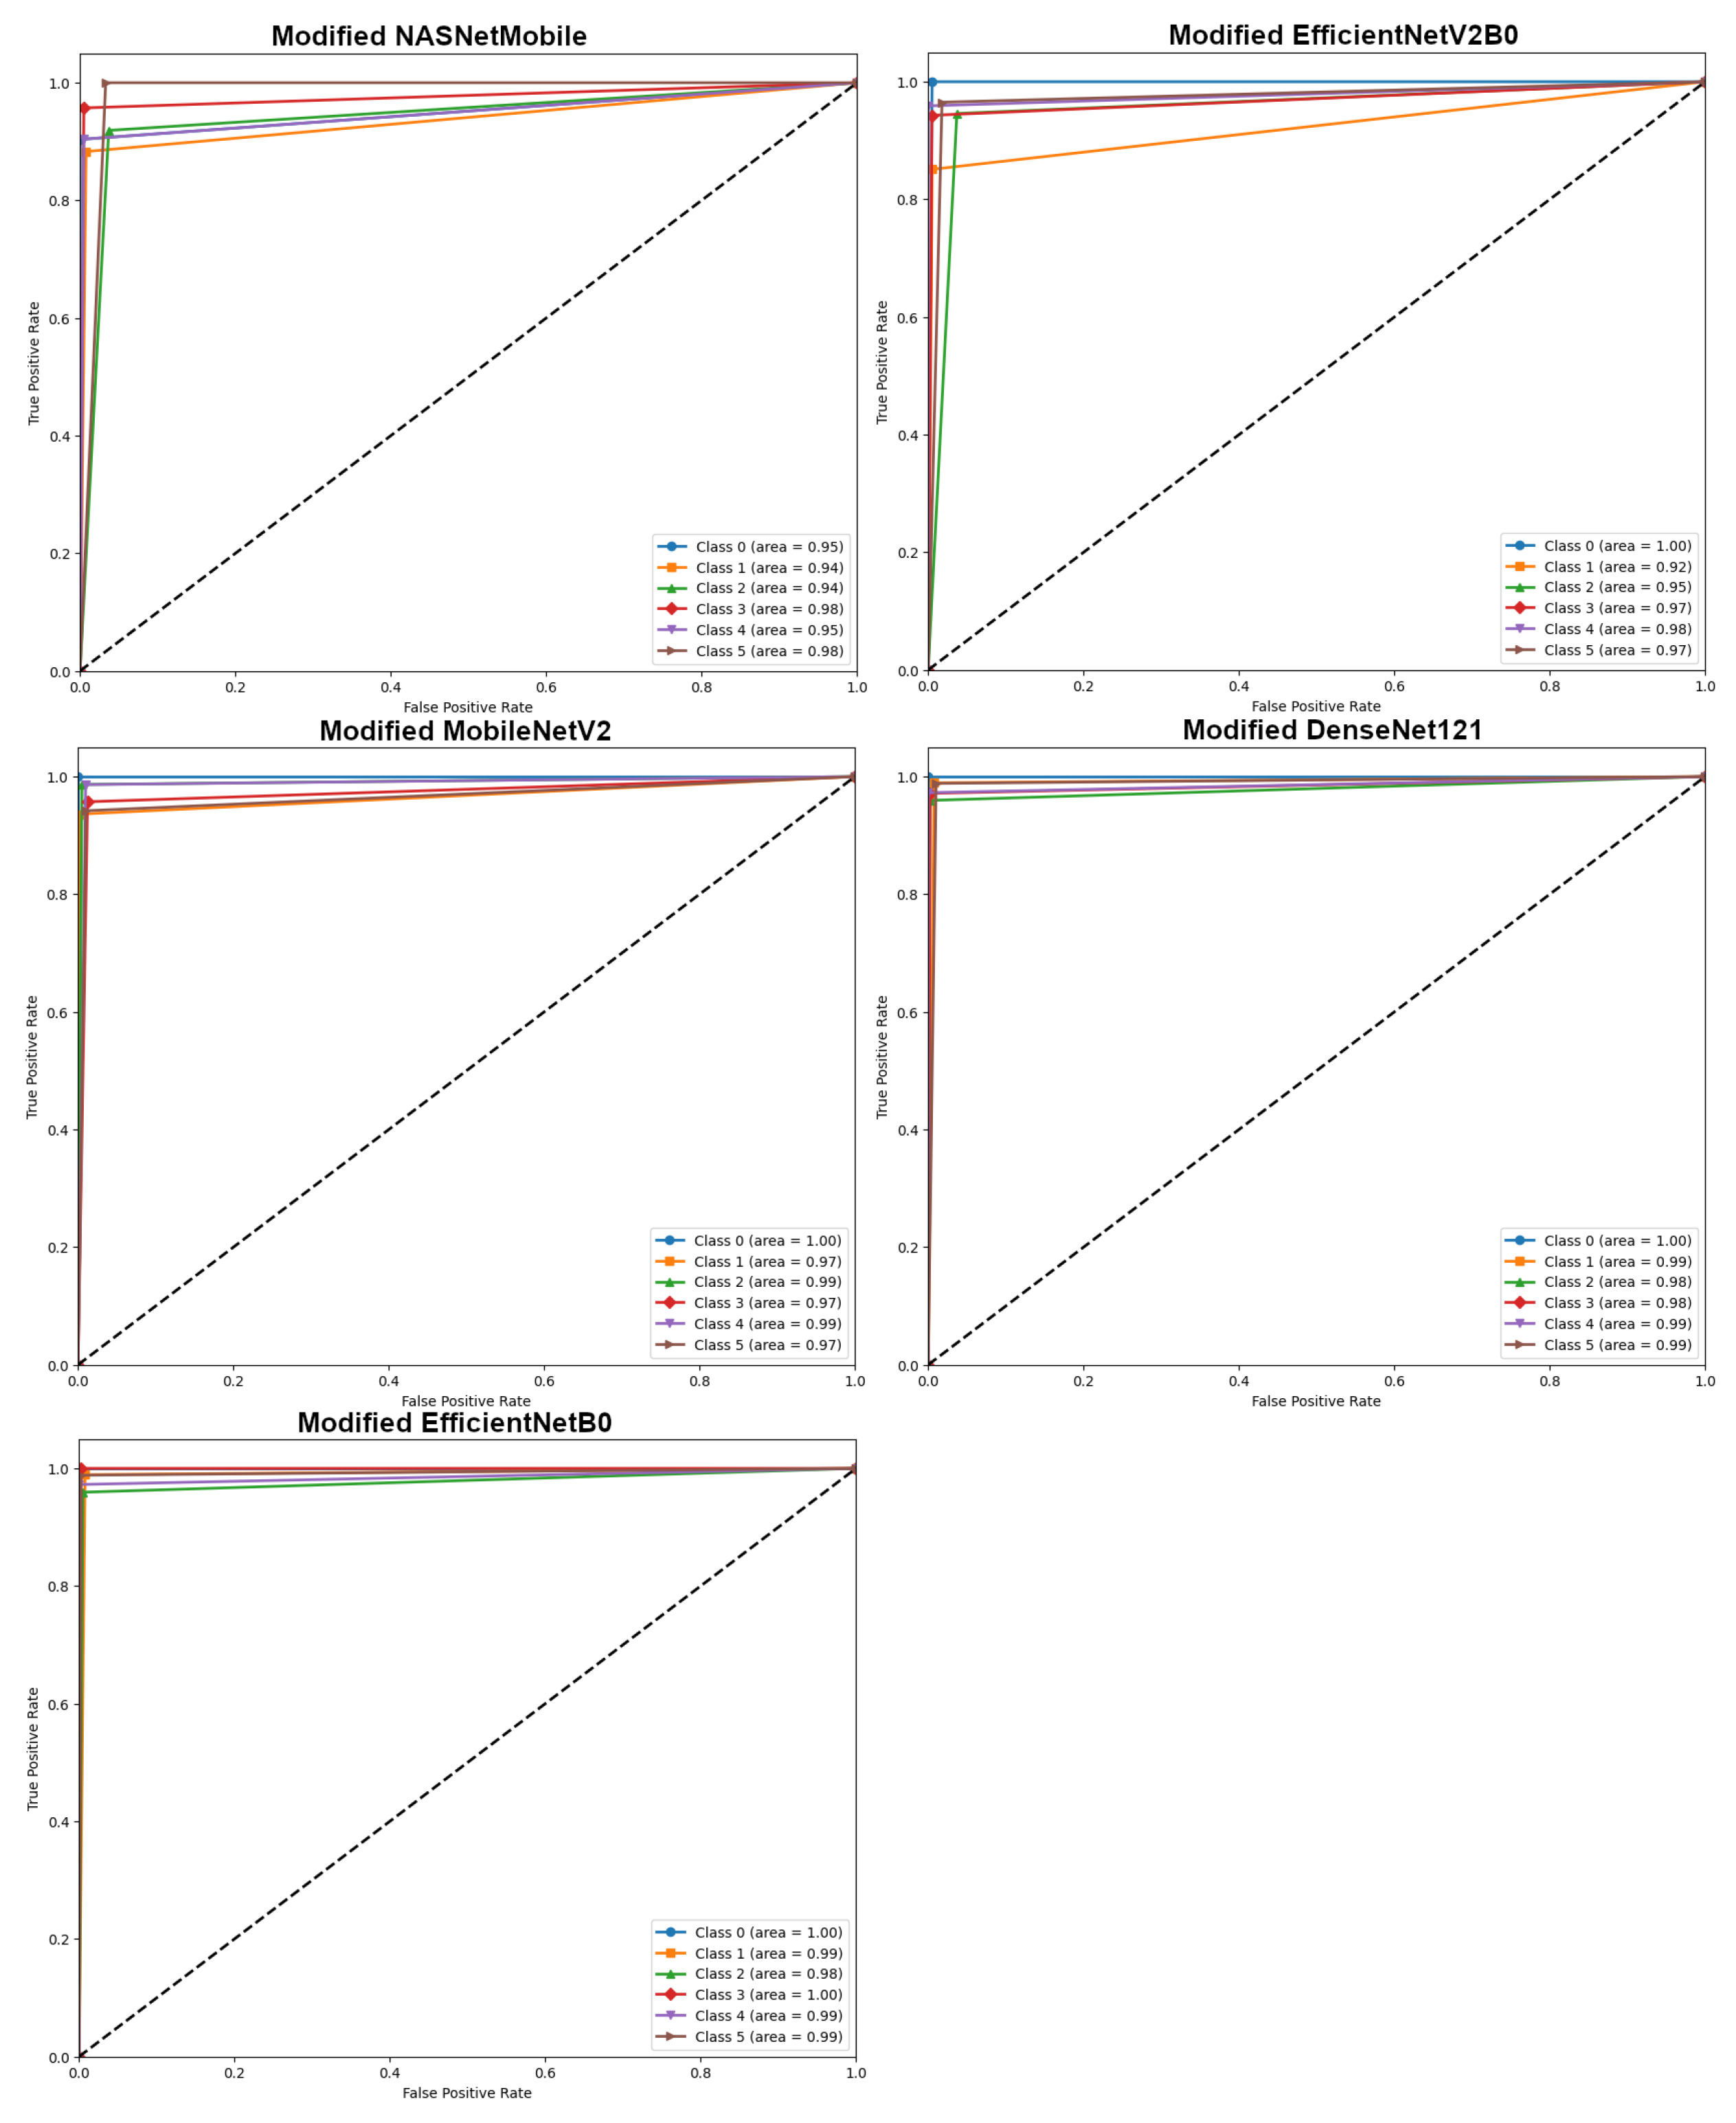
The receiver operating characteristic (ROC) curves for each improved transfer learning (TL) model are shown in Figure 6. This study’s examination of the micro-averaged ROC curve sheds light on how well the model can differentiate between cases that fall into each category, both positive and negative. A thorough assessment of the model’s performance is attained through a close inspection of the ROC curve’s form, its distance from the upper left corner, and the area under the curve (AUC). Perfect discrimination is shown by an AUC value of 1, which is a crucial sign of model performance. With the exception of NASNetMobile and EfficientNetV2B0, all modified TL models achieved AUC values closer to 1 across each category, suggesting a high degree of accuracy in correctly classifying all forms of sugarcane leaf disease.
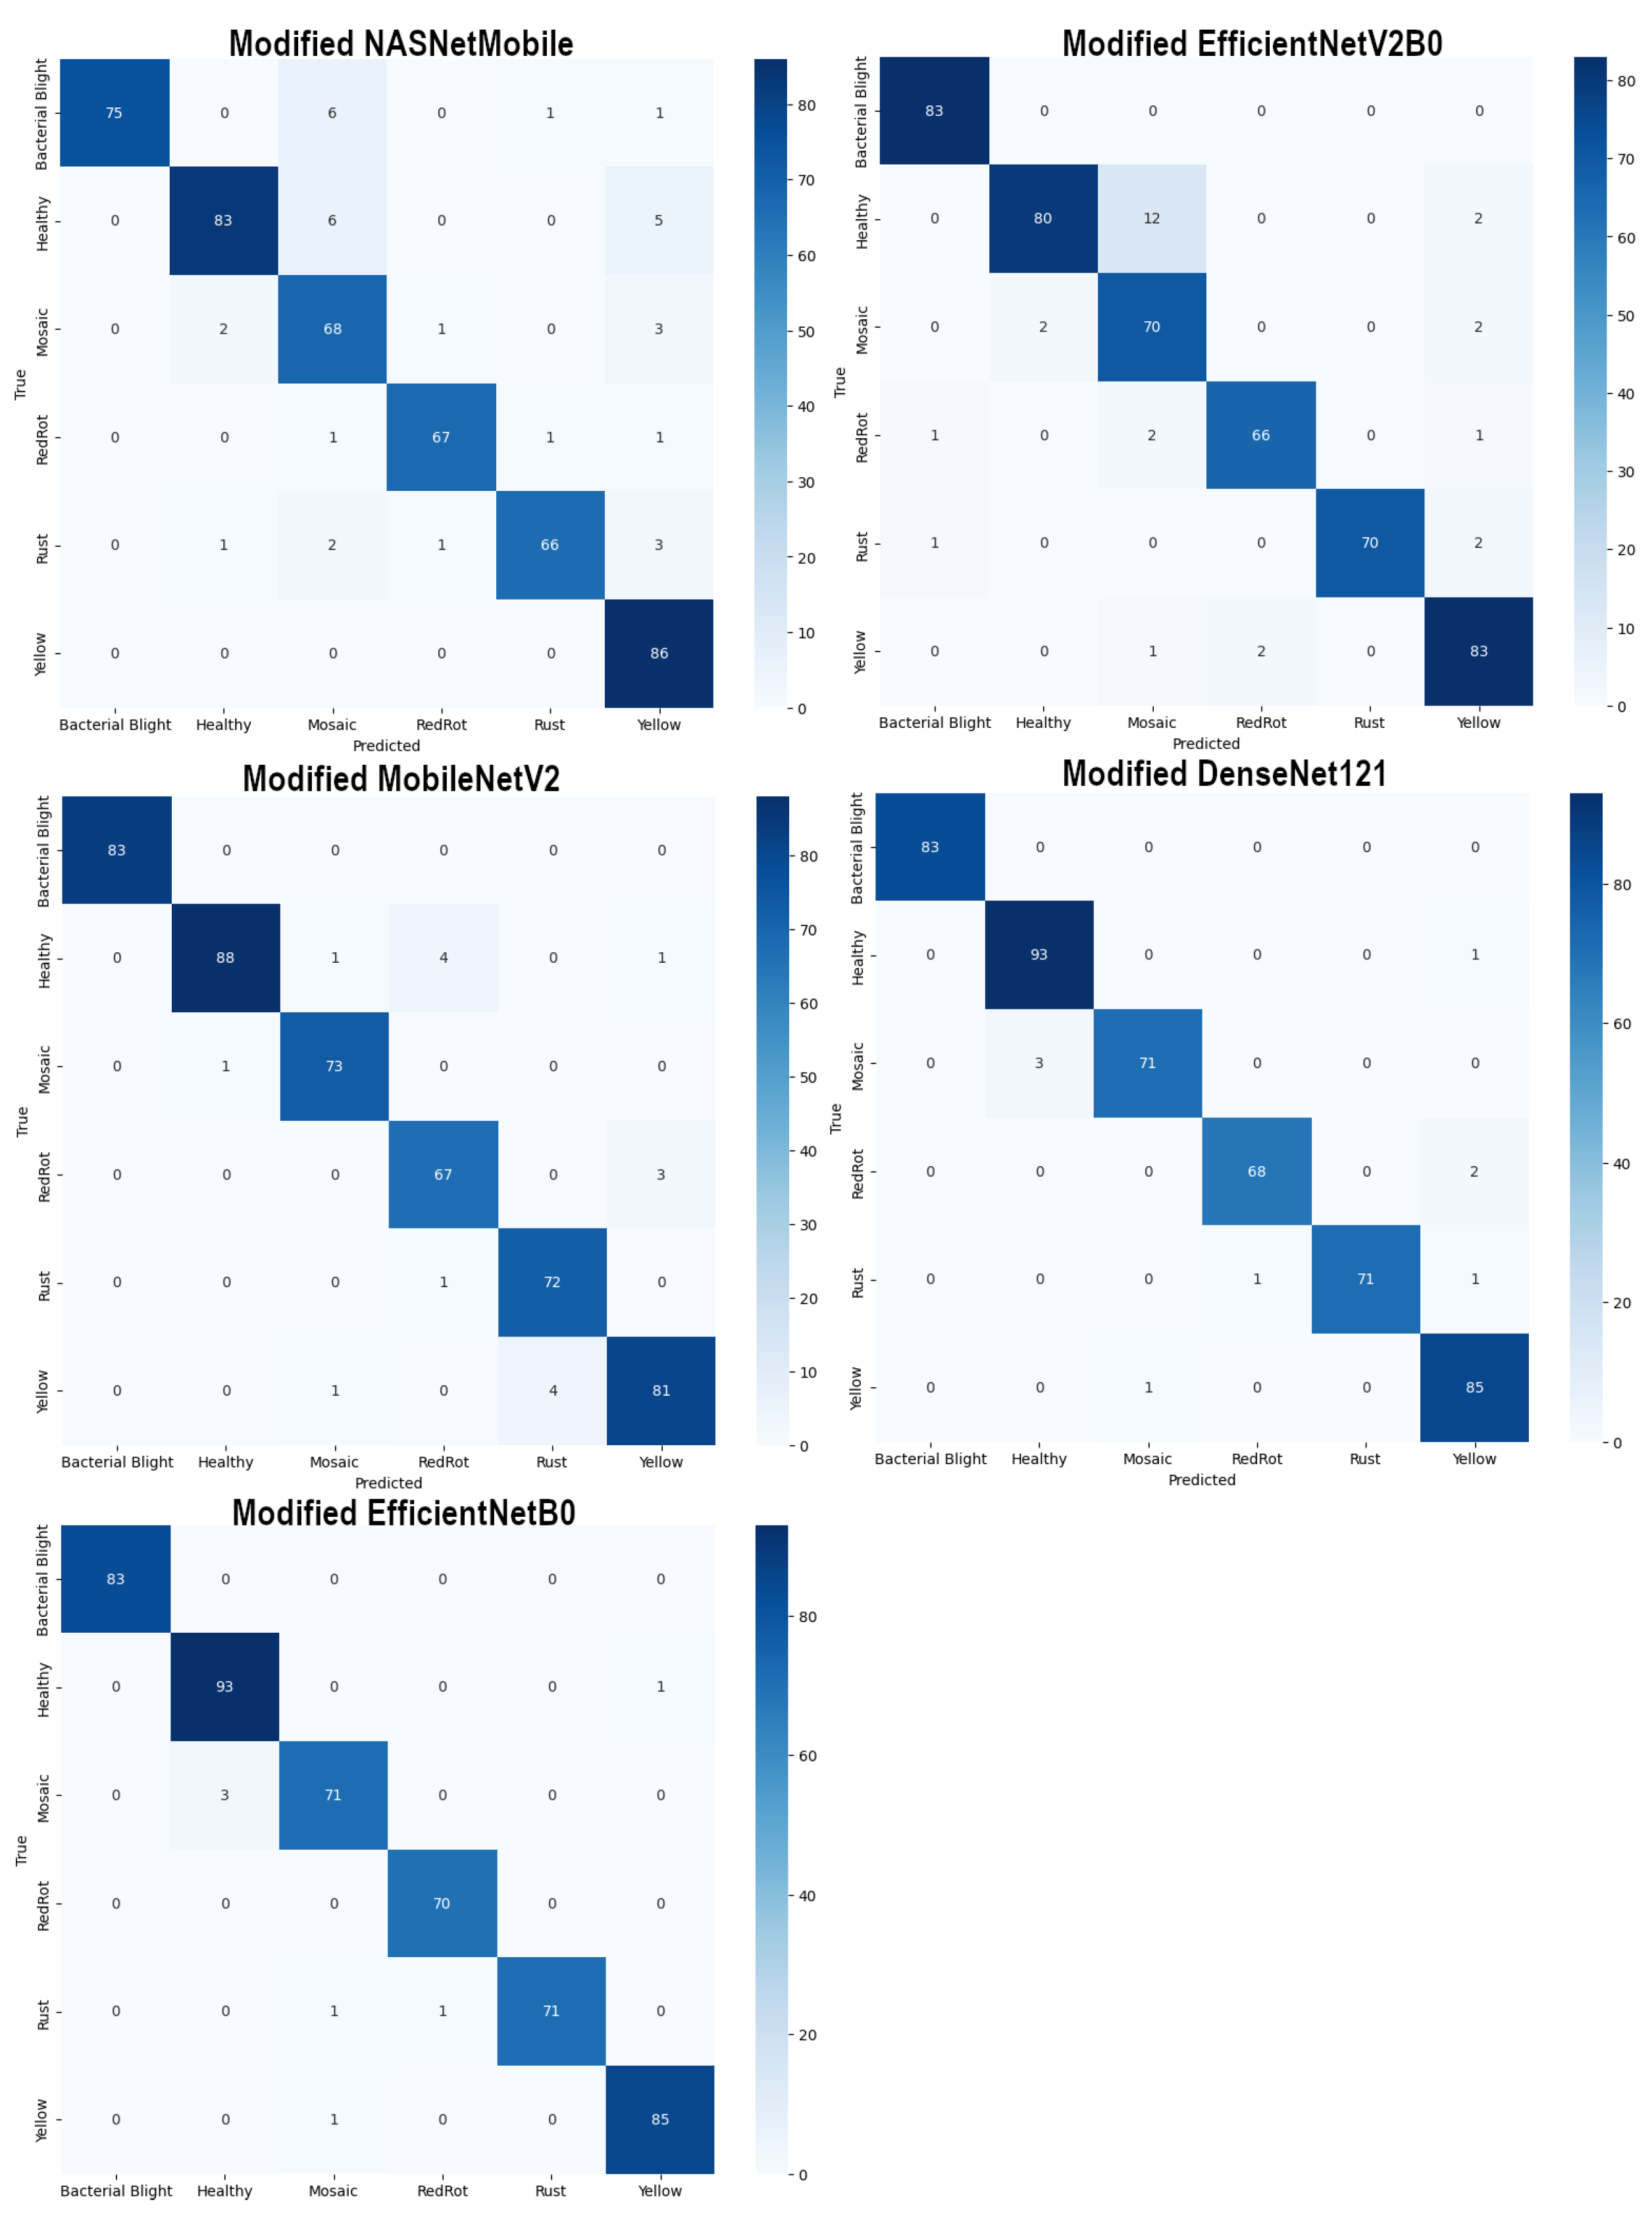
Presented in Figure 7 is the confusion matrix that was produced from 480 test cases. The modified transfer learning (TL) models for sugarcane leaf diseases are shown in this figure along with their classification result. The matrix includes true positives, false positives, true negatives, and false negatives for each model. As depicted in Figure 7, the modified NASNetMobile and EfficientNetV2B0 models displayed relatively low classification accuracy, correctly identifying only 446 and 452 out of the 480 sugarcane leaf disease cases, respectively. In contrast, the remaining models—such as the modified MobileNetV2, DenseNet121, and EfficientNetB0—demonstrated progressive improvements in performance. Among these, the modified EfficientNetB0 model achieved the highest accuracy, correctly identifying 453 out of 480 cases, thereby showcasing the best overall classification performance among the five models.
As shown in Table 7, the specific accuracies of the modified TL models—namely NASNetMobile, EfficientNetV2B0, MobileNetV2, DenseNet121, and EfficientNetB0—are 92.71%, 94.17%, 96.67%, 98.12%, and 98.54%, respectively. These results indicate varying degrees of performance improvement across the five modified TL models, with the modified EfficientNetB0 model demonstrating a clear superiority over the others. The adjusted EfficientNetB0 model outperforms the other five modified TL models in terms of precision, recall, F1 score, and prediction accuracy in the thorough performance evaluation that is presented in Table 8.

4.2. Results of Ensemble Modified TL Model DECNN

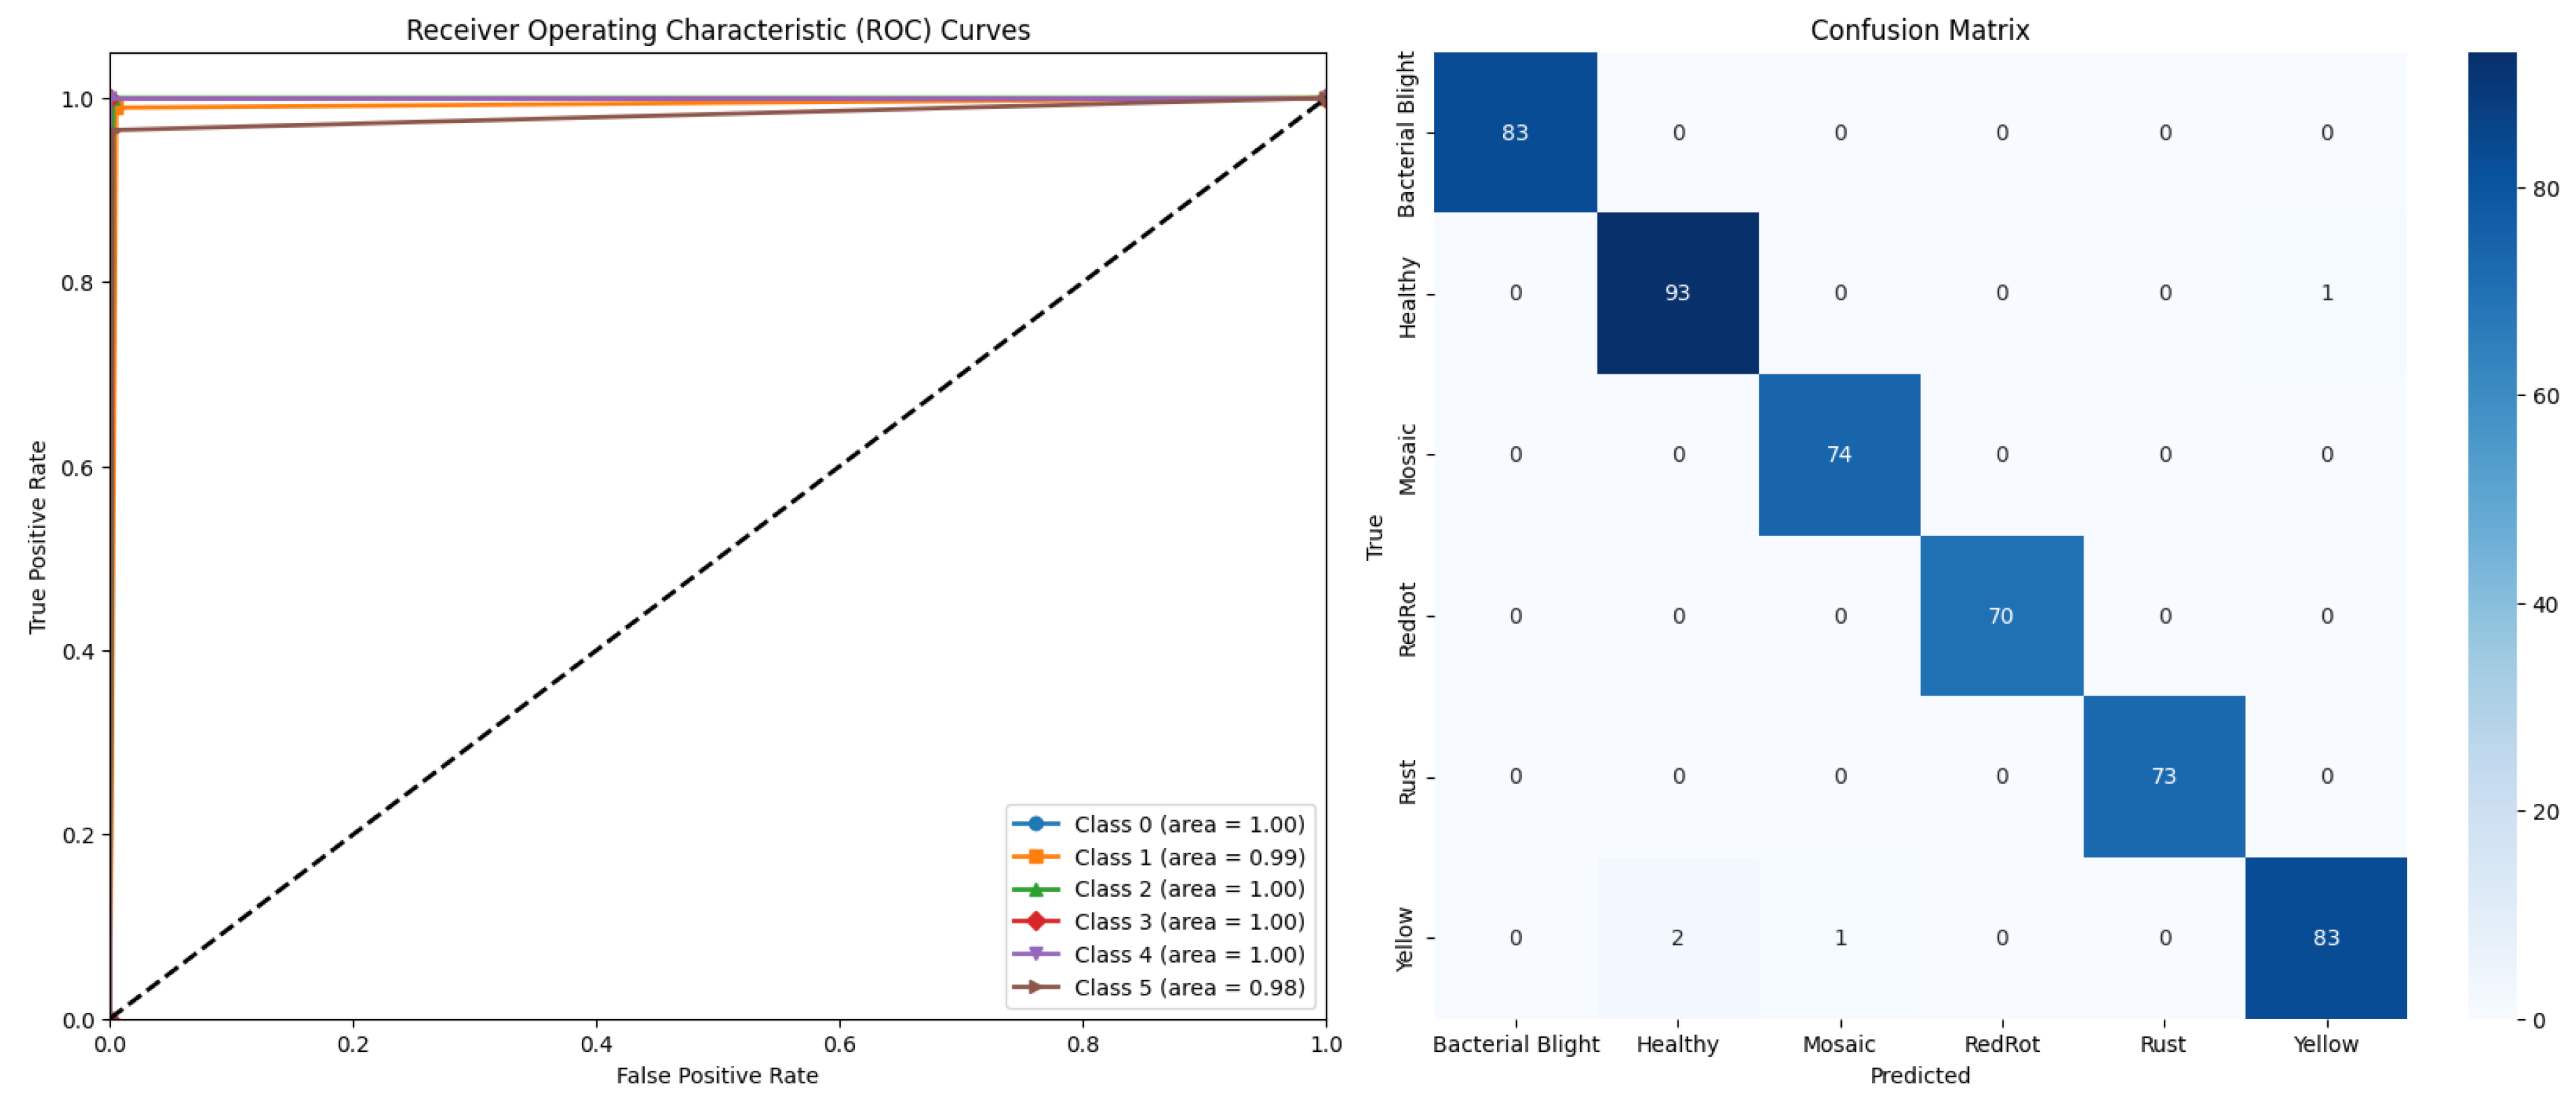
The DECNN model is composed of the three most accurate modified versions of EfficientNetB0, MobileNetV2, and DenseNet121, utilizing a custom weighted ensemble strategy. As shown in Table 8, the DECNN model achieves an accuracy of 99.17%, precision of 99.23%, recall of 99.13%, and an F1 score of 99.18%. These results surpass the performance of all modified TL models, representing the most remarkable outcome in this study. Figure 8 illustrate the receiver operating characteristic (ROC) curves and confusion matrix of the DECNN model, which exhibited the highest performance overall. The ROC curves for the DECNN model indicate four categories with an area under the curve (AUC) of 1, while the remaining two categories have an AUC approaching 1. The model correctly classified 476 out of 480 images of sugarcane leaf diseases, resulting in only four misclassifications. The efficiency of the DECNN model presented in this research in detecting and classifying sugarcane leaf diseases is well demonstrated by a thorough analysis of performance indicators.

5. Discussion

The Kaggle dataset comprises six categories and a total of 2,646 images, which this study utilizes to develop a computer vision-based technique for classifying sugarcane leaf diseases.
Developing learning models on relatively small datasets presents significant challenges. To mitigate the limitations associated with the availability of extensive datasets, this paper introduces a series of data augmentation techniques, including scaling, rotation, cropping, width shifting, height shifting, brightness adjustment, and horizontal flipping. These augmentation techniques expand the dataset while concurrently reducing the likelihood of overfitting [27]. Additionally, this study employs transfer learning, which enhances model performance despite limited data availability. As an illustration, Bagchi et al. [20] created a novel hybrid model with excellent accuracy, although the authors did not use data augmentation approaches. Had they done so, they might have achieved even higher accuracy.In this study, five modified transfer learning (TL) models were utilized, incorporating dense layers and batchnormalization layers at the base of each model to minimize overfitting and improve accuracy. Regularization techniques, such as ELN-Reg and Dropout, were also employed to prevent overfitting due to the limited training data. Furthermore, Rahman Yead et al. [30] utilized several classical deep learning architectures, including ResNet50, VGG16, DenseNet201, VGG19, and Inception V3, without modifications to the TL model. While designing their models, Daphal et al. [23] used average ensemble techniques instead of weighted ensemble learning. To further enhance performance, this paper adopts a bespoke weighted ensemble strategy for the top three modified models—EfficientNetB0, MobileNetV2, and DenseNet121—based on accuracy.
Table 9 presents the optimal weights obtained from the Tree-structured Parzen Estimator (TPE) search. The proposed weighted ensemble model (DECNN) achieves the most significant performance when utilizing these weights, demonstrating the highest accuracy in various experiments and in the context of previous studies. As illustrated in Figure 9, the model achieved an accuracy of 476 out of 480 test data points, with only four misclassifications. Table 8 shows the highest precision (99.23%), recall (99.13%), F1 score (99.18%), and accuracy (99.17%) recorded in this study. As depicted in Figure 9, the model demonstrates a high degree of accuracy in classifying the test data. Table 10 compares the proposed model with recently published models [20,23,30]. It is clear that the model put forward in this work greatly improves the classification accuracy of sugarcane leaf diseases.
Recognizing the study’s shortcomings is essential. Firstly, it is important to note that traditional machine learning models were not utilized, as the majority of existing literature indicates that deep learning techniques tend to outperform traditional machine learning approaches. However, the potential efficacy of hybrid machine learning techniques on the current dataset warrants further investigation.Secondly, this study focused exclusively on five common sugarcane leaf diseases. For the model to be applicable in real-world scenarios, it is essential to address a broader range of sugarcane leaf diseases. Additionally, only five principal modified transfer learning models were considered, some of which were combined in the ensemble. While these modified TL models effectively fulfilled the experimental objectives of this research, incorporating additional modified TL models could enhance the robustness and applicability of future studies.

6. Conclusions

This paper proposes a robust and highly accurate deep ensemble convolutional neural network (DECNN) model for the early detection of sugarcane leaf diseases. The proposed model incorporates dense and batchnormalization layers, applies regularization methods such as ELN-Reg and Dropout to mitigate overfitting, and employs early stopping optimization techniques for five transfer learning models: EfficientNetB0, MobileNetV2, DenseNet121, NASNetMobile, and EfficientNetV2B0. Additionally, various data augmentation techniques were utilized to expand the dataset and further reduce the risk of overfitting. A comprehensive comparative analysis of the modified transfer learning (TL) models was conducted. Ultimately, the three most effective models for disease classification were selected, and their predictions were integrated through a customized weighted strategy. The ensemble DECNN model exhibited significant improvements in performance metrics, achieving accuracy, precision, recall, and F1 score of 99.17%, 99.23%, 99.13%, and 99.18%, respectively. In the end, this high-precision model may help growers identify and cure leaf illnesses in sugarcane crops early on, which could increase sugarcane yields.
While this research focused on the detection of five distinct categories of sugarcane diseases, there is substantial scope for future research to modify and expand this model. Incorporating a more comprehensive set of sugarcane diseases and implementing the DECNN model in real agricultural settings could enhance and validate its performance. Furthermore, deploying the DECNN model in field trials and agricultural operations will provide invaluable insights into its viability and efficacy in authentic contexts. Researchers will be able to assess the model’s performance and provide guidance for future changes by working with farmers and agricultural groups to gather data on disease prevalence, treatment effectiveness, and general crop health.

Author Contributions

Conceptualization, K.H. and H.L.; Investigation, K.H. and S.Z.; Methodology, K.H. and H.L; Resources, K.H.; Visualization, K.H.; Writing—original draft, K.H.; Writing—review & editing, K.H. and S.Z. Project administration, H.L. and X.F.; funding acquisition, H.L. and X.F. All authors have read and agreed to the published version of the manuscript.

Funding

This research was funded by the National Natural Science Foundation of China Grant No. 61962047; the Inner Mongolia Autonomous Region Science and Technology Major Special Project Grant No. 2021ZD0005; the Natural Science Foundation of Inner Mongolia Autonomous Region Grant No. 2024MS06002; the Inner Mongolia Autonomous Region Directly Affiliated Universities Basic Scientific Research Business Fund Grant No. BR22-14-05; the Inner Mongolia Autonomous Region Higher Education Institutions Innovation Research Team Project NMGIRT2313 and the Collaborative Innovation Project of Universities and Institutes in Hohhot City Grant No. XTCX2023-20, XTCX2023-24

Conflicts of Interest

The authors declare no conflicts of interest.

References

  1. Rae, A.L.; Grof, C.P.L.; Casu, R.E.; Bonnett, G.D. Sucrose accumulation in the sugarcane stem: pathways and control points for transport and compartmentation. Field Crops Research 2005, 92, 159–168. [Google Scholar] [CrossRef]
  2. Ali, A.; Khan, M.; Sharif, R.; Mujtaba, M.; Gao, S.-J. Sugarcane Omics: An Update on the Current Status of Research and Crop Improvement. Plants 2019, 8, 344. [Google Scholar] [CrossRef]
  3. Hemalatha, N.K.; Brunda, R.N.; Prakruthi, G.S.; Prabhu, B.V.B.; Shukla, A.; Narasipura, O.S.J. Sugarcane leaf disease detection through deep learning. In Deep Learning for Sustainable Agriculture; Poonia, R.C., Singh, V., Nayak, S.R., Eds.; Elsevier Academic Press: London, United Kingdom, 2022; pp. 297–323. [Google Scholar]
  4. Li, A.-M.; Liao, F.; Wang, M.; Chen, Z.-L.; Qin, C.-X.; Huang, R.-Q.; Verma, K.K.; Li, Y.-R.; Que, Y.-X.; Pan, Y.-Q.; et al. Transcriptomic and Proteomic Landscape of Sugarcane Response to Biotic and Abiotic Stressors. Int. J. Mol. Sci. 2023, 24, 8913. [Google Scholar] [CrossRef]
  5. Yadav, S.; Singh, S.R.; Bahadur, L.; et al. Sugarcane Trash Ash Affects Degradation and Bioavailability of Pesticides in Soils. Sugar Tech 2023, 25, 77–85. [Google Scholar] [CrossRef]
  6. Ali, M.M.; Bachik, N.A.; Muhadi, N.A.; Yusof, T.N.T.; Gomes, C. Non-destructive techniques of detecting plant diseases: A review. Physiological and Molecular Plant Pathology 2019, 108, 101426. [Google Scholar] [CrossRef]
  7. Lu, T.; Han, B.; Chen, L.; Yu, F.; Xue, C. A generic intelligent tomato classification system for practical applications using DenseNet-201 with transfer learning. Sci. Rep. 2021, 11, 15824. [Google Scholar] [CrossRef]
  8. Kouadio, L.; El Jarroudi, M.; Belabess, Z.; Laasli, S.-E.; Roni, M.Z.K.; Amine, I.D.I.; Mokhtari, N.; Mokrini, F.; Junk, J.; Lahlali, R. A Review on UAV-Based Applications for Plant Disease Detection and Monitoring. Remote Sens. 2023, 15, 4273. [Google Scholar] [CrossRef]
  9. Krishnamoorthy, N.; Prasad, L.V.N.; Kumar, C.S.P.; Subedi, B.; Abraha, H.B.; Sathiskumar, V.E. Rice leaf diseases prediction using deep neural networks with transfer learning. Environ. Res. 2021, 198, 111275. [Google Scholar]
  10. Shorten, C.; Khoshgoftaar, T.M. A survey on Image Data Augmentation for Deep Learning. Journal of Big Data 2019, 6, 60. [Google Scholar] [CrossRef]
  11. Ayana, G.; Dese, K.; Choe, S.-w. Transfer Learning in Breast Cancer Diagnoses via Ultrasound Imaging. Cancers 2021, 13, 738. [Google Scholar] [CrossRef]
  12. Yigit, E.; Sabanci, K.; Toktas, A.; Kayabasi, A. A study on visual features of leaves in plant identification using artificial intelligence techniques. Comput. Electron. Agric. 2019, 156, 369–377. [Google Scholar] [CrossRef]
  13. Basavaiah, J.; Anthony, A.A. Tomato leaf disease classification using multiple feature extraction techniques. Wirel. Pers. Commun. 2020, 115, 633–651. [Google Scholar] [CrossRef]
  14. Chanda, M.; Biswas, M. Plant disease identification and classification using Back-Propagation Neural Network with Particle Swarm Optimization. In Proceedings of the 2019 3rd International Conference on Trends in Electronics and Informatics (ICOEI), Tirunelveli, India, 23-25 April 2019; pp. 1029–1036. [Google Scholar]
  15. Hossain, E.; Hossain, M.F.; Rahaman, M.A. A color and texture based approach for the detection and classification of plant leaf disease using KNN classifier. In Proceedings of the 2019 International Conference on Electrical, Computer and Communication Engineering (ECCE), Cox’s Bazar, Bangladesh, 7-9 February 2019; pp. 1–6. [Google Scholar]
  16. Wu, Y.; Feng, X.; Chen, G. Plant Leaf Diseases Fine-Grained Categorization Using Convolutional Neural Networks. IEEE Access 2022, 10, 41087–41096. [Google Scholar] [CrossRef]
  17. Patil, R.R.; Kumar, S. Rice-Fusion: A Multimodality Data Fusion Framework for Rice Disease Diagnosis. IEEE Access 2022, 10, 5207–5222. [Google Scholar] [CrossRef]
  18. Elfatimi, E.; Eryigit, R.; Elfatimi, L. Beans Leaf Diseases Classification Using MobileNet Models. IEEE Access 2022, 10, 9471–9482. [Google Scholar] [CrossRef]
  19. Rahaman Yead, M.A.; Rukhsara, L.; Rabeya, T.; Jahan, I. Deep Learning-Based Classification of Sugarcane Leaf Disease. In Proceedings of the 2024 6th International Conference on Electrical Engineering and Information & Communication Technology (ICEEICT), Dhaka, Bangladesh, 2–4 May 2024; pp. 818–823. [Google Scholar]
  20. Bagchi, A.K.; Haider Chowdhury, M.A.; Fattah, S.A. Sugarcane Disease Classification using Advanced Deep Learning Algorithms: A Comparative Study. In Proceedings of the 2024 6th International Conference on Electrical Engineering and Information & Communication Technology (ICEEICT), Dhaka, Bangladesh, 2–4 May 2024; pp. 887–892. [Google Scholar]
  21. Pham, T.N.; Tran, L.V.; Dao, S.V.T. Early Disease Classification of Mango Leaves Using Feed-Forward Neural Network and Hybrid Metaheuristic Feature Selection. IEEE Access 2020, 8, 189960–189973. [Google Scholar] [CrossRef]
  22. Sun, C.; Zhou, X.; Zhang, M.; Qin, A. SE-VisionTransformer: Hybrid Network for Diagnosing Sugarcane Leaf Diseases Based on Attention Mechanism. Sensors 2023, 23, 8529. [Google Scholar] [CrossRef]
  23. Daphal, S.D.; Koli, S.M. Enhancing sugarcane disease classification with ensemble deep learning: A comparative study with transfer learning techniques. Heliyon 2023, 9, e18261. [Google Scholar] [CrossRef] [PubMed]
  24. Sharma, S. Five Crop Diseases Dataset. Available online: https://www.kaggle.com/datasets/shubham2703/five-crop-diseases-dataset (accessed on 10 August 2024).
  25. Sankalana, N. Sugarcane Leaf Disease Dataset. Available online: https://www.kaggle.com/datasets/nirmalsankalana/sugarcane-leaf-disease-dataset (accessed on 10 August 2024).
  26. Ali, A.; Ali, S.; Husnain, M.; Missen, M.M.S.; Samad, A.; Khan, M. Detection of Deficiency of Nutrients in Grape Leaves Using Deep Network. Mathematical Problems in Engineering 2022, 2022, 1–12. [Google Scholar] [CrossRef]
  27. Bansal, P.; Kumar, R.; Kumar, S. Disease detection in Apple leaves using deep convolutional neural network. Agriculture 2021, 11, 617. [Google Scholar] [CrossRef]
  28. Fan, C.; Chen, M.; Wang, X.; Wang, J.; Huang, B. A Review on Data Preprocessing Techniques Toward Efficient and Reliable Knowledge Discovery From Building Operational Data. Front. Energy Res. 2021, 9, 652801. [Google Scholar] [CrossRef]
  29. Zou, H.; Hastie, T. Regularization and Variable Selection Via the Elastic Net. Journal of the Royal Statistical Society Series B: Statistical Methodology 2005, 67, 301–320. [Google Scholar] [CrossRef]
  30. Dialameh, M.; Hamzeh, A.; Rahmani, H.; Dialameh, H.; Kwon, H.J. DL-Reg: A deep learning regularization technique using linear regression. Expert Systems with Applications 2024, 247, 123182. [Google Scholar] [CrossRef]
  31. Akiba, T.; Sano, S.; Yanase, T.; Ohta, T.; Koyama, M. Optuna: A Next-generation Hyperparameter Optimization Framework. In Proceedings of the 25th ACM SIGKDD International Conference on Knowledge Discovery & Data Mining (KDD ’19), Anchorage, AK, USA, 4-8 August 2019; pp. 2623–2631. [Google Scholar]
  32. Hosna, A.; Merry, E.; Gyalmo, J.; Alom, Z.; Aung, Z.; Azim, M.A. Transfer learning: a friendly introduction. Journal of Big Data 2022, 9, 102. [Google Scholar] [CrossRef] [PubMed]
  33. Neyshabur, B.; Sedghi, H.; Zhang, C. What is being transferred in transfer learning? In Proceedings of the 34th International Conference on Neural Information Processing Systems (NIPS ’20), Vancouver, BC, Canada, 6-12 December 2020; pp. 512–523. [Google Scholar]
  34. Liu, L.; Chen, J.; Fieguth, P.; Zhao, G.; Chellappa, R.; Pietikäinen, M. From BoW to CNN: Two Decades of Texture Representation for Texture Classification. Int. J. Comp. Vis. 2019, 127, 74–109. [Google Scholar] [CrossRef]
  35. Yan, Y.; Ren, W.; Cao, X. Recolored Image Detection via a Deep Discriminative Model. IEEE Transactions on Information Forensics and Security 2019, 14, 5–17. [Google Scholar] [CrossRef]
  36. Tan, M.; Le, Q.V. EfficientNet: Rethinking Model Scaling for Convolutional Neural Networks. arXiv 2019, arXiv:1905.11946. [Google Scholar]
  37. Sandler, M.; Howard, A.; Zhu, M.; Zhmoginov, A.; Chen, L.-C. MobileNetV2: Inverted Residuals and Linear Bottlenecks. In Proceedings of the 2018 IEEE/CVF Conference on Computer Vision and Pattern Recognition, Salt Lake City, UT, USA, 18-23 June 2018; pp. 4510–4520. [Google Scholar]
  38. Huang, G.; Liu, Z.; Maaten, L.V.D.; Weinberger, K.Q. Densely Connected Convolutional Networks. In Proceedings of the 2017 IEEE Conference on Computer Vision and Pattern Recognition (CVPR), Honolulu, HI, USA, 21–26 July 2017; pp. 2261–2269. [Google Scholar]
  39. Zoph, B.; Vasudevan, V.; Shlens, J.; Le, Q.V. Learning Transferable Architectures for Scalable Image Recognition. In Proceedings of the 2018 IEEE/CVF Conference on Computer Vision and Pattern Recognition, Salt Lake City, UT, USA, 18-23 June 2018; pp. 8697–8710. [Google Scholar]
  40. Tan, M.; Le, Q.V. EfficientNetV2: Smaller Models and Faster Training. arXiv 2021, arXiv:2104.00298. [Google Scholar]
  41. Sagi, O.; Rokach, L. Ensemble learning: A survey. WIREs Data Mining and Knowledge Discovery 2018, 8, e1249. [Google Scholar] [CrossRef]
  42. Dietterichl, T.G. Ensemble learning. In The Handbook of Brain Theory and Neural Networks; Arbib, M.A., Ed.; MIT Press: Cambridge, MA, USA, 2002; pp. 405–408. [Google Scholar]
  43. Bergstra, J.; Yamins, D.; Cox, D.D. Making a science of model search: hyperparameter optimization in hundreds of dimensions for vision architectures. In Proceedings of the 30th International Conference on International Conference on Machine Learning - Volume 28 (ICML’13), Atlanta, GA, USA, 16-21 June 2013; pp. I–115–I–123. [Google Scholar]
Figure 1. Some examples of diseases of sugarcane.
Preprints 121200 g001
Figure 2. Flow diagram of the proposed DECNN model.
Preprints 121200 g002
Figure 3. The concept of transfer learning.
Preprints 121200 g003
Figure 4. Proposed deep ensemble CNN (DECNN) model.
Preprints 121200 g004
Figure 5. Accuracy of the modified model versus number of epochs.
Preprints 121200 g005
Figure 6. ROC curve of modified TL model.
Preprints 121200 g006
Figure 7. Confusion matrix of modified TL model.
Preprints 121200 g007
Figure 8. ROC curve and Confusion matrix of proposed DECNN model.
Preprints 121200 g008
Figure 9. Final predicted outputs.
Preprints 121200 g009
Table 1. Comparison of various architectural approaches taken on various plants.
References Model Used Dataset Number of Images Number of Classes Transfer learning Ensemble Learning Data augmentation Accuracy
[12] SVM Multi-plant (Folio) 637 32 No No No 92.91%
[16] CNN(FGIA) Peach,Tomato (PlantVillage) 2657,18162 2,10 No No No 95.48%
[17] CNN, MLP Rice(own) 3200 4 No Yes No 95.31%
[18] MobileNetV2 Bean(ibean) 1296 3 Yes No No 92.97%
[19] ResNet50, VGG16,VGG19 DenseNet201, InceptionV3 Sugarcane (Mendeley) 2511 5 Yes No No 95.69%
[20] EfficientNetB0, CSPDarknet53 Sugarcane (Mendeley) 2522 5 Yes Yes Yes 96.80%
[21] ANN Mango(own) 450 4 No No No 89.41%
[22] SE-VIT Multi-plant (PlantVillage), Sugarcane(own) 60343,1877 38,5 Yes No Yes 89.57%
[23] CNN,VGG19, ResNet50, Xception, MobileNetV2, EfficientNetB7 Sugarcane(own) 2569 5 Yes Yes No 86.53%
Table 2. Specifications of the augmentation methods used in this study.
Serial No. Augmentation Technique Parameter with Value
1 Rotation rotation_range=20
2 Width shift width_shift_range=0.2
3 Height shift height_shift_range=0.2
4 Shear shear_range=0.2
5 Zoom zoom_range=0.2
6 Horizontal flip horizontal_flip=True
7 Brightness brightness_range=[0.5, 1.5]
Table 3. Sample size before and after augmentation of the sugarcane leaf disease dataset.
Classes Original dataset Data augmentation
Total Training Validation Testing Total Training Validation Testing
Healthy 522 420 54 48 800 631 75 94
Mosaic 462 366 49 47 800 658 68 74
RedRot 518 413 49 56 800 653 77 70
Rust 514 416 45 53 800 644 83 73
Yellow 505 400 56 49 800 618 96 86
BacterialBlight 125 101 12 12 800 636 81 83
Total 2646 2116 265 265 4800 3840 480 480
Table 4. Comparison of common regularization methods with and without regularization in sugarcane leaf disease classification accuracy using EfficientNetB0 as a base model.
Method Test Classification Accuracy
NULL 96.39
L1 97.92
L1+Dropout 98.12
L2 97.50
L2+Dropout 98.12
ELN-Reg 98.12
ELN-Reg+Dropout 98.54
Table 5. TL architectures applied in the study.
Model Total Parameter Trainable Parameters Non-Trainable Parameters
EfficientNetB0 5,330,571 5,288,548 42,023
MobileNetV2 3,538,984 3,504,872 34,112
DenseNet121 8,062,504 7,978,856 83,648
NASNetMobile 5,326,716 5,289,978 36,738
EfficientNetV2B0 7,200,312 7,139,704 60,608
Table 6. The Modified EfficientNetB0’s layers and learning settings.
Layer (Type) Output Shape Parameters
Input Layer [(None,224,224,3)] 0
efficientnet-b0 (None, 1280) 4049564
Dense (None, 128) 163968
BatchNormalization (None, 128) 896
Dropout (None, 128) 0
Dense (None, 64) 8256
BatchNormalization (None, 64) 448
Dropout (None, 64) 0
Dense (None, 32) 2080
BatchNormalization (None, 32) 224
Dropout (None, 32) 0
Dense (None, 6) 198
Table 7. Comparison of test results of the modified TL model on the augmented dataset.
Model Original Modified Improvement
NASNetMobile 85.00 92.71 +%7.71
EfficientNetV2B0 90.21 94.17 +%3.96
MobileNetV2 92.50 96.67 +%4.17
DenseNet121 95.83 98.12 +%2.29
EfficientNetB0 97.08 98.54 +%1.46
Table 8. Comprehensive analysis of the models’ performance.
Model (Modified) Macro Average Weighted Average Accuracy
Precision Recall F1 score Precision Recall F1 score
NASNetMobile 93.24 92.78 92.80 93.31 92.71 92.78 92.71
EfficientNetV2B0 94.47 94.40 94.27 94.57 94.17 94.20 94.17
MobileNetV2 96.60 96.76 96.64 96.75 96.67 96.67 96.67
DenseNet121 98.22 98.11 98.16 98.14 98.12 98.12 98.12
EfficientNetB0 98.59 98.50 98.53 98.58 98.54 98.54 98.54
Proposed DECNN 99.23 99.13 99.18 99.17 99.17 99.17 99.17
Table 9. Tuned weight values.
Model (Modified) Weight Values
EfficientNetB0 0.58
MobileNetV2 0.17
DenseNet121 0.21
Table 10. Comparison of the performance of the model proposed in this paper with previous work.
No. Method Accuracy
1 Rahaman Yead et al.[32] 95.69
2 Bagchi et al.[34] 96.80
3 Daphal et al.[40] 86.53
4 Proposed method 99.17
Disclaimer/Publisher’s Note: The statements, opinions and data contained in all publications are solely those of the individual author(s) and contributor(s) and not of MDPI and/or the editor(s). MDPI and/or the editor(s) disclaim responsibility for any injury to people or property resulting from any ideas, methods, instructions or products referred to in the content.
Copyright: This open access article is published under a Creative Commons CC BY 4.0 license, which permit the free download, distribution, and reuse, provided that the author and preprint are cited in any reuse.
Prerpints.org logo

Preprints.org is a free preprint server supported by MDPI in Basel, Switzerland.

Subscribe

© 2024 MDPI (Basel, Switzerland) unless otherwise stated