Submitted:
15 October 2024
Posted:
15 October 2024
You are already at the latest version
Abstract
Glass fiber reinforced epoxy resin composites were manufactured using the vacuum infusion process. In some of the samples, the biaxial glass fiber fabric was pretreated with an air plasma generated in a dielectric barrier discharge. All samples were exposed to temperature changes, UV radiation, and NaCl and KOH solutions and then examined for their mechanical properties. Compared to the reference samples, the plasma-treated samples showed slightly better mechanical properties. The strength values determined in tensile, compression, and bending tests were several percent higher. Thermal stress and UV radiation did not lead to a loss of mechanical performance. The effect of NaCl and KOH solutions deteriorated the mechanical properties. Although the comparatively better mechanical properties of the plasma-treated samples were retained after the different treatments, the stability of the composite material against aggressive environmental conditions was not significantly improved.
Keywords:
glass fiber reinforced epoxy
; vacuum assisted resin infusion
; plasma pretreatment
; weathering test
; mechanical properties
1. Introduction
Glass fiber reinforced polymers (GFRP) were introduced more than 80 years ago and still play an important role today. Due to their outstanding properties, this material is applied in aircraft, trains, rotor blades, electronic devices, sport equipment and many other products. The use of GFRP to reinforce bridges, buildings, tunnels, silos, tanks, and underground infrastructure represents another important field of application [1]. In 2022, 12.7 million tons of fiber reinforced composite materials were traded on the global market [2]. Glass fiber products made up the largest share [3]. The further expansion of wind energy parks and electromobility is leading to increasing demand and production of GFRP.
There are numerous approaches to improving the properties and service life of GFRP. The transfer of mechanical stress from the matrix to the fiber reinforcement plays a central role. The focus is on better fiber wettability and fiber matrix adhesion. Manufacturers of glass fibers and glass fiber fabrics apply special sizing, i.e. a functional coating, so that the chemical properties of the reinforcing material and the organic matrix become more compatible [3]. In this context, research into the potential of plasma treatment of glass fibers became interesting as early as the 1970s. The experiments had different objectives: complete removal of the sizing, roughening of the surface, activation and functionalization of the surface, or plasma deposition of selected functional coatings on the glass.
As shown in a review article by Li et al. [4], the use of plasma technologies for the treatment of various reinforcing fibers has received great attention since the 1980s. The focus was on properties of fiber-reinforced composites such as interfacial adhesion, transverse tensile or shear strength, toughness and tribological behavior of the composites. However, first attempts to incorporate N-containing functional groups into unsized borosilicate fibers using NH3 plasma led to a decrease of the adhesive strength due to a smoothing of the glass fiber surface [5,6]. Better results were reported after treating glass fabrics with NH3 plasma for 10 – 60 minutes. By incorporating surface groups, the fiber-matrix adhesion was improved, as shown by the results of a tensile test [7]. The application of an Ar, air, O2 or NH3 plasma at different pressures to treat woven glass fabrics was investigated and slightly increased tensile strength of the GFR epoxy was observed compared to untreated samples [8]. Nakahira et al. [9] treated heat-cleaned glass fibers and sheets for 120 s in an Argon plasma at pressures of 60, 90, and 120 Pa to develop high performance glass fiber reinforced plastics. The removal of surface contaminants and the modification of the E-glass by plasma treatment resulted in a reduction in the contact angle and an improvement in the interfacial shear strength by up to 160% compared to the untreated samples. Improved wettability was also reported by Ermel et al. [10] after treating glass fiber layers in a dielectric barrier discharge in air. Haji et al. [11] investigated the influence of the plasma treatment parameters – process gas, gas flow, plasma power, and exposure time – on the tensile strength of glass fiber/epoxy resin composites. The best result was achieved for a one-minute argon plasma treatment of the glass fibers. With an oxygen plasma treatment of the same duration, the improvement was significantly lower.
In their study, Mäder et al. [12] showed the relationships between surface, boundary layer and various bonding properties in composite materials made of glass fibers and epoxy resin. They examined unsized glass fibers and silane-treated glass fibers and determined their thermodynamic work of adhesion and debonding shear strength. In this context, plasma coating processes became increasingly important.
Glass fibers coated with plasma-polymerized hexamethyldisiloxane or vinyltriethoxysilane did not achieve the interfacial shear strength of argon plasma-treated E-glass fibers coated with the commercially available silane sizing agent A-174 based on γ-methacryloxypropyltrimethoxysilane [13]. In pull-out tests, composites made of glass fibers coated with tetravinylsilane using oxygen plasma showed a 40% increase in bond strength compared to uncoated reinforcement [14]. The plasma polymerization of thin films of 3-glycidoxypropyltrimethoxysilane on glass fibers led to an improvement of interfacial adhesion of glass fiber reinforced epoxy composite. Compared to the composite using thermally cleaned glass fibers, the interlaminar shear strength (ILSS) increased by 110% as the concentration of C-O, C-O-C, and C-H groups increased and the glass fiber surface became rougher [15]. To provide the composites with a controlled interphase and to optimize the bonding with the matrix resin, unsized E-glass fibers were coated with a functional plasma polymer of 5-15 nm thickness. For this purpose, an acrylic acid/1,7-octadiene or an allylamine/1,7-octadiene plasma of different compositions was used. It was found that ILSS was high for the highest functional coating and increased as the thickness of the coating decreased [16]. The authors proposed a model according to which the epoxy resin diffuses into the plasma polymer during curing and forms a semi-interpenetrating network of varying thickness.
Meiners et al. [17] investigated the chemical changes of a commercial silane sizing consisting of bisphenol A diglycidyl ether, fatty acid polyglycol ester and silane coupling agent after 1-7 s treatment with a dielectric barrier discharge in air at atmospheric pressure. They found a functionalization of the sizing through the formation of new hydroxyl, ester, and carbonyl groups. After a short plasma treatment of 1-3 s, the surface tension of the silane-containing coating increased, as did the polar and the disperse components. They were able to demonstrate an improvement of wettability of the plasma-treated glass fibers and of the fatigue behavior of the GFRP. At an average stress level of 25 MPa, the number of cycles to failure doubled after plasma treatment [18].
In practical use, GFRPs are not only subjected to mechanical stress, but are also exposed to environmental and weather influences. Therefore, it is important to know how their properties change under such conditions. Guzman and Brøndsted [19] investigated the effect of moisture on glass fiber reinforced epoxy resin composites. For this purpose, they immersed unidirectional (UD) and multidirectional (MD) laminates in a salt water solution equivalent to sea water for a period up to 8 years. After this long-term conditioning, the samples showed a significant deterioration in elastic properties (UD samples 12-16%, MD samples 7-13%), which was attributed to a degradation of the bonding between the fiber and the matrix.
The effects of moisture absorption and exposure to elevated temperatures was studied on glass-fiber epoxy resin composite tubes. Specimens immersed for four months at 50°C showed a final moisture content of 0.29%, those at 20°C a moisture content of 0.23%. The mechanical properties were generally negatively impacted. Plasticization, hydrolysis, and a lowering of the glass transition temperature of the matrix, resulting in reduced stiffness, were discussed [20].
In another study, the mechanical behavior of glass/epoxy UD laminates under static loading at low temperatures (25°C, -20°C and -60°C) was investigated. For tensile, compressive and in-plane shear loads in longitudinal direction, the maximum mechanical characteristics were found at -60°C [21].
Investigation of the surface degradation mechanism of an epoxy resin sample exposed to boiling water for 1000 hours revealed that the degradation is caused by the dissociation of the molecular chain and the formation of carboxyl groups as result of a reaction with oxygen molecules in the environment [22].
According to the literature, most research is based on plasma treatments that last up to a minute or even longer. On the other hand, already after just a few seconds of plasma treatment, a chemical modification of a silane sizing can be detected, as well as a reduction in the contact angle, allowing better wettability with polar liquids. Therefore, in this article, glass fiber fabrics equipped with sizing were treated with air plasma for only a few seconds in a dielectric barrier discharge (DBE) system and then immediately processed into glass fiber reinforced epoxy resin. The quality of the material obtained in this way was checked through mechanical tests and compared with material that was not plasma-treated. To determine the mechanical properties, tensile, compressive, and bending tests were carried out. The morphology of the various composite materials was examined using scanning electron microscopy (SEM). Changes in the epoxy matrix were recorded using differential scanning calorimetry (DSC).
To obtain information about the composite material in practical use, the influence of temperature changes, UV light and salt solutions on the mechanical properties of the composite material was investigated. The focus of the work was the question of the extent to which a plasma treatment step integrated in production can help make the mechanical characteristics robust against environmental influences. In contrast to many publications, the plasma treatment of the glass fiber fabrics was kept comparatively short for a better integration into a production process.
2. Materials and Methods
2.1. Composite Preparation and Treatment Method
All composite samples were prepared using the vacuum infusion method (vacuum assisted resin transfer molding). A special mold tool manufactured in the mechanic workshop of the HAWK Göttingen was used for the preparation of the 12 composite sheets. Fiberglass fabric KNG 800 M (±45° biaxial scrim) provided from P-D Glasseiden GmbH Oschatz (Germany) and EPIKOTE-Resin MGS RIMR 135 and EPICURE-Curing Agent MGS RIMH 1366 from Momentive Specialty Chemicals Inc. (Columbus, Ohio, USA) were used. Four 318 mm x 210 mm fiberglass fabric cuts were placed over each other to realize a ± 45° fiber orientation. The stacking sequence is shown in Figure 1. The epoxy resin mixture consisted of 320 g resin and 96 g curing agent. Before mixing with the curing agent, the resin was warmed up to 70°C for 20 min. Then the mixture was placed in a vacuum desiccator to remove gas bubbles. After the resin injection the laminate remained 48 h in the device for hardening. To reduce internal tensions, the laminate was tempered for 15 h at 80°C. After removing the side edges, the laminate size was 284 mm x 203 mm x 2.5 mm.
Two types of composites were produced. For the GFRP samples, the commercially available glass fiber fabric coated with a silane sizing was used. For the plasma-treated GFRP (pt-GFRP) composites, the glass fiber fabric was pre-treated in an air plasma generated with a dielectric barrier discharge system. The power supply JK50kV-P (Ingenieurbüro Jürgen Klein, Aachen, Germany) was pulsed with a frequency of 17 kHz, the pulse width was 2 µs, the distance between plasma head and fiberglass fabric was 4 mm. The plasma head was moved with a constant velocity so that a plasma treatment time of 3 s resulted for each side, front and back of the fiberglass fabric. The reinforcing material was processed into the composite immediately after the plasma treatment within 30 min.
For comparison, five sheets of epoxy resin were produced using the same mold tool for the infusion of the resin under vacuum conditions.
2.2. Composite Characteristics and Artifical Weathering
The composites were characterized for the following physical properties: fiber volume fraction and glass transition temperature. Mechanical properties of epoxy resin and composite samples were investigated using tensile test, compressive test, and bending test. SEM images were taken to investigate the fracture zone.
The fiber volume ratio of each GFRP sample was determined using the burn-off method according to DIN EN ISO 1172 to investigate five 10 mm x 5 mm x 2.5 mm large samples taken at different positions of the plate. The samples were put in crucibles and heated in a muffle furnace Heraeus Thermicon P (Hanau, Germany) for two hours at 650°C. The weight of the composite samples was measured and after pyrolysis of the epoxy resin the weight of the remaining glass fibers. Considering the density of the fibers (2.5 g/cm3) and the matrix (mean value according to the data sheet 1.16 g/cm3) the fiber volume fraction was calculated.
For thermal weathering, the samples were placed in a closed PP box and stored in a drying cabinet Memmert GmbH (Schwabach, Germany) for 8 h at 70°C followed by 16 h storage at -18°C in a refrigerator. This treatment cycle was repeated for 30 days.
The artificial weathering with UV radiation was carried out in accordance with DIN EN ISO 4892-3. Exposure to UV was realized using a UV lamp UV-8 S/L of Herolab (Wiesloch, Germany) working at 254 nm and 365 nm wavelength. According to the manufacturer, the intensity of the UV radiation is at 150 mm distance from the lamp 950 µW/cm2 (315 nm) and 680 µW/cm2 (280 nm), respectively. The distance between the samples and the UV source was 100 mm. The samples were exposed for 30 days with a daily exposure time of 8 h.
NaCl and KOH provided from Merck KGaA (Darmstadt, Germany) were dissolved in distilled water to achieve 20 weight-% solutions. The laminate samples were placed in the solutions so that they were completely covered and stored for 30 days in covered PMMA boxes at ambient temperature.
The number of normal and plasma-treated composite samples for each weathering experiment was 8, the number of reference samples 5 to 6.
2.3. Static Mechanical Tests, SEM and DSC
All untreated and plasma-treated GRFP were investigated using the tests described in the following section. For better comparison, control and weathered samples were taken from the same composite plate. The static mechanical tests were carried out on a universal testing machine Instron 5567 (Instron, Norwood, Massachusetts, USA). The software Bluehill was used for control of the experiments and evaluation of the measuring data. To be able to statistically confirm the results, at least five samples were examined for each type of mechanical test. The test specimens were milled from the plates and their side edges were ground and polished.
For tensile testing, specimens 120 ± 0.5 mm long, 10 ± 0.5 mm wide, and 2.5 ± 0.2 mm thick were tested at a constant crosshead speed of 2 mm/min with a span length of 40 mm. Specimens of the same dimensions were used for the compressive strength test, but in accordance with DIN EN ISO 14126 the span length was 10 mm. The crosshead speed was 1 mm/min. After reaching the maximum load, the measurement was stopped manually. With uniaxial tensile loading, a biaxial stress arises in every +45° and -45° layer. The same applies to the compression test. The measured maximum loads in the tensile and compression test are an expression of the strength of the laminate samples and are well suited for comparison purposes.
The flexural test was carried out as three-point bending test in accordance with DIN EN ISO 14125. The radius of the bending punch was 5 mm and that of the two supports was 2 mm. According to the sample geometry (24 mm x 12 mm x 2.5 mm), the distance between the two supports was 22 mm and the crosshead speed was 1 mm/min. The apparent flexural strength was calculated according to Formula (1) for rectangular plastic samples:
with σ flexural strength, F total force at failure, L length of support span, b broadness of the sample, d thickness of the sample. During the three-point bending test of ±45° laminates, a shear stress occurs at the fiber matrix boundary layer. Therefore, the interlaminar shear strength was also calculated for the two types of laminate samples according to Formula (2):
with τmax interlaminar shear stress, F force, b broadness of the sample, h thickness of the sample.
σ = 3 F L / (2 b d2),
τmax = 3 F / (4 b h),
Although mixed loads occur in tensile, compressive, and bending test of ±45° laminates, for simplicity the measured strengths should be referred to as tensile, compressive, and flexural strengths.
Light microscopy images were taken with a stereo microscope Stemi 508 (Zeiss, Germany) using a USB camera and Axiovision software. To document the fracture zone, images were taken with an HP scanner at 1200 DPI and 8 gray levels. The gray value was evaluated using IrfanView 64 software and ranges from 0 (black) to 255 (white).
The electron micrographs were generated with a Phenom Pro G6 Desktop SEM (Thermo Fisher Scientific, Waltham, Massachusetts, USA) in high vacuum mode with an accelerating voltage of 15 kV. Images with 1000x and 2000x magnification were recorded after the mechanical test. The samples were sputtered with a thin gold coating to omit charging effects of the non-conducting specimen.
Differential scanning calorimetry investigations were carried out at a DSC 3+ (Mettler Toledo) using software STARe. Samples of 20 ± 1 mg with the dimensions 4 mm x 4 mm x 1.3 mm were investigated. The weight was determined using a precision balance TGA/SDTA851 (Mettler Toledo). To determine the glass transition temperature, the temperature program given in Table 1 was applied. Heating and cooling rates were 20 K/min. During the whole measurement the sample room was flushed with nitrogen (30 mL/min). The measurement curves were evaluated according to DIN EN ISO 11357-2 using software STARe. Since the endothermic step of the glass transition is superimposed by a relaxation peak, the second heating was also evaluated, as recommended in DIN standard.
3. Results and Discussion
During the vacuum injection process, a slightly faster resin flow into the fiberglass fabric stack can be observed with the plasma-pretreated glass fibers. However, the fiber volume fraction of both types of the composite material is almost similar, with 50.6 ± 1.0 % for the laminates prepared without plasma treatment (5 samples per sheet, 7 sheets) and 49.9 ± 1.2 % for the samples with this additional surface treatment step (5 samples per sheet, 5 sheets). Small differences in quality become apparent (see Table 2) when comparing the mechanical properties of the composite materials before they are exposed to thermal, UV or chemical stress.
The tensile strength of the plasma-pretreated composite samples is approximately 6% higher than that of the untreated samples. The stress-strain diagram shows that the fracture occurs between 8% and 11% elongation. Samples not pretreated with plasma break in the range of 5% to 11% elongation. In addition to the slightly increased tensile strength, the pretreated composite samples have a more homogeneous quality, as can be seen from the standard deviation values. The pretreated composite samples also have a slightly enhanced compressive strength. The difference is smaller and amounts to about 3%. The flexural strength is almost 10% greater when the fiberglass fabric is treated with an air plasma. Thus, all three investigated mechanical characteristics are slightly improved when the fiber reinforcement material is modified before the injection with the epoxy resin.
Typical stress-strain curves are plotted in Figure 2. The two laminate types show a rather similar behavior under load, also the maximal loads obtained in tensile and compression tests differ only slightly. In both tests, the ±45° laminates are at the same time subjected to shear stress. Uniaxial loading creates a biaxial stress state. The small drops in the stress-strain curves are caused by accumulation of inter fiber failures. The first inter fiber failure is subject to many influencing factors. The fracture may occur due to a defect in the laminate, such as pores, local variations in fiber volume content, or stress concentration at the fiber/matrix interface. A clouding of the originally clear sample makes the damage visible. Although the infusion resin was prepared very carefully and degassed under vacuum, some voids caused by gas bubbles could not be avoided (see Figure 3). The last load drop observed in the tensile test shows the complete failure of the test specimen. The compressive test was stopped manually after reaching the maximal load. Similar observations were also made during the bending test. Before a complete failure is observed, several load drops occur.
The light micrograph of a GFRP sample (Figure 3) before weathering and mechanical stress shows the presence of gas bubbles of different sizes in the resin matrix. Near the warp thread they reach dimensions of almost 500 µm.
For all following investigations, 5-6 reference samples were taken from the same composite plate in order to have a direct comparison between the composite characteristics before and after exposure to the different climates. This explains the small deviations from the data given in Table 2.
3.1. Thermal Treatment
Storage of the composite under a daily temperature change between -18°C and +70°C has a positive effect on the material properties. Untreated as well as plasma-treated GFRP show a slight increase of all three mechanical characteristics (see Figure 4). The largest increase is observed in the compressive test. This enhancement of mechanical characteristics is caused by small changes of the polymer matrix. Obviously, the heat treatment caused a post-hardening of the composite material. Although the glass transformation temperature of epoxy resin is a little bit higher, the storage at 70°C allows further reactions combined with further network building. This should become obvious in the DSC experiment discussed below.
This result agrees well with the observations of Carbas et al. [23], who studied the influence of curing temperature on the glass transition temperature and mechanical properties of epoxy adhesives. Samples treated at a temperature below the value at which a fully cured network is achieved show an increase in strength and stiffness after further treatment at a higher temperature.
3.2. UV exposure
The total irradiation time was 240 hours. Irradiation with UV light was interrupted overnight to better simulate the daily rhythm. As can be seen from Figure 5, the mechanical strength values of the resin samples and the laminate samples only change slightly due to UV weathering and are sometimes a bit larger and sometimes a bit smaller. The deviating effects can be attributed to different changes in the thermoset. Bond cleavage, formation of radicals and formation of new chemical bonds are possible reactions in the resin that lead to opposite effects. The epoxy matrix, produced by cross-linking reaction of a diglycidyl ether of bisphenol-A (DGEBA) with a curing agent consisting of an amine mixture (alkyletheramine, cycloaliphatic amine, ethyleneamine), has a very good UV stability. It shows practically the same strength values and remains unaffected. However, a slight yellow discoloration indicates a certain degradation of the polymer. It is well known from the literature that epoxy resins are vulnerable to UV degradation due to the presence of aromatic groups. Irradiation leads to chain scission and rapid crosslinking reaction [24]. The UV irradiation induces color modifications of DGEBA epoxy resins proportional to the exposure time. The effect is already significant after 100 h of irradiation, and its strength depends on the structure of the amine hardener used [25]. The high content of cycloaliphatic amine (30-50 wt.-%) in the hardener used in this study and the presence of 15-20% 1,6-bis(2,3-epoxypropoxy)-hexane in the bisphenol-A resin component support the UV stability of the cured epoxy resin. The yellowing of the laminate samples and the decrease of mechanical strength are significantly lower compared to laminates made with epoxy resin that is based on unmodified bisphenol A [26]. Under the influence of UV radiation, compressive and flexural strength of the untreated GFRP increase by 4.8% and 3.1%, respectively, while the tensile strength decreases by 2.2%. In contrast, tensile and compressive strength of plasma-pretreated GFRP increase by 3.3% and 7.0%, respectively, and the flexural strength decreases slightly by 1.0%, which is within the error limits. In contrast to a reported decrease in tensile strength by nearly 23% after 180 hours of UV exposure [26], the UV stability of the samples investigated here is remarkably higher.
3.3. Effect of Chemical Solutions
To study the effect of aggressive aqueous media, the samples were exposed to a 20 wt.% sodium chloride solution and a 20 wt.% potassium hydroxide solution. The salt solution is used to replace seawater, and the alkaline solution is chosen because of the low stability of silicate glass towards hydroxyl ions.
Storage of epoxy samples and composite materials in a sodium chloride solution (see Figure 6) leads to a loss of mechanical strength of all investigated sample types, epoxy resin as well as untreated and plasma-pretreated GFRP. Tensile, compressive, and flexural strengths of the epoxy samples are reduced by 8.2%, 3.0% and 4.8%, respectively. The penetration of the solution into microcracks of the epoxy resin and the hydrolysis reaction of the silicate glass reduce the stability of the matrix material and the reinforcing material. This effect is a little stronger in the presence of KOH (see Figure 7). Tensile, compressive, and flexural strength of the matrix material are reduced by 10.0%, 3.1% and 5.0%, respectively.
The high concentration of hydroxyl ions causes degradation reactions of epoxide resin and silicate glass. The originally higher mechanical characteristics of the plasma-treated material are nearly completely lost under the influence of the alkaline solution. The damaging influence of storage in aqueous solutions is stronger for plasma-treated samples. This means that the original improvement of the fiber matrix adhesion is significantly reduced by the interaction with NaCl and KOH solutions. It should also be noted that, compared to the long-term test of Guzman and Brøndsted [19], significant losses in strength were observed for both solutions after a relatively short treatment period.
A look at the mechanical characteristics of the epoxy resin samples shows improved properties after thermal treatment, practically no changes after UV exposure, and a reduction of the values after storage in NaCl and KOH solutions. Analogous behavior is measured for both types of composite materials and is reflected in the ILSS values (see Table 3). The shear strength of the plasma-pretreated GFRP is about 9% higher than that of the conventionally produced GFRP material. After thermal, UV, NaCl and KOH treatment this advantage with respect to the untreated GFRP is reduced to 7.3%, 1.7%, 6.5% and 6.3%, respectively (see Table 3).
3.4. Scanning Electron Microscopy and Light Microscopy
SEM images of two mechanically tested reference samples are given in Figure 8 to show the morphology in the fracture zone. When comparing the GFRP sample with the pt-GFRP sample after the tensile test, no major differences can be seen at first glance. Before the mechanical test, the fibers were well embedded in the resin. The thickness of the matrix layer between individual fibers of a layer was small and was on the order of one micrometer. After the test, some broken fibers and resin grooves could be seen where the fibers were delaminated. Differences in the fiber matrix adhesion of the two samples could be responsible for the different morphology of the matrix material. The GFRP sample shows grooves in the resin matrix and breaks in the fibers, while the pt-GFRP sample also shows scale-like structural elements in the resin matrix, which are presumably due to a better adhesion in certain areas. The SEM images are consistent with the results of Cuaiman [27] on the fracture mechanism of glass fiber reinforced epoxy resin. As can be seen, in both sample types there is delamination of the individual fibers and, after the matrix has transferred the load, fractures of the fibers. The fracture zone is large and easily recognizable due to the changed light refraction behavior.
Looking at the light transmission through samples after the compression test gives the following result. The GFRP samples show a larger fracture area than comparable pt-GFRP samples. Further, more glass fiber layers are damaged. This visual impression is confirmed by the gray values of the optical scan. As an example, Figure 9 displays some images of samples whose gray values correspond to the respective average value of the series of measurements. After compression test, thermally treated GFRP samples have a gray value of 138 ± 13 in the fracture area, while pt-GFRP samples treated in the same manner have a gray value of 100 ± 6. The fracture area of unweathered GFRP and pt-GFRP reference samples after the bending test is rather similar. The examination of the GFRP samples gives a gray value of 86 ± 4 and of the pt-GFRP samples of 89 ± 3. Thus, the difference is in the order of the error limits.
3.5. Differential Scanning Calorimetry
Changes of the resin matrix become visible when comparing its glass transition temperature Tg. Thermoset plastics such as epoxy transform from a hard and brittle state to a rubbery state when heated. The glass transition temperature depends on the degree of crosslinking of the polymer and can be influenced, for example, by thermal treatment of the polymer. By increasing the degree of crosslinking, the free volume is reduced and the mobility of the molecular chains is restricted. Typical DSC curves of two GFRP samples are shown in Figure 10. All samples were heated twice and both DSC curves were evaluated. The glass transition temperature was determined using the half-step height method according to ISO 11357-2. When heated the first time, an overheating peak occurs, which is due to the release of mechanical tensions within the sample. This effect is avoided when the sample is reheated. The Tg values obtained from the first and second heating curves differ slightly, but the changes in the glass transition temperature observed after sample weathering show the same tendency. When comparing the Tg values of epoxide resin, GFRP and plasma-treated GFRP, a uniform result is visible (see Table 4, average of two samples). In all cases, thermal treatment leads to an increase in the value due to post-hardening of the epoxy resin, while exposure to UV radiation, NaCl solution and KOH solution reduces the transition temperature. UV radiation as well as aqueous solutions lead to a dismantling of the network structure of the polymer matrix.
4. Conclusions
Fiber glass fabrics equipped with a silane sizing were used to produce fiber reinforced epoxy resin composites using vacuum injection processes. In some of the samples, the fiber glass was treated with an air plasma before the resin was injected. Tensile, compressive, and bending experiments showed slightly improved mechanical properties of the plasma-pretreated samples and improved homogeneity of the samples.
Studies on the influence of artificial weathering of the composite samples through temperature changes, UV radiation as well as NaCl and KOH solutions on mechanical properties have shown:
- Tensile strength, compressive strength, flexural strength, and interlaminar shear strength of plasma-pretreated composites are slightly greater.
- Thermal treatment proves to be a form of post-curing and improves the mechanical properties of both sample types, untreated and plasma-treated GFRP. DSC measurements confirm an increase in the glass transition temperature.
- UV exposure leads to somewhat smaller and inconsistent changes. The samples have a good stability against UV radiation.
- Both storage in NaCl solution and in KOH solution leads to a deterioration of mechanical properties of both types of samples, with the effect being stronger in the KOH solution. Epoxy matrix as well as reinforcing glass fibers are damaged.
Although all mechanical properties of the plasma-treated samples are slightly greater than those of the untreated samples, the additional step of a short-term plasma treatment of the glass fiber fabric does not increase the resistance of the GFRP to environmental influences.
Author Contributions
Conceptualization, C.L., G.O.; methodology, C.L., S.H., G.O.; validation, C.L., G.O.; investigation, C.L.; resources, G.O., S.H.; writing—original draft preparation, G.O.; writing—review and editing, G.O.
Funding
This research received no external funding.
Acknowledgments
The authors thanks Dr. Roger Skarsten for proofreading the manuscript.
Conflicts of Interest
The authors declare no conflicts of interest.
References
- Abbood, I.S.; Odaa, S.A.; Hasan, K.F.; Jasim, M.A. Properties evaluation of fiber reinforced polymers and their constituent materials used in structures – A review. Mater. Today: Proc. 2021, 43, 1003-1008. [CrossRef]
- The European Market for Fiber Reinforced Plastics/Composites in 2022, CU reports 02/2023, 02.05.2023. Available Online: https://composites-united.com/der-europaeische-markt-fuer-faserverstaerkte-kunststoffe-composites-2022/ (accessed on 16 April 2024).
- Thomason, J.L. Glass fibre sizing: A review. Composites Part A 2019, 127, 105619. [CrossRef]
- Li, R.; Ye, L.; Mai, Y.-W. Application of plasma technologies in fibre-reinforced polymer composites: A review of recent developments. Composites Part A 1997, 28A, 73-86.
- Ivanova, V.P.; Andreevskaja, G.D.; Friedrich, J.; Gähde, J. Untersuchungen zum Einfluß einer Oberflächenmodifizierung von Fasermaterialien im nichtthermischen Plasma einer Hochfrequenz-Entladung auf die Adhäsionsfestigkeit zu Epoxidharz. Teil I: Messung der Adhäsionsfestigkeit. Acta Polymerica 1980, 31, 752-756. [CrossRef]
- Friedrich, J.; Gähde, J.; Ivanova, V.P.; Andreevskaja, G.D.; Ebert, I.; Reiner, H.-D.; Richter, K. Untersuchungen zum Einfluß einer Oberflächenmodifizierung von Fasermaterialien im nichtthermischen Plasma einer Hochfrequenz-Entladung auf die Adhäsionsfestigkeit zu Epoxidharz. Teil II. Veränderung der Struktur von Glasfasern nach Plasmabehandlung. Acta Polymerica 1981, 32(1), 36-40. [CrossRef]
- Ihara, T.; Matsuoka, T.; Iriyama, Y. Fundamental study on fiber-reinforced epoxy composites using glass fabric treated by low-temperature ammonia plasma. Journal of Adhesion Science and Technology 1996, 10:9, 823-832. [CrossRef]
- Iriyama, Y.; Taira, M.; Ihara, T.; Matsuoka, T. Effect of Plasma Treatment of Glass Fabrics on the Mechanical Strength of Glass-Fiber-Reinforced Epoxy Composites. J. Photopolym. Sci. Technol. 1997 (10:1) 139-142.
- Nakahira, A.; Suzuki, Y.; Ueno, S.; Akamizu, H.; Kijima, K.; Nishijima, S. Effect of Plasma Treatment on Microstructure and Surface of Glass for Plastic-Based Composite. Science and Engineering of Composite Materials 1999, 8(3), 129-136.
- Ermel, V.; Kurrat, M. Plasmabehandlung von Glasfasergelege. Vakuum in Forschung und Praxis 2009, 21(2), 27-31. [CrossRef]
- Haji, A.; Hadizadeh, M.; Ferasat, E.; Movaghatian, D. Effect of Plasma Treatment on Glass Fiber/Epoxy Resin Composite. In Proceedings of the 2nd International Congress of Innovative Textiles (ICONTEX 2019), Çorlu, Turkey, 17–18 April 2019.
- Mäder, E.; Grundke, K.; Jacobasch, H.-J.; Wachinger, G. Surface, interphase and composite property relations in fibre-reinforced polymers. Composites 1994, 7, 739-744.
- Cech, V.; Prikryl, R.; Balkova, R., Grycova, A.; Vanek, J. Plasma surface treatment and modification of glass fibers. Composites: Part A 2002 (33) 1367-1372.
- Hoferek, L.; Janecek, P.; Cech, V. Plasma coating of glass fibers used for polymer composites. Proceedings of the 19th International Symposium on Plasma Chemistry Poster Session 1, ID: P1.8.35 2009. https://www.researchgate.net/publication/267207852.
- Sever, K.; Sarikanat, M.; Seki, Y.; Gülec, H.A.; Mutlu, M.; Tavman, I.H. Improvement of Interfacial Adhesion of Glass Fiber/Epoxy Composite by Using Plasma Polymerized Glass Fibers. The Journal of Adhesion 2010, 86:9, 915-938. [CrossRef]
- Liu, Z.; Zhao, F.; Jones, F. Optimising the interfacial response of glass fibre composites with a functional nanoscale plasma polymer coating. Composites Science and Technology 2008, 68, 3161-3170.
- Meiners, A.; Ohms, G.; Leck, M.; Vetter, U.; Abel, B. Modifying Glass Fiber Size by Plasma Treatment. J. Adhesion Sci. Technol. 2012, 26, 1611-1627. [CrossRef]
- Meiners, A.; Leck, M.; Ohms, G. Optimization of the fiber-matrix adhesion by atmospheric-pressure plasma treatment. In Proceedings of the 5th Asia-Europe Symposium on Processing and Properties of Reinforced Polymers, Dresden, Germany, 2011.
- Guzman, V.A.; Brøndsted, P. Effects of moisture on glass fiber-reinforced polymer composites, Journal of Composite Materials 2015, 49(8), 911–920. [CrossRef]
- Ellyin, F.; Maser, R. Environmental effects on the mechanical properties of glass-fiber epoxy composite tubular specimens. Composites Science and Technology 2004, 64, 1863-1874. [CrossRef]
- Torabizadeh, M.A. Tensile, compressive and shear properties of unidirectional glass/epoxy composites subjected to mechanical loading and low temperature services. Indian J. Eng. Mater. Sci. 2013, 20, 299-309.
- Lim, K.-B.; Lee, D-C. Study of the Surface Degradation Mechanism of an Epoxy Insulator Exposed to Water. Journal of the Korean Physical Society 2000, 37(1), 49-54.
- Carbas, R.J.C.; Marques, E.A.S.; da Silva, L.F.M.; Lopes, A.M. Effect of Cure Temperature on the Glass Transition Temperature and Mechanical Properties of Epoxy Adhesives. The Journal of Adhesion 2014, 90:1, 104-119. [CrossRef]
- Gesner, B.D.; Kelleher, P.G. Oxidation of bisphenol A polymers. J. Appl. Polym. Sci. 1969, 13(10), 2183–2191. [CrossRef]
- Varganici, C.-D.; Rosu, L.; Rosu, D.; Rosca, I.; Ignat, M.-E.; Ignat, L. Surface Degradation of DGEBA Epoxy Resins Cured with Structurally Different Amine Hardeners: Effect of UV Radiation. Polymers 2024, 16, 67. [CrossRef]
- Naveen, R.; Kumar, M.; Ramesh, M.; Abinaya, R.; Prasath, M.S. An investigation on effect of ultraviolet (UV) rays on mechanical properties of epoxy laminates. materials today: Proceedings 2023, ISSN 2214-7853. [CrossRef]
- Cuaiman, T.; Karin, P.; Ohtake, N.; Akasaka, H.; Larpsuriyakal, P.; Prakymoramas, N.; Rojsaten, J.; Thanomjitr, D.; Kaewket, S. Mechanical property and fracture mechanism of glass fiber reinforced polymer and carbon fiber reinforced polymer. IOP Conf. Ser.: Mater. Sci. Eng. 2019, 501, 012024.
Figure 1.
(a) Fiberglass fabric; (b) Stacking of the fiberglass fabric in the laminate.
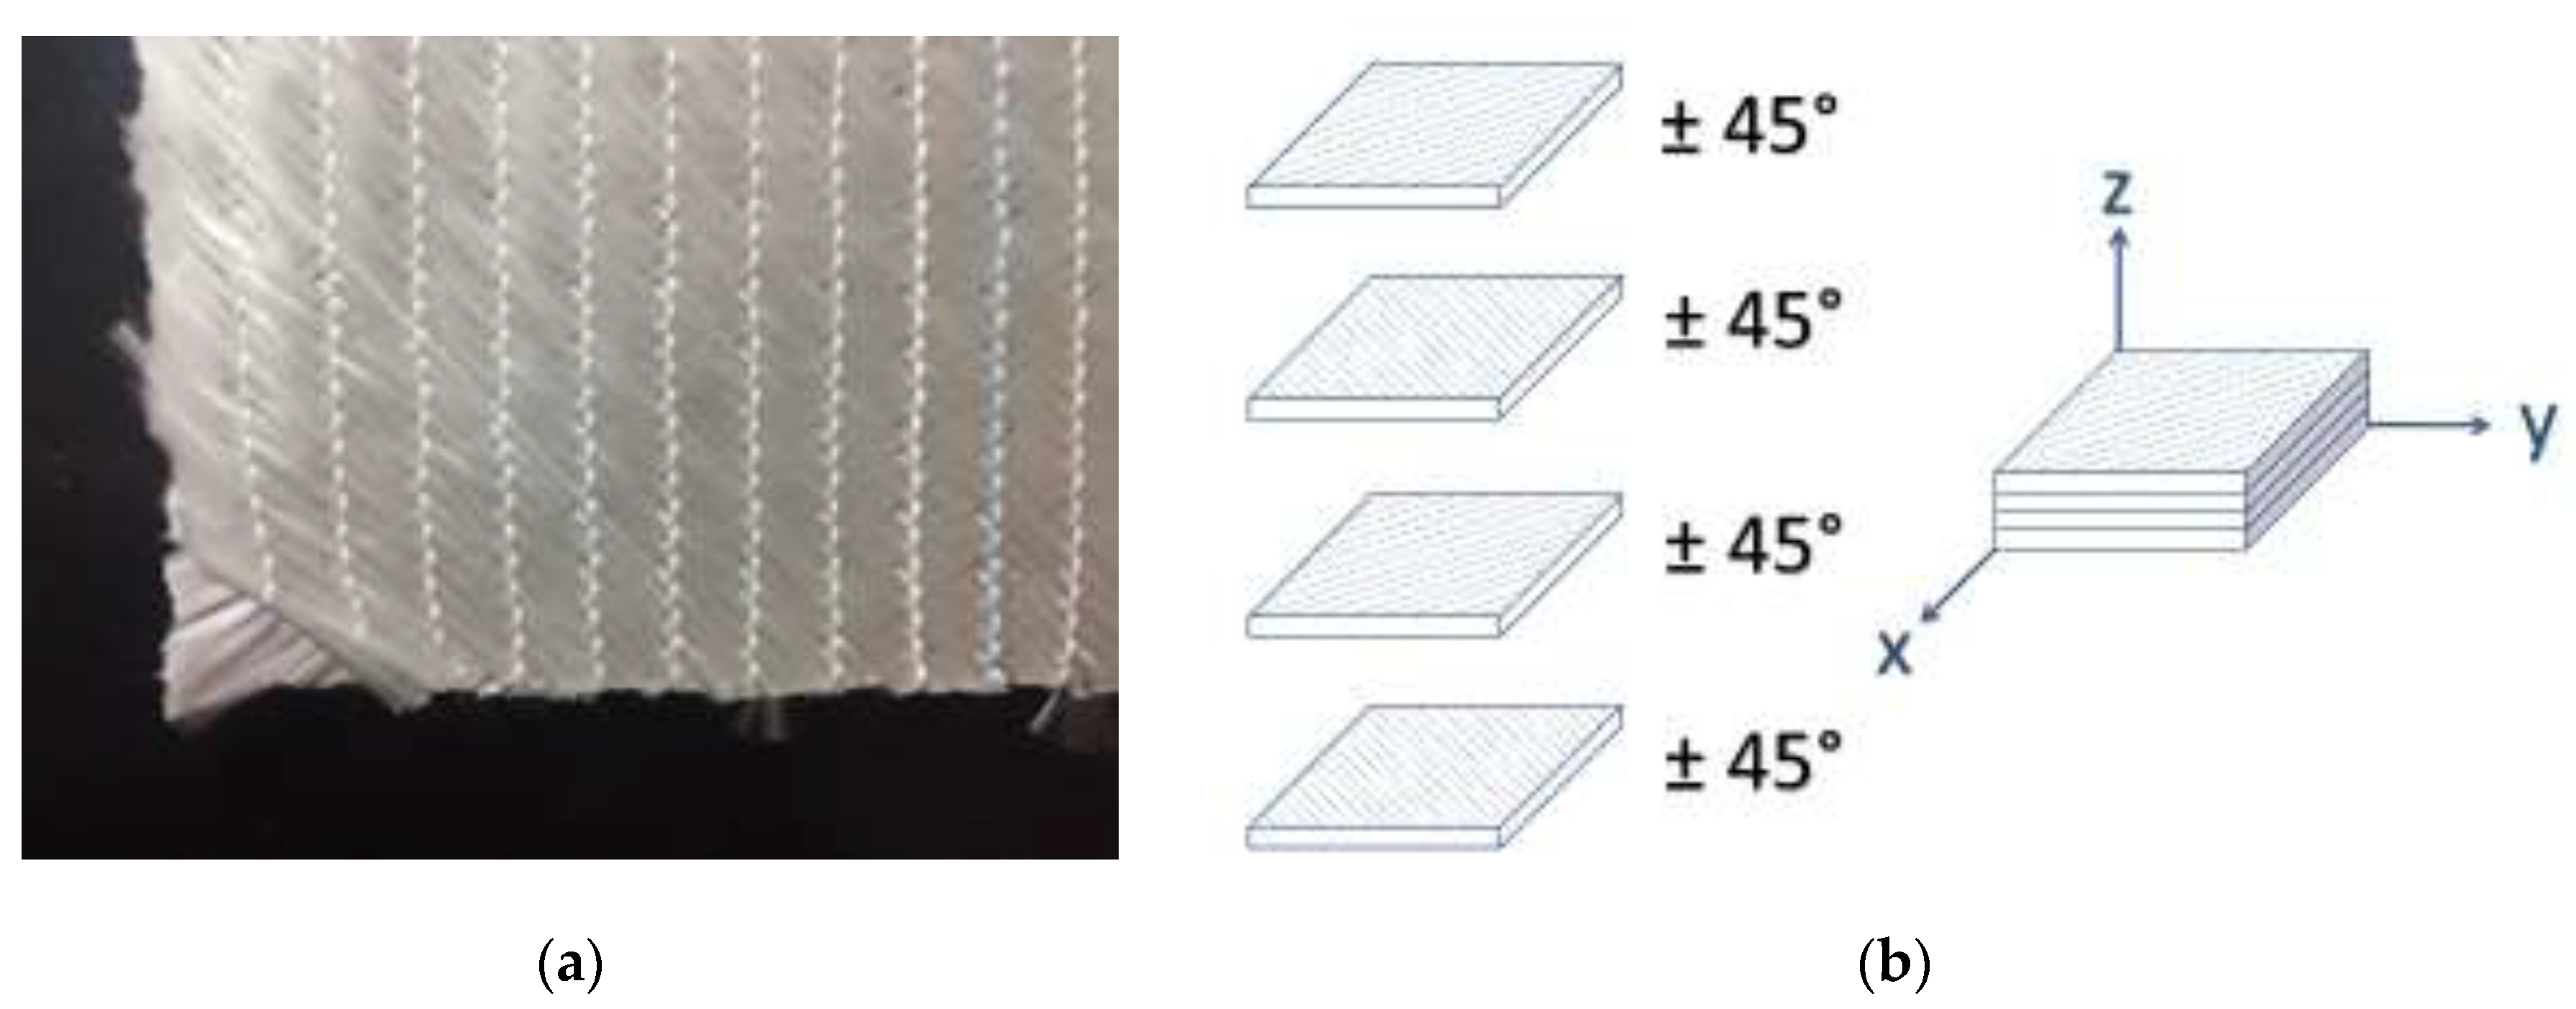
Figure 2.
Stress-strain curves of epoxy resin (ER), GFRP and pt-GFRP under (a) tensile, (b) compressive and (c) bending loads.
Figure 2.
Stress-strain curves of epoxy resin (ER), GFRP and pt-GFRP under (a) tensile, (b) compressive and (c) bending loads.
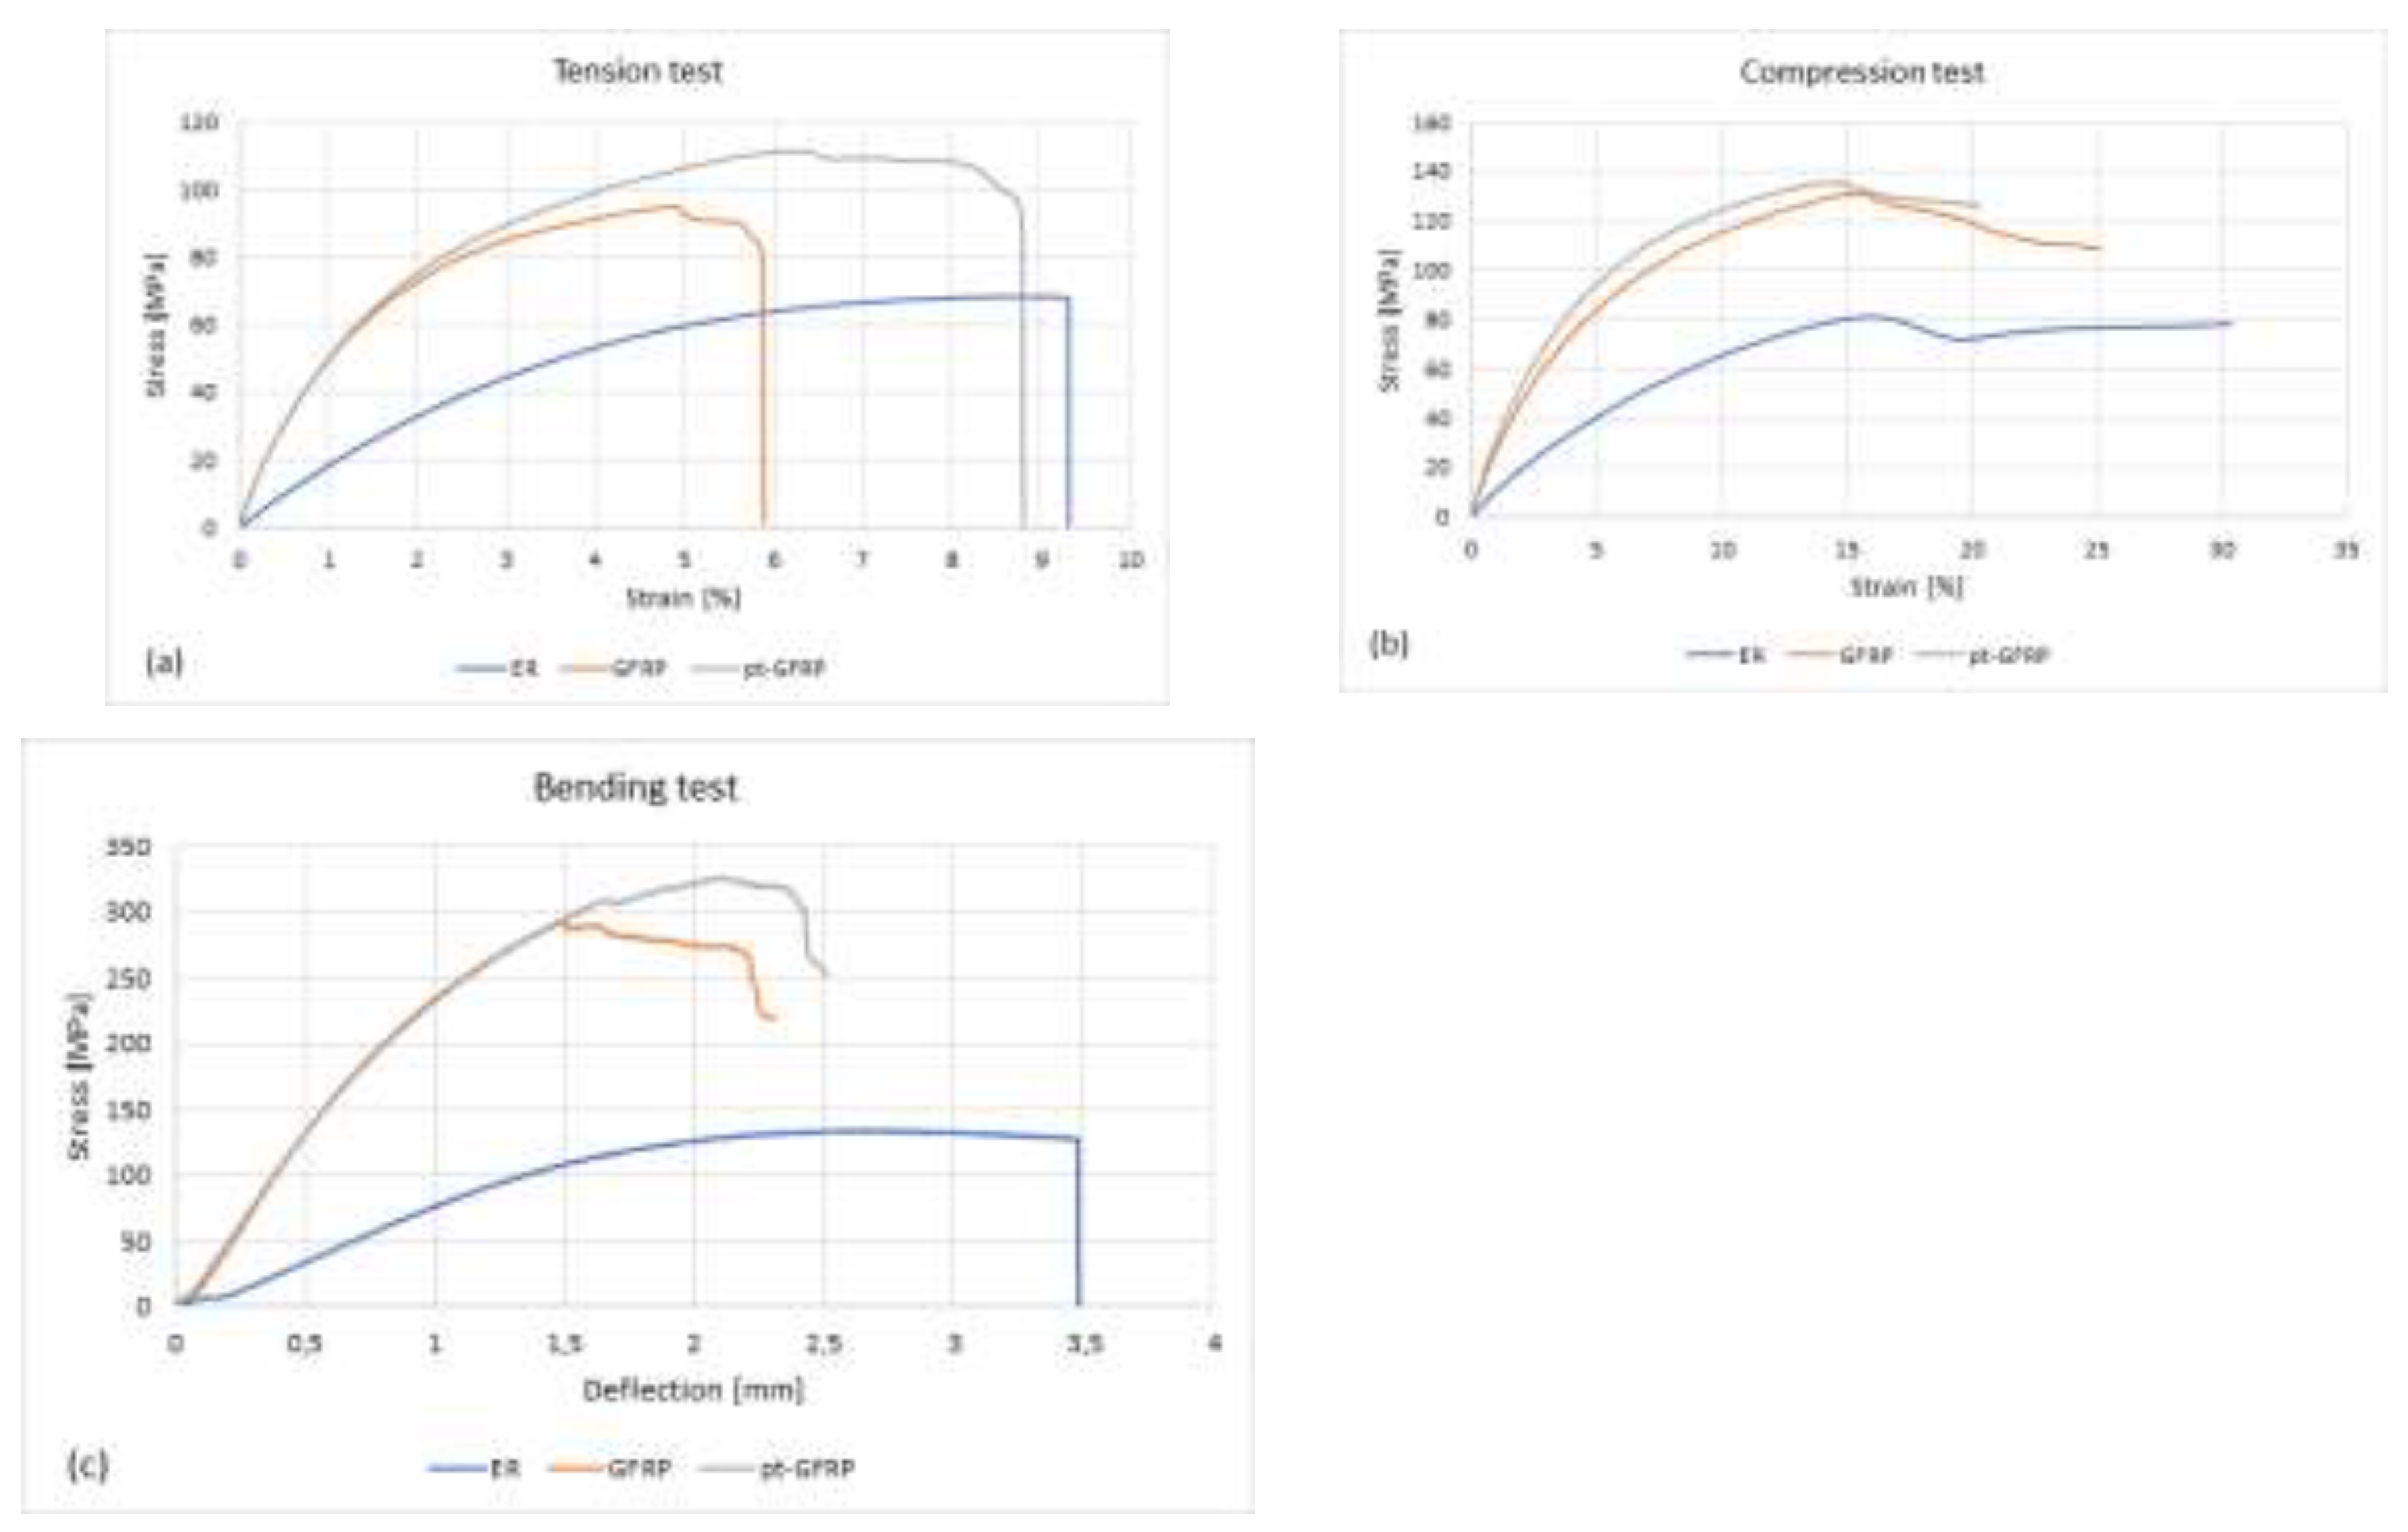
Figure 3.
Microscopy image of a GFRP sample with gas bubbles.
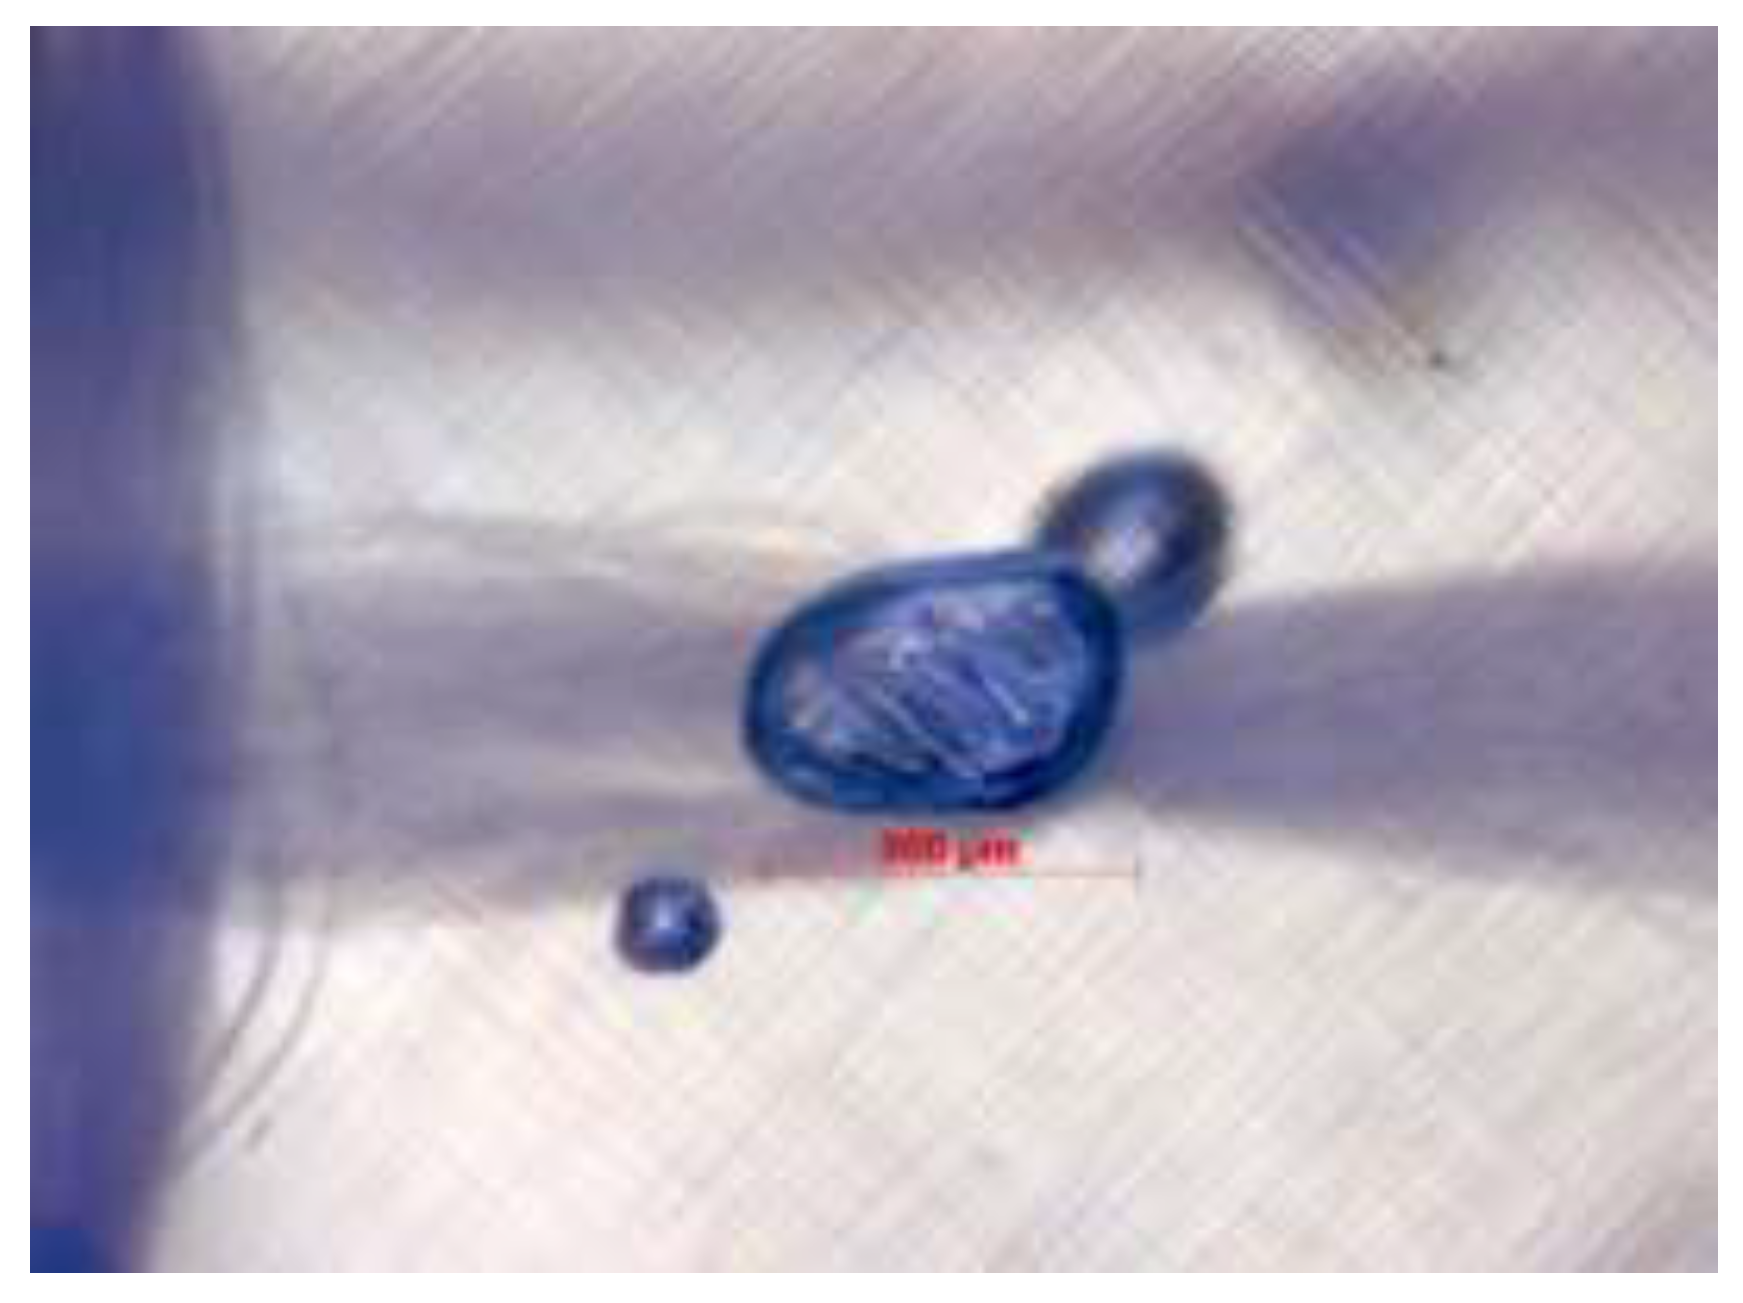
Figure 4.
Influence of thermal treatment on mechanical characteristics of epoxy resin, untreated and plasma-pretreated GFRP.
Figure 4.
Influence of thermal treatment on mechanical characteristics of epoxy resin, untreated and plasma-pretreated GFRP.
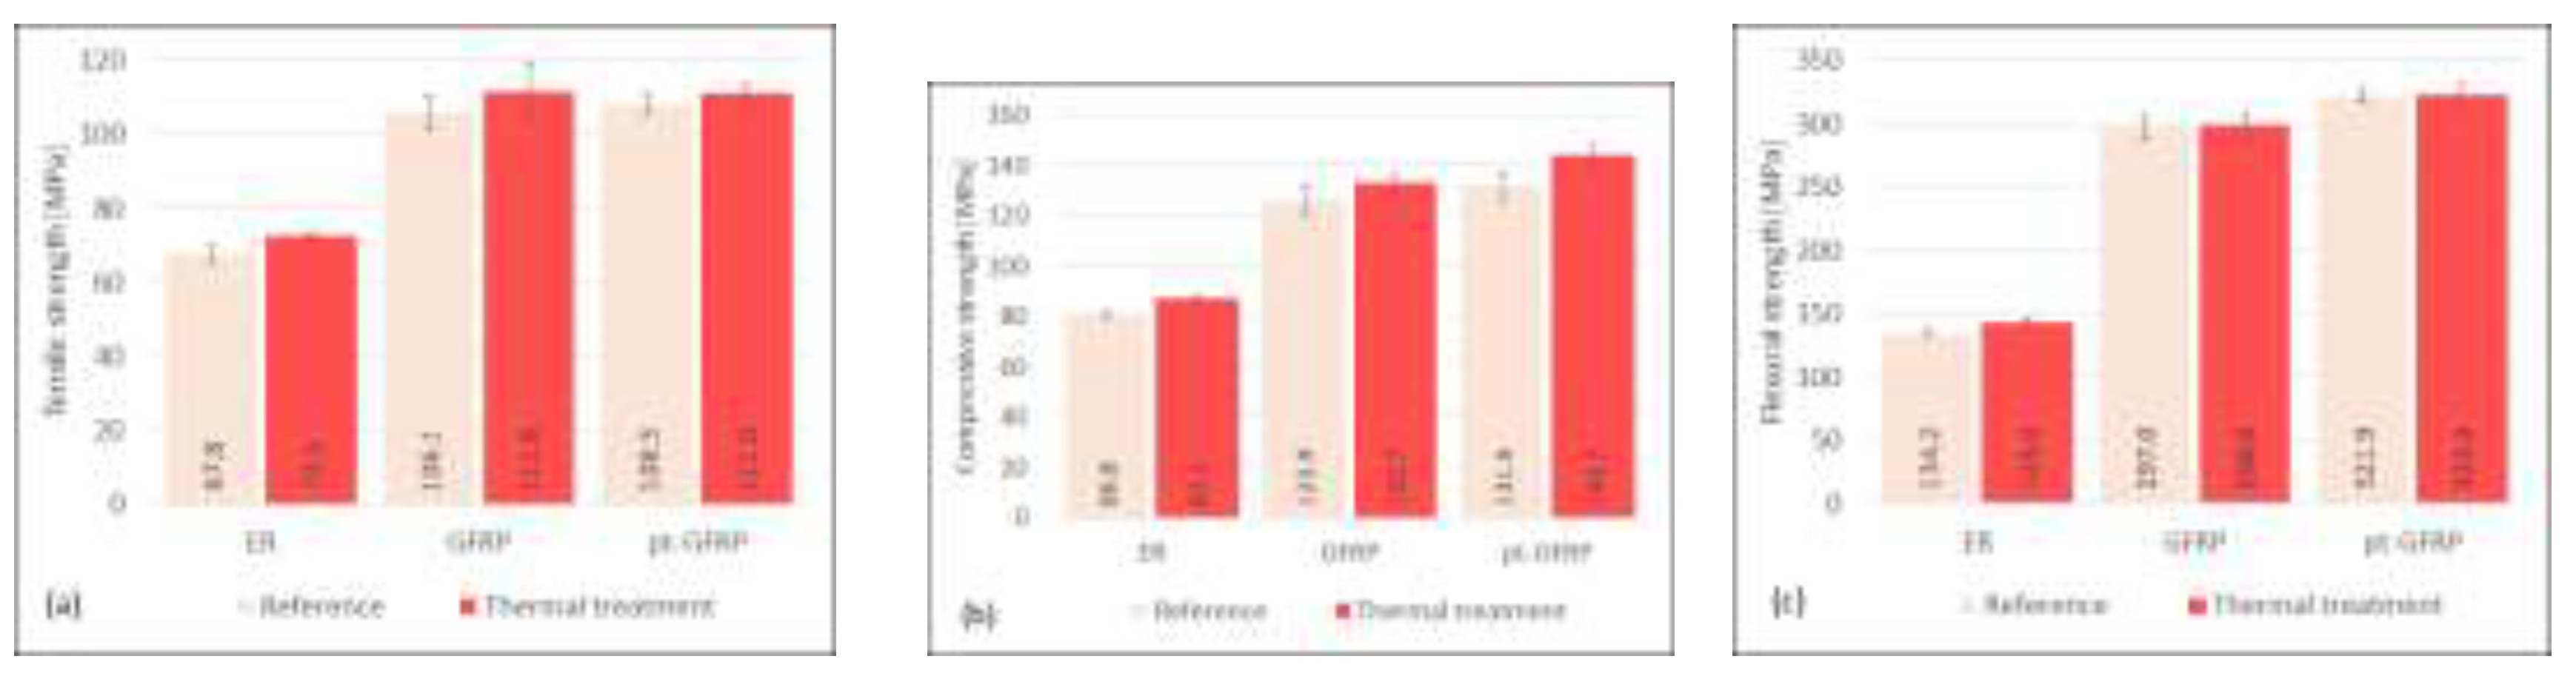
Figure 5.
Influence of 240 h exposure to UV radiation on mechanical characteristics of epoxy resin, untreated and plasma-pretreated GFRP.
Figure 5.
Influence of 240 h exposure to UV radiation on mechanical characteristics of epoxy resin, untreated and plasma-pretreated GFRP.
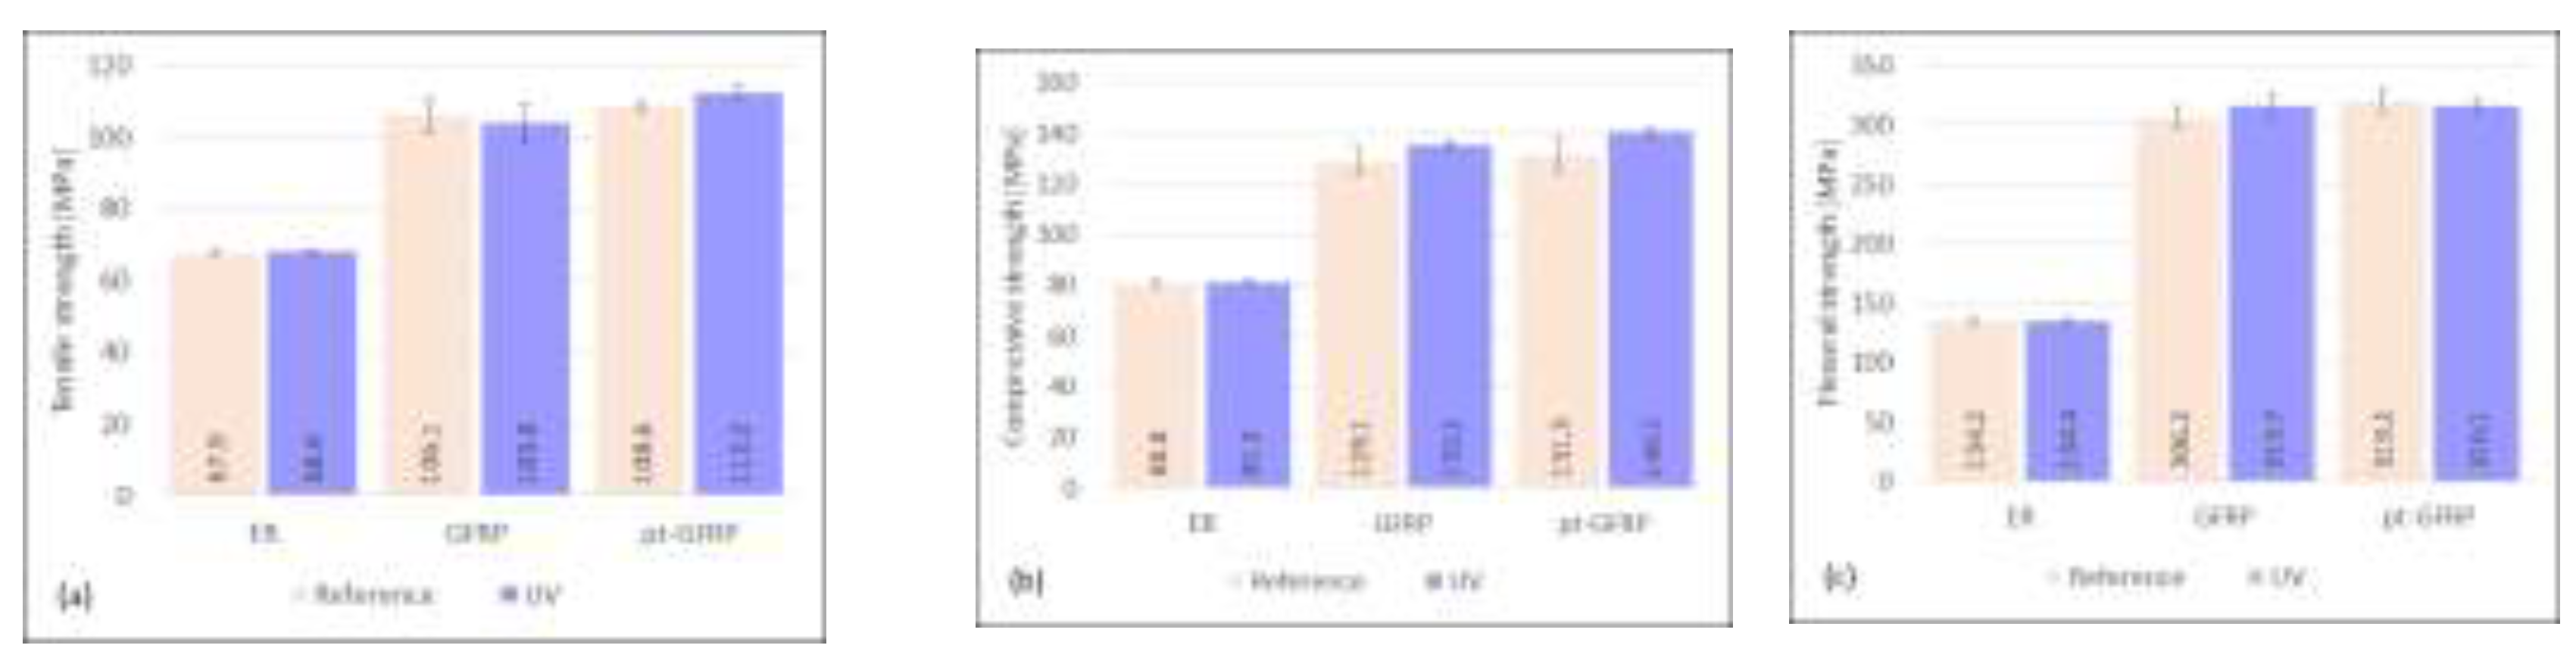
Figure 6.
Influence of NaCl-solution on mechanical characteristics of epoxy resin, untreated and plasma-pretreated GFRP.
Figure 6.
Influence of NaCl-solution on mechanical characteristics of epoxy resin, untreated and plasma-pretreated GFRP.
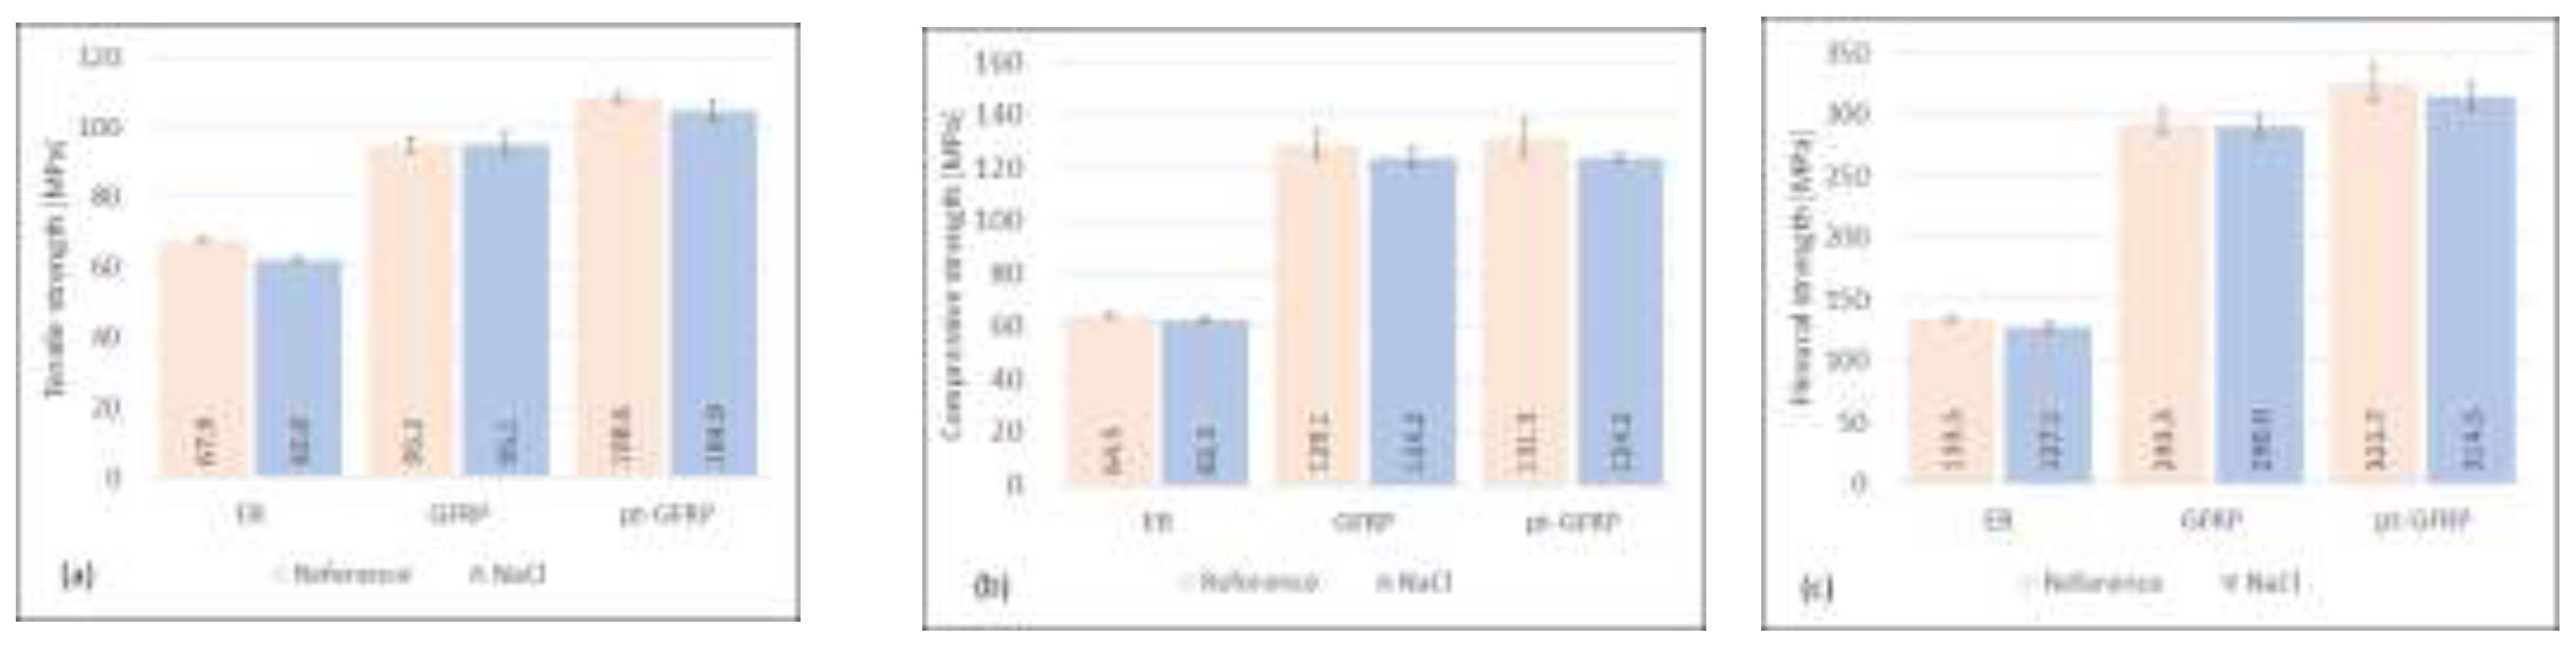
Figure 7.
Influence of KOH-solution on mechanical characteristics of epoxy resin, untreated and plasma-pretreated GFRP.
Figure 7.
Influence of KOH-solution on mechanical characteristics of epoxy resin, untreated and plasma-pretreated GFRP.
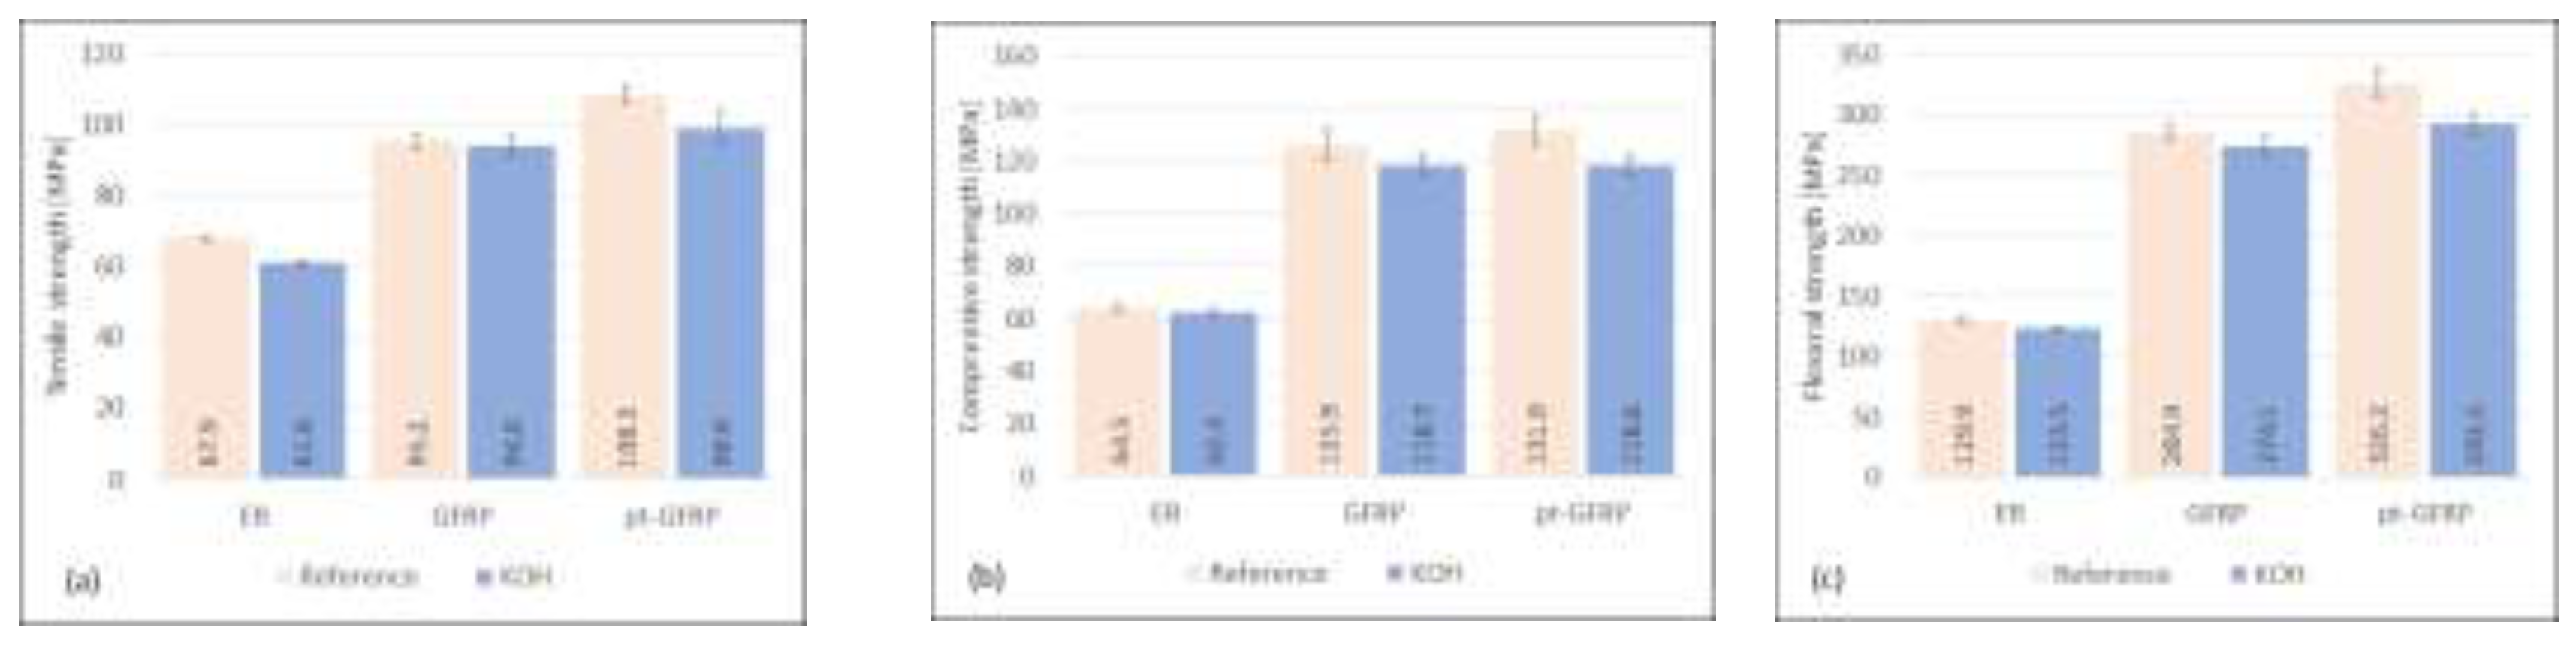
Figure 8.
SEM images of (a, b) untreated and (c, d) plasma-treated GFRP specimen after tensile test at 1000x (scale bar 150 µm) and 2000x (scale bar 80 µm) magnification.
Figure 8.
SEM images of (a, b) untreated and (c, d) plasma-treated GFRP specimen after tensile test at 1000x (scale bar 150 µm) and 2000x (scale bar 80 µm) magnification.
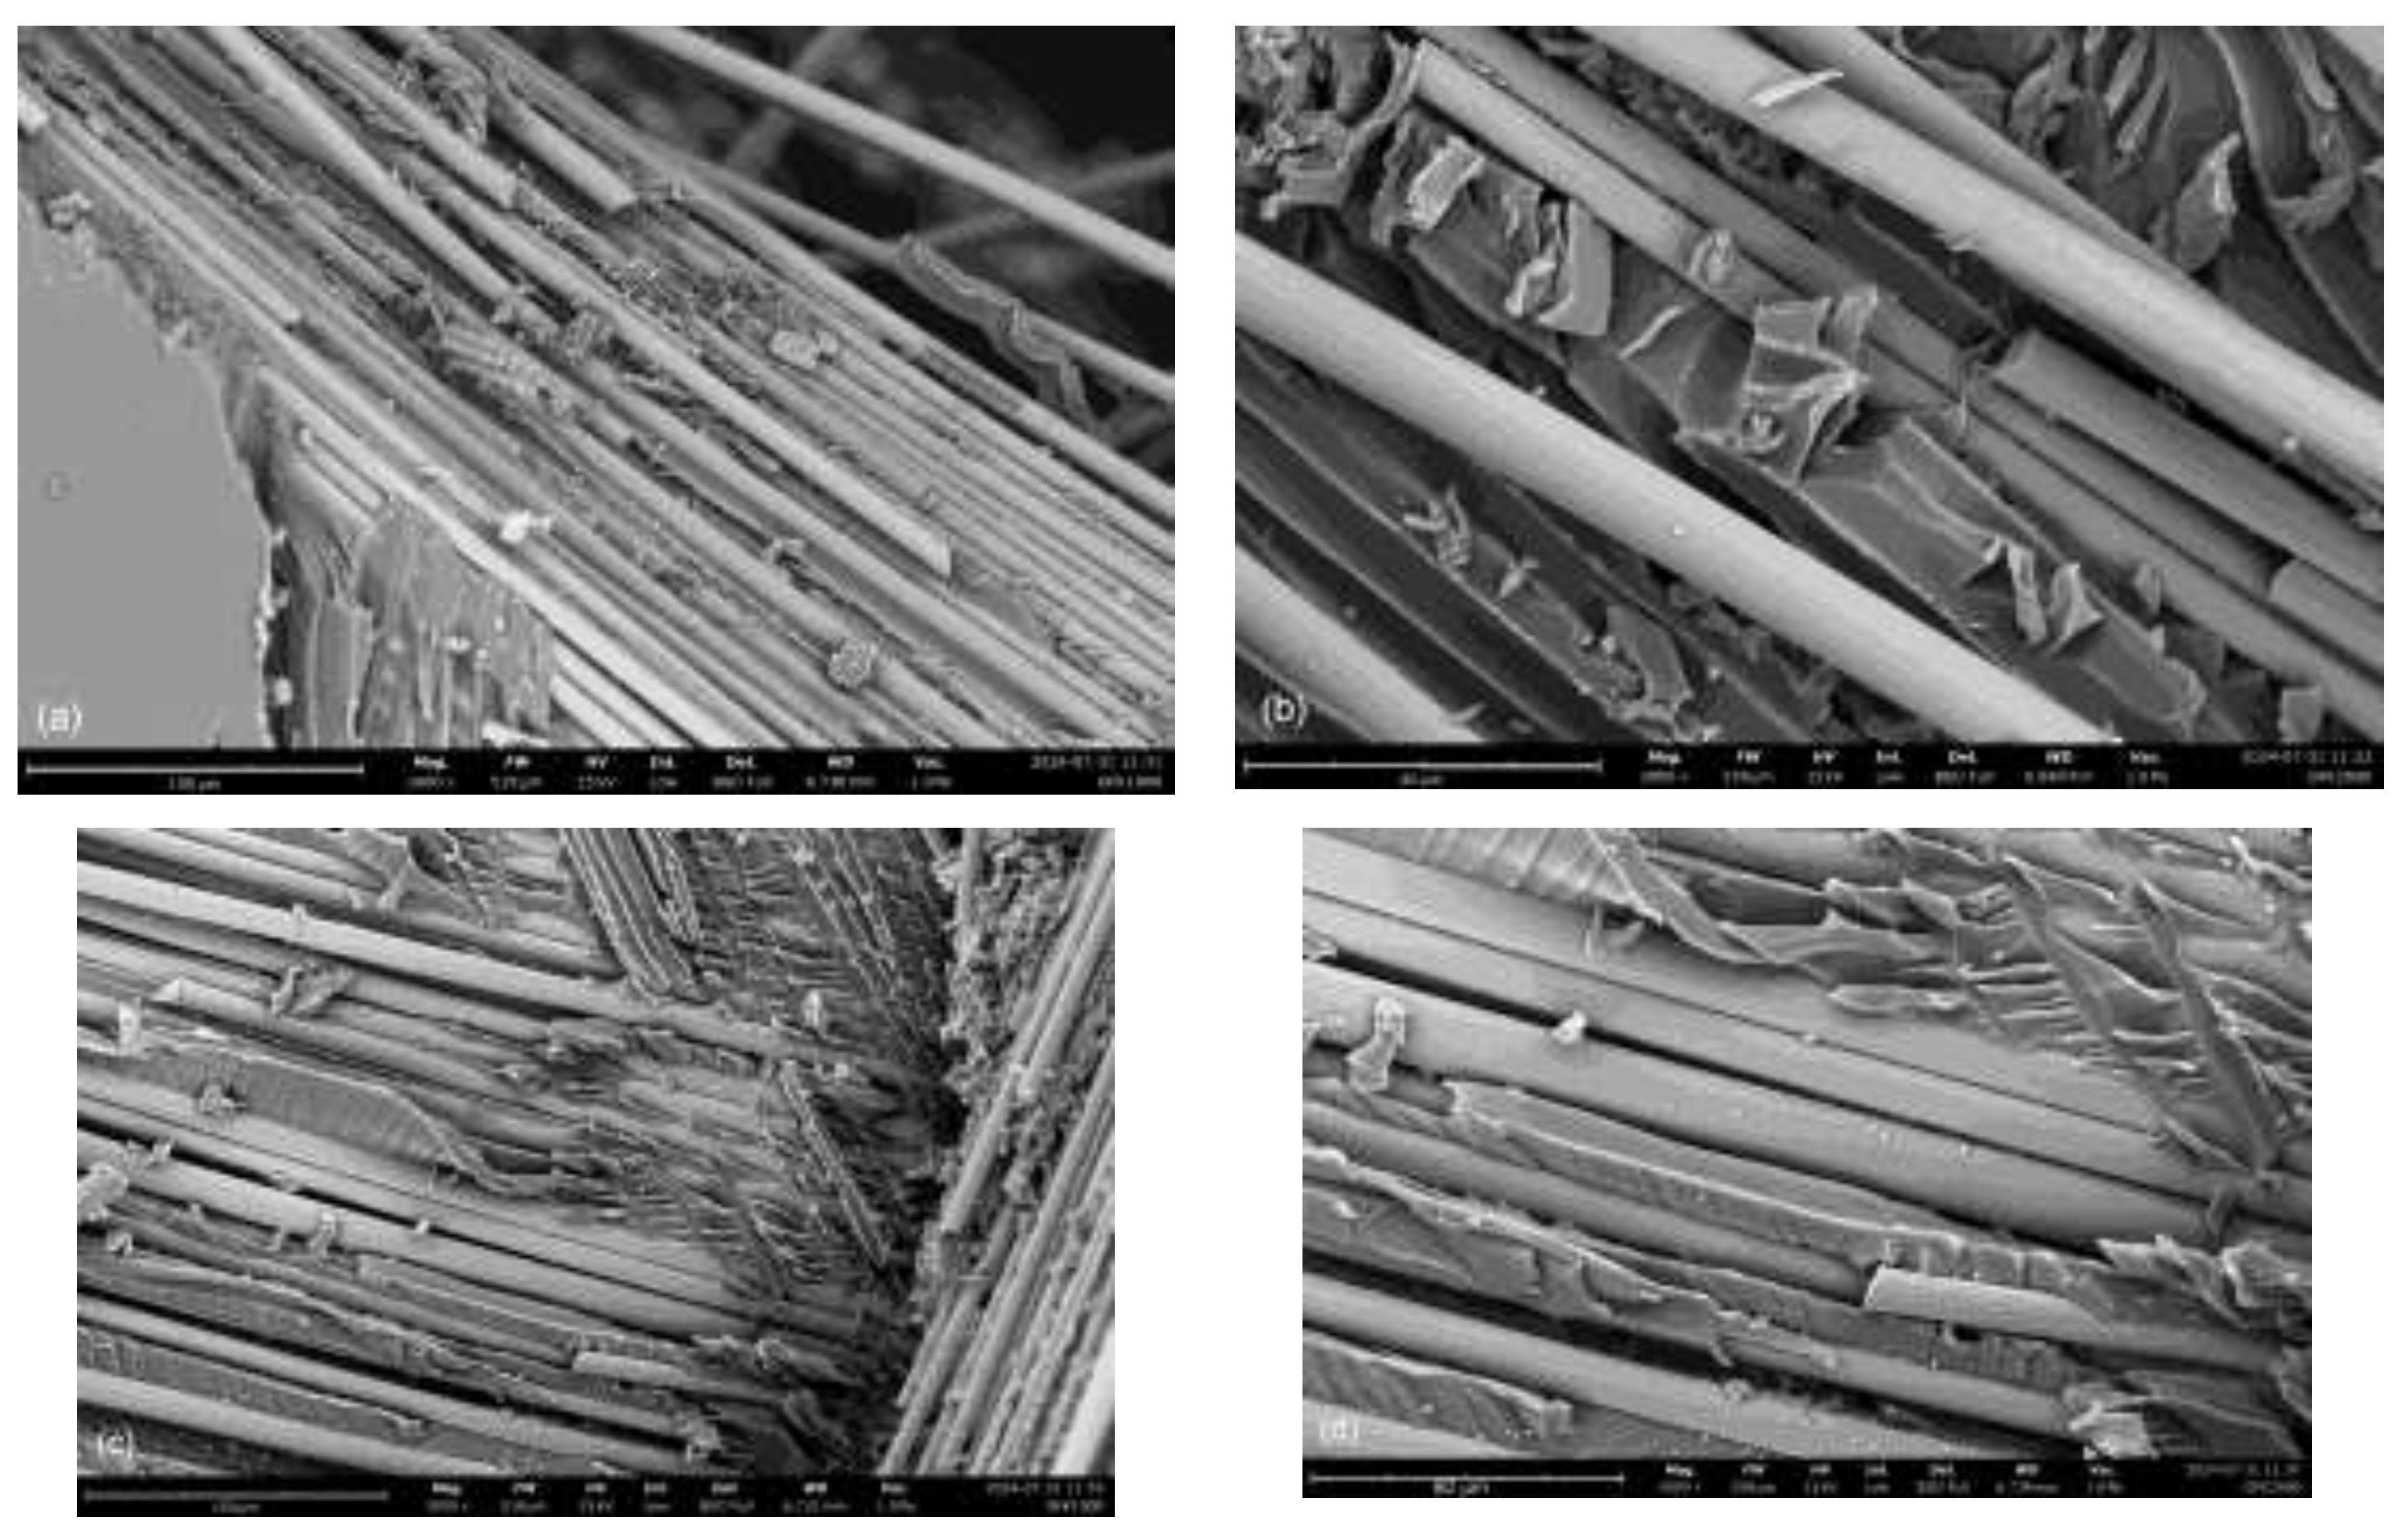
Figure 9.
Optical scan images of (a) untreated and (b) plasma-treated GFRP specimen after thermal weathering and compression test and (c) untreated and (d) plasma-treated GFRP reference samples after bending test.
Figure 9.
Optical scan images of (a) untreated and (b) plasma-treated GFRP specimen after thermal weathering and compression test and (c) untreated and (d) plasma-treated GFRP reference samples after bending test.
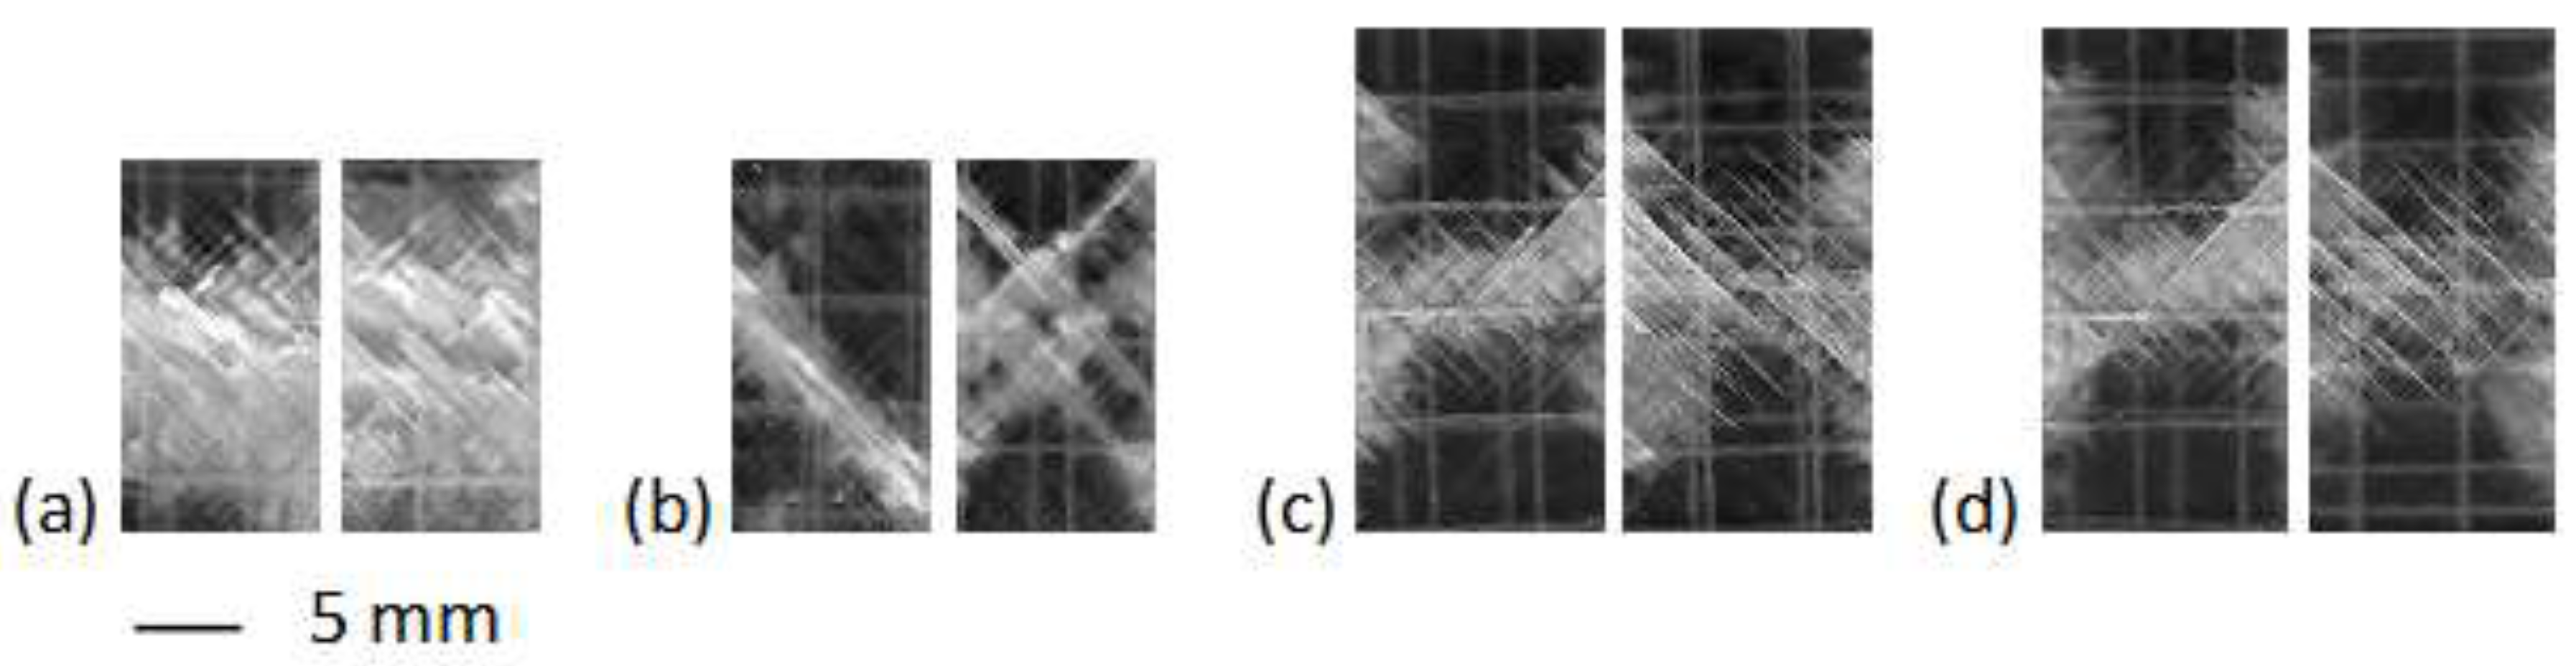
Figure 10.
Typical DSC curves of GFRP (here samples after UV exposure).
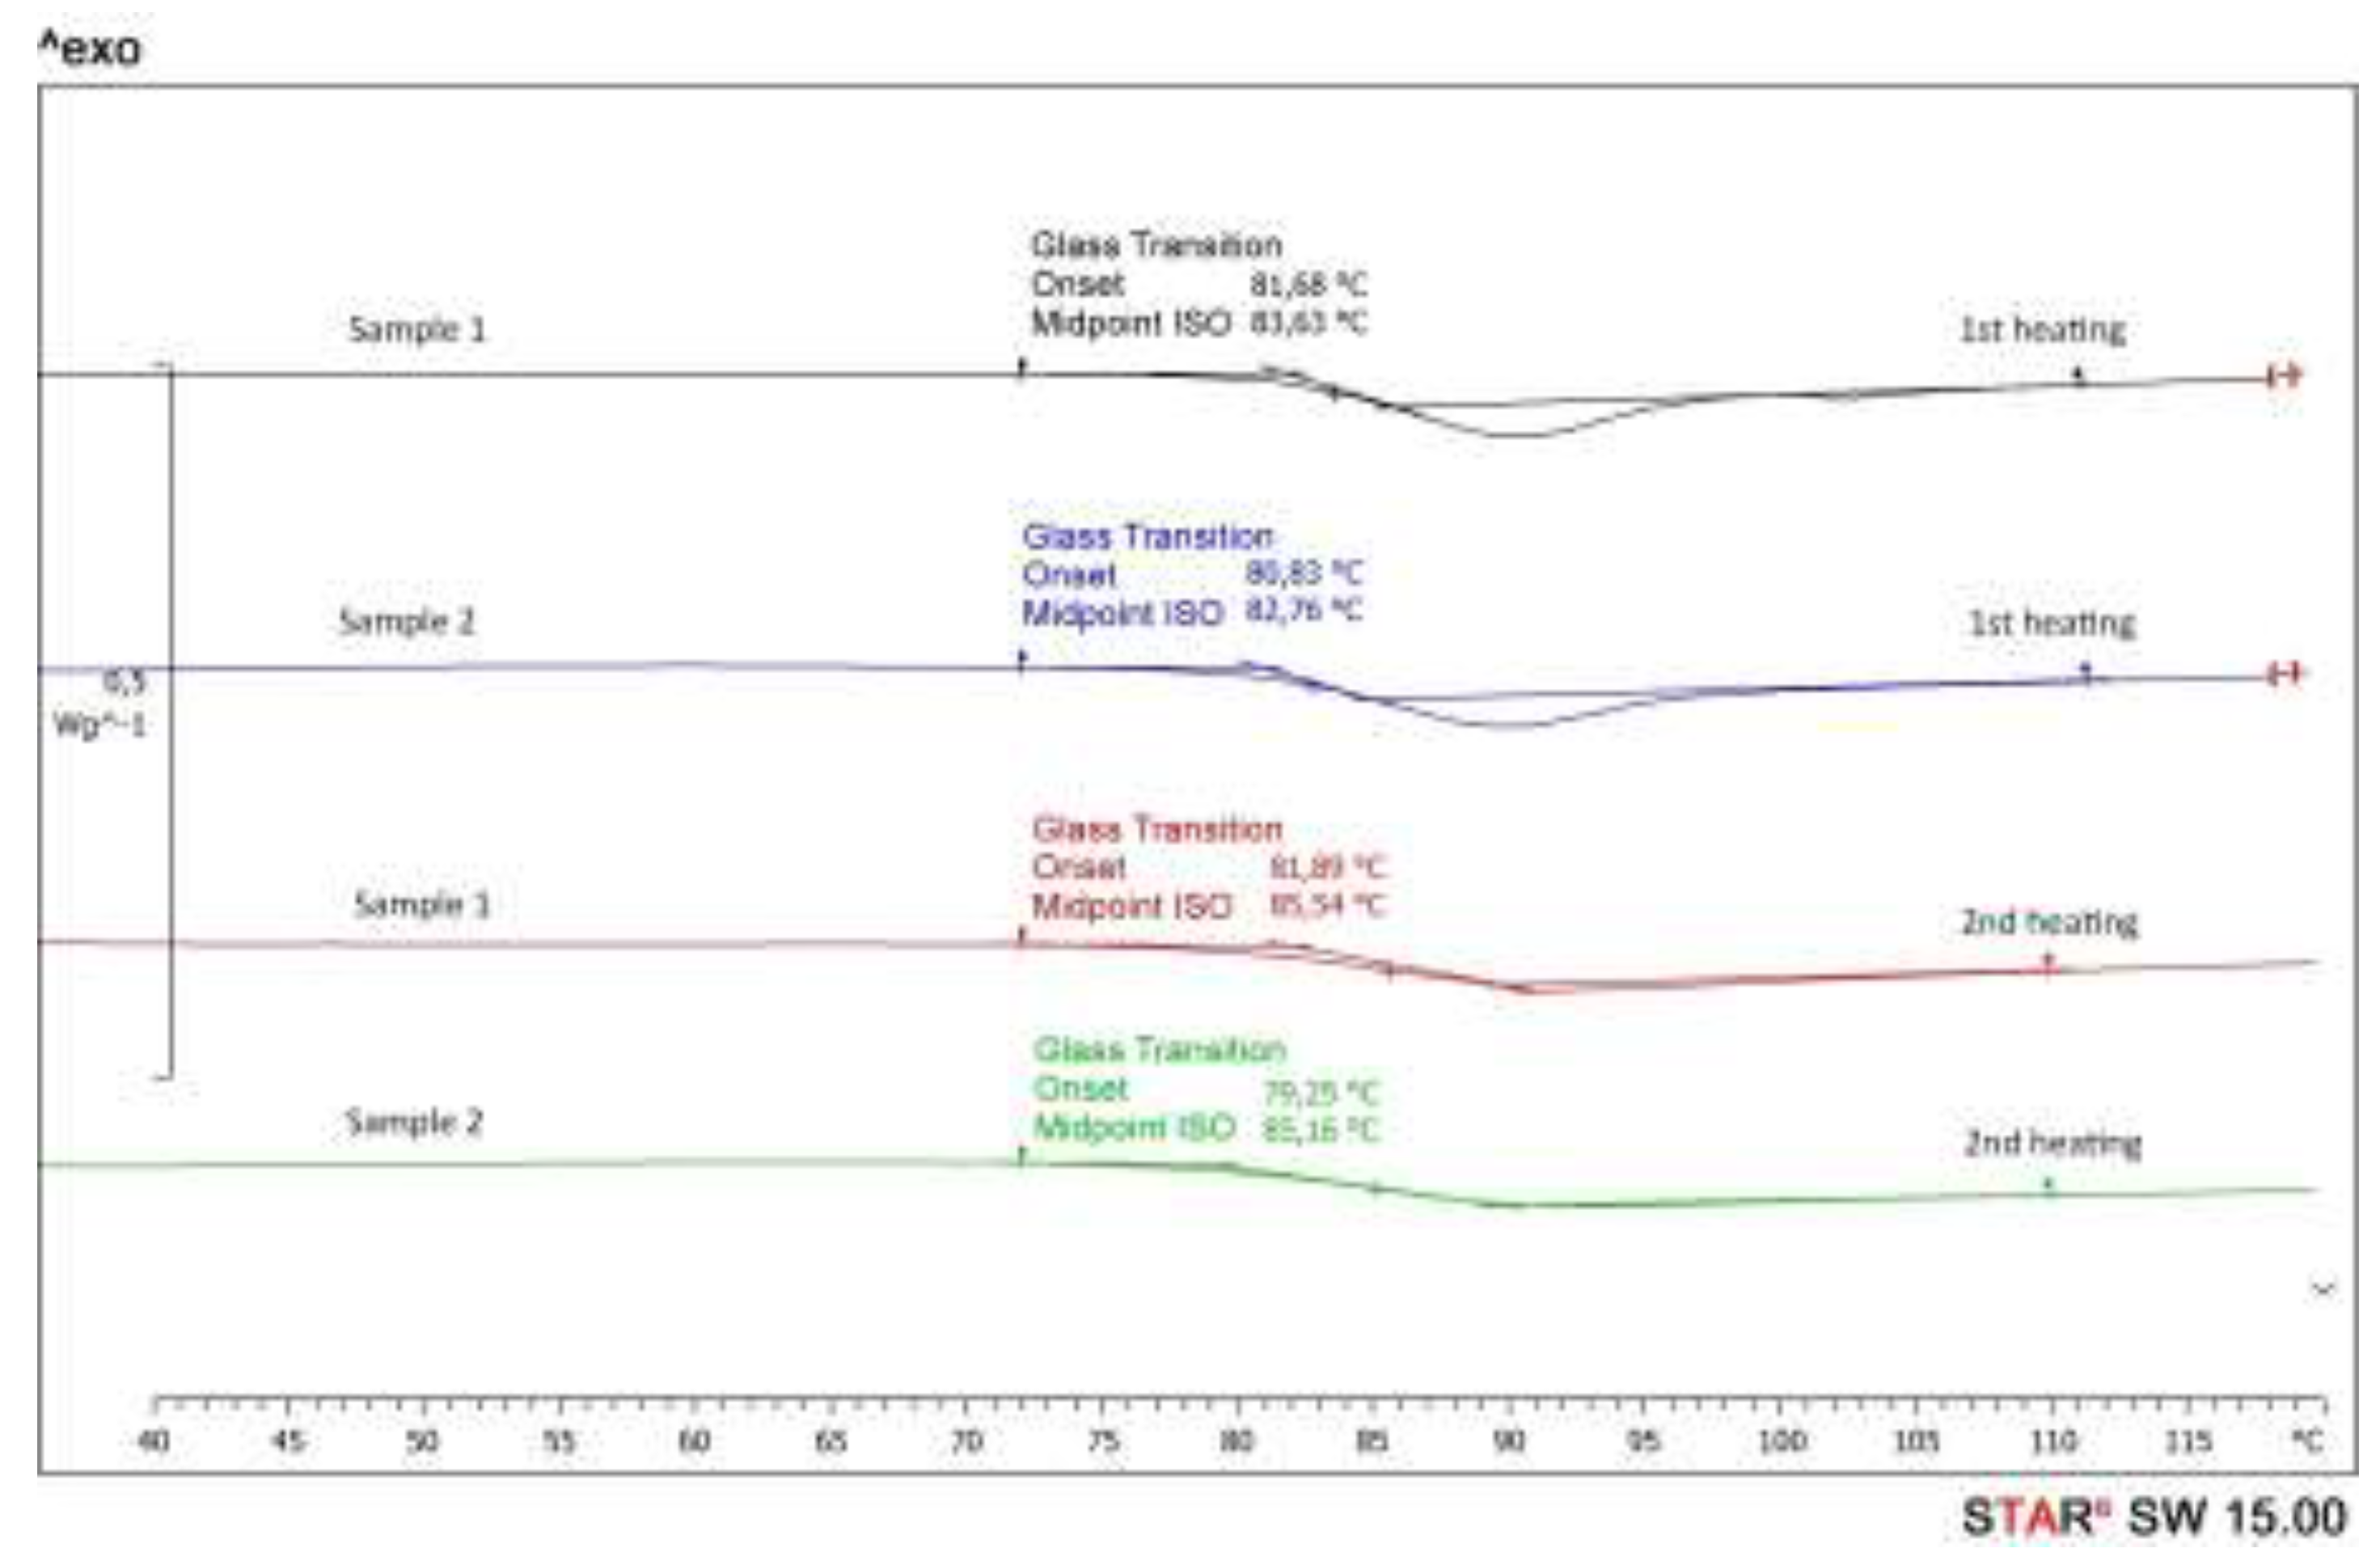

Table 1.
DSC measuring program.
| Segment | Process | Time / min | Temperature / °C |
|---|---|---|---|
| 1 | Isotherm | 2.00 | 25 |
| 2 | Heating | 4.75 | 25 – 120 |
| 3 | Isotherm | 2.00 | 120 |
| 4 | Cooling | 4.75 | 120 – 25 |
| 5 | Isotherm | 2.00 | 25 |
| 6 | Heating | 4.75 | 25 – 100 |
Table 2.
Mechanical characteristics of glass fiber reinforced epoxy.
| Name | GFRP | pt-GFRP |
|---|---|---|
| Type of samples | Without plasma pretreatment | With plasma pretreatment |
| Tensile strength / MPa | 102.5 ± 6.5 | 108.5 ± 2.0 |
| Compressive strength / MPa | 127.5 ± 5.8 | 131.6 ± 5.9 |
| Flexural strength / MPa | 295.0 ± 11.0 | 323.5 ± 10.5 |
| Interlaminar shear strength / MPa | 17.8 ± 0.6 | 19.4 ± 0.6 |
Table 3.
ILSS [MPa] of GFRP and plasma-treated GFRP.
| Treatment | GFRP Control |
GFRP Sample |
pt-GFRP Control |
pt-GFRP Sample |
|---|---|---|---|---|
| Thermally treated | 17.8 ± 0.6 | 17.9 ± 0.5 | 19.0 ± 0.3 | 19.2 ± 0.5 |
| UV exposed | 18.3 ± 0.5 | 18.9 ± 0.5 | 19.4 ± 0.5 | 19.2 ± 0.4 |
| NaCl solution | 17.9 ± 0.7 | 17.7 ± 0.5 | 19.5 ± 0.9 | 18.8 ± 0.6 |
| KOH solution | 17.2 ± 0.4 | 16.4 ± 0.5 | 19.6 ± 0.7 | 17.5 ± 0.5 |
Table 4.
Glass transition temperatures of epoxy resin, GFRP and plasma-treated GFRP.
| Sample | Epoxy resin | Epoxy resin | GFRP | GFRP | pt-GFRP | pt-GFRP |
|---|---|---|---|---|---|---|
| 1. Heating | 2. Heating | 1. Heating | 2. Heating | 1. Heating | 2. Heating | |
| Tg/°C | Tg/°C | Tg/°C | Tg/°C | Tg/°C | Tg/°C | |
| Control | 89.2 | 89.9 | 84.8 | 86.6 | 84.8 | 86.7 |
| Thermally treated | 90.7 | 90.9 | 87.2 | 87.6 | 89.2 | 89.3 |
| UV exposed | 88.1 | 88.8 | 83.2 | 85.4 | 82.4 | 86.2 |
| NaCl solution | 86.3 | 88.4 | 83.4 | 86.4 | 83.4 | 85.8 |
| KOH solution | 86.1 | 87.6 | 84.6 | 86.6 | 82.2 | 85.9 |
Disclaimer/Publisher’s Note: The statements, opinions and data contained in all publications are solely those of the individual author(s) and contributor(s) and not of MDPI and/or the editor(s). MDPI and/or the editor(s) disclaim responsibility for any injury to people or property resulting from any ideas, methods, instructions or products referred to in the content. |
© 2024 by the authors. Licensee MDPI, Basel, Switzerland. This article is an open access article distributed under the terms and conditions of the Creative Commons Attribution (CC BY) license (http://creativecommons.org/licenses/by/4.0/).
Copyright: This open access article is published under a Creative Commons CC BY 4.0 license, which permit the free download, distribution, and reuse, provided that the author and preprint are cited in any reuse.


