Preprint
Article

Impact of Environmental Factors on Bacterial Populations: A Comparison of Riverine, Estuarine and Coastal Sediments Within Adyar Creek Estuary, India

Altmetrics

Downloads

68

Views

38

Comments

0

Submitted:

15 October 2024

Posted:

15 October 2024

You are already at the latest version

Alerts
Abstract
The Adyar Creek, a backwater estuary at the mouth of the Adyar River on the Coromandel Coast of the Bay of Bengal, represents a critical ecosystem facing mounting pressure from urbanization. This study employed high throughput 16S rRNA gene sequencing to characterize bacterial communities within the riverine, estuarine, and coastal sediments of Adyar Creek. Proteobacteria was the dominant phylum across most samples, with proportions ranging from 39.65% to 72.09%. Notably, the estuarine environment exhibited a distinct taxonomic profile characterized by a significant abundance of Firmicutes (47.09% of the bacterial population). Distinct bacterial classes were observed across sediment types: Alphaproteobacteria (30.07% - 34.32%) in riverine sediments, bacilli dominated estuarine sediments (40.17%), and Gammaproteobacteria (15.71%-51.94%) in coastal sediments. The most significant environmental factors influencing bacterial community composition across these samples were pH, salinity, phosphate, and nitrate. LEfSe analysis identified specific genera within the estuary, including Bacillus (20.26%), unclassified Paenibacillaceae (12.87%), Clostridium (3.81%), Gailella (3.17%), Paenibacillus (3.02%), Massilia (1.70%), Paraburkholderia (1.42%), and Pantoea (1.15%), as potential biomarkers for habitat health. Functional analysis revealed elevated expression of genes associated with ABC transporters and carbon metabolism in the estuary, suggesting a heightened nutrient cycling capacity. Furthermore, co-occurrence network analysis indicated bacterial communities exhibit a strong modular structure with complex species interactions across the three sediment types. These findings highlight bacterial communities' critical role and their key drivers in estuarine ecosystems, establishing a baseline for further investigations into the functional ecology of these vulnerable ecosystems.
Keywords: 
Subject: Environmental and Earth Sciences  -   Environmental Science

1. Introduction

Estuaries are complex and dynamic aquatic environments, enriched by the mix of river freshwater and ocean tides, containing a blend of land-sourced materials, native biological interactions, and tidal influences [1]. These ecosystems also exhibit a notable accumulation of suspended matter (SPM), which, owing to its hydrodynamic properties, tends to concentrate in a distinct turbidity maximum (TM) zone at salinities ranging from 2 to 5 % [2]. Salinity is widely recognized as the primary factor governing the distribution of plants in estuarine and marine marshes [3], and it also serves as a key determinant of microbial community composition [4], along with other inorganic nutrients [5]. Besides salinity, estuarine microbial communities and diversity are also significantly influenced by a range of physicochemical and biological factors resulting from tidal movements [6]. Importantly, bacteria are highly responsive to changes in physical and chemical conditions [7]. Within estuarine ecosystems, bacterial communities play a key role in various processes, including converting energy from non-living organic carbon into microbial biomass, binding metals, and reacting to pollutants [8]. However, it is critical to establish comprehensive baseline data to accurately detect changes in these microbial communities due to environmental changes or anthropogenic pollution [9].
Urbanization is leading to the gradual replacement of estuarine wetlands with residential and industrial zones globally. Pollution from industrial and residential developments, recreational activities, and other human activities within the estuary and its surrounding catchment area significantly affects these sensitive habitats and the living resources they harbour [10]. The Adyar estuary in urban Chennai, the capital of Tamil Nadu, Southern India, has suffered extensive ecological damage due to the presence of various industrial facilities along its bank, including chemical plants, a battery company, and plastic and rubber factories, as well as residential buildings [3]. The continuous discharge of industrial effluents and sewage has significantly affected its self-purification capacity [11]. Additionally, as the intersection between terrestrial and marine ecosystems, urbanized estuarine sediments frequently accumulate a wide range of pollutants from this industrial and sewage runoff [12]. Moreover, sediments act as a repository of events and processes in the pelagic environment, and the microbial communities present in these surface sediments play a significant role in the cycling of elements, locally and globally [13]. Numerous past studies have analyzed the water and sediments of the Adyar estuary, focusing on aspects such as physicochemical properties [14], meiofaunal communities [15], zooplankton dynamics [16], trace metal content [17], methane emissions [18], and heavy metal bioaccumulation in certain fish species [11]. These studies have established baseline data for physicochemical conditions as well as faunal and plankton populations. Despite this extensive research, there has been no investigation into the bacterial diversity within the estuary, which could serve as a sensitive indicator for assessing environmental pollution levels and associated risks.
Although bacterial assemblages are sensitive indicators of human-induced impacts, they have not been sufficiently used to analyse ecosystem functioning and biomonitoring [19]. The use of microbial bioindicators to assess environmental health can be accomplished through various methods, including analysing community data with techniques like 16S rRNA gene sequencing, metagenomics, and metaproteomics, or by directly studying the presence or prevalence of specific taxa or functional genes [20]. In India, research on the bacterial diversity of estuaries has predominantly used culture-based methods [21,22,23,24]. Very few studies used high throughput sequencing technologies to assess the bacterial diversities in the estuarine ecosystem [5,25]. These approaches have been utilized to identify how microbial communities respond to specific environmental disturbances, including oil spills [26,27], nutrient influxes [28], and heavy metal contamination [29]. This method allows for the detection of changes in community composition and structure and provides insights into potential functional alterations. This study aimed to investigate and compare the variations in bacterial communities across estuarine, riverine, and coastal sediments within Adyar Creek, focusing on the impact of physicochemical factors on these communities and exploring their functional contributions to the estuarine ecosystem. To the best of our knowledge, this is the first study to assess the bacterial communities in this particular setting using high-throughput sequencing technology and aims to provide essential insights into the microbial populations across various sediments, identify indicator species, and enhance our understanding of their role in monitoring changes within the ecosystem.

2. Materials and Methods

2.1. Sampling Location and Collection

Adyar Creek is a backwater estuary in Chennai, India, at the Adyar River's mouth along the Coromandel Coast of the Bay of Bengal. In total, 30 surface sediment samples were collected from the different points of the estuarine environment, comprising the riverine (n = 12) within part of the estuary, estuarine (n = 4) near the tidal mixing zone and coastal sediment (n = 12) on both sides of the transition zone and the sampling points were grouped and labelled as G1 and G2 (from the Adyar River channel), G3 (estuarine) and G4 and G5 (coastal) shown in Figure 1. In addition, control samples (n = 2) were collected at points not part of the estuarine system. All the samples were collected using a sterile snapper sediment sampler (Sampling Systems, USA), stored in a sterile plastic bag, kept in an ice box, and transported back to the laboratory within 24 hours. The sediment samples collected for this study did not require specific permissions, as the study area and sampling points are not governed by conservation or protection regulations.

2.2. Sediment Chemical Analysis

During sampling, sediment samples were analyzed on-site for temperature, pH, salinity, and dissolved oxygen (DO) using calibrated multi-parameter probes (Hanna Instruments, USA). Since the temperature at all sampling sites was the same (28-29 ℃), the temperature readings were not included in Table 1. For the quantification of Nitrate (NO3), Ammonia (NH4), and Phosphate (PO4), samples were collected in two sets: one in sterile plastic bags for nutrient analysis and another in pre-washed, acid-treated (HNO3) glass containers for heavy metal analysis. In the laboratory, sediment samples were homogenized using a homogenizer before analysing NH4, NO3, PO4, and elemental contents. NO3 and PO4 concentrations and NH4 were determined calorimetrically, following the methods described [29,30], while the determination of heavy metals and metalloids was conducted using Inductively Coupled Plasma Optical Emission Spectrometry (ICP-OES) (PerkinElmer Optima 5300 DV) as described [31]. To ensure the calibration accuracy of the ICP-OES, calibration blanks and independent standards for calibration and verification were analyzed concurrently with the samples. Calibration curves with r2  >  0.999 were accepted for quantification. The results were then averaged from three repeated measurements.

2.3. DNA Extraction and Illumina Sequencing

For DNA extraction, we adapted our previous method with minor modifications [32]. Approximately 10 g of each sediment sample was mixed with 10 mL of phosphate-buffered saline (PBS) at pH 7.4. These mixtures were then vigorously vortexed and allowed to settle at room temperature for one hour. Subsequently, 600 μL aliquots of the supernatant were taken for further analysis. Total genomic DNA was extracted using the Faecal/Soil Total DNA™ extraction kit (Zymo Research Corporation, CA, USA) following the manufacturer's instructions. For bacterial community analysis, the universal 16S rRNA gene was amplified using the primers 27F (5′-AGAGTTTGATCCTGGCTCAG-3′) and 1429R (5′-TACGGYTACCTTGTTACGACTT-3′) to target the full-length hypervariable region, as described by Ogola et al., (2021). A nested PCR was then performed to amplify the V1-V3 region, using the primers 27F and 518R (5′-GTATTACCGCGGCTGCTGG-3′) with sequences that allow attachment to Illumina indexing and sequencing adapters. The amplified 16S rDNA gene fragments were purified using AMPure XP beads (Beckman Coulter, Agencourt Bioscience Corporation, Beverly, MA, USA), following the manufacturer’s protocol. Subsequent PCR steps involved adding Illumina sequencing adapters and dual-index barcodes to each amplicon library, utilizing the full complement of Nextera XT indices (Illumina Inc., San Diego, CA, USA). This PCR process included an initial denaturation at 95 °C for 3 minutes, cycles of denaturation at 95 °C for 30 seconds, annealing at 55 °C for 30 seconds, and extension at 72 °C for 30 seconds, with a final extension at 72 °C for 5 minutes. The barcoded PCR products were then purified, validated for fragment size (~630 bp) using a Bioanalyzer DNA 1000 chip (Agilent, Santa Clara, CA, USA), and quantified with the Qubit-HS assay (Life Technologies, Carlsbad, CA, USA). Finally, the DNA libraries were pooled, denatured, and sequenced on an Illumina MiSeq System using a 600-cycle MiSeq v3 kit (Illumina, San Diego, CA, USA) to generate high-quality reads (UNISA, South Africa).

2.4. Data Analysis

Before bioinformatic analysis, the quality of the raw sequencing data was evaluated using FastQC [34]. The sequences then underwent extensive processing steps using the QIIME2 (Quantitative Insights into Microbial Ecology, v1.8.0) pipeline (v1.8.0) [35]. This included trimming, quality filtering, removing adapter and primer sequences, denoising, and merging with the DADA2 algorithm [36]. This process was used to infer amplicon sequence variants (ASVs). BLAST searches against the Silva v138 bacterial sequence database were performed for taxonomic classification using the ASVs' representative sequences. A "taxa filter" was implemented to remove sequences derived from chloroplasts and mitochondria. To assess the diversity and richness of the bacterial communities, metrics such as the Chao1 richness estimator, Shannon and Simpson diversity indices were calculated in QIIME2 tool. Community structure was analyzed using Principal Coordinate Analysis (PCoA), based on Bray-Curtis dissimilarity metrics. The analyzed data were subsequently visualized using bar plots and heatmaps to illustrate the taxonomic composition at various levels, employing Origin-Pro 22 software and the R programming package.
Two-tailed Pearson correlation coefficients were calculated to explore the relationship between samples and toxic metalloids, and the results were plotted using Origin-Pro 22 software. A Redundancy Analysis (RDA) was conducted to investigate the influence of physicochemical parameters on bacterial meta-community distribution and prevalence, using the relative abundance of ASVs at the class level and physicochemical parameters as input data, analyzed with the R vegan package. Bacterial functions were predicted using the PICRUSt2 pipeline, and potential metabolic and degradation pathways were identified and visualized using the STAMP program tool. Based on Spearman’s correlation, co-network analysis was performed to understand bacterial members' interactions. The co-occurrence network model was visualized with Cytoscape software (v 3.10.1), revealing network statistics such as the number of edges and nodes, network diameter, modularity, clustering coefficient, average degree, average path length, density, and heterogeneity. Finally, the raw sequences were deposited in the NCBI Gene Bank under an SRA accession number PRJNA1122362.

3. Results

3.1. Sediment Chemical Properties

The chemical properties of sediment samples collected from various sampling points are summarized in Table 1. The pH values recorded from riverine and estuarine sampling points were neutral, ranging from 7.3 to 7.7, whereas marine sediments exhibited a slightly alkaline pH between 8.01 and 8.03. Salinity levels varied across the sampling points, displaying a gradual increase from riverine samples (15.25 to 17.29) to estuarine (21.5) and coastal sediments (28.17 to 29.9). Notably, dissolved oxygen (DO) concentrations were higher in estuarine sediments (3.8) compared to other locations (excluding control samples). In contrast, nitrate and phosphate concentrations did not exhibit significant variations across the sampling points. However, ammonia concentrations were elevated in the G2 and G3 sampling points relative to other sites.
Toxic heavy metals in the sediment samples showed a sequential increase in concentration in the order Fe < Cr < Mn < Zn < Cu < Ni < Pb. The concentrations of Fe, Cr, Ni, and Pb were notably higher in the riverine sediment samples at points G1 and G2 compared to those in estuarine (G3) and marine sediments (G4 and G5). This variation in concentration is likely due to the leaching of tannery waste, electronic waste, including batteries, and atmospheric deposition from the metropolitan area. While elevated levels of Fe were observed in all sediment samples, the estuarine samples (G3) exhibited a notably higher concentration than others. This significant presence of Fe in the estuarine sediments may be attributed to the transportation and deposition of Fe by the Adyar River, facilitated by leaching from metal wastes generated by various small-scale industries specializing in metal fabrication, welding, and grinding located along the riverbanks and within its catchment area.
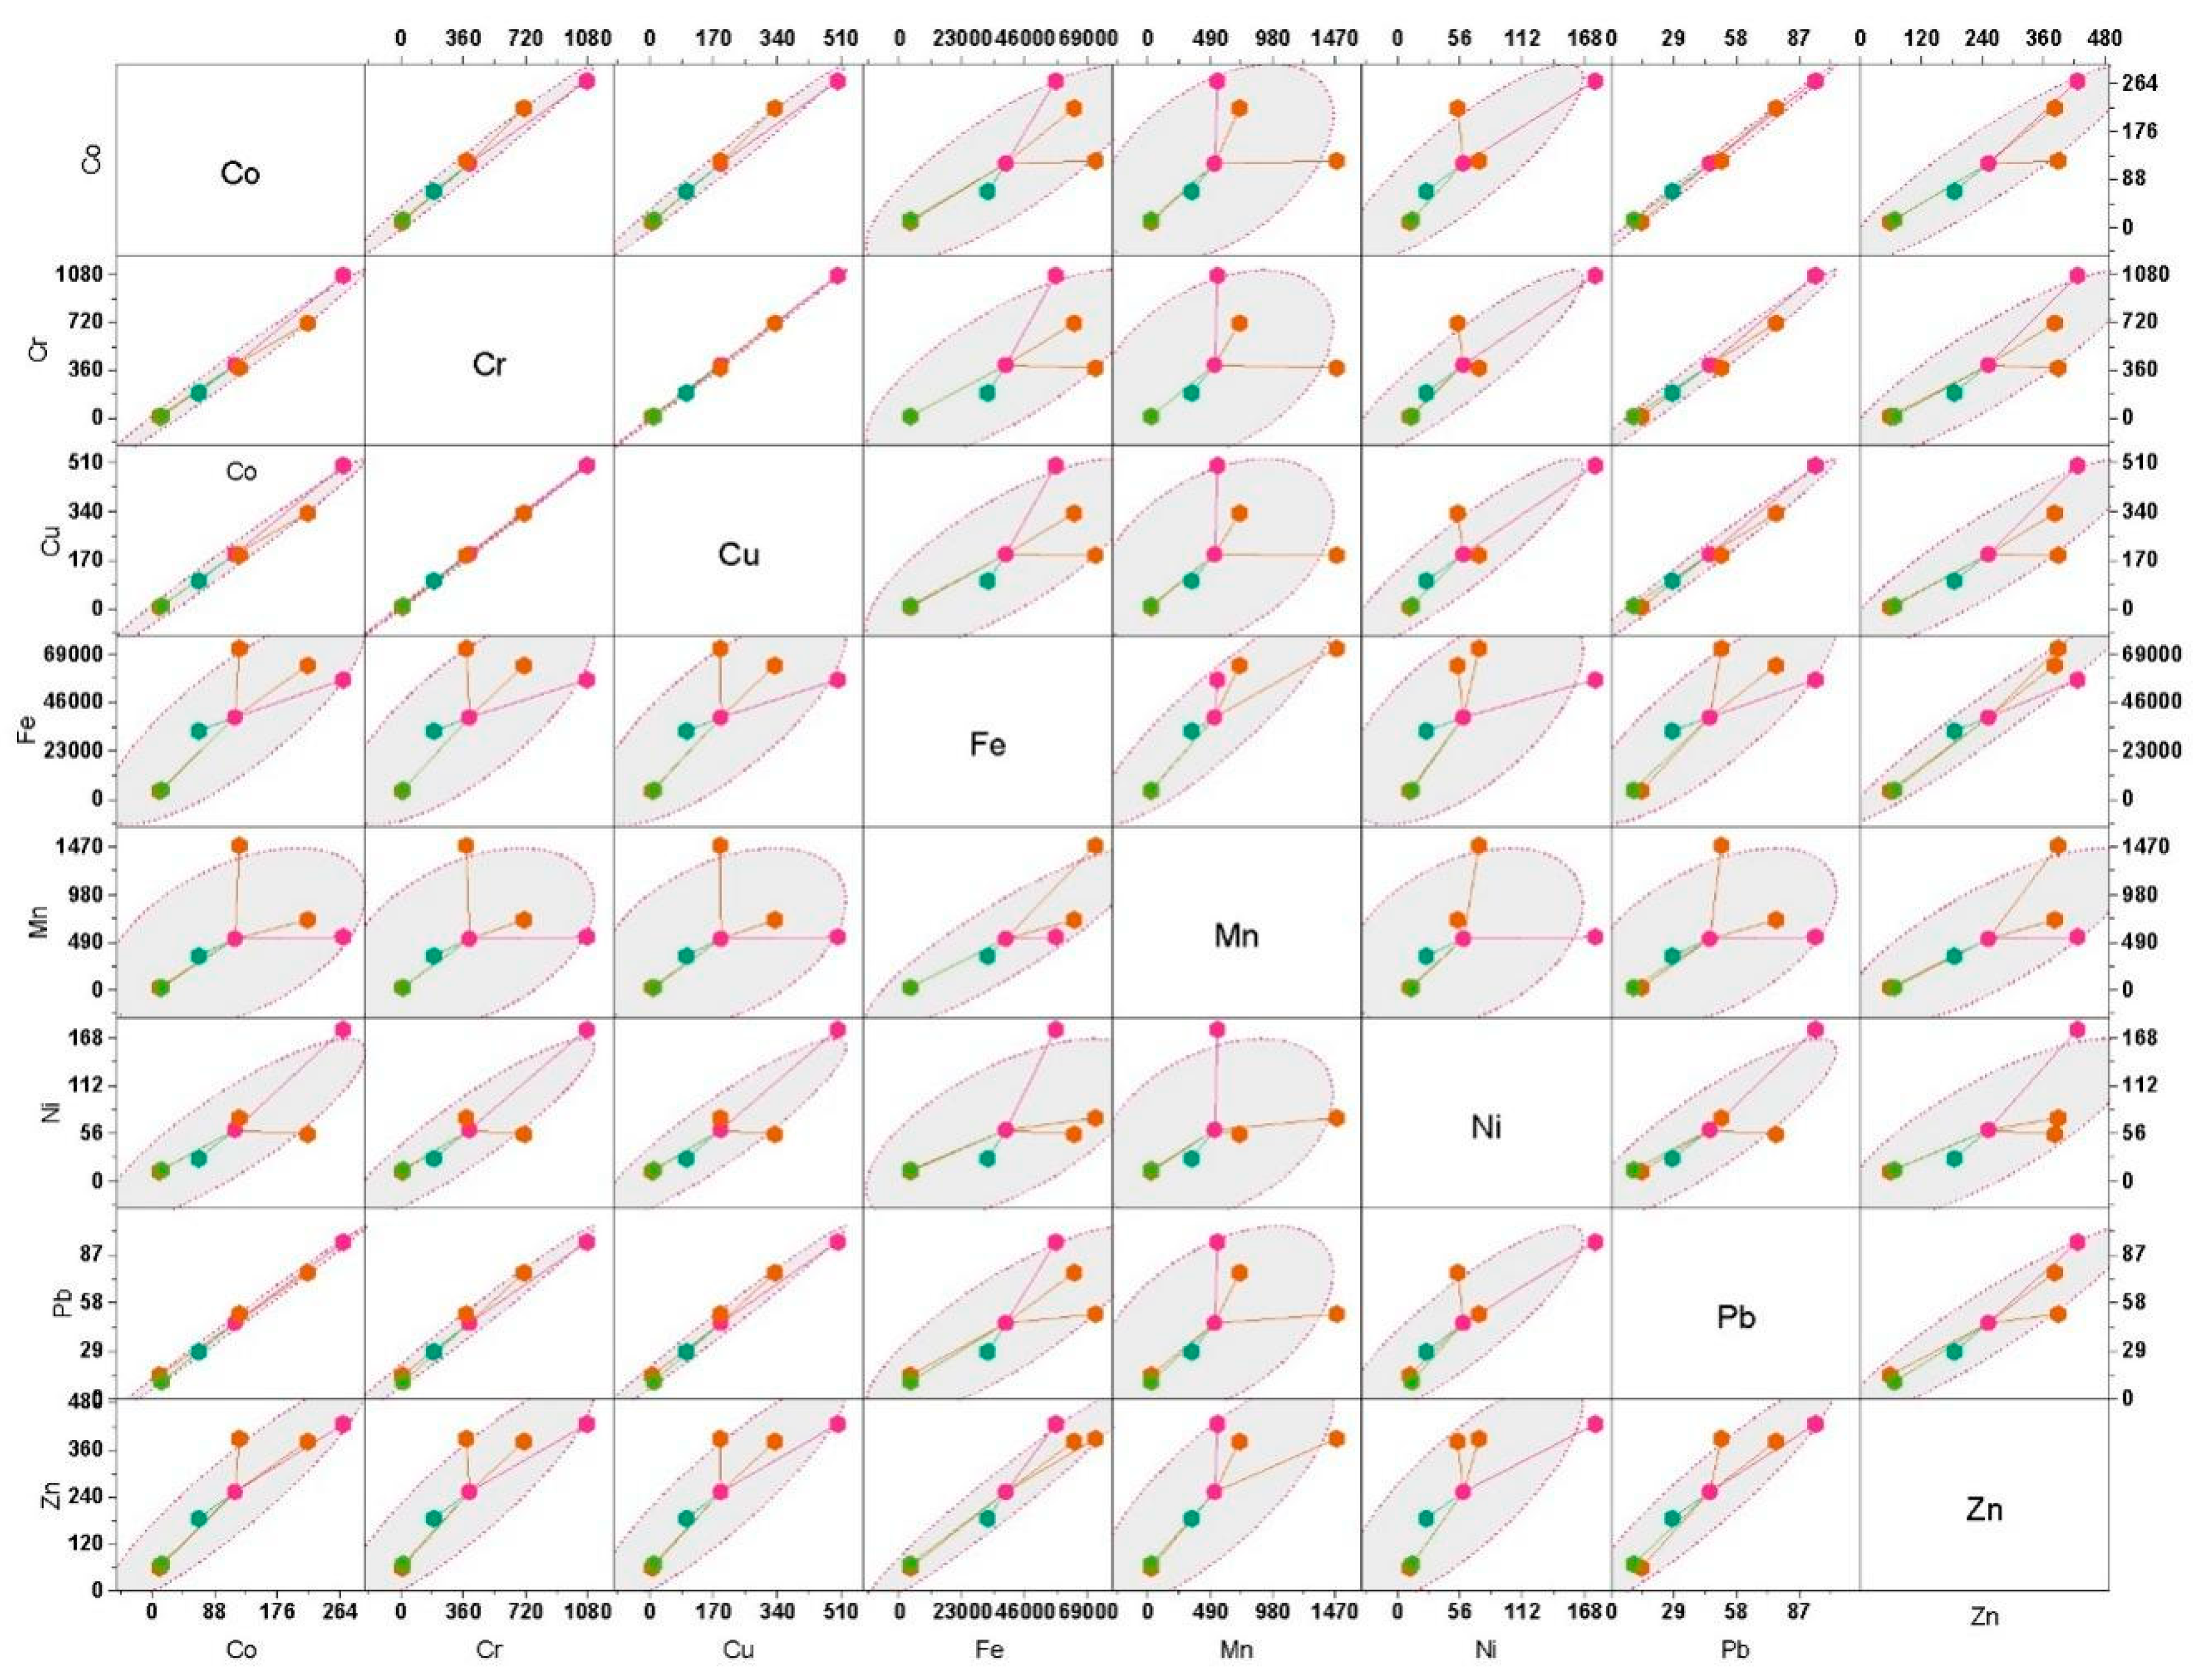
The Pearson correlation coefficients for toxic heavy metal concentrations in sediment samples displayed varied degrees of linear associations between metal pairs (Figure 2). Notably, Co, Cr, Cu, and Pb exhibit strong correlations, with coefficients exceeding 0.98, suggesting these metals may share common sources or similar transport and deposition mechanisms in Adyar Creek. Co and Pb displayed a highly significant correlation coefficient of 0.99753 (p = 9.16E-06). Fe showed moderate to strong correlations with most metals, particularly Zn (0.96946) (p = 0.00138). However, Mn showed weaker correlations with other metals, such as Cr and Cu (0.41-0.43), suggesting more diverse sources or different behaviours in the sedimentary environment. These observations indicate that while some heavy metals are closely associated, likely due to common environmental factors, the variability in correlations among other metals could be attributed to distinct geochemical properties or varying anthropogenic impacts.

3.2. Diversity Indices of Bacterial Communities

After denoising, the number of high-quality sequences obtained for the bacterial community analysis varied across samples, ranging from 275,552 sequences in the G2 samples to 106,675 sequences in the G3 sediment samples. The control sites, where fewer samples were collected (n = 2), yielded 33,618 sequences. These high-quality sequences were further grouped into amplicon sequence variants (ASVs), representing unique microbial types, with counts ranging from 1,428 ± 421 (G1) to 112 ± 19 (G4). Control samples exhibited 402 ± 33 ASVs.
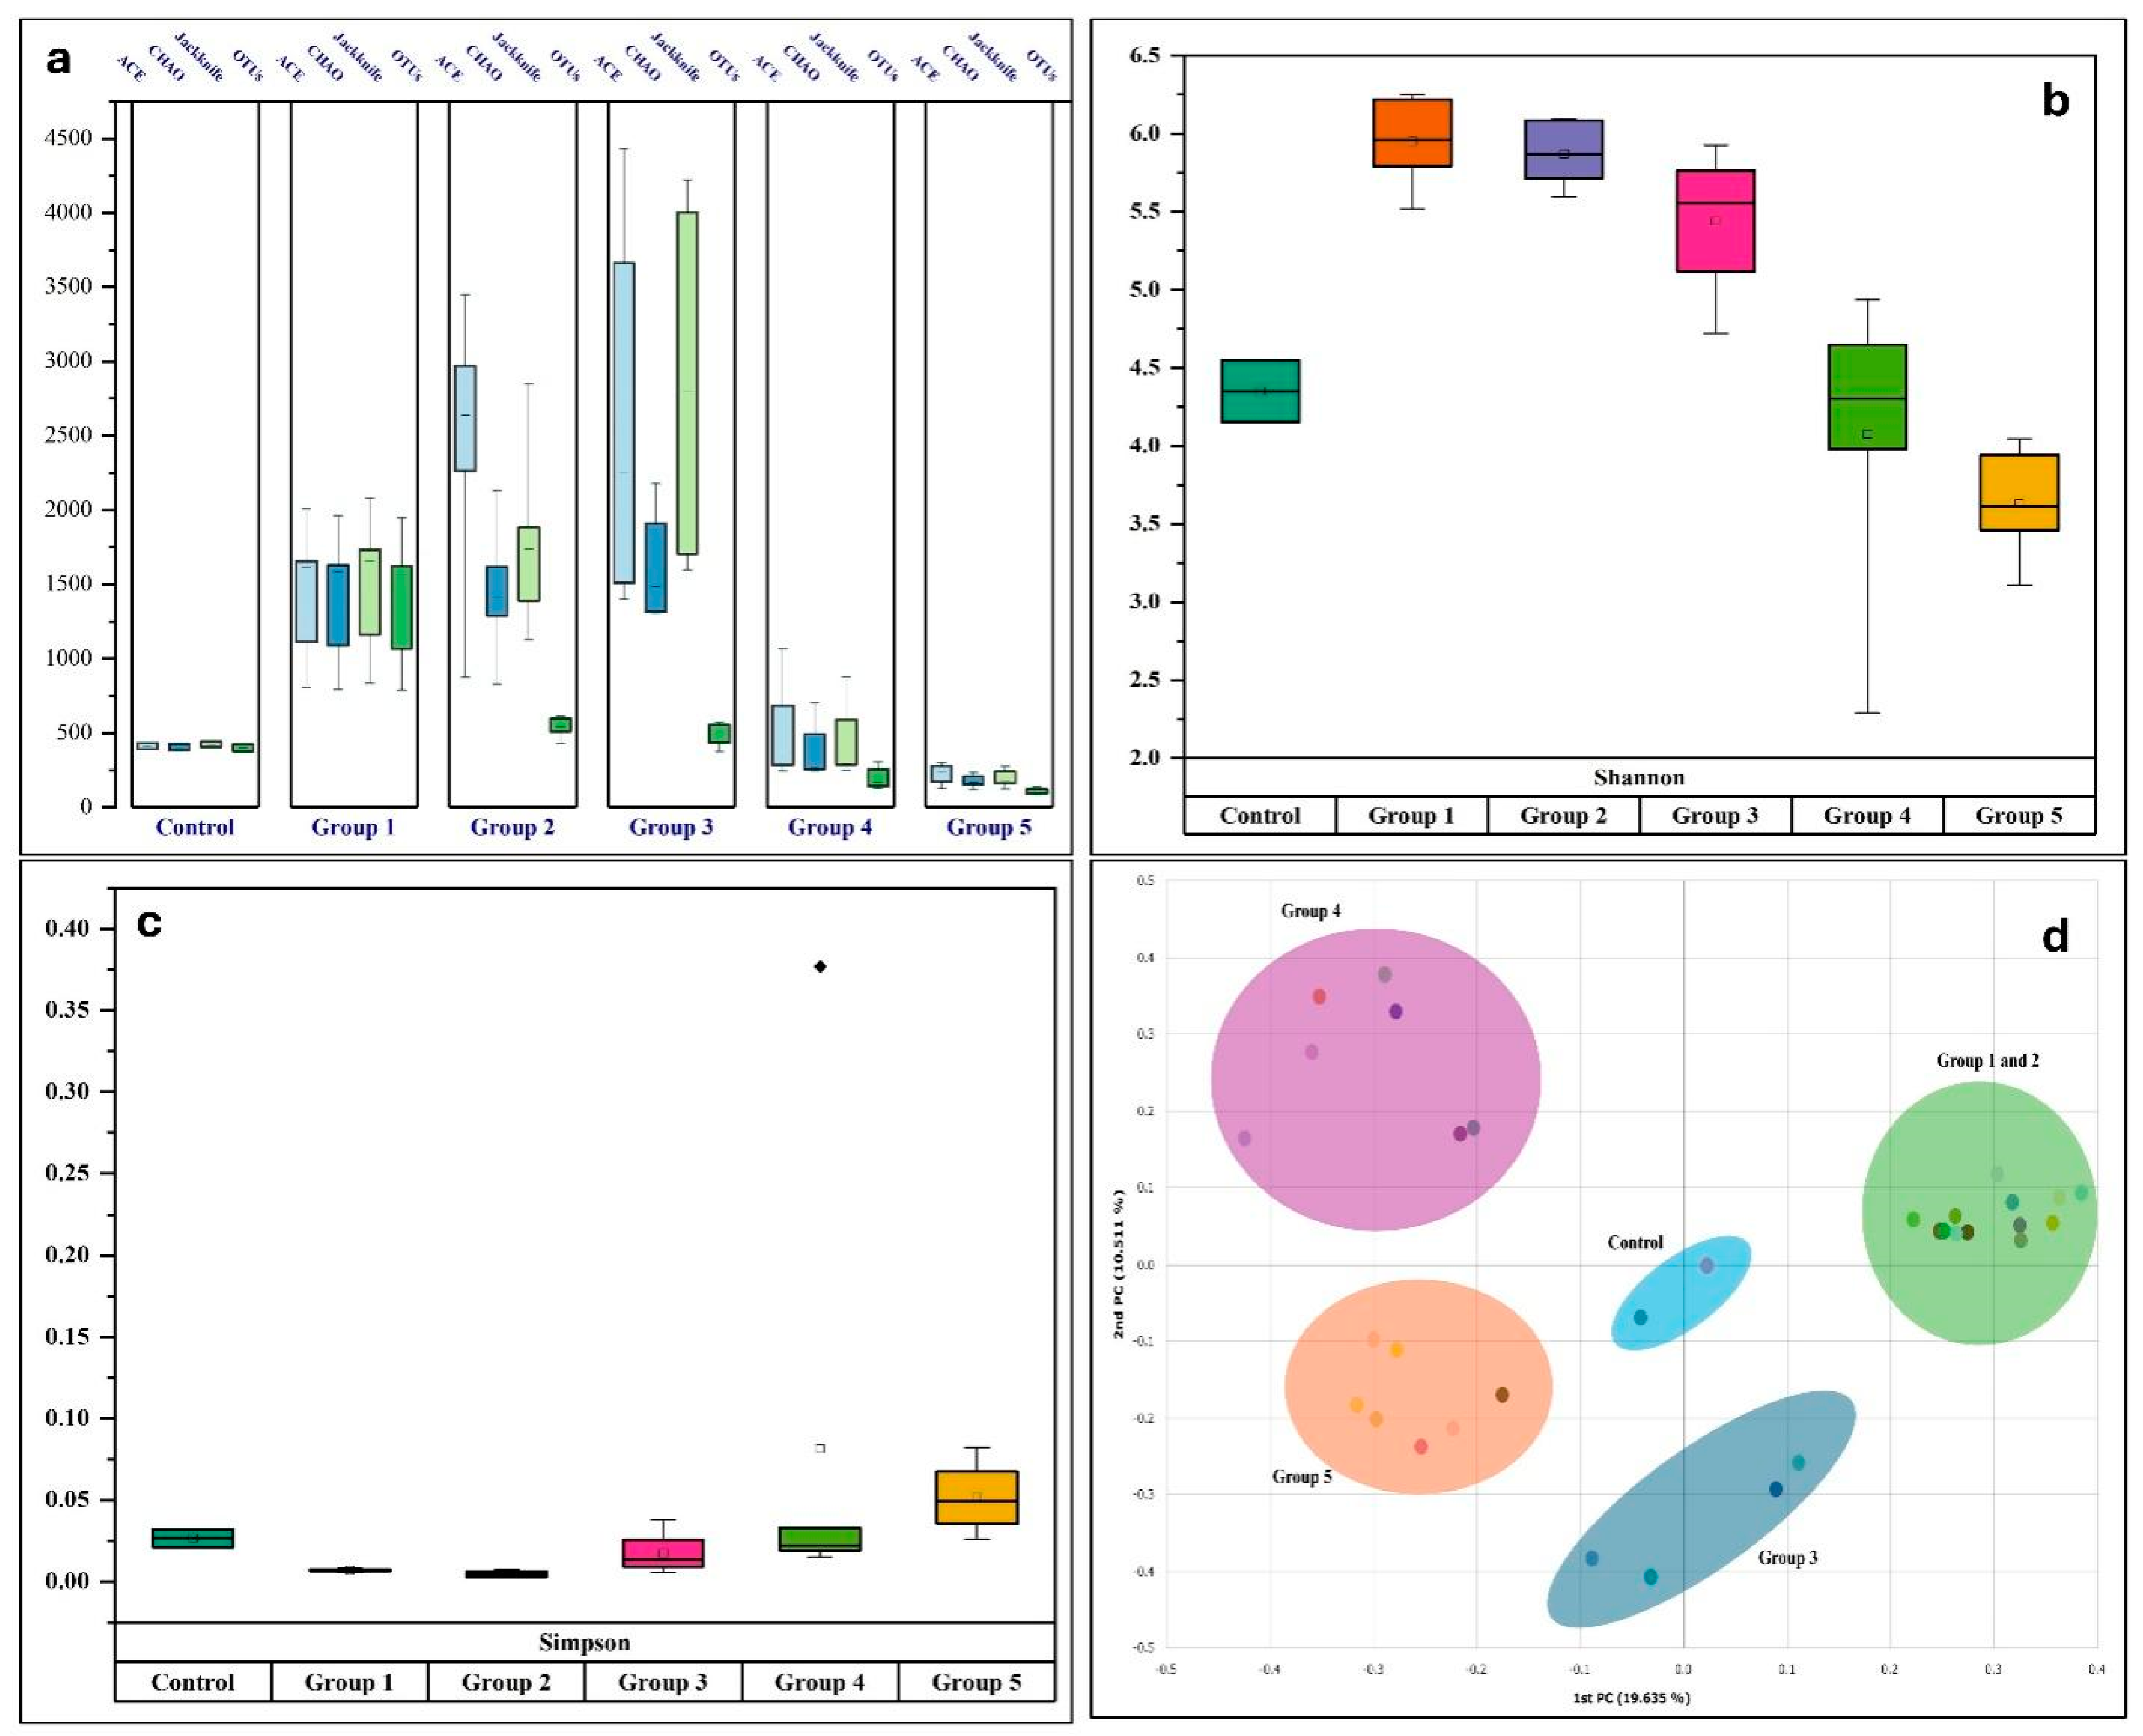
Alpha diversity metrics, including Chao1, Shannon and Simpson indices, were calculated to evaluate bacterial diversity in estuarine sediments (Figure 3). The Chao1 index indicated that species richness was notably higher in the G3 sediments (1,613 ± 405), located near the mouth of the estuary within the tidal mixing zone, with the lowest richness observed in the G5 samples (176 ± 41) (Figure 3a). As measured by the Shannon index, species diversity was highest in the G1 sediment samples and showed a gradual decrease from riverine to estuarine and coastal sediments (Figure 3b). Conversely, the Simpson index, indicating the concentration of individuals within species, was higher in the G4 (0.48) and G5 (0.31) samples compared to those from estuarine (0.07) and riverine (0.02 - 0.04) sediments (Figure 3c). Analysis of the Bray-Curtis dissimilarity among sediment bacterial communities highlighted variations in community structure across different sampling points (Figure 3d). Specifically, Group 1 and Group 2 sediment samples exhibited similar bacterial community structures, clustering closely without significant differences between them. In contrast, Group 4 and Group 5 samples showed distinct variations and formed separate clusters. Group 3, on the other hand, demonstrated unique bacterial communities that differed markedly from those of the other groups and control samples.

3.3. Bacterial Community Composition in Sediment Samples

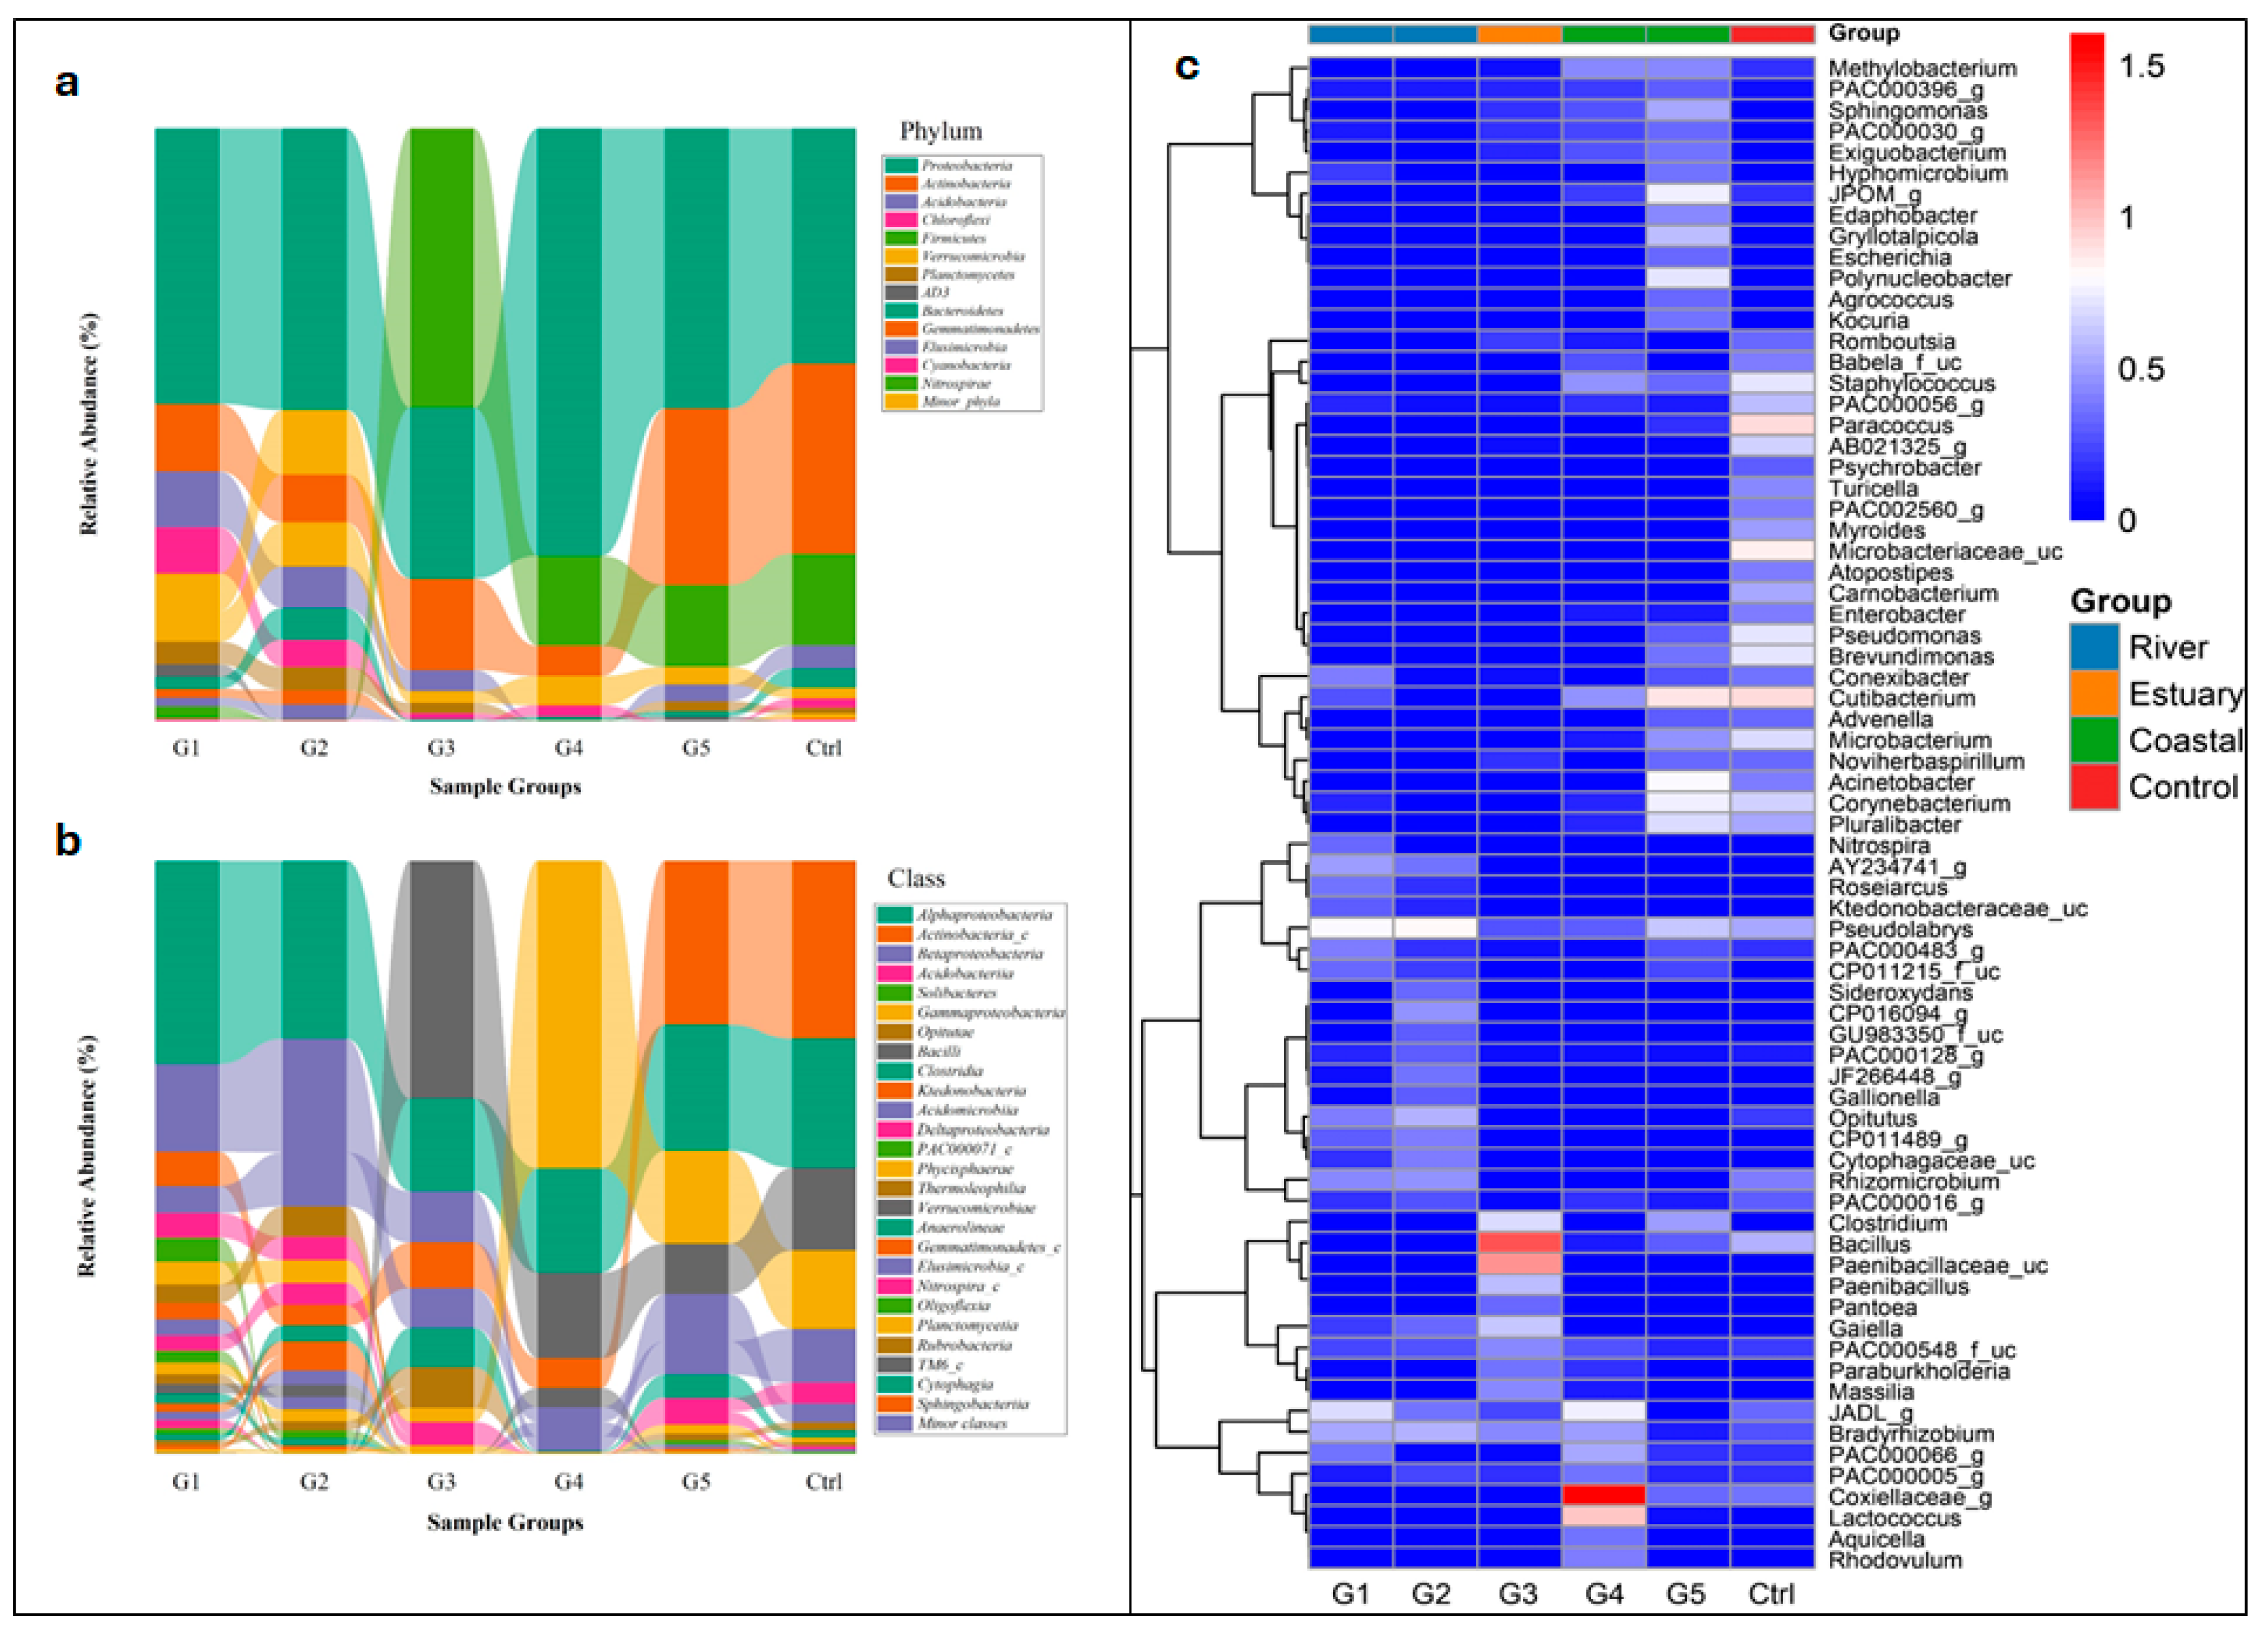
Taxonomic classification identified over 23 phyla across all sediment samples. Proteobacteria was the predominant phylum in nearly all samples, with relative abundances ranging from 39.65% (control) to 72.09% in the G4 coastal sediment sample (Figure 4a). However, the estuarine sediment sample (G3) was an exception, where Firmicutes emerged as the most dominant phylum at 47.09%. In the riverine sediment G1 and G2 samples, Actinobacteria (8.08 - 11.37%) and Acidobacteria (6.96 - 9.47%) were the second most dominant phyla, respectively. Following Firmicutes in the estuarine G3 sample, the next most abundant phyla were Proteobacteria (28.85%) and Actinobacteria (15.43%). Conversely, the coastal sediment samples (G4 and G5) displayed Actinobacteria (29.74 - 32.07%) and Firmicutes (13.87 - 15.49%) as the second most dominant phyla, respectively. Less prevalent phyla in the riverine samples included Chloroflexi (4.51 - 7.76%), Verrucomicrobia (5.18 - 7.46%), and Bacteroidetes (2.07 - 5.4%). These phyla appeared in relatively lower abundances in the estuarine and coastal sediments. Both Planctomycetes (0.99 - 3.92%) and Cyanobacteria (0.14 – 1.92%) were also found in low quantities across all samples.
Figure 4b illustrates the diversity of bacterial communities at the class level across different sediment types in Adyar Creek. Alphaproteobacteria was the predominant class in the riverine sediments, with abundances ranging from 30.07% to 34.32%. Conversely, Bacilli dominated the estuarine sediments, comprising 40.17% of the bacterial population, while Gammaproteobacteria was the most prevalent class in coastal sediments, ranging from 15.71% to 51.94%. The control samples were primarily characterized by Actinobacteria, accounting for 30.01% of the community. Betaproteobacteria was consistently present across all sediment types, with concentrations varying from 2.38% to 9.11%. Acidobacteriia showed a higher presence in riverine sediments (3.91% - 4.14%) compared to estuarine (2.13%) and coastal (2.33%) sediments. Specific bacterial classes such as Opitutae, Ktedonobacteria, Acidimicrobiia, Nitrospira, and Verrucomicrobiae were solely found in riverine sediments. Classes like Clostridia, Thermoleophilia, and Rubrobacteria exhibited significant abundances greater than 3% in estuarine sediment compared to other sediment types. Other detected classes, including Deltaproteobacteria, Solibacteres, Planctomycetia, and Sphingobacteriia, were present across all sampling zones, indicating a broad distribution across different sedimentary environments.
At the genus level, bacterial composition exhibited variability across the different sediment groups (Figure 4c). In riverine sediments, predominant genera included Pseudolabrys (5.03 - 5.54%), JADL_g (1.41 - 3.90%), Bradyrhizobium (2.48 - 2.53%), AY234741_g (1.27 - 2.17%), Rhizomicrobium (1.62 - 1.86%), Conexibacter (1.06 - 1.55%), Opitutus (1.45 - 1.76%), and Nitrospira (0.66 - 1.20%). In contrast, estuarine sediments were characterized by different dominant genera, notably Bacillus (20.26%), unclassified Paenibacillaceae (12.87%), Clostridium (3.81%), Gailella (3.17%), Paenibacillus (3.02%), Massilia (1.70%), Paraburkholderia (1.42%), and Pantoea (1.15%). Coastal sediments displayed a distinct set of predominant bacterial genera compared to riverine and estuarine groups, including Coxiellaceae_g (1.19 - 39.43%), Lactococcus (0.2 - 8.39%), Cutibacterium (1.8 - 6.73%), Acinetobacter (0.51 - 5.19%), Corynebacterium (0.45 - 4.57%), Polynucleobacter (0.37 - 4.38%), Methylobacterium (0.42 - 1.65%), Microbacterium (0.62 - 1.98%), and Staphylococcus (1.23 - 1.99%). Several genera, including JADL_g, Bradyrhizobium, Pseudolabrys, Sphingobacterium, and members of the PAC clade, were found in all sediment samples. This suggests a core microbial community persists across these environments despite variations in environmental conditions.

3.4. Redundancy Analysis

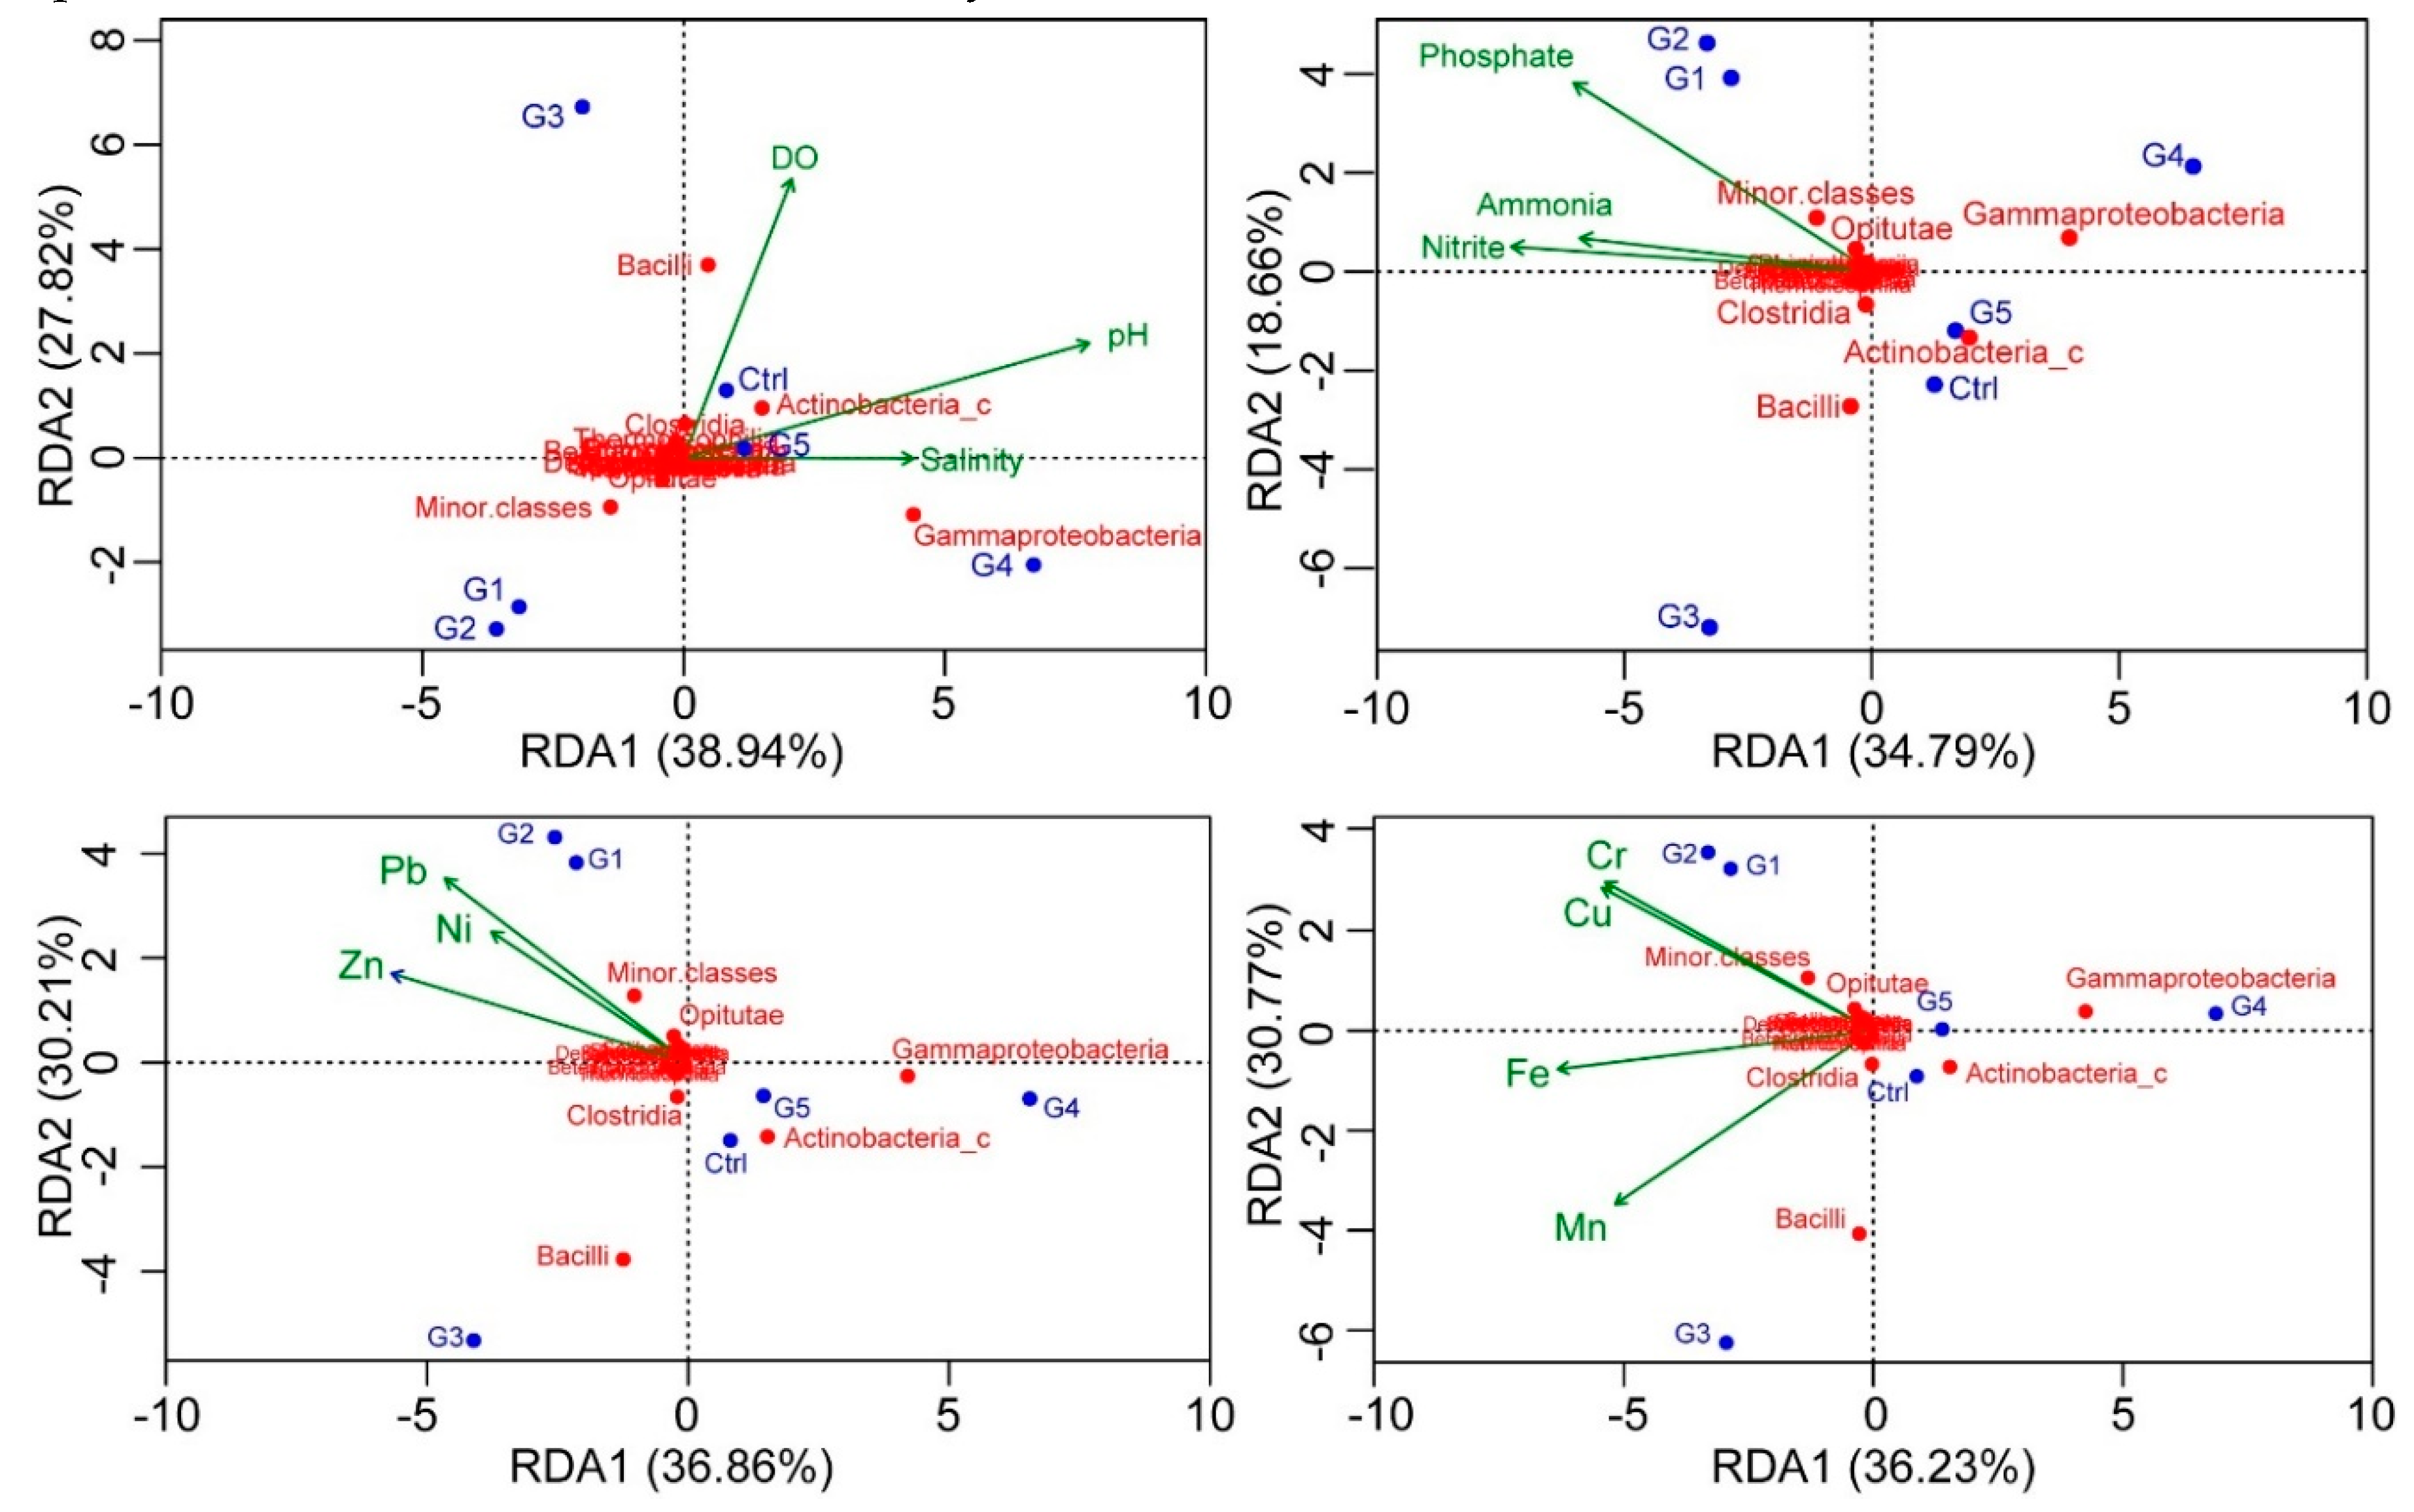
A Redundancy Analysis (RDA) was conducted based on bacterial class abundance and physicochemical factors to identify the environmental variables influencing bacterial community structures across different sediments. The RDA-analysis (Figure 5) identified pH, salinity, phosphate, and nitrate as the most significant environmental factors influencing variations in bacterial community composition across the sediment samples. Dissolved oxygen (DO) and ammonia concentrations also played a role. Among the toxic heavy metals, iron (Fe), lead (Pb), chromium (Cr), and copper (Cu) demonstrated the highest explanatory power, followed by zinc (Zn), manganese (Mn), and nickel (Ni). The analysis showed that salinity and pH strongly influenced the prevalence of Gammaproteobacteria and Actinobacteria. Conversely, the DO levels strongly influenced Firmicutes, particularly the Bacilli and Clostridia classes. Although the toxic heavy metals were predominantly concentrated in the riverine sediments, they showed minimal direct influence on specific bacterial classes in the estuarine and coastal sediments. Nonetheless, they impacted minor classes and Opitutae within the bacterial community.

3.5. Functional Prediction Analysis

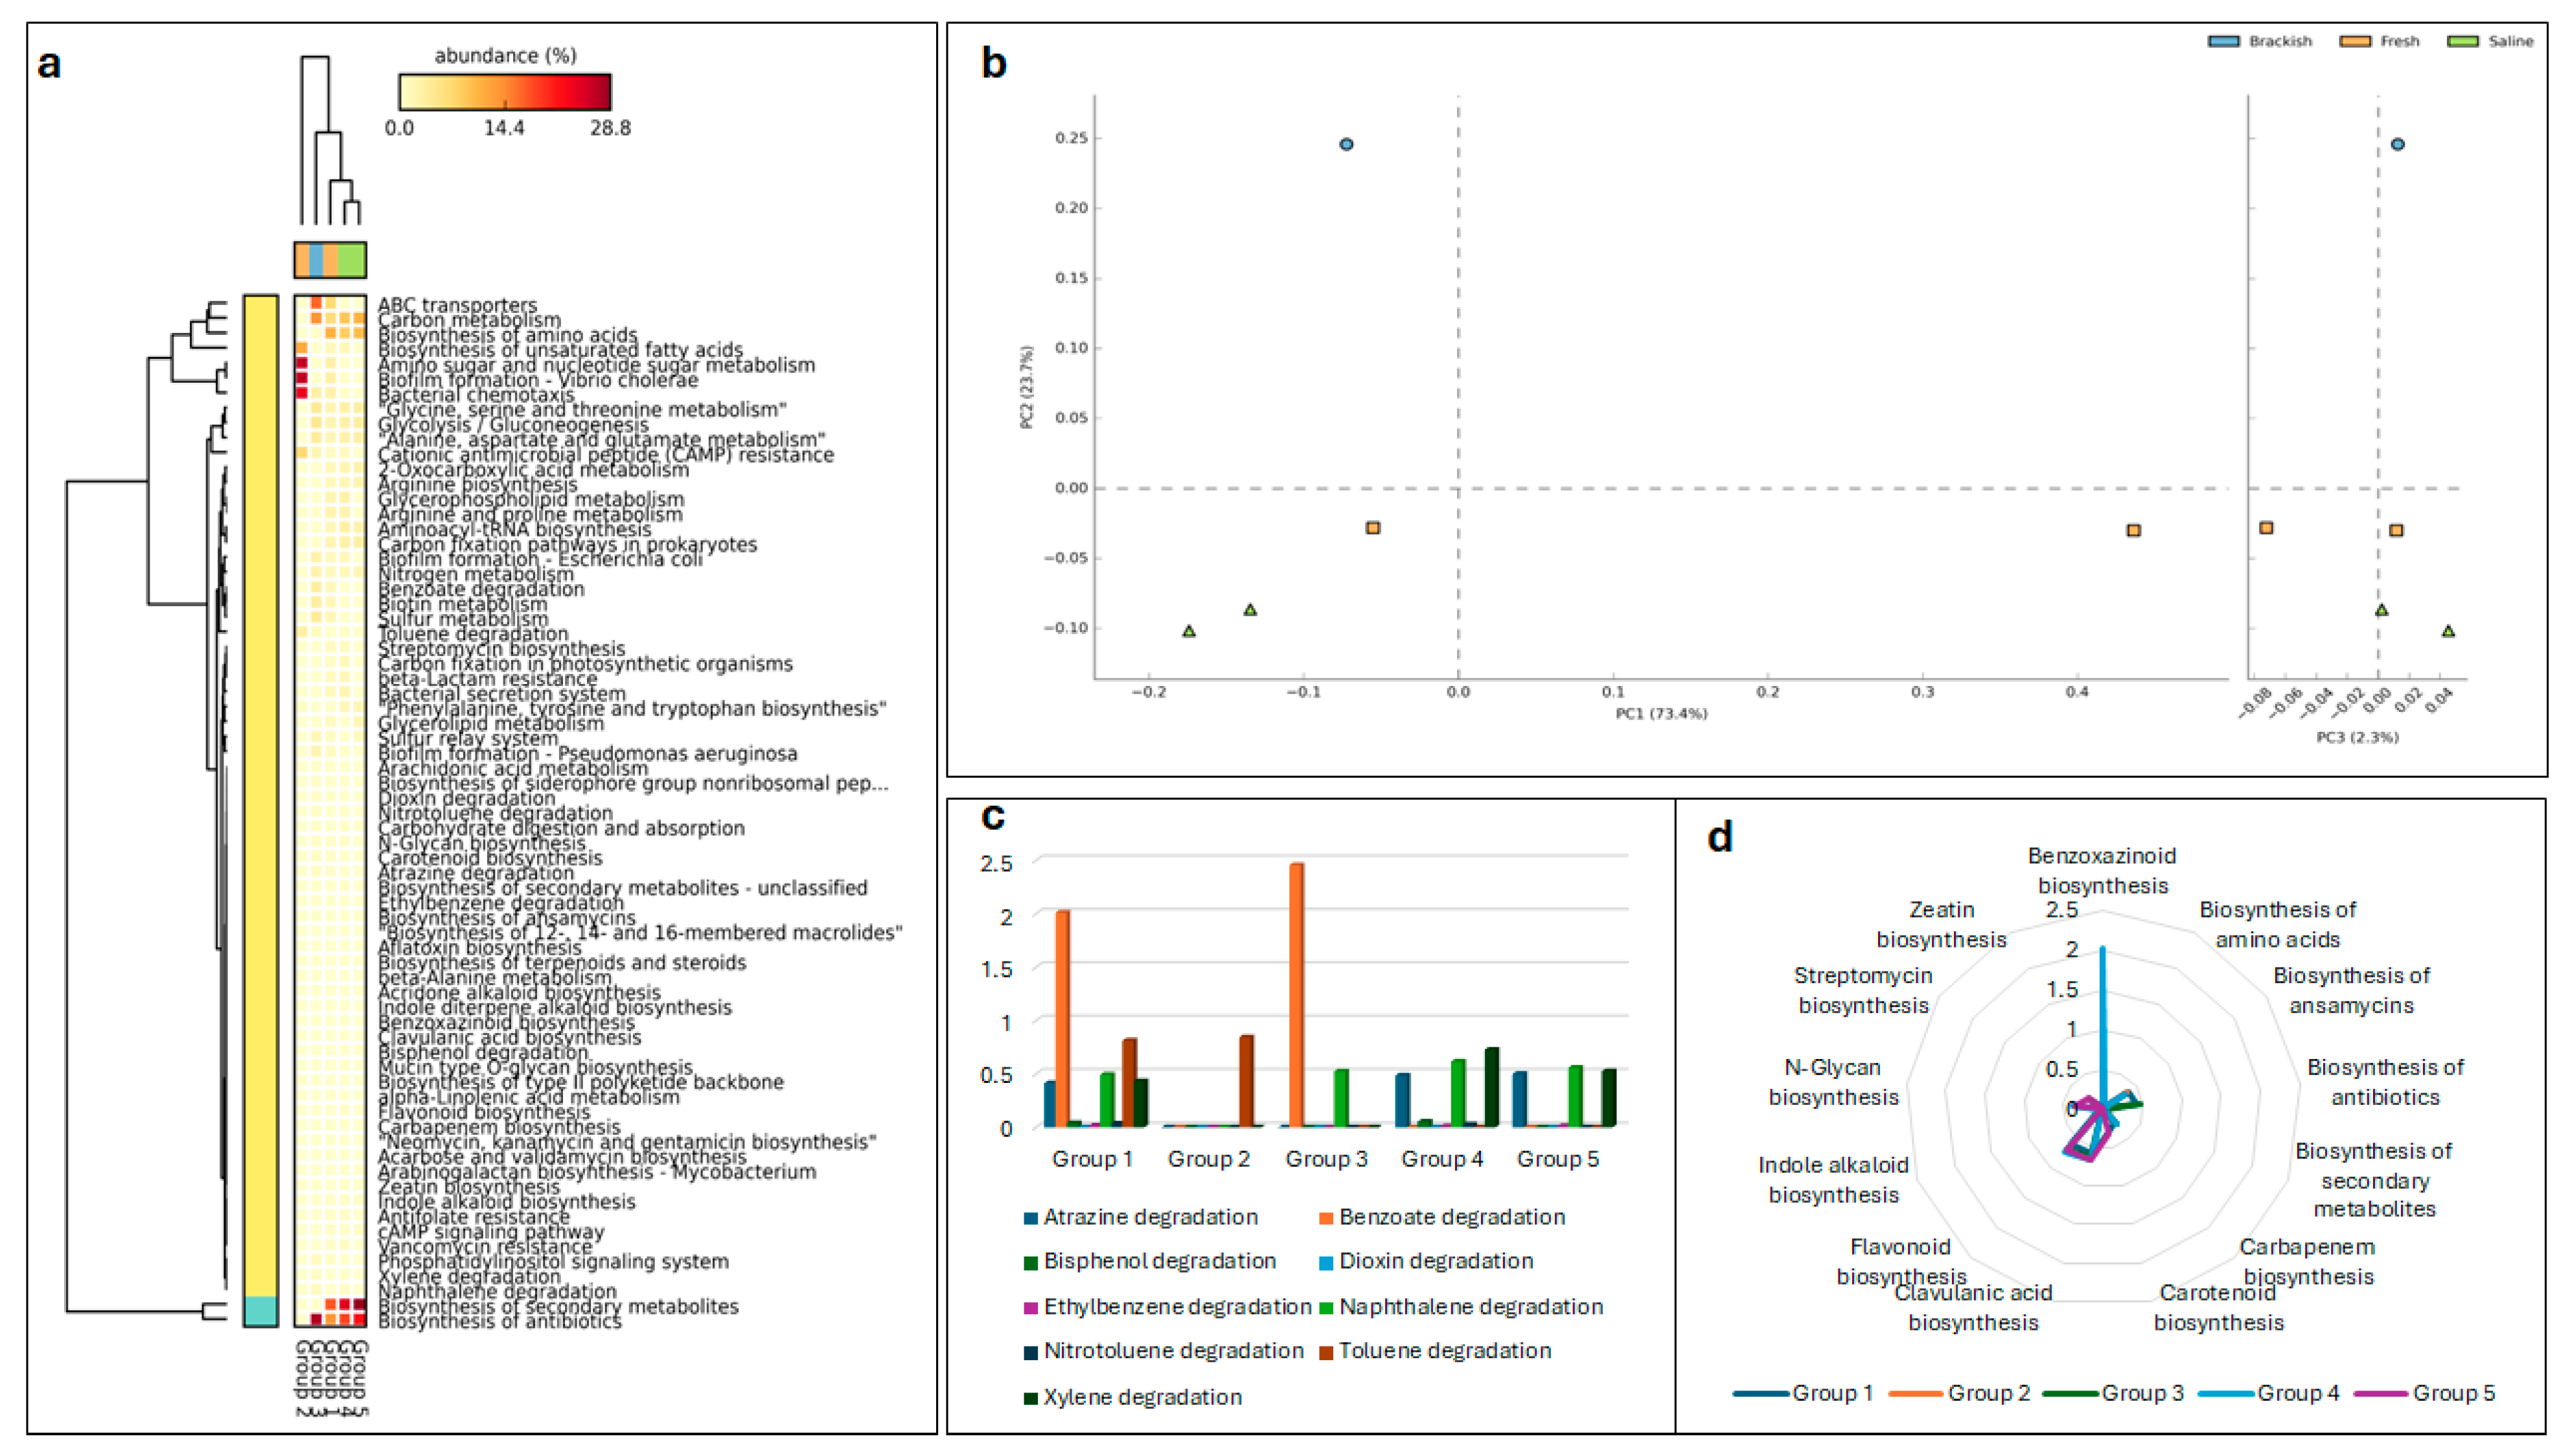
A PICRUSt2 analysis predicted the metabolic functions differed between estuarine/riverine bacterial communities (Figure 6a). Estuarine sediments exhibited a notably higher expression of genes associated with ABC transporters and carbon metabolism than other samples. Riverine bacterial communities, on the other hand, displayed enhanced functional potential in genes related to bacterial chemotaxis, biofilm formation, unsaturated fatty acid synthesis, and amino sugar metabolism. Coastal sediment bacterial communities primarily expressed functional genes involved in the biosynthesis of antibiotics and secondary metabolites (Figure 6b). Degradation potential genes were present in all sediment samples (Figure 6c), with variations in specific degradation capabilities. Estuarine bacterial communities were significantly involved in the degradation of benzoate and naphthalene. Riverine sediments displayed a broader range of degradation capabilities, including genes for bisphenol, naphthalene, toluene, and atrazine degradation. Coastal bacterial communities were particularly active in the degradation of naphthalene and xylene. Notably, genes involved in benzoxazinoid biosynthesis were predominantly found in estuarine sediments. Additionally, genes for the biosynthesis of antibiotics, secondary metabolites, amino acids, and pigments were observed in all samples (Figure 6d).

3.6. LEfSe and Co-Occurrence Network Analysis

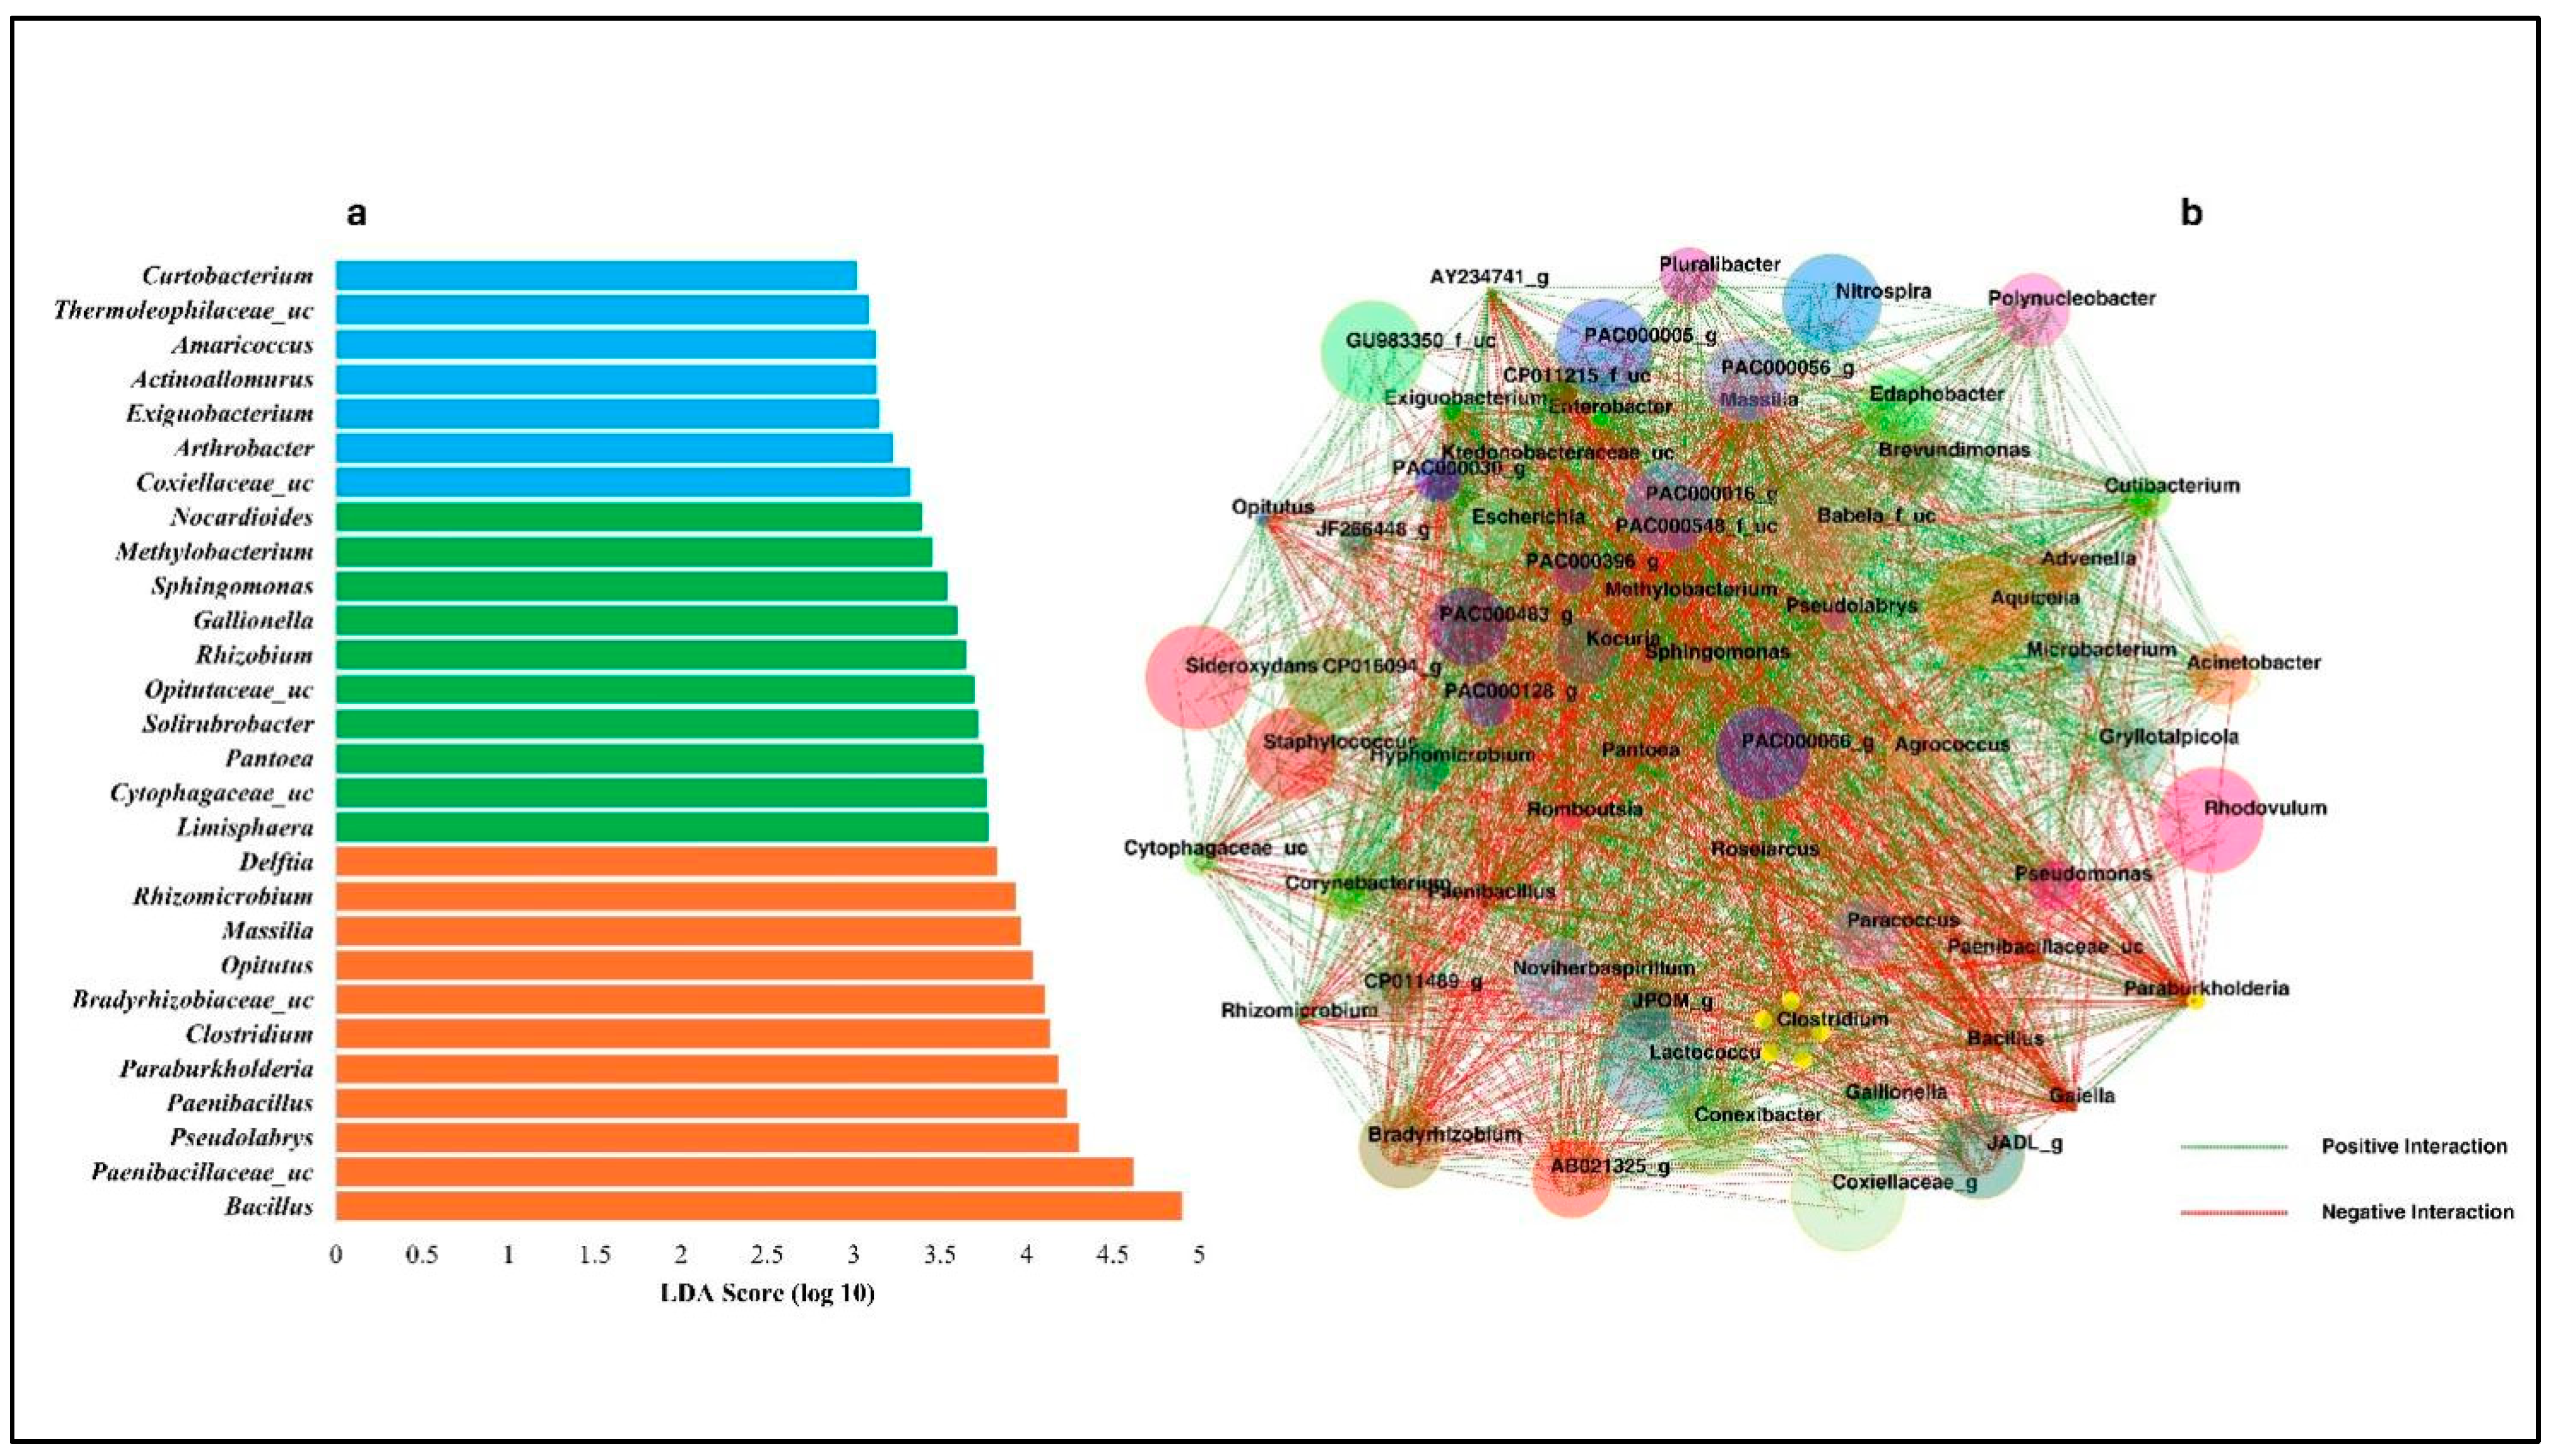
Linear Discriminant Analysis (LDA) Effect Size (LEfSe) analysis was utilized to identify effective microbial bioindicators within the collected sediment samples. LEfSe analysis identified 29 bacterial groups showing significant differences (LDA score ≥ 3.5) in abundance between the three sediment types (Figure 7a). For instance, Bacillales dominated in estuarine sediments, while Thermoleophilales and Legionellales were prevalent in riverine sediments, and Pedosphaera_f and Cytophagaceae were dominant in coastal sediments. The analysis also revealed representation patterns: 11 bacterial members were overrepresented in estuarine samples, 10 in coastal, and 7 in riverine samples. The bacterial co-occurrence network was analyzed using correlation coefficients, revealing a network comprising 62 nodes and 3,018 edges (Figure 7b). This network displayed 1,766 strong positive correlations and 1,212 negative correlations across the samples. Notably, there were 700 positive and 668 negative interactions among the riverine and estuarine samples. Between estuarine and coastal samples, 1,066 positive and 544 negative interactions were noted. Interestingly, PAC bacterial members between riverine and estuarine samples exhibited more positive interactions (124) with other bacterial members (average r = 0.928). The dominant bacterial member in the estuarine samples, Bacillus, showed strong interactions (r = 0.99) with other prevalent members, including Clostridium, Paenibacillus, Paraburkholderia, Sphingomonas, and Methylobacterium. The observed modularity indices above 0.4 indicate that the co-occurrence networks of the bacterial communities possess a strong modular structure with complex species interactions across the three groups.

4. Discussion

Microorganisms are crucial to the functioning of estuarine ecosystems, facilitating essential interactions between biological and chemical processes and acting as a bridge between ecological dynamics and biogeochemical cycles [37]. These microbial activities, such as nutrient cycling, decomposition, and pollutant degradation, play a vital role in maintaining the stability and productivity of estuarine ecosystems. The structure of microbial communities in sediments can vary with differing hydrodynamic conditions across the estuarine gradient [38]. Therefore, sediments from riverine to coastal zones within the estuarine ecosystem harbour highly complex microbial communities with notable variations in composition and diversity. In this study, species richness was highest in estuarine sediments, followed by riverine and coastal sediments (Figure 3a). This pattern may be due, in part, to the increasing salinity from riverine to estuarine sediments (Table 1), which typically favours estuarine bacterial communities. However, the observed decrease in species richness in coastal sediments may be attributed to factors such as tidal disturbances and the dispersion of microbial communities. This observation is consistent with the results reported by Campbell and Kirchman (2013), who noted considerable changes in bacterial richness along salinity gradients, with the lowest diversity occurring in the transition zone between freshwater and marine environments. Furthermore, as indicated by the Shannon index, bacterial diversity was highest in the riverine sediments, followed by estuarine and coastal sediments. This pattern may be due to differences in nutrient concentrations across the sediment samples (Table 1). Higher levels of nutrients such as nitrogen and phosphorus in wetland sedimentary systems contribute to increased microbial diversity [40].
Variations in microbial community composition across the three sediment groups can be attributed to the ecological roles played by dominant microbial taxa. In riverine and coastal sediments, Proteobacteria emerged as the predominant phylum (Figure 4a). However, estuarine sediments were primarily dominated by Firmicutes followed by Proteobacteria, indicating a notable deviation. Proteobacteria, the predominant bacterial community in sediment environments, are extensively found in nature and play vital roles in the global cycling of carbon, nitrogen, and sulfur [41,42] as well as in degradation and metabolism [43]. While many recent studies on various estuarine sediments have identified Proteobacteria as the dominant phylum in various estuarine sediments [25,41,44,45,46], a study by Huang et al., (2019) found that Firmicutes were more abundant in estuarine sediments around Taihu Lake compared to lake and wetland sediments. Additionally, a study by Anderson et al. (2018) suggested that increases in soil pH could solubilize organic matter, significantly enhance denitrification potential, and stimulate growth within the Firmicutes phylum. This may explain the prevalence of Firmicutes in estuarine sediments observed in this study, which also recorded a gradual increase in pH along with high ammonium and nitrate concentrations. Further, the authors identified that pure isolates from the microcosms were dominated by Bacillus and exhibited varying nitrate reductive potential. Consistently, Bacillus was identified as the dominant indicator genus in the estuarine sediments of this study (Figures 4c and 7a). Moreover, studies indicate that Acidobacteria is strongly associated with pH levels and prefers environments exhibiting lower pH [29,49]. In this study, the riverine sediments, which had a lower pH than other sediment types, showed a higher abundance of Acidobacteria. Furthermore, the phylum Actinobacteria was found across all sediment types. Their ubiquitous presence in estuarine systems is beneficial for various ecological functions, including the decomposition of leaf litter [50], breakdown of hydrocarbons [51], metal oxidation [52], and nitrate reduction [53].
The predominance of Alphaproteobacteria in riverine sediments aligns with findings from other estuarine studies [1,47]. While some studies have indicated a higher occurrence of Betaproteobacteria compared to Alphaproteobacteria in freshwater zones of estuaries, potentially due to lower salinity levels [5,54], the higher salinity observed in our study area typically favours Alphaproteobacteria. This indicates that shifts in salinity significantly influence the distribution and abundance of both Beta- and Alphaproteobacteria. However, the specific processes that drive bacterial community shifts at varying salinity levels remain poorly understood. Members of Alphaproteobacteria may be involved in nutrient cycling processes, especially given their known roles in carbon and nitrogen cycles. This is supported by the RDA findings (Figure 5) where nitrate and phosphate levels, important for such biogeochemical processes, play a critical role in microbial community variance. In contrast, Gammaproteobacteria were the predominant class in coastal sediments, consistent with findings that they dominate in most ocean water and sediments [55,56]. Known for their active roles in carbon fixation, sulfur oxidation, and ammonia oxidation, Gammaproteobacteria play crucial ecological functions in marine environments [57]. Estuarine sediments were predominantly composed of Bacilli (Figures 4c and 7a), consistent with previous studies [47,58]. This dominance suggests an estuarine environment enriched with organic matter from human activities, supporting strong decomposition activities. These processes may be influenced by the relatively stable and possibly higher pH levels compared to the other riverine sediments, as indicated by the RDA. Acidobacteria, which are more abundant in riverine sediments, align with their preference for less saline, more acidic environments, reflecting the influence of pH on microbial distribution patterns. Coastal sediments show a distinct bacterial profile with genera such as Lactococcus and Coxiellaceae_g, highlighting adaptations to saline conditions and dynamic coastal environments. These genera, which are endosymbionts potentially driven by terrestrial pollution, significantly contribute to nutrient metabolism and detoxification processes in these environments [59,60]. Moreover, dissolved oxygen levels notably affected the prevalence of Firmicutes, particularly Bacilli and Clostridia, indicating the critical role of oxygen in regulating anaerobic processes. Although heavy metals such as Fe and Pb were significant predictors in the RDA, their impact was more visible on minor bacterial classes, suggesting some indirect interactions between microbial communities and metal contaminants.
In estuarine and riverine sediments, a diverse array of functional genes related to nutrient cycling processes, such as ABC transporters and carbon metabolism in estuaries, as well as chemotaxis and biofilm formation in riverine areas (Figure 6a), underscores the adaptability and ecological roles of these bacteria. ABC transporters play a key role in importing essential nutrients like organic nitrogen sources (ammonium/urea and amino acids/peptides), sugars, phosphorus/phosphonate, and metal-chelate complexes [61], supporting the nutrient dynamics in these environments. ABC transporters in Firmicutes, particularly in Gram-positive bacteria (Bacillus and Clostridium), are crucial for bacterial resistance, transport mechanisms, and gene regulation [62]. Furthermore, Pseudolabrys, Rhizomicrobium, Delftia, and Massilia belonging to the order Hyphomicrobiales, Rhizobiales, and Burkholderiales were significantly present and are known to have metabolic capabilities for transforming C as well as N compounds [63,64,65]. These bacterial taxa regulate nutrient and organic carbon levels within the estuarine environments [45]. Riverine sediments exhibited a wide range of degradation capabilities (Figure 6c), including genes responsible for the breakdown of bisphenol, naphthalene, toluene, and atrazine. Although this study did not directly assess PAH concentrations in the sediments, high levels of PAHs are typically associated with riverine sediments due to petroleum-related activities and the combustion of fossil fuels near Adyar Creek [17]. Naphthalene and other low-molecular-weight hydrocarbons can serve as energy sources for certain bacteria. While PAHs can be toxic to bacteria at high concentrations [27], they may support bacterial growth and even enhance microbial activity across a range of concentrations commonly found in the environment. Coastal bacterial communities showed particular abilities in degrading naphthalene and xylene. Studies have revealed that the genus Exiguobacterium, isolated from nearshore surface sediments of the Pacific Ocean, is capable of breaking down compounds such as benzene, toluene, and xylene [66], a finding that aligns with the observed dominance of Exiguobacterium in coastal sediment samples in this study. Likewise, the degradation of naphthalene may be facilitated by Arthrobacter, a halotolerant bacterium known for its ability to decompose polycyclic aromatic hydrocarbons [67].
Co-occurrence networks are essential for deciphering interactions within complex microbial ecosystems (Lv et al., 2022). In estuarine sediments, Bacillus, a key member, exhibited more negative (72) than positive (66) interactions (Table S1; Supplementary Materials). Within this network, Bacillus has strong positive associations with Clostridium, Massilia, and Paenibacillus but negative interactions with Opitutae, Pseudolabrys, and Rhizomicrobium. Interestingly, although Bacillus and Paenibacillus belong to the same class, Bacillus showed a cooperative relationship with Massilia, a different class member, and positively interacted with the obligatory anaerobe Clostridium. Cooperative interactions among bacteria can be established through the exchange of intermediate metabolites, electron carriers, or the removal of inhibitory by-products [68]. In such dynamics, metabolites produced by one bacterium may serve as resources for another. These strong positive interactions, especially among oligotrophic bacteria, enhance the efficient utilization of nutrients within estuarine ecosystems [69]. This suggests that key bacterial players in specific environments control specialized metabolic functions and are critical in maintaining community stability and ecological functionality [70]. Moreover, the movement and distribution of bacteria among riverine, estuarine, and coastal sediments exhibit a complex pattern. Distinct key members from these environments exhibit selective dispersal behaviours (Figure S1; Supplementary Materials). For instance, Bacillus was predominantly dispersed from estuarine to coastal sediments rather than riverine environments, while Pseudolabrys from riverine sediments tends to move towards coastal rather than estuarine environments. Conversely, the coastal sediment member Coxiellaceae_g showed no significant dispersal to estuarine or riverine sediments. Other estuarine bacterial members are more likely to spread to coastal rather than riverine sediments, suggesting that bacteria acclimated to estuarine conditions may be better suited to coastal environments than riverine ones. However, various factors can influence bacterial mobility, including nutrient availability, predation pressure, physicochemical conditions, and interactions with other bacterial species [71]. Thus, the dynamics between bacterial members and the given ecosystem are crucial in determining their dispersion patterns.

5. Conclusions

This study provides the first comprehensive analysis of bacterial diversity across riverine, estuarine, and coastal sediments of the Adyar Creek estuary in Tamil Nadu, India. A gradual increase in salinity from riverine to estuarine and coastal sediments was observed, significantly impacting the variations in bacterial diversity observed. Proteobacteria predominated in riverine and coastal sediments, while Firmicutes was the major phylum in estuarine samples. Additionally, there was considerable variability in bacterial genera across different sediment types. Redundancy Analysis (RDA) revealed that salinity, nutrients, and toxic metals were the primary factors influencing variations in bacterial composition. Predictive functional analysis highlighted that while coastal bacterial communities exhibited similar metabolic functions, those in estuarine and riverine sediments displayed diverse functions. Bacillus, a key bacterial member in estuarine samples, demonstrated strong interactions with other significant bacteria, emphasizing its role in specialized metabolic processes and maintaining community stability and ecological health. Moreover, this study highlights the potential of using specific indicator ASVs as a valuable tool for monitoring ecosystem health and pollution within the Adyar Creek estuary. These findings pave the way for future studies to explore the functional roles of dominant members in maintaining estuarine health or to develop an Estuarine Bacterial Index based on the identified indicator taxa. However, microbial communities can change rapidly due to environmental pressures, seasonal changes, or anthropogenic impacts. This study's lack of temporal data can limit understanding of these dynamics. Therefore, understanding these variations in bacterial communities can provide insights into their potential influence on the overall functioning of the estuary ecosystem, including nutrient cycling and organic matter decomposition.

Supplementary Materials

The following supporting information can be downloaded at the website of this paper posted on Preprints.org, Figure S1: Sankey-plot showing selective dispersal behaviours exhited by distinct key members from the studied environments; Table S1: Co-occurrence network correlations.

Author Contributions

Conceptualization, R.S. and M.Y..; methodology, R.S. and M.Y.; software, R.S., M.Y. and H.J.O.O.; validation, A.L.K.A., H.J.O.O. and T.S.; formal analysis, H.J.O.O., A.L.K.A. and T.S.; investigation, R.S. and M.Y.; writing—original draft preparation, R.S.; writing—review and editing, ALL; visualization, A.L.K.A. and T.S.. All authors have read and agreed to the published version of the manuscript.

Funding

Please add: This research received no external funding, and the APC was funded by R.S., A.L.K.A., and the University of KwaZulu-Natal Research Office.

Data Availability Statement

All data have been included in the manuscript and supplementary materials.

Acknowledgments

The authors express their gratitude to Mr. Abdul Ajmeer and Mr. Murugesan for their assistance in collecting and transporting samples. We also extend our thanks to UNISA (Florida campus) for making the Illumina sequencing platform available for our sample sequencing. Additionally, we appreciate the support provided by the Centre for High-Performance Computing (CHPC) facility in South Africa, which offered computational resources for analysing sequence data.

Conflicts of Interest

The authors declare no conflicts of interest.

References

  1. Vijayan, J.; Nathan, V.K.; Ammini, P.; Ammanamveetil, A.M.H. Bacterial Diversity in the Aquatic System in India Based on Metagenome Analysis—A Critical Review. Environ. Sci. Pollut. Res. 2023, 30, 28383–28406. [Google Scholar] [CrossRef] [PubMed]
  2. Nybakken, J.W. Seagrass Communities. Mar. Biol. An Ecol. Approach, fifth ed. Benjamin Cummings, an Impr. Addison-Wesley Longman, San Fr. 2001, 210–218. [Google Scholar]
  3. Karthigeyan, K.; Kumaraswamy, I.; Arisdason, W. An Assessment of Angiosperm Diversity of Adyar Estuary, Chennai - A Highly Degraded Estuarian Ecosystem, Tamil Nadu, India. Check List 2013, 9, 920–940. [Google Scholar] [CrossRef]
  4. Dupont, C.L.; Larsson, J.; Yooseph, S.; Ininbergs, K.; Goll, J.; Asplund-Samuelsson, J.; McCrow, J.P.; Celepli, N.; Allen, L.Z.; Ekman, M.; et al. Functional Tradeoffs Underpin Salinity-Driven Divergence in Microbial Community Composition. PLoS ONE 2014, 9. [Google Scholar] [CrossRef]
  5. Parvathi, A.; Catena, M.; Jasna, V.; Phadke, N.; Gogate, N. Influence of Hydrological Factors on Bacterial Community Structure in a Tropical Monsoonal Estuary in India. Environ. Sci. Pollut. Res. 2021, 28, 50579–50592. [Google Scholar] [CrossRef]
  6. Vajravelu, M.; Martin, Y.; Ayyappan, S.; Mayakrishnan, M. Seasonal Influence of Physico-Chemical Parameters on Phytoplankton Diversity, Community Structure and Abundance at Parangipettai Coastal Waters, Bay of Bengal, South East Coast of India. Oceanologia 2018, 60, 114–127. [Google Scholar] [CrossRef]
  7. Kisand, V.; Valente, A.; Lahm, A.; Tanet, G.; Lettieri, T. Phylogenetic and Functional Metagenomic Profiling for Assessing Microbial Biodiversity in Environmental Monitoring. PLoS ONE 2012. [Google Scholar] [CrossRef]
  8. DeLong, E.F.; Karl, D.M. Genomic Perspectives in Microbial Oceanography. Nature 2005, 437, 336–342. [Google Scholar] [CrossRef]
  9. Raina, V.; Panda, A.N.; Mishra, S.R.; Nayak, T.; Suar, M. Microbial Biodiversity Study of a Brackish Water Ecosystem in Eastern India; Elsevier Inc., 2019; ISBN 9780128148495. [Google Scholar]
  10. Rosa, S.; Palmeirim, J.M.; Moreira, F. Factors Affecting Waterbird Abundance and Species Richness in an Increasingly Urbanized Area of the Tagus Estuary in Portugal. Waterbirds 2003, 26, 226–232. [Google Scholar] [CrossRef]
  11. Rubalingeswari, N.; Thulasimala, D.; Giridharan, L.; Gopal, V.; Magesh, N.S.; Jayaprakash, M. Bioaccumulation of Heavy Metals in Water, Sediment, and Tissues of Major Fisheries from Adyar Estuary, Southeast Coast of India: An Ecotoxicological Impact of a Metropolitan City. Mar. Pollut. Bull. 2021, 163, 111964. [Google Scholar] [CrossRef]
  12. Barletta, M.; Lima, A.R.A.; Costa, M.F. Distribution, Sources and Consequences of Nutrients, Persistent Organic Pollutants, Metals and Microplastics in South American Estuaries. Sci. Total Environ. 2019, 651, 1199–1218. [Google Scholar] [CrossRef] [PubMed]
  13. Arrigo, K.R. Marine Microorganisms and Global Nutrient Cycles. Nature 2005, 437, 349–355. [Google Scholar] [CrossRef]
  14. Selvan, C.T.; Milton, J. Physicochemical Analysis of Coastal Water of East Coast of Tamil Nadu (Adyar Estuary). J. Zool. Stud. 2016, 3, 20–29. [Google Scholar]
  15. Janakiraman, A.; Naveed, M.S.; Asrar Sheriff, M.; Altaff, K. Ecological Restoration Assessment of Adyar Creek and Estuary Using Meiofaunal Communities as Ecological Indicators for Aquatic Pollution. Reg. Stud. Mar. Sci. 2017, 9, 135–144. [Google Scholar] [CrossRef]
  16. Altaff, K.; Janakiraman, A.; Naveed, M.S.; Asrar Sheriff, M.; War, M.; Sugumaran, J.; Mantha, G. Post-Restoration Ecological Assessment on the Zooplankton Dynamics of the Adyar Creek and Estuary. J. Coast. Conserv. 2019, 23, 473–483. [Google Scholar] [CrossRef]
  17. Veerasingam, S.; Venkatachalapathy, R.; Ramkumar, T. Historical Environmental Pollution Trend and Ecological Risk Assessment of Trace Metals in Marine Sediments off Adyar Estuary, Bay of Bengal, India. Environ. Earth Sci. 2014, 71, 3963–3975. [Google Scholar] [CrossRef]
  18. Rajkumar, A.N.; Barnes, J.; Ramesh, R.; Purvaja, R.; Upstill-Goddard, R.C. Methane and Nitrous Oxide Fluxes in the Polluted Adyar River and Estuary, SE India. Mar. Pollut. Bull. 2008, 56, 2043–2051. [Google Scholar] [CrossRef] [PubMed]
  19. Caruso, G.; La Ferla, R.; Azzaro, M.; Zoppini, A.; Marino, G.; Petochi, T.; Corinaldesi, C.; Leonardi, M.; Zaccone, R.; Fonda Umani, S. Microbial Assemblages for Environmental Quality Assessment: Knowledge, Gaps and Usefulness in the European Marine Strategy Framework Directive. Crit. Rev. Microbiol. 2016, 42, 883–904. [Google Scholar] [CrossRef] [PubMed]
  20. Astudillo-García, C.; Hermans, S.M.; Stevenson, B.; Buckley, H.L.; Lear, G. Microbial Assemblages and Bioindicators as Proxies for Ecosystem Health Status: Potential and Limitations. Appl. Microbiol. Biotechnol. 2019, 103, 6407–6421. [Google Scholar] [CrossRef]
  21. Eswaran, R.; Khandeparker, L. Seasonal Variation in β-Glucosidase-Producing Culturable Bacterial Diversity in a Monsoon-Influenced Tropical Estuary. Environ. Monit. Assess. 2019, 191, 1–11. [Google Scholar] [CrossRef]
  22. Nair, A. V; Vijayan, K.K.; Chakraborty, K.; Leo Antony, M. Diversity and Characterization of Antagonistic Bacteria from Tropical Estuarine Habitats of Cochin, India for Fish Health Management. World J. Microbiol. Biotechnol. 2012, 28, 2581–2592. [Google Scholar] [CrossRef] [PubMed]
  23. Ranjan Mishra, R.; Ranjan Swain, M.; Kanti Danga, T.; Thatoi, H. Diversity and Seasonal Fluctuation of Predominant Microbial Communities in Bhitarkanika, a Tropical Mangrove Ecosystem in India. Rev. Biol. Trop. 2012, 60, 909–924. [Google Scholar] [CrossRef]
  24. Thajudeen, J.; Yousuf, J.; Veetil, V.P.; Varghese, S.; Singh, A.; Abdulla, M.H. Nitrogen Fixing Bacterial Diversity in a Tropical Estuarine Sediments. World J. Microbiol. Biotechnol. 2017, 33, 1–11. [Google Scholar] [CrossRef] [PubMed]
  25. Khandeparker, L.; Kuchi, N.; Kale, D.; Anil, A.C. Microbial Community Structure of Surface Sediments from a Tropical Estuarine Environment Using next Generation Sequencing. Ecol. Indic. 2017, 74, 172–181. [Google Scholar] [CrossRef]
  26. Chikere, C.B.; Mordi, I.J.; Chikere, B.O.; Selvarajan, R.; Ashafa, T.O.; Obieze, C.C. Comparative Metagenomics and Functional Profiling of Crude Oil-Polluted Soils in Bodo West Community, Ogoni, with Other Sites of Varying Pollution History. Ann. Microbiol. 2019, 69. [Google Scholar] [CrossRef]
  27. Okoye, A.U.; Selvarajan, R.; Chikere, C.B.; Okpokwasili, G.C.; Mearns, K. Characterization and Identification of Long-Chain Hydrocarbon-Degrading Bacterial Communities in Long-Term Chronically Polluted Soil in Ogoniland: An Integrated Approach Using Culture-Dependent and Independent Methods. Environ. Sci. Pollut. Res. 2024. [Google Scholar] [CrossRef] [PubMed]
  28. Osunmakinde, C.O.; Selvarajan, R.; Mamba, B.B.; Msagati, T.A.M. Profiling Bacterial Diversity and Potential Pathogens in Wastewater Treatment Plants Using High-Throughput Sequencing Analysis. Microorganisms 2019, 7. [Google Scholar] [CrossRef] [PubMed]
  29. Selvarajan, R.; Sibanda, T.; Venkatachalam, S.; Kamika, I.; Nel, W.A.J.W.A.J.; Ramganesh, S.; Timothy, S.; Venkatachalam, S.; Kamika, I.; Nel, W.A.J.W.A.J. Industrial Wastewaters Harbor a Unique Diversity of Bacterial Communities Revealed by High-Throughput Amplicon Analysis. Ann. Microbiol. 2018, 1–14. [Google Scholar] [CrossRef]
  30. Zheng, Y.; Hou, L.; Newell, S.; Liu, M.; Zhou, J.; Zhao, H.; You, L.; Cheng, X. Community Dynamics and Activity of Ammonia-Oxidizing Prokaryotes in Intertidal Sediments of the Yangtze Estuary. Appl. Environ. Microbiol. 2014, 80, 408–419. [Google Scholar] [CrossRef]
  31. Iloms, E.; Ololade, O.O.; Ogola, H.J.O.; Selvarajan, R. Investigating Industrial Effluent Impact on Municipal Wastewater Treatment Plant in Vaal, South Africa. Int. J. Environ. Res. Public Health 2020, 17. [Google Scholar] [CrossRef]
  32. Selvarajan, R.; Sibanda, T.; Ullah, H.; Abia, A.L.K. Beach Sand Mycobiome: The Silent Threat of Pathogenic Fungi and Toxic Metal Contamination for Beachgoers. Mar. Pollut. Bull. 2024, 198, 115895. [Google Scholar] [CrossRef] [PubMed]
  33. Ogola, H.J.O.; Selvarajan, R.; Tekere, M. Local Geomorphological Gradients and Land Use Patterns Play Key Role on the Soil Bacterial Community Diversity and Dynamics in the Highly Endemic Indigenous Afrotemperate Coastal Scarp Forest Biome. Front. Microbiol. 2021, 12. [Google Scholar] [CrossRef]
  34. Andrews, S. FastQC: A Quality Control Tool for High Throughput Sequence Data 2010.
  35. Bolyen, E.; Rideout, J.R.; Dillon, M.R.; Bokulich, N.A.; Abnet, C.; Ghalith, G.A. Al; Alexander, H.; Alm, E.J.; Arumugam, M.; Bai, Y.; et al. QIIME 2: Reproducible, Interactive, Scalable, and Extensible Microbiome Data Science. PeerJ Prepr. 2018, 9–10. [Google Scholar] [CrossRef] [PubMed]
  36. Callahan, B.J.; McMurdie, P.J.; Rosen, M.J.; Han, A.W.; Johnson, A.J.A.; Holmes, S.P. DADA2: High-Resolution Sample Inference from Illumina Amplicon Data. Nat. Methods 2016, 13, 581–583. [Google Scholar] [CrossRef]
  37. Crump, B.C.; Bowen, J.L. The Microbial Ecology of Estuarine Ecosystems. Ann. Rev. Mar. Sci. 2024, 16, 335–360. [Google Scholar] [CrossRef] [PubMed]
  38. Colares, G.B.; Melo, V.M.M. Relating Microbial Community Structure and Environmental Variables in Mangrove Sediments inside Rhizophora Mangle L. Habitats. Appl. Soil Ecol. 2013, 64, 171–177. [Google Scholar] [CrossRef]
  39. Campbell, B.J.; Kirchman, D.L. Bacterial Diversity, Community Structure and Potential Growth Rates along an Estuarine Salinity Gradient. ISME J. 2013, 7, 210–220. [Google Scholar] [CrossRef] [PubMed]
  40. Marengo, J.A.; Oliveira, G.S.; Alves, L.M.; Bergier, I.; Assine, M.L. Dynamics of the Pantanal Wetland in South America 2016, 227–238.
  41. Chen, Y.; Xu, Y.; Ma, Y.; Lin, J.; Ruan, A. Microbial Community Structure and Its Driving Mechanisms in the Hangbu Estuary of Chaohu Lake under Different Sedimentary Areas. Environ. Res. 2023, 238, 117153. [Google Scholar] [CrossRef]
  42. Ramganesh, S.; Maredza, A.T.; Tekere, M. Microbial Exploration in Extreme Conditions: Metagenomic Analysis and Future Perspectives. In Metagenomics - Methods, Applications and Perspectives; BENEDETTI, C., Ed.; Nova Science Publishers, Inc.: New York, 2014; ISBN 9781631172557. [Google Scholar]
  43. Sibanda, T.; Selvarajan, R.; Msagati, T.; Venkatachalam, S.; Meddows-Taylor, S. Defunct Gold Mine Tailings Are Natural Reservoir for Unique Bacterial Communities Revealed by High-Throughput Sequencing Analysis. Sci. Total Environ. 2019, 650, 2199–2209. [Google Scholar] [CrossRef]
  44. Du, M.; Zheng, M.; Liu, A.; Wang, L.; Pan, X.; Liu, J.; Ran, X. Effects of Emerging Contaminants and Heavy Metals on Variation in Bacterial Communities in Estuarine Sediments. Sci. Total Environ. 2022, 832, 155118. [Google Scholar] [CrossRef]
  45. Fernandes, S.O.; Gonsalves, M.J.; Nazareth, D.R.; Wong, S.K.; Haider, M.N.; Ijichi, M.; Kogure, K. Seasonal Variability in Environmental Parameters Influence Bacterial Communities in Mangrove Sediments along an Estuarine Gradient. Estuar. Coast. Shelf Sci. 2022, 270. [Google Scholar] [CrossRef]
  46. Lu, X.M.; Chen, C.; Zheng, T.L.; Chen, J.J. Temporal–Spatial Variation of Bacterial Diversity in Estuary Sediments in the South of Zhejiang Province, China. Appl. Microbiol. Biotechnol. 2016, 100, 2817–2828. [Google Scholar] [CrossRef] [PubMed]
  47. Huang, W.; Chen, X.; Wang, K.; Chen, J.; Zheng, B.; Jiang, X. Comparison among the Microbial Communities in the Lake, Lake Wetland, and Estuary Sediments of a Plain River Network. Microbiologyopen 2019, 8, 1–13. [Google Scholar] [CrossRef]
  48. Anderson, C.R.; Peterson, M.E.; Frampton, R.A.; Bulman, S.R.; Keenan, S.; Curtin, D. Rapid Increases in Soil PH Solubilise Organic Matter, Dramatically Increase Denitrification Potential and Strongly Stimulate Microorganisms from the Firmicutes Phylum. PeerJ 2018, 6, e6090. [Google Scholar] [CrossRef]
  49. Lukhele, T.; Ogola, H.J.O.; Selvarajan, R.; Oruko, R.O.; Nyoni, H.; Mamba, B.B.; Msagati, T.A.M. Metagenomic Insights into Taxonomic Diversity and Metabolic Potential of Bacterial Communities Associated with Tannery Waste-Contaminated Soils. Int. J. Environ. Sci. Technol. 2022, 19, 2409–2424. [Google Scholar] [CrossRef]
  50. Das, M.; Royer, T. V; Leff, L.G. Diversity of Fungi, Bacteria, and Actinomycetes on Leaves Decomposing in a Stream. Appl. Environ. Microbiol. 2007, 73, 756–767. [Google Scholar] [CrossRef] [PubMed]
  51. Fenibo, E.O.; Selvarajan, R.; Abia, A.L.K.; Matambo, T. Medium-Chain Alkane Biodegradation and Its Link to Some Unifying Attributes of AlkB Genes Diversity. Sci. Total Environ. 2023, 877, 162951. [Google Scholar] [CrossRef]
  52. Jones, R.M.; Barrie Johnson, D. Acidithrix Ferrooxidans Gen. Nov., Sp. Nov.; a Filamentous and Obligately Heterotrophic, Acidophilic Member of the Actinobacteria That Catalyzes Dissimilatory Oxido-Reduction of Iron. Res. Microbiol. 2015, 166, 111–120. [Google Scholar] [CrossRef]
  53. Zhang, H.; Ma, B.; Huang, T.; Shi, Y. Nitrate Reduction by the Aerobic Denitrifying Actinomycete Streptomyces Sp. XD-11-6-2: Performance, Metabolic Activity, and Micro-Polluted Water Treatment. Bioresour. Technol. 2021, 326, 124779. [Google Scholar] [CrossRef]
  54. Sheng, P.; Yu, Y.; Zhang, G.; Huang, J.; He, L.; Ding, J. Bacterial Diversity and Distribution in Seven Different Estuarine Sediments of Poyang Lake, China. Environ. Earth Sci. 2016, 75, 479. [Google Scholar] [CrossRef]
  55. Dyksma, S.; Bischof, K.; Fuchs, B.M.; Hoffmann, K.; Meier, D.; Meyerdierks, A.; Pjevac, P.; Probandt, D.; Richter, M.; Stepanauskas, R. Ubiquitous Gammaproteobacteria Dominate Dark Carbon Fixation in Coastal Sediments. ISME J. 2016, 10, 1939–1953. [Google Scholar] [CrossRef] [PubMed]
  56. Gutierrez, T. Marine, Aerobic Hydrocarbon-Degrading Gammaproteobacteria: Overview. Taxon. genomics Ecophysiol. Hydrocarb. microbes 2019, 143–152. [Google Scholar]
  57. Gilbert, J.A.; Steele, J.A.; Caporaso, J.G.; Steinbrück, L.; Reeder, J.; Temperton, B.; Huse, S.; McHardy, A.C.; Knight, R.; Joint, I. Defining Seasonal Marine Microbial Community Dynamics. ISME J. 2012, 6, 298–308. [Google Scholar] [CrossRef] [PubMed]
  58. Gawade, L.; Sarma, V.; Rao, Y.V.; Hemalatha, K.P.J. Variation of Bacterial Metabolic Rates and Organic Matter in the Monsoon-Affected Tropical Estuary (Godavari, India). Geomicrobiol. J. 2017, 34, 628–640. [Google Scholar] [CrossRef]
  59. Douglas, A.E. How Multi-Partner Endosymbioses Function. Nat. Rev. Microbiol. 2016, 14, 731–743. [Google Scholar] [CrossRef]
  60. Tsao, H.F.; Scheikl, U.; Volland, J.M.; Köhsler, M.; Bright, M.; Walochnik, J.; Horn, M. “Candidatus Cochliophilus Cryoturris” (Coxiellaceae), a Symbiont of the Testate Amoeba Cochliopodium Minus. Sci. Rep. 2017, 7, 1–8. [Google Scholar] [CrossRef]
  61. Poretsky, R.S.; Sun, S.; Mou, X.; Moran, M.A. Transporter Genes Expressed by Coastal Bacterioplankton in Response to Dissolved Organic Carbon. Environ. Microbiol. 2010, 12, 616–627. [Google Scholar] [CrossRef]
  62. Gebhard, S. ABC Transporters of Antimicrobial Peptides in Firmicutes Bacteria - Phylogeny, Function and Regulation. Mol. Microbiol. 2012, 86, 1295–1317. [Google Scholar] [CrossRef]
  63. Huq, M.A.; Ma, J.; Srinivasan, S.; Parvez, M.A.K.; Rahman, M.M.; Naserkheil, M.; Abuhena, M.; Maitra, P.; Islam, F.; Nam, K. Massilia Agrisoli Sp. Nov., Isolated from Rhizospheric Soil of Banana. Int. J. Syst. Evol. Microbiol. 2023, 73, 5897. [Google Scholar] [CrossRef]
  64. Morel, M.A.; Iriarte, A.; Jara, E.; Musto, H.; Castro-Sowinski, S. Revealing the Biotechnological Potential of Delftia Sp. JD2 by a Genomic Approach.; AIMS, 2016.
  65. Xu, L.; Wang, G.; Zhang, S.; Li, T.; Xu, X.; Gong, G.; Zhou, W.; Pu, Y.; Jia, Y.; Li, Y. Inhibition of High Sulfur on Functional Microorganisms and Genes in Slightly Contaminated Soil by Cadmium and Chromium. Environ. Pollut. 2024, 344, 123421. [Google Scholar] [CrossRef]
  66. Wang, L.; Qiao, N.; Sun, F.; Shao, Z. Isolation, Gene Detection and Solvent Tolerance of Benzene, Toluene and Xylene Degrading Bacteria from Nearshore Surface Water and Pacific Ocean Sediment. Extremophiles 2008, 12, 335–342. [Google Scholar] [CrossRef] [PubMed]
  67. Plotnikova, E.G.; Yastrebova, O. V; Anan’ina, L.N.; Dorofeeva, L. V; Lysanskaya, V.Y.; Demakov, V.A. Halotolerant Bacteria of the Genus Arthrobacter Degrading Polycyclic Aromatic Hydrocarbons. Russ. J. Ecol. 2011, 42, 502–509. [Google Scholar] [CrossRef]
  68. Raes, J.; Bork, P. Molecular Eco-Systems Biology: Towards an Understanding of Community Function. Nat. Rev. Microbiol. 2008, 6, 693–699. [Google Scholar] [CrossRef] [PubMed]
  69. Li, S.; Zhang, H.; Huang, T.; Ma, B.; Miao, Y.; Shi, Y.; Xu, L.; Liu, K.; Huang, X. Aerobic Denitrifying Bacterial Communities Drive Nitrate Removal: Performance, Metabolic Activity, Dynamics and Interactions of Core Species. Bioresour. Technol. 2020, 316, 123922. [Google Scholar] [CrossRef] [PubMed]
  70. Xun, W.; Liu, Y.; Li, W.; Ren, Y.; Xiong, W.; Xu, Z.; Zhang, N.; Miao, Y.; Shen, Q.; Zhang, R. Specialized Metabolic Functions of Keystone Taxa Sustain Soil Microbiome Stability. Microbiome 2021, 9, 1–15. [Google Scholar] [CrossRef]
  71. Yang, P.; van Elsas, J.D. Mechanisms and Ecological Implications of the Movement of Bacteria in Soil. Appl. Soil Ecol. 2018, 129, 112–120. [Google Scholar] [CrossRef]
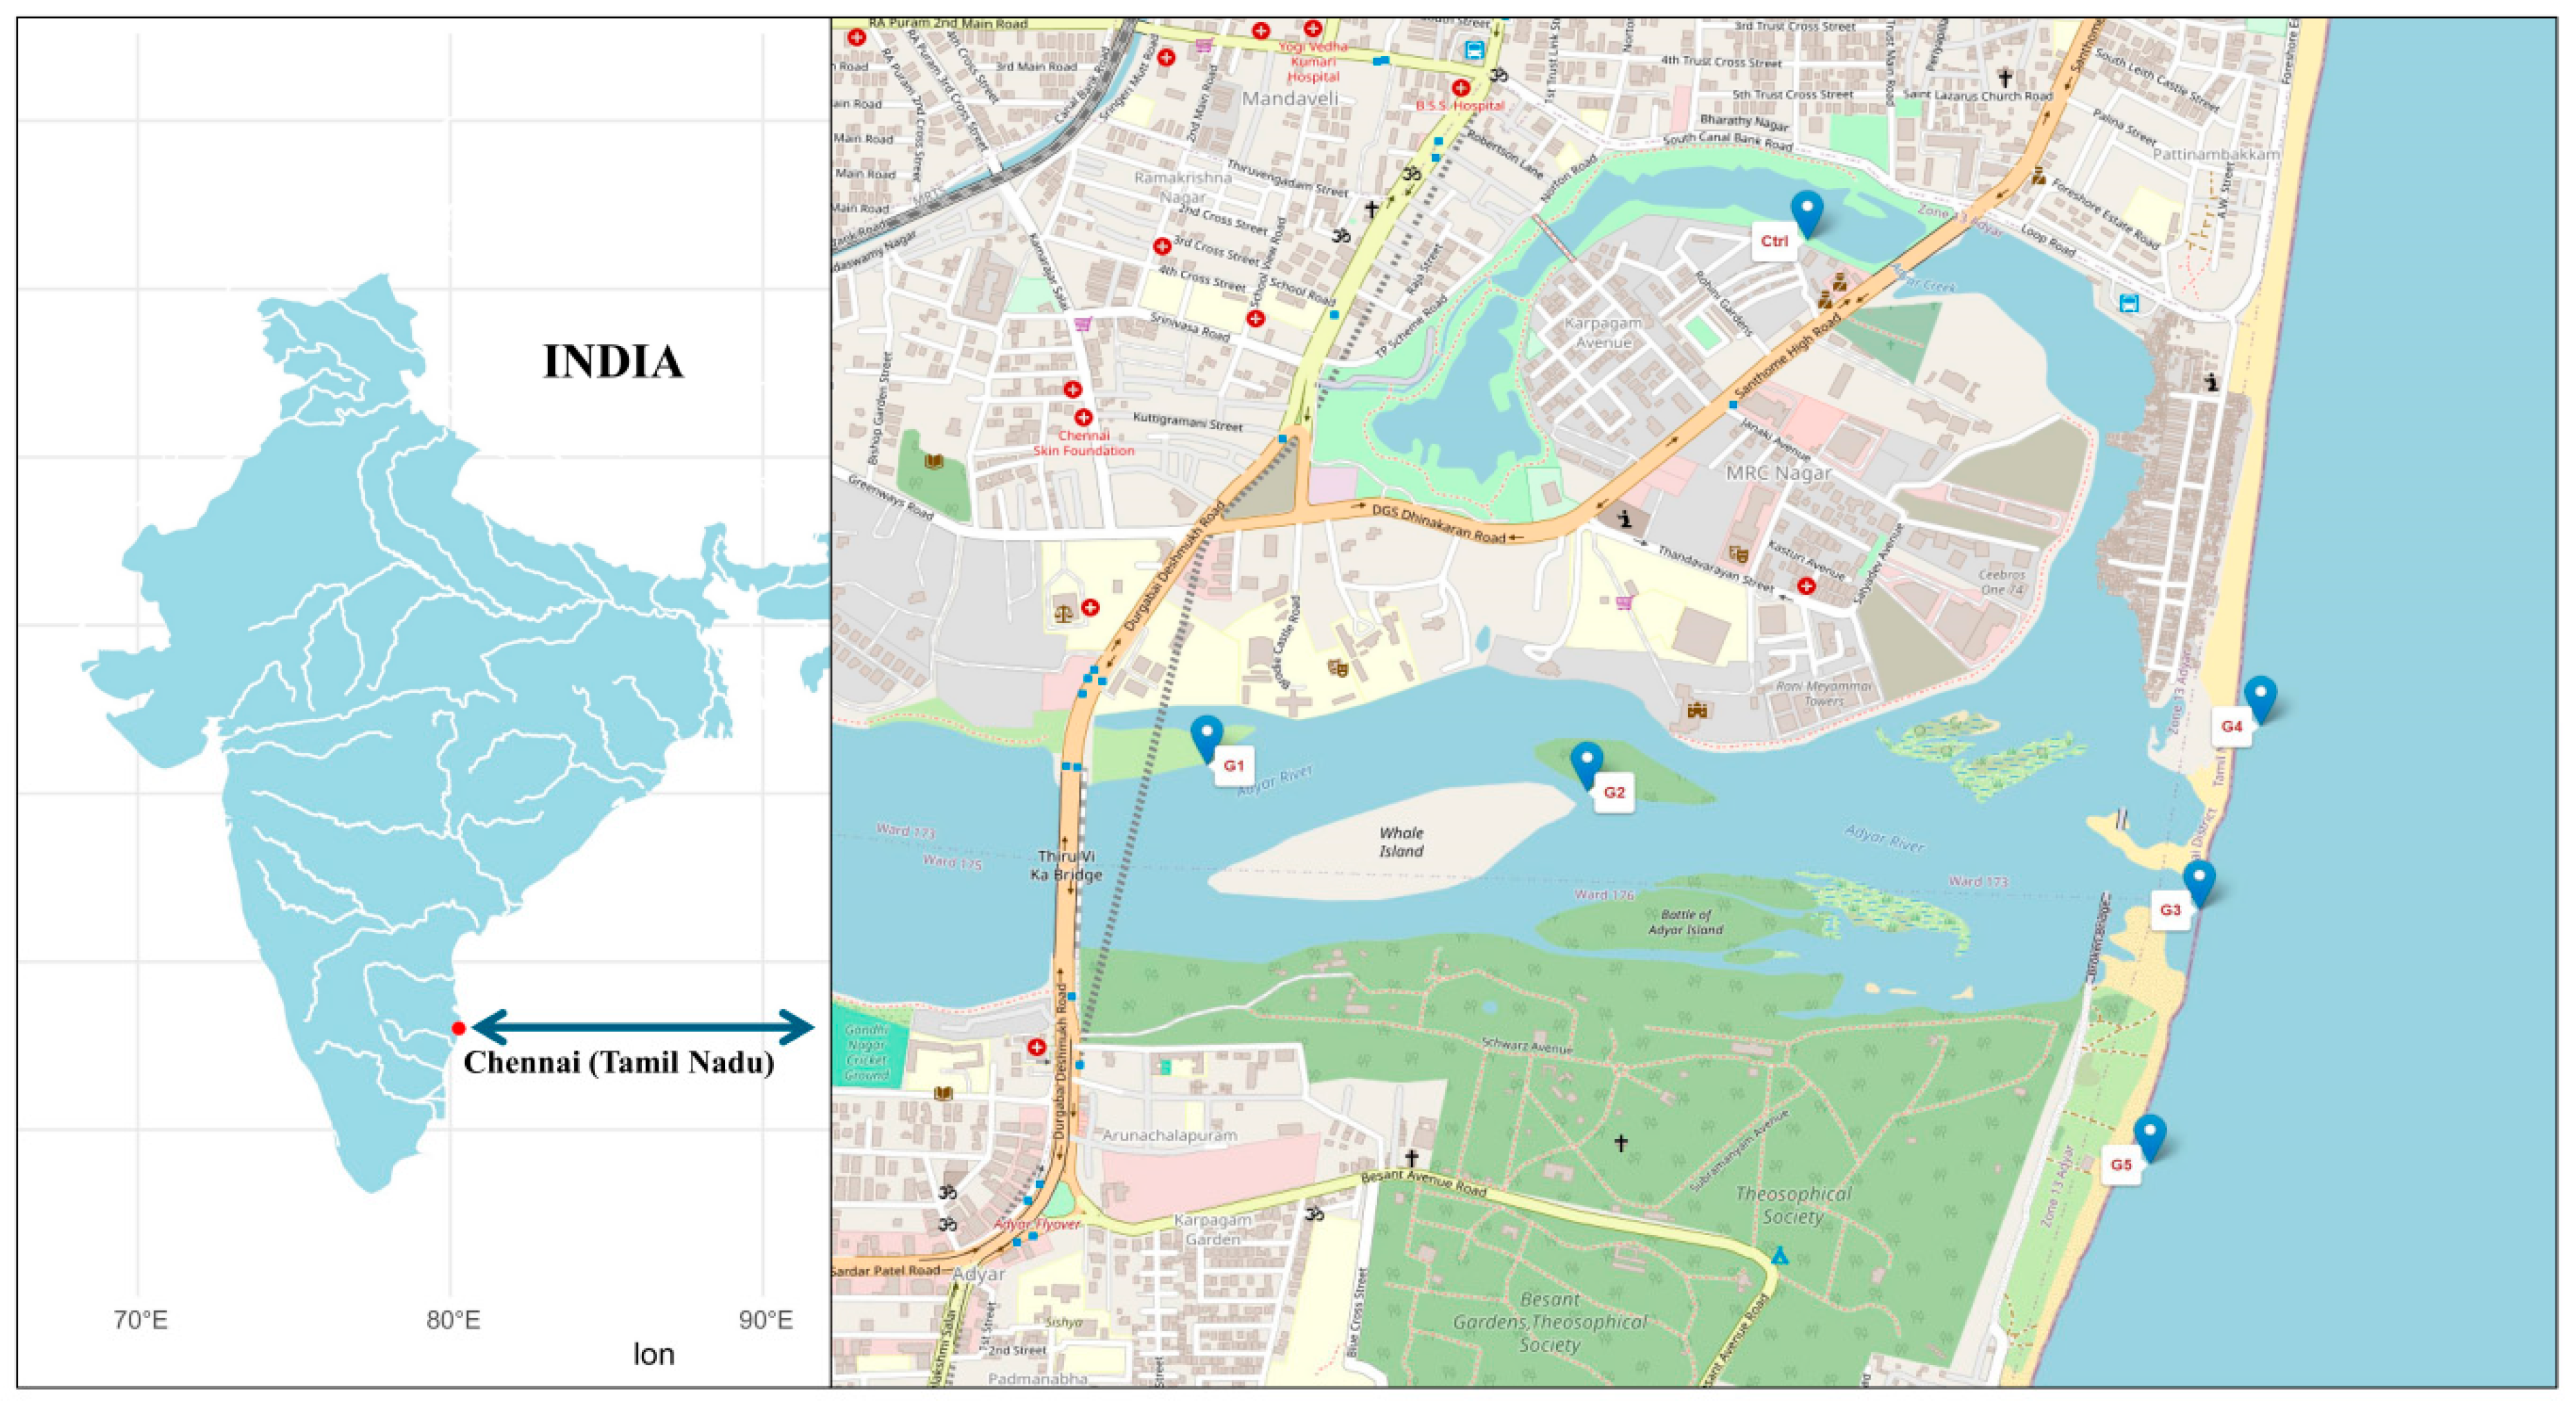
Figure 1. A map showing the sampling points within the Adyar estuary creek
Preprints 121285 g001
Figure 2. Two-tailed Pearson’s correlation coefficients for the toxic heavy metal contents in the collected sediment samples.
Preprints 121285 g002
Figure 3. Alpha and Beta Diversity of the sediment samples (a) ACE, Chao1, Jackknife and observed OTUs; (b) Shannon index; (c) Simpson index; (d) Principal coordinate analysis (PcoA).
Preprints 121285 g003
Figure 4. Relative abundance of Bacterial community composition in sediment samples (a) phylum level distribution, (b) class level distribution and (c) genus level distribution.
Preprints 121285 g004
Figure 5. Redundancy analysis (RDA) shows the first and second ordination axes of RDA explained, respectively. RDA explains the relationships between microbial community composition at the class level across various sediment sample groups and the principal environmental variables.
Preprints 121285 g005
Figure 6. Functional prediction (a) Major pathway distribution of collected sediment samples (b) Principal component analysis (PCA) (c) Major degradation pathway and (d) biosynthetic pathways.
Preprints 121285 g006
Figure 7. (a) Indicator bacterial members in the three groups (Blue – coastal; Green – riverine; and Orange – estuarine) of sediment samples with LDA values higher than 3.5. (b) Co-network analysis of major bacterial members in the collected samples (red lines show the negative correlation, and green shows the positive correlation between the bacterial members).
Preprints 121285 g007
Table 1. Physico-chemical analysis of sediments at Adyar Estuary.
Sampling
points
pH Salinity DO NO3 NH4 PO4 Co Cr Cu Fe Mn Ni Pb Zn
G1 7.39 15.25 3.25 0.24 2.95 1.51 134.3 536.15 250.6 28550 273.05 89.1 47.3 213.2
G2 7.44 17.29 2.97 0.22 4.39 1.46 109.45 357.1 167.25 31950 362.05 27.35 38.2 191.25
G3 7.74 21.5 3.8 0.26 4.12 1.29 61.4 190.3 94.35 35900 742.8 36.9 25.6 194.3
G4 8.03 28.17 3.43 0.11 1.72 1.13 5.25 6.6 3.695 2023.2 13.97 5.9 7.13 29.7
G5 8.01 29.9 3.33 0.12 1.88 1.02 6.9 8.3 5.34 2108.1 15.35 6.65 5.23 33.55
Ctrl 7.57 6.25 4.56 0.14 0.51 1.24 32.9 95.75 49.35 16200 173.05 13.2 14.2 92.5
*Units for salinity (PSU), DO (mg/L), Nutrients (mg/g), Trace metals (µg/g).
Disclaimer/Publisher’s Note: The statements, opinions and data contained in all publications are solely those of the individual author(s) and contributor(s) and not of MDPI and/or the editor(s). MDPI and/or the editor(s) disclaim responsibility for any injury to people or property resulting from any ideas, methods, instructions or products referred to in the content.
Copyright: This open access article is published under a Creative Commons CC BY 4.0 license, which permit the free download, distribution, and reuse, provided that the author and preprint are cited in any reuse.
Prerpints.org logo

Preprints.org is a free preprint server supported by MDPI in Basel, Switzerland.

Subscribe

© 2024 MDPI (Basel, Switzerland) unless otherwise stated