Preprint
Article

A Feed-Forward Back Propagation Neural Network Approach For Integration Of Ev Into Vehicle-To-Grid (V2g) To Predict State Of Charge Lithium-Ion Batteries

Altmetrics

Downloads

49

Views

37

Comments

0

A peer-reviewed article of this preprint also exists.

This version is not peer-reviewed

Submitted:

14 October 2024

Posted:

16 October 2024

You are already at the latest version

Alerts
Abstract
The incorporation of electric vehicles (EVs) with vehicle-to-grid (V2G) offers the development of multi-energy microgrid (MMOs) models. However, MMOs have among their goals to decrease electricity costs by coordinating with vehicle-to-grid (V2G) scheduling. Controlling V2G models poses uncertainties about the voltages developed and creates the need for power generation disruptions. In this work, a Feed-Forward-Back-Propagation Network (FFBPN) is developed with Matlab software, based on the Levenberg-Marquardt algorithm by varying the number of hidden neurons to realize better performance thanks to the value of the Maximum Coefficient of De-termination (R2) and the Minimum Mean Squared Error (MSE). In this article, the dataset from NASA PCoE has been used to make proper consideration of the model that best calculates the life cycle of the battery, demonstrating relevant implications for future development of this type of system based on FFBPN for the integration of EV into V2G. The proposed FFBPN demonstrates better performance than other methods taken from the literature. In conclusion, the comparison between the phases of training, validation and test are used to completely represent the validity of the proposed model and precisely to identify the characteristics curves of FFBPN for future ap-plications highlighting its performance to create profitability, efficiency, production, energy saving and minimum environmental impact.
Keywords: 
Subject: Engineering  -   Electrical and Electronic Engineering

1. Introduction

Lithium-ion batteries have recently felt the need to improve their performance, given their wide use in various sectors, such as electrical and space [1,2,3,4,5]. Vehicle-to-grid (V2G) permits a bidirectional flow of energy between EVs and the grid, permitting EVs to be utilized as mobile energy storage units [6]. Vehicle-to-grid (V2G) system is a critical area of research and development that explores the interaction between electric vehicles and the power grid. In particular, V2G allows EVs to draw energy from the grid and consume excess energy back into it. EV in this case acts as an energy distribution unit, helping balance grid demand and supply. Researchers in their recent studies have noted that it is important to maximize benefits and minimize disadvantages such as energy consumption. The benefits found are increased grid stability and reliability, and reduced greenhouse gas emissions. Researchers have also identified in a final step the purposes and opportunities of EVs in association with V2G by exploring topologies, control methods, and associated services; that is, exploring innovation by revolutionizing the energy system by integrating EVs into the grid. Shi in his article realizes a review on the development of a vehicle-to-grid research approach based on CiteSpare6.1R6 software to create a graph with keywords that summarize the most important results of the V2G search. The author highlights the possible improvements of the V2G approach from different points of view such as energy control, load distribution, and environmental preservation. It emphasizes the importance of V2G areas, renewable power consumption, power speed and smart grid maximization criteria [7]. Escoto in his article approaches the maximization in V2G methods and describes the utilization of artificial intelligence (AI) approaches to obtain these results. In his article, the author analyses the known technique regarding optimization in V2G systems and studies gaps where AI-driven processes, machine learning systems, and adaptable optimization models can be used. The author introduced adaptable optimization models to improve adaptability in V2G optimization. In particular, the author ends the article with his future developments to integrate AI-driven techniques into V2G systems, emphasizing their potentiality [8]. Bortolotti in his article describes vehicle-to-grid (V2G) technology from specific points of view, studying combined planning systems for renewable energy. The author has divided the study into four dimensions: environmental, social, technical, economic, and political. Each analysis is additionally subdivided into further aspects, allowing for better characterization. The author uses a simple but effective methodological approach from an algebraic point of view utilizing vectors to address all the particularities belonging to the V2G system. Specifically, environmental aspects with a particular focus on technical-economic aspects due to the integration of V2G technology are developed based on a city with industrial parameters. The results achieved show improvements for all four dimensions presented, in particular by developing an important reflection on indirect reductions in CO2 emissions. The author, however, states further needs in these scientific areas due to the need for specific data that are still limited. This important study is believed to set new horizons towards a V2G technology subject to social and economic implications [9]. To achieve these goals, researchers are carrying out numerous research related to the integration of electric vehicles (EVs) into the Vehicle-to-Grid (V2G) system. Researchers have found an increase in renewable power sources, and have initiated major studies on the energy system because of its increasing complexity, setting the goal of greater stability in the energy sector. Relying on in-depth planning of the energy market has several limitations and the optimal use of energy storage systems is essential to better address these issues. In his article, Shin [10] addresses the importance of integrating electric vehicles towards the grid with the use of Vehicle-to-Grid (V2G) systems. In his article, the author develops the interconnection between electric vehicles and renewables through a day-ahead real-time application and develops methods that use V2G to minimize operating costs in power systems [10]. Biswas in his article studies the opportunities and challenges of electric vehicles in V2G systems. Firstly, configuration, purpose, performances, obstacles, control systems, core models, and current factors, are described in depth through a series of advantages and disadvantages, creating an in-depth study also on associated services. The author addresses a particular aspect of the integration of electric vehicles (EVs) with the Vehicle-to-Grid (V2G). Finally, the article proposes recommendations to overcome the gaps in the field of research [11]. The particular integration of vehicle-to-grid (V2G) systems with EVs remains an area of great attention and interest that proposes multiple changes. As the complexity of the energy system increases, holistic approaches are essential. Numerous challenges arise from gaps in online V2G programming and energy load management. Researchers are carefully investigating solutions to optimize the use of batteries within V2G, developing new models of energy demand. In particular, new models based on the artificial neural network are being developed to achieve these important goals [12,13]. According to [13], the battery of EVs has specific values that cannot be easily measured directly. In particular, battery parameters like ageing aspect, environment temperature, cell temperature, and battery composition are difficult to evaluate [14]. Researchers to perform an analysis on these unmeasurable parameters have used important data-driven methods in their studies and described the detailed artificial neural network (ANN) [15,16,17,18,19]. Hussein [20] made a capacity fade estimation in RUL prediction for EV using an artificial neural network. The author made this technique to improve SOC estimation precision considering the life cycle of the cells, intending to achieve extended cell life. Guo [22] in his article used an improved neural network for SOC estimation of LIB. The author used potential difference, current and temperature and internal resistance as input to learn lithium battery power. The SOC value of the lithium battery and the actual State of Charge value calculated by the neural network are compared and the prediction error obtained is small. A Feedforward neural network (FNN) is part of the category of artificial neural network [23,24,25,26,27,28,29,30,31,32], and its primary feature is the direction of the data flow from its layers. Many researchers commonly used the FeedForward (FF) Network together with Back Propagation to train neural networks. Feed-Forward Back Propagation Network (FFBPN)is used to create a relationship between input and output. This research aims to investigate the combination of electric vehicles (EVs) with vehicle-to-grid (V2G) and the parameters that contribute to lithium battery condition to create a model for evaluating the life condition of a battery. The principal purpose of this article is to create a predictive model for measuring the ageing condition of lithium batteries using FFBPN. Cervellieri in his article has selected the model architecture by a new method based on trial-and-error to reach the definition of an optimal neural network configuration evaluated based on comparison with the known technique by il minimum error and maximum R2 value. This article has been designed as follows:
Section 2 describes the Data Acquisition NASA Prognostics Center of Excellence Dataset;
Section 3 described the FFBPN Model development and the architecture of the model;
Section 4 described the proposed Feed-Forward Back Propagation Network
Section 5 describes the results and discussions
Section 5.3 Remaining Useful Life Calculation Results
The Conclusions are set out in Section 6.

2. Data Acquisition Nasa Prognostics Center Of Excellence Dataset

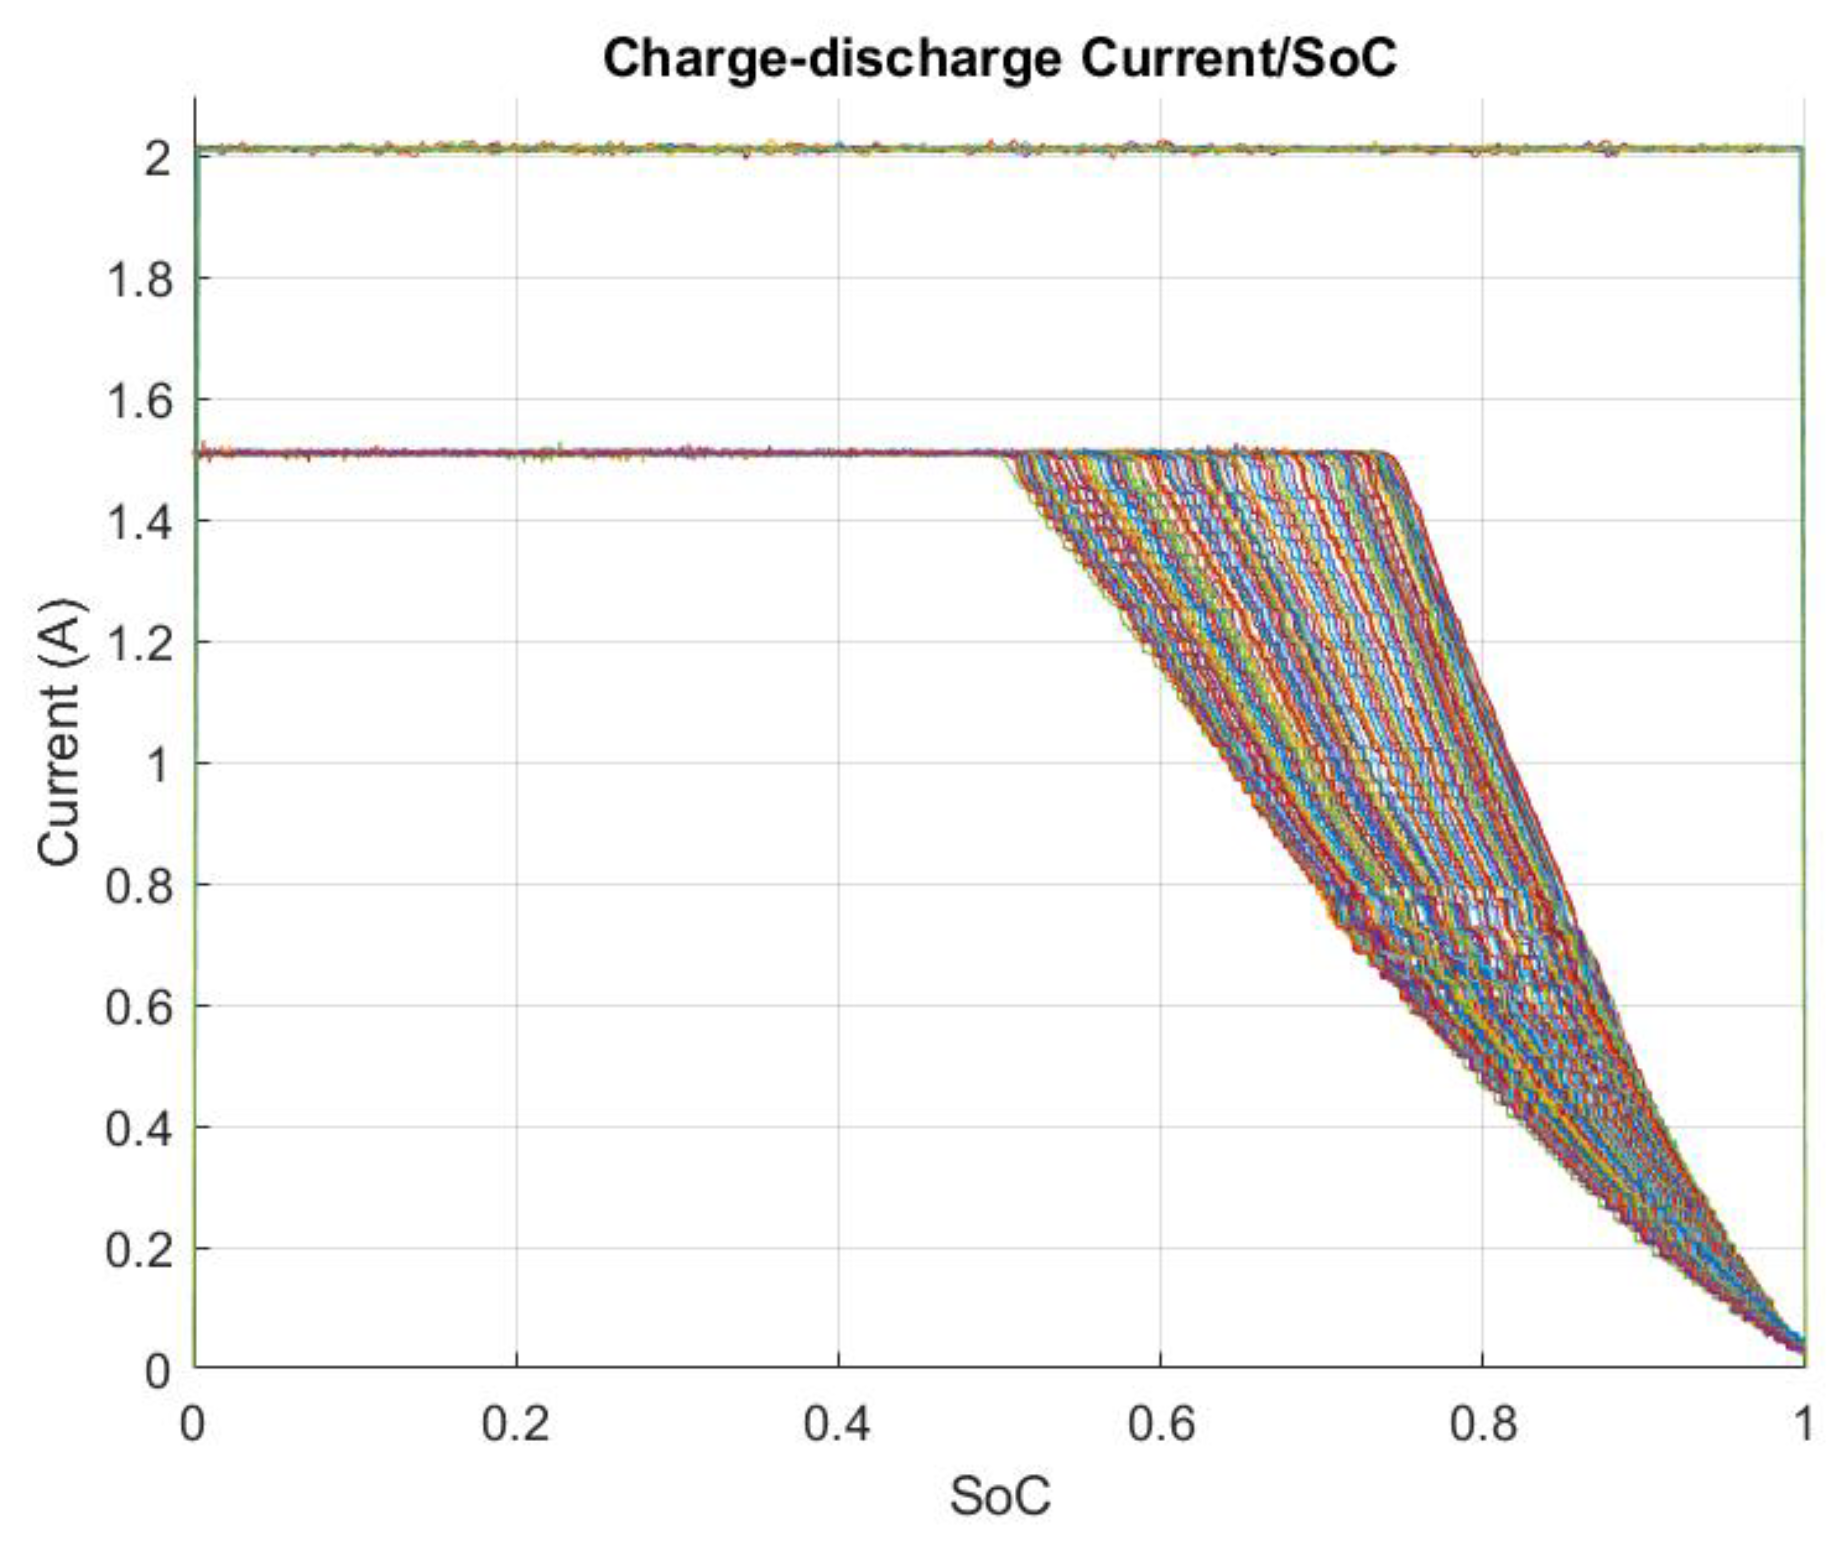
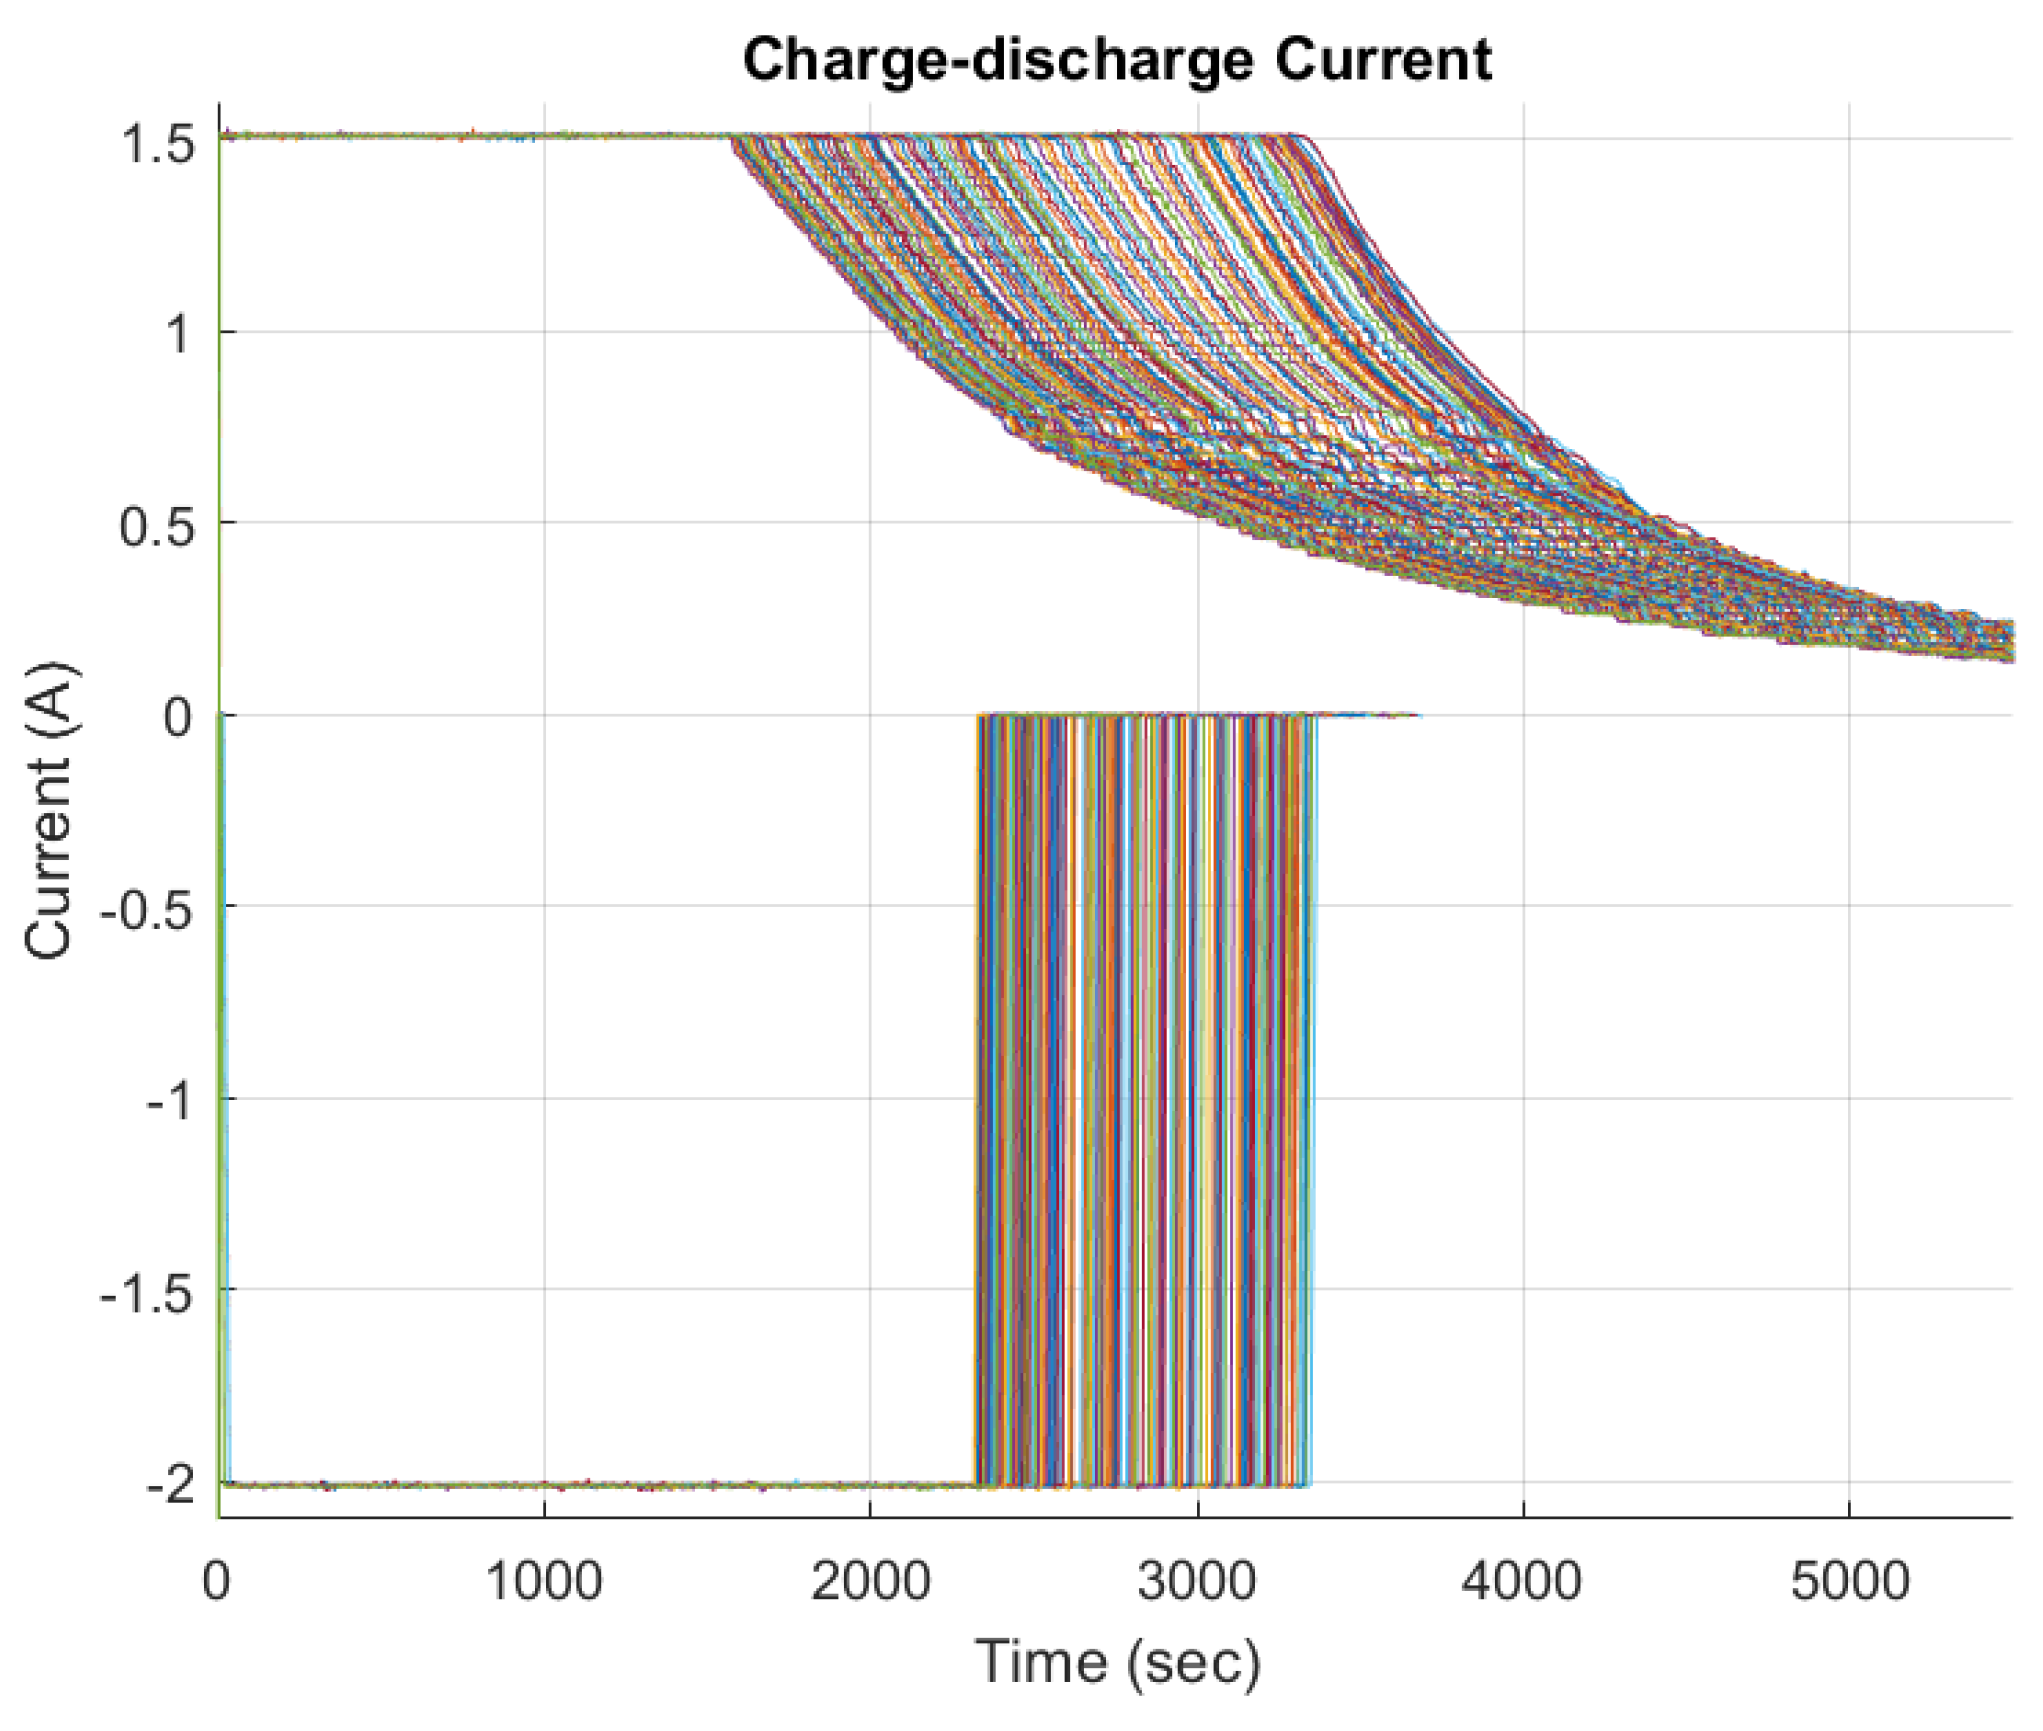
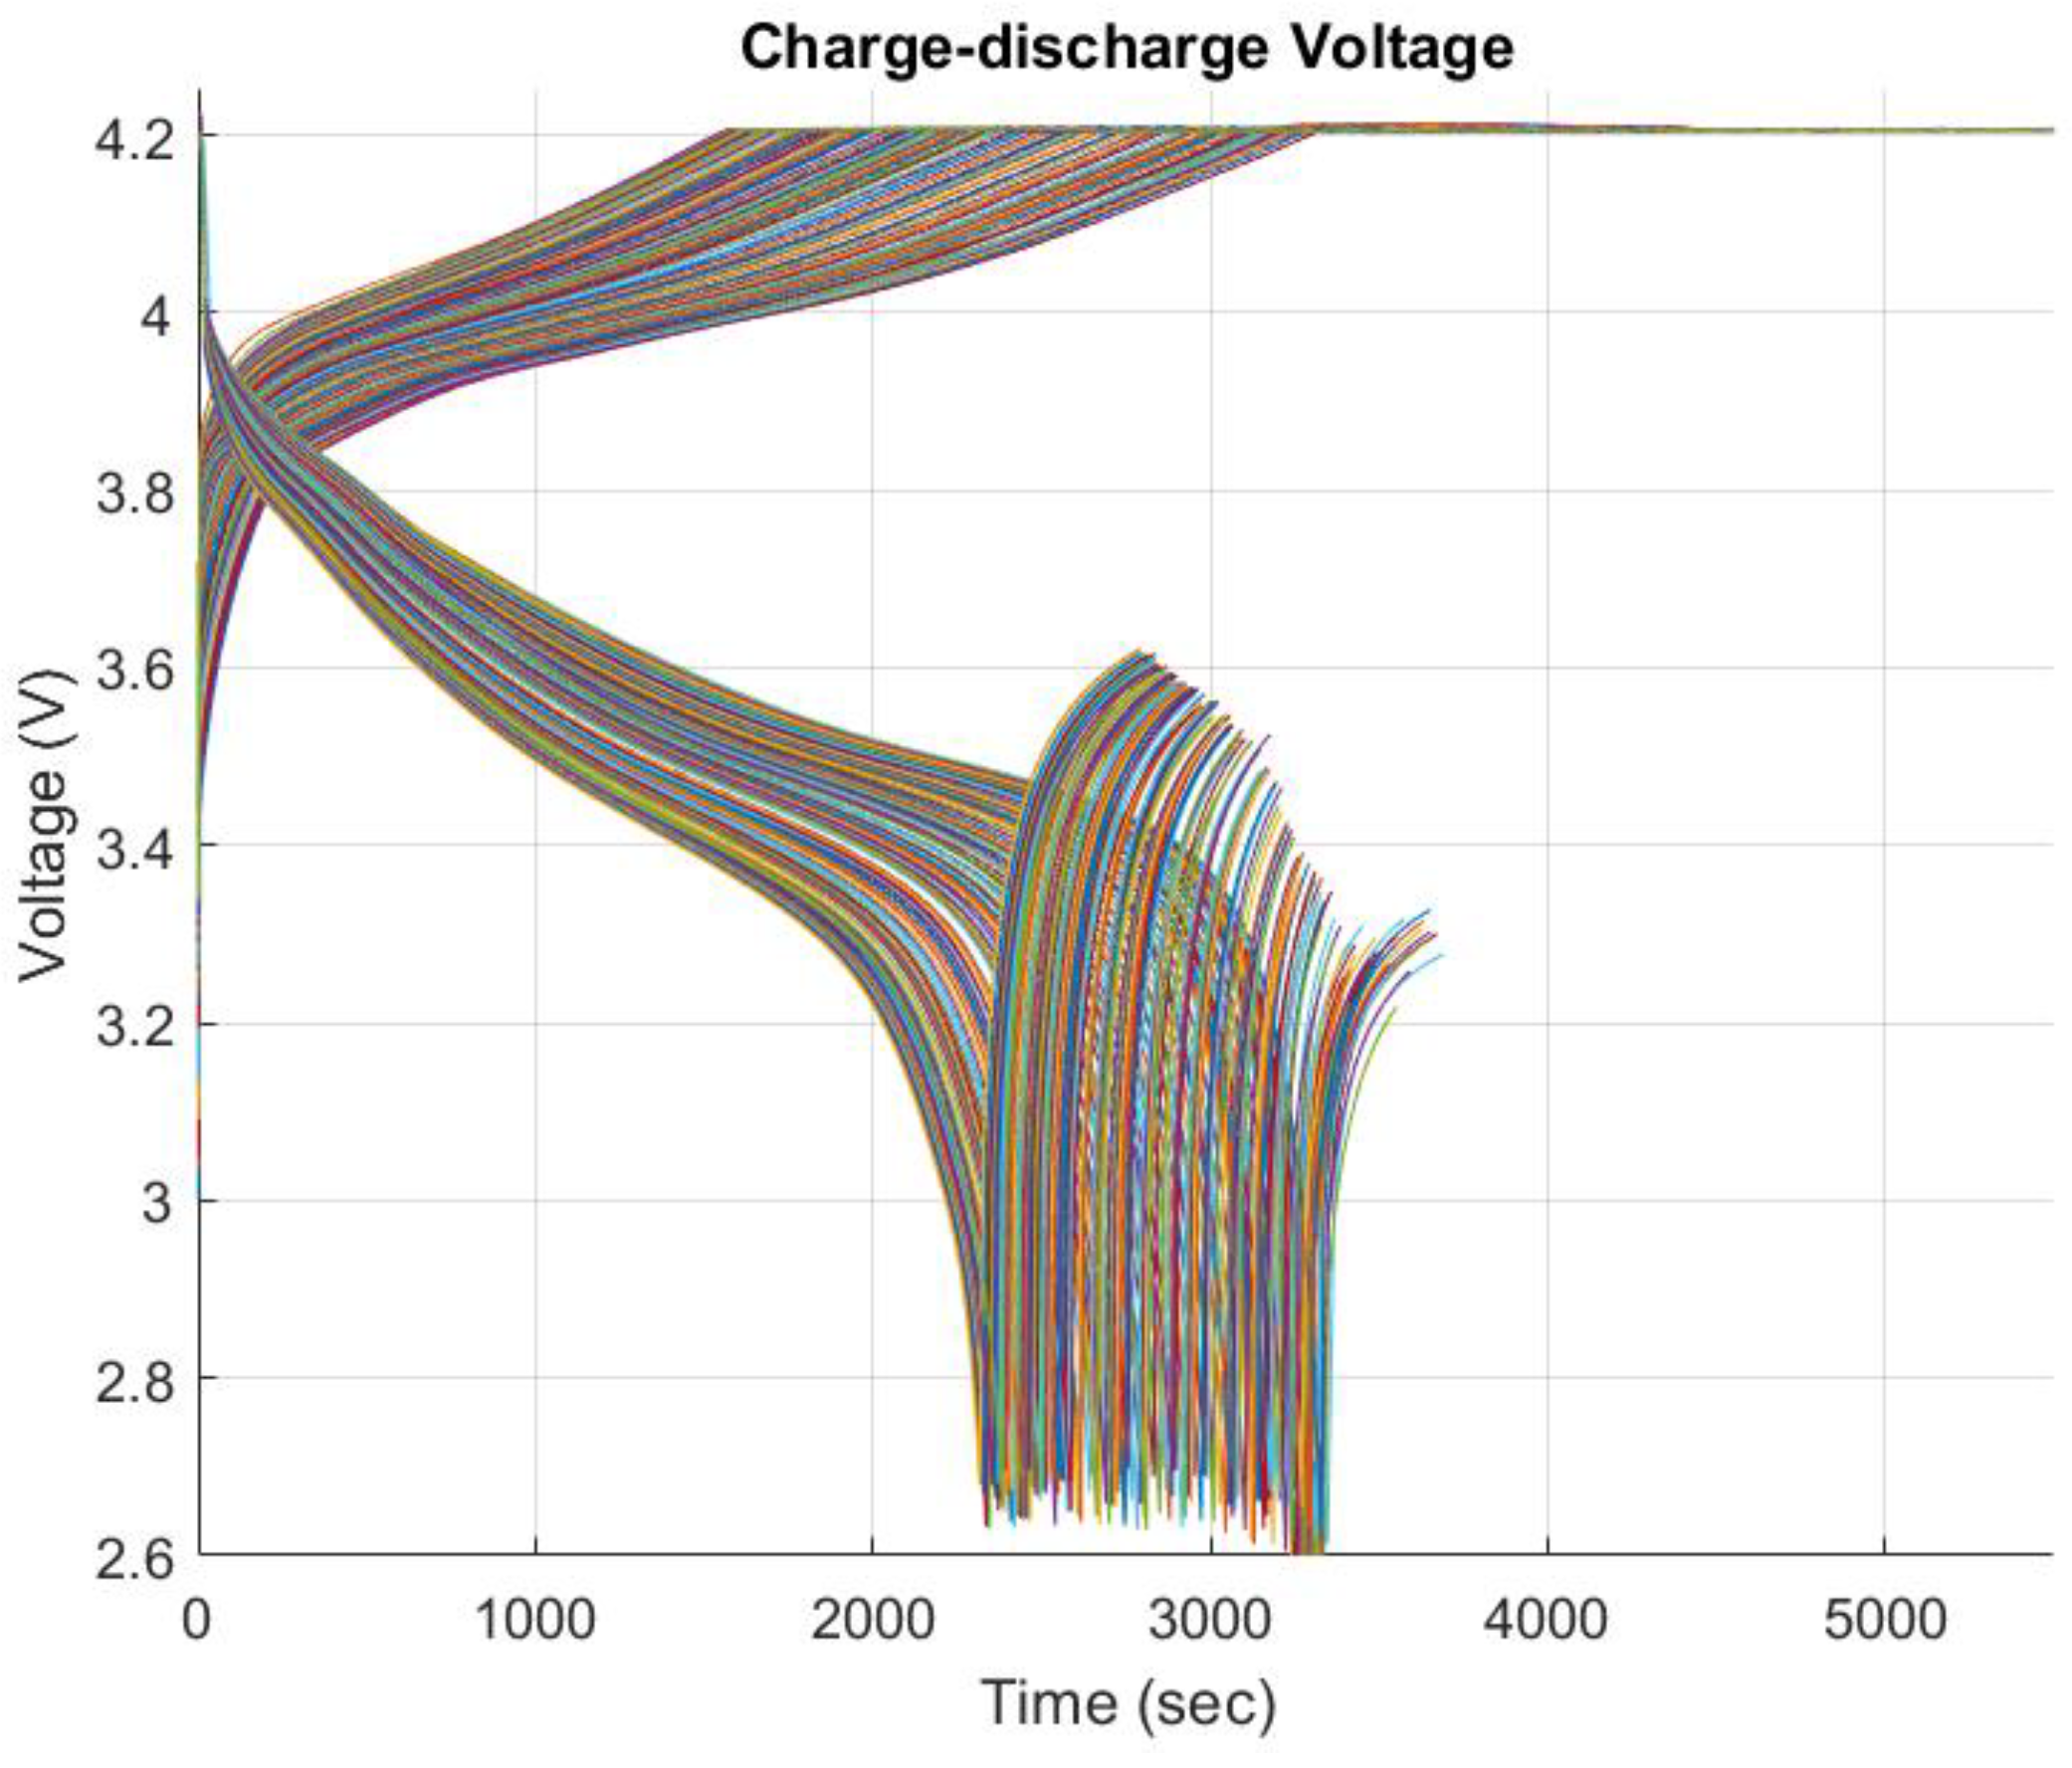
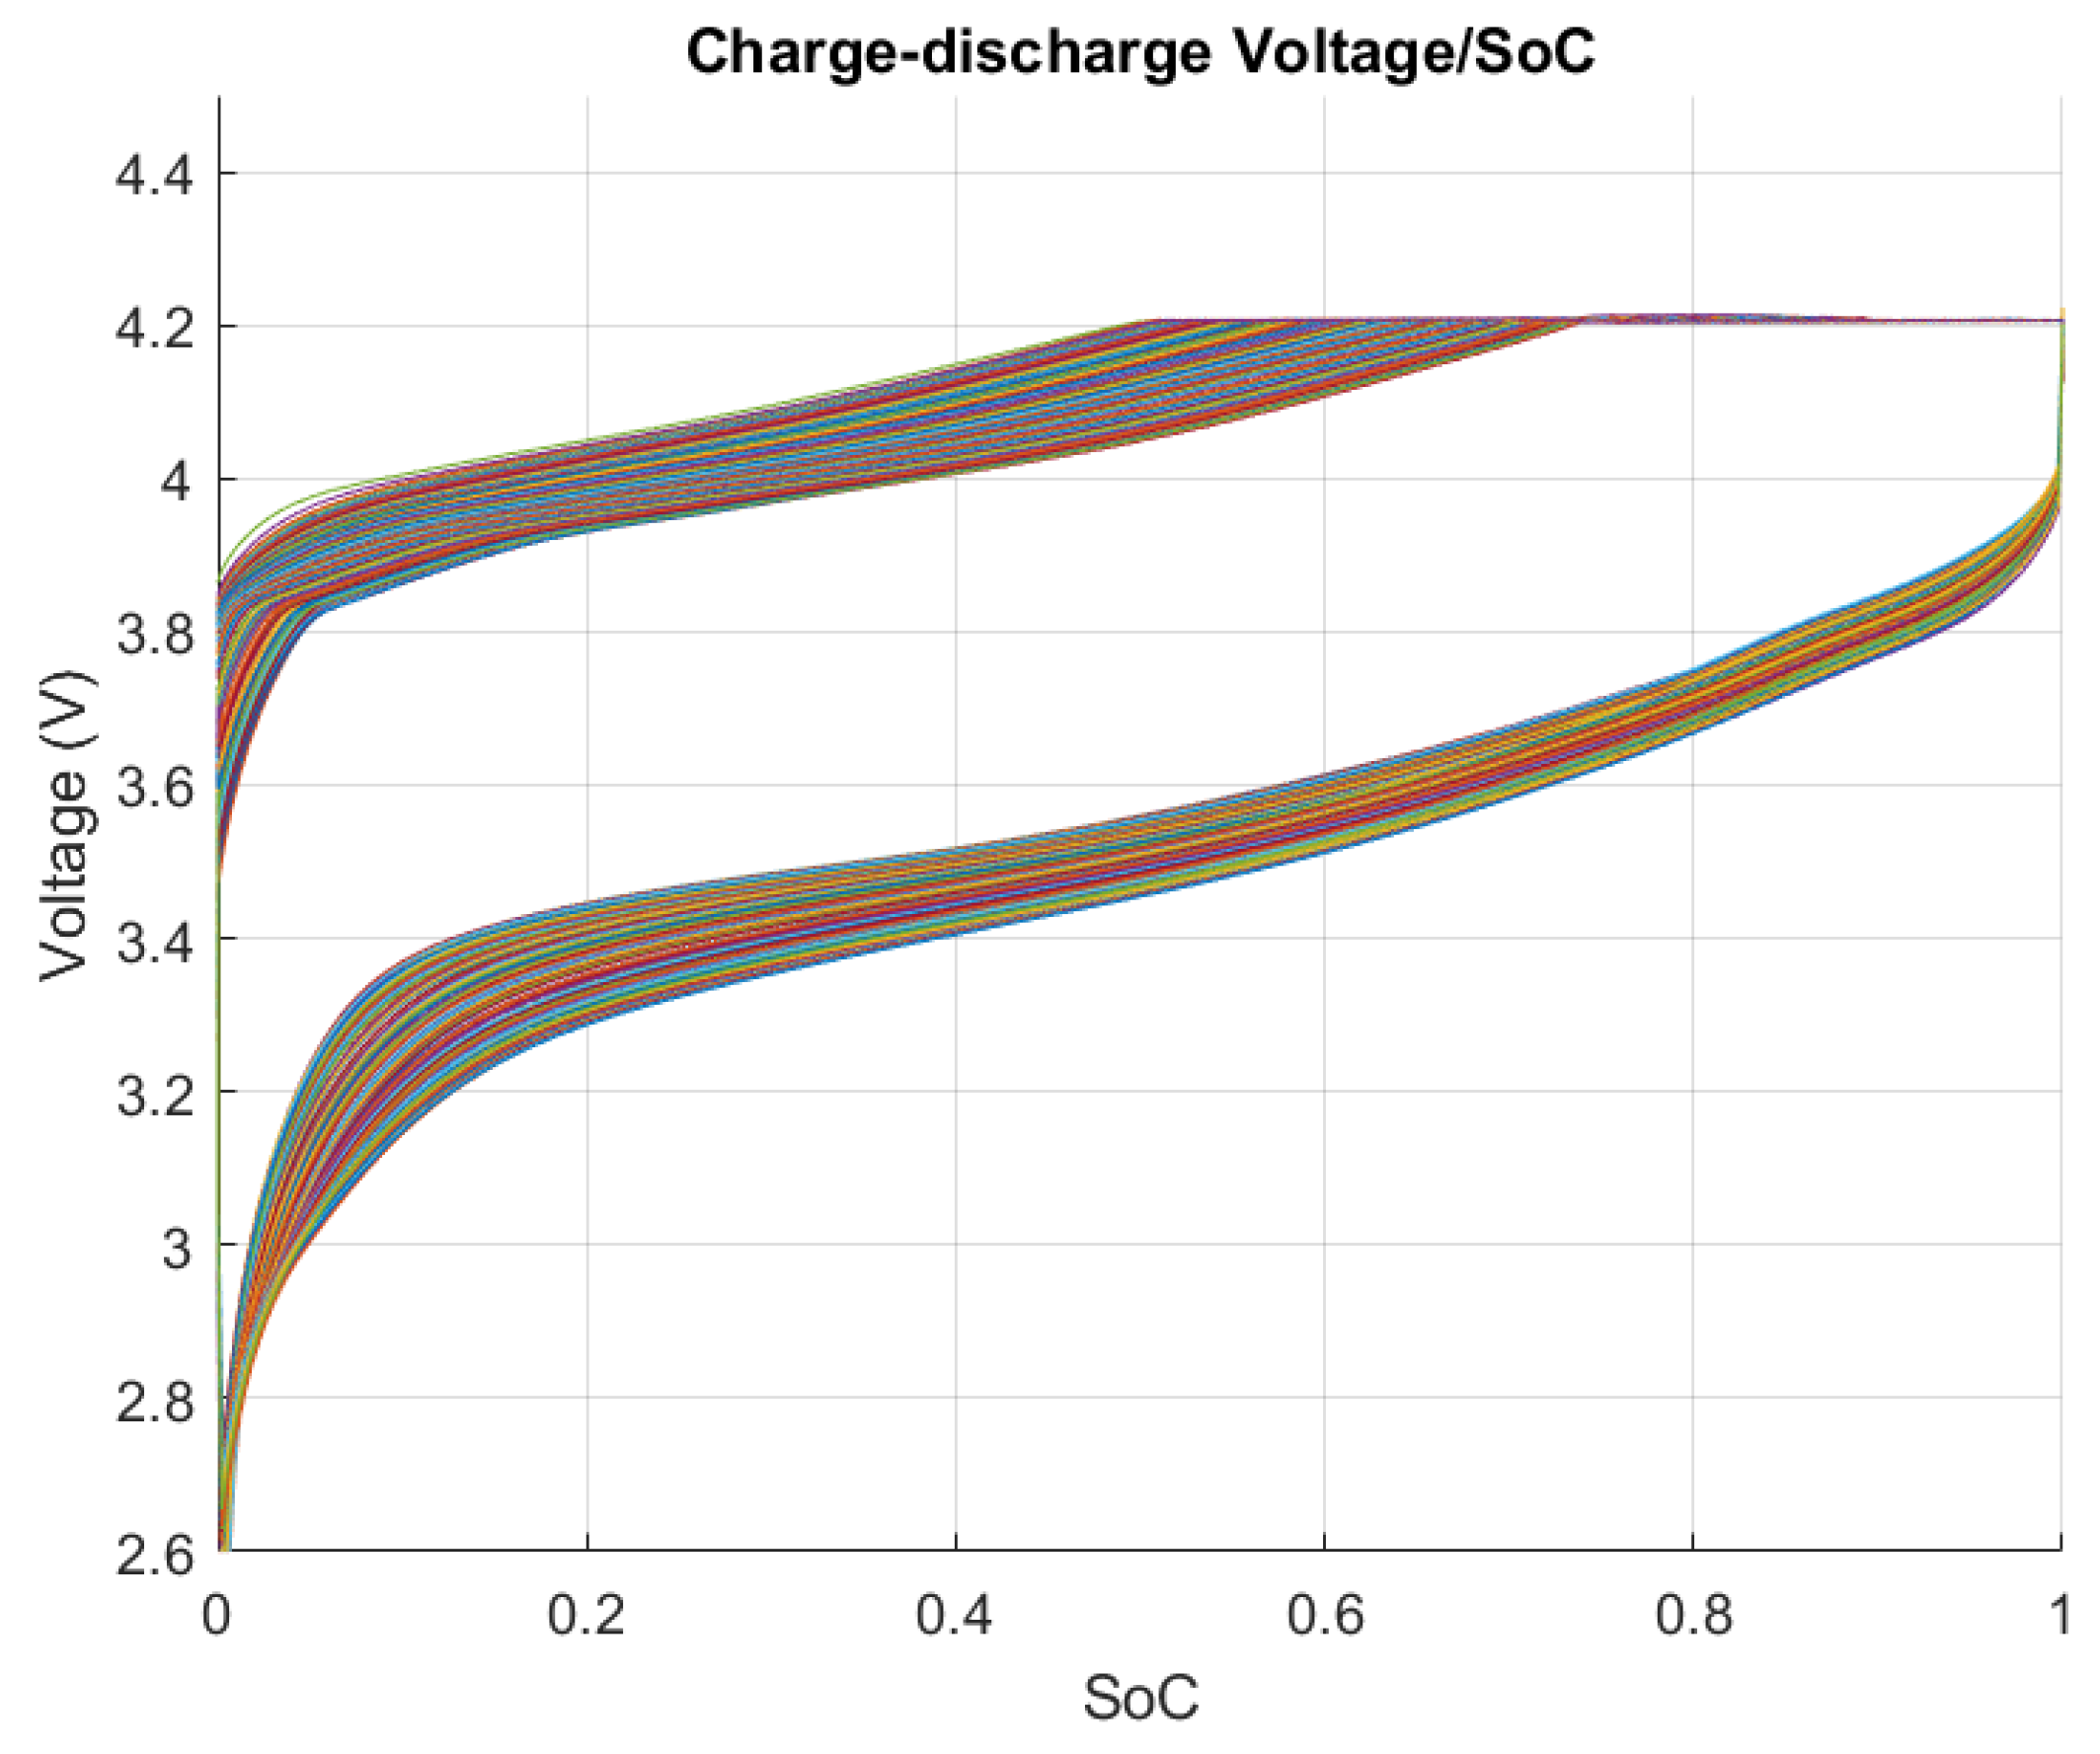
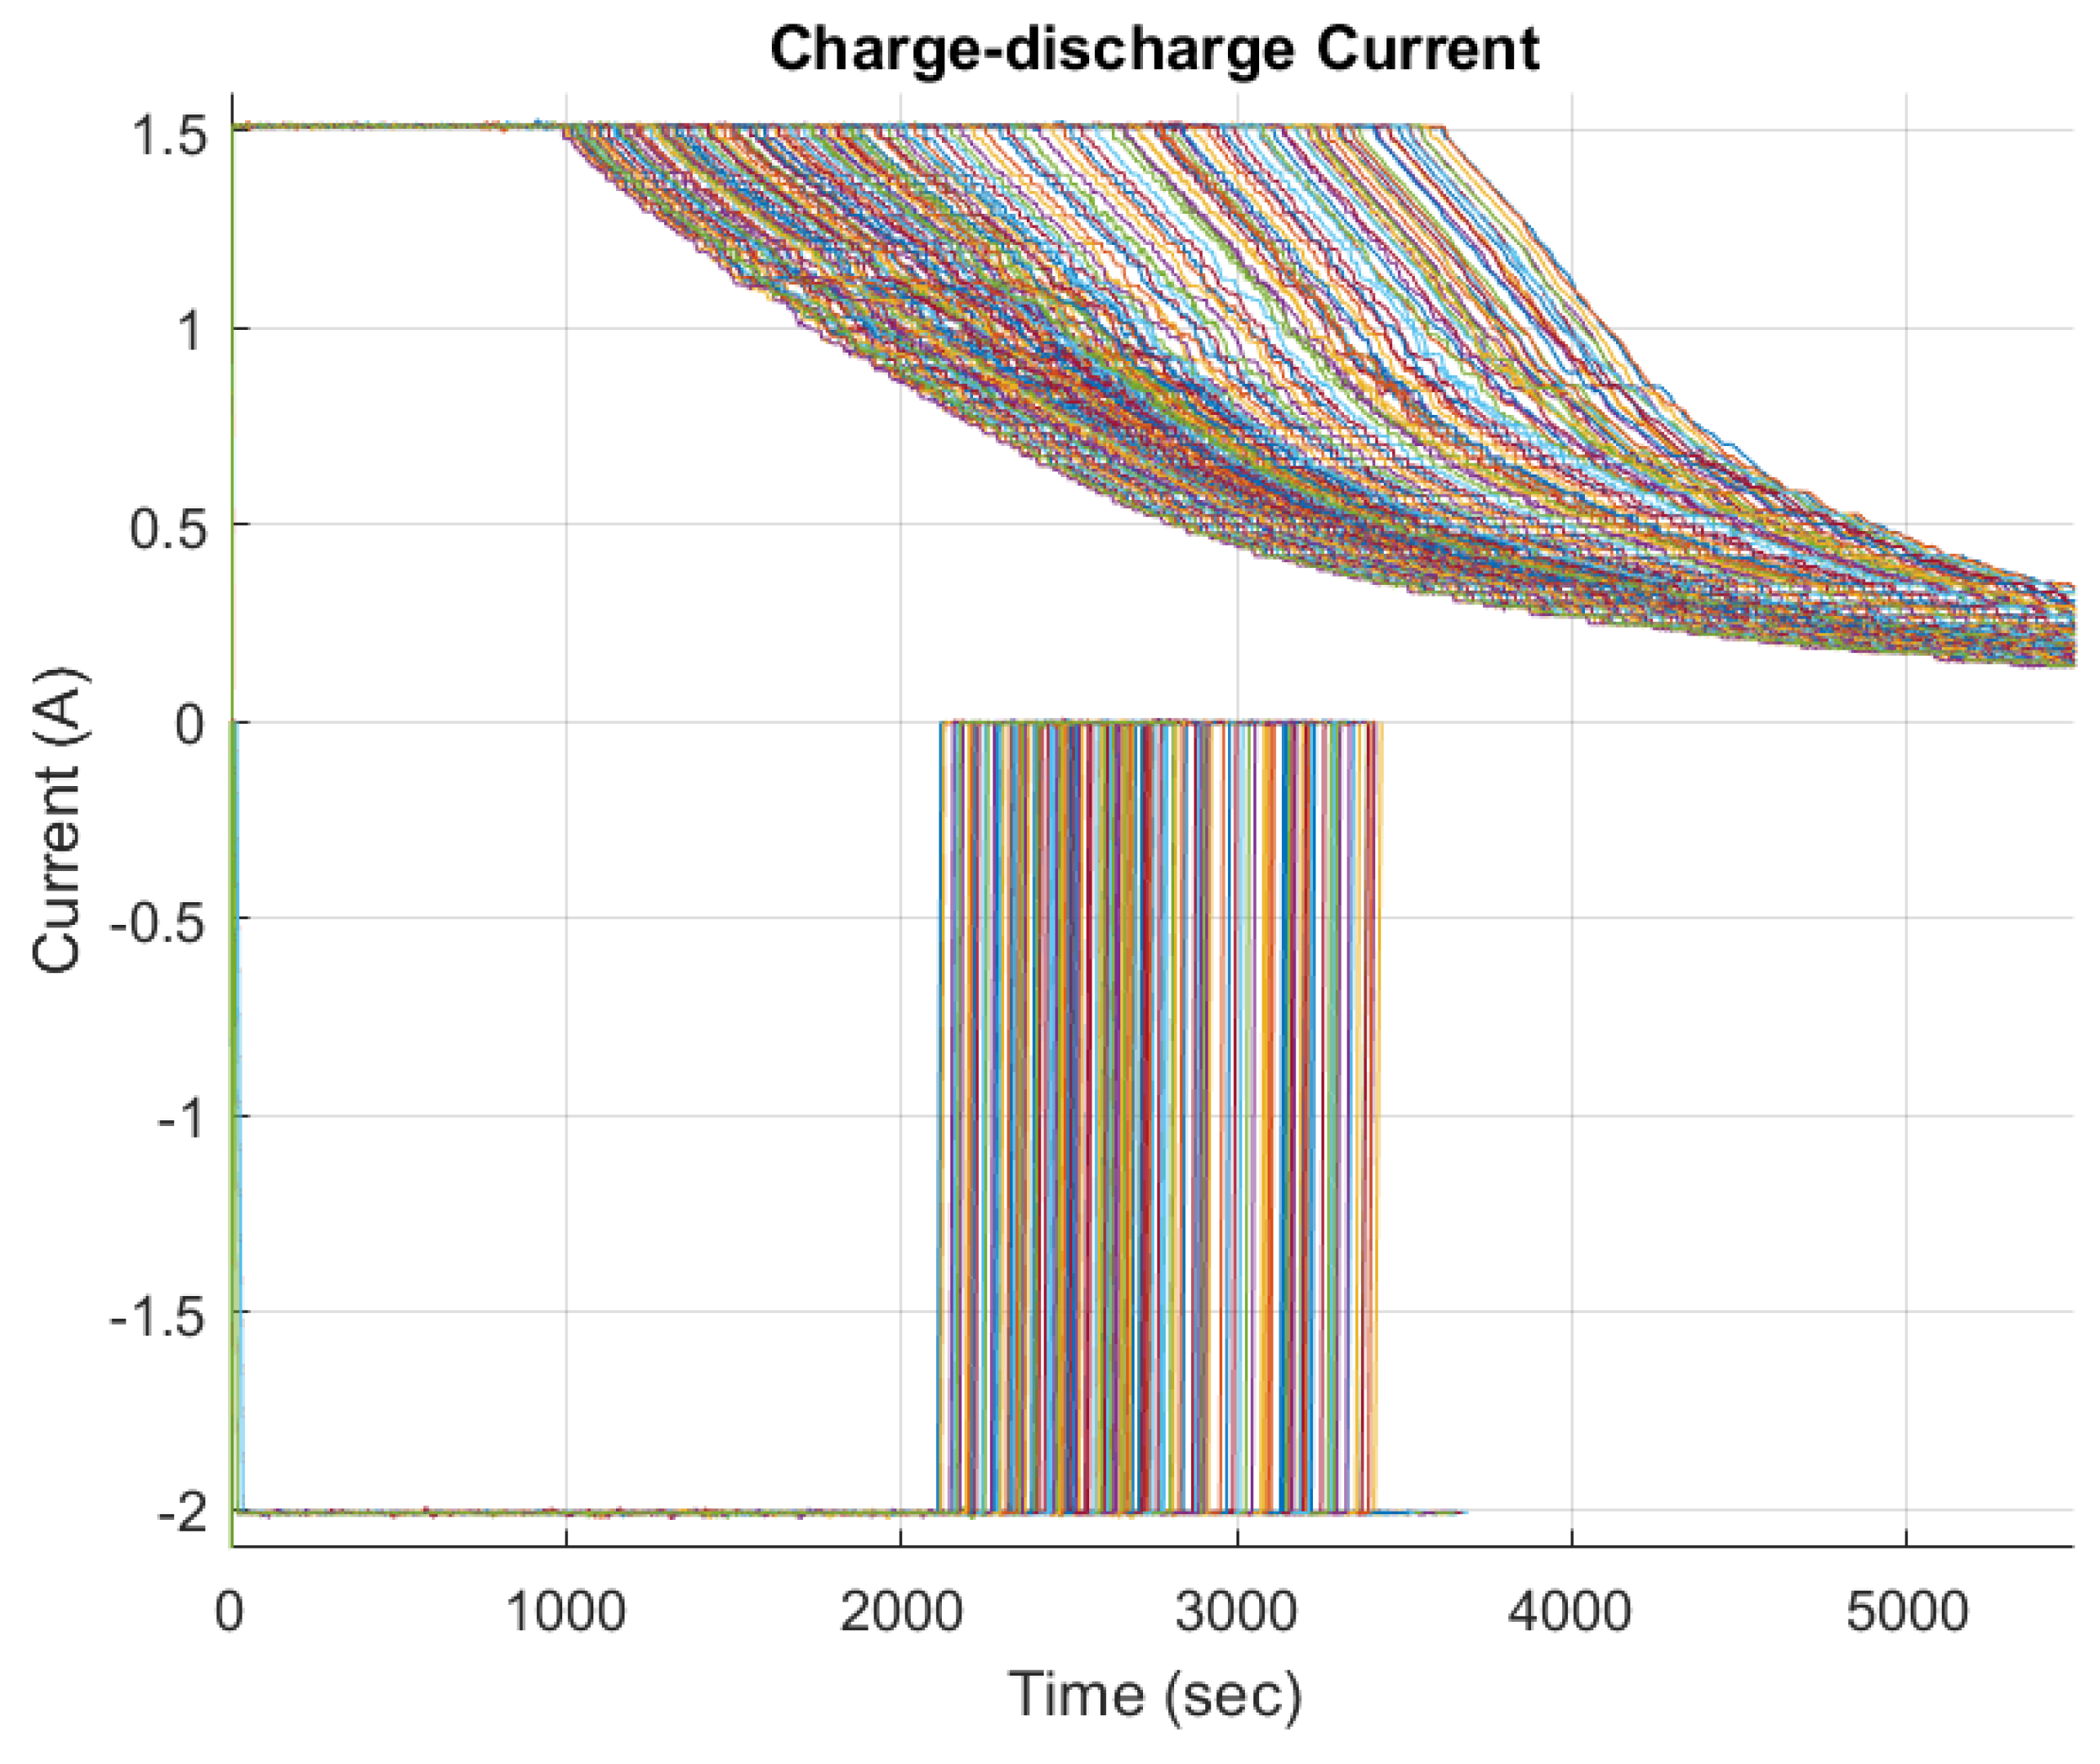
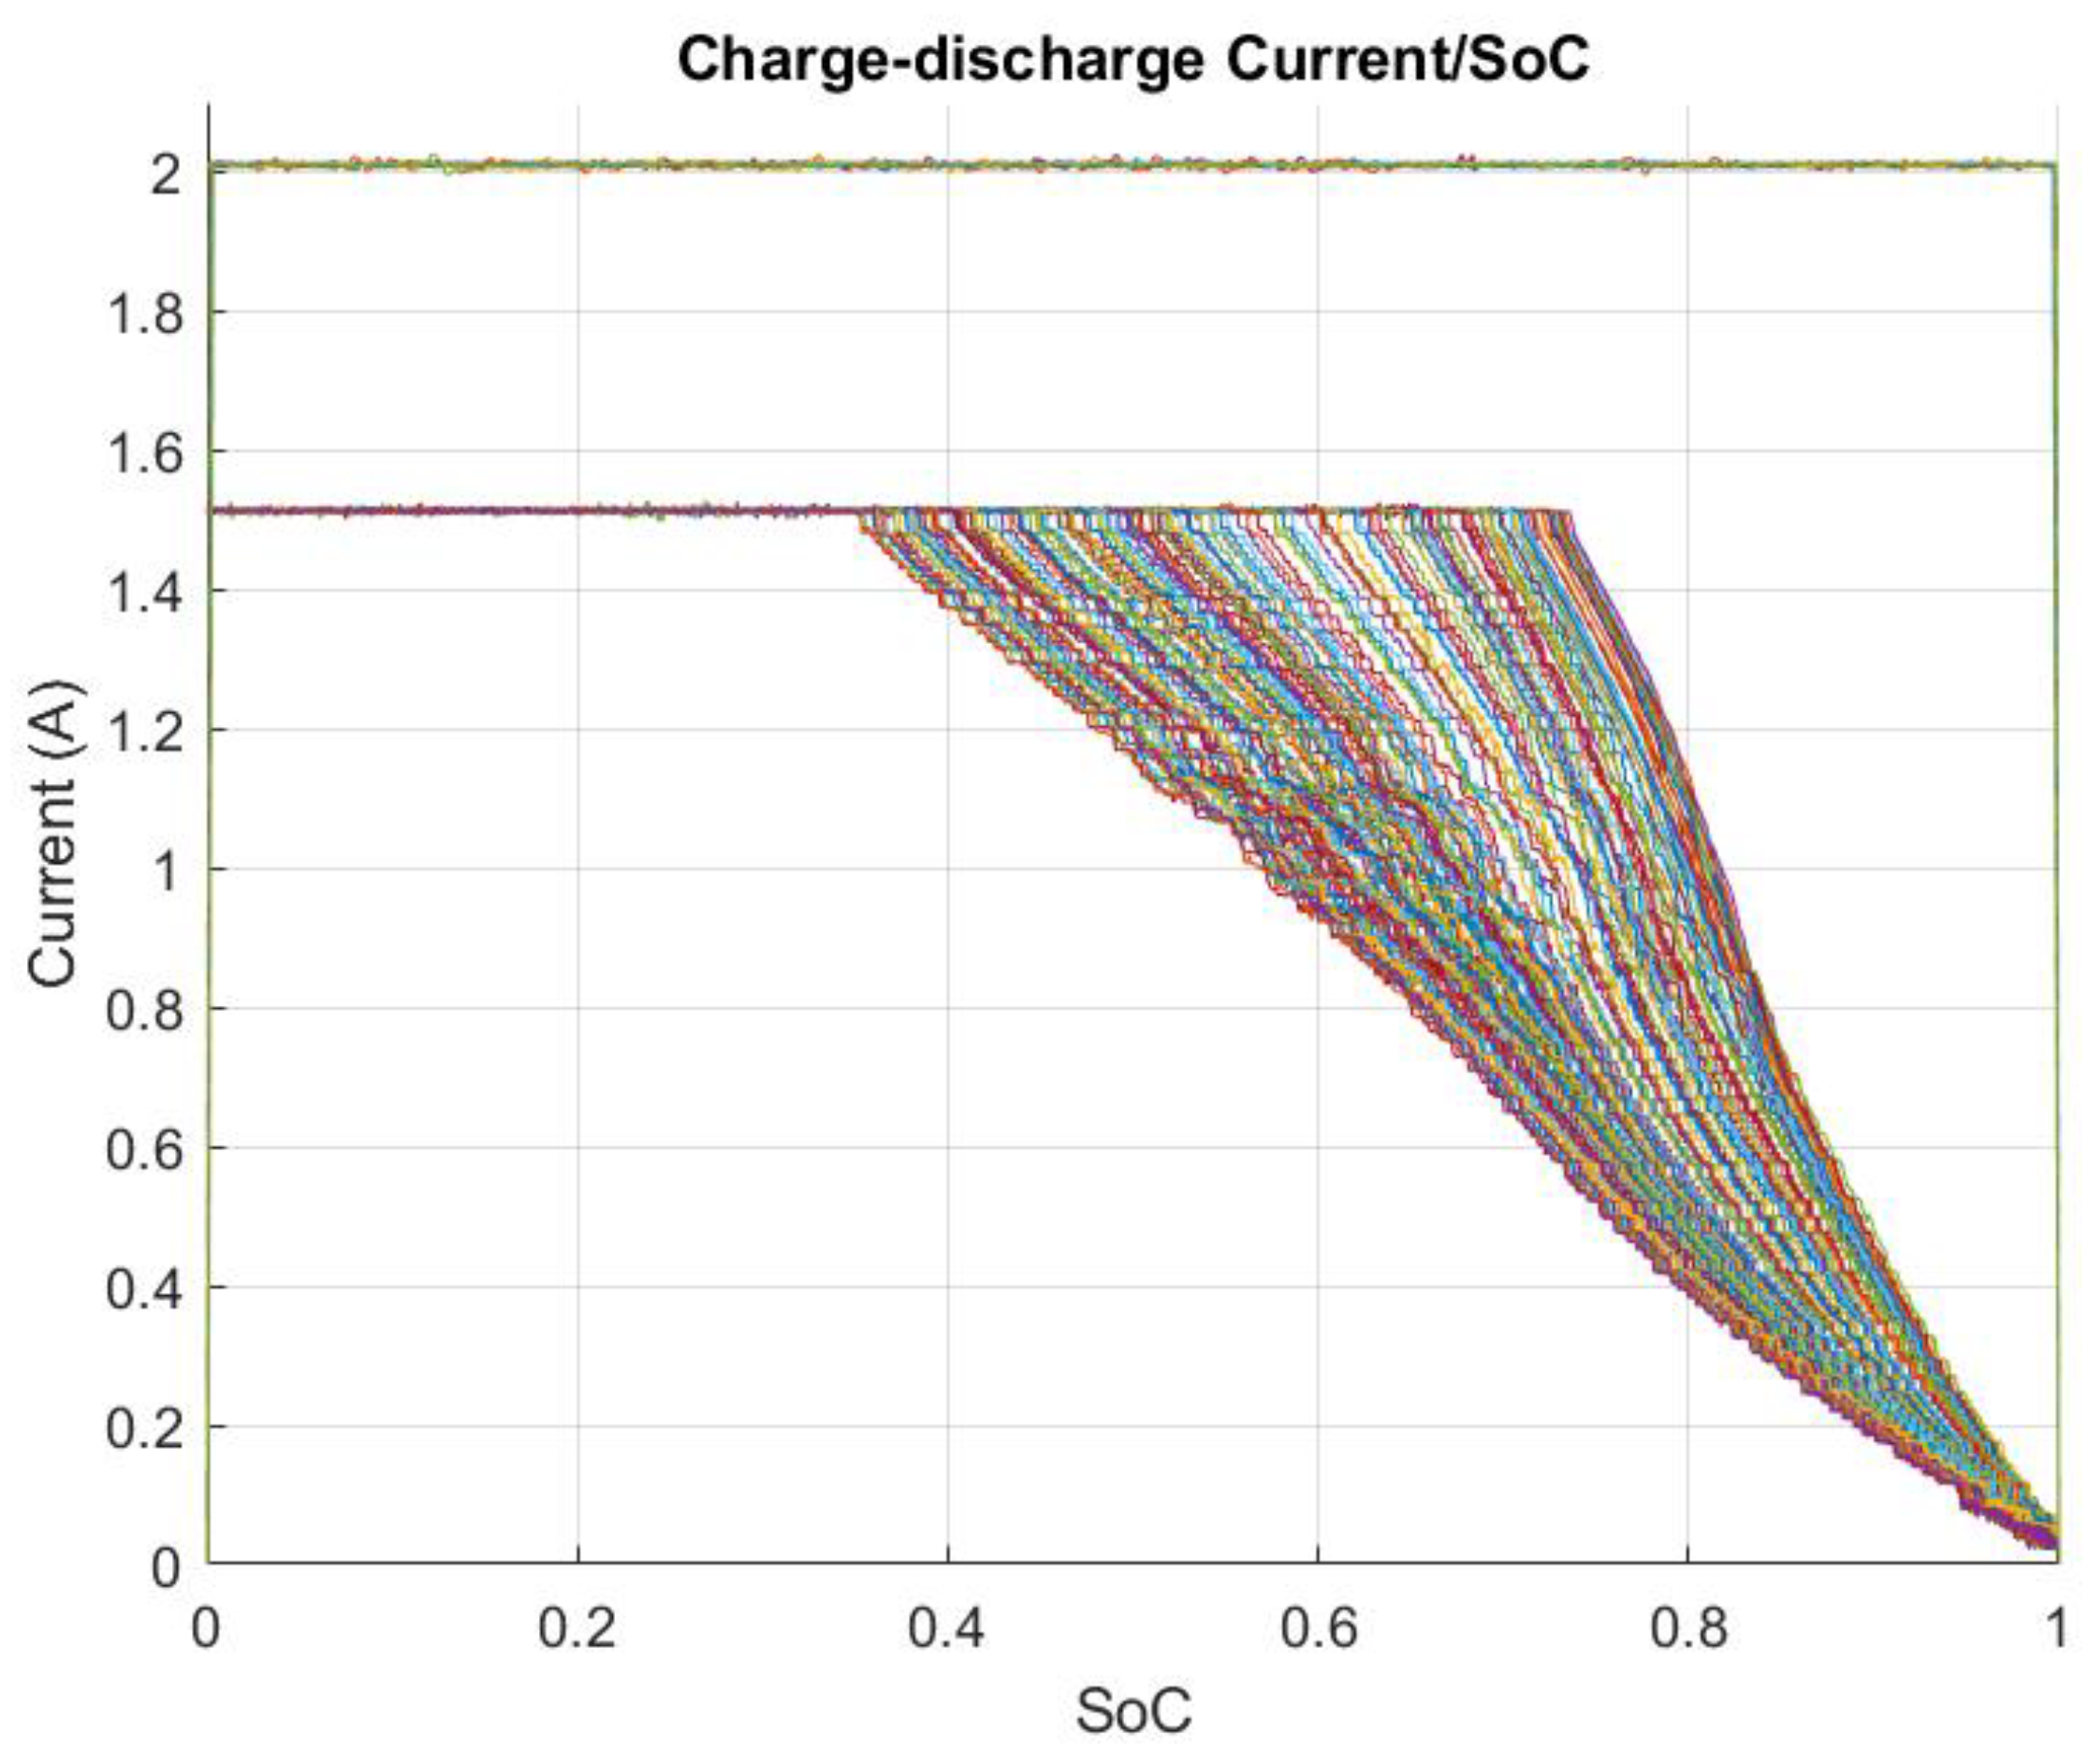
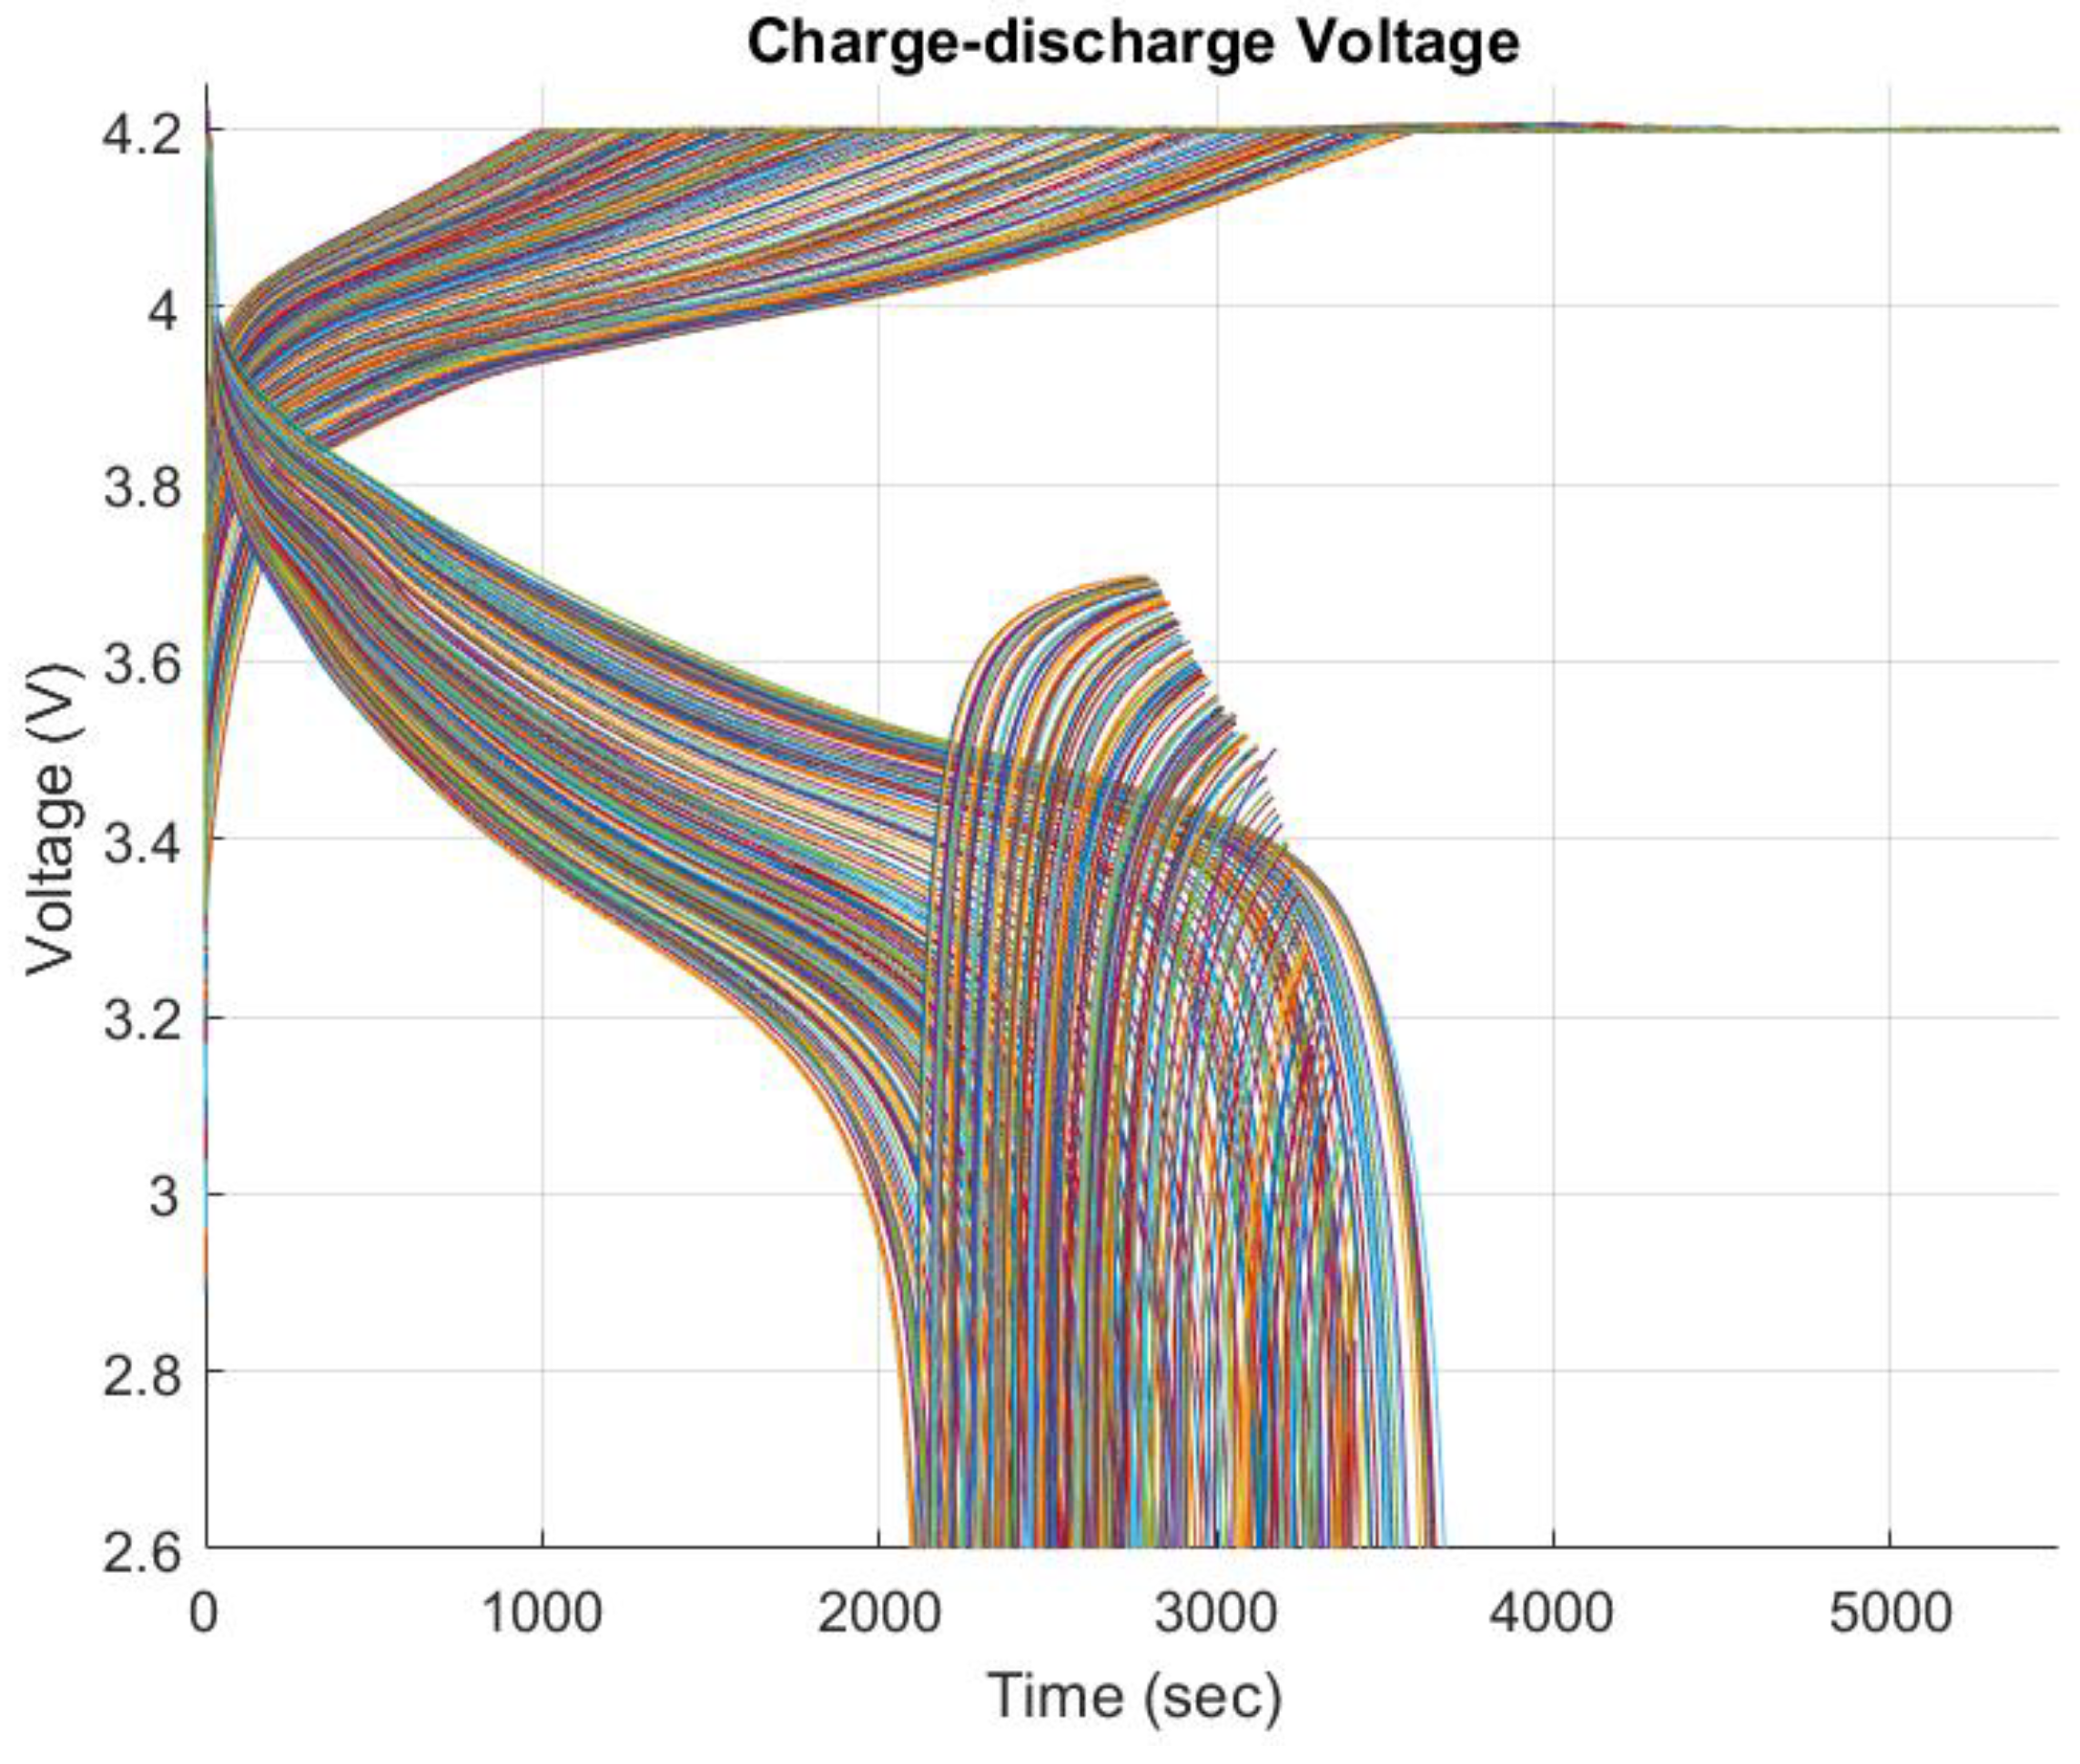
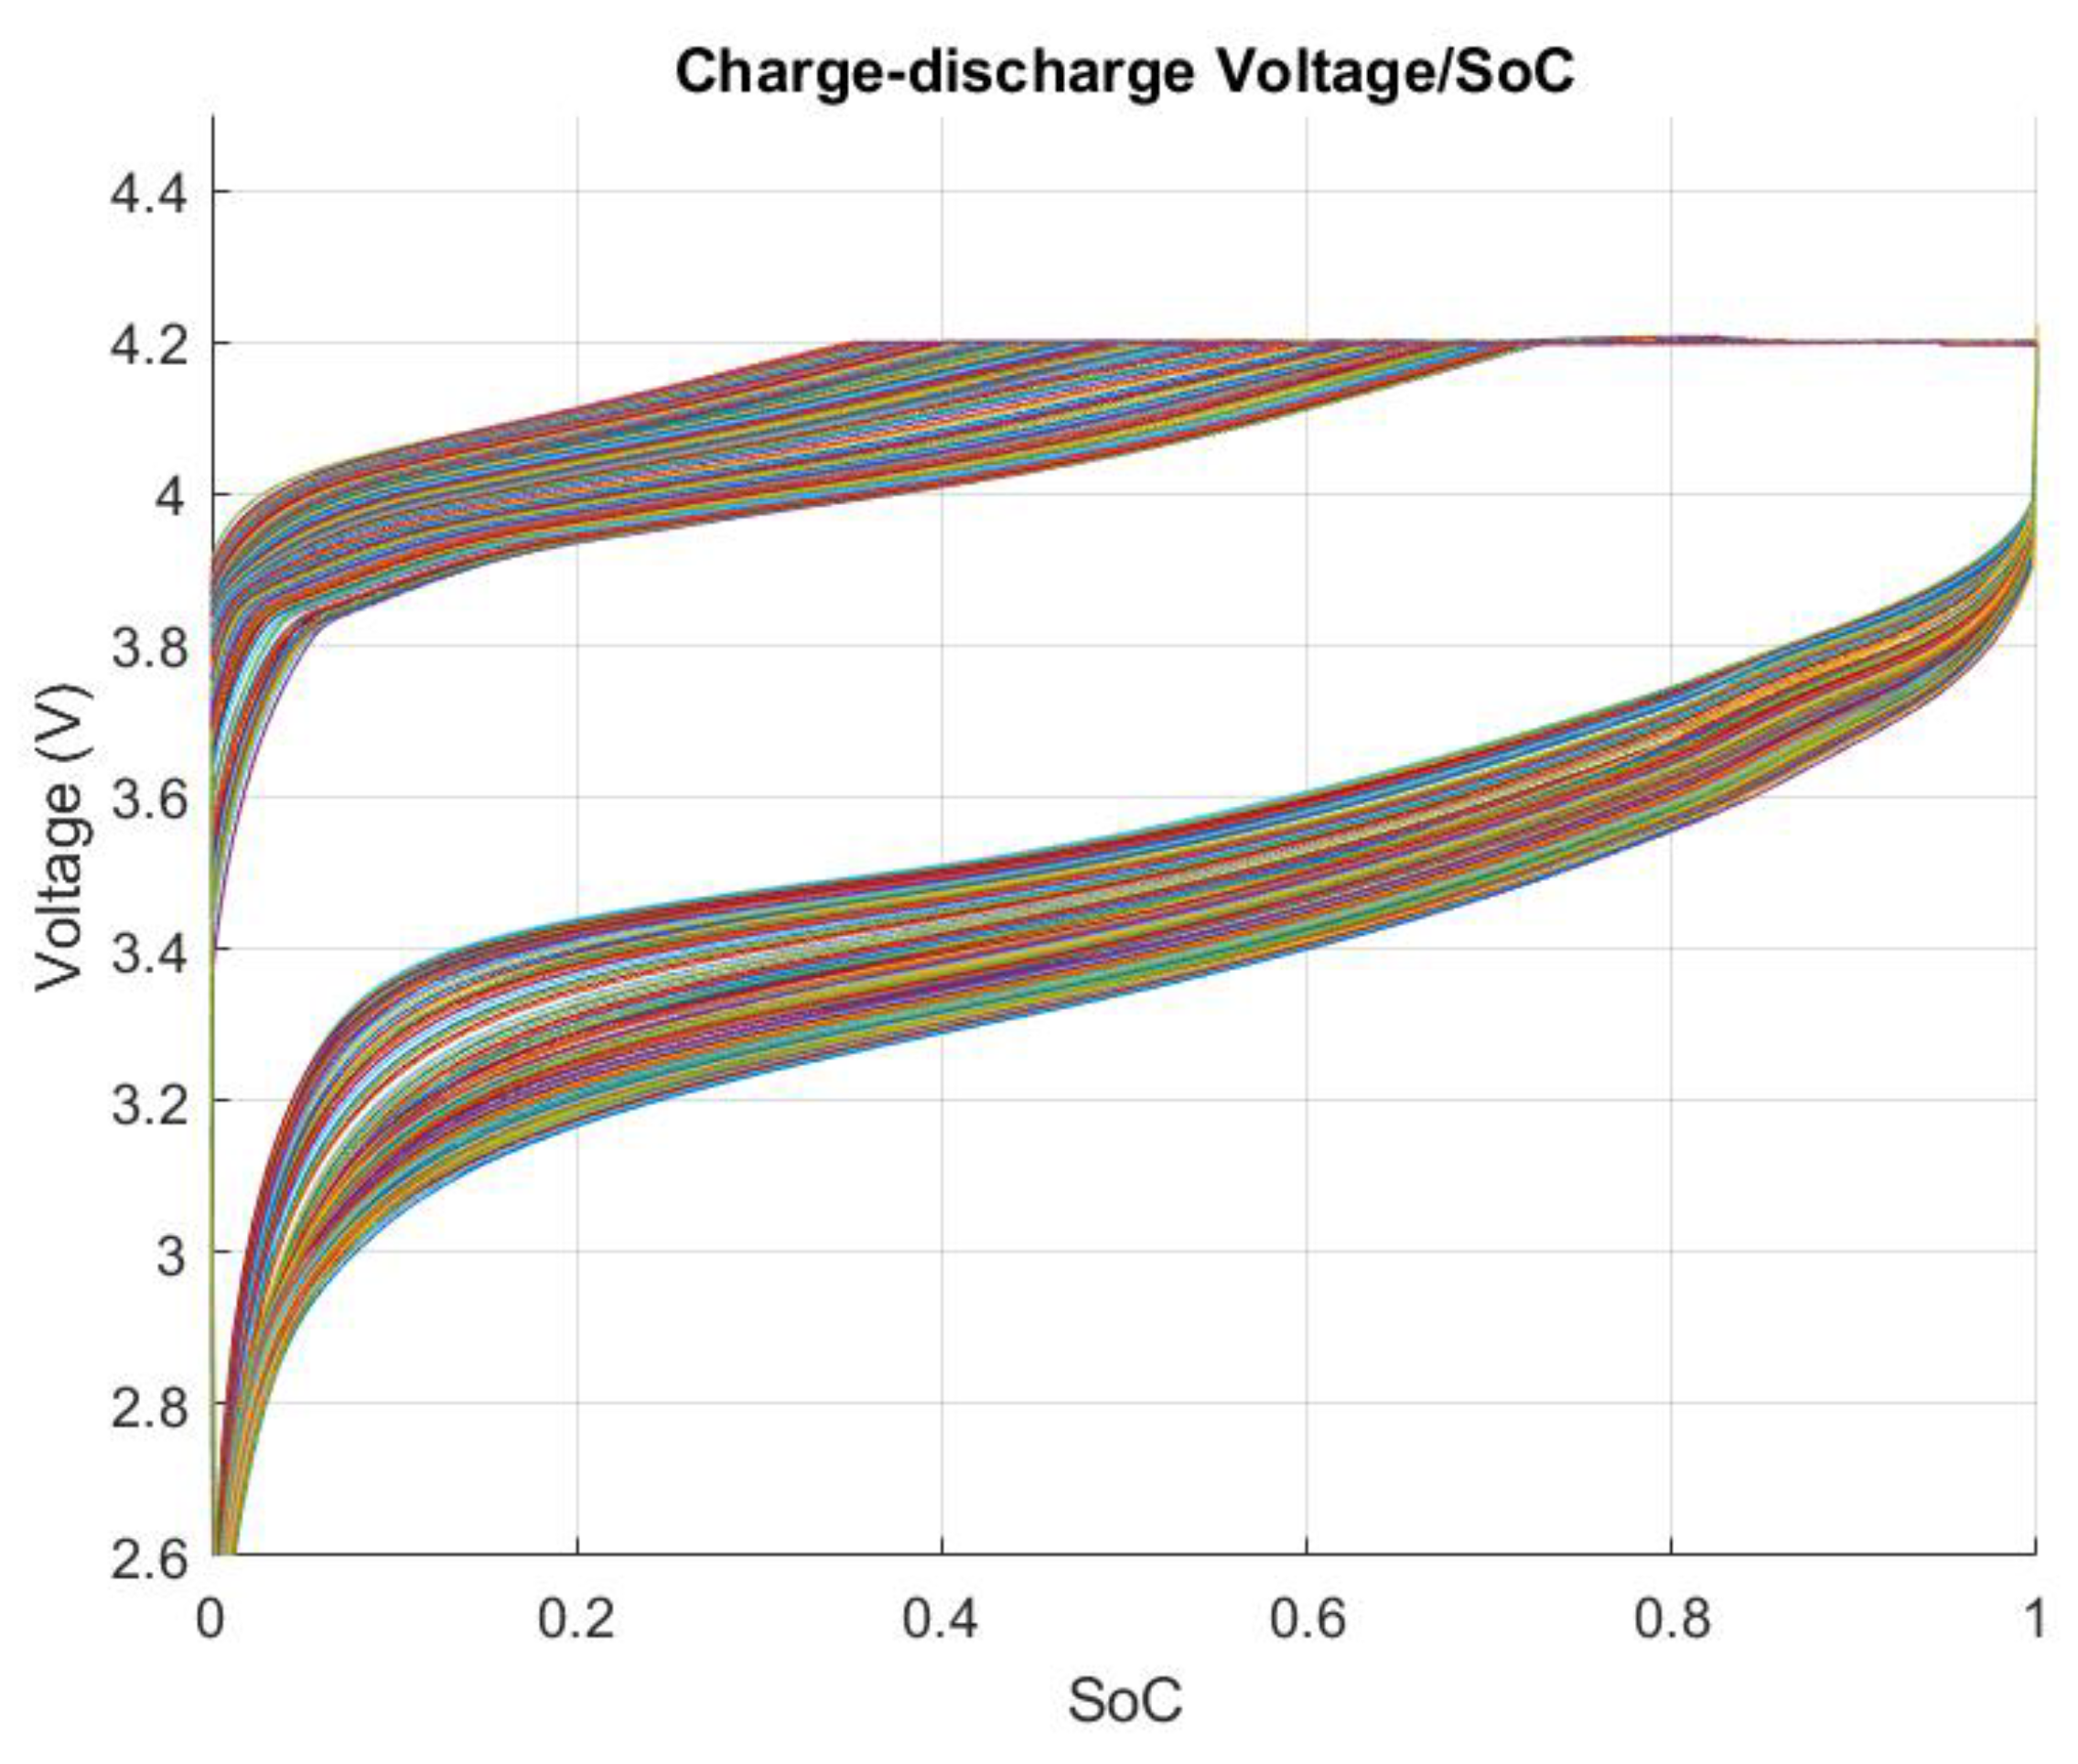
This section introduces the suggested Feed Forward Back Propagation Network (FFBPN) using the NASA Prognostics Center of Excellence Dataset [1]. In particular, the battery's battery life can be predicted through the charging and discharging phases of the processes. NASA'sPCoE Research Centre provides experimental data for the development of the FFBPN. Four cells are cycled, charged and discharged simultaneously under loads and environmental conditions defined respectively as a function of the charge performed and by the environmental chamber. Researchers decided to examine the internal parameters of the cells using periodic EIS measurements. In particular, complete charging, discharging and rest phase cycles were evaluated to predict the duration of the charge and the life cycle of the battery. With experimental data from NASA's PCoE Research Center, i.e., test time, step time, voltage, and cell surface temperature, researchers performed simulation tests by extracting fi files.csv or .mat for the most relevant data. As shown in Figure 1, Figure 2, Figure 3, Figure 4, Figure 5, Figure 6, Figure 7 and Figure 8, the trend of batteries B00005 and B00006 of current, voltage and SOC changes significantly in case of charge or discharge phase with advancing age; during the charging process, in fact, the current passes (as visible in Figure 1) from a value of 1.5A to 0 seconds in the initial phase and a value of 0.2 A at 5500 seconds and during the discharge process from an initial value of -2 A to a final value of 0 A. The corresponding voltage will change from a charging phase based on an initial value 3.8730 V reaches a final value of 4.1911V for battery B0005. The B0006 battery will have a charging phase with the initial values of current of 8.1999 A and voltage 3.8646 V until the voltage limit values of 4.2 V are reached. The discharge phase saw an initial current value of -2A up to the voltage limit value of 2.6 V for the B0006 battery. Figure 2 and Figure 5 represent the trends of Current (A) in the function of SOC for battery B0005 with starting values for the current in the charge phase of 2A and for the discharge phase of 1.5 A. For the B0006 battery, a starting current of 2A can be observed in the charging phase and an initial value of 1.555 A for the discharge phase.

3. Described The FFFBPN Model Development And The Architecture Of The Model

The first part of this article includes a retrieval of 3 data points and a dataset of the B0005 battery from the NASA PCoE Research Center Dataset. Three parameters were chosen based on utility assessments in the State of Charge SOC assessment. The model was trained with the use of 80% of the data, 10% of the data is attributed to testing and the remaining 10-5% of the data is attributed to the validation phase, respectively. The "logsig" activation function was used in this article, placed between the input and hidden layer, as shown in equation (10):
f(x)= 1 1 + e x (10)
Between the hidden layer and the output layer, the author has chosen to use the function "purelin" shown in equation (11):
f(x)=x (11)
Researchers after the end of this phase, have carried out the development of new batteries (B0005, B00007, B0018) of the NASA PCoE Research Center and the results have been very satisfactory.

3.1. Parameters Considered for the Realization of the Model

The input parameters are extracted from the NASA Dataset for Battery B0005. These are test_time(s), step_time(s), step_index, voltage (V), current (A), and surface_temperature (°C). In this work, the author used experimental data from NASA PCoE Research Center to perform important simulations. The process consists of using the charging phase to predict the SOC of lithium-ion battery B0005 of Dataset NASA Research Center. The model consisted of three stages, specifically called training, testing and validation; for these, the researchers developed the various phases using 80%,10%, and 10% respectively for each stage. The model used proceeds in successive phases.
If in the first training phase, all the requirements are met, the model proceeds to a test phase to carry out a performance measurement starting from the test data, otherwise, the model returns to the first phase. Specifically, the researchers developed and validated the model after the testing phase.

3.2. Data Normalization

The mathematical relationships for the calculation of the State of Charge (SOC) and weight update rule are presented in Eq.12 and 13:
State of Charge (SoC):
S o C ( t ) = S o C ( t 1 ) + ( t 0 t n I / C _ b a t )   ) (12)
Where :
  • SoC(t): State of Charge;
  • I(t): Current at time (t);
  • Cbat: Battery capacity;
  • t0: Initial time (s);
  • tn: Final time (s).
Weight Update Rule:
w i j = w i j η * E w i j (13)
  • wij: Weight between neurons (i) and (j)
  • η : Learning rate
  • E : Error

3.3. Method For FFBPN Model Improvement

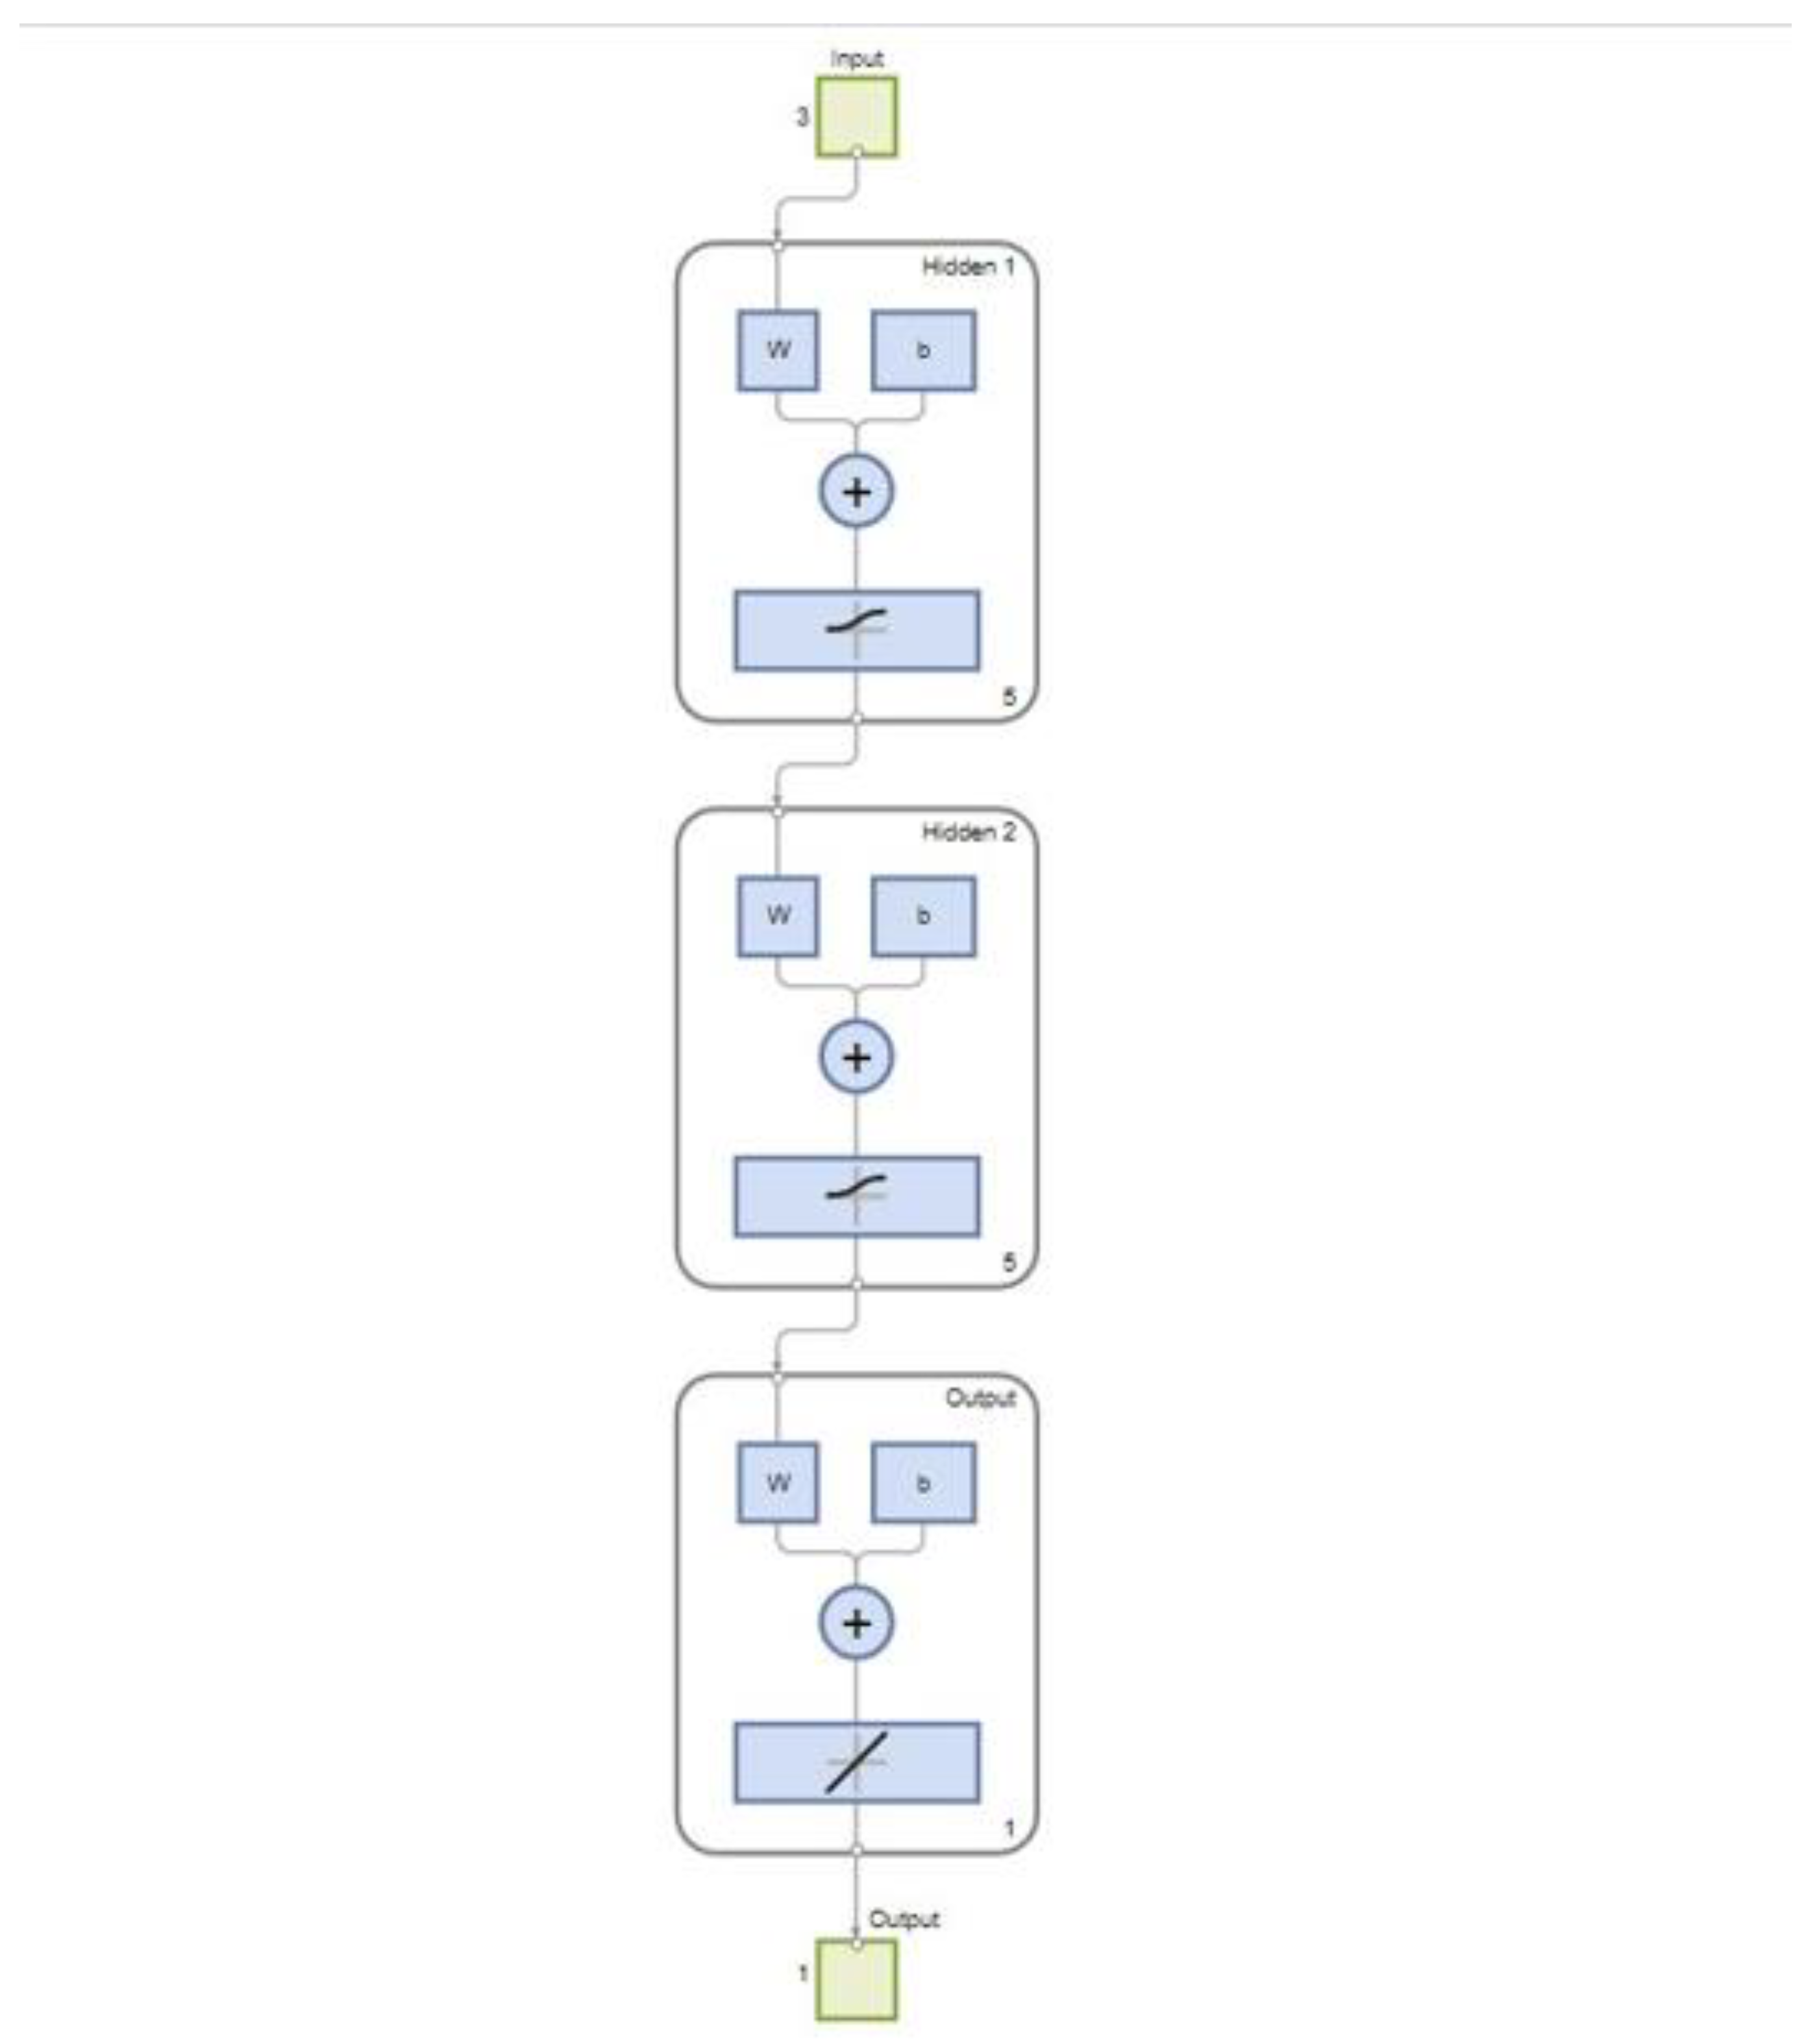
The FFBPN model was developed by MATLAB® 2023. During the first training process, the FFBPN-based model is trained with the available available historical data. If the model fails to perform as expected, it can be re-trained using the Levenberg-Marquardt (LM) backpropagation algorithm [33] until it performs best. In the validation phase, 10% of the data was used to verify the trained model after the conclusion of the model training. Once the accuracy was achieved, the model was approved for the test phase and tested on the remaining 10% of the datasets and the results were considered accurate with an R2 value close to 1.0. Three layers constitute the network, are shown in Figure 10 and are classified as input, hidden, and output layers. The author chose for the suggested network the sigmoid function (Tansig) in the hidden layer and the linear function (Purelin) in the output layer. The author set the goal of using another source to send the input signal to the input layer; also wants to transform the signal from the hidden layer into something that can support the output signal. Figure 10 represents the proposed neural network architecture with "Tansig" and "Purelin" functions. This neural architecture is also known as a multi-layer perceptron. Standard multilayer perceptrons can approximate any measurable function to the requested accuracy [33]". The “Initial training stage" phase uses data initially measured from the NASA PCoE Research Center Dataset.

4. Suggested Feed-Forward Back Propagation Network (FFBPN).

For researchers, the classic architecture of an artificial neural network is made up of three layers, which are the input layers, the hidden layers, and the output layers [34]. ANN is made up of neurons or nodes that are joined with each other. The ith, jth and kth nodes can be used to represent the three nodes. Adedeji [34] in his article described that during the forward pass, at the output layer, we have:
n e t k = j = 1 n w j k * y j + b k (1)
y k = g n e t k (2)
Where:
i: ith input layer node,
j: jth hidden layer node,
k: kth output layer node,
y: Output,
b: Bias,
wij: Is the connection between the weight or strength from node i to node j,
g: Is the activation function or non-linear activation function,
wjk: Connect the weight or the strength from node j to node k.
The gradient descending principle finds its representation in backpropagation of multilayer neural networks [34]:
w i j t + 1 = w i j t + Δ w i j (gradient descent) (3)
Δ w i j = η T i A i x i (4)
Where :
η : Learning rate,
xi: Input vector or signal,
Ti: Target output for a node or pattern recognition,
Ai: Actual output for a specific node,
Δ w i j : Weight or parameter adjustment.

4.1. Direct Model or Single Output Model

Figure 10 shows a single output model explained with the pre-processed dataset. The author chose to use three parameters as initial variables and a single element as the target variable. The state of charge was chosen as the target and the output variable. The determined input variables are:
X = x 1 , , x n (4)
X = x 1 , , x n = x 1 U U x n (5)
X = x 1 , , x n = x 1 U U x 3 (6)
Where:
x: Set of input variables,
x1: Battery current,
x2: Battery voltage,
x3: Battery temperature.
Similarly, the set of output variables can be represented as:
Y = y 1 , , y n 7
Y = y 1 , , y n = y 1 U U y n (8)
As Figure 1 shows, there is only one output variable:
Y = y 1 9
Where:
Y : Set of the output variables.
x∈Rn and y∈Rn
it is possible to define R as real numbers.

4.2. Training and Test Data

The author shows in Figure 11 the model of Function of Feed-forward Back Propagation Neural Network and shows with it 3 elements in input: current, voltage, and temperature of battery B0005 in case of charge, the State of Charge SOC value was chosen for the output.
5 neurons were chosen as the first hidden layer and 5 neurons as the second hidden layer. It is possible to see from Figure 11 that 3 input variables have been used so the size of the input variables is 3. Mean square error was used to evaluate the model.

4.3. Training Algorithm

The algorithm commonly applied to train a Feed-Forward Neural Network is Backpropagation with gradient descent. During training, the author chose to randomly initialize the parameters of the weights of the interconnection of the neurons. The trained data is passed through the network, from input to output, and the author chose to calculate the difference between the predicted output and the desired output. The error is then propagated backwards through the network, updating the weights of the connections based on each neuron's contribution to the total error. The created algorithm repeats the process for a certain number of epochs until an acceptable failure level or until overfitting occurs. After the completion of the training model, 10% of the data was utilized to validate the trained model during the validation period. After reaching a level of desired precision, the algorithm is tested for the remaining 10% of the dataset. Finally, the researchers obtained very accurate results from the simulations with R2 values close to 1.0. Figure 2 shows the suggested network with 3 layers, 3 inputs, 2 hidden, and 1 output layer.
The author created a representation of the Sigmoid function (Tansig) that can be observed from the graph used in the hidden layer and another representation of the linear function (Purelin) used in the output layer.

4.4. Hidden Layers in Prediction

Capturing non-linear associations between features, hidden layers train abstract representations of the input data. Each neuron in a hidden layer utilizes weighted inputs from the previous layer and uses a nonlinear activation function to generate its output. Subsequent hidden layers combine the outputs of neurons from the previous layer to become more abstract and complex representations. During the predictive phase, the input data is processed through the integrated network and the output of the last layer is used to predict the battery health.

4.5. Using for Battery Health Prediction

To use the trained model to predict the health of a battery, you need to provide the relevant characteristics of the cell as input data to the model. The model will process the input through hidden layers and produce a prediction of health status as output. The prediction can be interpreted as a percentage of a score that indicates the health level of the battery, where higher values indicate a healthier battery. This prediction can be used to make decisions about battery maintenance, replacement, or management to design and improve EV integration with vehicle-to-grid (V2G).

5. Results and discussions

5.1. FFBPN Model Training and FFBPN Model Testing

In this article, researchers have used a FFBPN neural network to predict the SOC of the cells. Input data taken from Dataset NASA has been considered for model development. The system was trained based on the Levenberg-Marquard backpropagation algorithm. The Levenberg-Marquard algorithm is used particularly for neural networks. It combines the advantages of the Gauss-Neuton algorithm and gradient descent. This algorithm has several advantages that make it preferable to backpropagation methods in several key ways. Firstly, LM blends the Gauss-Newton algorithm and gradient descent. This hybrid approach allows it to switch between the two methods depending on the situation optimizing both speed and accuracy.
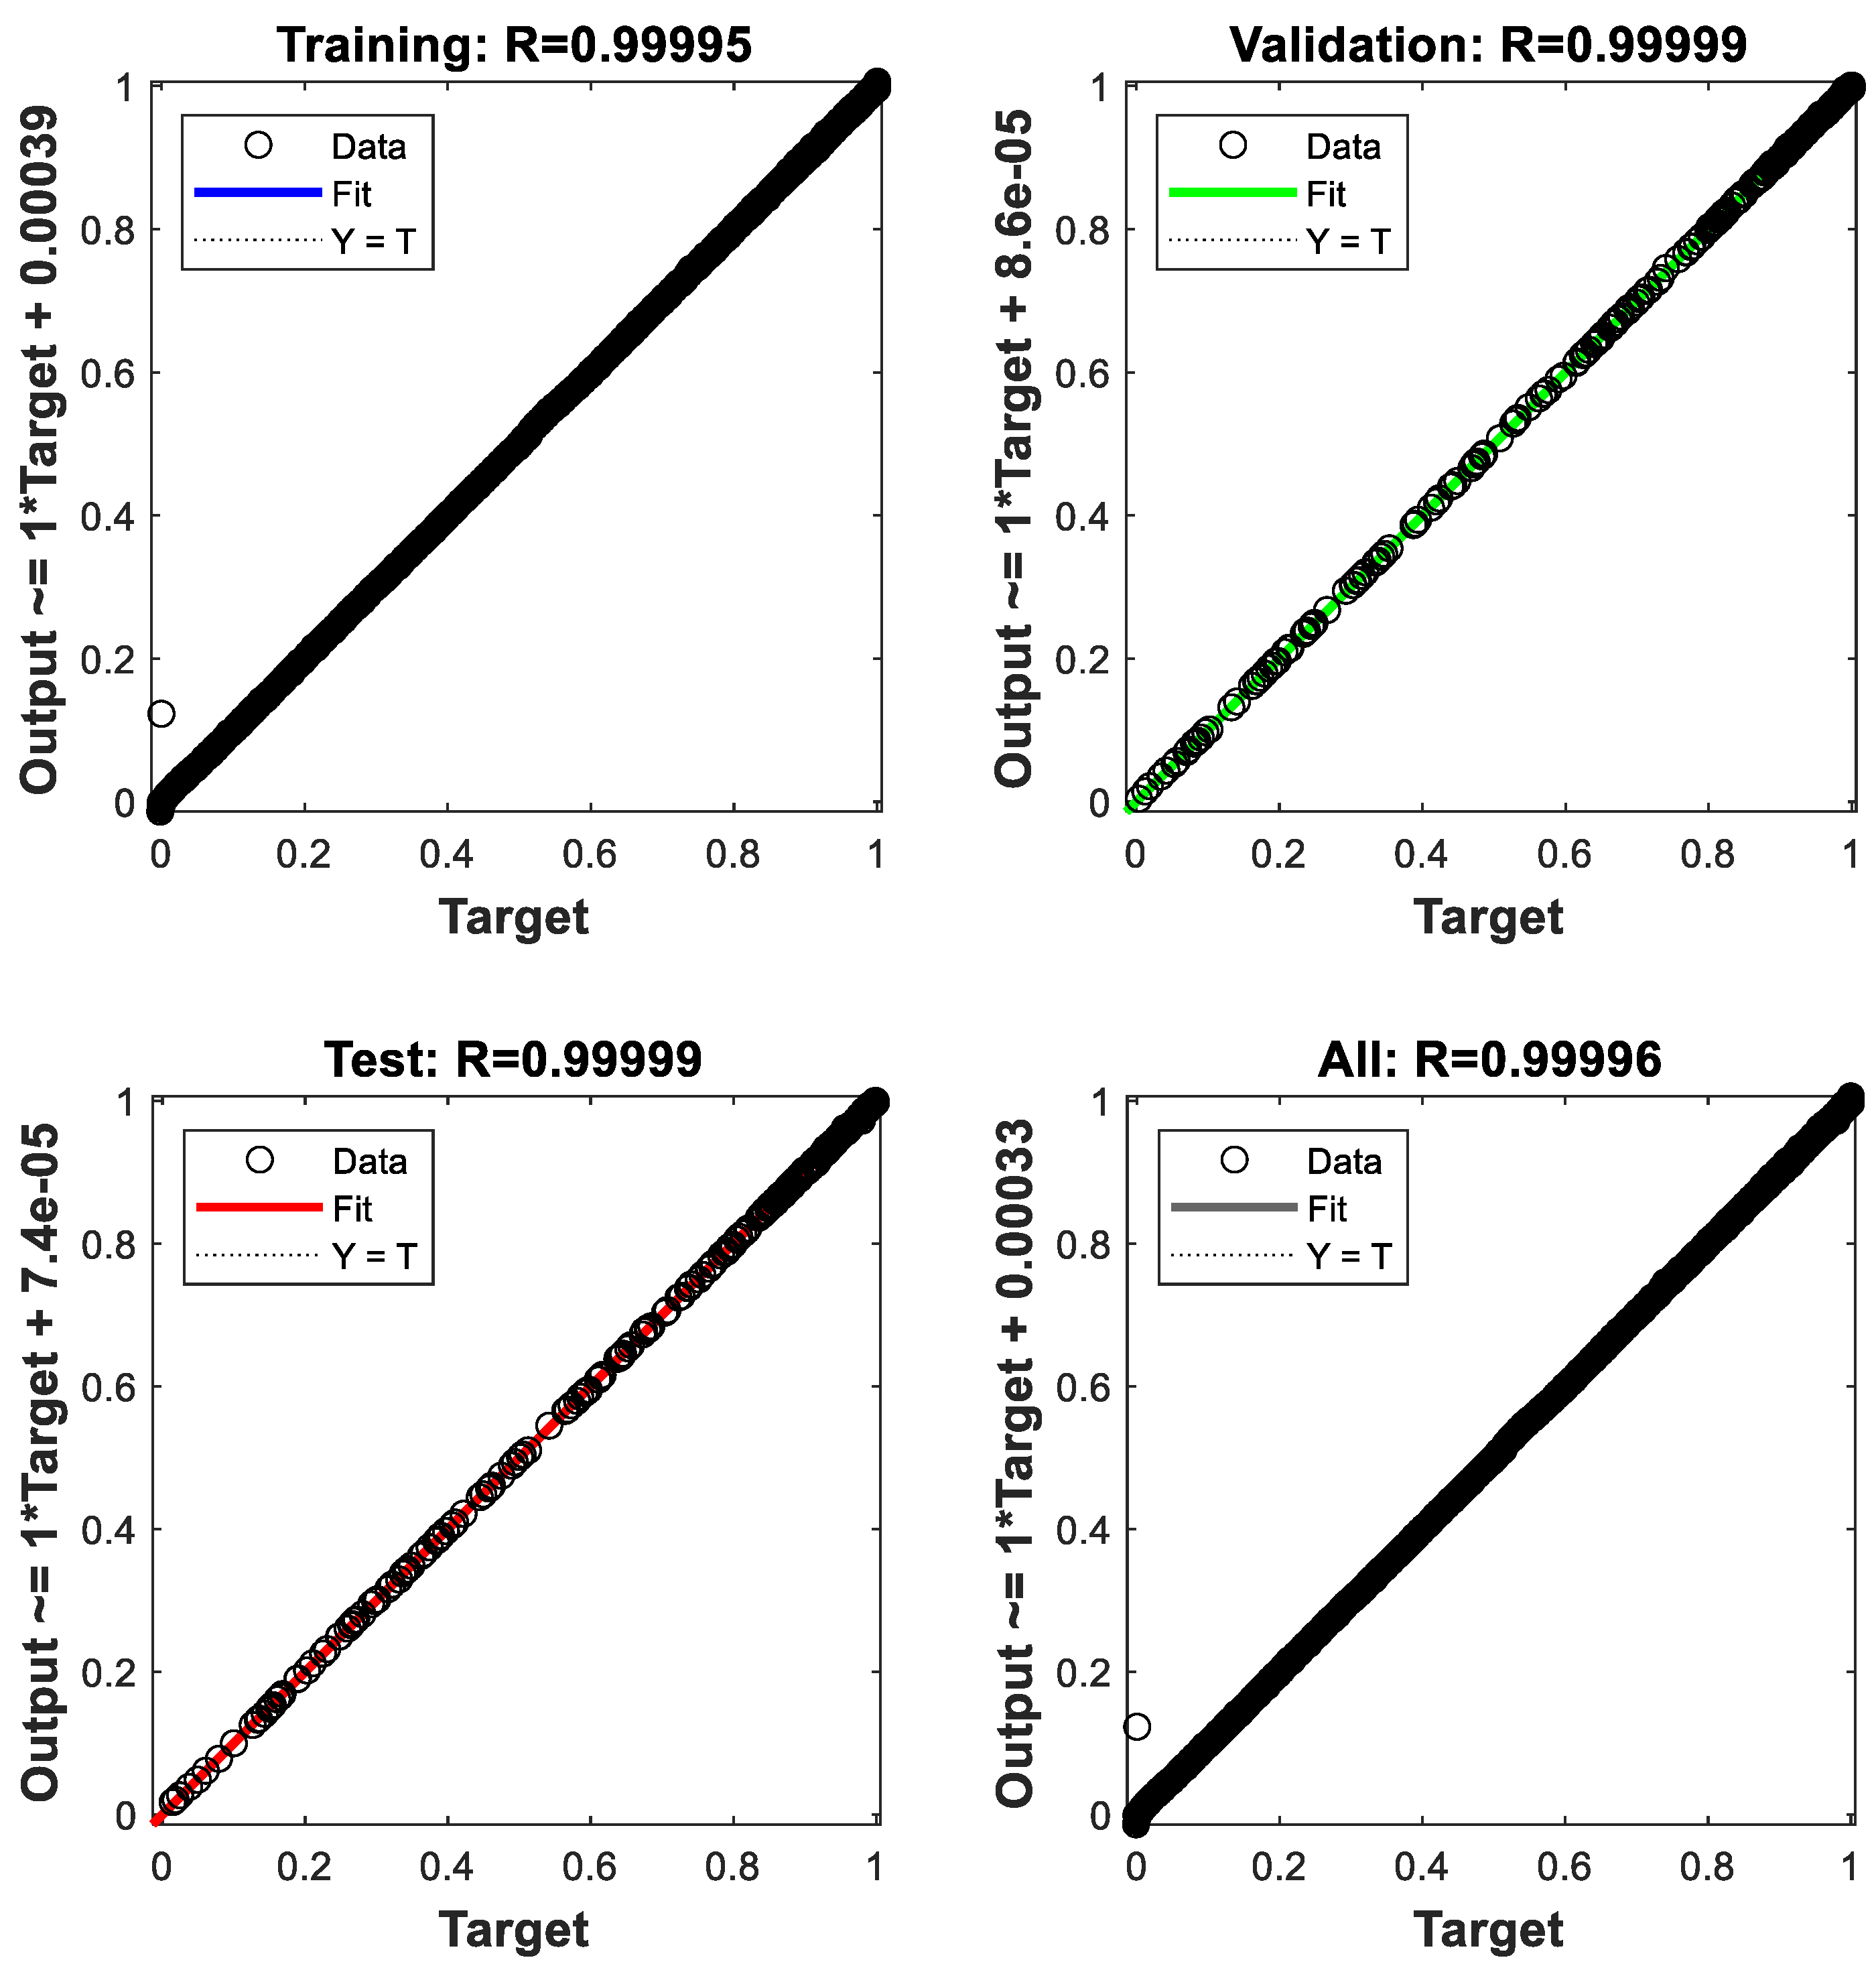
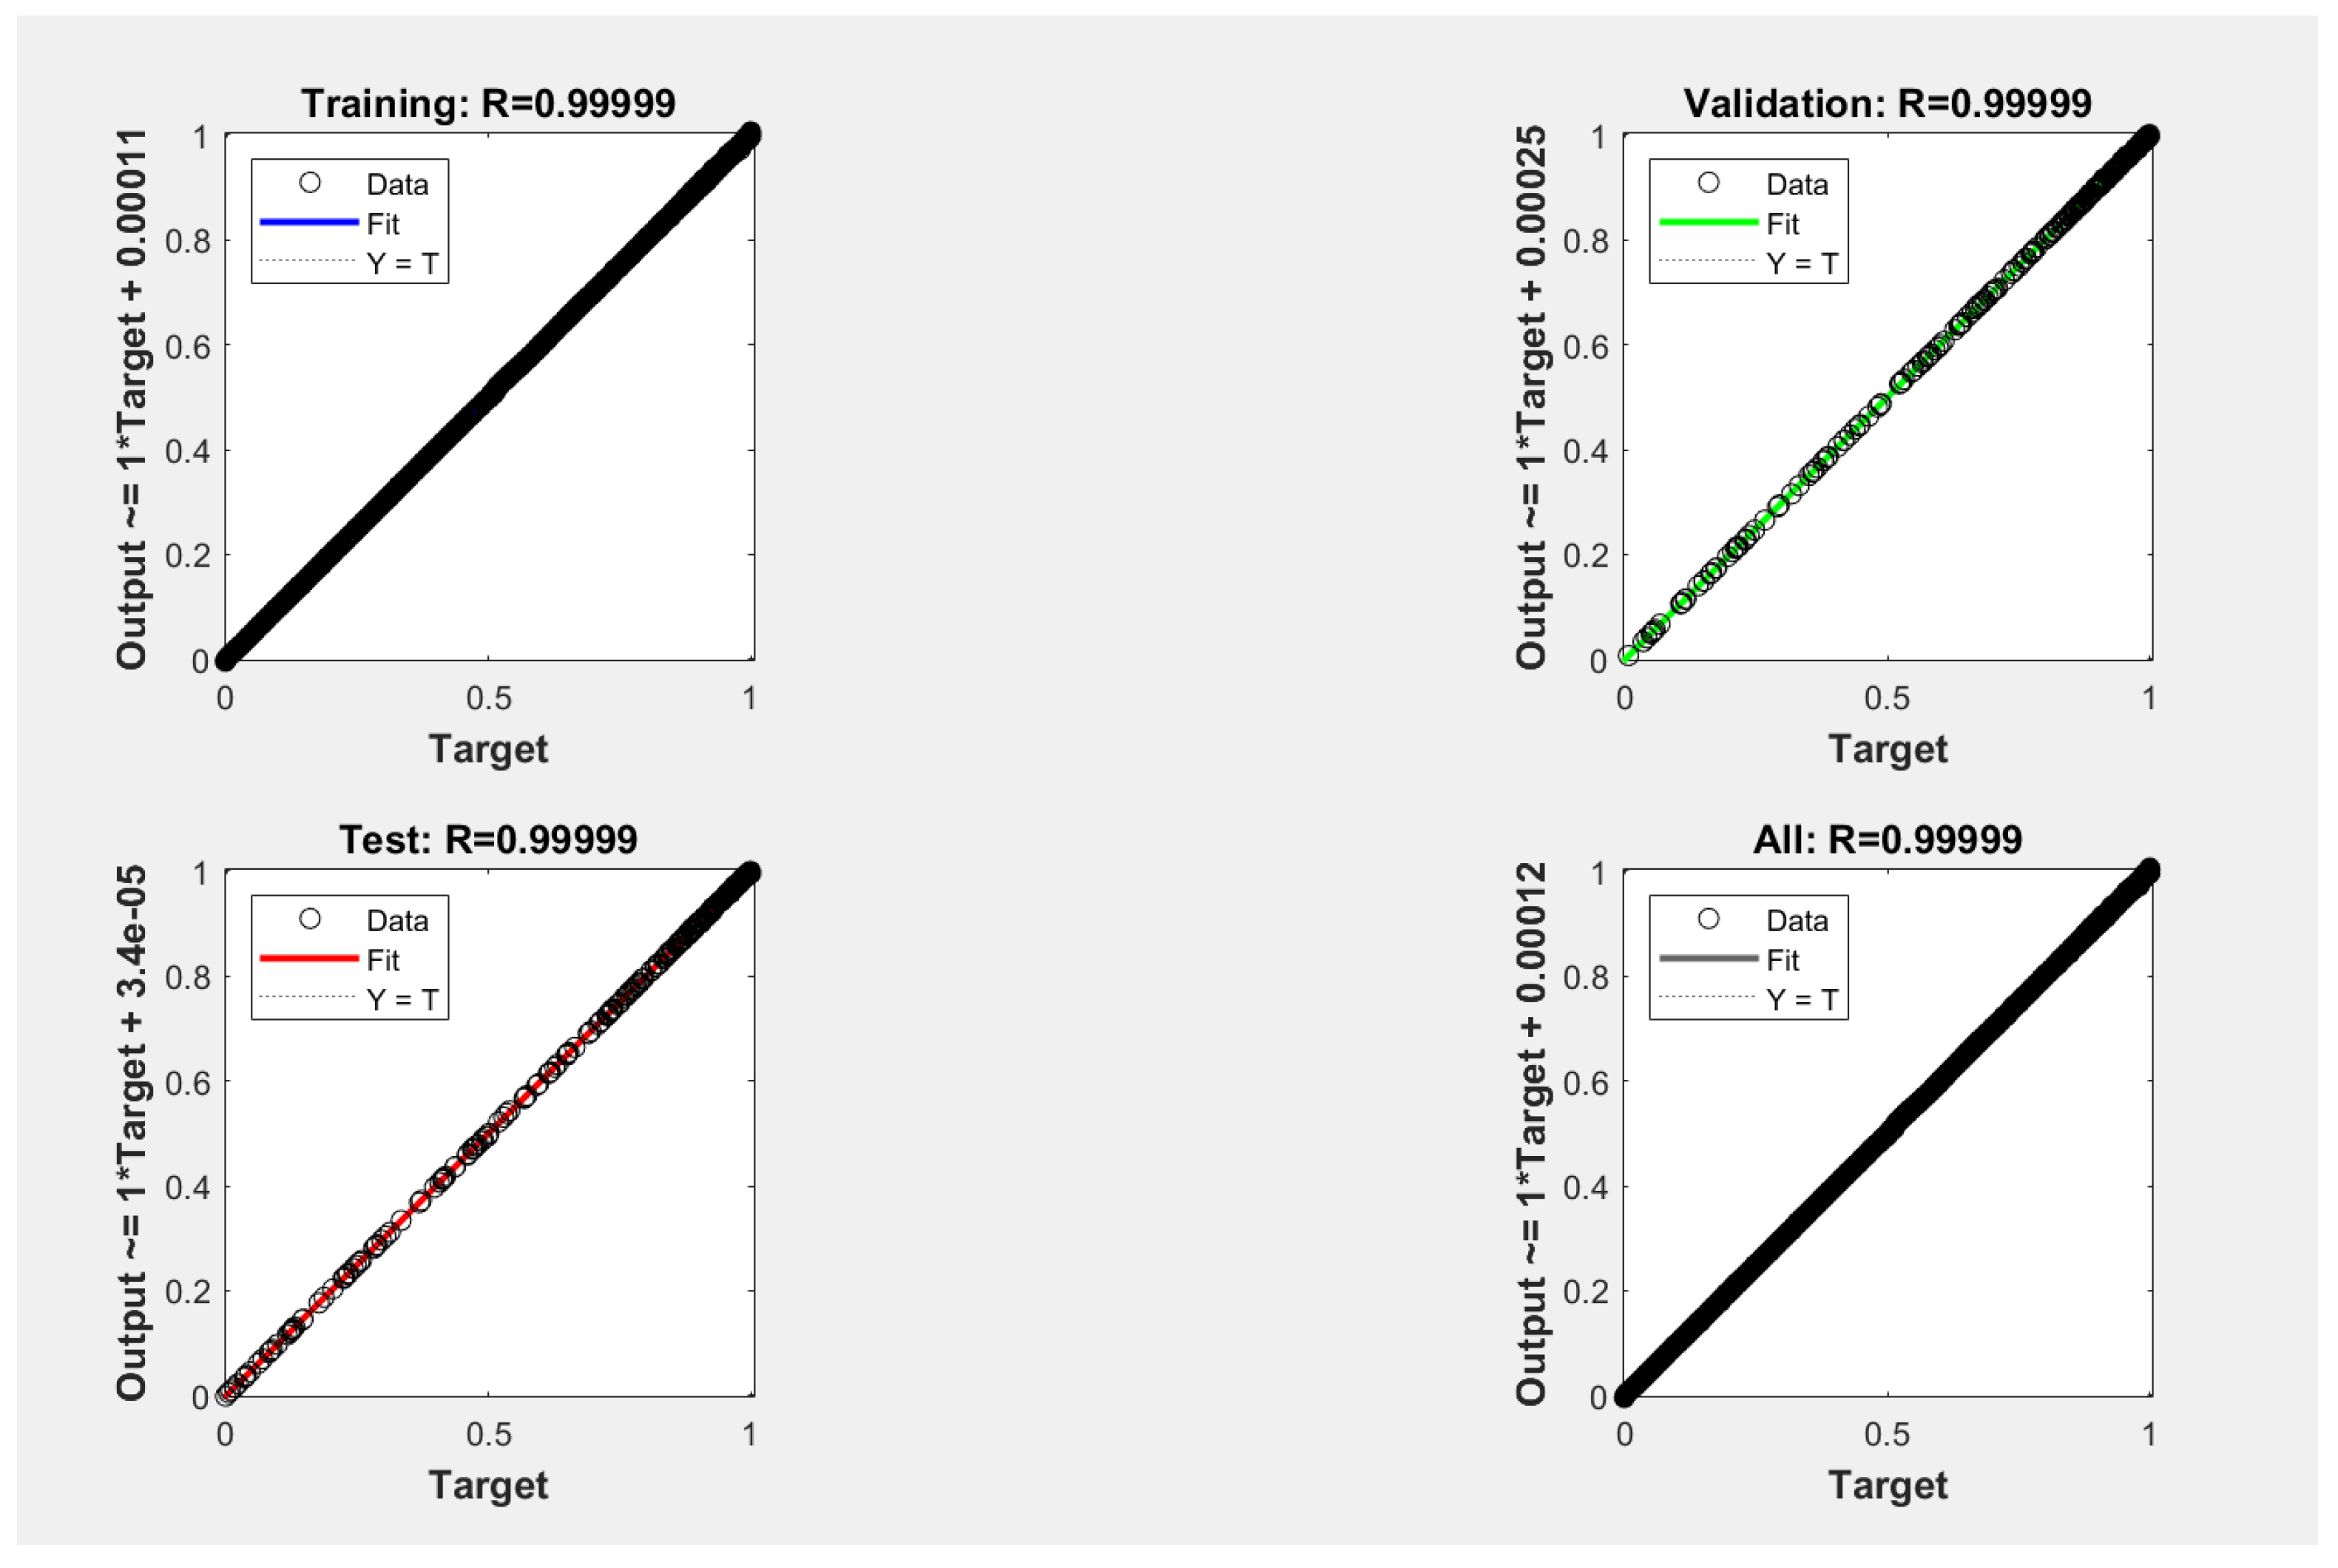
Secondly, LM is generally faster than standard gradient descent methods. It converges more quickly, especially for small to medium-sized networks. Thirdly, LM has higher memory requirements. It needs to store and manipulate large matrices. The algorithm adjusts the learning rate dynamically. When the solution is far from the optimal, it behaves like gradient descent and when it is close, it acts more like the Gauss-Network methods. In this article, this adaptability was used to efficiently find the optimal solution, in particular, LM minimizes the sum of square errors. NASA datasets for batteries #5,#6,#7, #18 were used to validate and test the proposed model. Figure 12 and Figure 13 illustrate summary R2 plots in training, test and validation stages during training for NASA Prognostics Centre of Excellence PCoE batteries B0005 and B0006. Researchers have trained the neural network and confirmed it using an accessible dataset from NASA to create a precise algorithm with great precision to predict the output. R2 values is closed to 1.0, consequences the results are satisfactory results.
In this article, the Mean Square Error (MSE) has been calculated for each of the phases using the corresponding equation [4]:
MSE= 1 2 m = 1 n O a O p (4)
Where compares:
MSE= Mean of error squares;
Oa= Actual output;
Op= Predicted output.
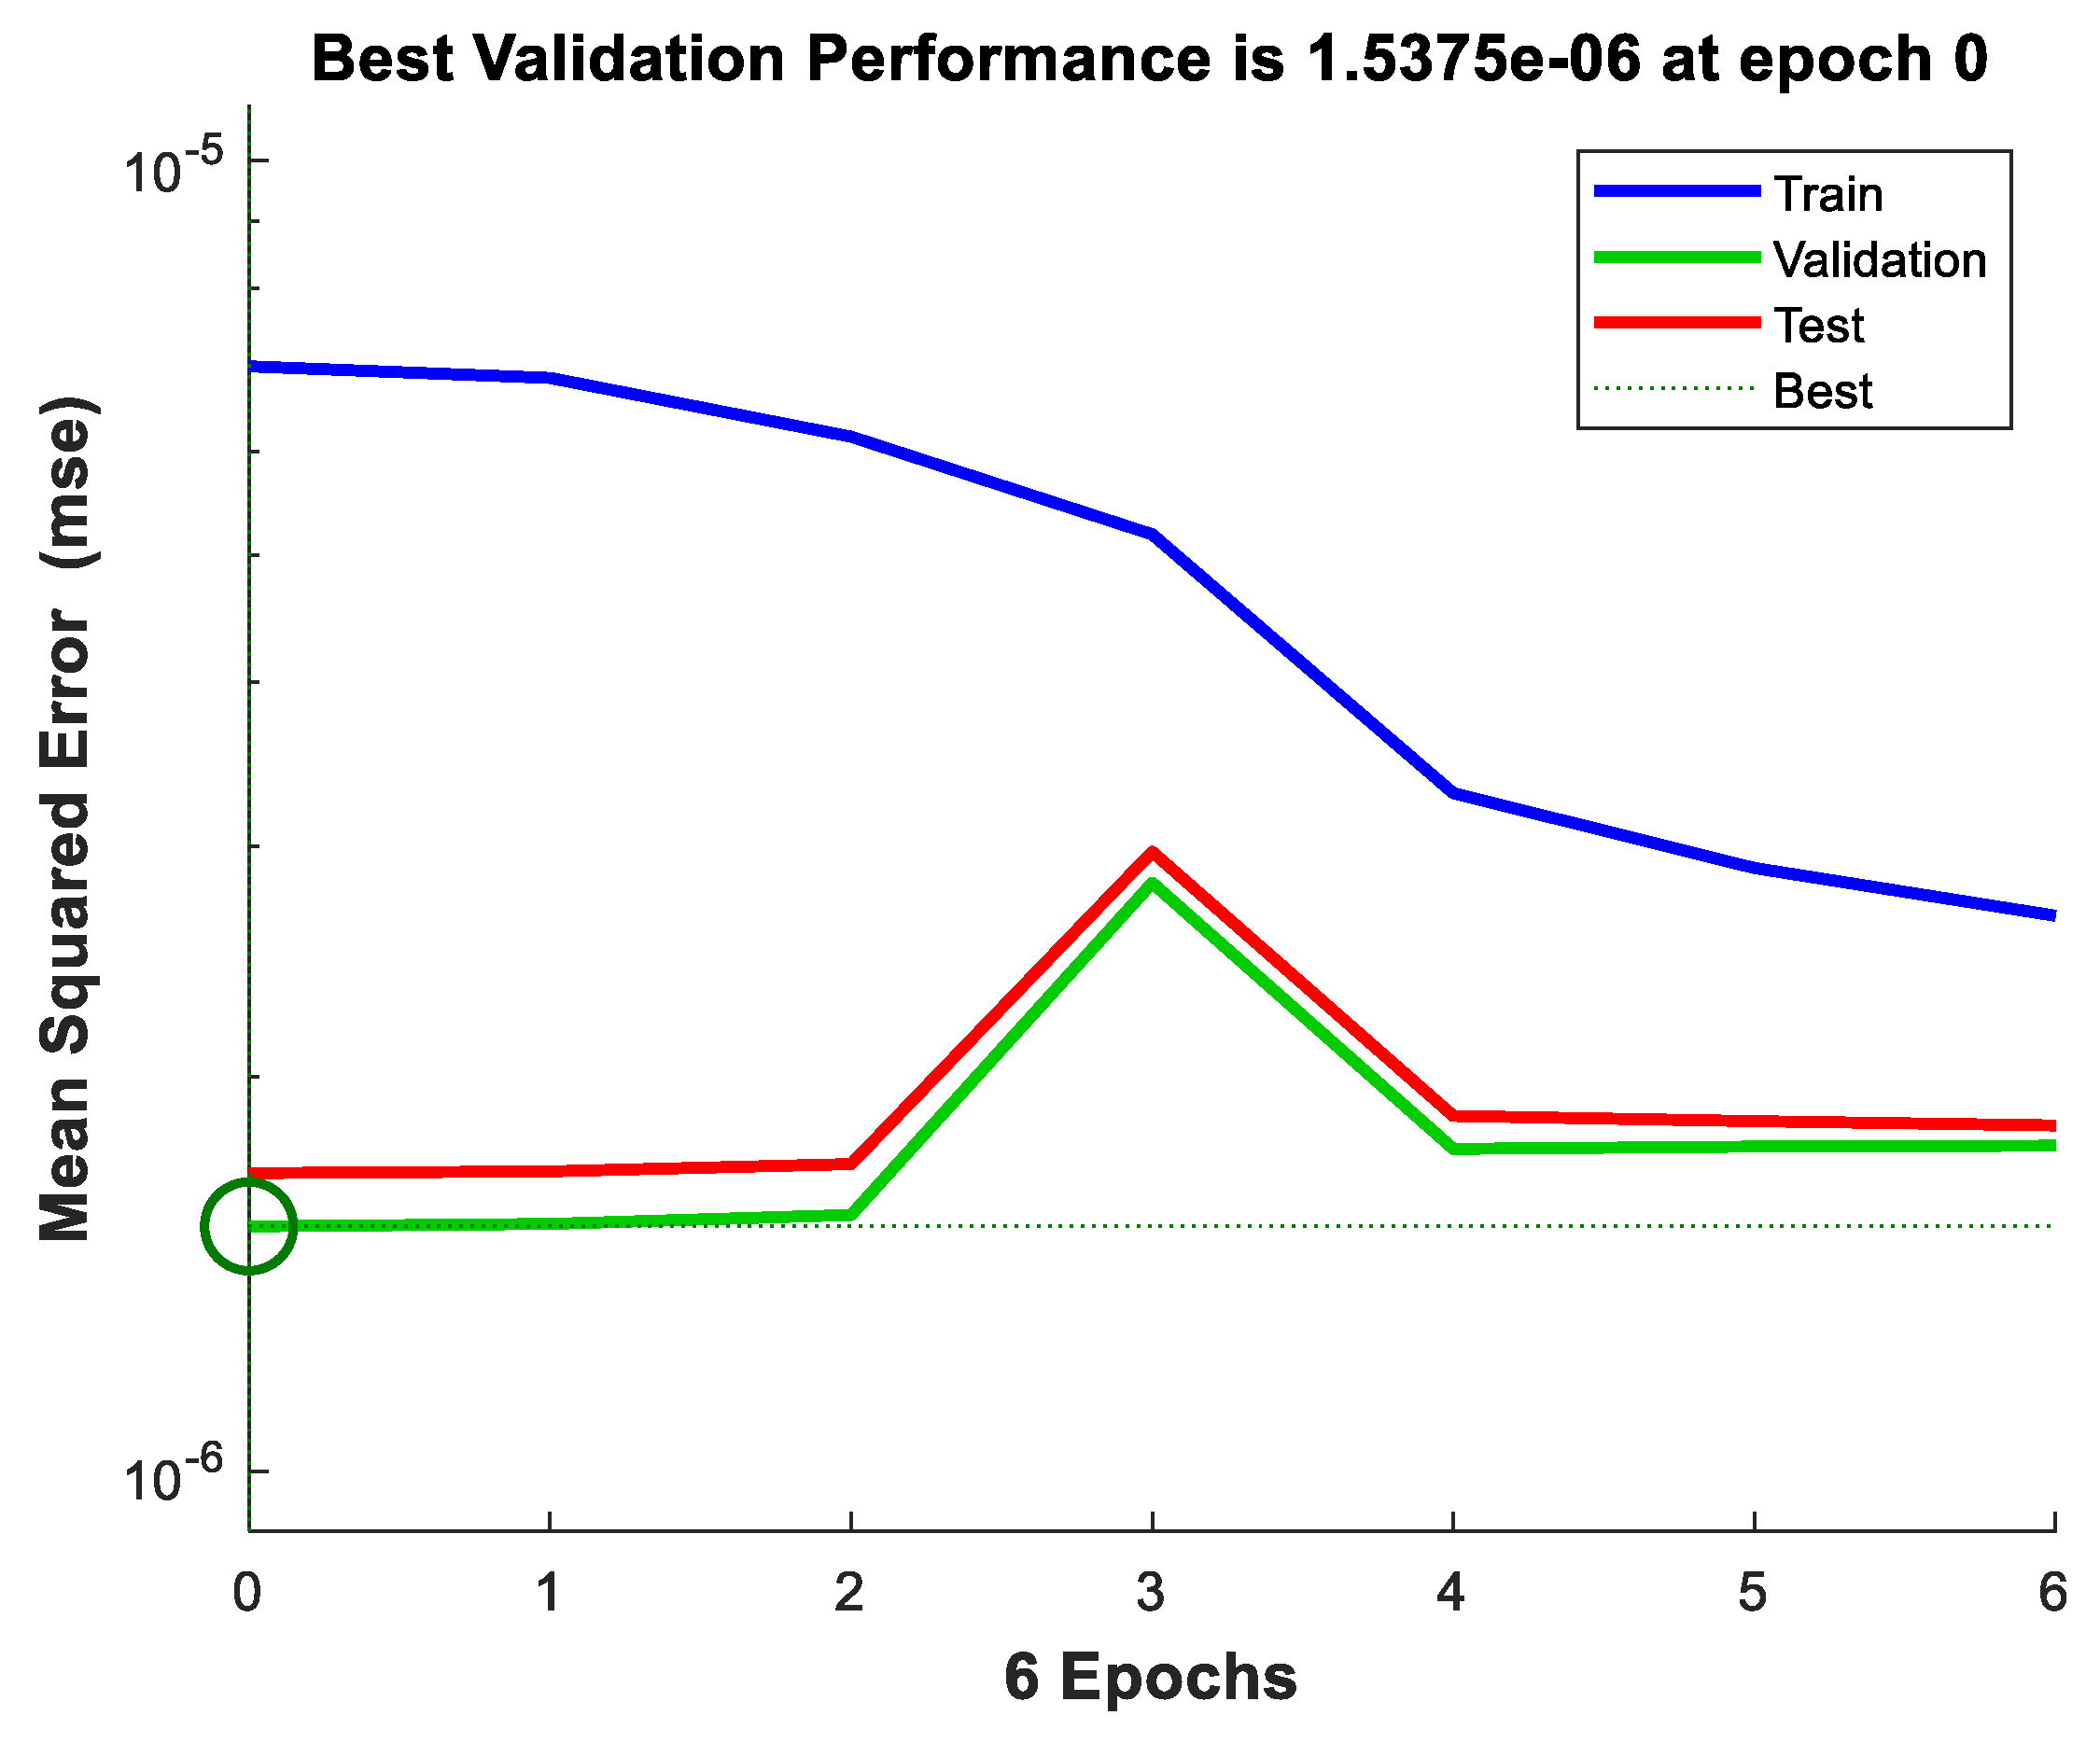
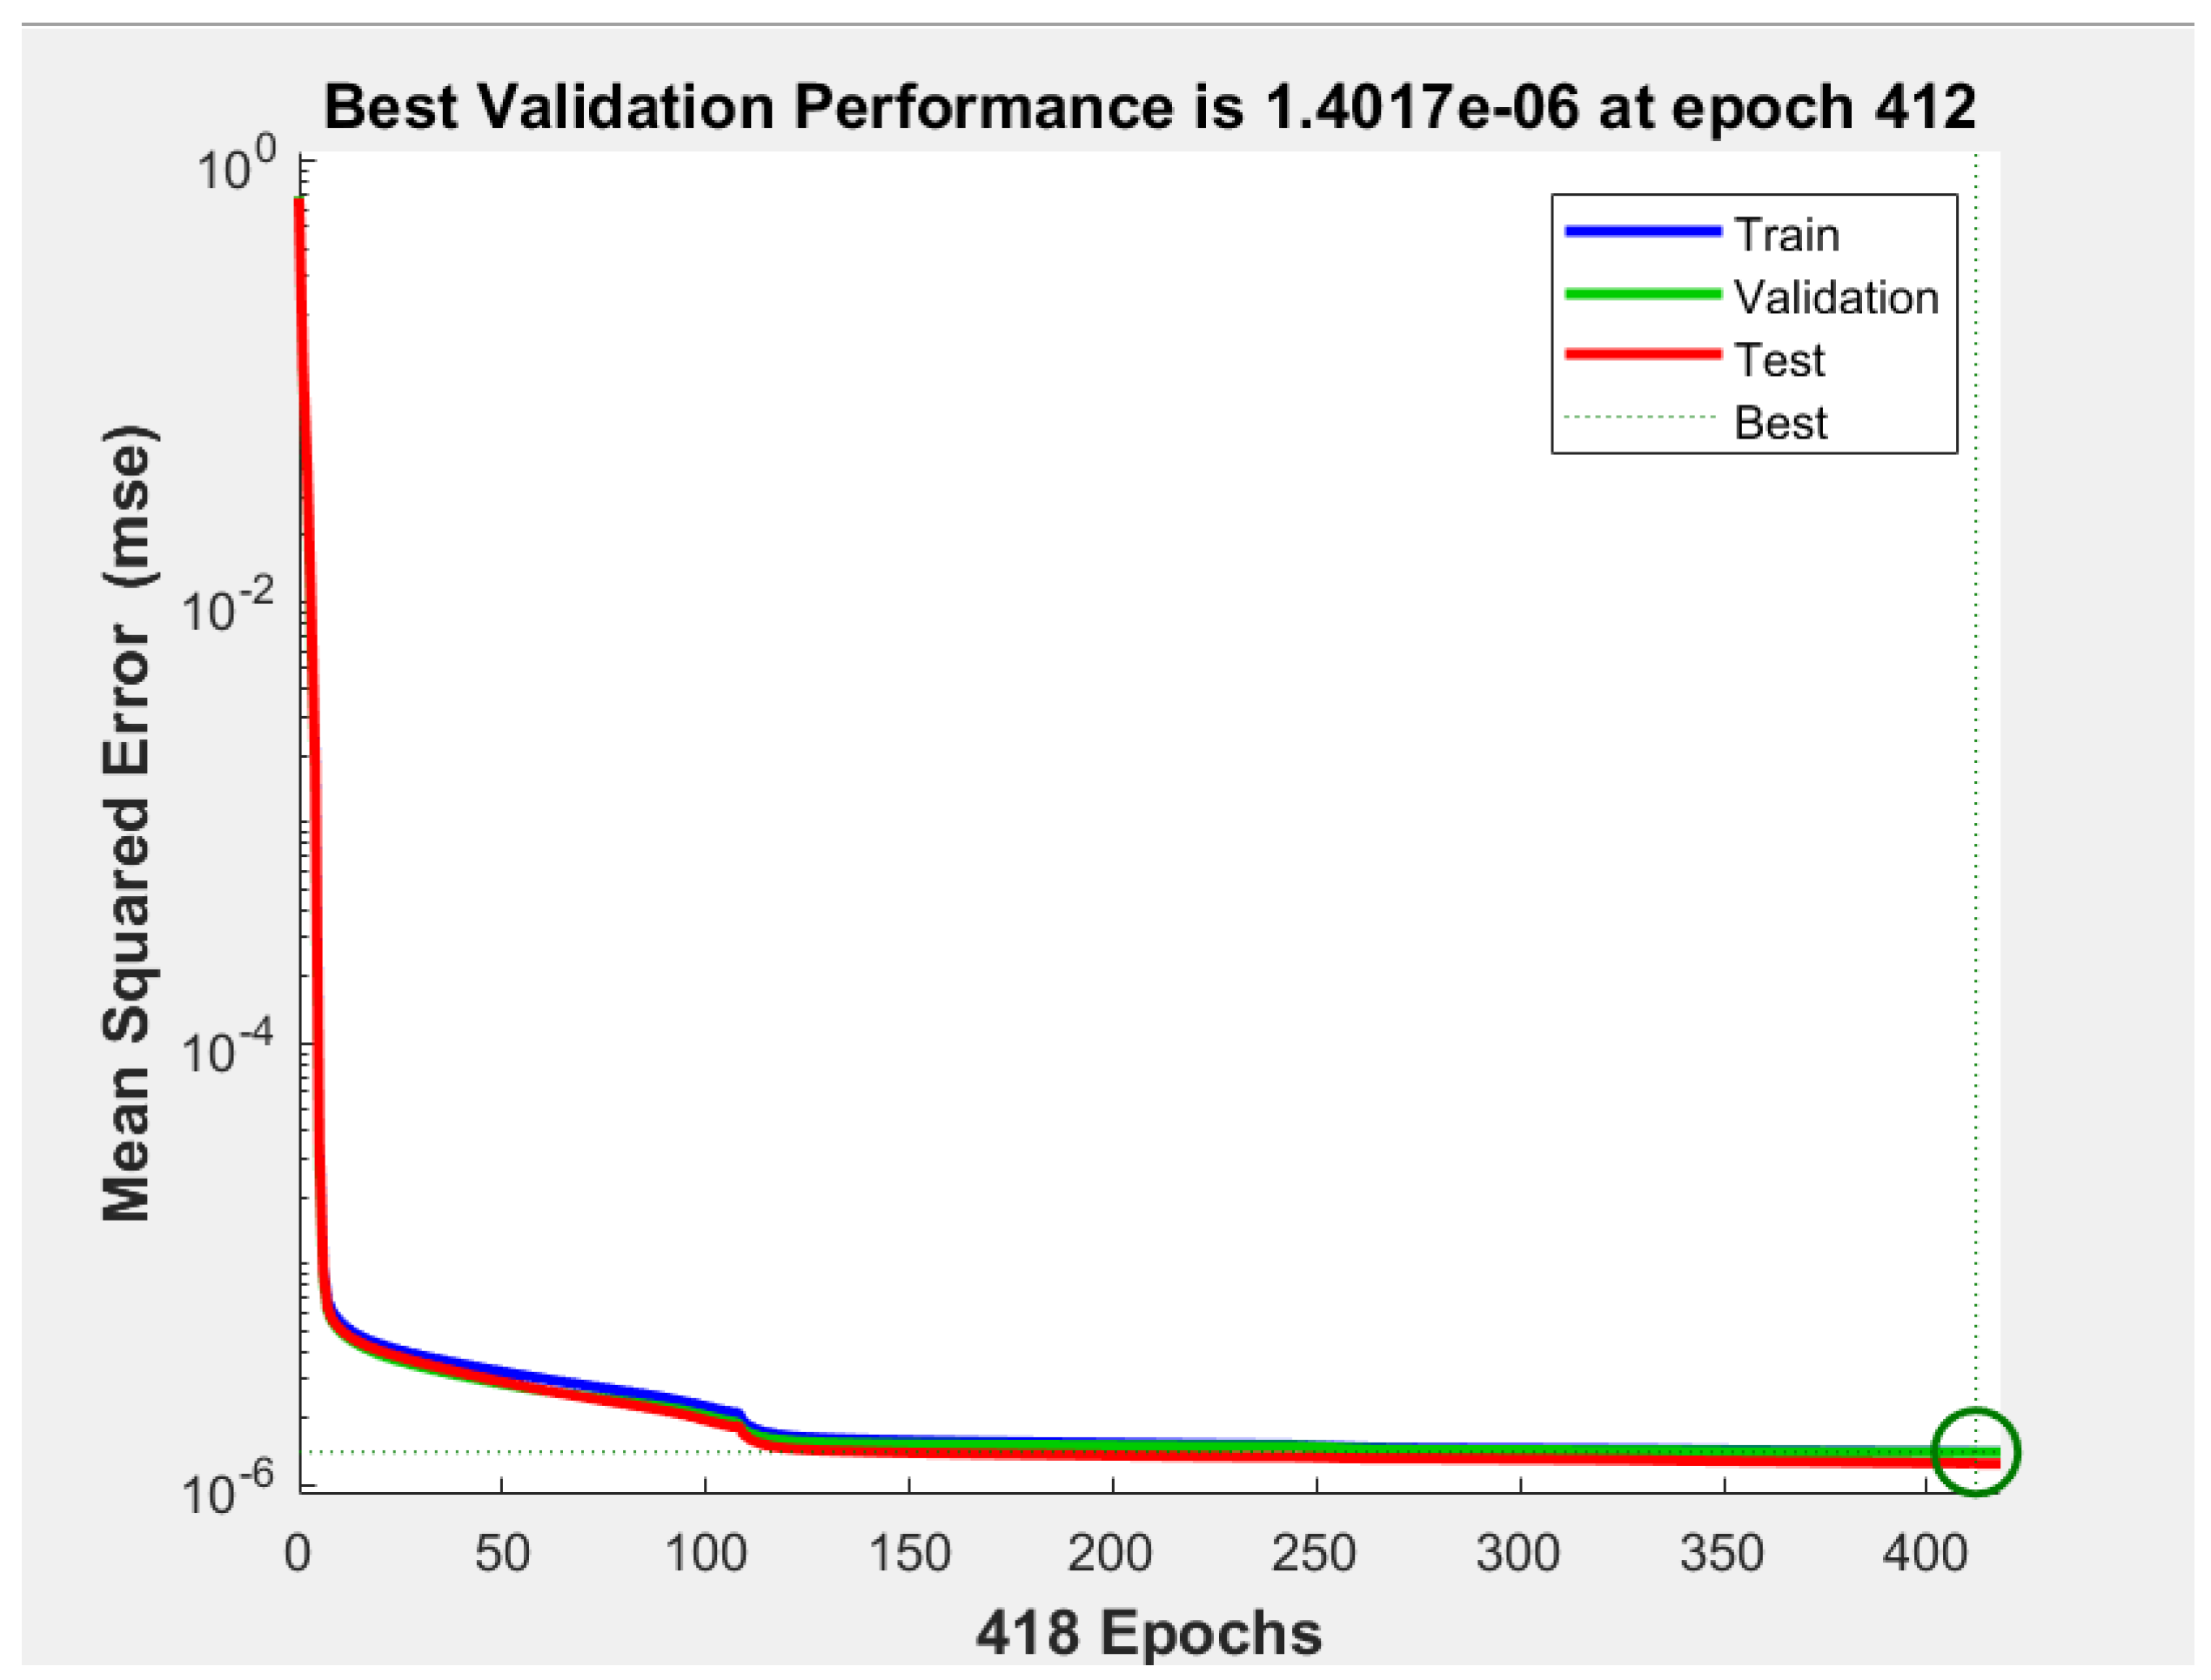
The MSE is calculated as the mean squared difference between the predicted values of the SOC and the actual values of the SOC. The best validation performance trends between the Mean Squared Error (MSE) for the B0005 and B0006 batteries from the NASA Prognostics Center of Excellence dataset are shown in Figure 14 and Figure 15.
Mean Squared Error (MSE): It is used by the author to calculate the mean square difference between predicted SOC values and actual SOC values. From the results obtained, it can be seen that lower MSE values correspond to better precision.
Table 1. Evaluation of MSE - Mean Squared Error Dataset NASA PCoE Research Center for Battery B0005 and Battery B0006.
Evaluation of MSE
Mean Squared Error
Dataset NASA PCoE Research Center Dataset NASA PCoE Research Center
MSE Battery B0005 Battery B0006
MSE 5.8991e-06 1.3928e-06
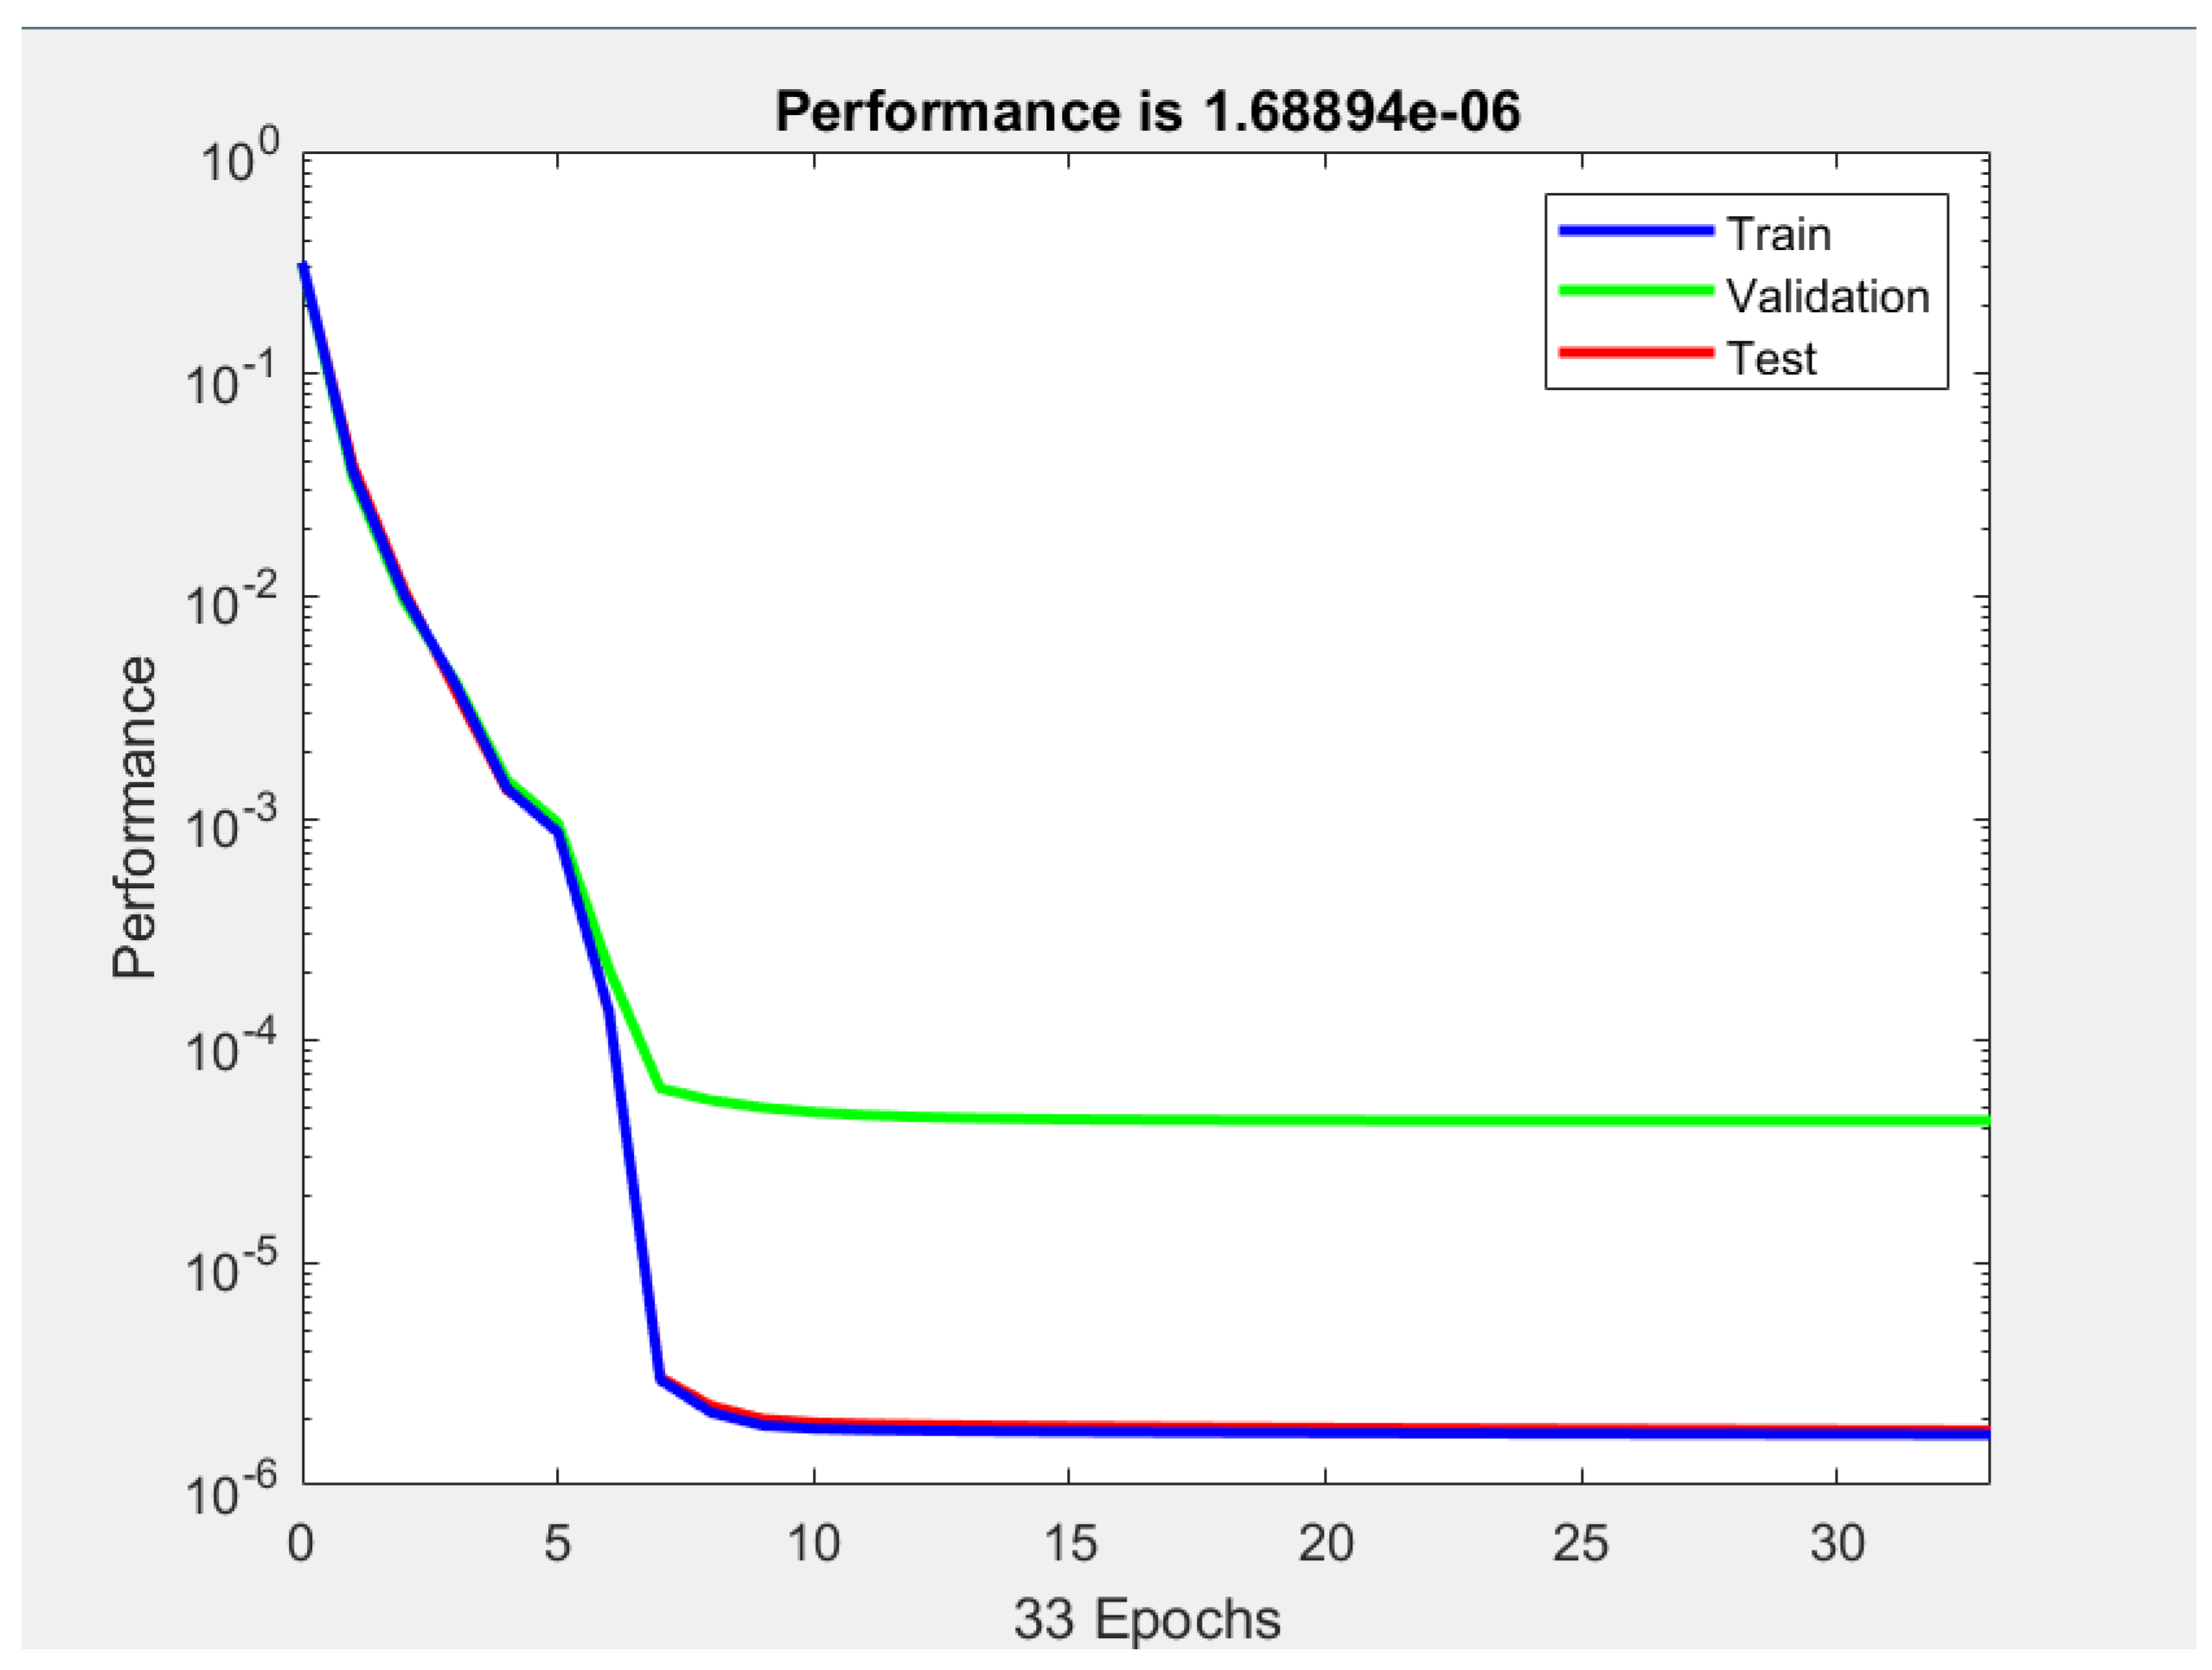
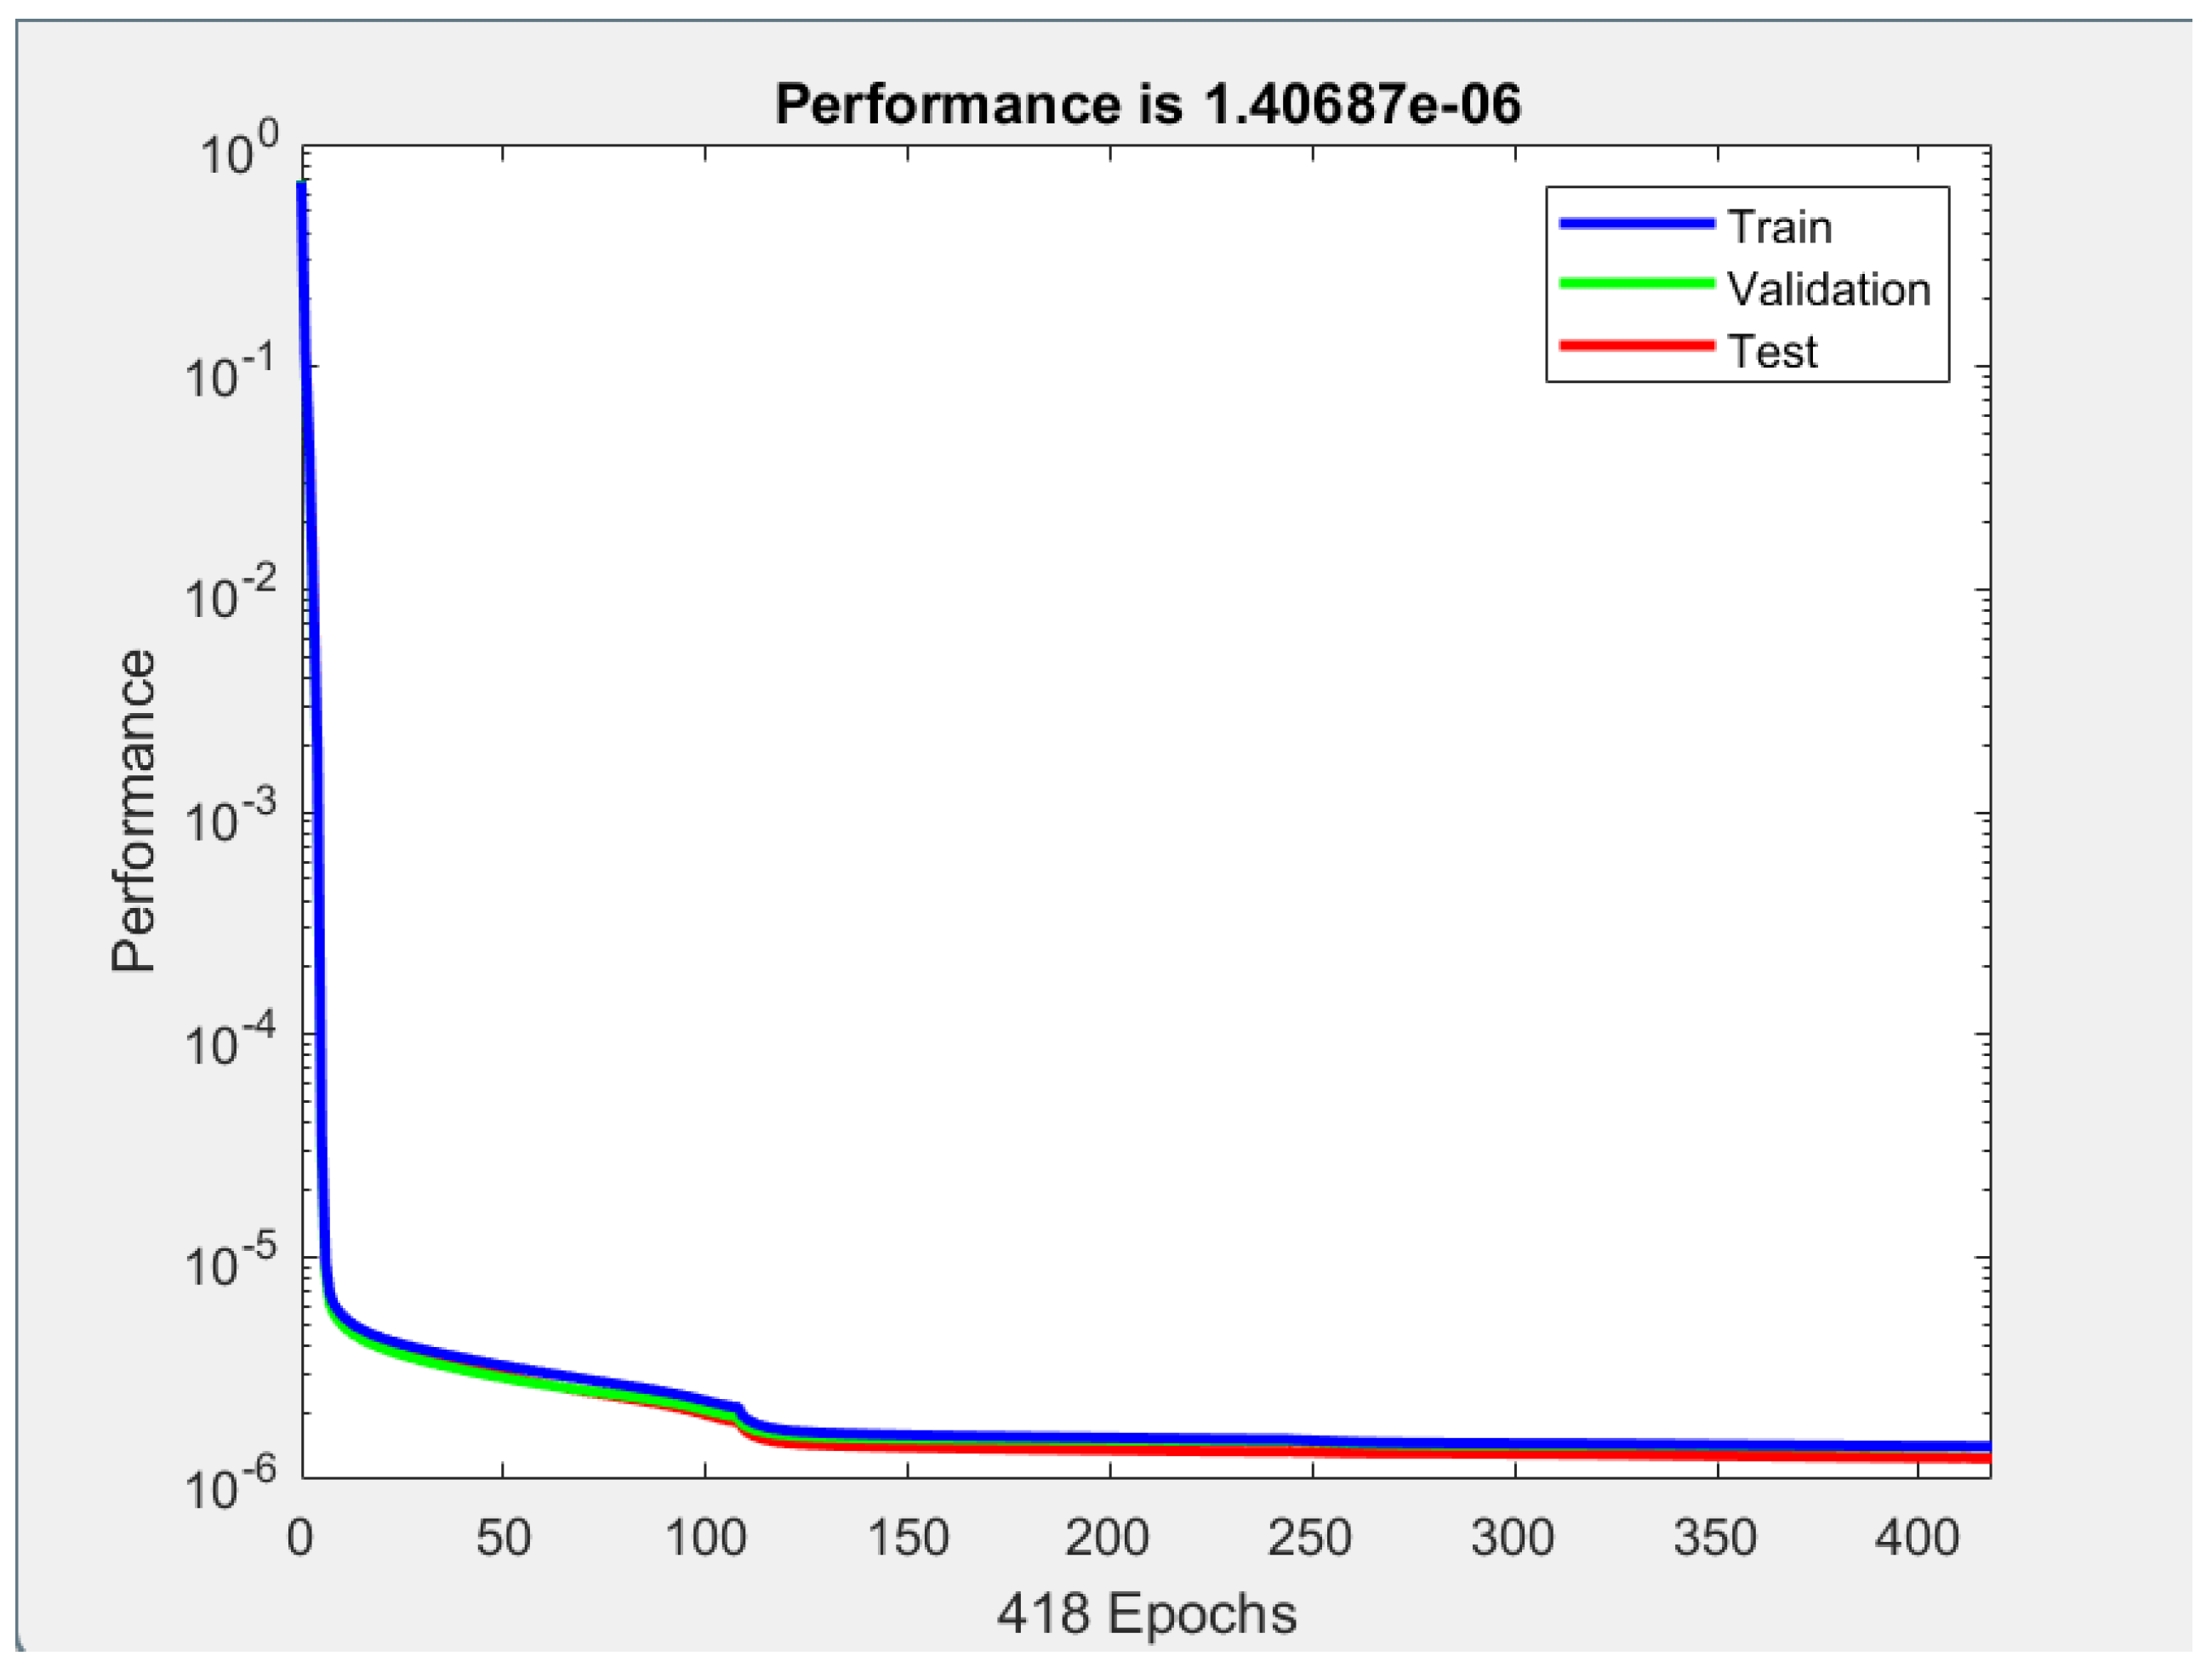
Figure 16 and Figure 17 show the trend of performance of Phases Train, Validation and Test in the function of the epochs of the dataset of the battery B0005 and B0006. For battery B0005, the Validation trend shows that it deviates from the Train and Test trend to a value close to 1*10-4, detaching itself from the Trend and Test phases that show a value close to 1*10-6 to obtain a performance of 1.68894*10-6 at 33 epochs. This deviation does not occur for battery B0006, where the trend of the three phases decreases to a value close to 1*10-6 to achieve a performance of 1.40687*10-6.

5.2. Evaluation Criteria- Root Mean Squared Error

To estimate the precision of the suggested approach, in this article, researchers have calculated the value of RMSE Root Mean Squared Error (RMSE), which indicates the mean predictive error in the unit of SOC values.
RMSE= i = 1 n ( x i x i ^ 2 (5)
Where:
  • x i =actual value;
  • x i ^ =predicted value.
The author has evaluated the RMSE for batteries B0005 and B0006 of the NASA Prognostics Center of Excellence Dataset:
Table 2. Evaluation of RMSE – Root Mean Squared Error Dataset NASA PCoE Research Center for Battery B0005 and Battery B0006.
Evaluation of RMSE
Root Mean Squared Error
Dataset NASA PCoE Research Center Dataset NASA PCoE Research Center
RMSE Battery B0005 Battery B0006
RMSE 0.0024 0.0012
The results show the validity of the algorithm for simulations carried out on lithium-ion batteries.

5.3. Remaining Useful Life Calculation Results

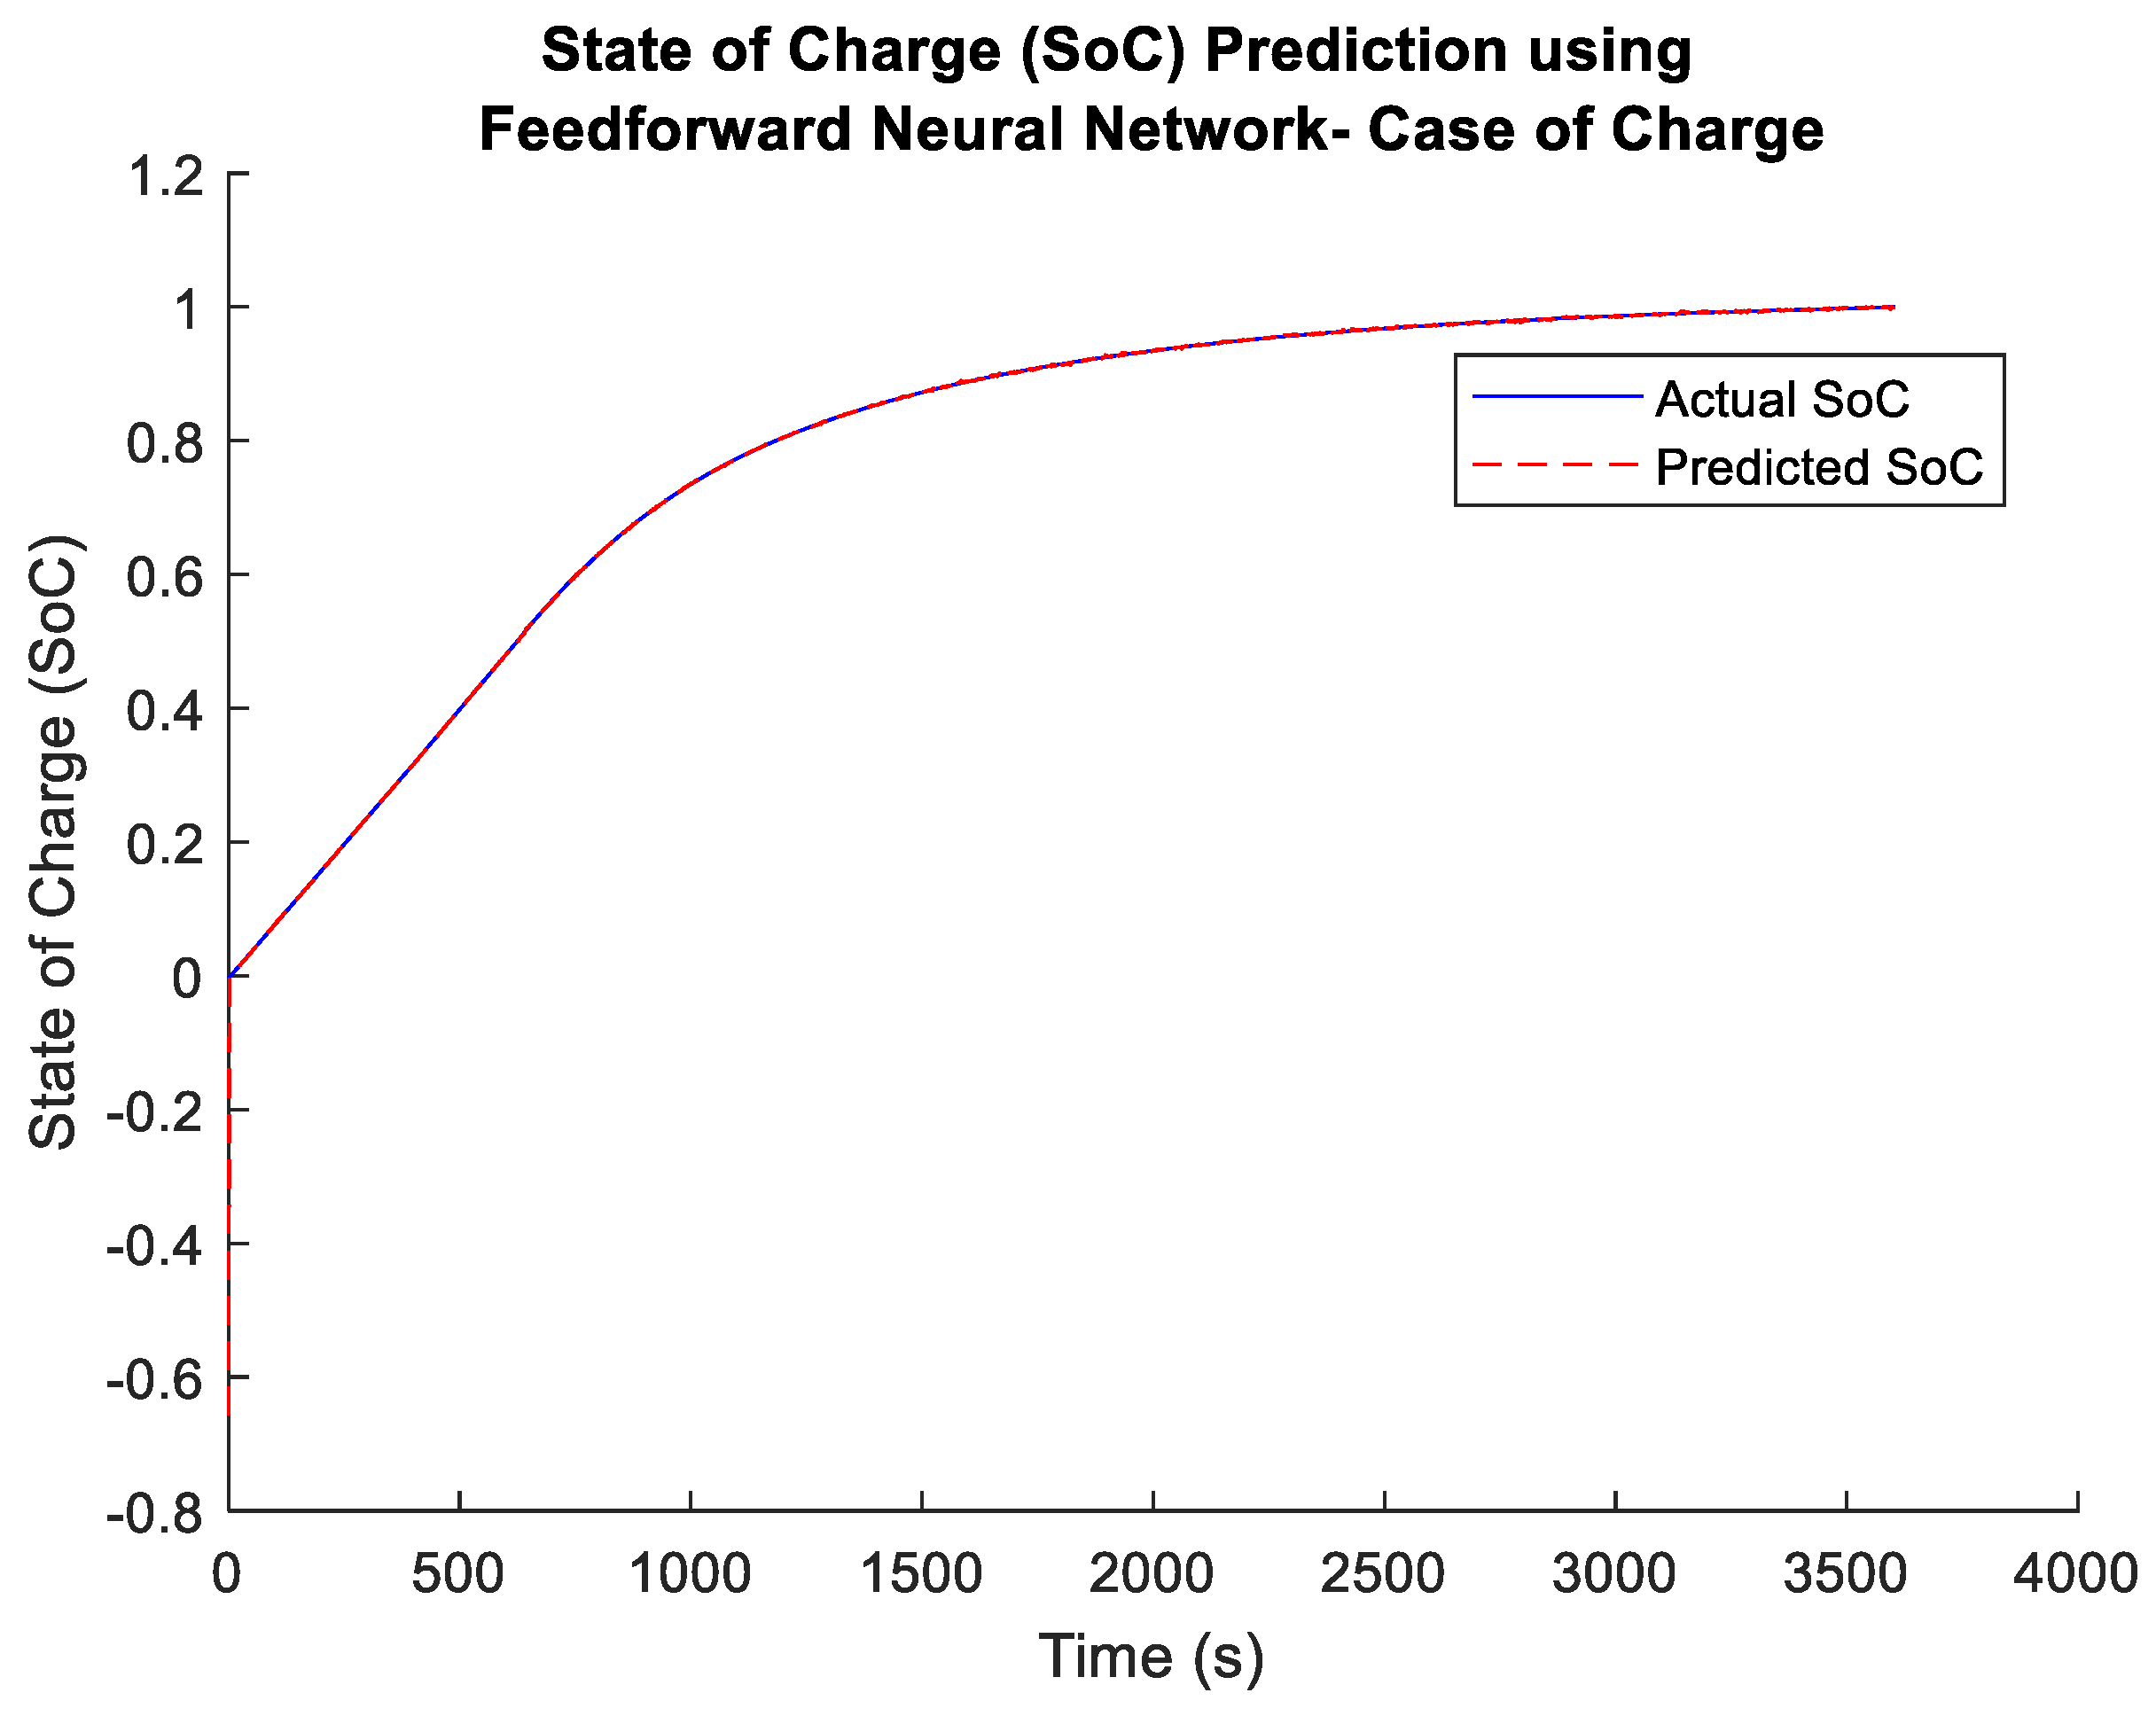
In this work, after having calculated the Actual SOC from the FFBPN model, the results obtained were used to predict SOC value at the final time instant. The RUL of State of Charge can be calculated from this FFBPN by making an appropriate prediction as in the article [32].
Figure 18. Trend between the actual State of Charge SOC and the predicted State of Charge SOC for battery B00005 NASA PCoE Research Center.
Preprints 121205 g018
R U L = x i x p (6)
In equation (6) compare:
  • xi= Actual SOC State of Charge for battery B0005;
  • xp= Predicted SOC State of Charge for battery B0005.
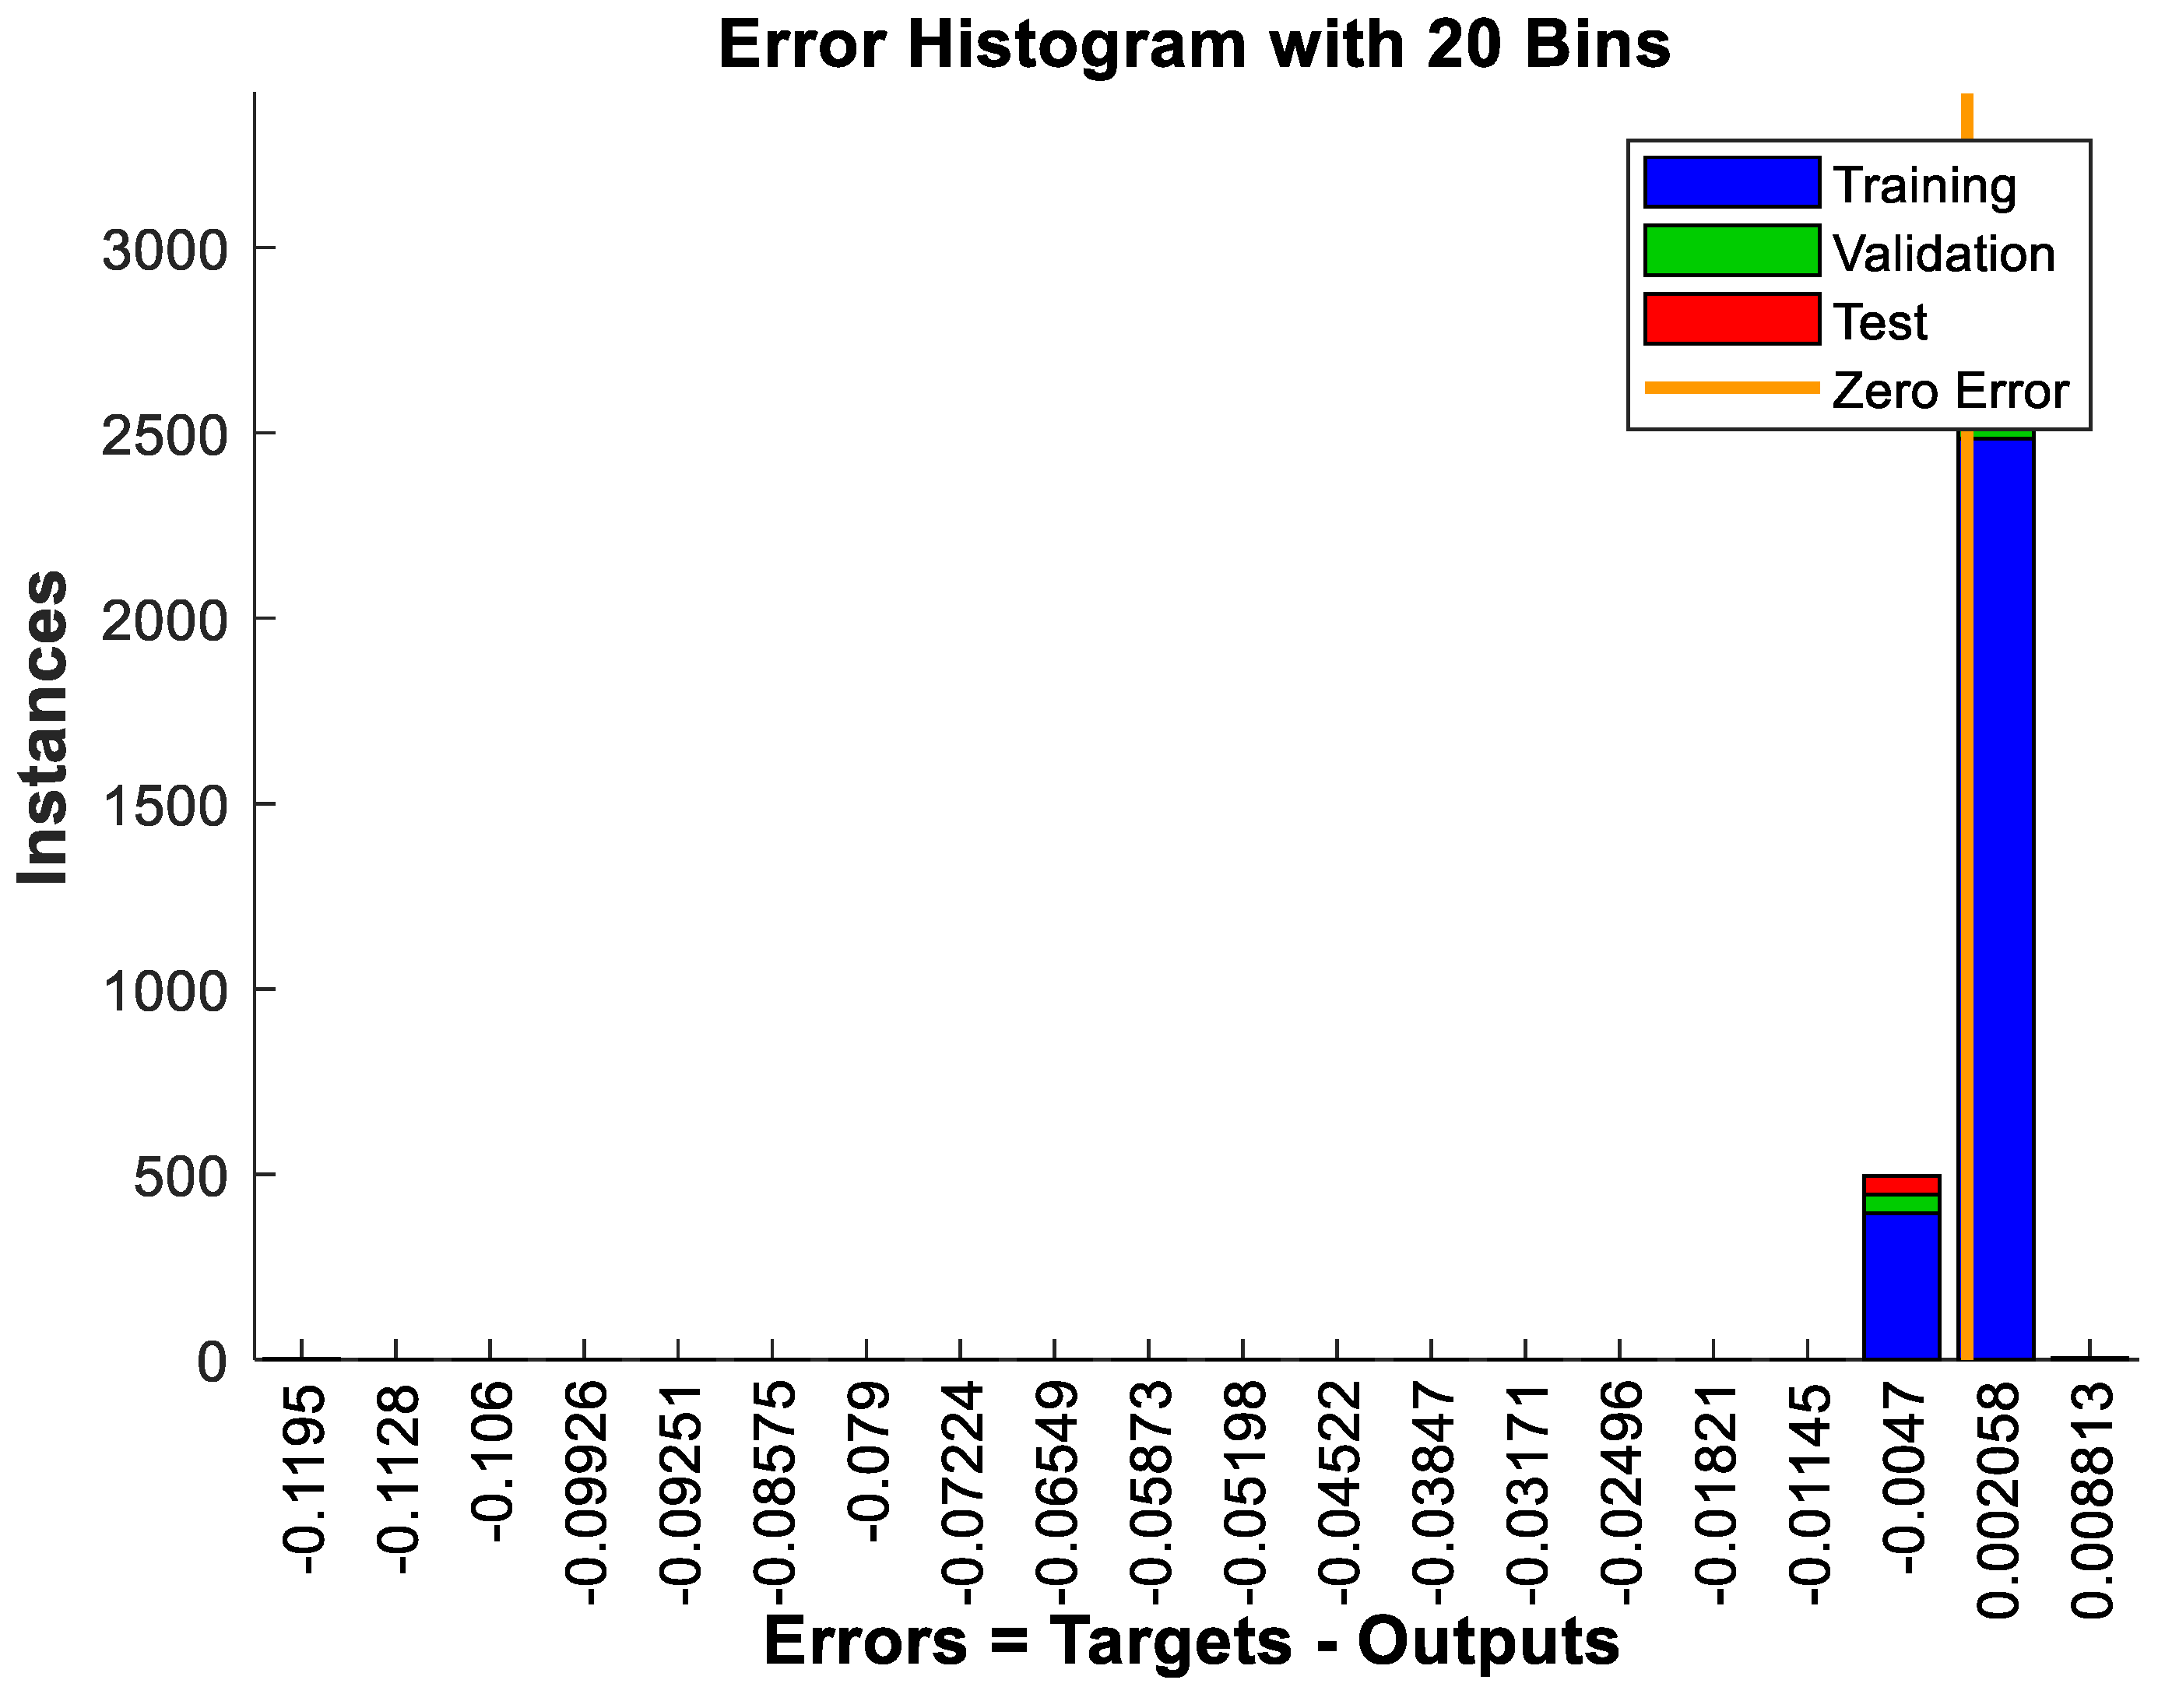
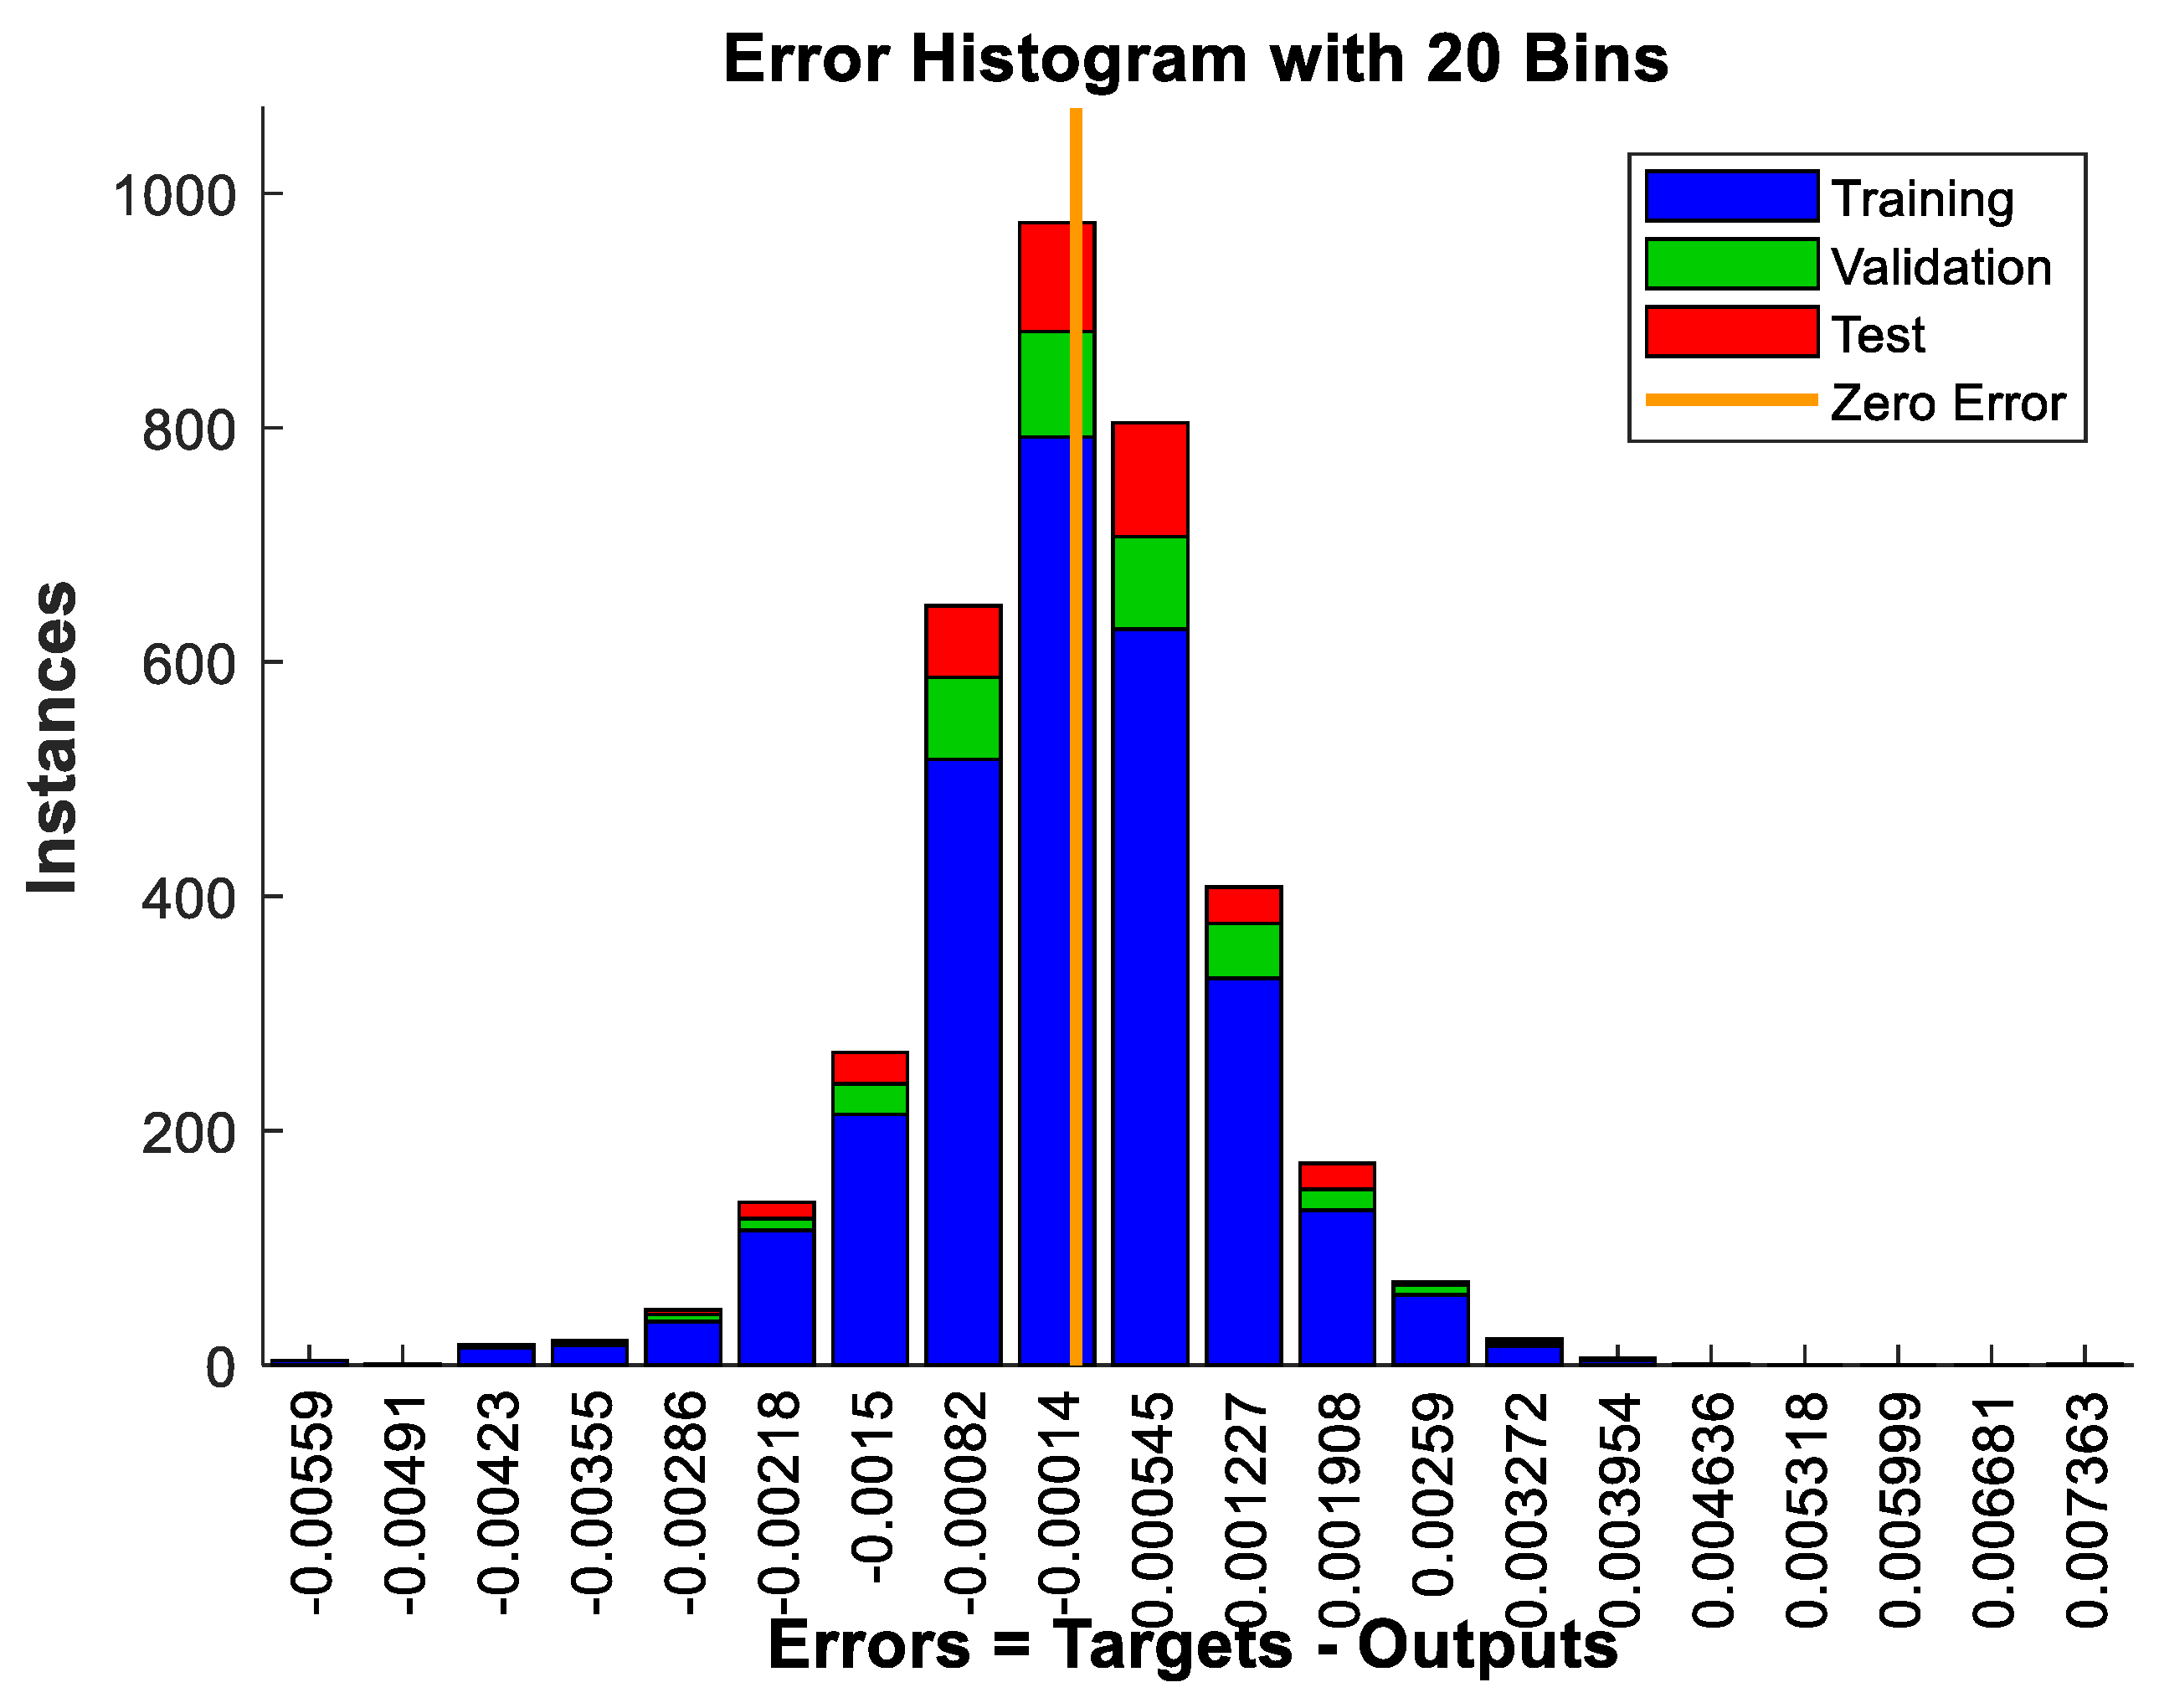
In the following Figure 19 and Figure 20 is it possible to see the error trend for the phases Training, Validation and Test for the batteries B0005 and B0006 for NASA PCoE Research Center. For battery B0005 the maximum error is 0.002058. For the battery B0006, the biggest error is 0.003954. The results show the validity of the Feed – Forward Back Propagation Neural Network algorithm for all simulations carried out.

6. Conclusion

This research aims to integrate electric vehicles into smart grids to create a more sustainable, efficient and long-lasting energy system. In particular, the integration of electric vehicles with smart grids makes them capable of a flow of beverage energy. It enables decentralized power generation where electric vehicles serve as mobile energy sources. Researchers have thus created the possibility of decentralized power generation in which EVs become mobile energy sources, reducing the dependence on centralized power plants. In addition, integrated electric vehicles facilitate the creation of microgrids, which are independent localized energy units which operate powered by the main network. Microgrids powered by electric vehicles improve energy security and trigger disaster resilience mechanisms. In this article, the FFBPN algorithm wants, with the integration of electric vehicles, to foster the development of smarter transport systems. Through the RUL of the State of Charge, electric vehicles can better manage the charging phases, optimizing traffic flow and improving transport efficiency. A Feed Forward Back Propagation Network model with hidden multiples was used to determine the quality of a lithium-ion battery. The input data is pre-processed and training of the model is performed using the back-propagation algorithm. Hidden layers learn abstract representations of the data, and the output layer produced the final prediction. For battery B0005 has been obtained un maximum error of 0.002058. For the battery B0006 has been obtained an error of 0.003954. The results show the validity of the Feed – Forward Back Propagation Neural Network algorithm for all simulations carried out. In the future, researchers will use this trained model to predict the health of new batteries by providing their characteristics as input for better integration of electric vehicles (EVs) with vehicle-to-grid (V2G).

References

  1. Cervellieri A., A lithium-ion battery remaining useful life prediction method with the incremental capacity analysis based on a new algorithm, ISSN 1112-5209, Journal of Electrical System, 2024. [CrossRef]
  2. Cervellieri A., An incremental capacity analysis for a lithium-ion battery remaining useful life prediction method based on a new algorithm, AJSE-ASEAN Journal of Science and Engineering, 2024.
  3. Cervellieri A. A new algorithm for ICA/DVA utilized for a SOC and RUL prediction method of lithium-ion batteries, AJSE-ASEAN Journal of Science and Engineering, 2024.
  4. Cervellieri A. Literature review of lithium-ions batteries for SOH analysis and their transformative role within sectoral innovation systems, AJSE-ASEAN Journal of Science and Engineering, 2024.
  5. Cervellieri A. A critical review of lithium-ion batteries cycling process from a safety testing prospective, AJSE-ASEAN Journal of Science and Engineering, 2024.
  6. Damiano, Alfonso & Gatto, Gianluca & Marongiu, I. & Porru, Mario & Serpi, Alessandro. (2014). Vehicle-to-Grid Technology: State-of-the-Art and Future Scenarios. Journal of Energy and Power Engineering. 8. 152-165. [CrossRef]
  7. Shi, Ruifeng & Peng, Shuaikang & Chang, Tai & Lee, Kwang. (2023). Annotated Survey on the Research Progress within Vehicle-to-Grid Techniques Based on CiteSpace Statistical Result. World Electric Vehicle Journal. 14. 303. [CrossRef]
  8. Escoto, M.; Guerrero, A.; Ghorbani, E.; Juan, A.A. Optimization Challenges in Vehicle-to-Grid (V2G) Systems and Artificial Intelligence Solving Methods. Appl. Sci. 2024, 14, 5211. [CrossRef]
  9. Bortotti, M.F.; Rigolin, P.; Udaeta, M.E.M.; Grimoni, J.A.B. Comprehensive Energy Analysis of Vehicle-to-Grid (V2G) Integration with the Power Grid: A Systemic Approach Incorporating Integrated Resource Planning Methodology. Appl. Sci. 2023, 13, 11119. [CrossRef]
  10. Shin, GS., Kim, HY., Mahseredjian, J. et al. Smart Vehicle-to-Grid Operation of Power System based on EV User Behavior. J. Electr. Eng. Technol. 19, 2941–2952 (2024). [CrossRef]
  11. Biswas, S., Behera, S., Mekapati, S., Choudhury, N.B.D. (2024). Rapid EV Market Expansion Due to V2G Technology: A Review on V2G Grid Load Balancing and Control. In: Mahajan, V., Chowdhury, A., Singh, S.N., Shahidehpour, M. (eds) Emerging Technologies in Electrical Engineering for Reliable Green Intelligence. ICSTACE 2023. Lecture Notes in Electrical Engineering, vol 1117. Springer, Singapore. [CrossRef]
  12. Pan, W.; Yu, X.; Guo, Z.; Qian, T.; Li, Y. Online EVs Vehicle-to-Grid Scheduling Coordinated with Multi-Energy Microgrids: A Deep Reinforcement Learning-Based Approach. Energies 2024, 17, 2491. [CrossRef]
  13. Trinandana G.A., Pratama A.W., Prasetyono E., Anggriawan D.O. Real time state of charge estimation for lead acid battery using artificial neural network 2020 International Seminar on Intelligent Technology and its Applications, ISITIA, IEEE (2020), pp. 363-368. [CrossRef]
  14. How D.N., Hannan M.A., Lipu M.S.H., Sahari K.S., Ker P.J., Muttaqi K.M. State-of-charge estimation of li-ion battery in electric vehicles: A deep neural network approach IEEE Trans. Ind. Appl., 56 (5) (2020), pp. 5565-5574. [CrossRef]
  15. Alvarez A.D., Garcia F.S., Naranjo J.E., Anaya J.J., Jimenez F. Modeling the driving behavior of electric vehicles using smartphones and neural networks IEEE Intell. Transp. Syst. Mag., 6 (3) (2014), pp. 44-53. [CrossRef]
  16. Modi S., Bhattacharya J., Basak P. Estimation of energy consumption of electric vehicles using deep convolutional neural network to reduce driver’s range anxiety ISA Trans., 98 (2020), pp. 454-47. [CrossRef]
  17. Steinbaach L., Altinsoy M.E. Prediction of annoyance evaluations of electric vehicle noise by using artificial neural networks Appl. Acoust., 145 (2019), pp. 149-158. [CrossRef]
  18. Hussein A.A. Capacity fade estimation in electric vehicle li-ion batteries using artificial neural networks IEEE Trans. Ind. Appl., 51 (3) (2014), pp. 2321-2330. [CrossRef]
  19. Tian Z., Qian C., Gu B., Yang L., Liu F. Electric vehicle air conditioning system performance prediction based on artificial neural network Appl. Therm. Eng., 89 (2015), pp. 101-114. [CrossRef]
  20. Hussein, Ala. (2015). Capacity Fade Estimation in Electric Vehicles Li-ion Batteries using Artificial Neural Networks. IEEE Transactions on Industry Applications. 51. 2321-2330. [CrossRef]
  21. Ansari S., Ayob A., Hossain Lipu M.S., Hussain A., Saad M.H.M. Multi-channel profile based artificial neural network approach for remaining useful life prediction of electric vehicle lithium-ion batteries Energies, 14 (22) (2021), p. 7521. [CrossRef]
  22. Guo Y., Zhao Z., Huang L., SoC Estimation of Lithium Battery Based on Improved BP Neural Network, Energy Procedia, Volume 105, 2017, Pages 4153-4158, ISSN 1876-6102. [CrossRef]
  23. Zhao F., Li Y., Wang X., Bai L., Liu T. Lithium-ion batteries state of charge prediction of electric vehicles using RNNs-CNNs neural networks IEEE Access, 8 (2020), pp. 98168-98180. [CrossRef]
  24. Nie Z., Farzaneh H. Real-time dynamic predictive cruise control for enhancing eco-driving of electric vehicles, considering traffic constraints and signal phase and timing (SPaT) information, using artificial-neural-network-based energy consumption model Energy, 241 (2022), Article 122888. [CrossRef]
  25. Narasimhulu N., Krishnam Naidu R.S.R., Falkowski-Gilski P., Divakarachari P.B., Roy U. Energy management for PV powered hybrid storage system in electric vehicles using artificial neural network and aquila optimizer algorithm Energies, 15 (22) (2022), p. 8540. [CrossRef]
  26. Hong J., Wang Z., Chen W., Wang L.Y., Qu C. Online joint-prediction of multi-forward-step battery SOC using LSTM neural networks and multiple linear regression for real-world electric vehicles J. Energy Storage, 30 (2020), Article 101459. [CrossRef]
  27. Charkhgard M., Farrokhi M. State-of-charge estimation for lithium-ion batteries using neural networks and EKF IEEE Trans. Ind. Electron., 57 (12) (2010), pp. 4178-4187. [CrossRef]
  28. Zheng L., Hou Y., Zhang T., Pan X. Performance prediction of fuel cells using long short-term memory recurrent neural network Int. J. Energy Res., 45 (6) (2021), pp. 9141-9161. [CrossRef]
  29. Wang Z.H., Hendrick, Horng G.J., Wu H.T., Jong G.J. A prediction method for voltage and lifetime of lead–acid battery by using machine learning Energy Explor. Exploit., 38 (1) (2020), pp. 310-329. [CrossRef]
  30. Bukola Peter Adedeji, Golam Kabir, A feedforward deep neural network for predicting the state-of-charge of lithium-ion battery in electric vehicles, Decision Analytics Journal, Volume 8, 2023, 100255, ISSN 2772-6622. [CrossRef]
  31. Adedeji, B. (2023). A feedforward deep neural network for predicting the state-of-charge of lithium-ion battery in electric vehicles. Decision Analytics Journal. 8. 100255. [CrossRef]
  32. Shaik, N. & Pedapati, S. Rao & Taqvi, Syed Ali A. & Othman, A. & Abd D., Faizul A.. (2020). A Feed-Forward Back Propagation Neural Network Approach to Predict the Life Condition of Crude Oil Pipeline. Processes. 8. [CrossRef]
  33. Makhambet Sarbayev, Ming Yang, Haiqing Wang, Risk assessment of process systems by mapping fault tree into artificial neural network, Journal of Loss Prevention in the Process Industries, Volume 60. [CrossRef]
  34. 2019, Pages 203-212, ISSN 0950-4230. [CrossRef]
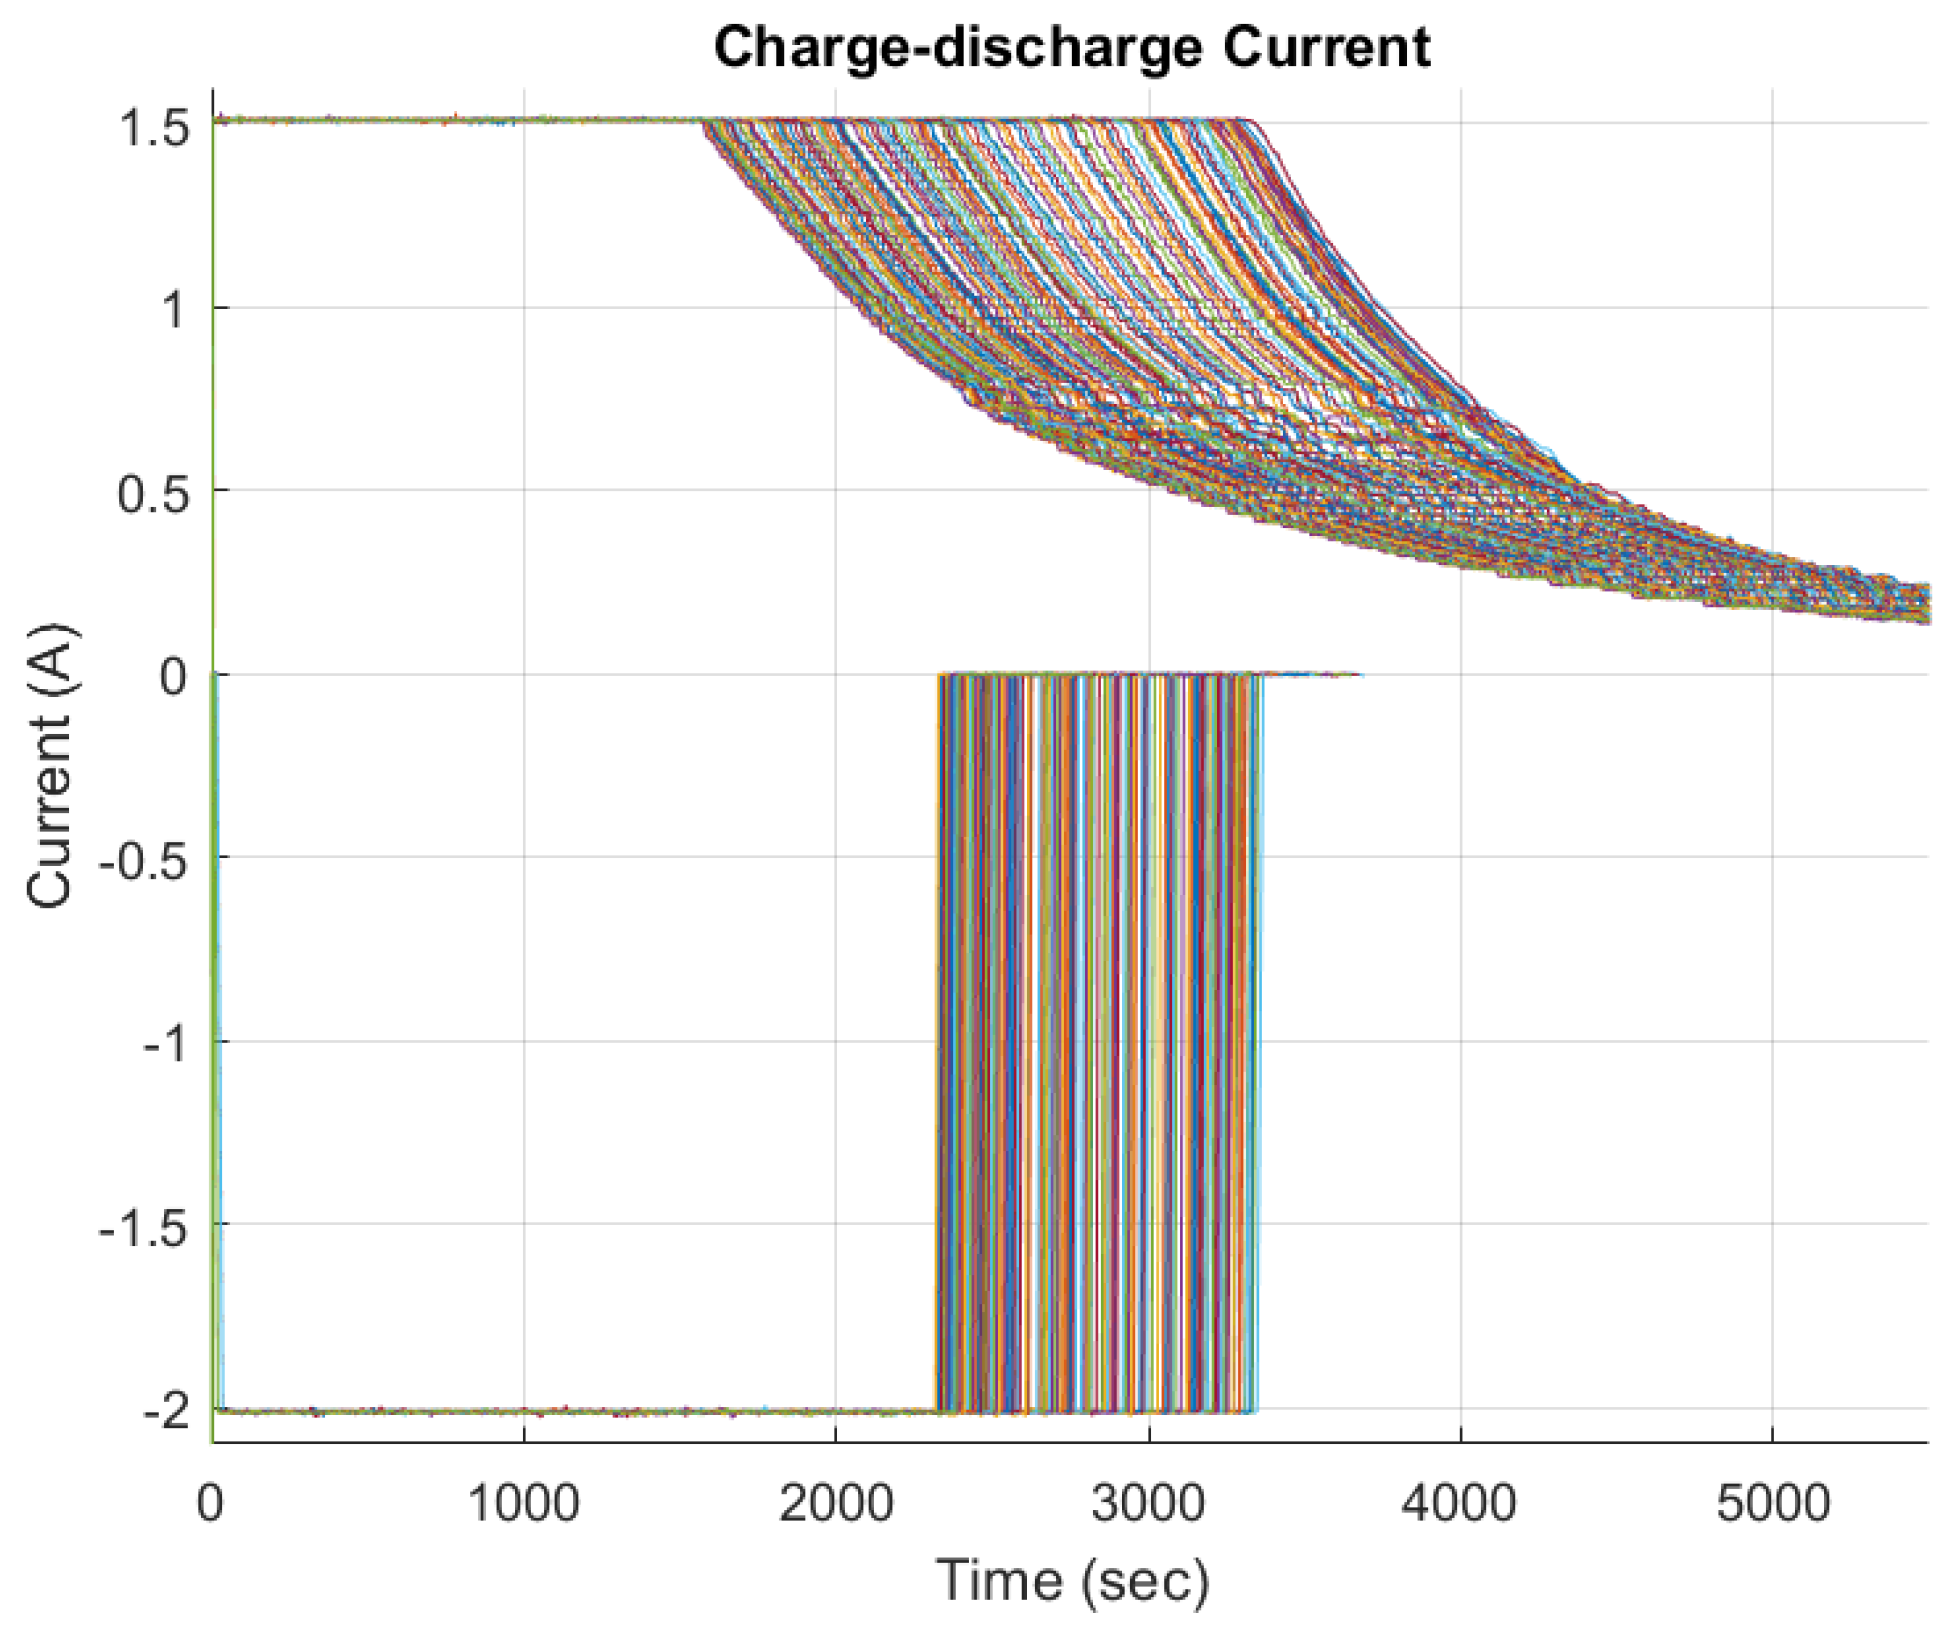
Figure 1. Trend of current (A) in function of time (sec) battery B0005 [1].
Preprints 121205 g001
Figure 2. Trend of Current (A) in function of SOC for battery B0005 [1].
Preprints 121205 g002
Figure 3. Trend of Current (A)in function of SOC for battery B0005 [1].
Preprints 121205 g003
Figure 4. Trend of Voltage (V) in function of of Time (sec) for battery B0005 [1].
Preprints 121205 g004
Figure 5. Trend of Voltage (V) in function of SOC for battery B0005 [1].
Preprints 121205 g005
Figure 6. Trend of current (A) in function of time (sec) battery B0006 [1].
Preprints 121205 g006
Figure 7. Trend of Current (A)in function of SOC for battery B0006 [1].
Preprints 121205 g007
Figure 8. Trend of Voltage (V) in function of of Time (sec) for battery B0006 [1].
Preprints 121205 g008
Figure 9. Trend of Voltage (V) in function of SOC for battery B0006 [1].
Preprints 121205 g009
Figure 10. Model of the Feed-Forward-Back-Propagation Network (FFBPN).
Preprints 121205 g010
Figure 11. Model of Function of Feed-Forward-Back-Propagation Network (FFBPN).
Preprints 121205 g011
Figure 12. Training, testing and validation values of the R2 for the B0005 battery.
Preprints 121205 g012
Figure 13. Training, testing and validation values of the R2 for the B0006 battery.
Preprints 121205 g013
Figure 14. Best validation performance between Mean Squared Error (MSE) for battery B0005.
Preprints 121205 g014
Figure 15. Best validation performance between Mean Squared Error (MSE) for battery B0006.
Preprints 121205 g015
Figure 16. Performance at 14 Epoch for battery B0005.
Preprints 121205 g016
Figure 17. Performance at 14 Epoch for battery B0006.
Preprints 121205 g017
Figure 19. Error Histogram of the phase Training, Validation and Test for battery B0005.
Preprints 121205 g019
Figure 20. Error Histogram of the phase Training, Validation and Test for battery B0006.
Preprints 121205 g020
Disclaimer/Publisher’s Note: The statements, opinions and data contained in all publications are solely those of the individual author(s) and contributor(s) and not of MDPI and/or the editor(s). MDPI and/or the editor(s) disclaim responsibility for any injury to people or property resulting from any ideas, methods, instructions or products referred to in the content.
Copyright: This open access article is published under a Creative Commons CC BY 4.0 license, which permit the free download, distribution, and reuse, provided that the author and preprint are cited in any reuse.
Prerpints.org logo

Preprints.org is a free preprint server supported by MDPI in Basel, Switzerland.

Subscribe

© 2024 MDPI (Basel, Switzerland) unless otherwise stated