1. Introduction
The issue of controlling the bow shock wave represents a significant aspect within the research of supersonic/hypersonic flow control, as the standoff distance of the bow shock directly affects upon the aerodynamic characteristics of a streamlined body (see [
1] by D. Knight). Surveys of research pertaining to energy deposition for flow/flight control were presented by D. Knight [
2], M. Ahmed and N. Qin [
3], and S. Rashid et al. [
4]. S. Leonov et al. provided an overview of researches devoted to the interaction of airflow with a range of surface-based gas discharges and discussed experiments concerning the control of supersonic flow structures through near-surface discharges [
5,
6]. I. Znamenskaya in the review [
7], discussed different visualization techniques such as refraction-based methods, electroluminescence, particle image velocimetry, and surface visualization techniques.
Theoretical considerations concerning the impact of energy deposition in a freestream flow on the bow shock and the parameters of an AD body are discussed by P. Georgievsky and V. Levin in [
8], V. Artem’ev et al. in [
9], and D. Riggins et al. in [
10]. Experimental investigations demonstrated the possibility of a significant influence on a supersonic flow using a variety of methods, including MW impulse (Y. Kolesnichenko et al. [
11]), laser (P. Tretyakov et al. [
12]), electrical discharge (V. Bityurin et al. [
13,
14], N. Benard and E. Moreau [
15]), and MHD effects (T. Lapushkina and A. Erofeev [
16]).
The dynamics of xenon plasma flow within a supersonic diffuser, influenced by external electric and magnetic fields, were investigated by T. Lapushkina et al. in [
17]. Experimental results showed that during heating of noble gas plasma in nonequilibrium conditions, the energy level, which determines the ionization rate, shifts towards a lower energy, which allows ionization of the expanding flow for subsequent MHD experiments. In [
18,
19], S. Bobashev et al. has revealed that external electric and magnetic fields exert a significant influence on the structural transformations occurring in the supersonic flow of weakly ionized xenon and MHD effects have a significant influence on the magnitude of the heat flux directed to the plate surface in the flow. The characteristics of the hydrodynamic phenomenon arising from high-speed flow over a surface of a blunt fin were considered by X. Zhao in [
20]. It was shown that the generation of the shock wave by the rib leads to early separation of the boundary layer in front of the rib, and the increase in pressure in the head part of the shock wave generated by the rib led to the detachment of the boundary layer, resulting in the formation of a region of separated flow. A substantial research has been conducted to ascertain the influence of diverse energy sources, distinguished by their geometric configuration and placement, on the bow shock wave. The impact of an arc gas discharge on the location of an oblique shock wave and the distribution of pressure within the flow was attributed to thermal effects and was modeled by H. Yan et al. in [
21]. Also, B. Tang et al. investigated the regulation of a cylindrical detached bow shock wave and the modification of the shock wave angle through the high-energy stimulation of surface arc discharge plasma in [
22]. These effects were attributed to the heating of the gas, which subsequently leads to the deformation of the bow shock wave
.
It is notable that among the studies on the bow shock wave control by energy deposition, a comparatively limited number of investigations were focused on the impact of plasma region parameters, such as the degree of ionization and nonequilibrium. Nevertheless, the introduction of charged particles, including electrons and ions, into the surrounding gas flow of an AD alongside the thermodynamic nonequilibrium, characterized by a predominance of electron temperature over gas temperature, results in an additional displacement of the bow shock wave compared with the consequence of purely thermal shifts. In [
23], Azarova et al. compared experimental data on the thermal nonequilibrium flow of an AD body with the results of modelling assuming a thermal mechanism of the discharge action. The experiments demonstrated the influence of plasma on the dynamics of the bow shock wave, which is associated with nonequilibrium ionization in the flow. The dependences of the adiabatic index (isentropic exponent) and specific heat capacities as functions of the degree of ionization and the degree of nonequilibrium for monatomic plasma in the absence of local thermodynamic equilibrium are presented by K. Burm et al. in [
24].
In [
25], V. Lago et al. examined the impact of a gas discharge near the surface of a streamlined body on the bow shock. The study involves the use of electrogasdynamic and magnetohydrodynamic methods to adjust the position of the bow shock wave. Experimental results for a Mach 2 flow showed that increasing the power of the gas discharge near the body surface leads to an increase in the bow shock stand-off distance. Numerical simulations suggested that this shift in the bow shock position is influenced by both thermal effects and specific plasma properties like thermal nonequilibrium and ionization. The control of supersonic flow at a Mach number of 4 past an AD body examined through the energy supply to its surface via organization of a gas discharge across the entire cylindrical frontal surface is described by O. Azarova et al. in [
26]. This study demonstrated the potential to influence both the position of the steady bow shock wave and the aerodynamic characteristics of the body by supplying energy to the near-surface flow region.
The main objective of the present study is to demonstrate the possibility of actively influencing the position of the bow shock wave and the main parameters of supersonic flow over a blunt body in xenon by organizing a gas discharge near the front surface of the body in the region between the body and the bow shock wave. The study examines the impact of plasma parameters, specifically the degree of ionization and degree nonequilibrium, along with the discharge current and power, on the bow shock position in the steady flow mode. The research is carried out using both experimental and numerical methods. The findings may prove valuable in the development of new energetic methods for flow and flight control.
3. Numerical Simulations of the Impact of a Surface-Energy Deposition on the Bow Shock Wave and Aerodynamic Characteristics of a Model
3.1. Methodology and Statement of the Problem
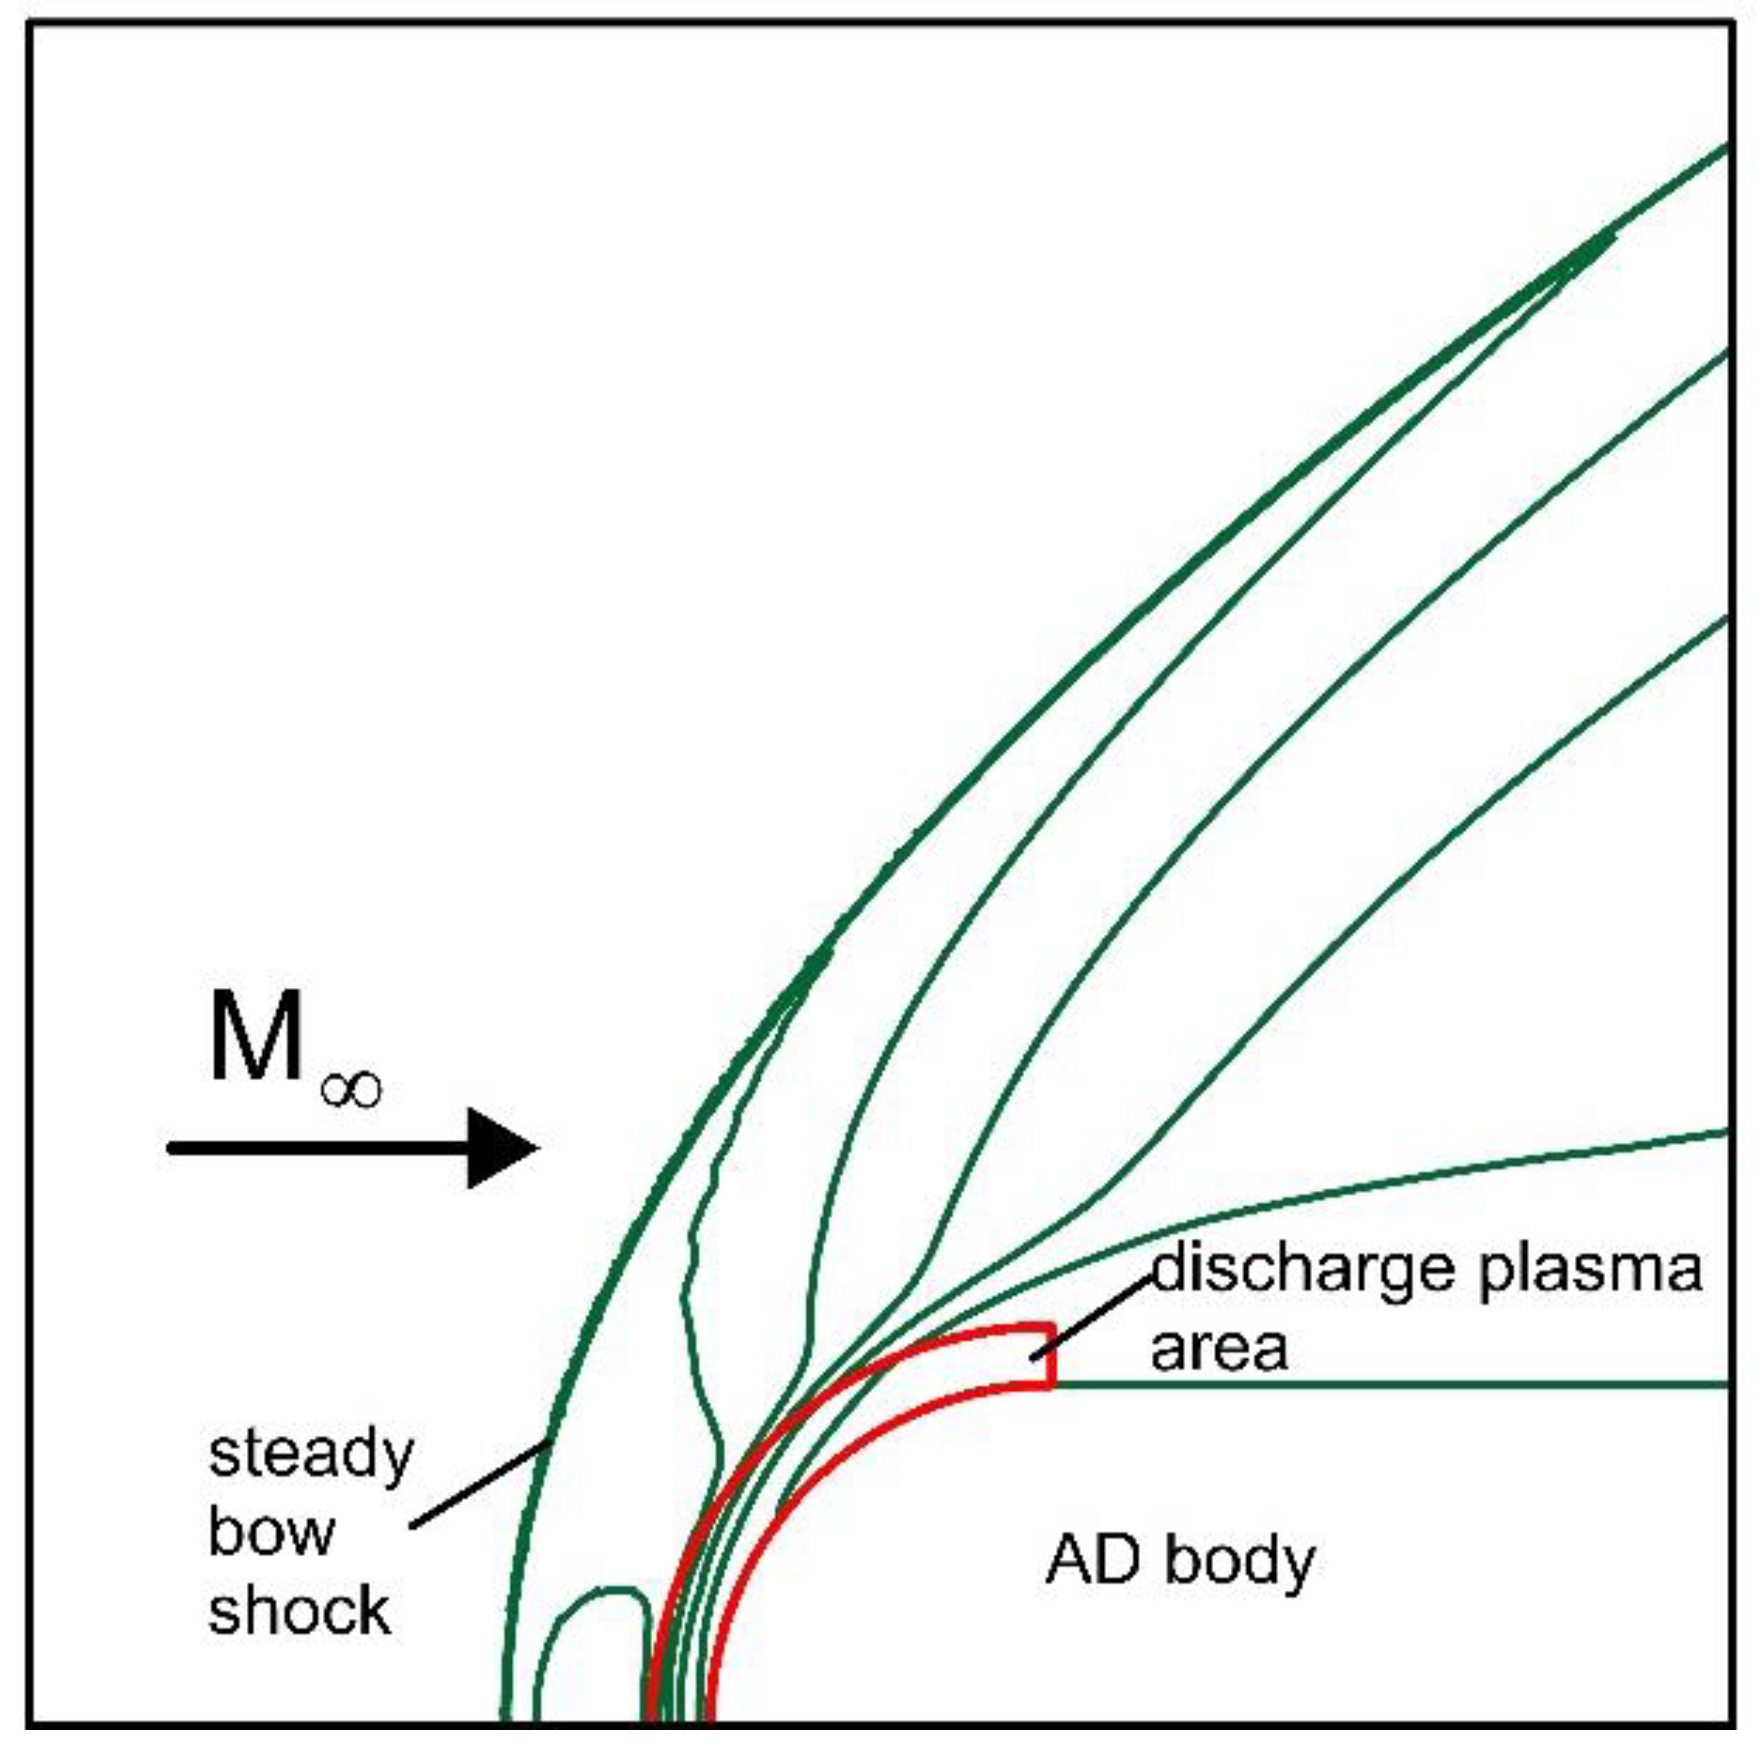
In the experiment, the ionized flow moves out of the shock tube, reaches the body, and causes the ignition of a discharge between the electrodes located on the body, to which voltage is applied. When the flow reaches the body, the formation of the bow shock wave begins, which passes through the gas-discharge plasma impact zone. In this case, additional ionization occurs in front of the body due to an increase in temperature behind the shock wave front. It should be noted that this additional ionization is present in the steady flow in the absence of discharge action, as well. In the calculations, it is assumed that the hot impact zone of ionized gas in front of the body occurs instantly, which is due to the difference in the time scales of discharge and gas-dynamic phenomena. Thus, in the simulation, the discharge action is described by the action of a volumetric gas region with the increased energy and changed adiabatic index. The scheme of the numerical approach to the study of an impact of a near-surface energy deposition on a supersonic flow past a plate blunted by a cylinder is shown in
Figure 11. Here the discharge action impact zone is marked by red.
The simulations are based on the Navier-Stokes equations for perfect viscous heat conductive gas (xenon); the ratio of specific heats (adiabatic index) was a fitting parameter for different values of the specific discharge power
q (power on the unit of mass). The flow is supposed to be parallel to the axis of symmetry. The full Navier-Stokes system of equations in the divergent form for the dimensionless variables [
28] is solved numerically:
Here q is the specific power in the area of higher gas energy formed by the discharge, ε is the specific internal energy,
The freestream Mach number M∞ = 6.8 and the Reynolds number Re=4559, the Prandtl number Pr=0.623.
The dependence of dynamic viscosity µ on temperature is supposed as:
The coefficient of heat conductivity k is supposed to depend on temperature by the same way:
The problem is solved in dimensionless variables, which are expressed through dimensional variables (designated by the index "dim") as follows:
The following scaling coefficients were used in the calculations:
where the index ∞ defines the free stream parameters. Further figures, where not specified, are given in dimensionless variables.
Initial conditions are the flow with freestream values of density , pressure , and velocity We suppose that the adiabatic index in the oncoming flow γ=1.217, and the adiabatic index in the plasma area created by the discharge in front of the body is γs=1.258. Therefore, the problem is solved taking into account the initial gas ionization.
The boundary conditions have a sense of the absence of according normal flows on the boundaries of the body:
The conditions of the absence of reflection in the normal directions are set at the exit boundaries of the computation domain:
The near-surface energy deposition is modelled via the creating a stationary region of higher gas energy using the right part in the equation of energy in (1), where
q is the specific power in this region (this area is noted by red in
Figure 11). The width of this area in the
x-direction is supposed to equal to 0.1
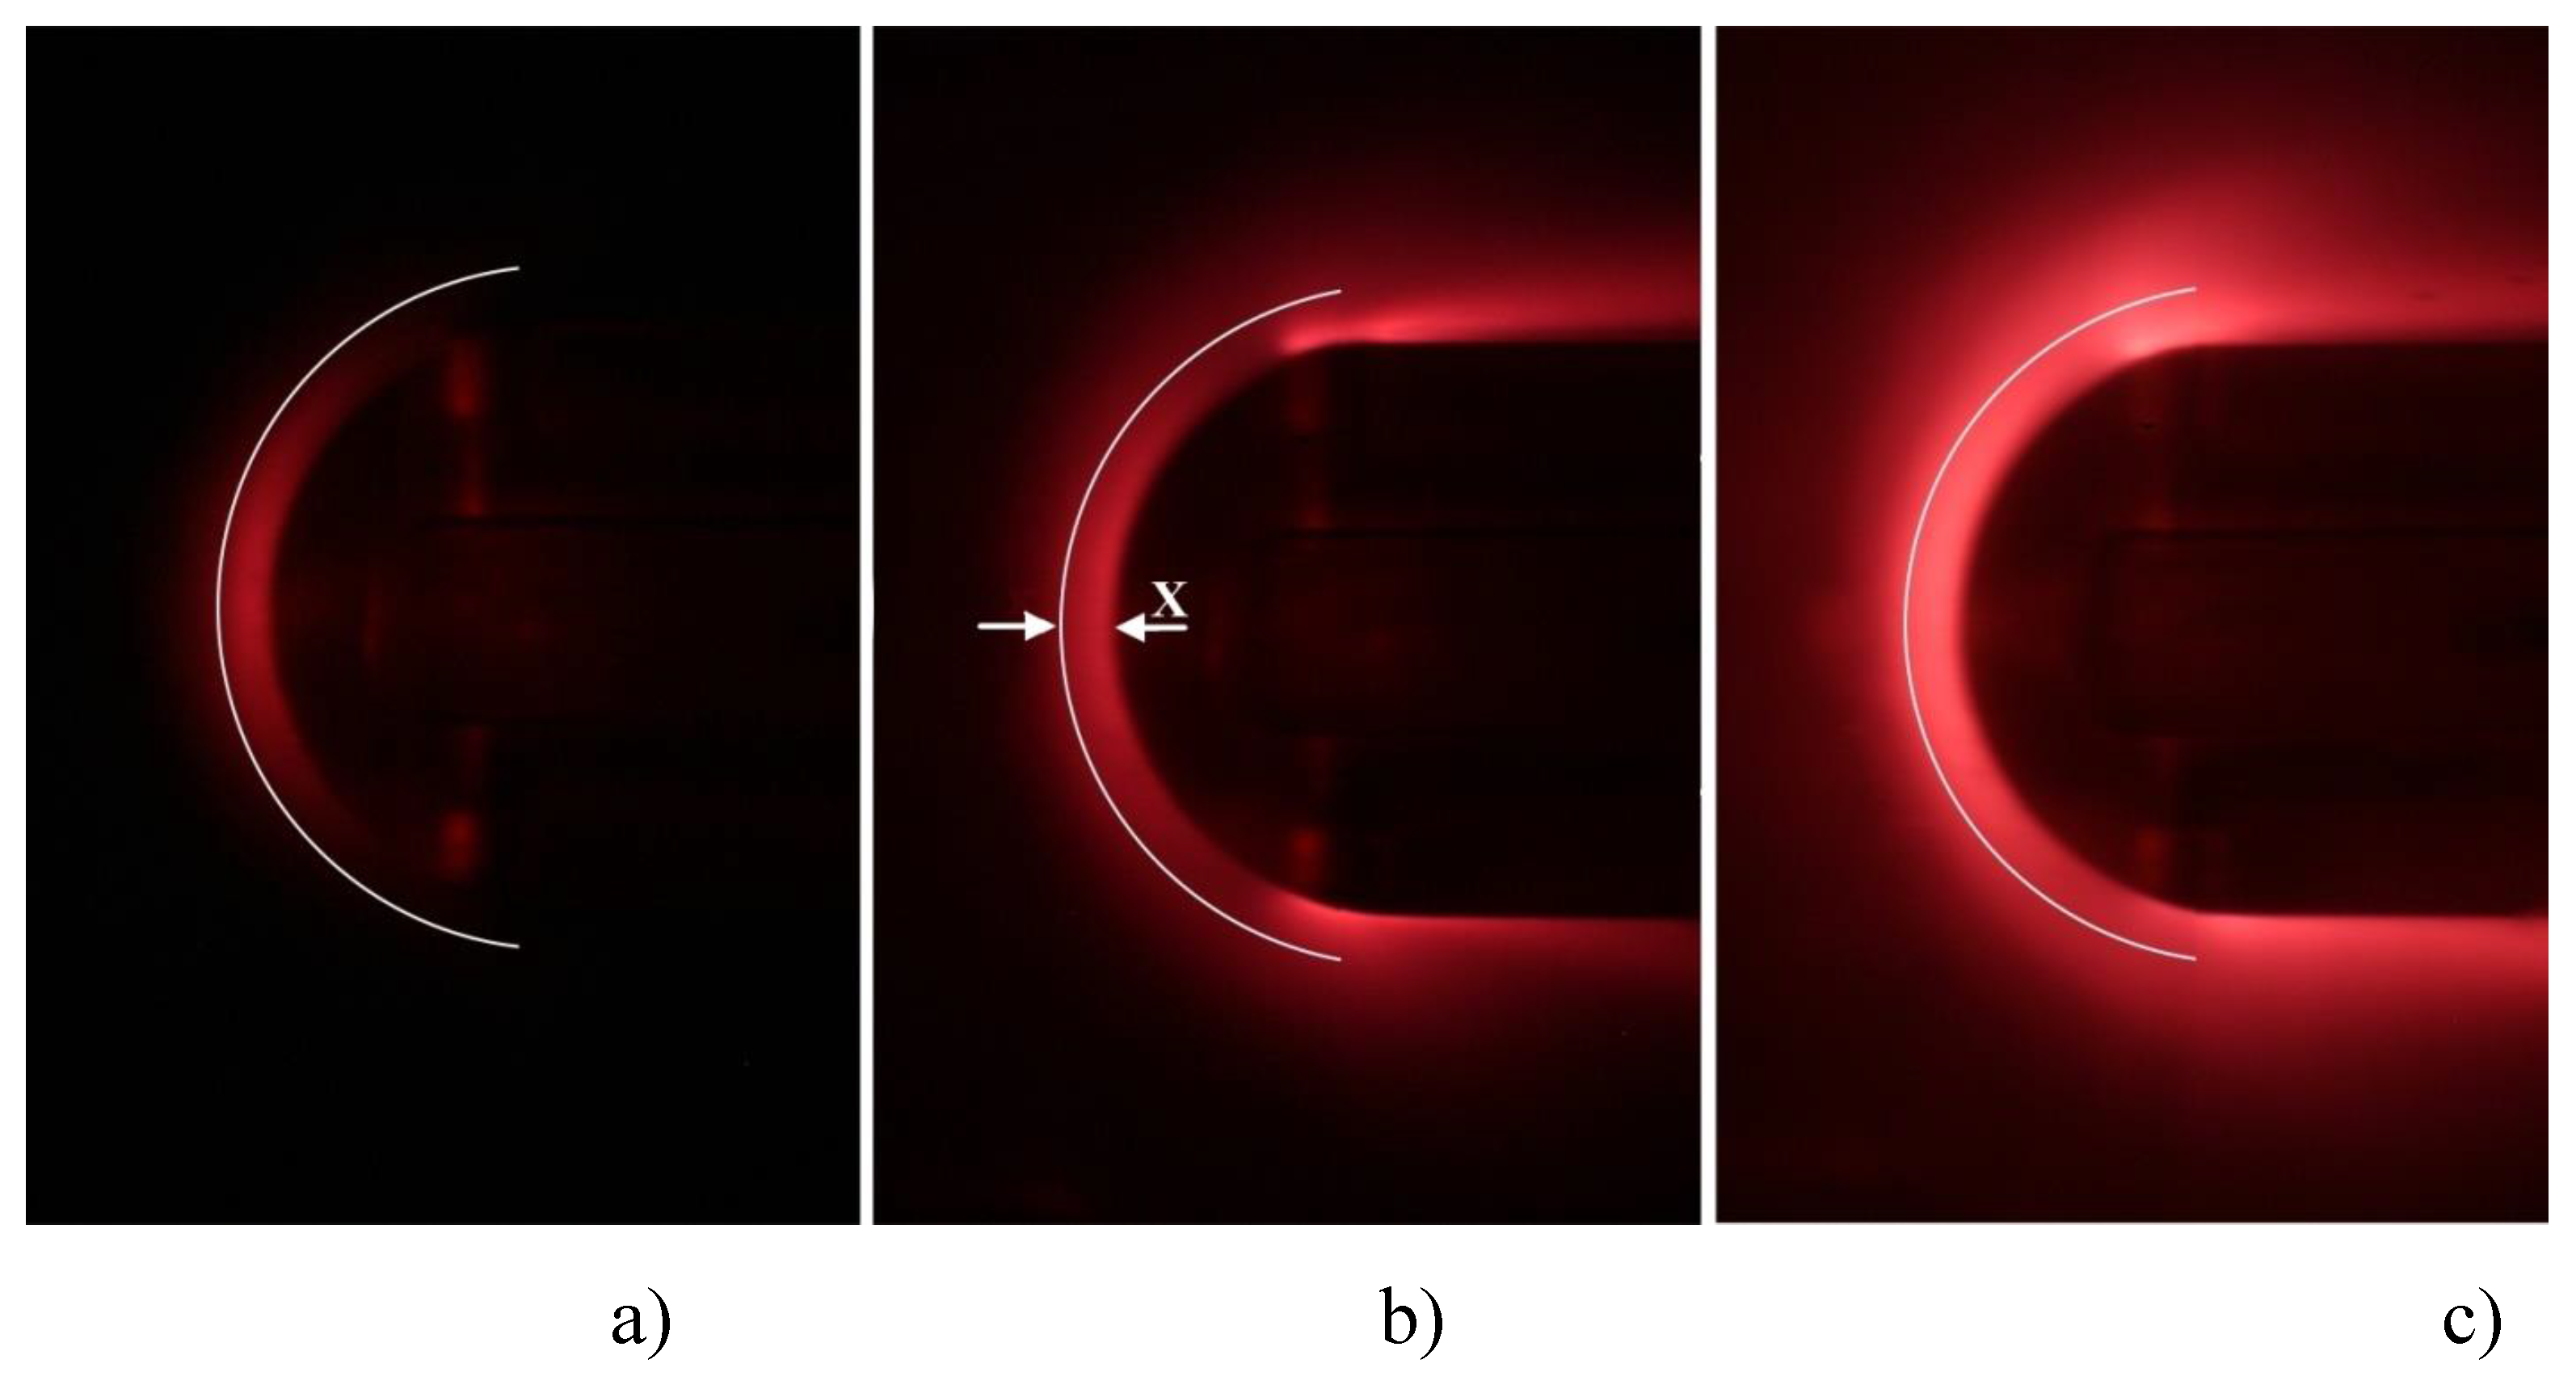
D, which is in accordance with the experimental Schlieren images (see
Figure 8). We supposed that this area arises instantly and it is determined via the initial conditions and the value of
q.
The simulations are performed using a computational code that employs complex conservative difference schemes [
29]. The schemes have the second order of approximation, both in space and in time. The five-point stencil from Lax's scheme is used for scheme construction, resulting in staggered and uniform grids throughout the computational domain. To increase the order of approximation in the development of the schemes, the differential consequences of system (1) are utilized for partial spatial derivatives on
x and
y. The boundaries of an AD body are introduced into the calculation area without breaking the conservation laws in it. The construction details of these schemes within the computational domain, and in the vicinity of the AD body boundaries are presented in [
29].
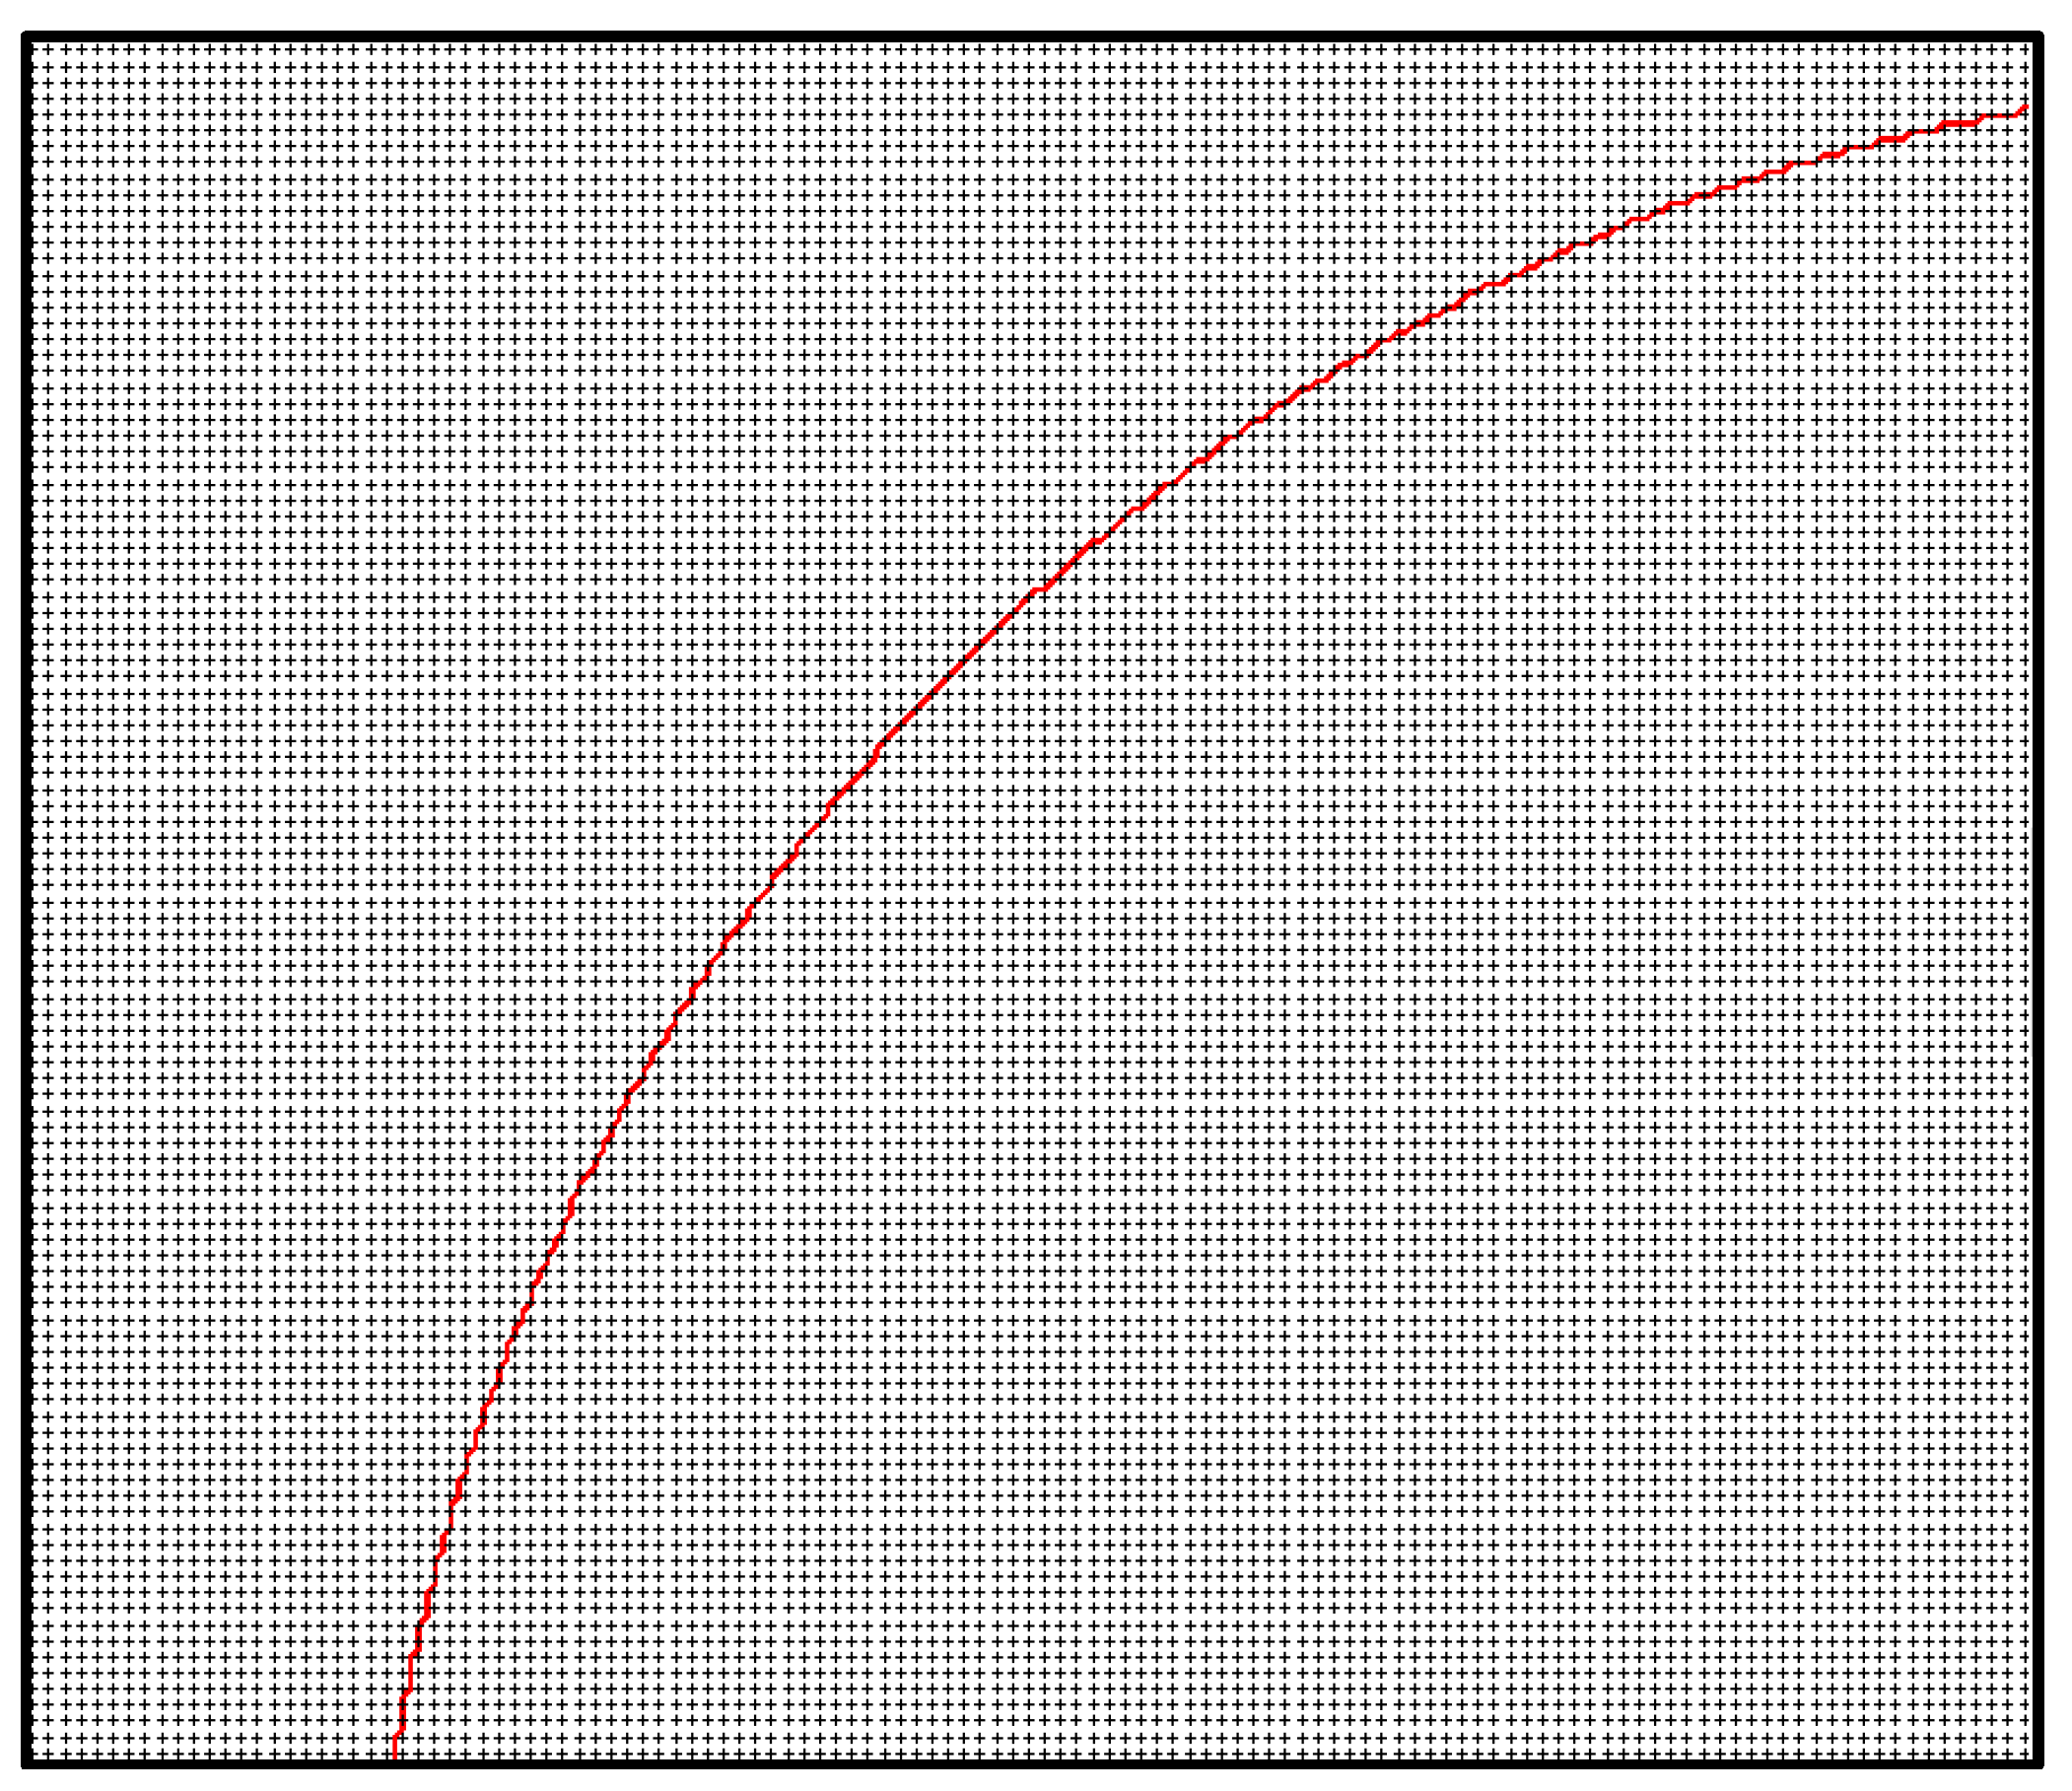
In an enlarged format,
Figure 2 illustrates the position of the body's front part on the difference grid. The staggered numerical grids employed in the calculations feature a node spacing of 2
hx and 2
hy at each time level (where
hx and
hy denote the spatial steps in the
x- and
y-directions, respectively). The selection of the time step is performed using the Courant-Friedrichs-Levy criterion. It should be noted that a number of test cases pertaining to the numerical methods employed, a comparison with the experimental results, and the developed software are presented in [
29].
3.2. Analysis of the Grid Convergence
A study of the grid convergence of the difference method used was conducted. The results were obtained on three different grids. The characteristics of these grids are presented together with the relative errors in the stagnation parameters (at the center of the cylinder surface) related to the theoretically values obtained with the help of the Bernoulli's relation (
Table 1). Here the dimensions of the grids are specified counting the middle node of the stencil.
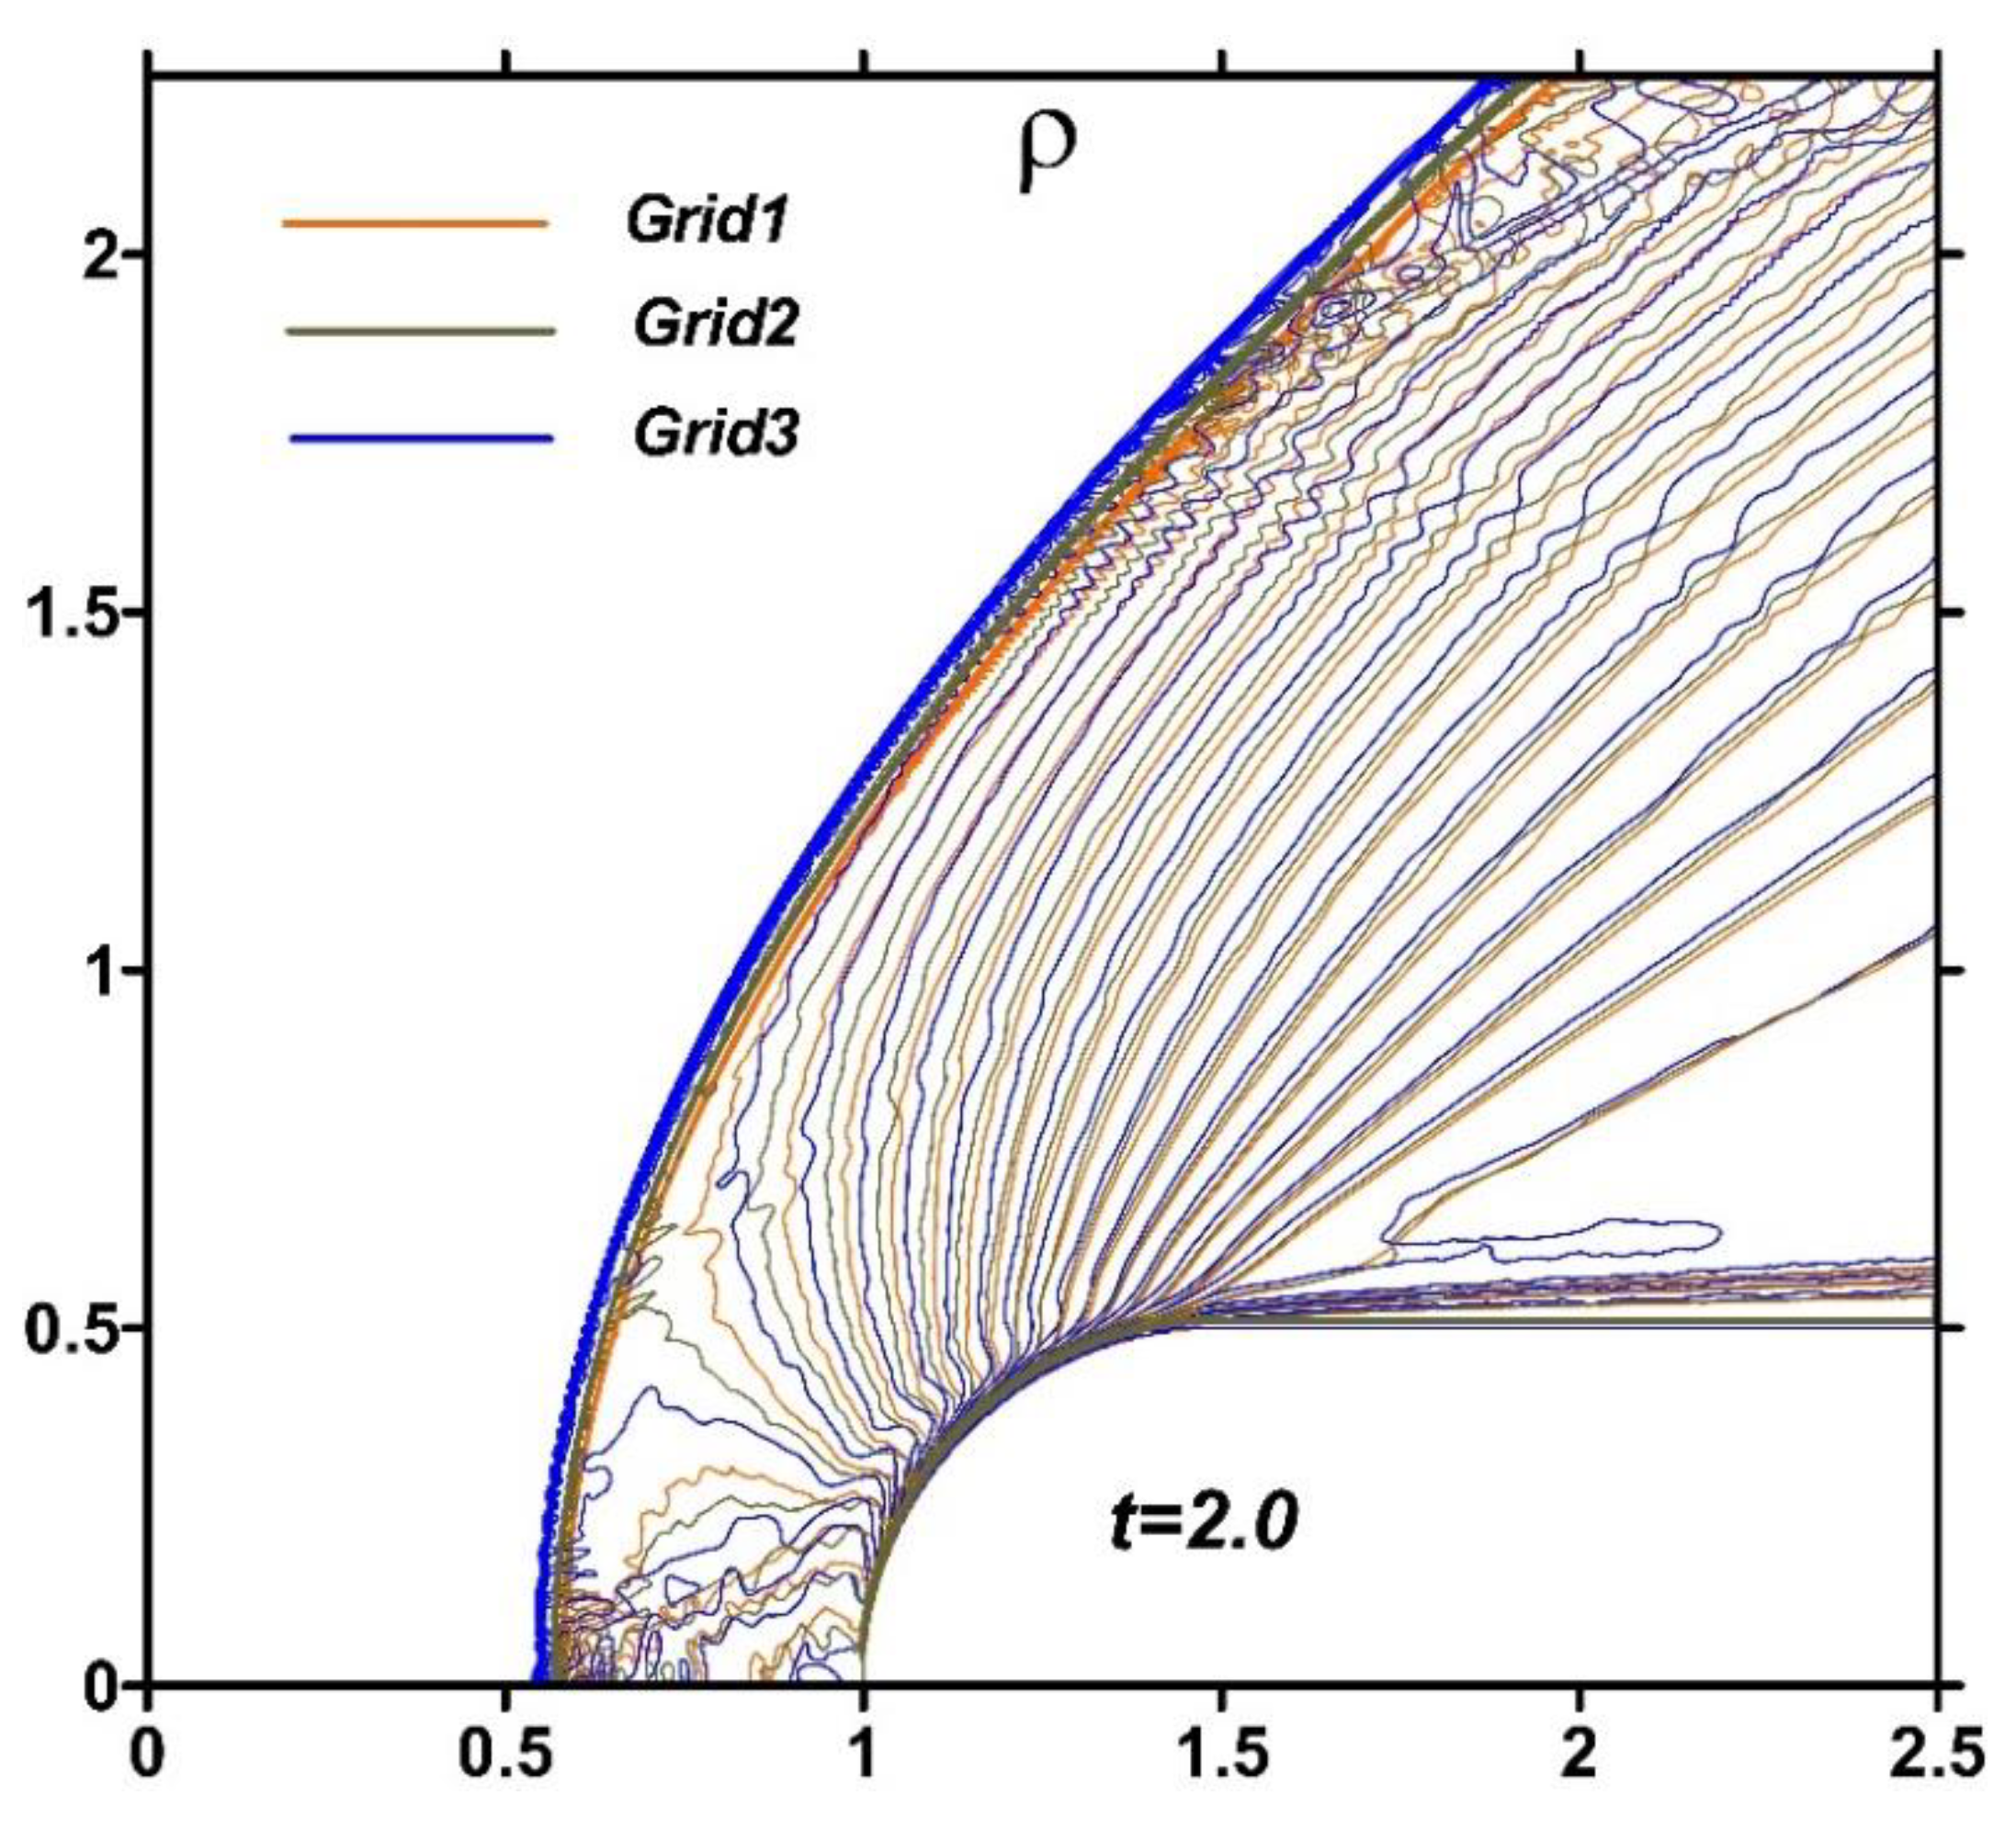
Figure 13 shows a comparison of the density fields in isochores obtained on three grids Grid1, Grid2, Grid3. From the analysis of the presented fields, we can conclude that there is grid convergence in the position and shape of the bow shock wave, as well as in the flow structure inside the shock layer.
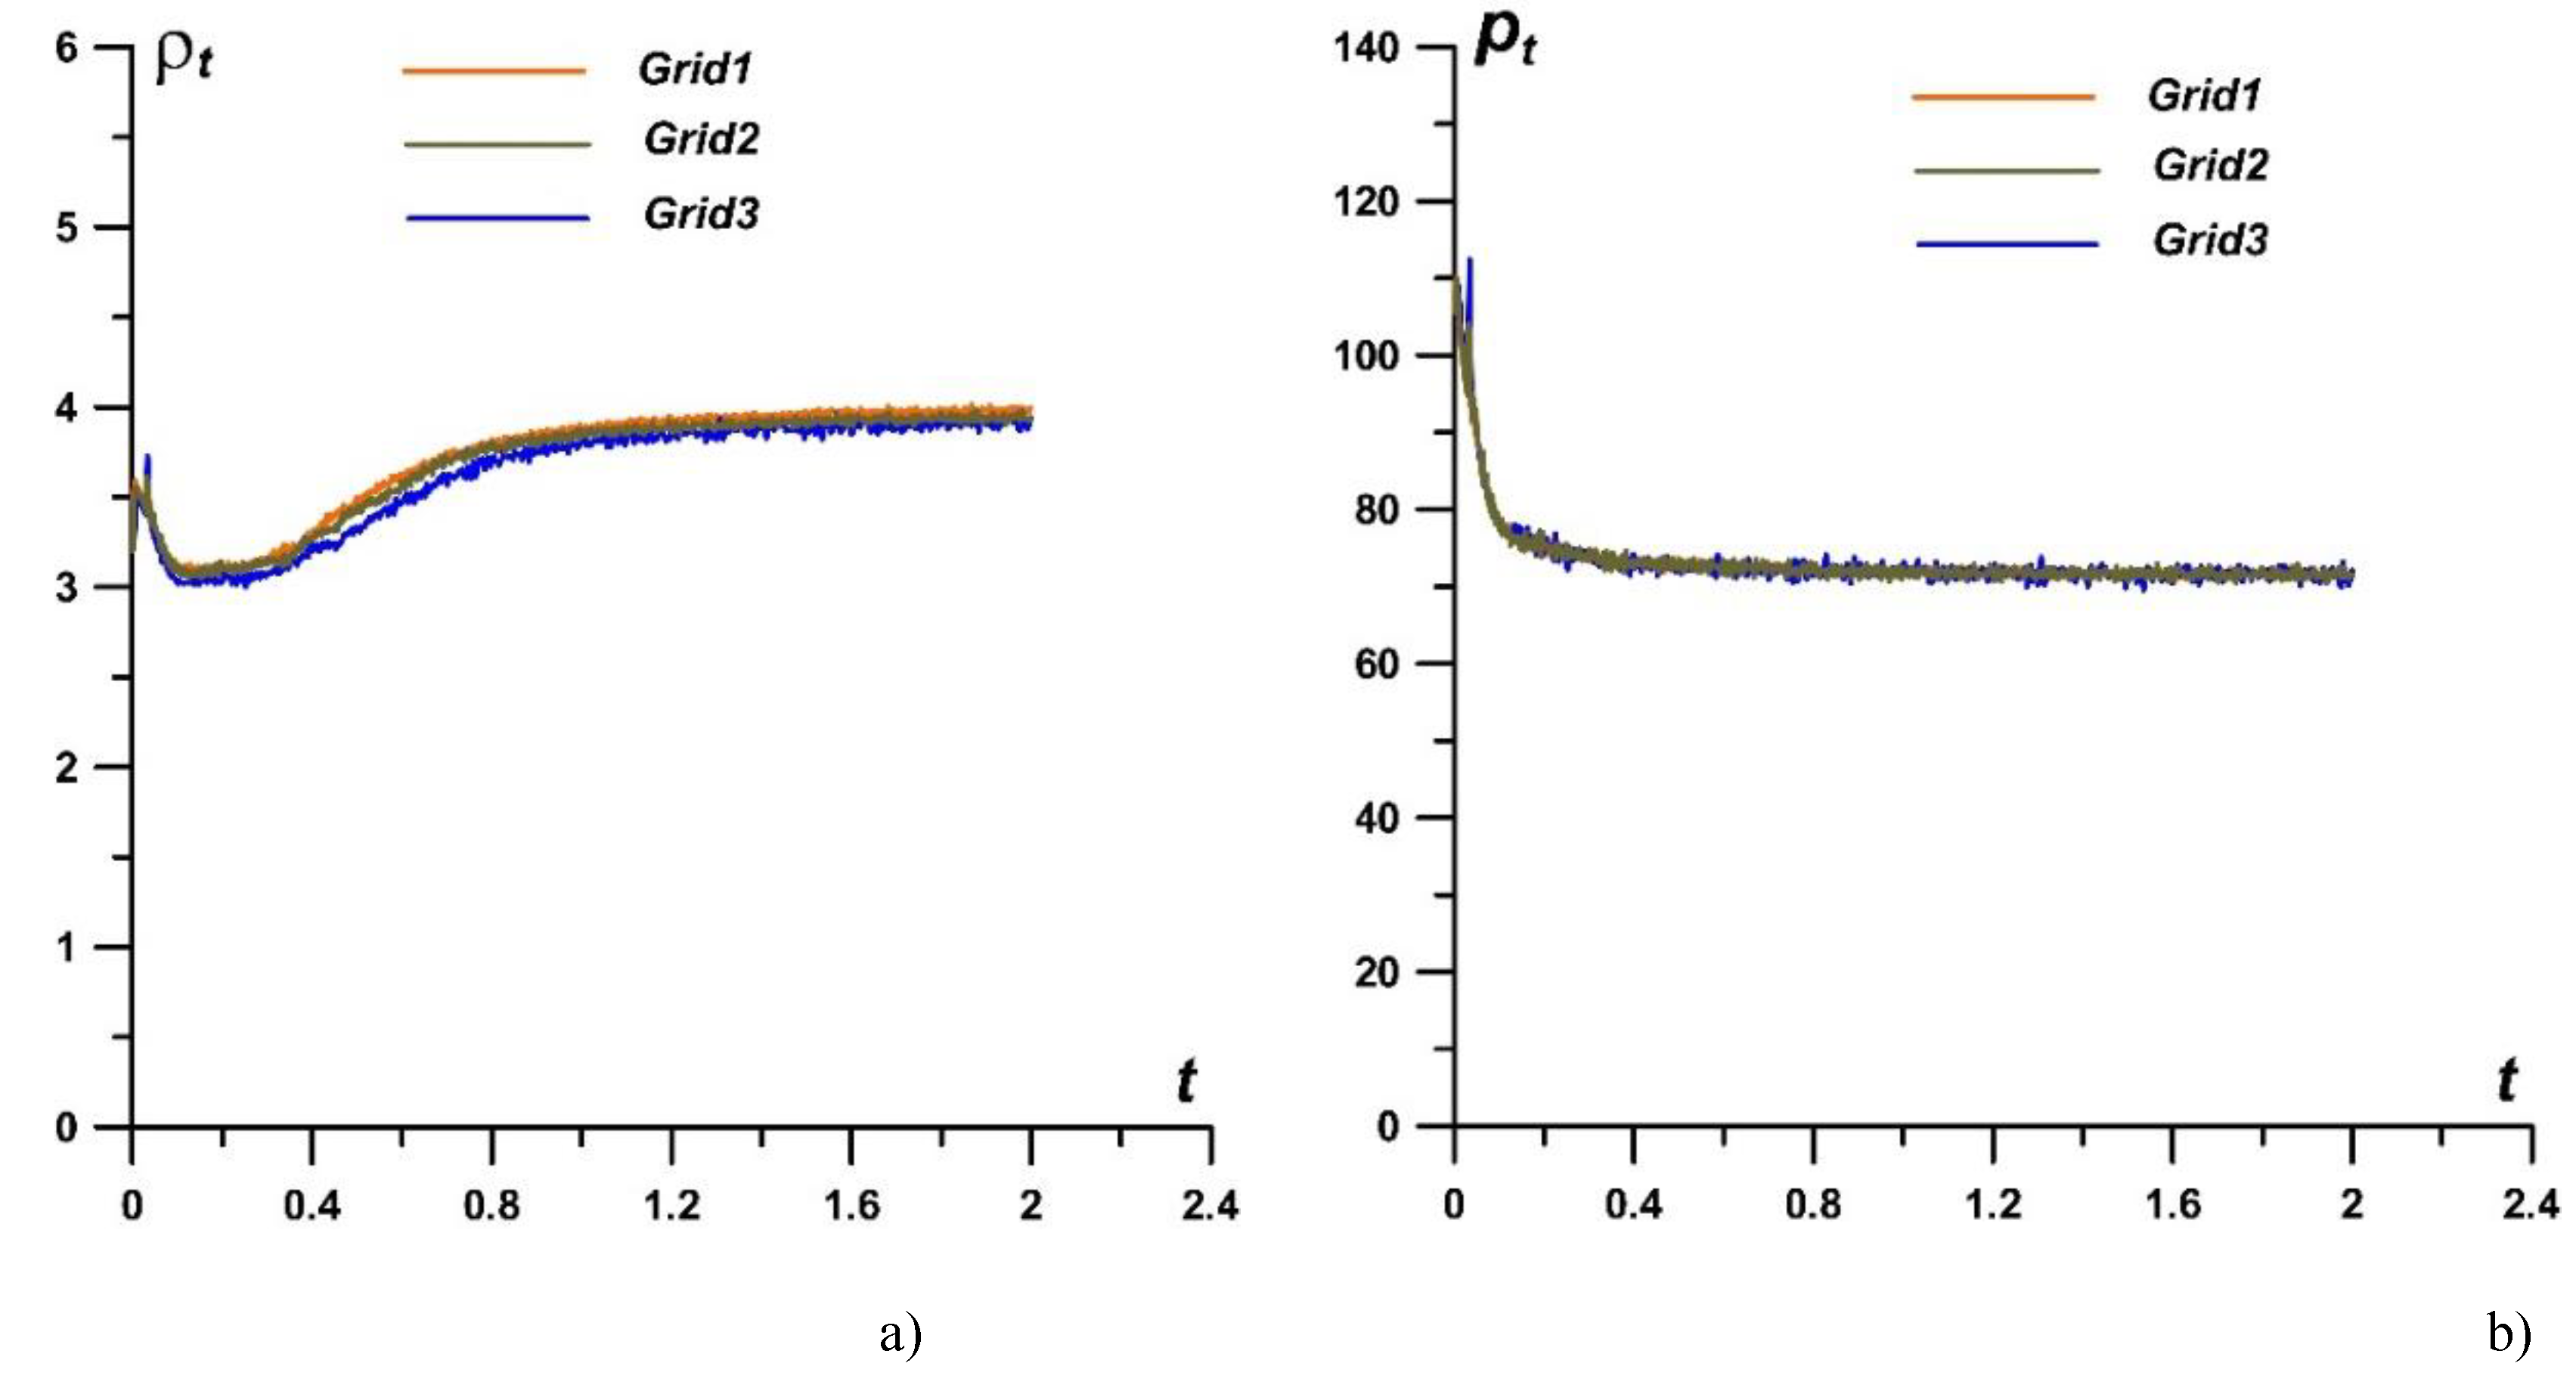
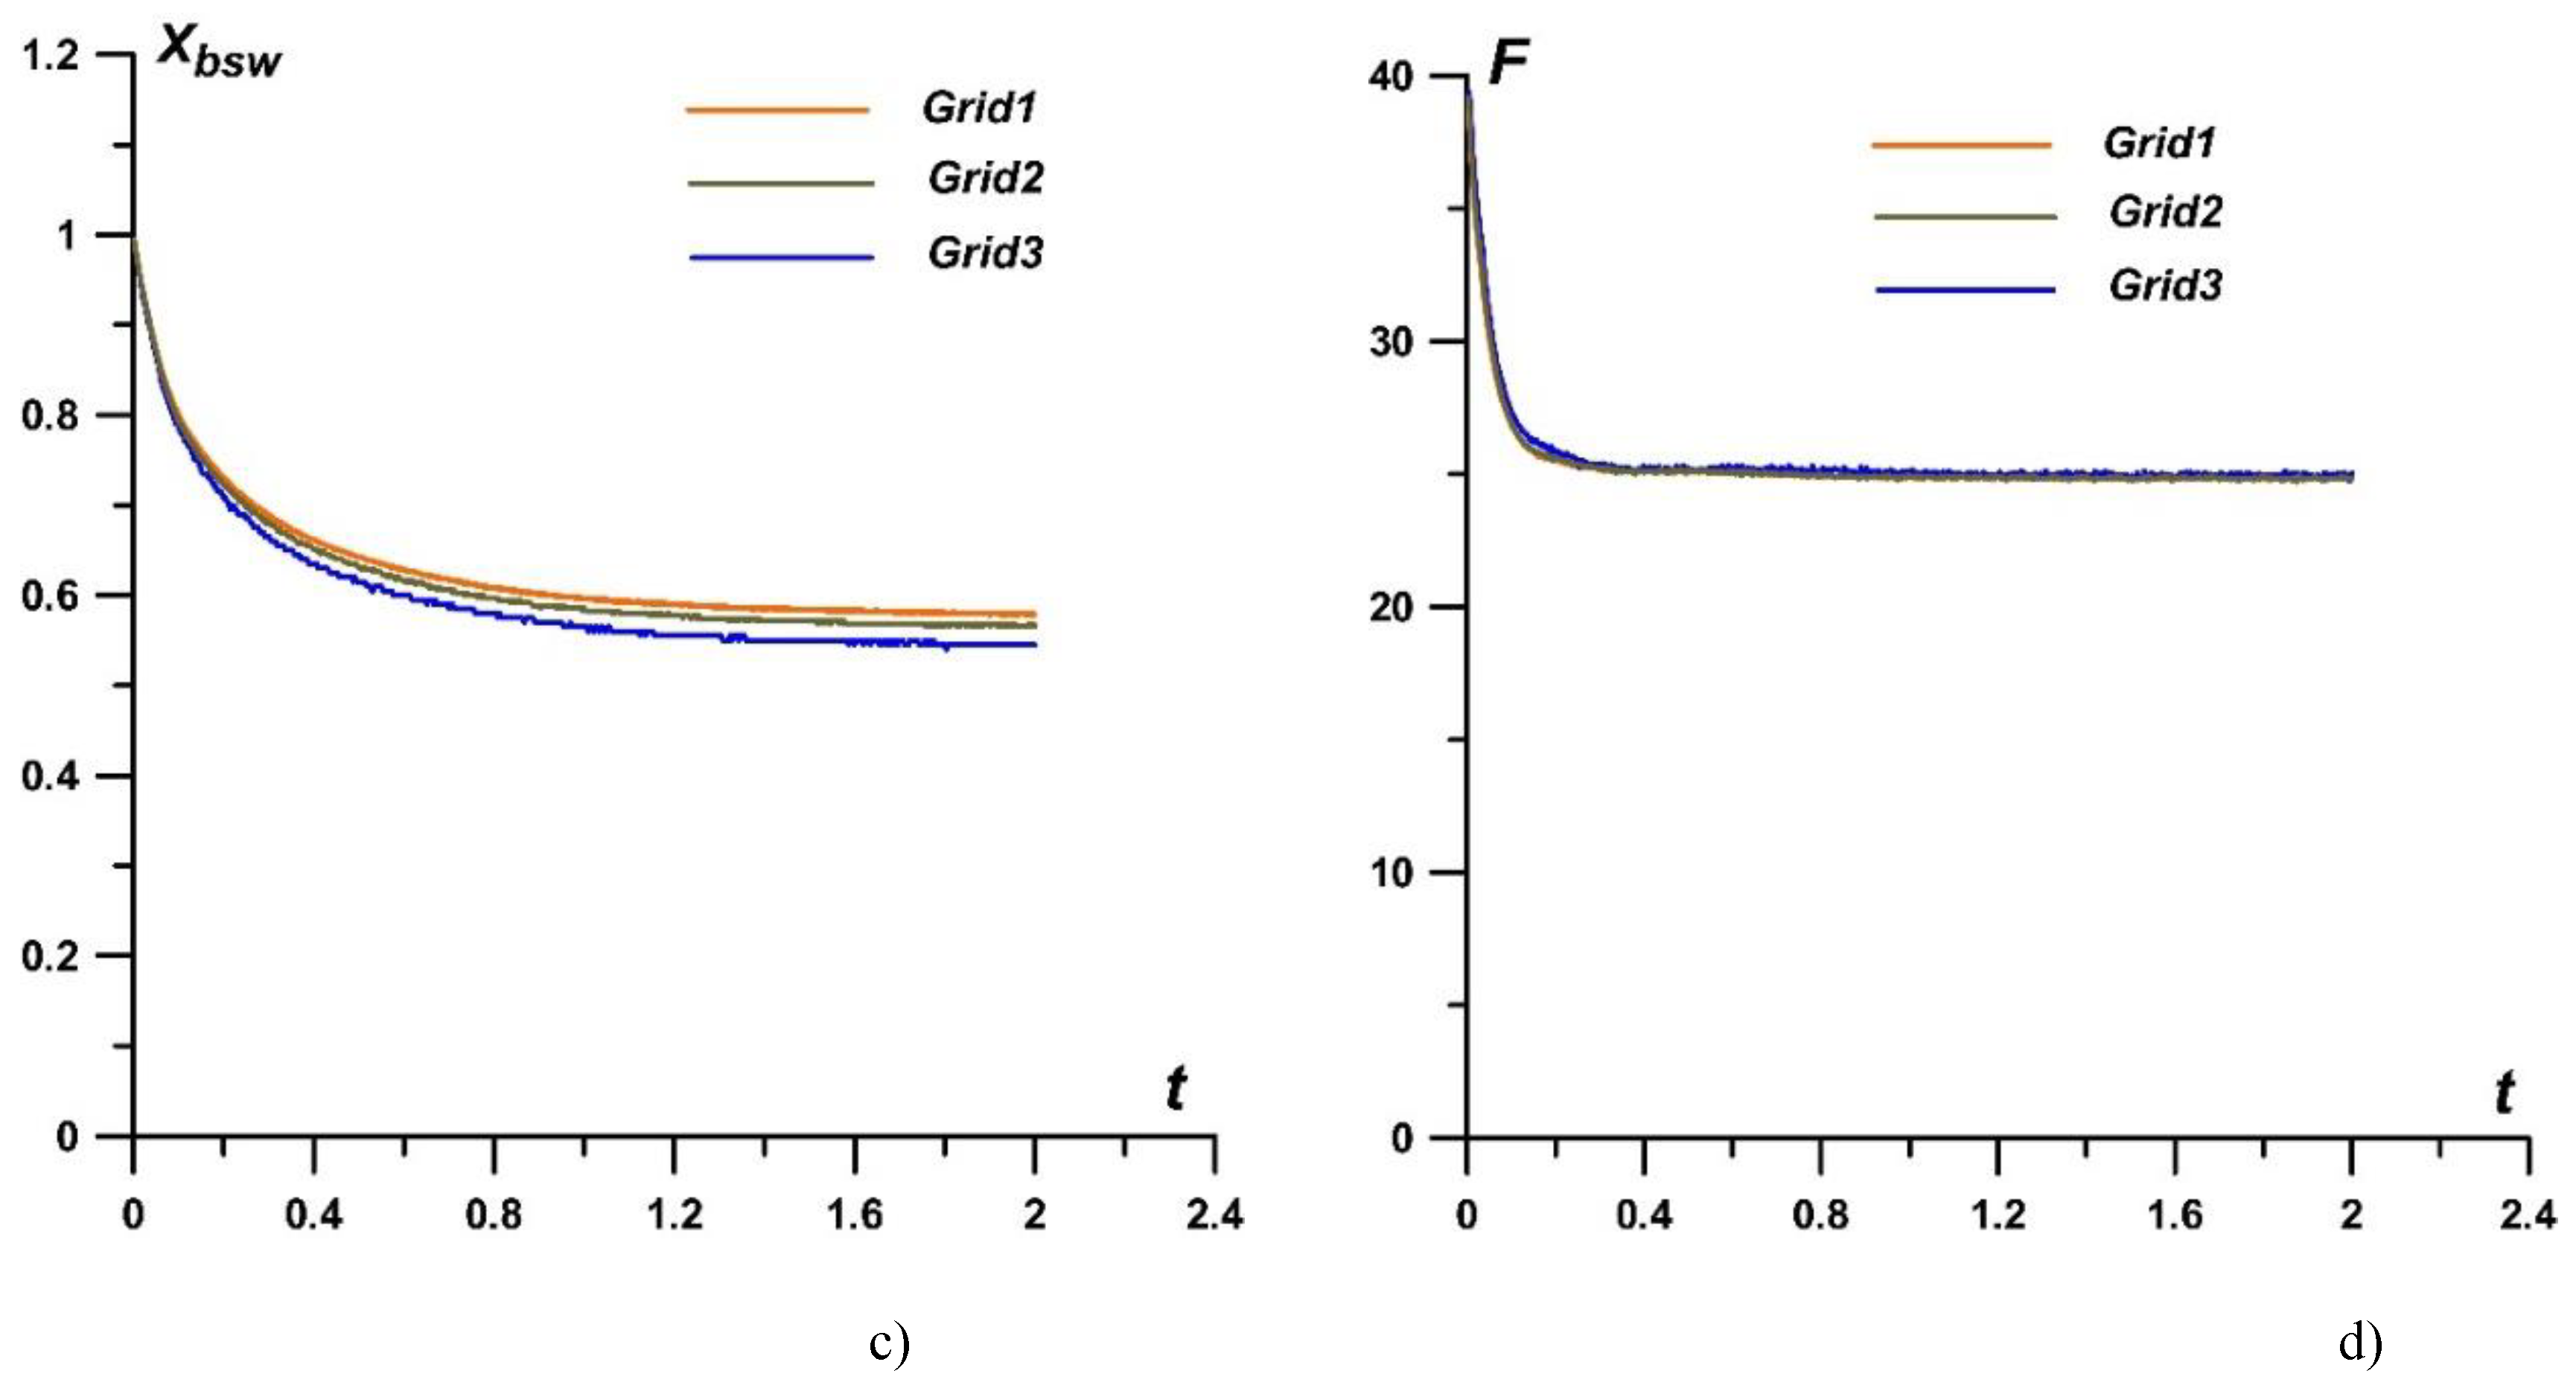
Figure 14 shows the dynamics of density and pressure at the critical point, ρ
t and
pt (at the center of the cylindrical surface of the body) (
Figure 14a and 14b), as well as the
x-coordinates of the bow shock wave
Xbsw and the drag force of the frontal surface
F (
Figure 14c and 14d) in the process of establishing a steady-state flow regime. Relative errors for the stagnation parameters are presented in
Table 2. These results also confirm the presence of grid convergence for the used configuration of the numerical experiment. In the calculations the Grid1 (
hx=
hy=0.001) is used.
3.3. Results of the Simulations
The defining flow parameters used in the experiments and simulations are presented in
Table 2.
In
Figure 15, a comparison of the experimental image and numerical flow picture in isochors for the quasi-steady flow mode in the absence of the discharge impact is presented. The calculations are conducted with taking to account the initial ionization of the flow near the body behind the bow shock wave, γ=1.217, γ
s=1.258 (
Figure 15,
Figure 16,
Figure 17 and
Figure 18). At the stagnation point the difference between the numerical and theoretical values (calculated using the Bernoulli relation) is 2.476% for density and 0.014% for pressure. We used the criterion for the evaluation of the relative errors in a form:
where
ft and
ft theor are the calculated value in the center point of a cylinder surface and the theoretical one.
Difference between the experiment and numerical values of the relation of the body radius to the stand-off distance (at the axis of symmetry), 0.5D/d is 15.8%. This difference, especially at the periphery, is related to the flow behavior in the expanding nozzle (and the approximately defined Mach number in the experiment). In this regard, in what follows we consider not the absolute, but the relative standoff of the bow shock wave from the body, focusing on the parameters on the axis of symmetry.
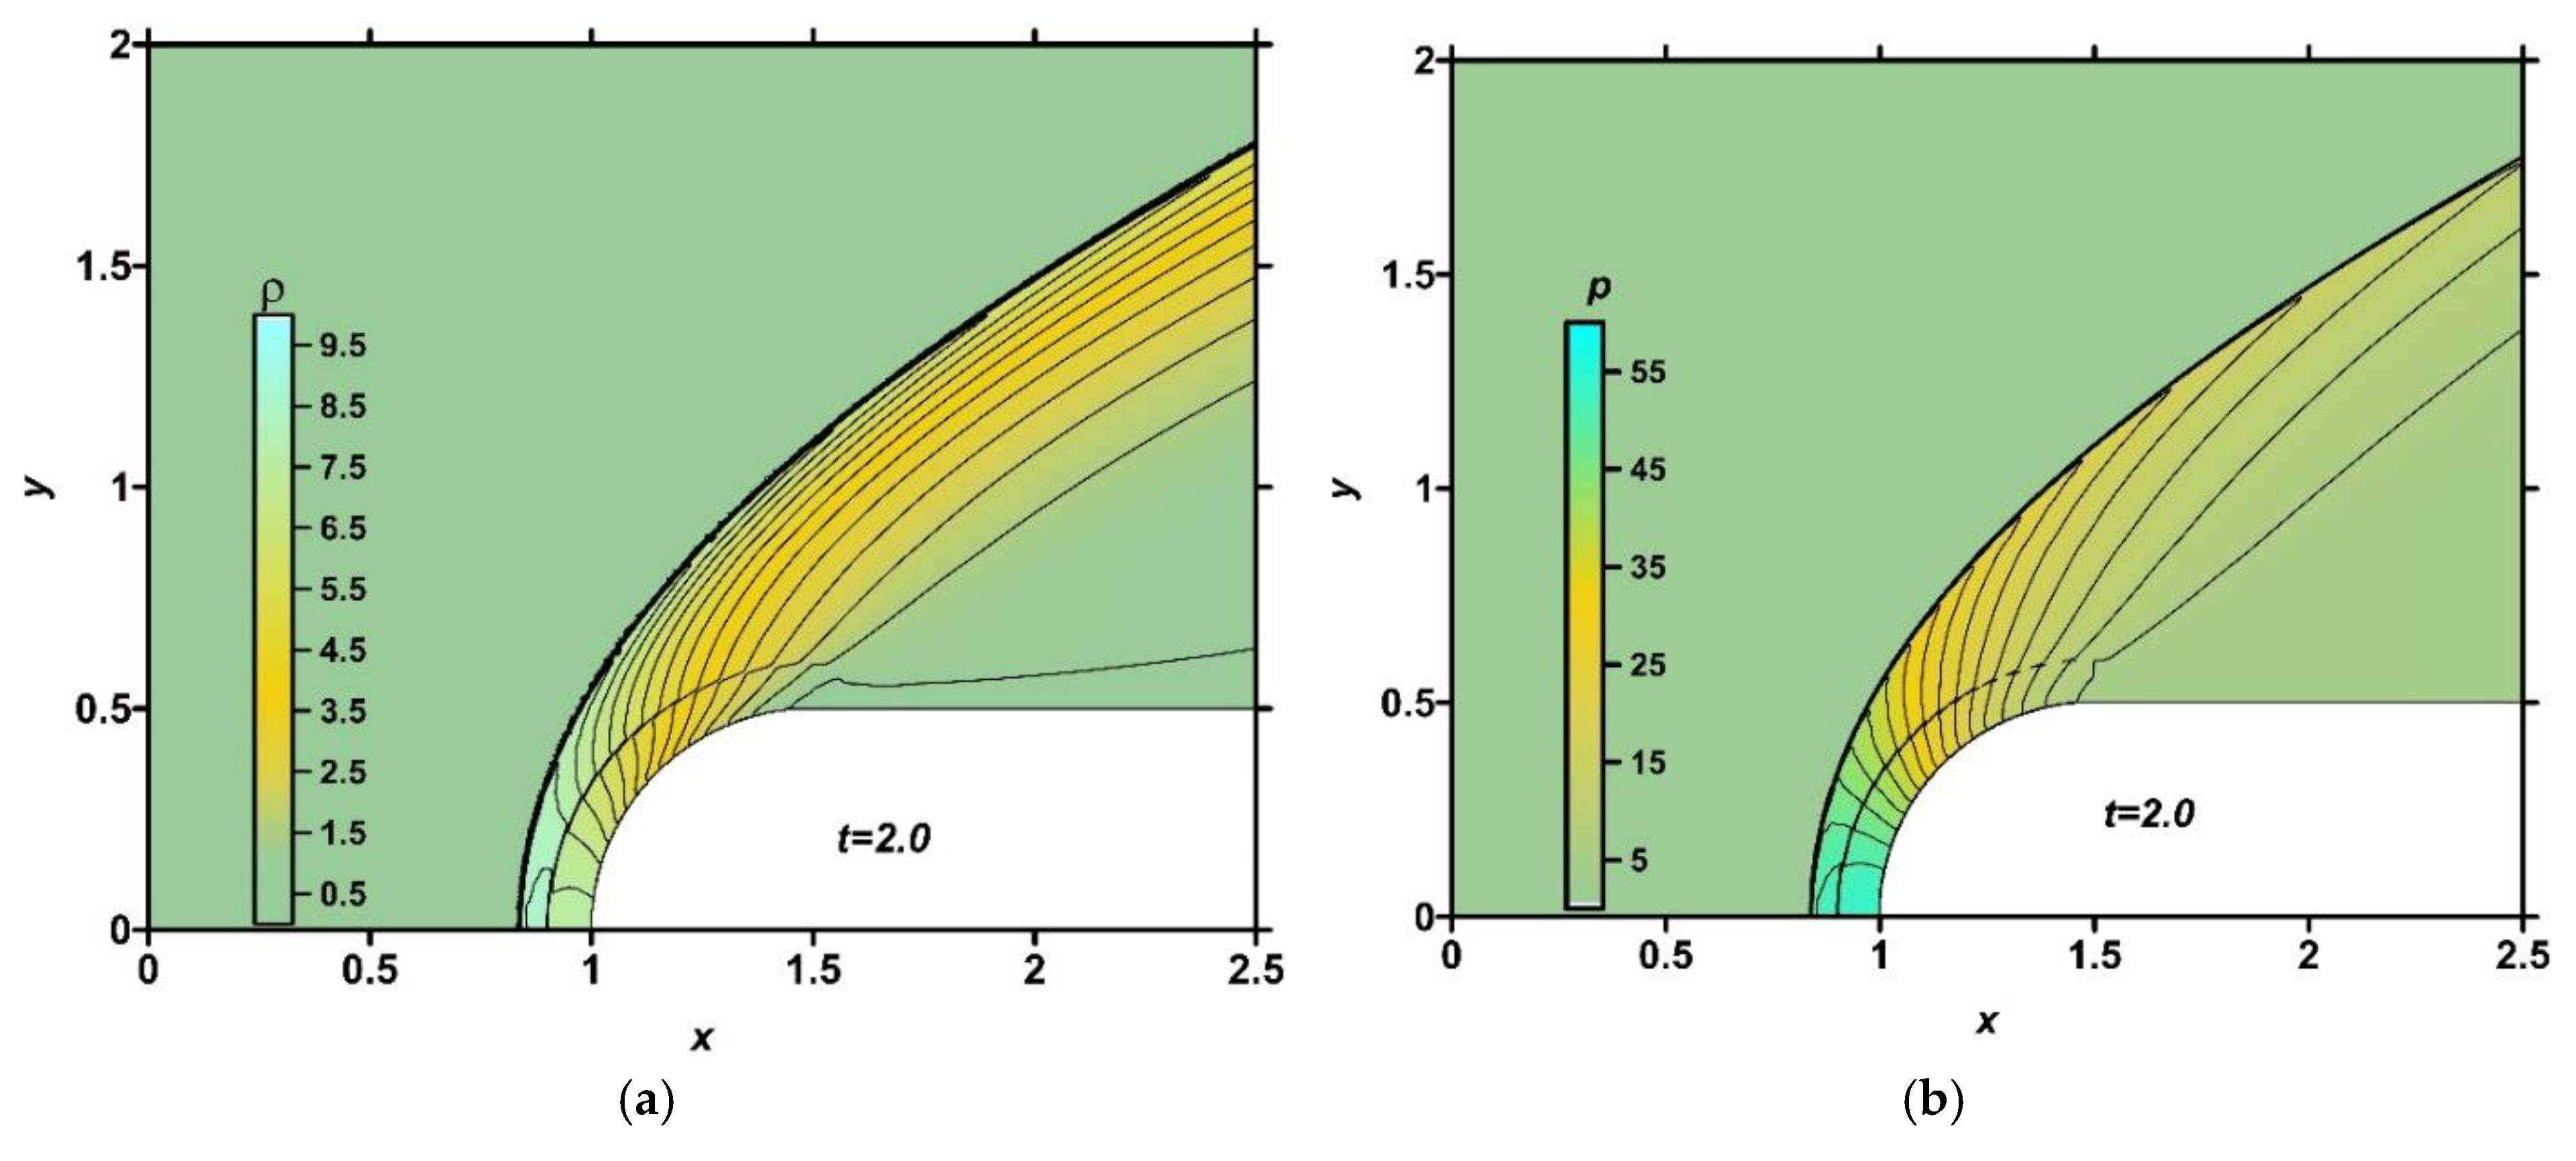
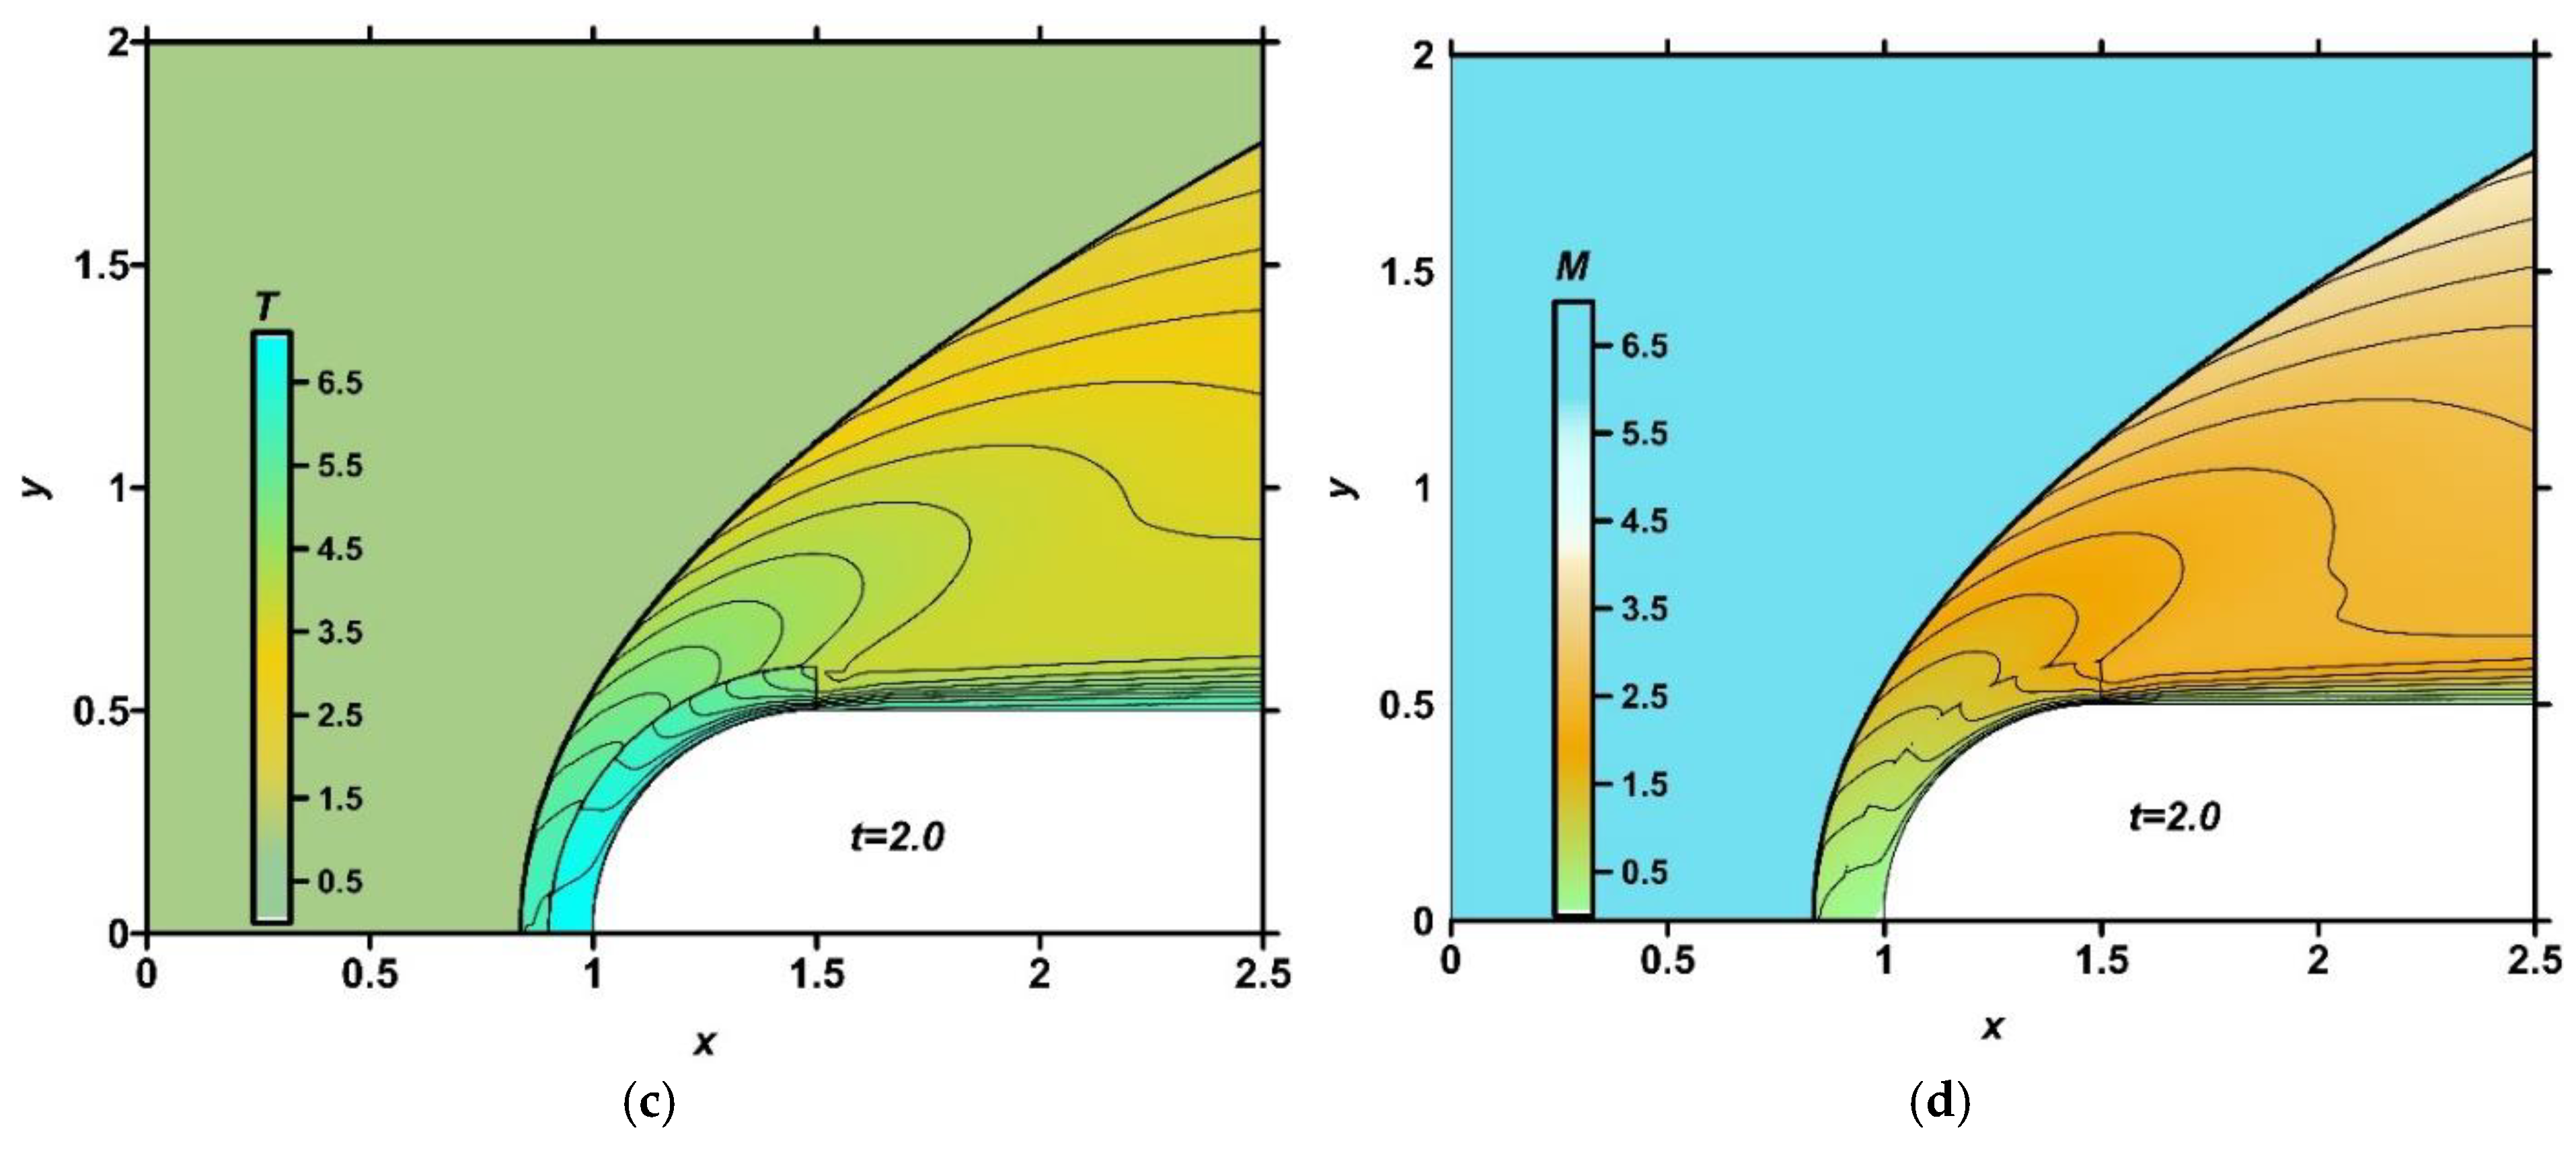
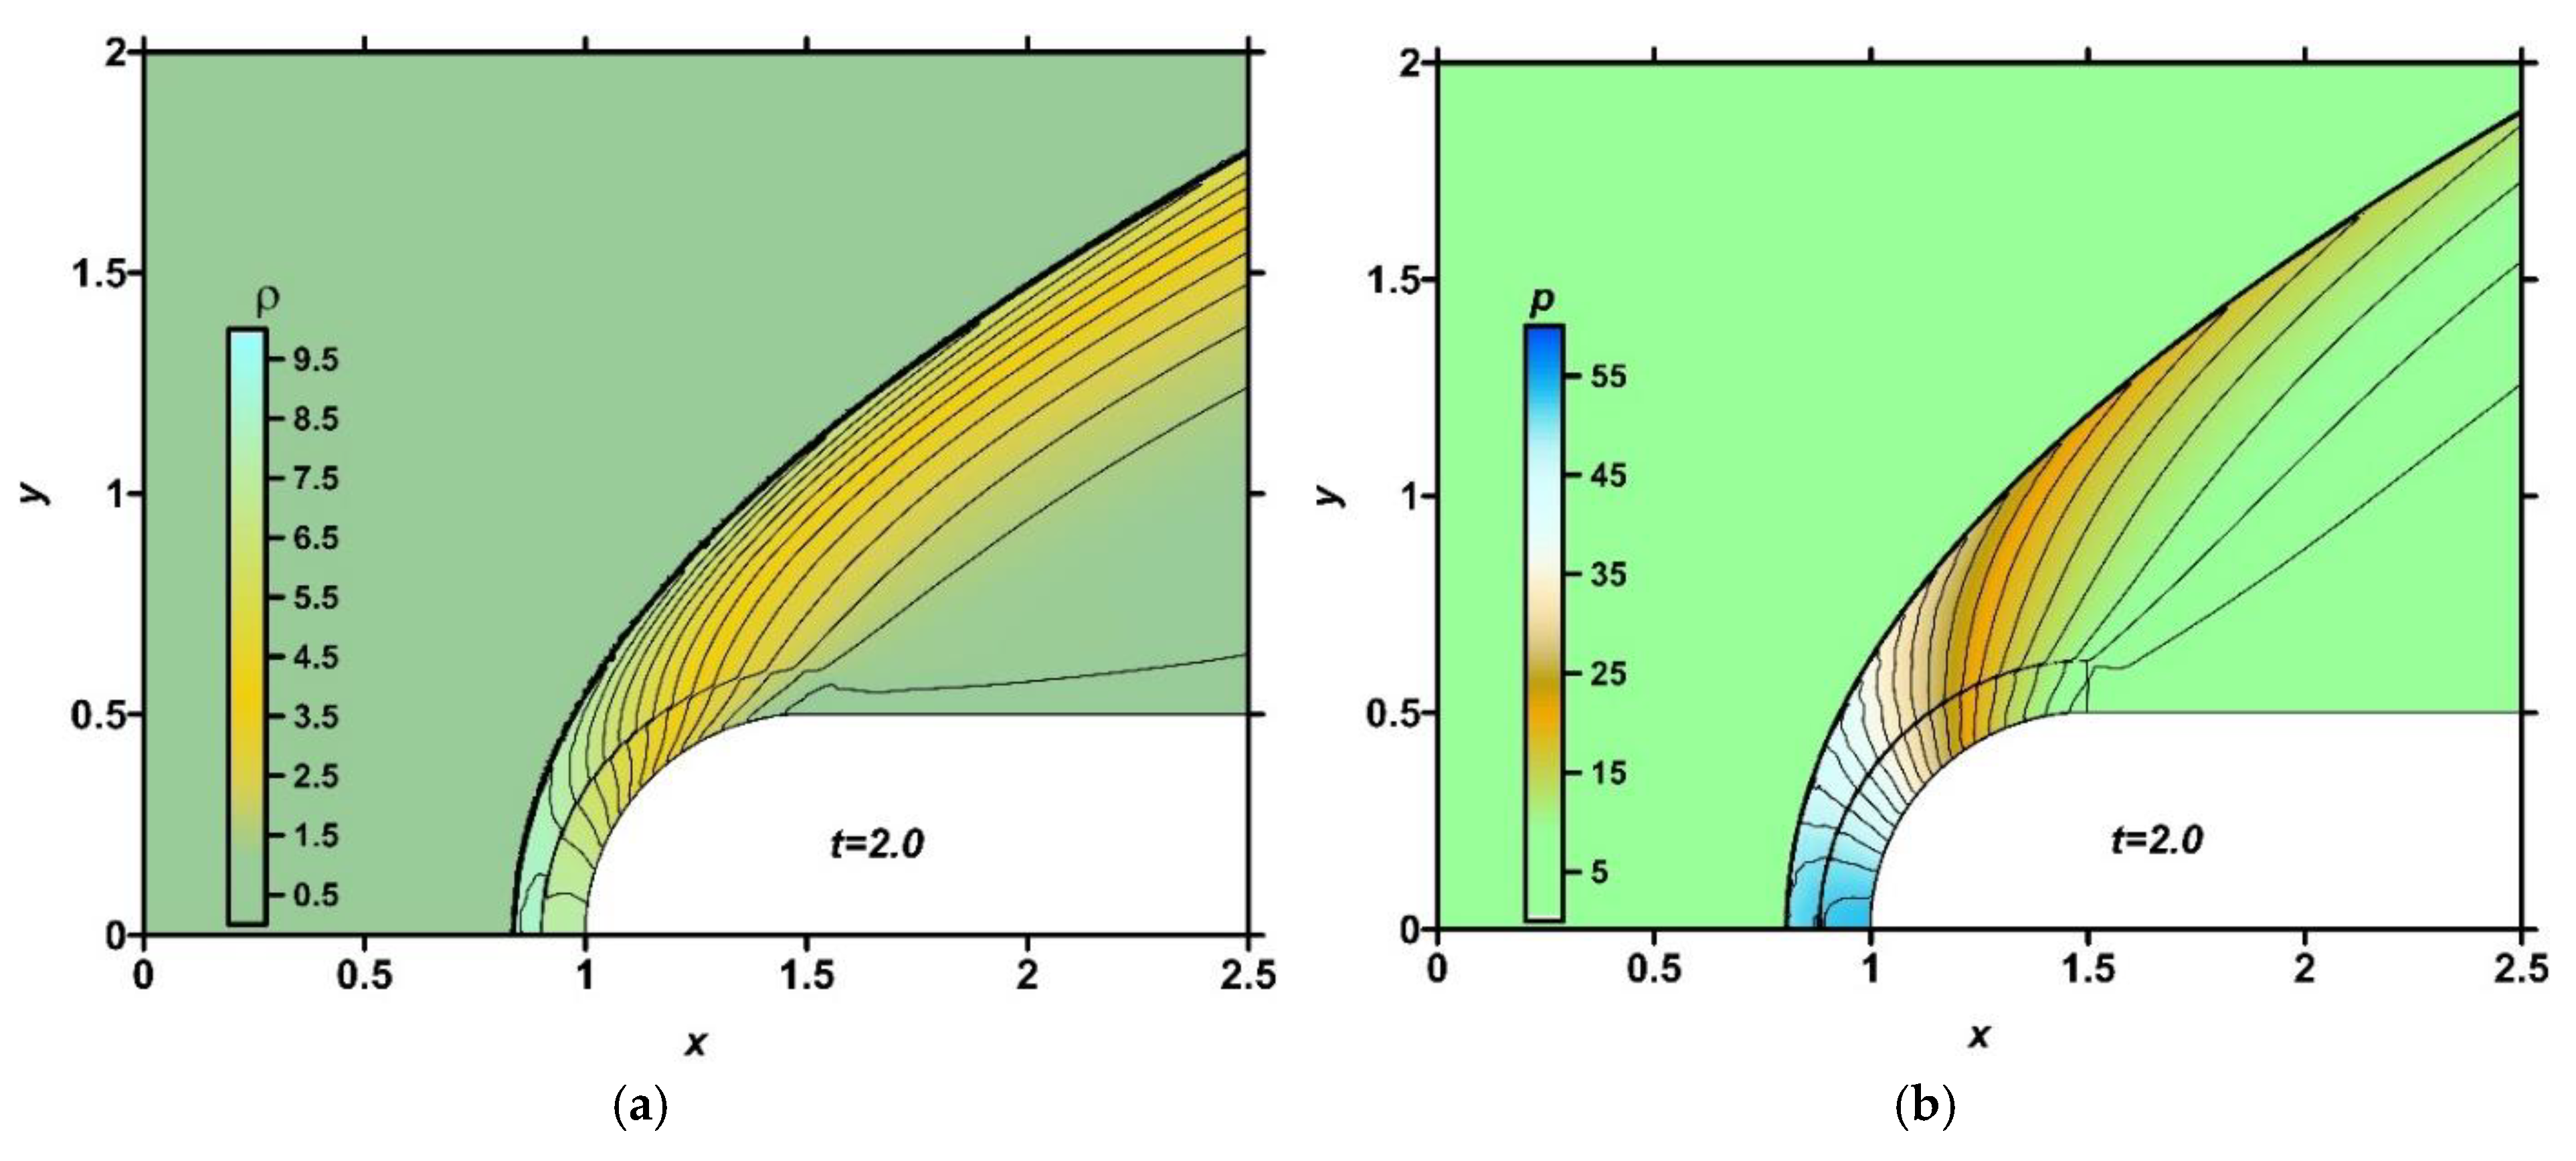
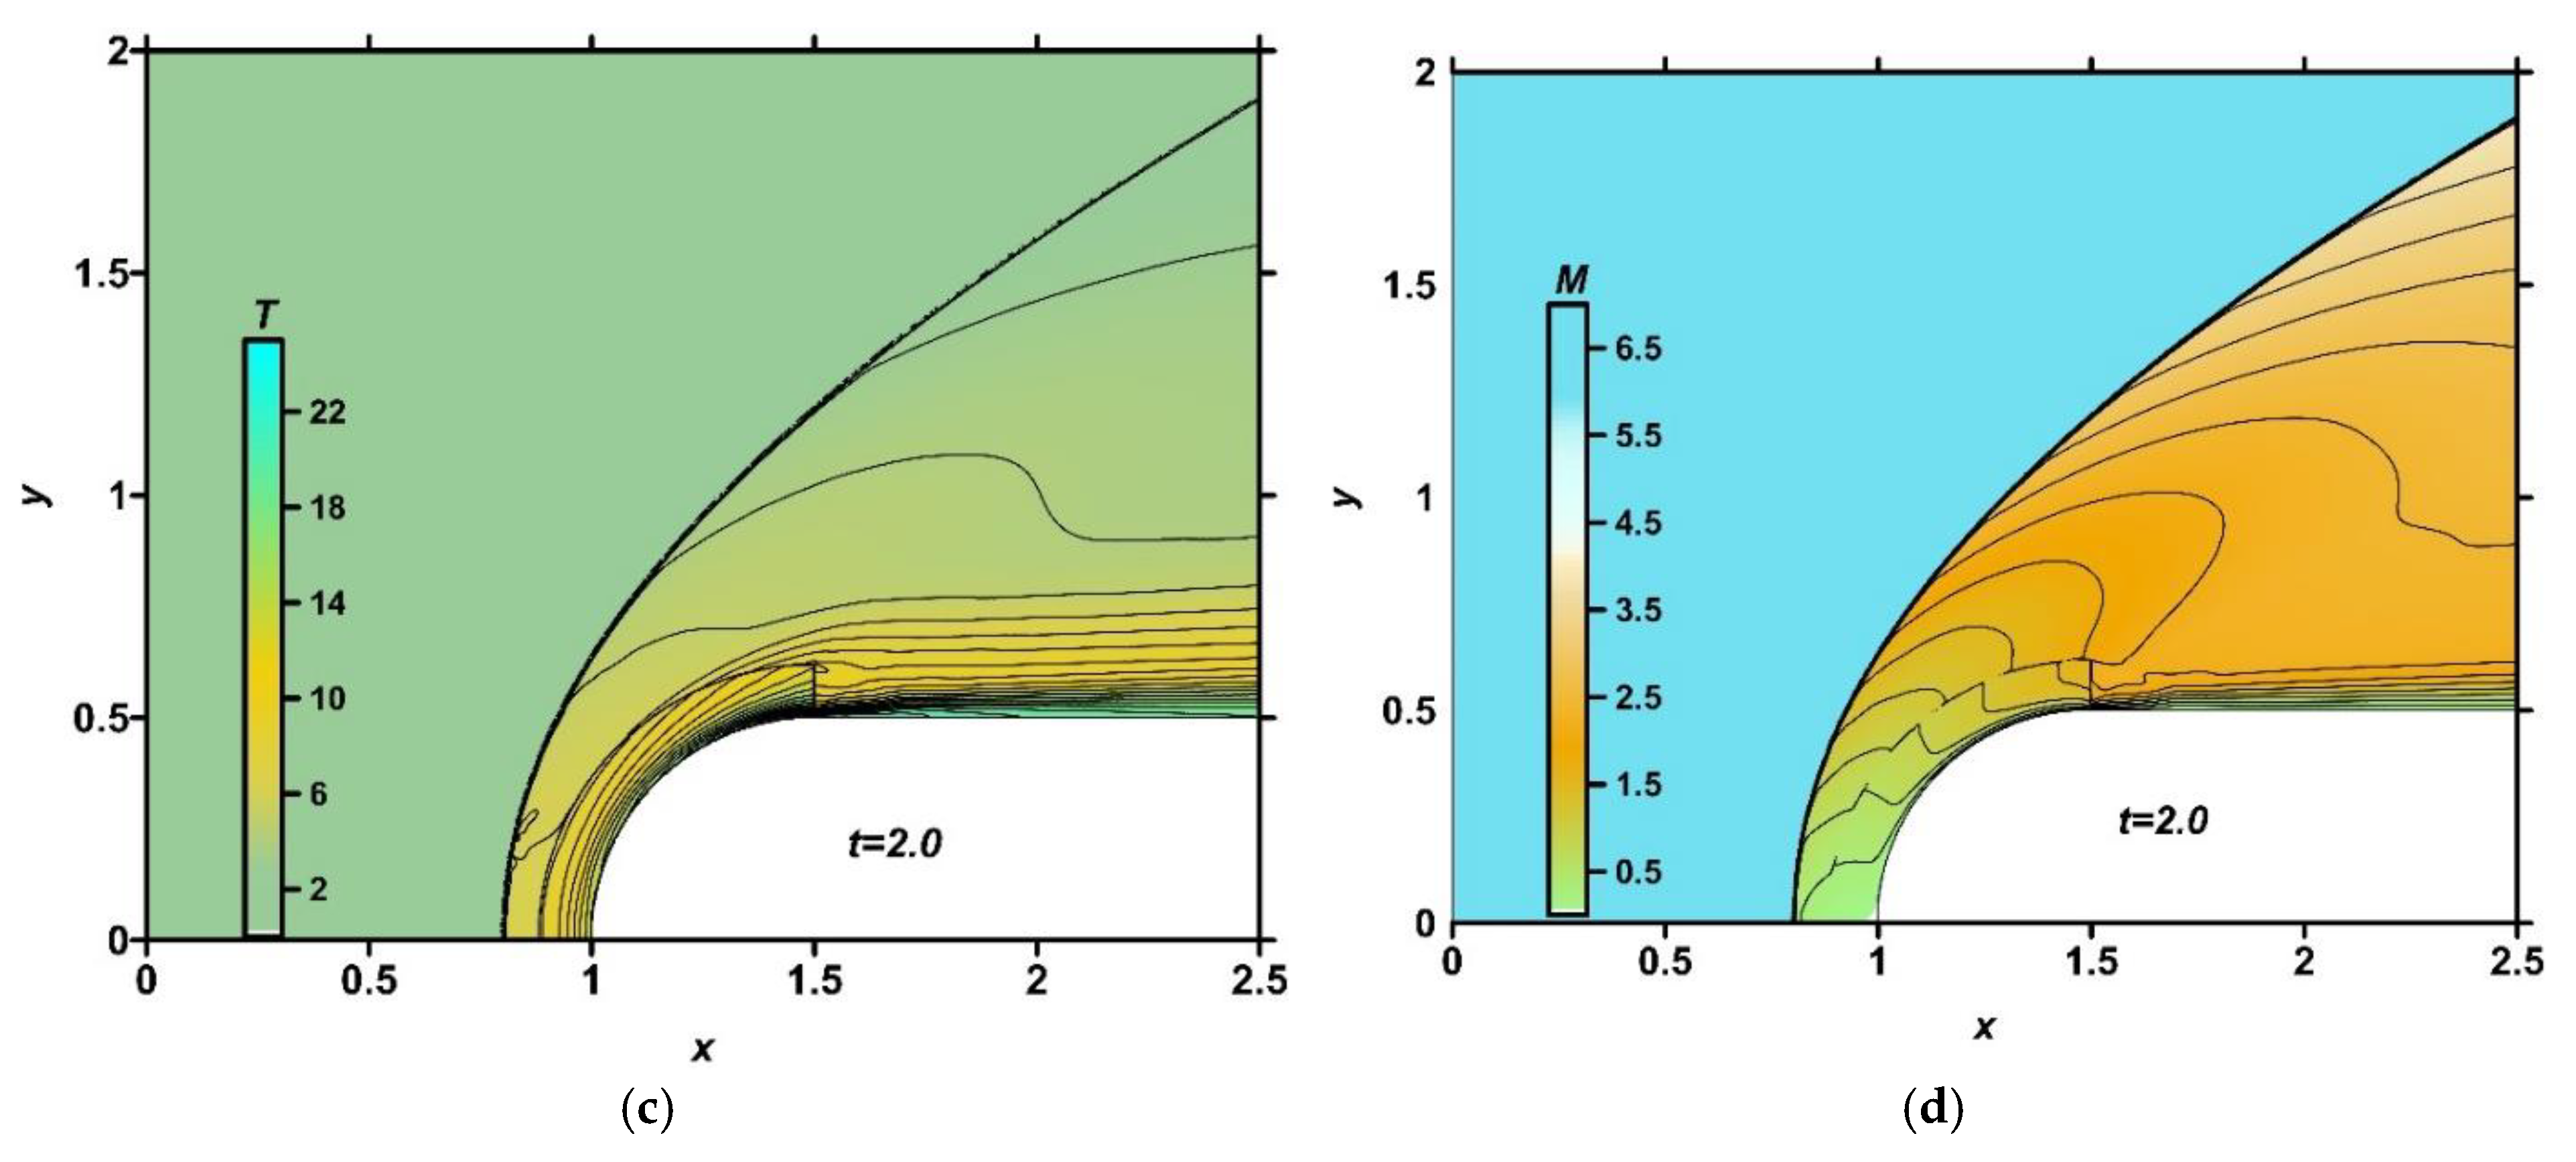
In
Figure 16, the numerical fields of density, pressure, temperature, and local Mach number are presented for the steady flow mode (
t=2.0) at
q=0 (absence of the discharge). It can be seen that the initial ionization influences the flow temperature to a greater extent than to other parameters.
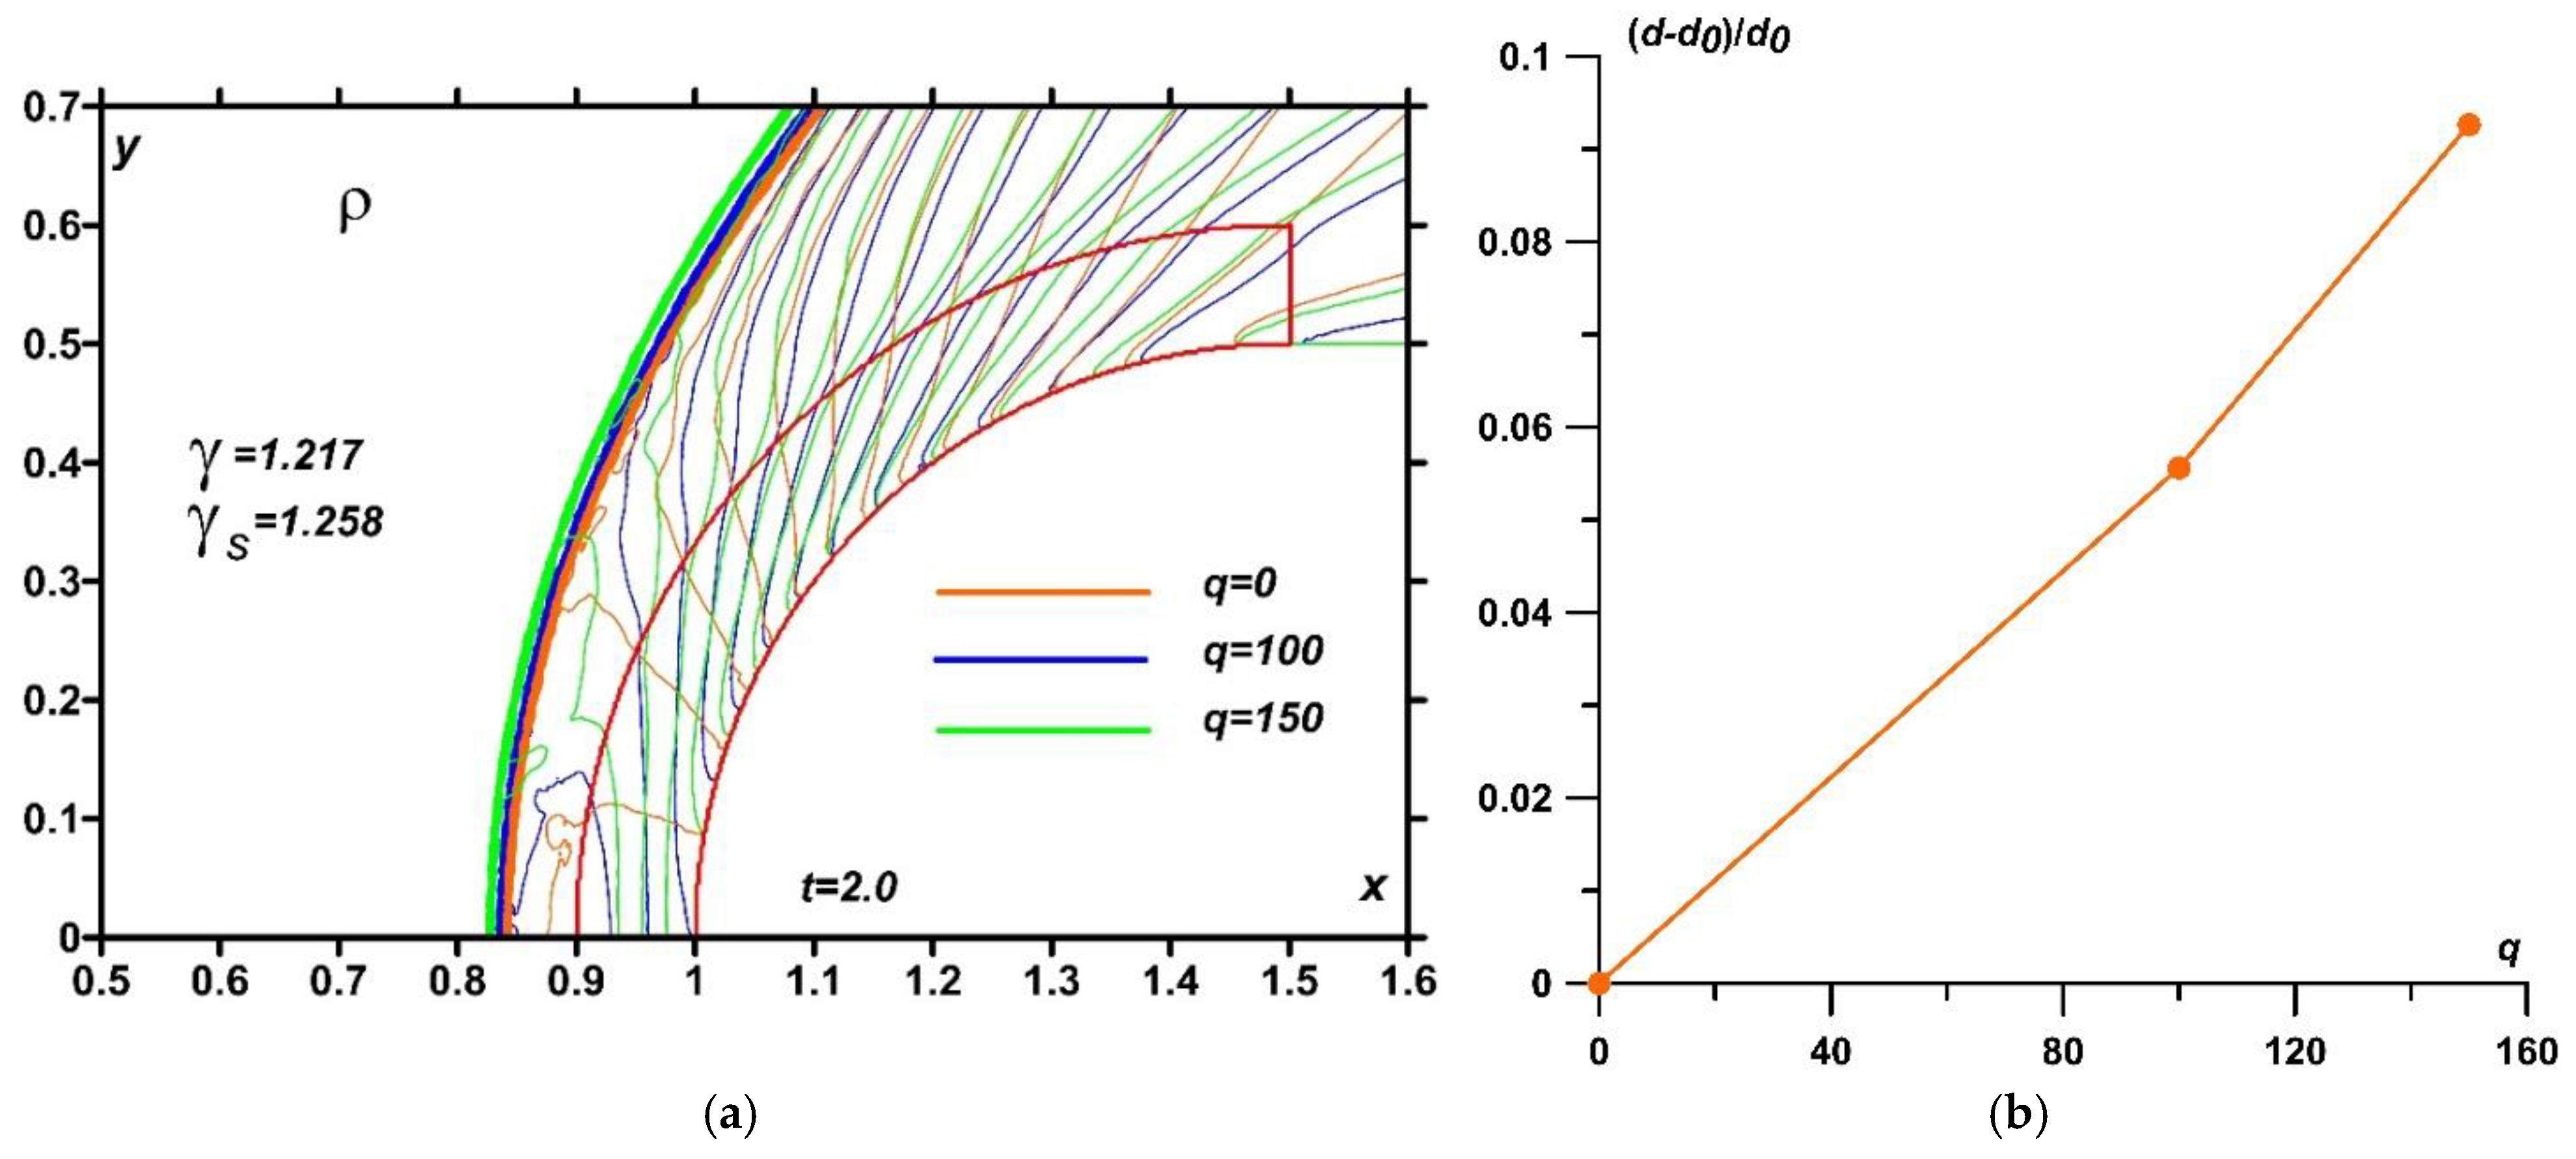
Figure 17 illustrates the results of simulations of the influence of the near-surface discharge energy impact zone the position of the bow shock at the steady state (
t=2.0). Here we consider the case with the influence of the changed adiabatic index in the plasma region, γ =1.217, γ
s =1.258. In
Figure 17a, the density fields for different values of the specific power are presented for the steady flow. It can be seen that the steady bow shock wave stand-off distance is greater for higher values of the specific power
q.
Figure 17b shows the dependence of the relative bow shock wave distance on the specific discharge power
q. The mechanism of such a phenomenon is described in [
26] for an air flow. This influence is connected with the fact, that the bow shock wave, during its formation, is moving throw already exsisting plasma heated area (due to the difference in time scales of the discharge plasma zone formations and gas dynamic processes). Thus, the parameters of the discharge zone influence the parameters of the forming bow shock wave at the unsteady stage, and as the result, at the steady stage, as well.
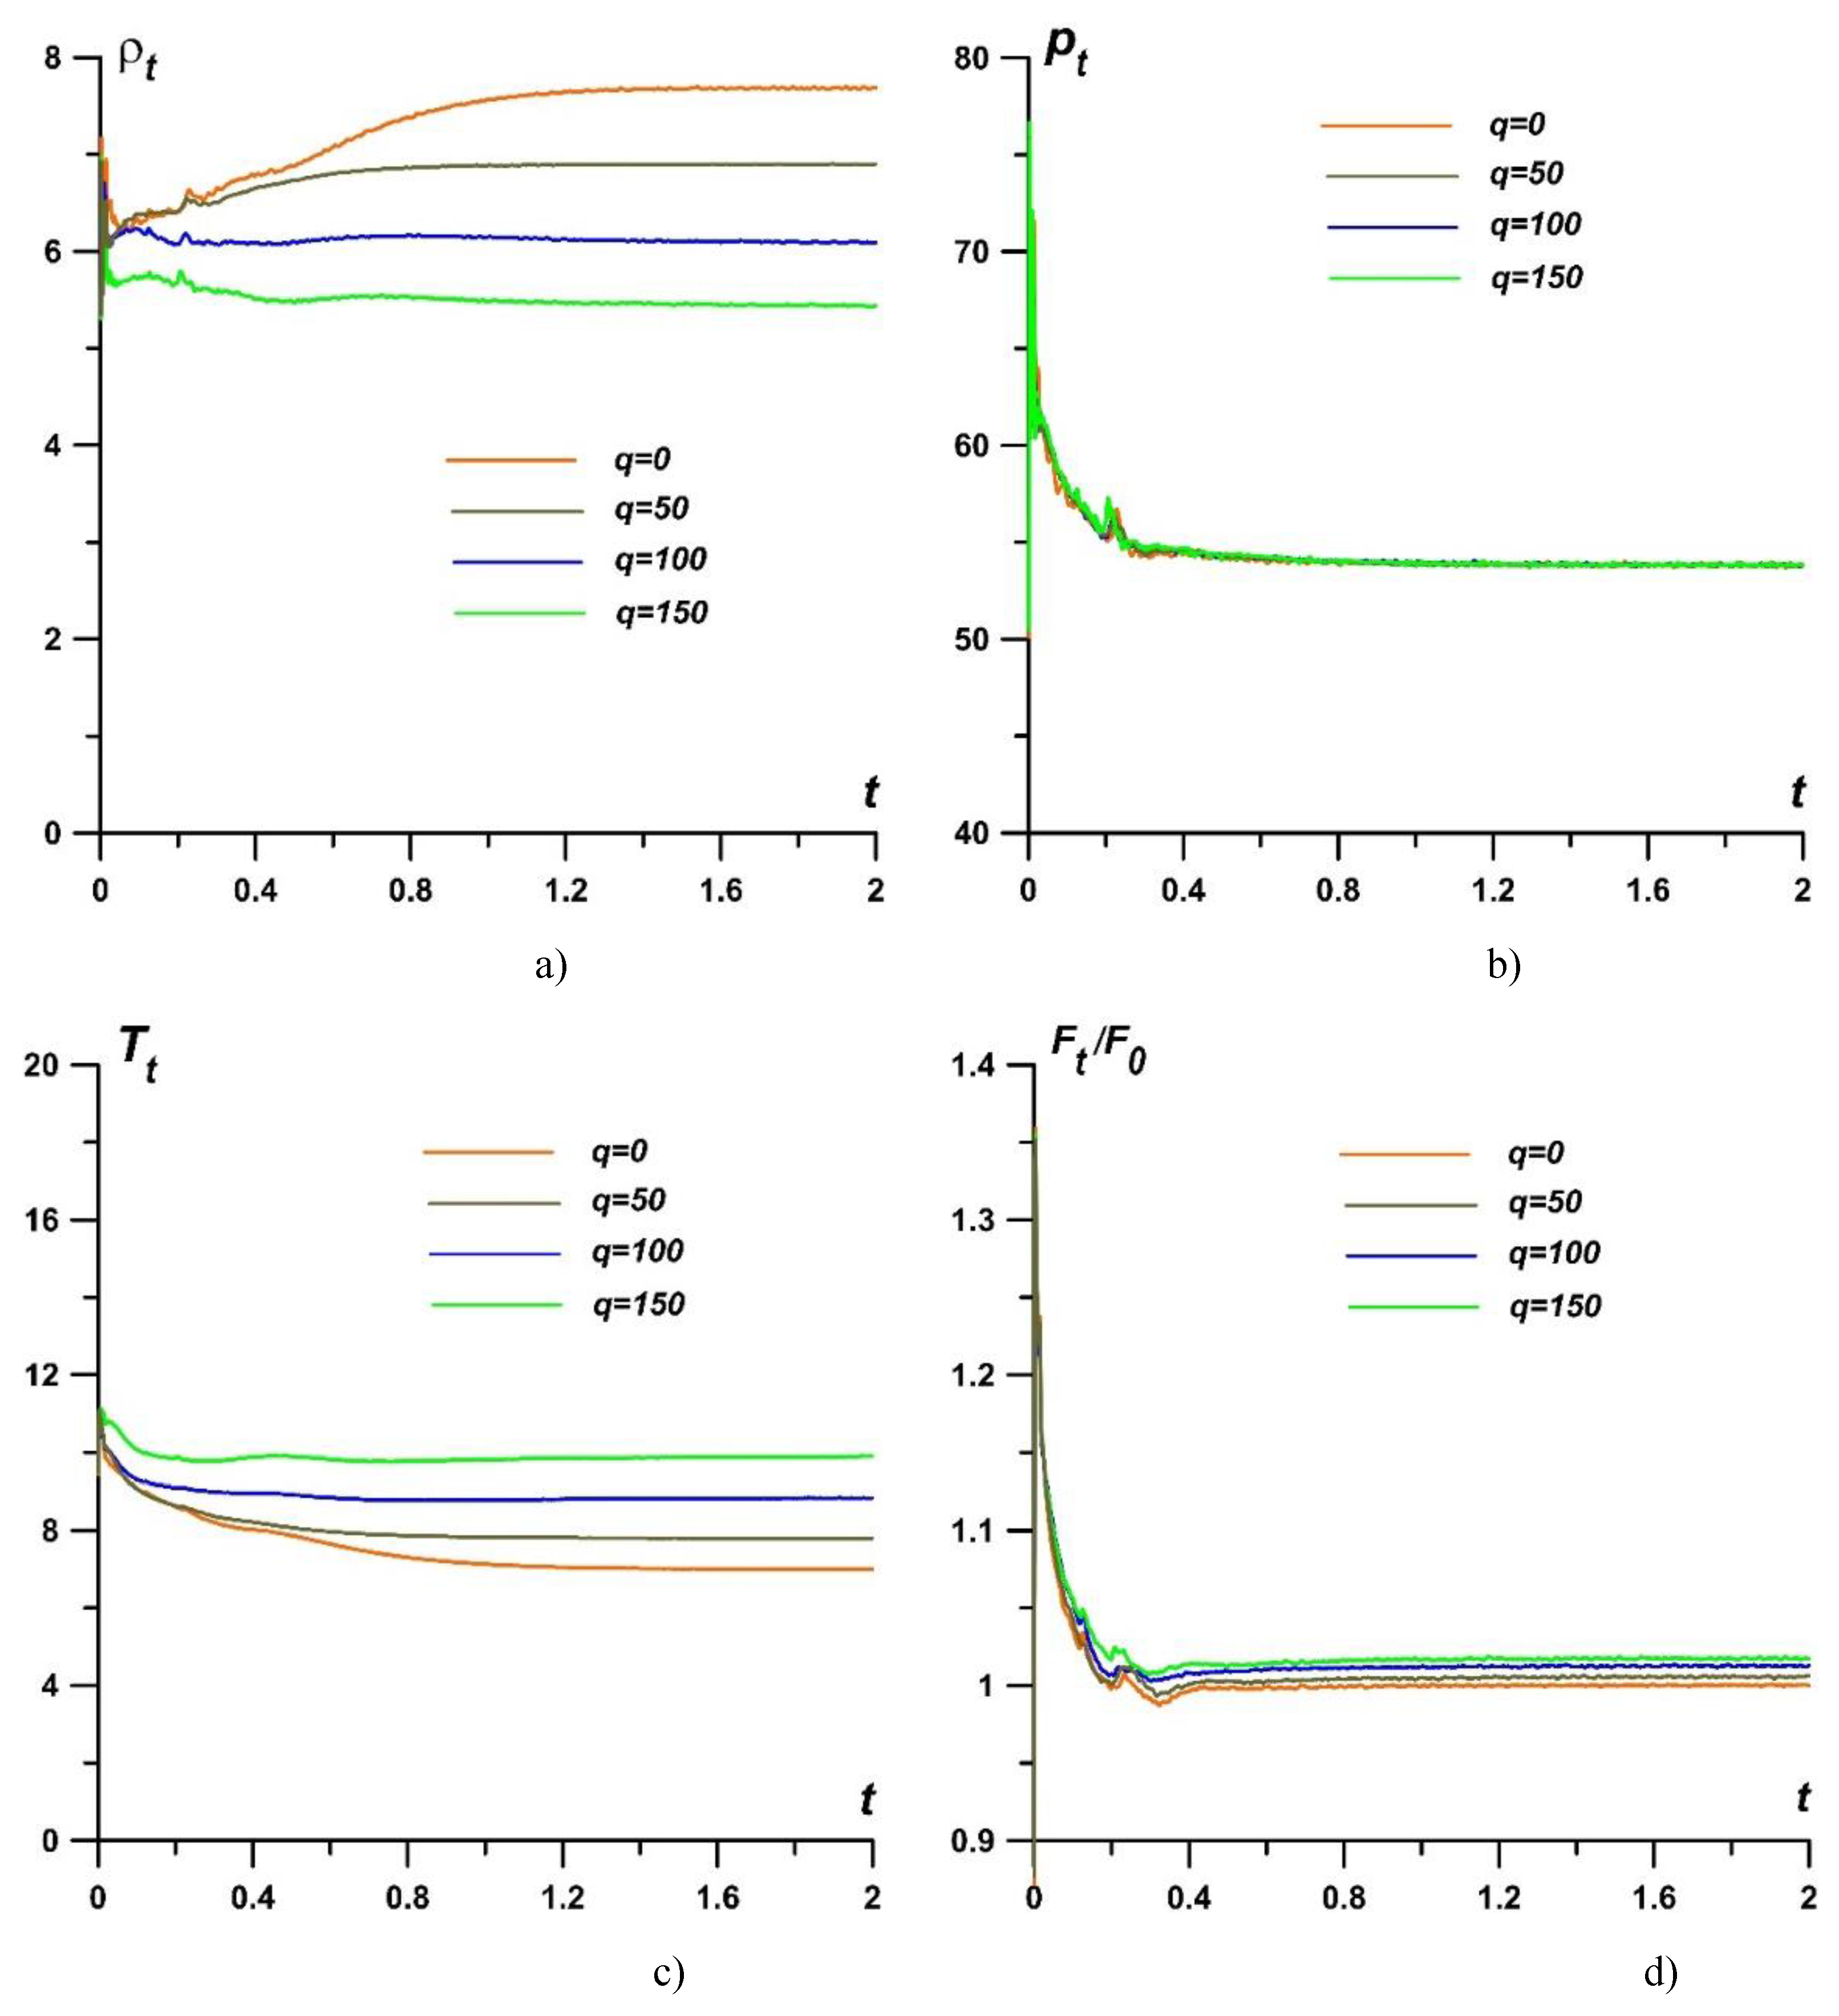
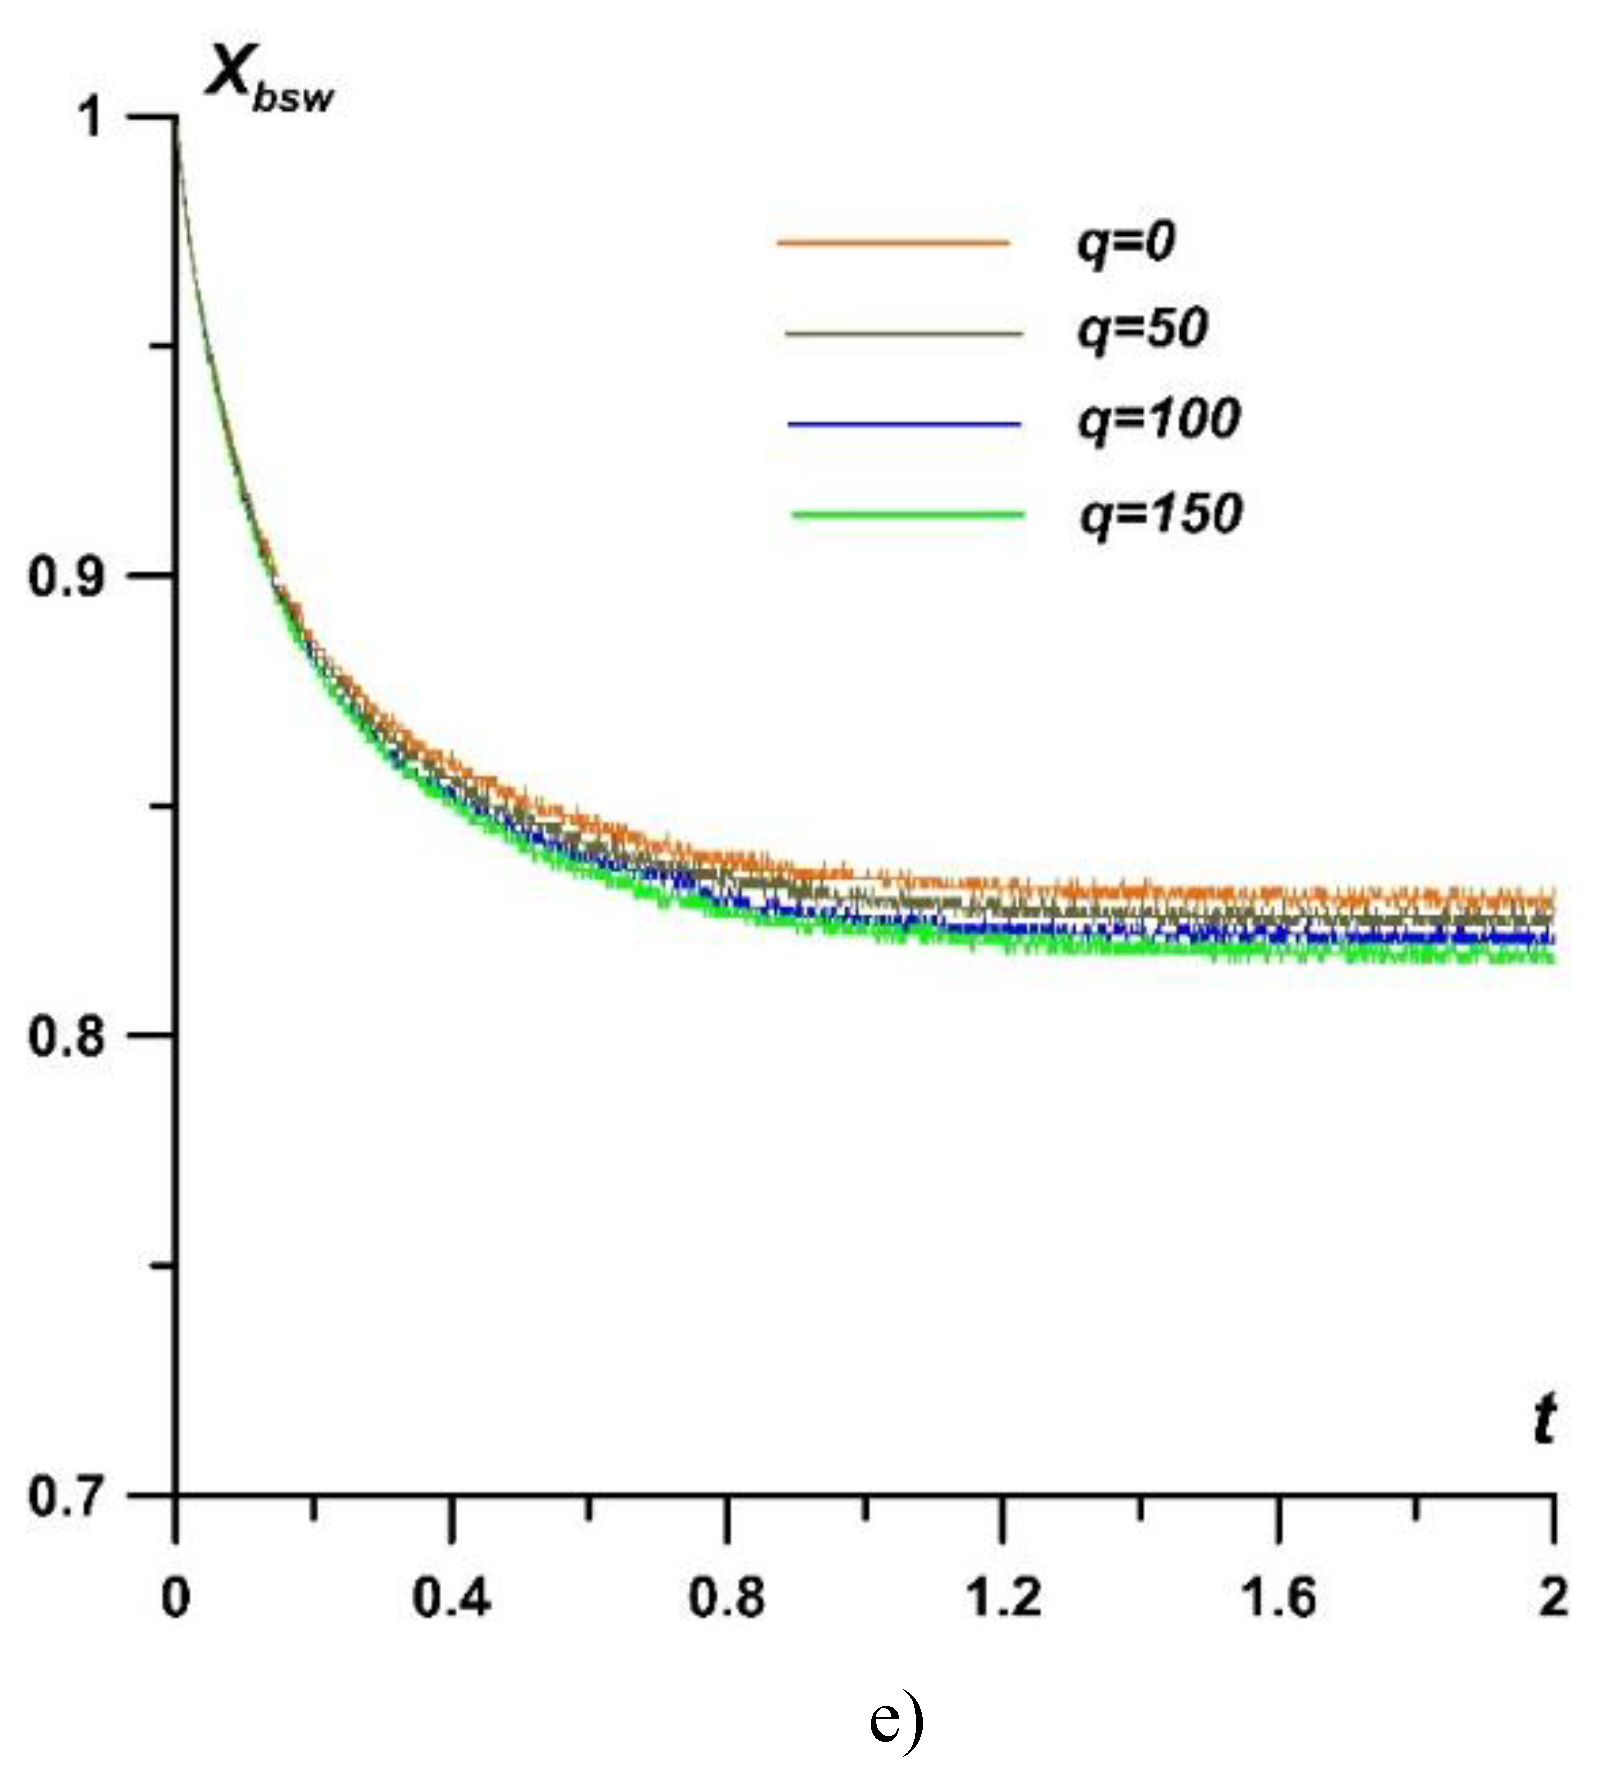
Figure 18 illustrates the dynamics of density, pressure, temperature, and the relative drag force
F/
F0 during the establishment of their stagnation values at the central point of the semi-cylinder for various values of
q. It is seen from
Figure 18(a)-18(c) that, at this point, pressure exhibits only slight changes with an increase in specific power
q, whereas the gas rarefaction significantly increases, resulting in a substantial rise in temperature. It should be highlighted that the relative drag force
F/
F0 acting on the front surface decreases overall with the increase in the stand-off distance of the steady bow shock wave; this force is greater for higher values of
q, as shown in
Figure 18d.
Here the drag force is
where
pb is the pressure value at the cylindrical part of the body’s surface,
F0 is the value of the drag force
F without energy deposition.
Figure 18e illustrates the dynamics of the bow shock front position for varying values of
q during the establishment of a steady flow. The position of the bow shock wave was determined by identifying the
x-coordinate that corresponded to the maximum value of
px at its front. Note that the fluctuations in the dependencies are due to the discreteness of the representation of the wave front in the difference cell, associated with the construction of the algorithm for tracking the front of the bow shock wave. Therefore, at the initial stage, when the bow shock is moving throw the region of the discharge plasma, the action of the energy source gradually increases the distance of the bow shock wave stand-off from the body, which is greater for higher values of the specific power. Subsequently, this increase affects the position of the bow shock wave in the steady state.
In
Figure 19, the fields of determining flow parameters (density, pressure, temperature, and local Mach number) are presented at
q=200 and γ
s =1.29 for the steady flow mode
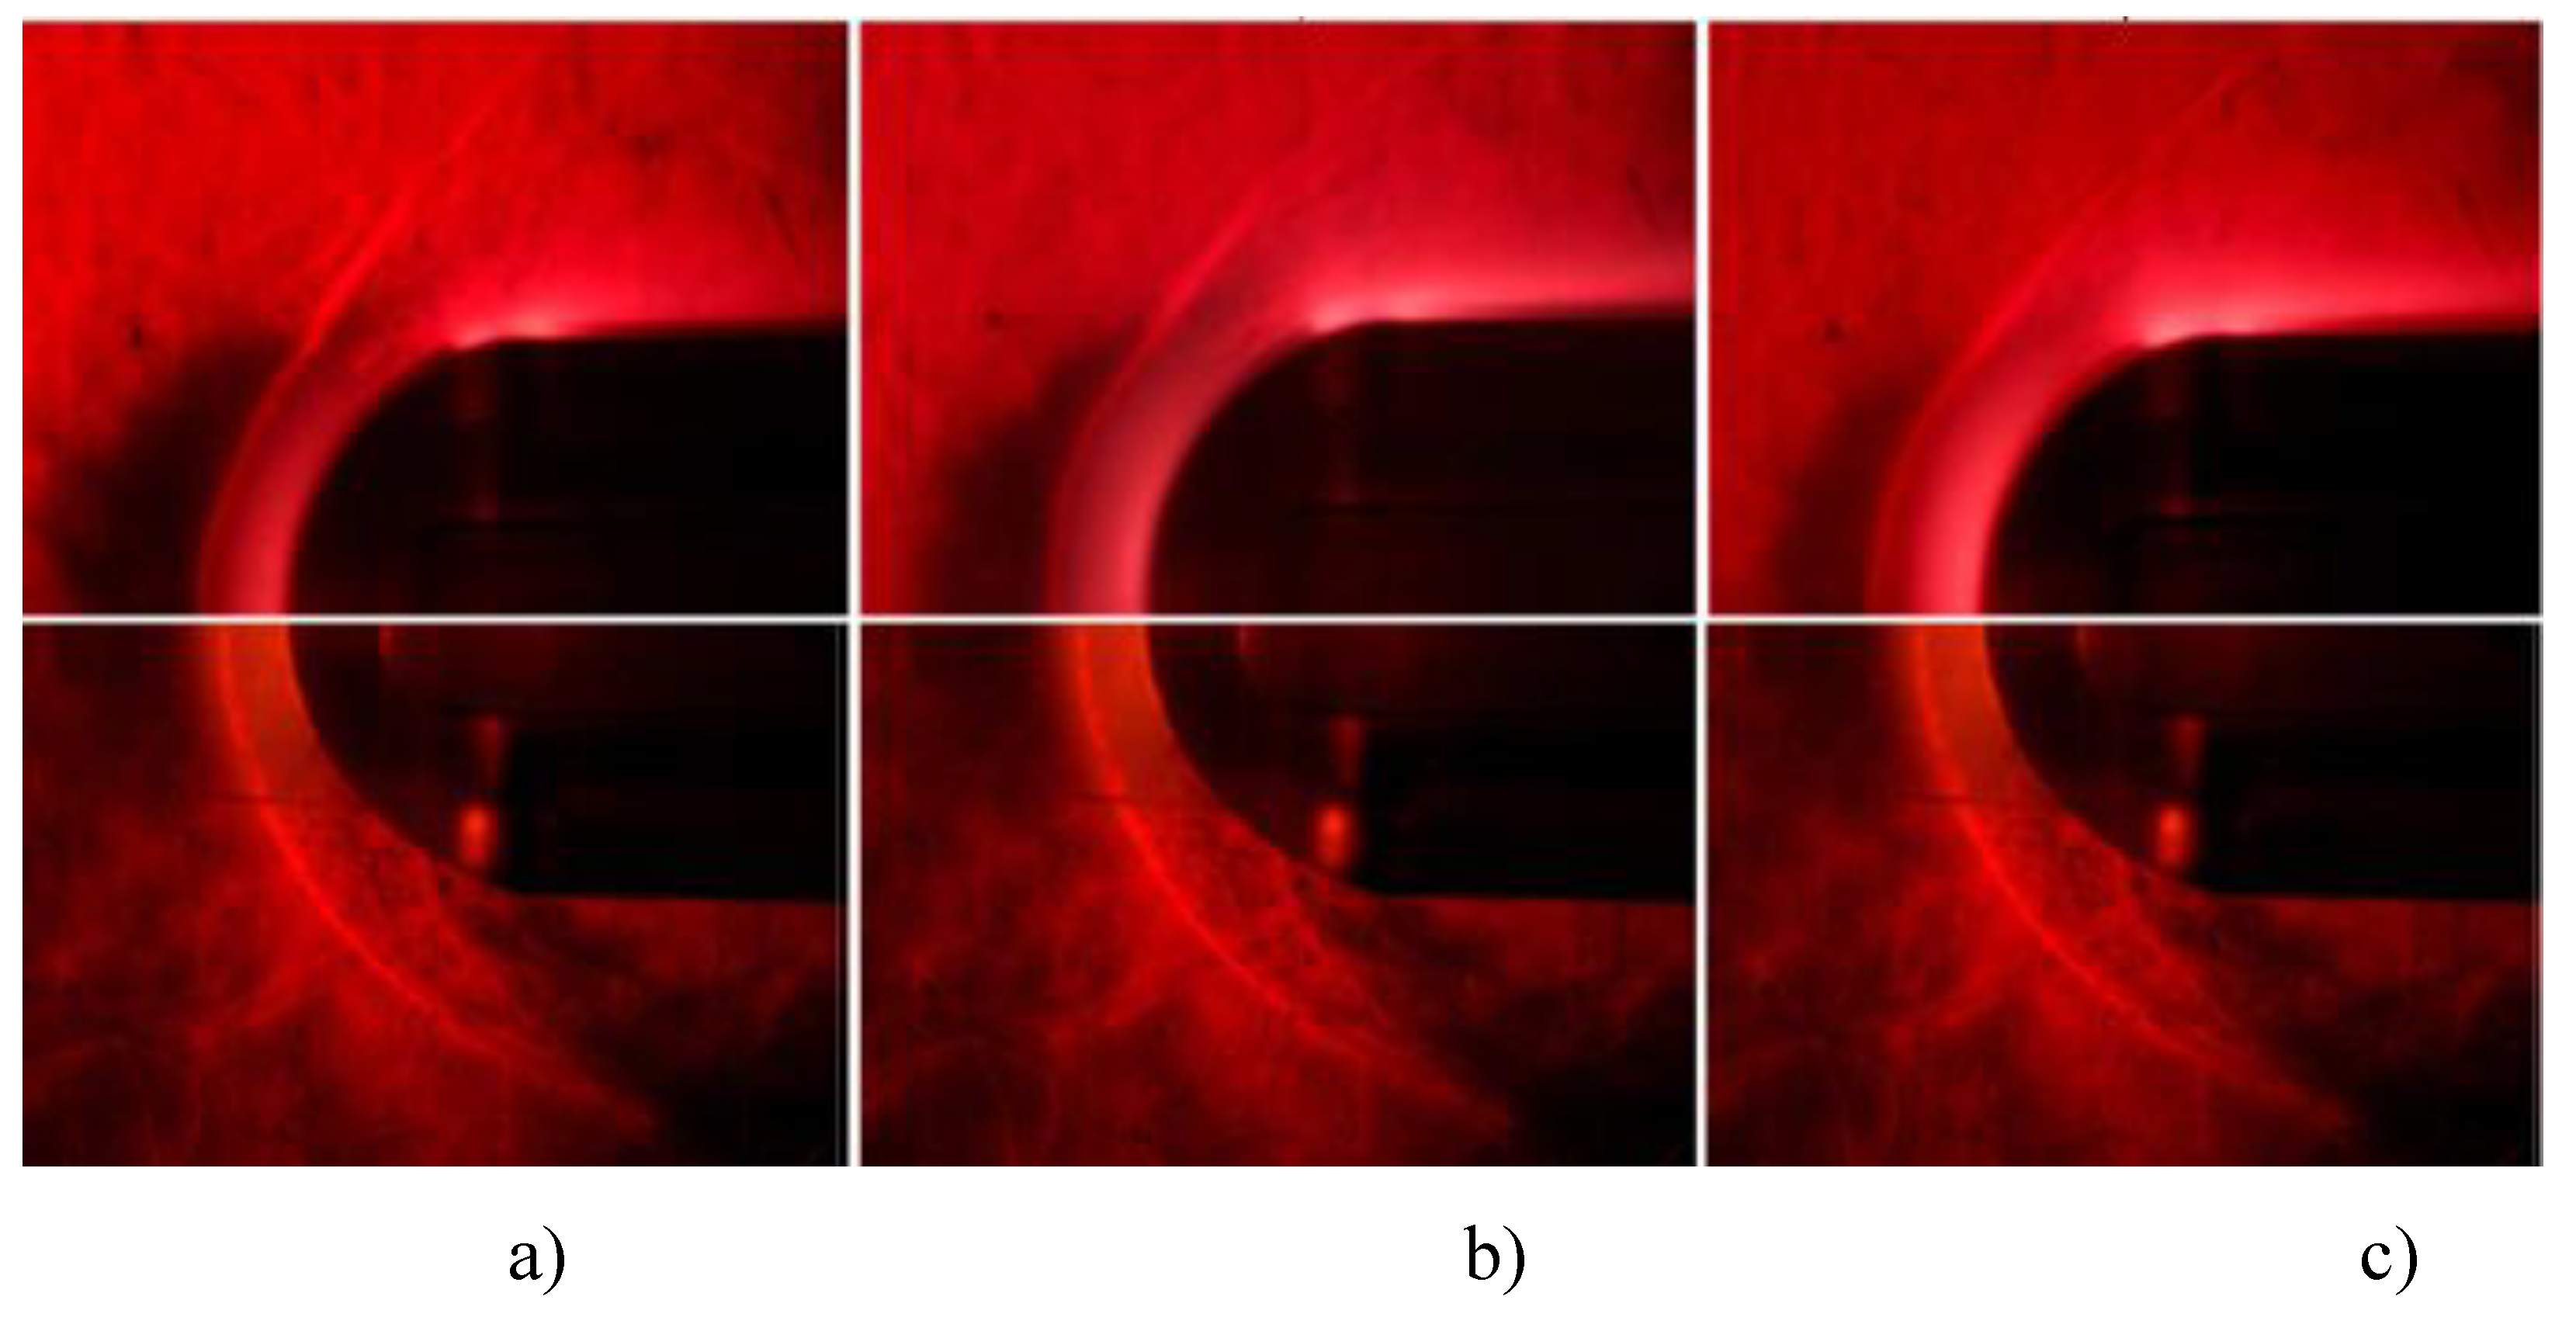
. This case is corresponded to the strongest influence of the discharge plasma zone on the flow. A region of compressed gas with increased pressure and temperature forms behind the bow shock wave front, as well as in a case of lacking an energy source. However, due to the deposition of energy, an adjacent region of less dense gas is created in the vicinity of the front surface of the body, resulting in the formation of a layer with an elevated gas temperature. Moreover, it is notable that high-temperature subsonic zones develop in proximity to the horizontal boundaries of the body. These zones are also observable in the Schlieren images, as illustrated in
Figure 7.
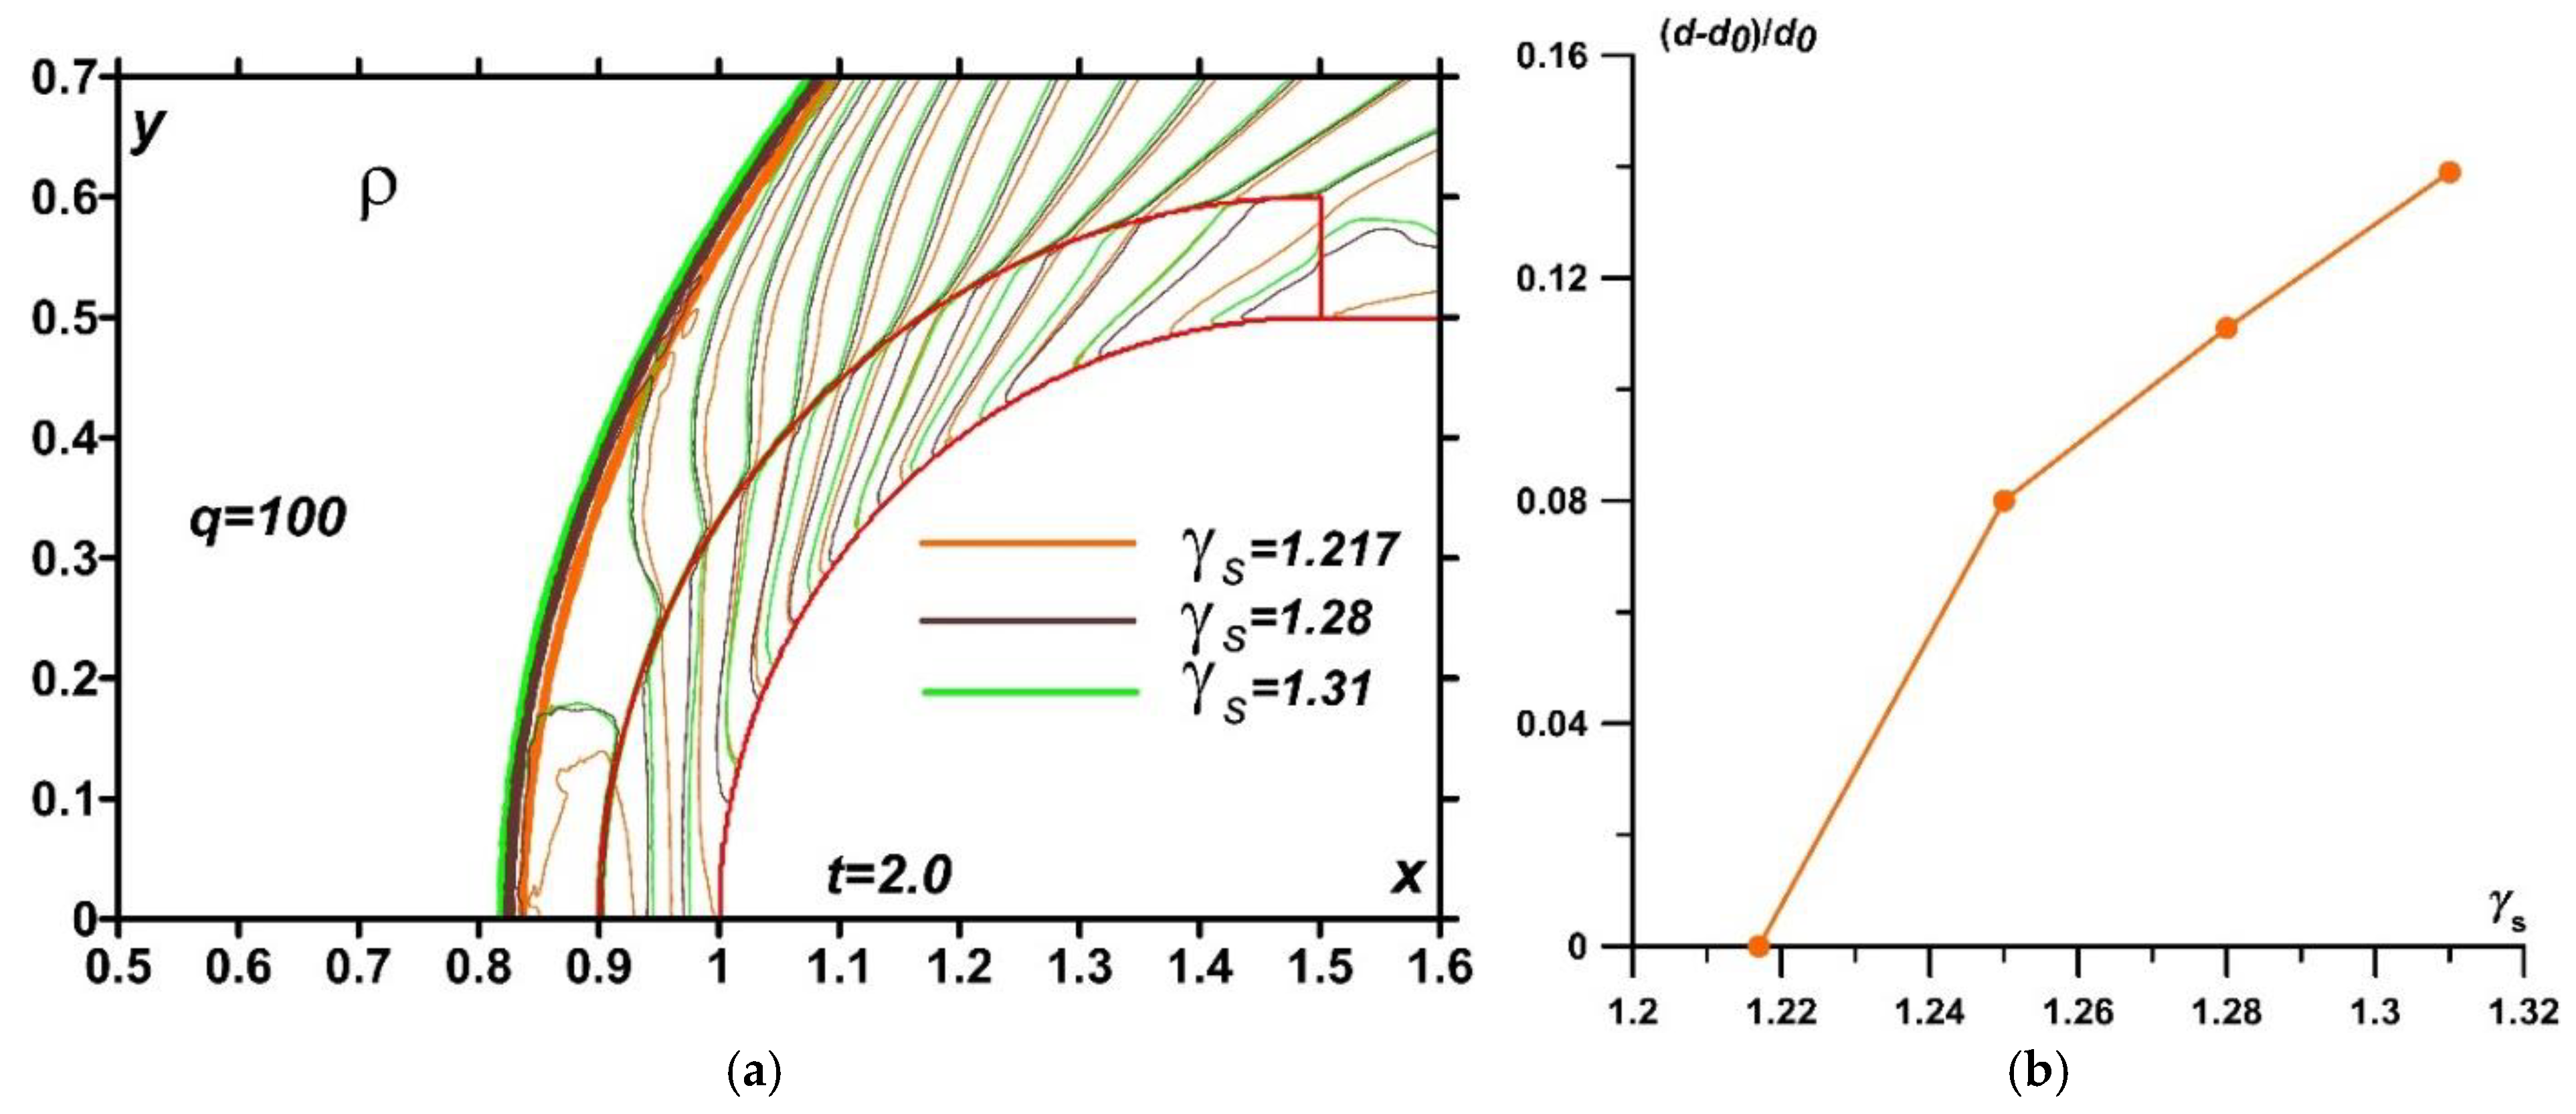
Calculations indicated that significant changes in temperature and density occur in the near-surface region due to the discharge energy release. It was also showed that the adiabatic index
γs influences the position of the bow shock wave in the steady flow regime. Density fields for steady flow modes at
q = 100 and varying of
γs values are presented in
Figure 20a, illustrating that a higher
γs corresponds to a larger stationary distance of the bow shock wave.
Figure 20b shows the dependence of the relative steady bow shock stand-off distance on
γs for
q=100, indicating that changes in
γs have a significant impact on the relative stand-off value of the steady bow shock wave.
4. Quantitative Comparison of the Experimental and Numerical Results
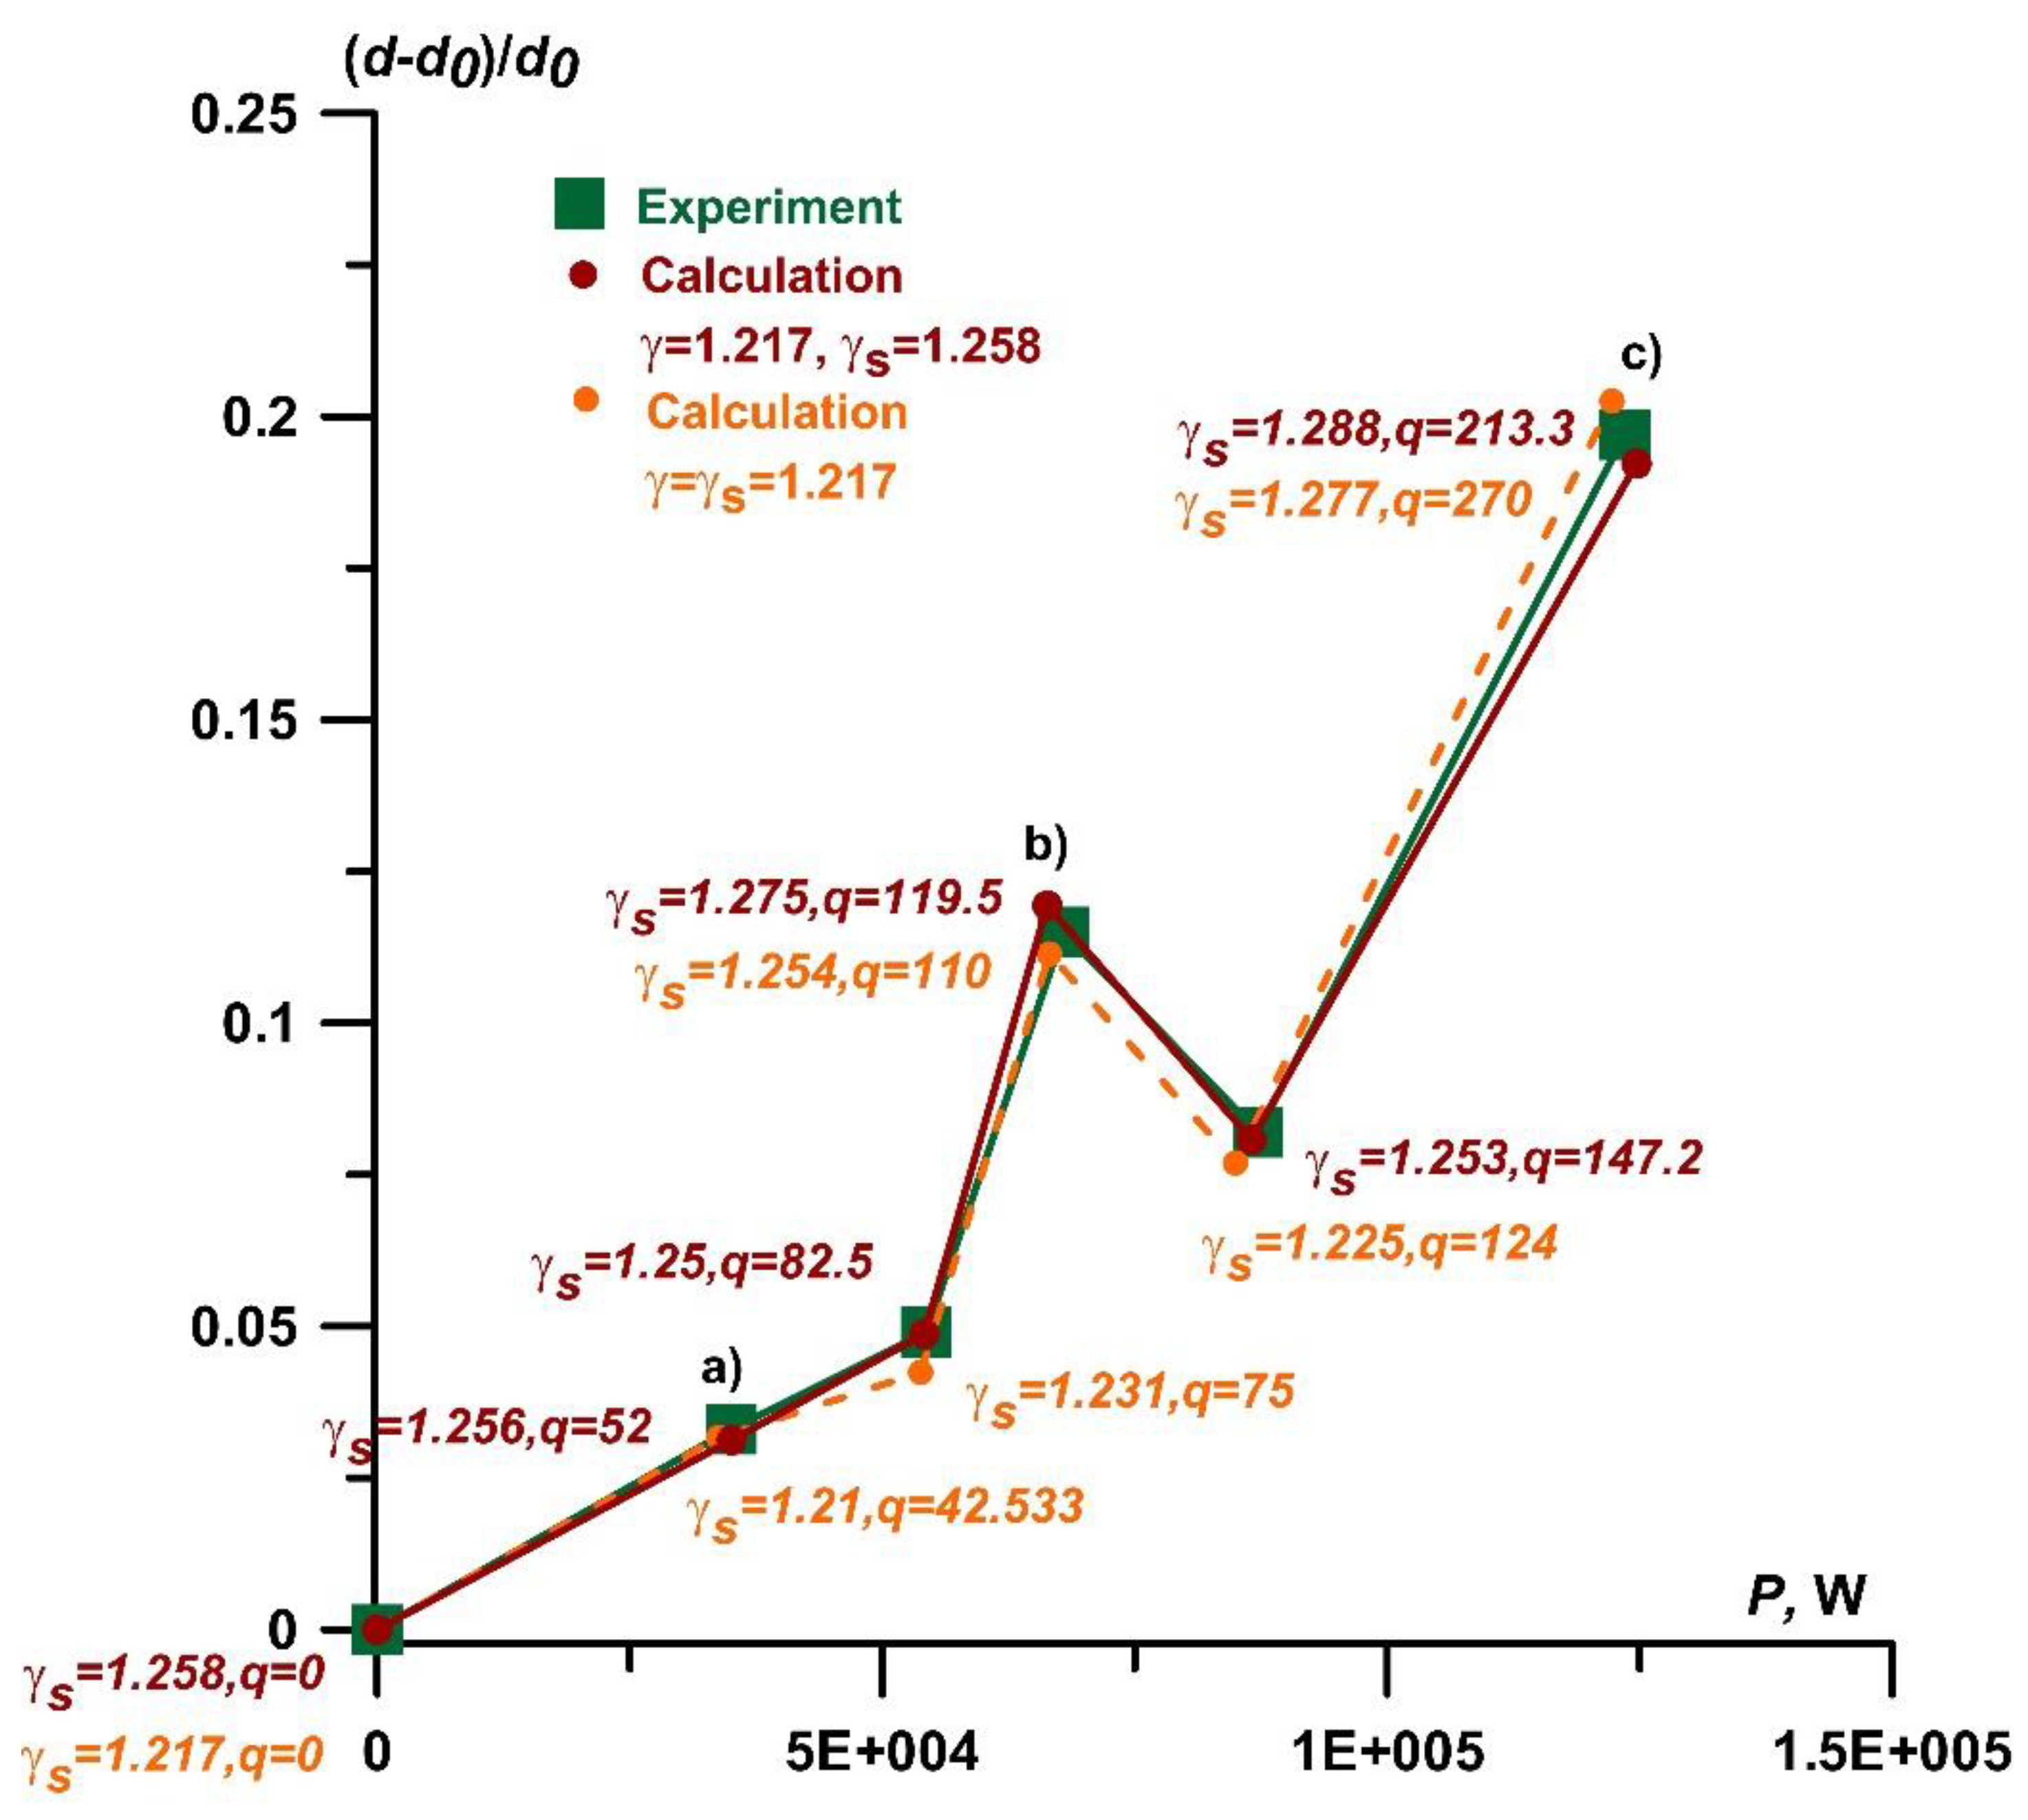
The calculated and experimental dependences of the relative value of the steady bow shock wave stand-off distance on the discharge power for the cases of taking into account the initial increased ionisation before the body and without this are presented in
Figure 21. Here, in the simulation we used of the calculated value of average density in the discharge plasma zone. From
Figure 21 one can see that approximately at 0<
P<1.25×10
5W (which is corresponded to 0<
I<915A) the calculated and experimental values of the relative stand-off distance are in good agreement. So, it is evident that the relative values of the stand-off distance at the steady flow mode is determined by two parameters,
q and γ
s, and the adiabatic index generally increases with increasing current and discharge power. It can be seen that at the beginning stage, 0<
P<5.42×10
5W (which is corresponded to 0<
I<604A) the dependence of the relative distance on the discharge power is close to linear. In addition, the oscillation of the relative stand-off distance was obtained at 1.25×10
5W<
P<8.66×10
5W (604A<
I<800A). This oscillation can be explained by the fact that the adiabatic index γ
s is strongly dependent on the degree of ionization in this range of the discharge current, which can lead to both its increase and decrease (see, also, Part 5).
Besides, in
Figure 21 the comparison is presented for the results obtained with taking into account the initial ionization ahead of the model (ruby red curve) and without it (orange curve). It can be concluded that when we take into account the initial ionization behind the model, the obtained the values of
q differ for small discharge currents (and powers) at first slightly, and this difference increases (and becomes significant) with increasing discharge current. The values of the adiabatic index γ
s for small discharge currents differ by 3.4%-3.8%, and for larger currents the action of the initial ionization weakens, and these values differ by 1%-2%. In general, it can be concluded that taking into account primary ionization is important both for small currents (since for these values there is a noticeable difference in the values of γ
s) and for large currents, for which a large difference in the estimates of the specific power was obtained.
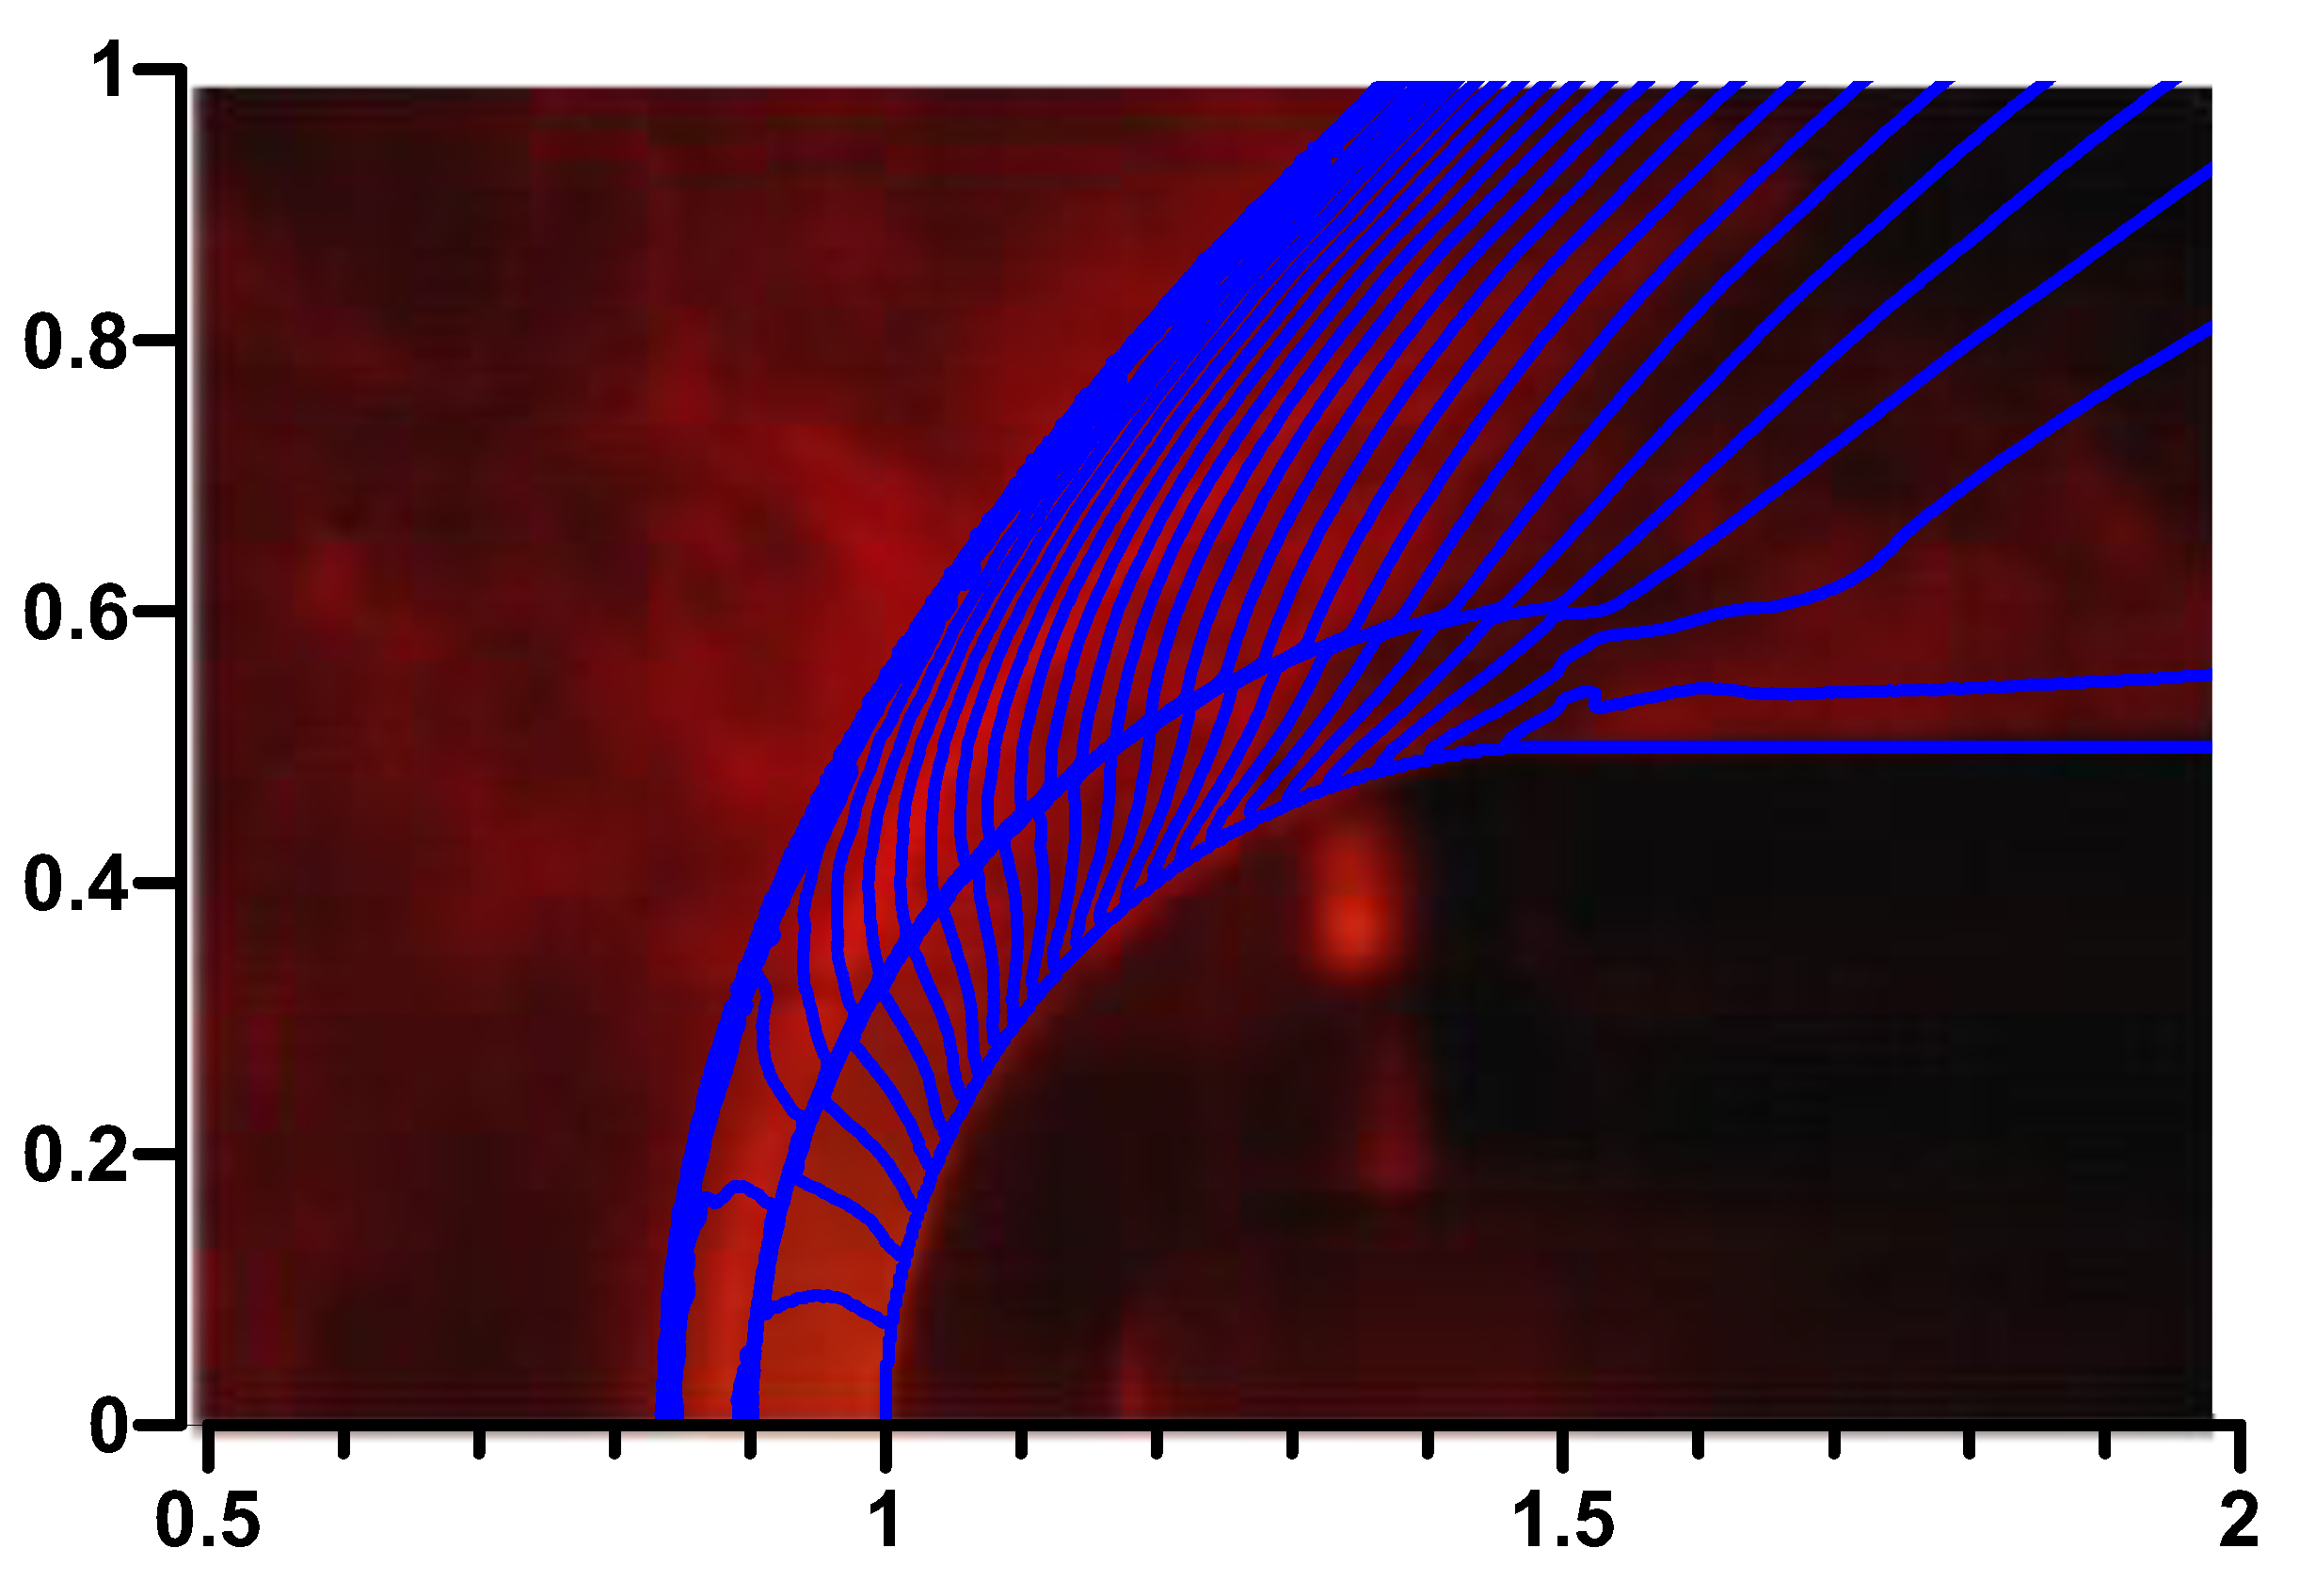
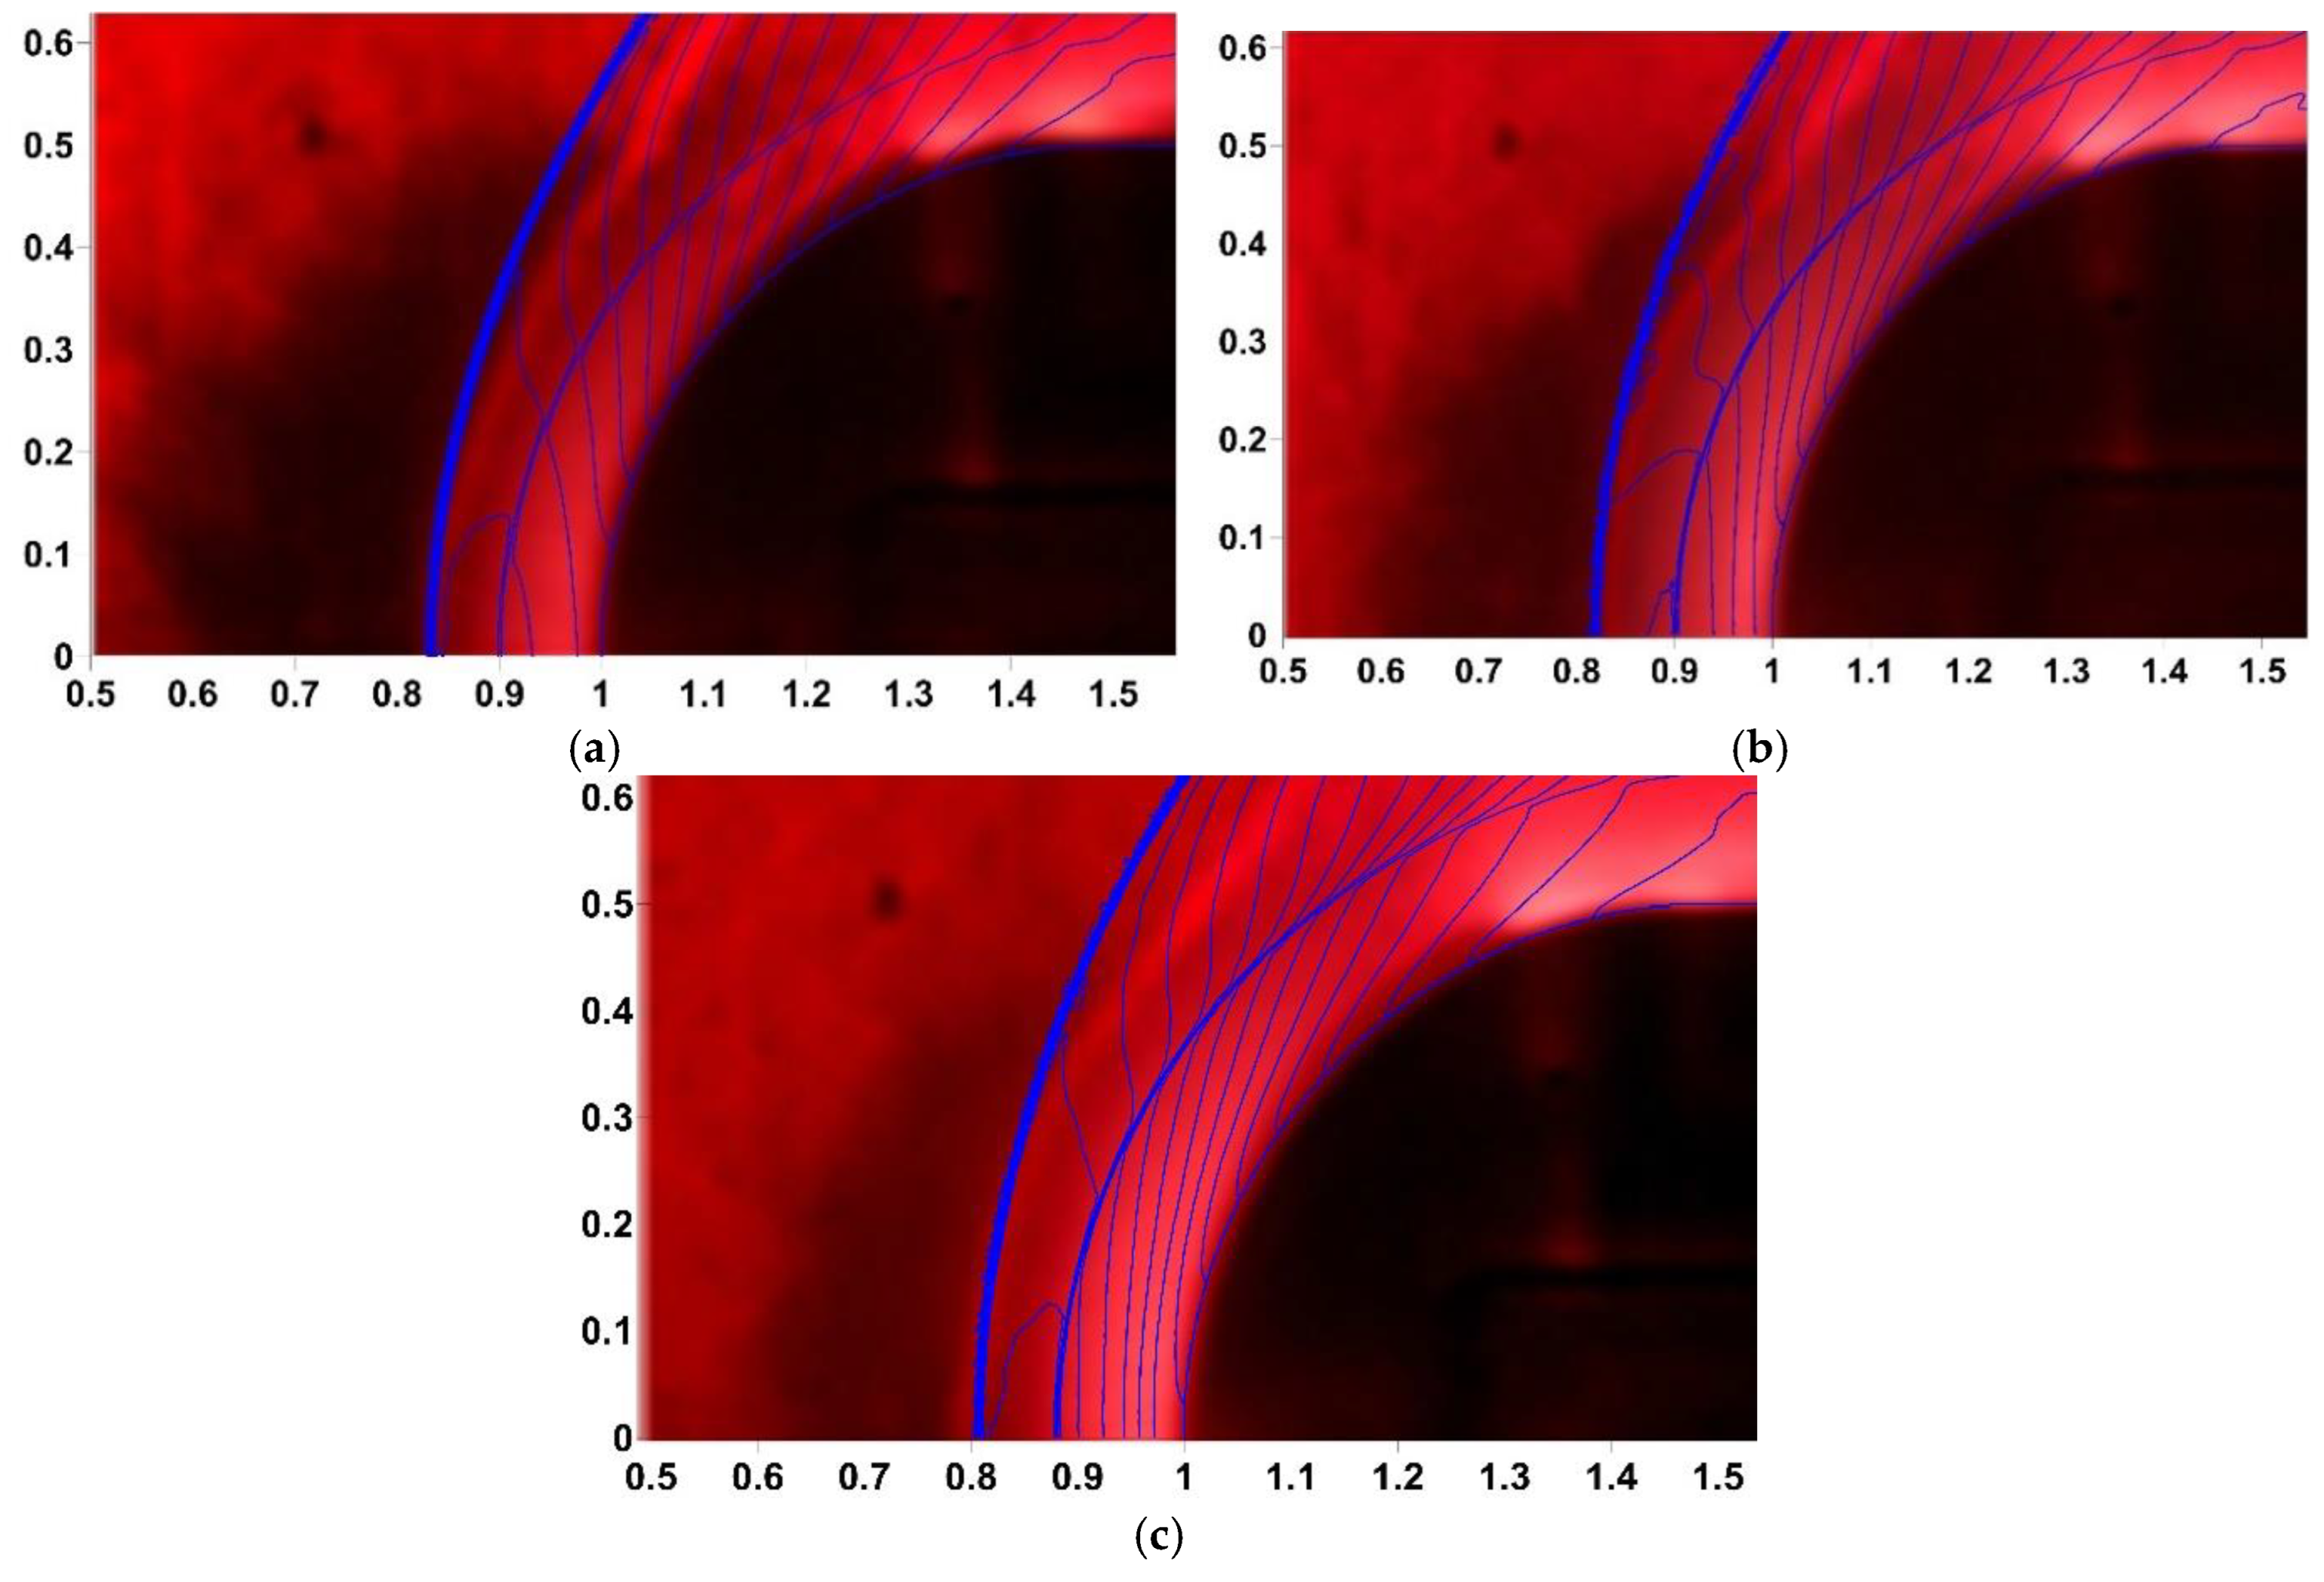
Figure 22 demonstrates the according comparison of the numerical flow patterns and schlieren images of the near-surface discharge action in xenon. It is seen the good agreement of the numerical and experimental values in the locations of the bow shock waves on the axis of symmetry for the obtained parameters γ
s and
q, evaluated sizes of the plasma area, and the established initial freestream flow conditions.
Table 3 shows a correspondence between the specific power produced by the discharge
q, the discharge current
I, and the value of the adiabatic index in the discharge zone γ
s. Here
qdim is the dimensional value of
q. It is seen, that with the growth of the discharge current, the specific power increases; the adiabatic index γ
s remains practically the same, in the interval 1.25-1.258, with one oscillation occurs when γ
s =1.275; for large values of the discharge current the adiabatic index γ
s increases.
A correspondence between the discharge current
I, discharge power
P, the average density ρ
a, temperature
Ta, pressure
pa, in the plasma zone, the electron density n
e, the degree of ionization α, and the adiabatic index γ
sfor Ɵ=1 (calculated using the theory of K. Burm et al. [
24]) is presented in
Table 4.
It can be seen that with an increase in the discharge current and power, the average density decreases, and the pressure is weakly dependent on the discharge current. The plasma parameters, such as the electron density and the degree of ionization are increasing with the discharge current, and the adiabatic index for Ɵ=1 is increasing overall, but experiences some oscillations (see, also, Part 5).
5. Comparison of the Results Obtained with the Dependences Defined by the Theory of K. Burm et al.
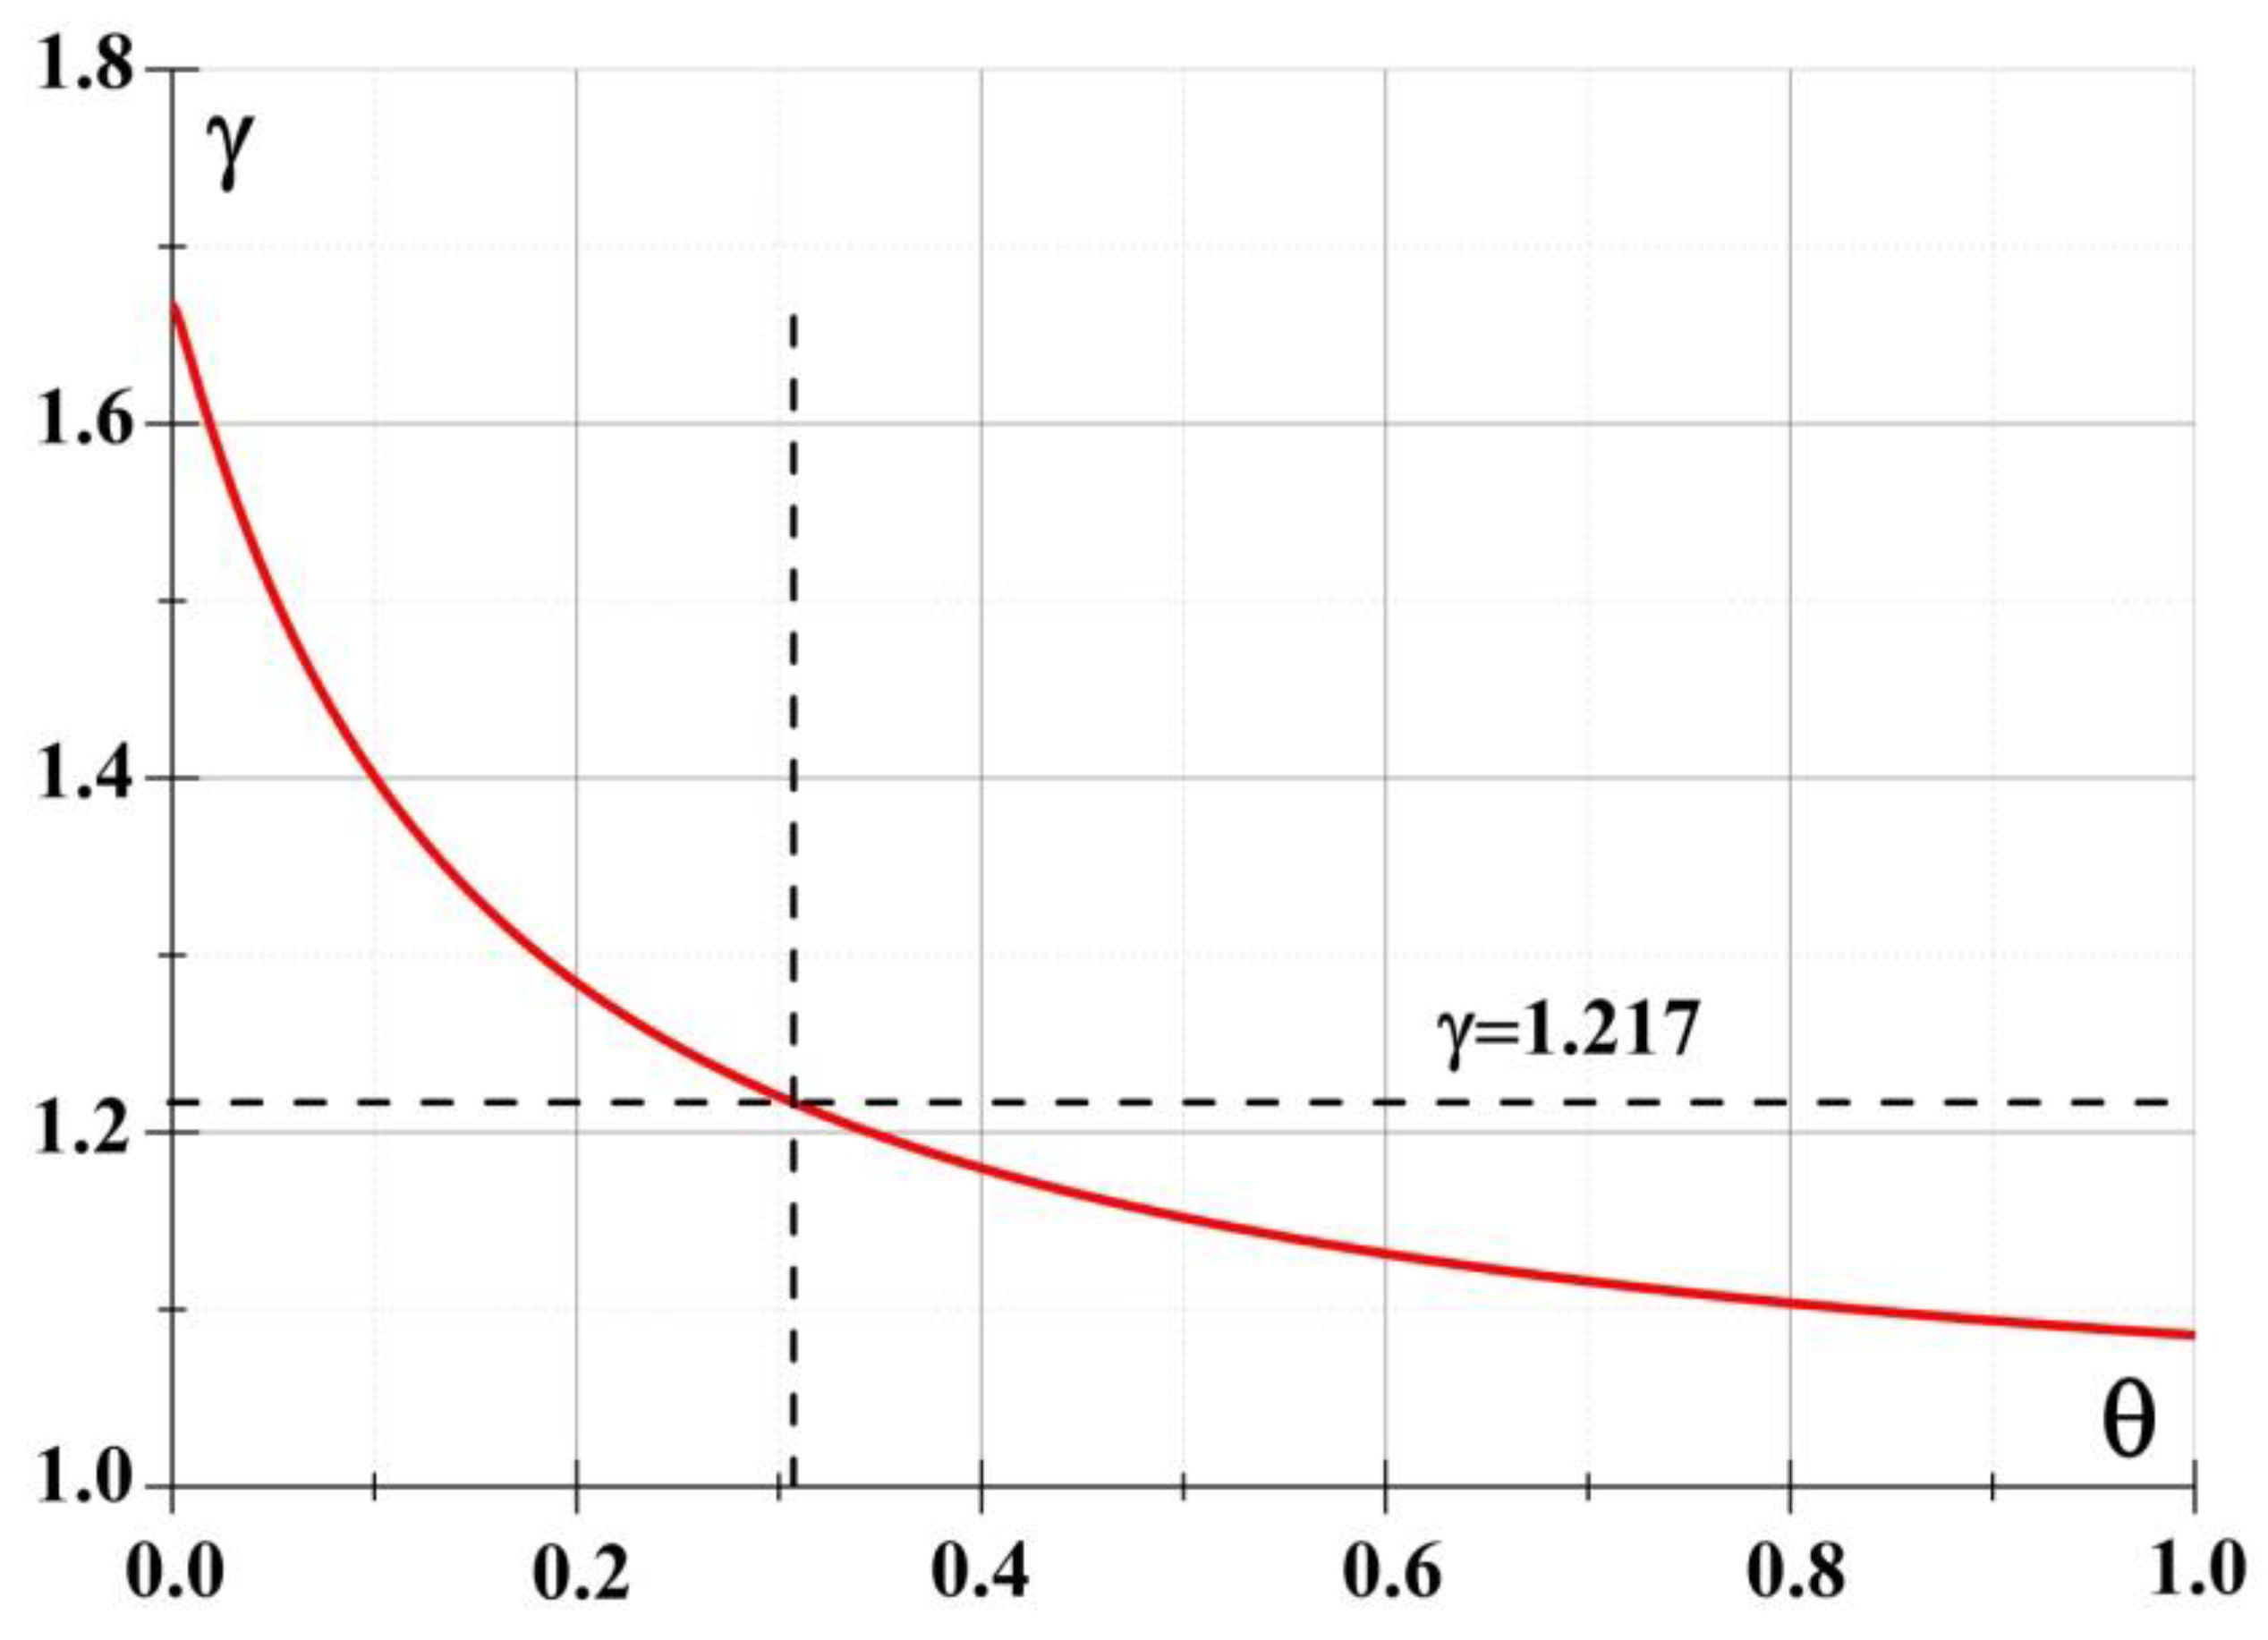
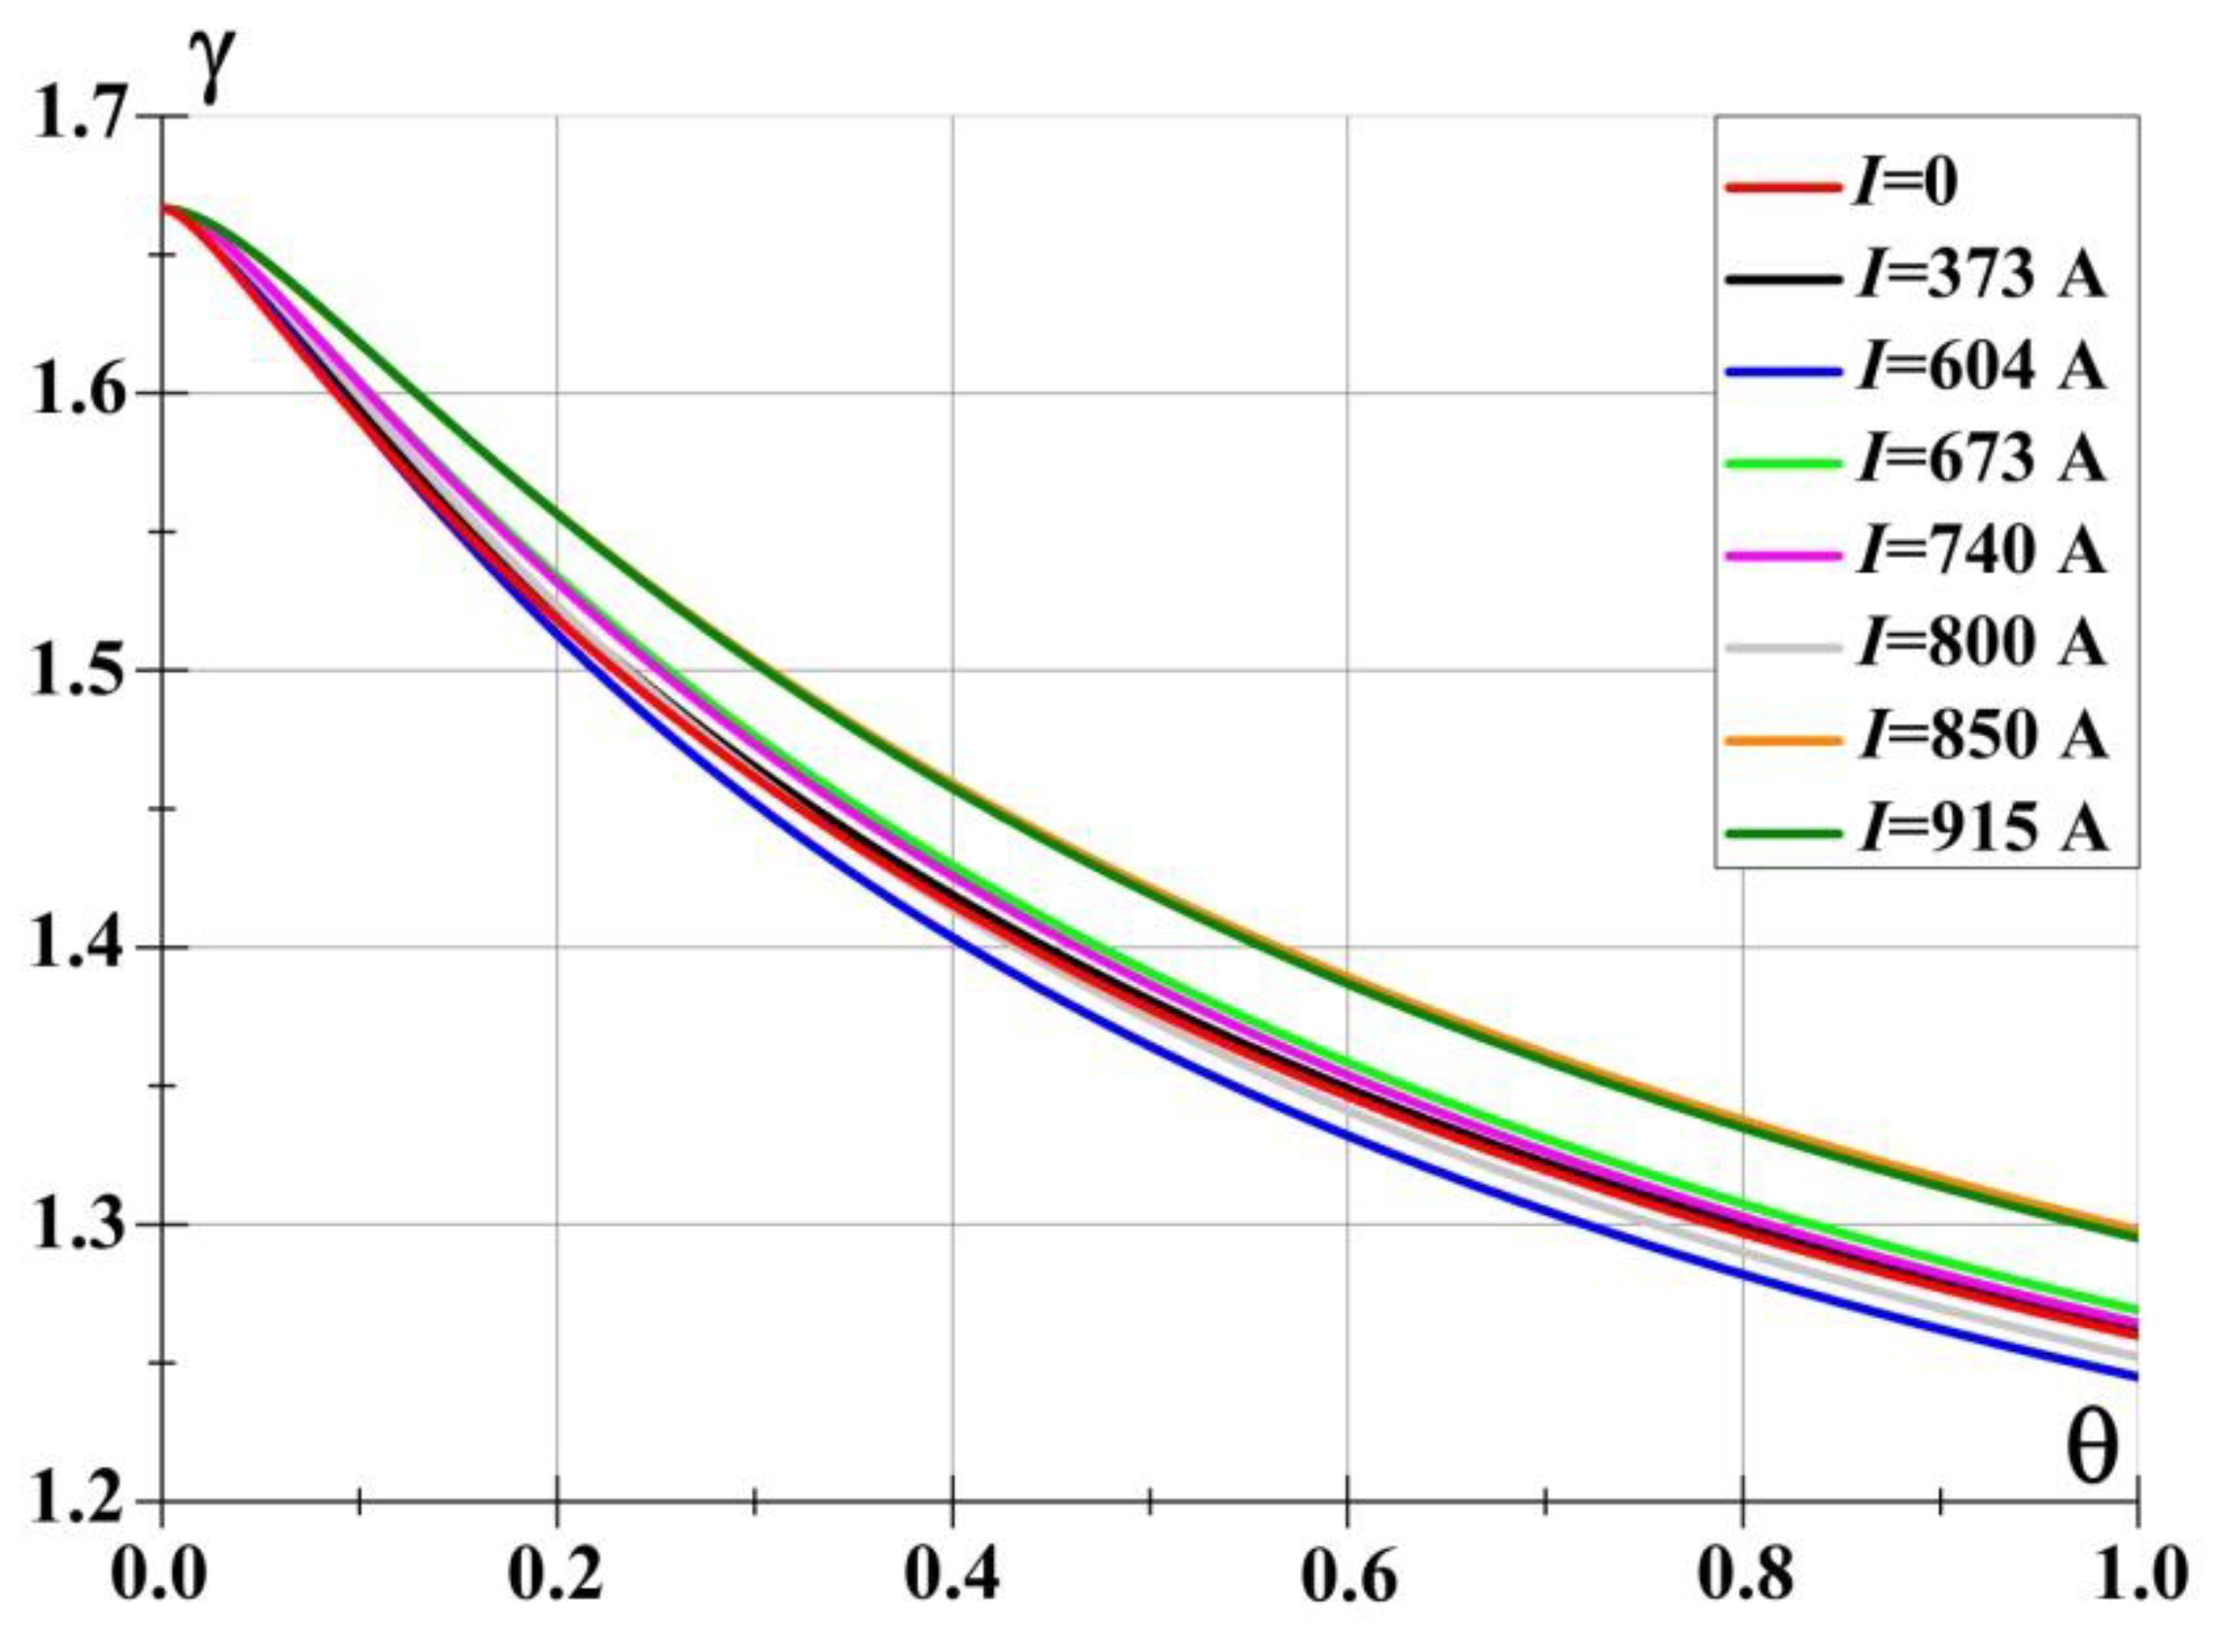
Figure 23 shows the dependences of the adiabatic index γ
s on the degree of nonequilibrium in the gas discharge zone, obtained according to the theory of K. Burm et al. [
24] for the gas temperature and the average density calculated in numerical simulation when energy is supplied to the impact zone. For each value of the gas discharge current, the degree of ionization and gas temperature are determined and the dependence on θ is plotted. Calculations have shown that the corresponding values of γ
s obtained in numerical simulation are close to the values of the adiabatic index calculated according to the theory of K. Burm et al. at θ=1. This is quite understandable and once again confirms that the state of the plasma in the braking zone near the model is close to thermodynamic equilibrium at the steady flow mode.
In
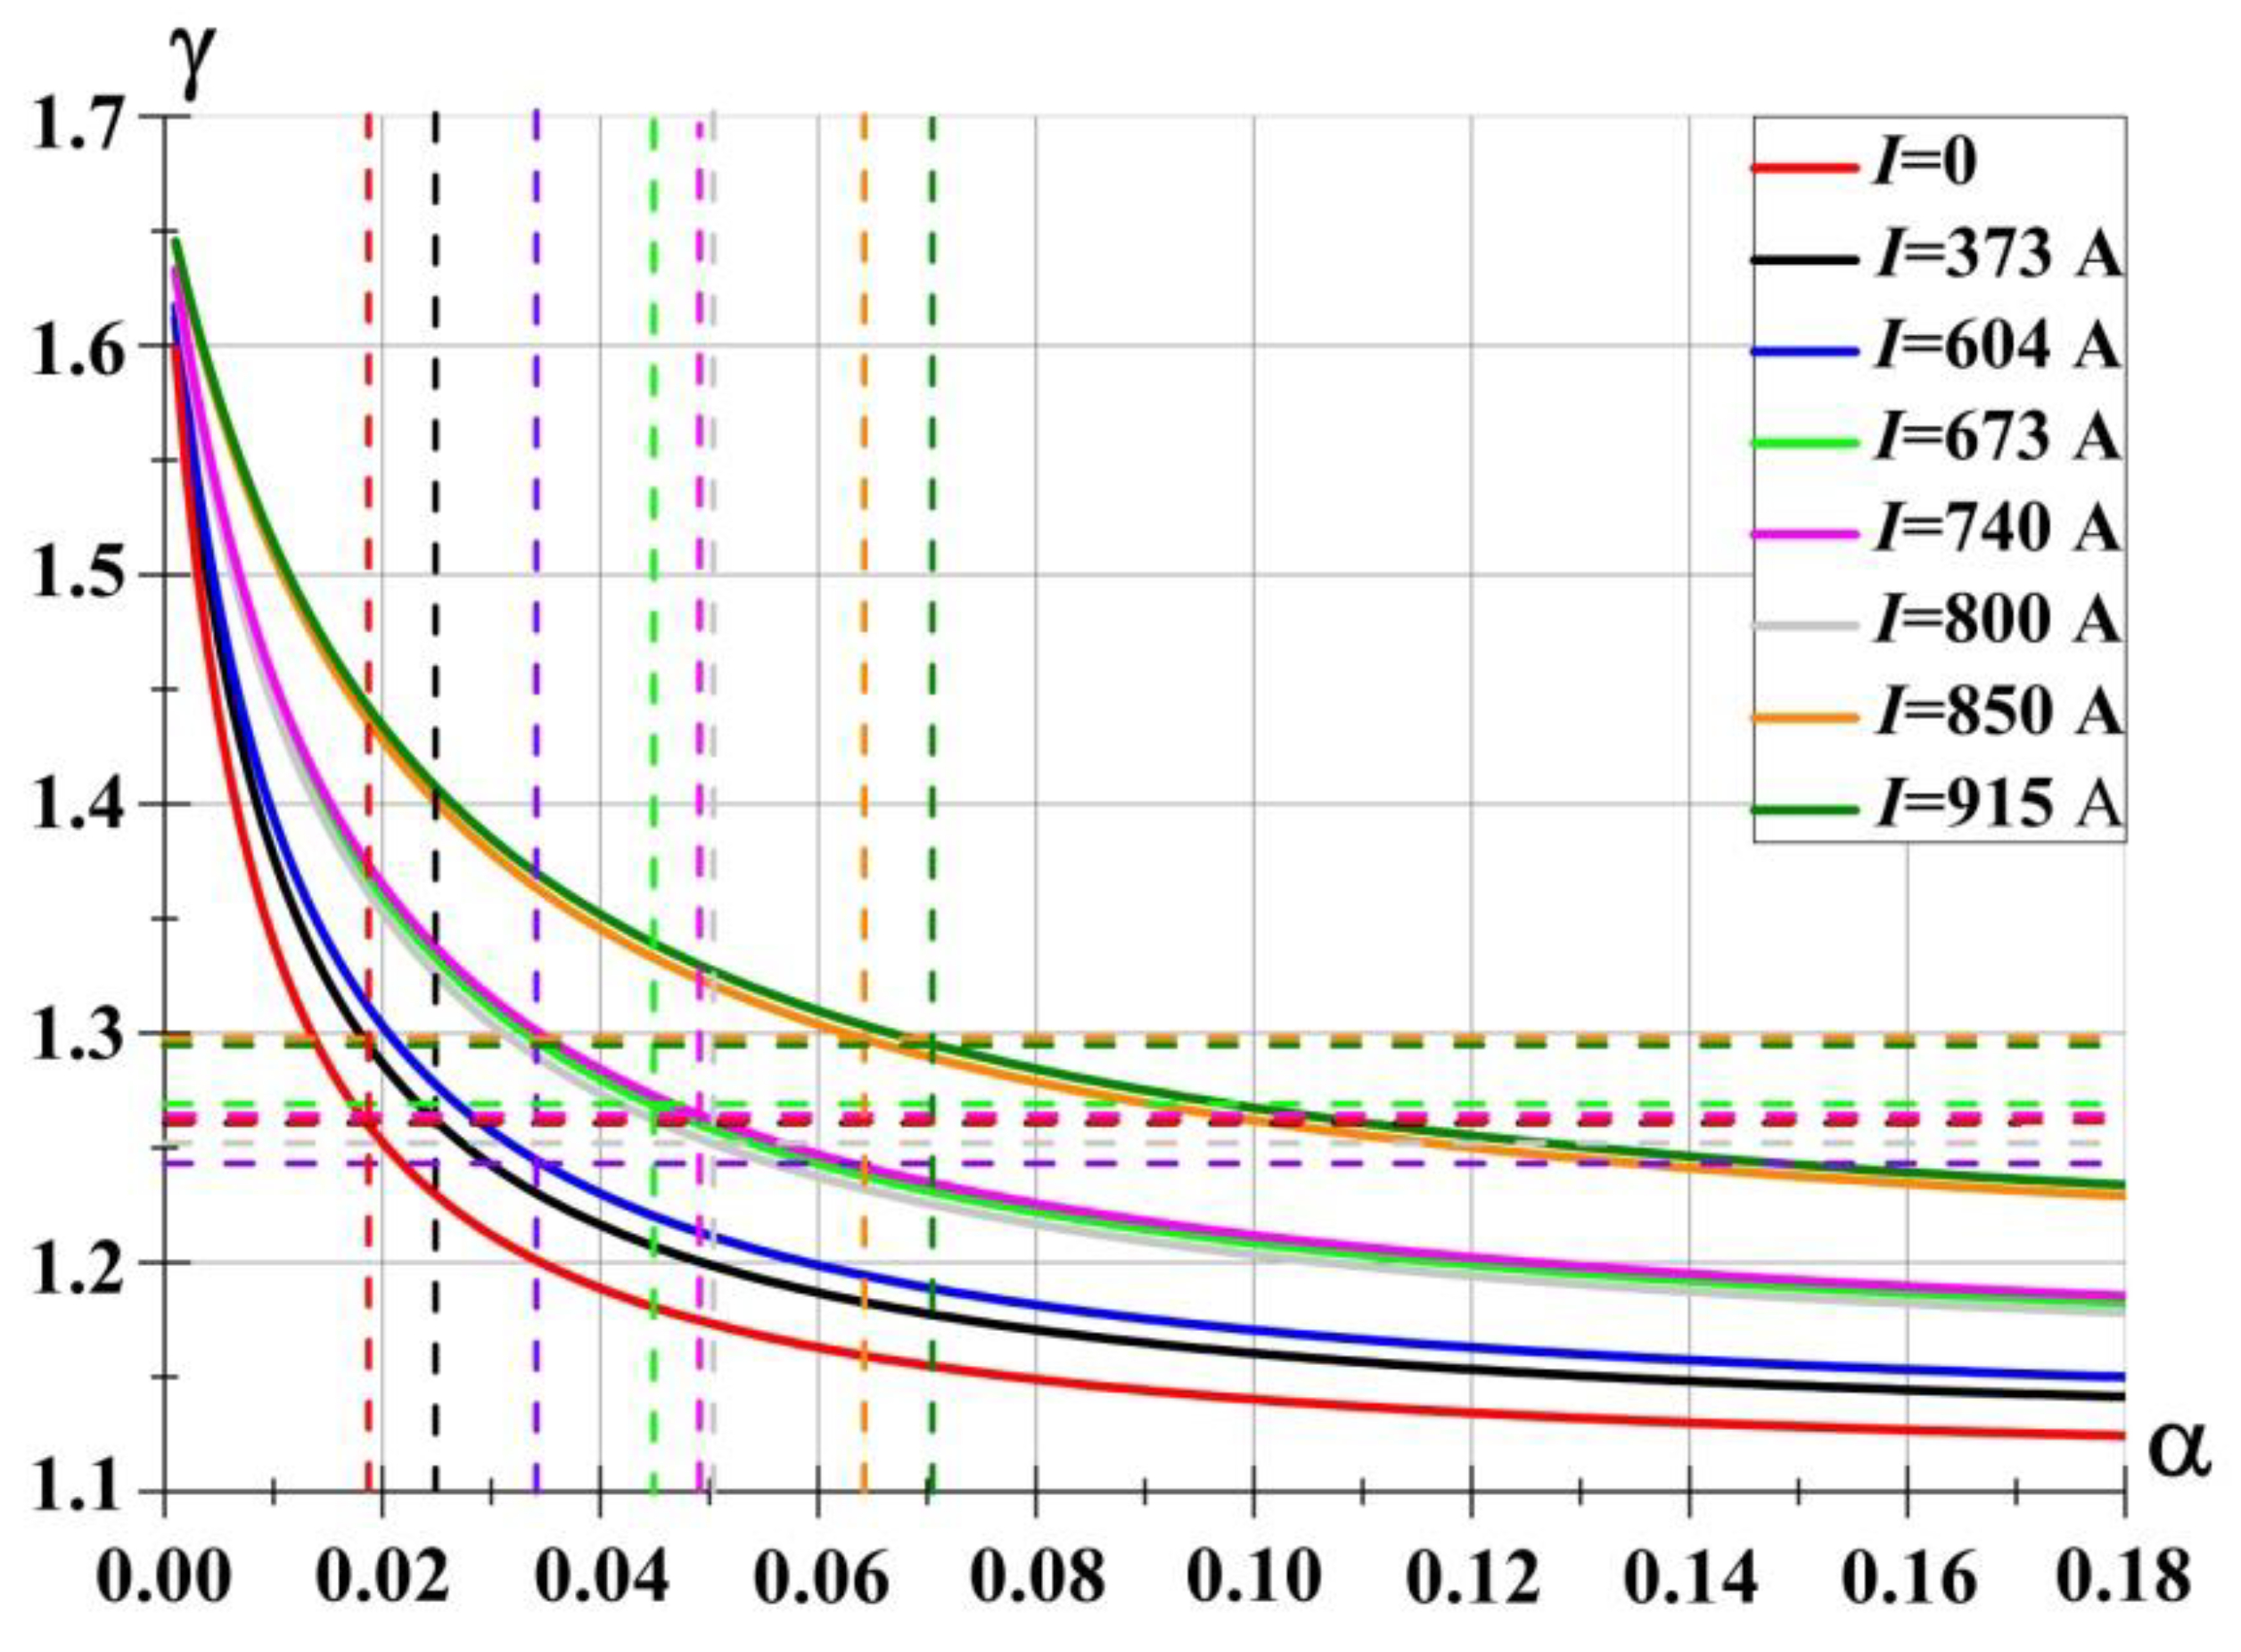
Figure 24, the same data are presented as dependences of the adiabatic index on the degree of plasma ionization in the impact zone at a fixed value of θ=1. The dashed vertical lines show the values of α for each value of the discharge current, and the horizontal lines show the corresponding values of the adiabatic index. From the curves in
Figure 24 it can be concluded that by changing the plasma characteristics in the impact zone it is possible to change the value of the adiabatic index in a wide range of values, and therefore actively influence the process of supersonic flow around AD objects.
In addition, it is seen from these dependences that an increase in the ionization degree leads to a decrease in the adiabatic index (at a fixed current and gas temperature), and an increase in the gas temperature (at a fixed ionization degree) leads to its increase. It is also evident that the curves in
Figure 24 are divided into three groups of curves: 1 - at the discharge currents of 0-600 A; 2 - at the currents of 600-800 A and 3 - at the currents greater than 800 A, the curves in the groups differ slightly from each other. Such a division leads to non-monotonicity of the dependence of the adiabatic index on the discharge current and the supplied power and, as a result, to non-monotonicity of the dependence of the value of the relative stand-off distance (see
Figure 21).
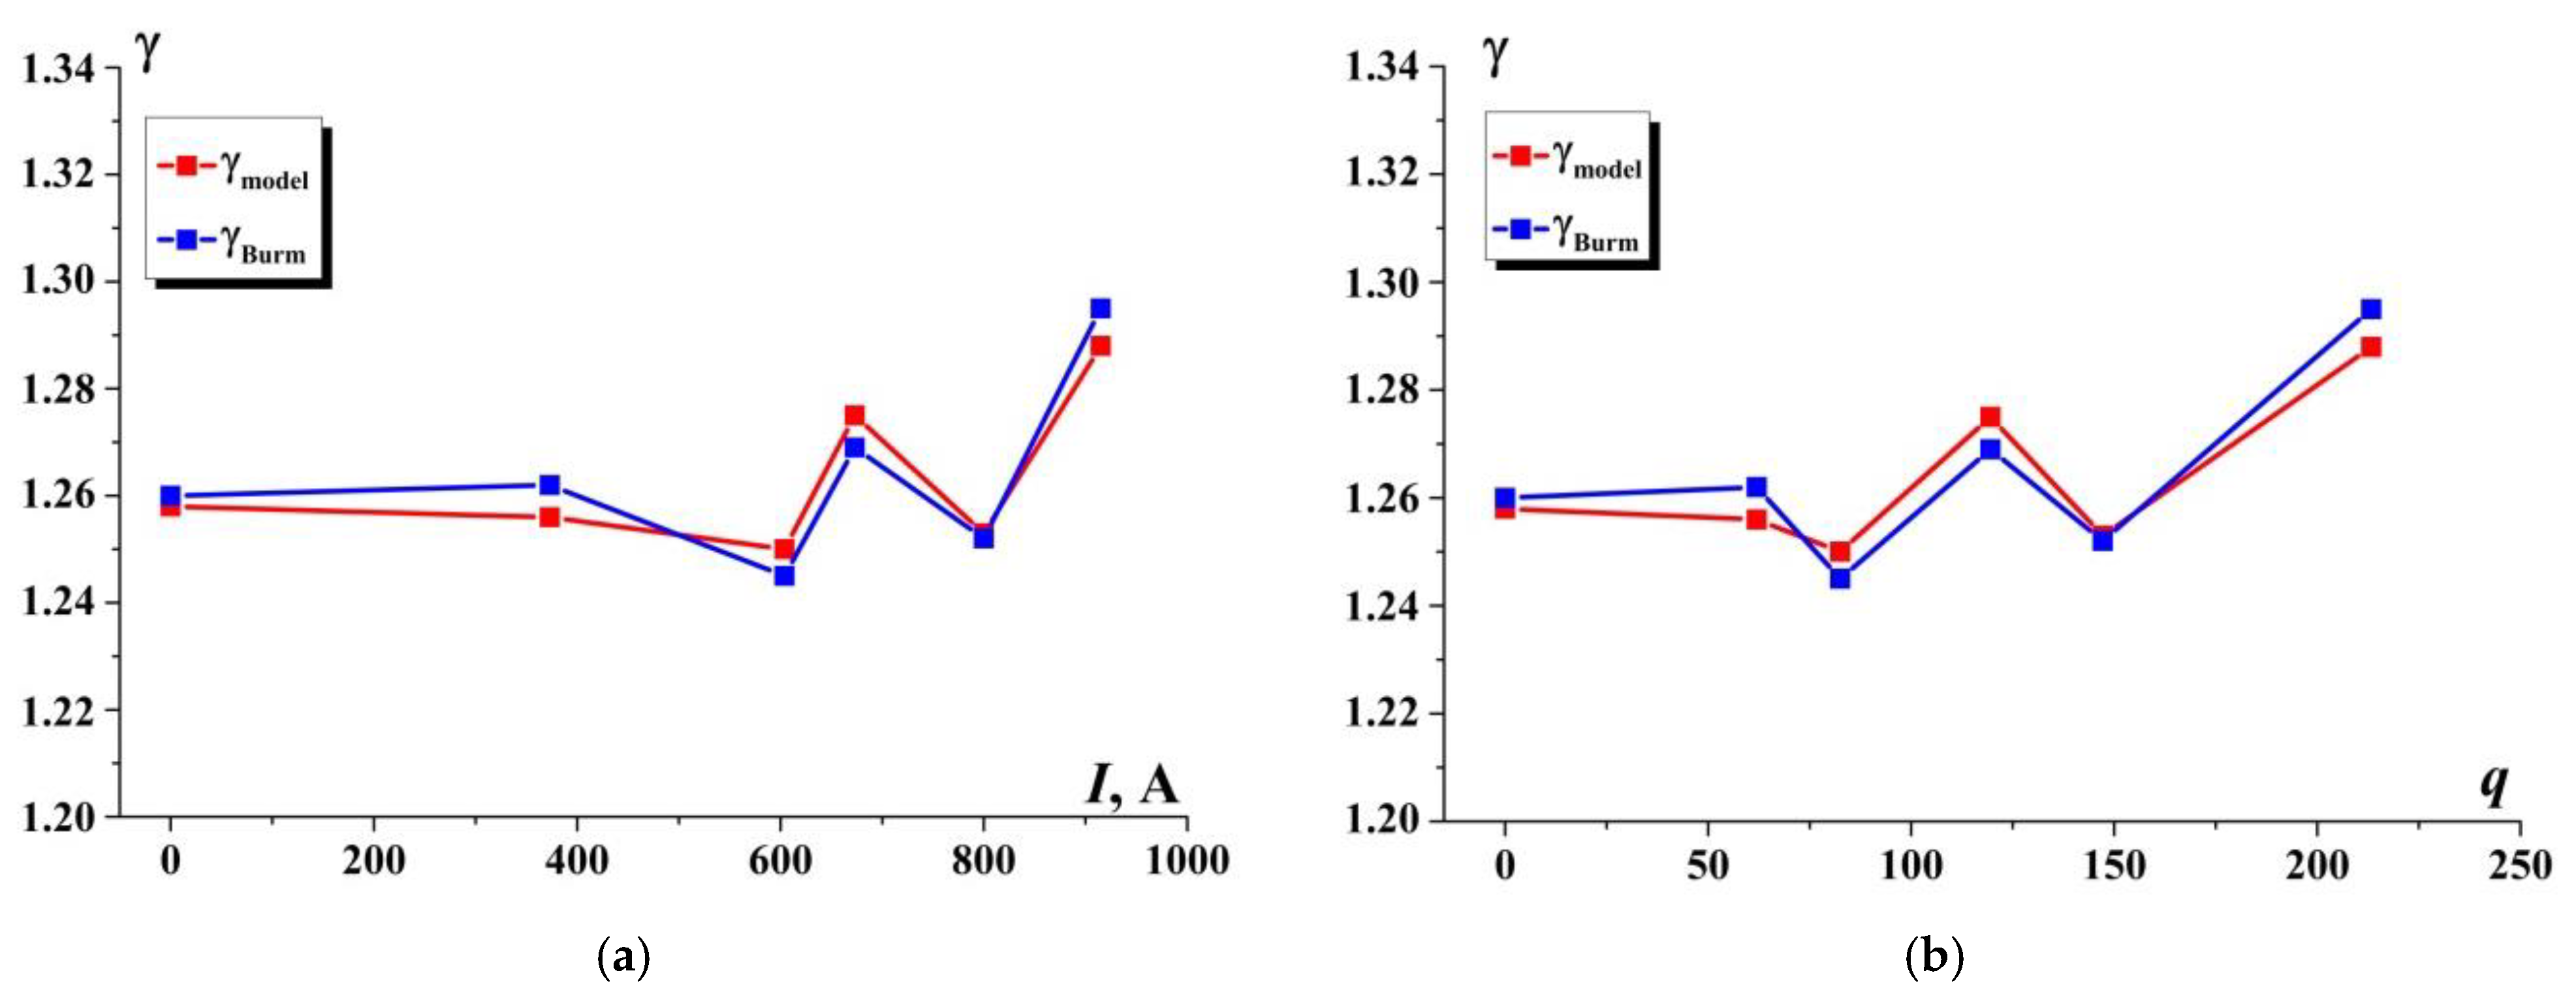
A comparison of the dependences of the adiabatic index on the value of the gas-discharge current and on the specific power of the energy supplied to the impact plasma zone obtained in numerical modeling and calculated according to the theory of K. Burm et al. is shown in
Figure 25. The non-monotonic nature of the dependencies shows a significant sensitivity of the adiabatic index γ
s to the plasma characteristics. In the range of currents 1 (of 0-600 A), the adiabatic index γ
s changes slightly, changes in the degree of ionization and gas temperature are not enough for significant changes in the adiabatic index γ
s. In the range 2 (of 600-800 A), the influence of plasma characteristics is strong, γ
s can both increase and decrease. In the range 3 (the current is greater than 800 A), γ
s begins to be determined by the gas temperature, which leads to its growth. Thus, a good agreement of the numerical results and the data calculated according to theory of K. Burm et al. was obtained. In addition, the non-monotonic dependence of the adiabatic index γ
s on the discharge current and the specific power in both calculations was shown, as well.
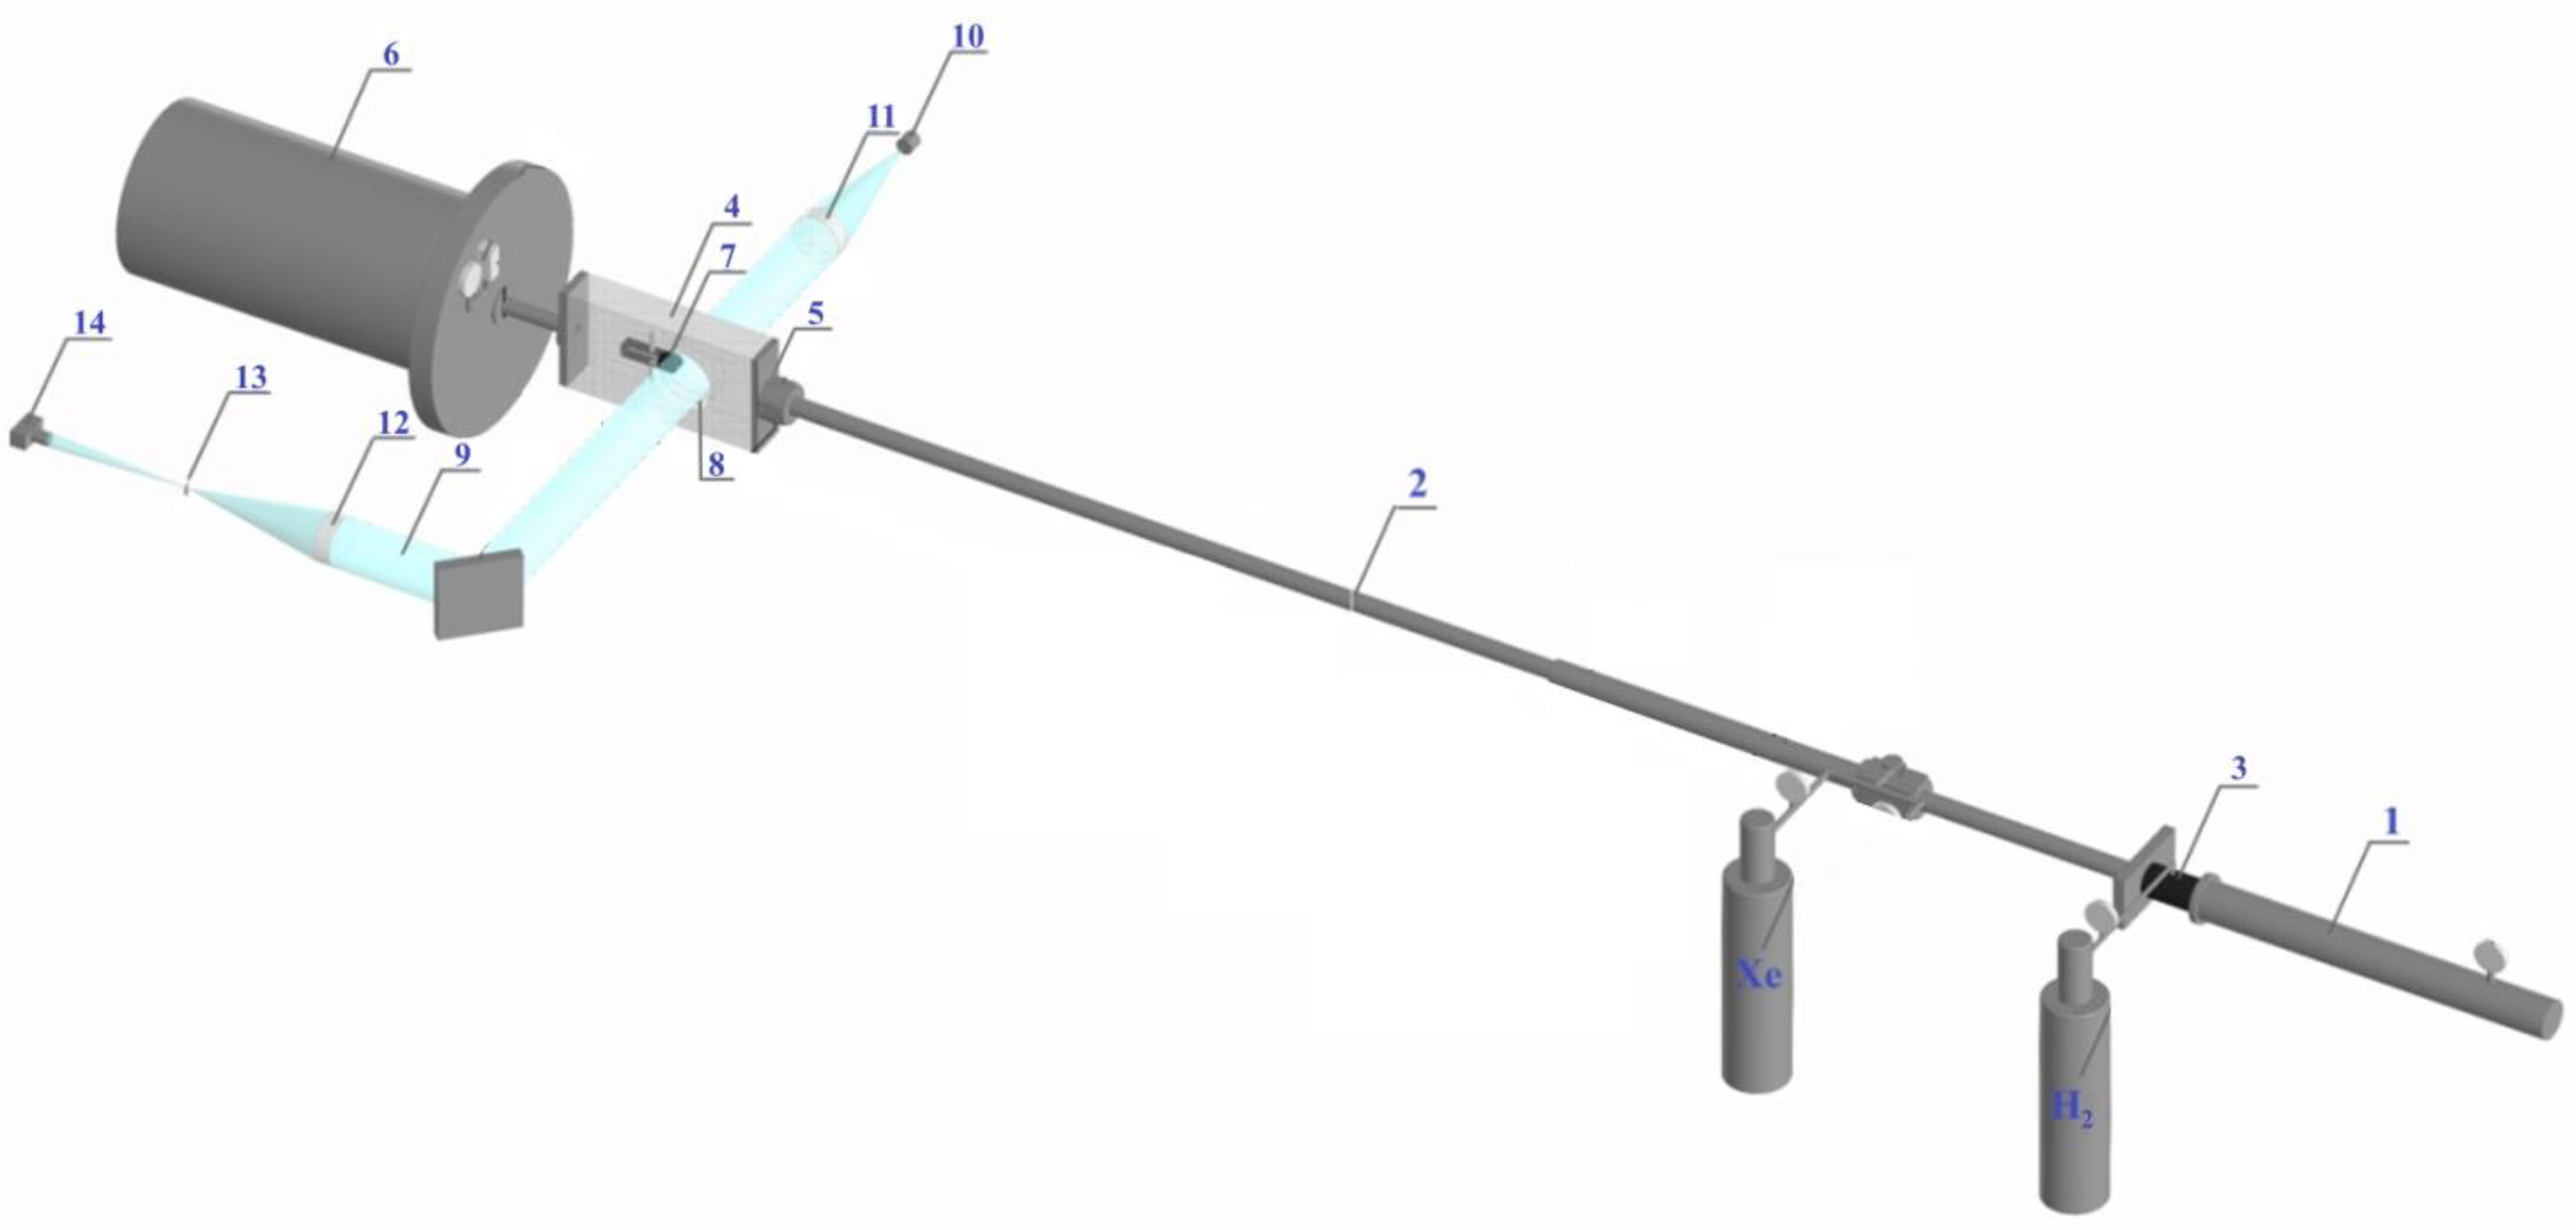
Figure 1.
Scheme of the experimental bench.
Figure 1.
Scheme of the experimental bench.
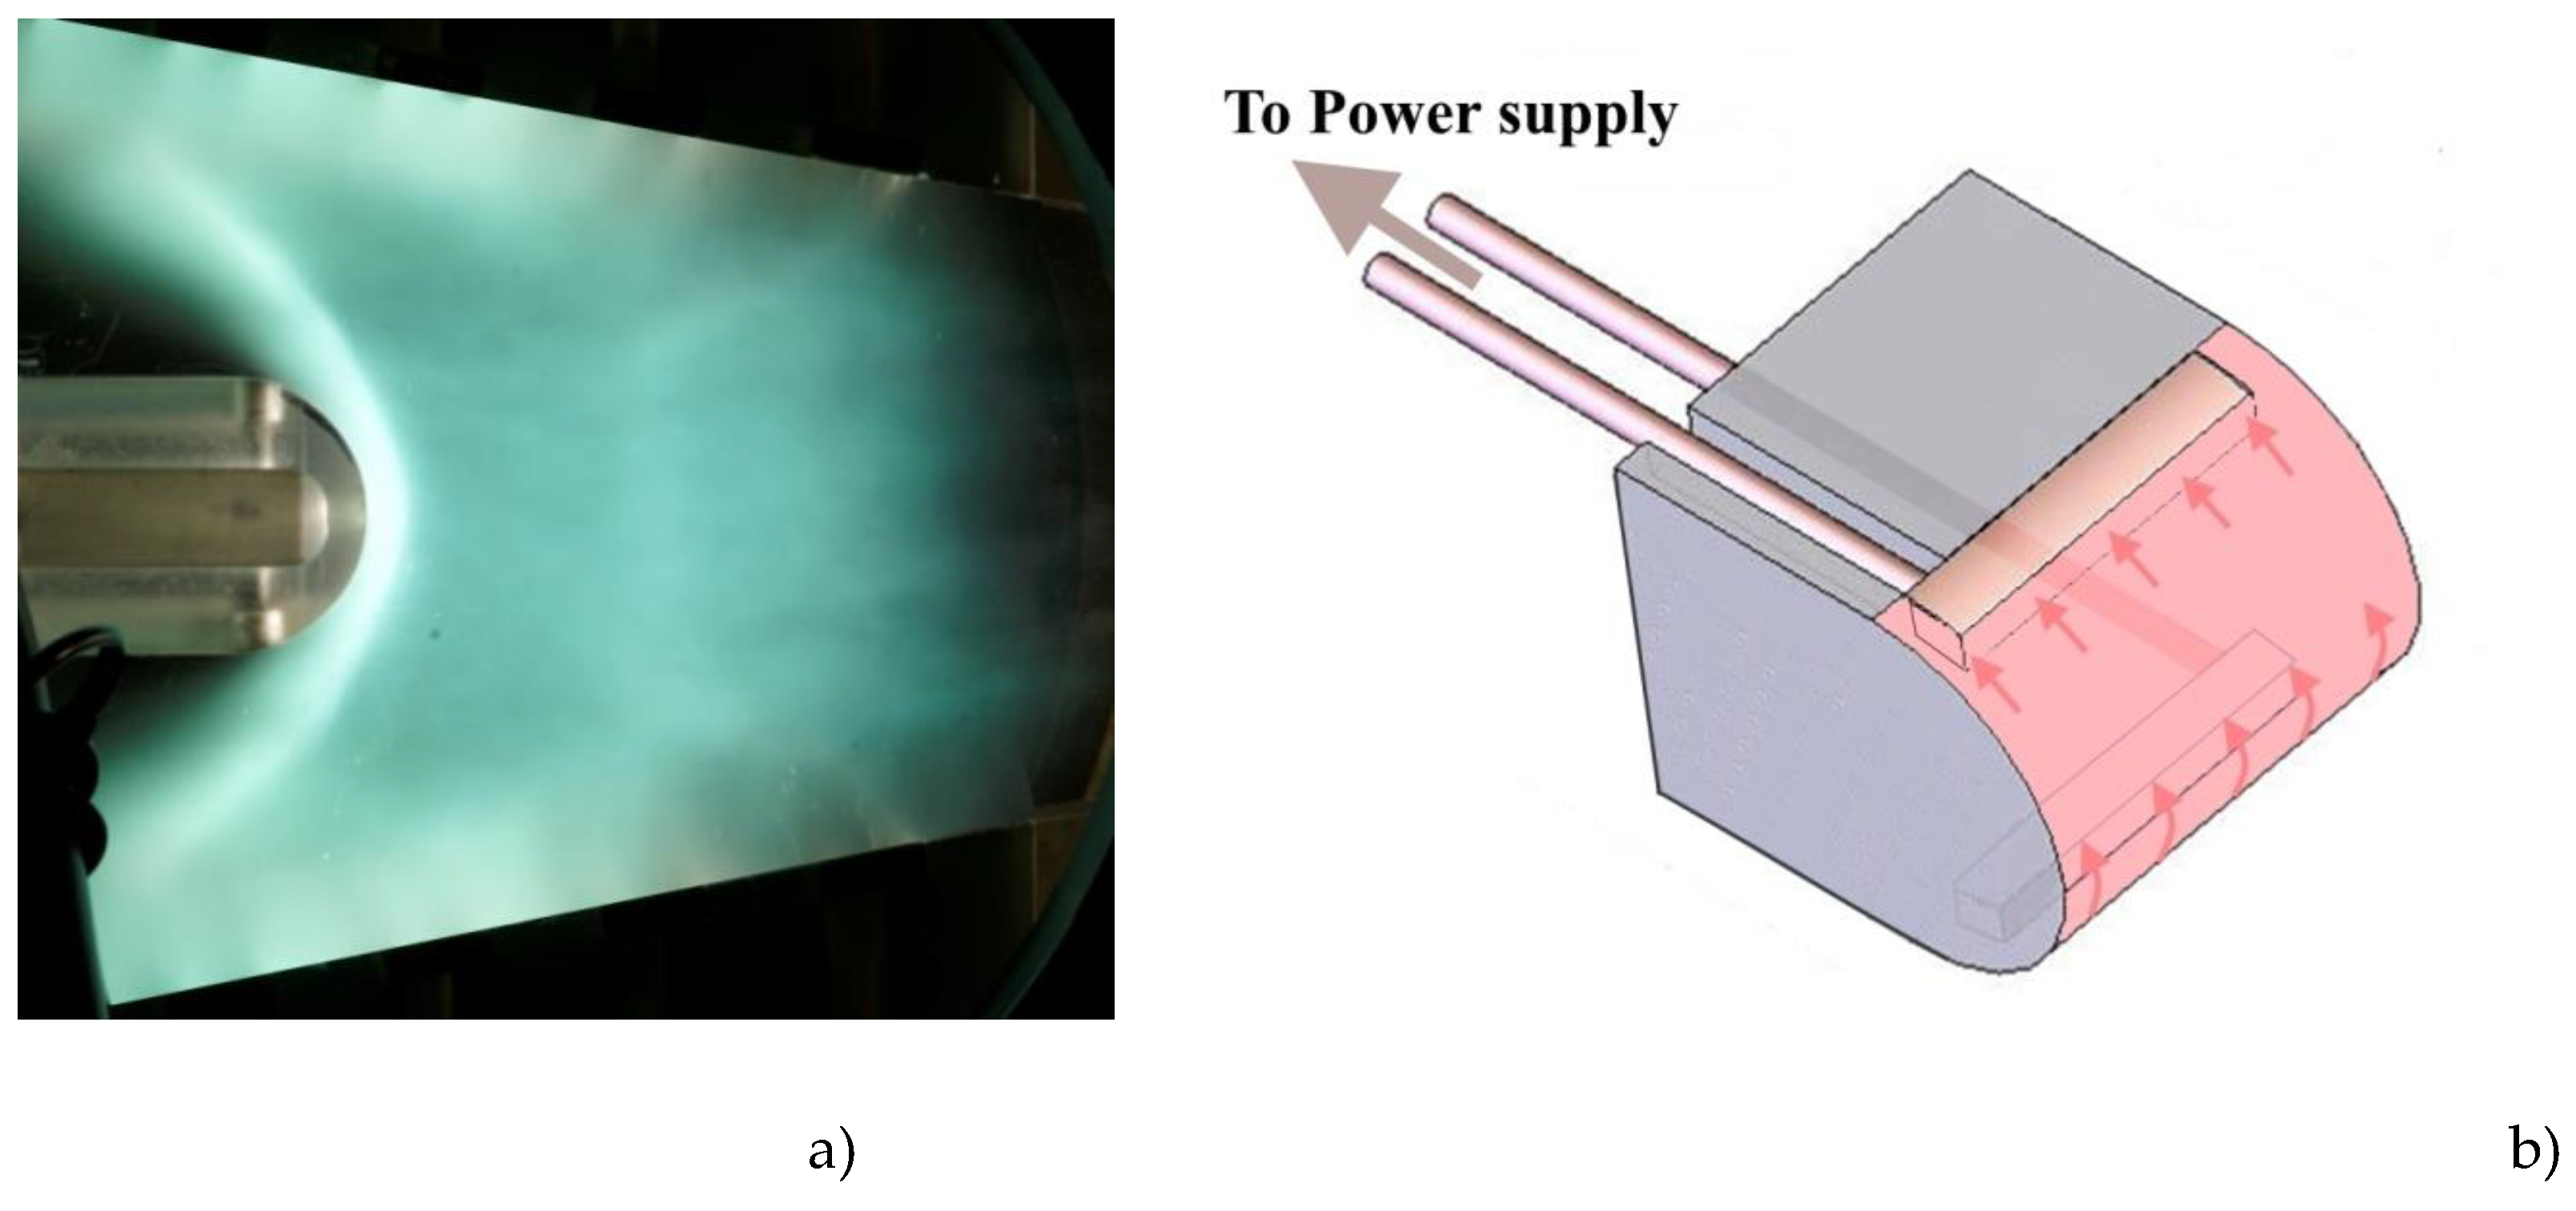
Figure 2.
The location of the model in the nozzle (a) and the shape of the studied model (b).
Figure 2.
The location of the model in the nozzle (a) and the shape of the studied model (b).
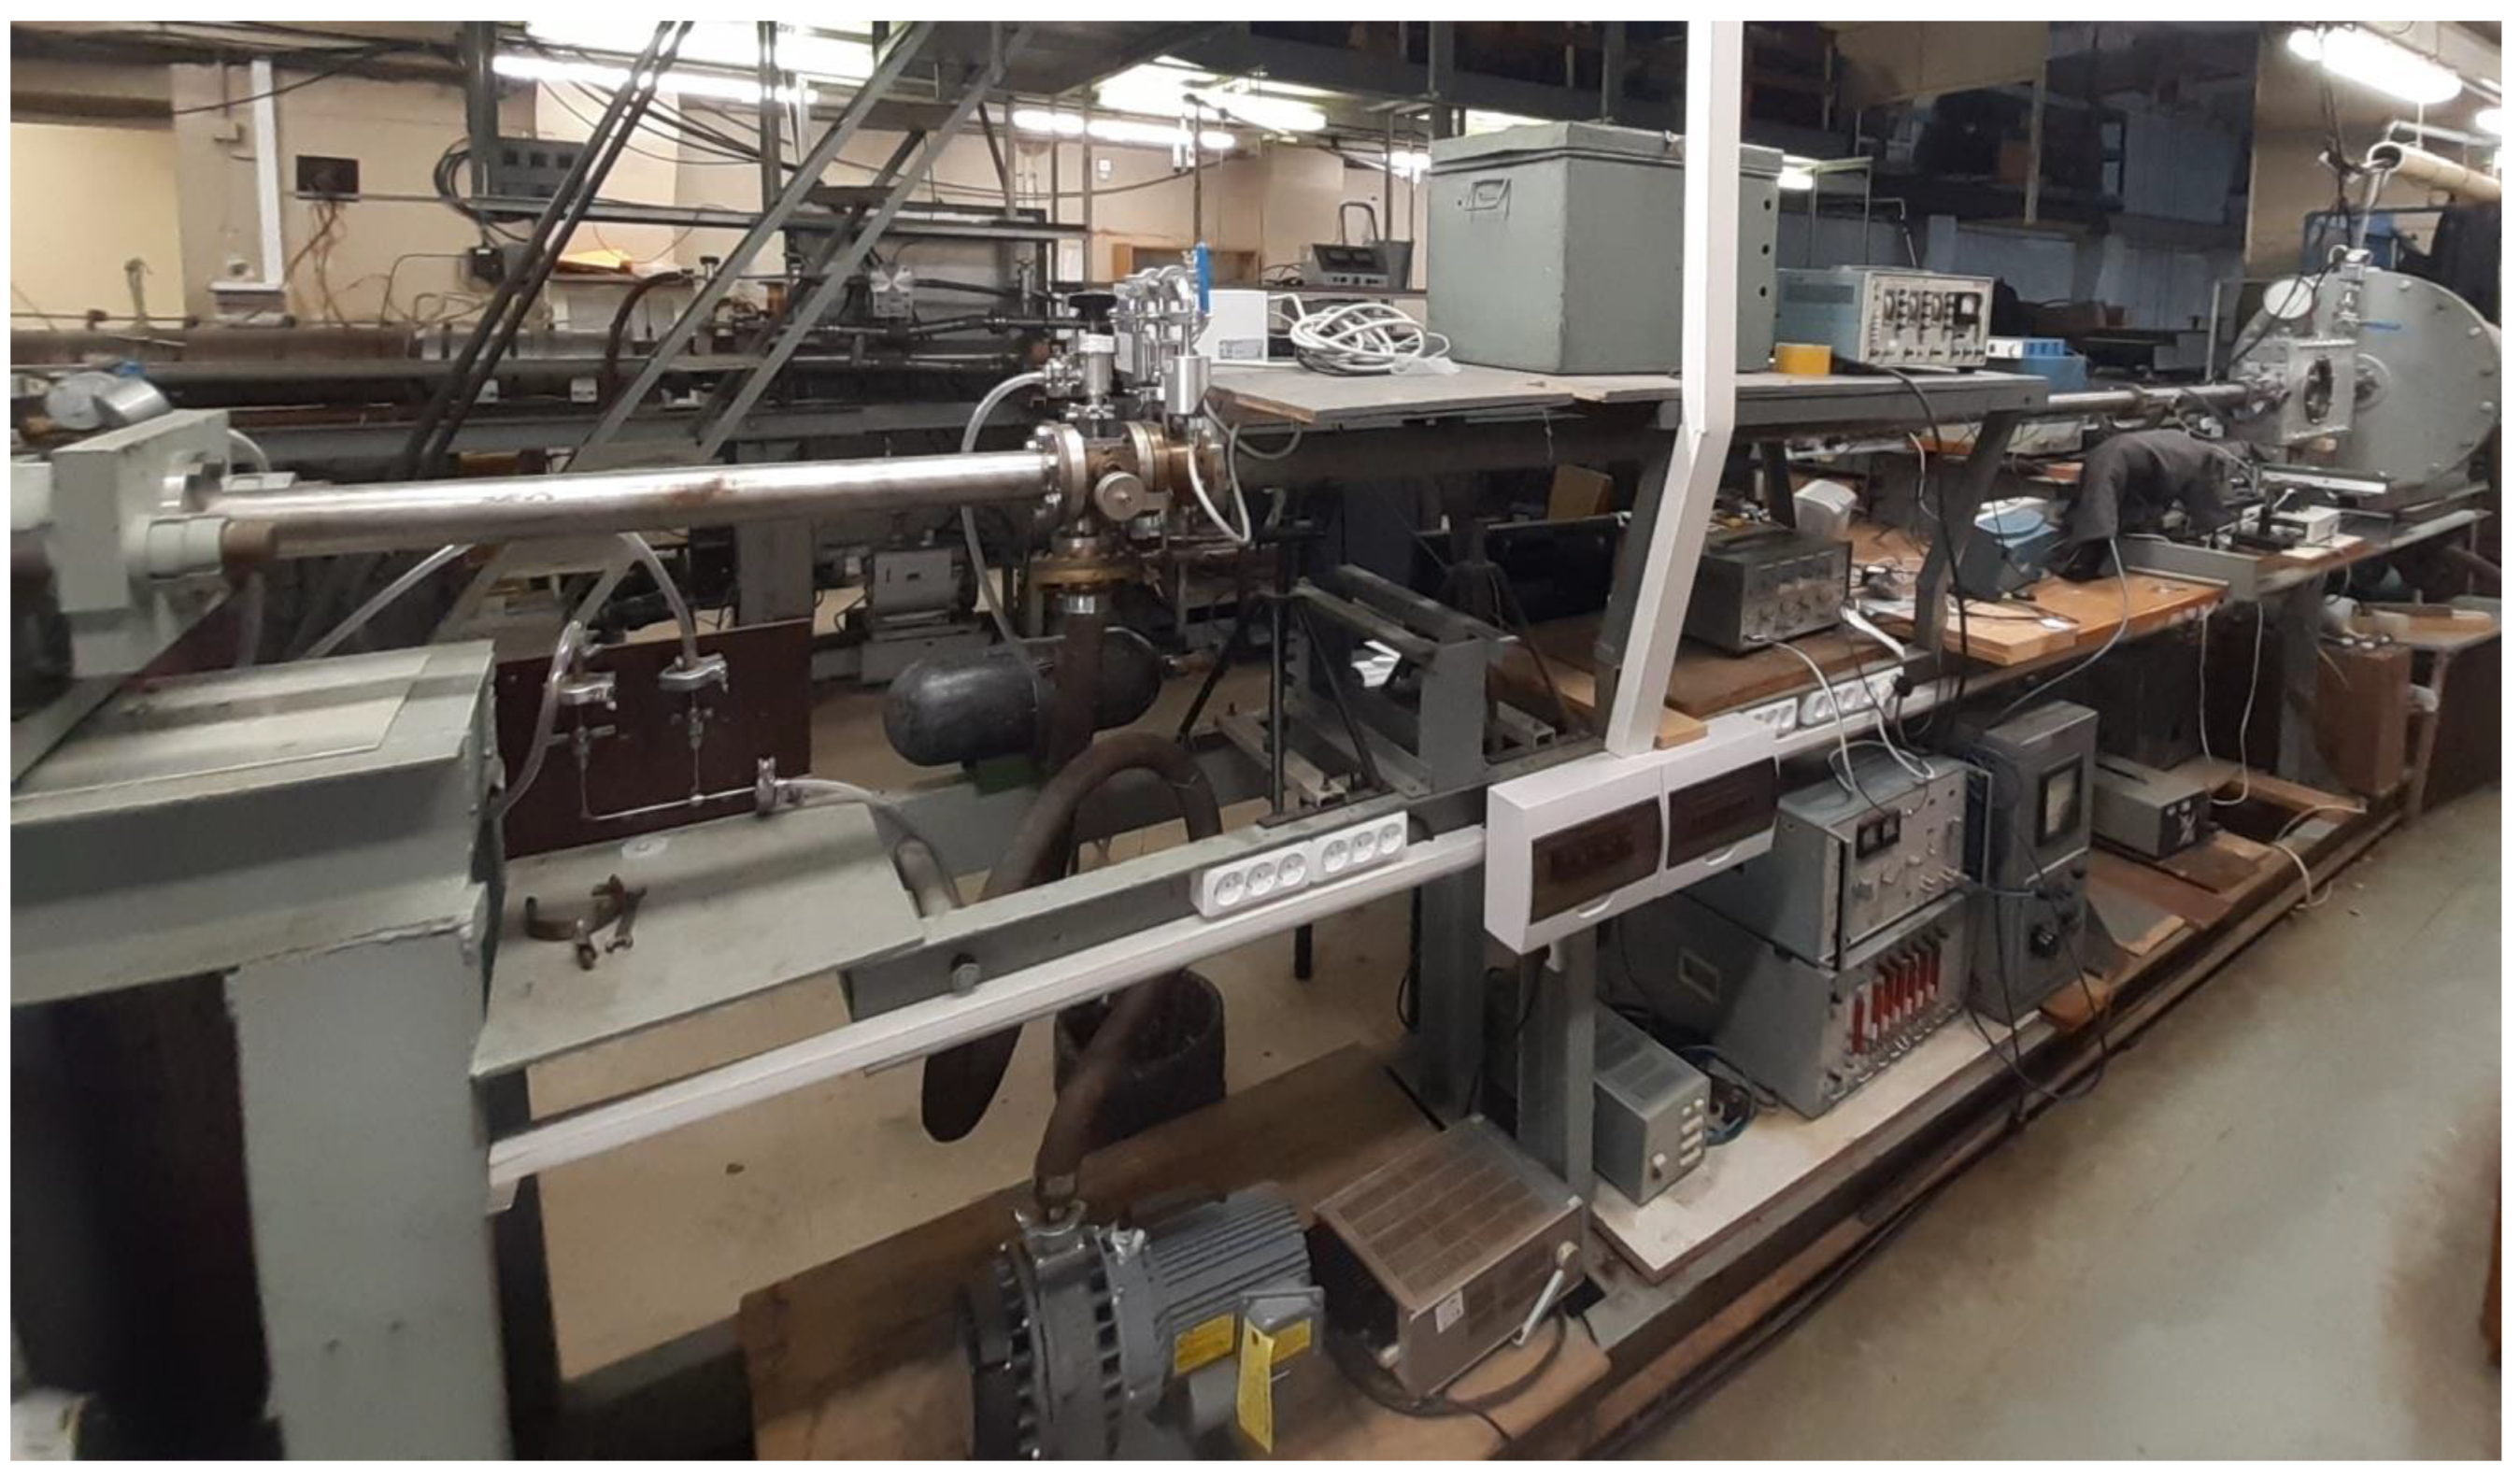
Figure 3.
Photograph of the experimental bench.
Figure 3.
Photograph of the experimental bench.
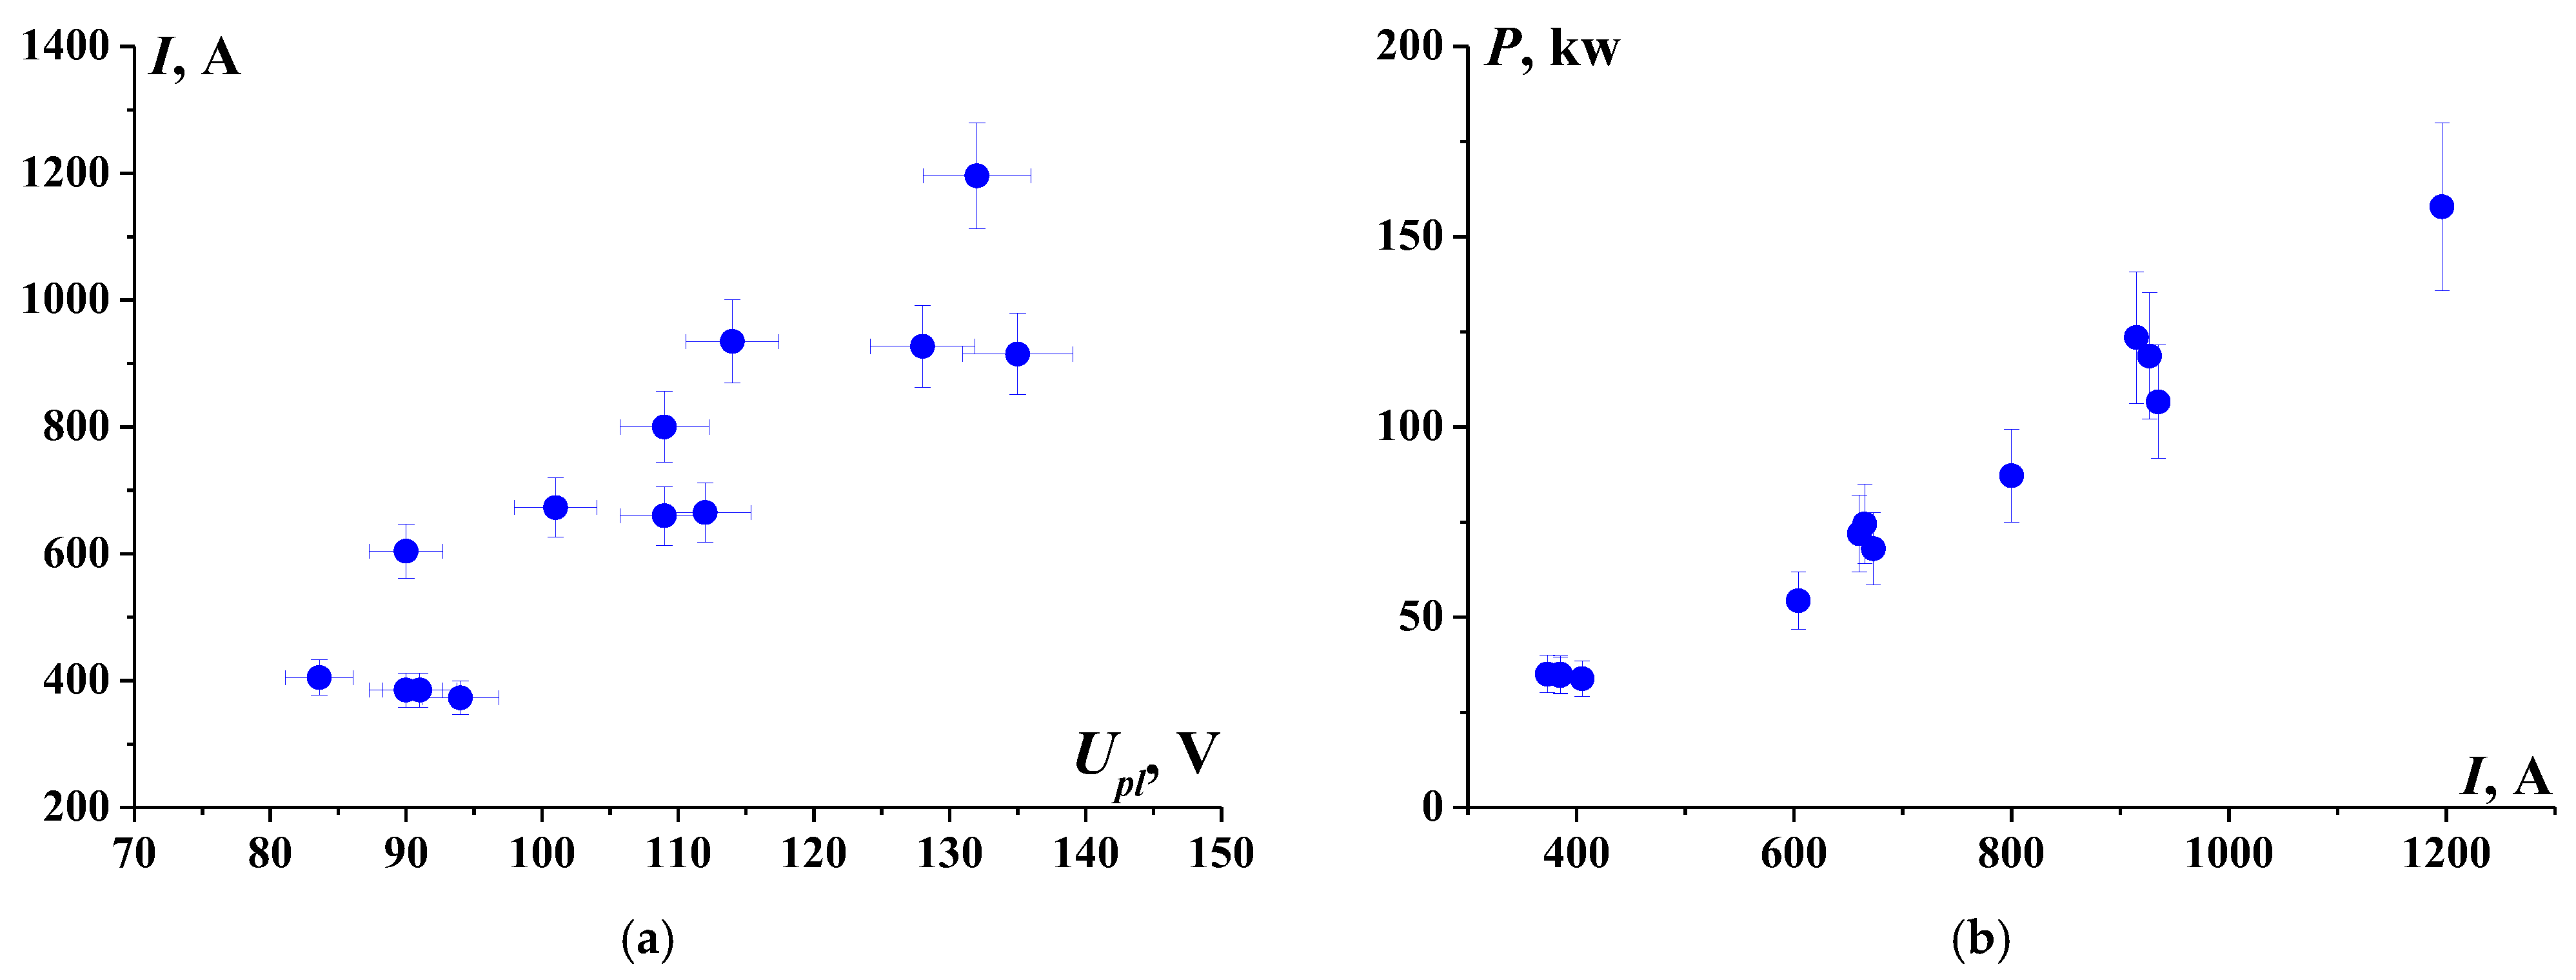
Figure 4.
Volt-ampere characteristic of a gas discharge at the surface of a model (a); power input into the discharge (b).
Figure 4.
Volt-ampere characteristic of a gas discharge at the surface of a model (a); power input into the discharge (b).
Figure 5.
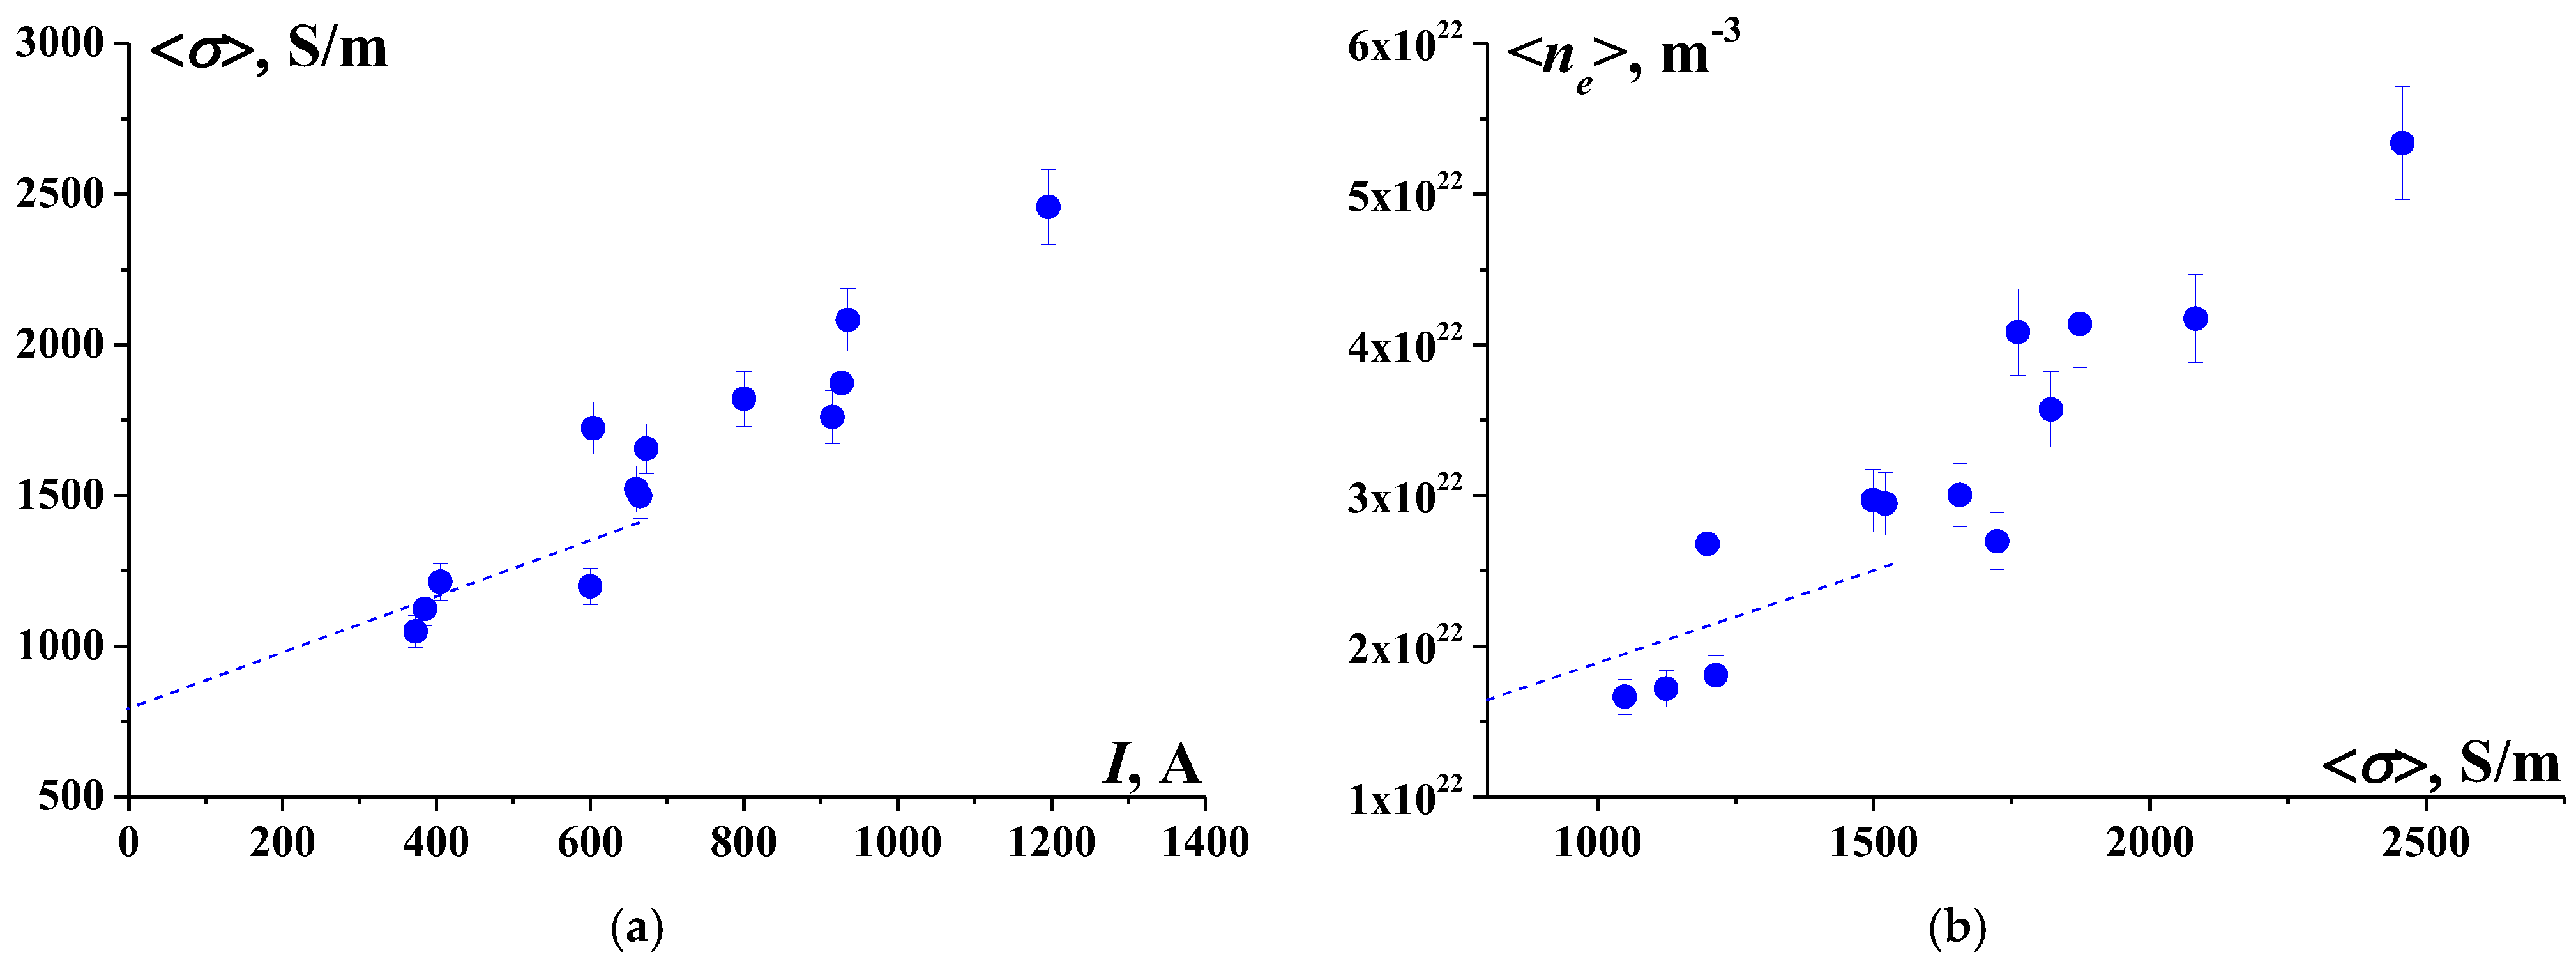
Dependence of the average plasma conductivity in the discharge core on the gas-discharge current (a) and the average values of electron concentration obtained in the discharge (b).
Figure 5.
Dependence of the average plasma conductivity in the discharge core on the gas-discharge current (a) and the average values of electron concentration obtained in the discharge (b).
Figure 6.
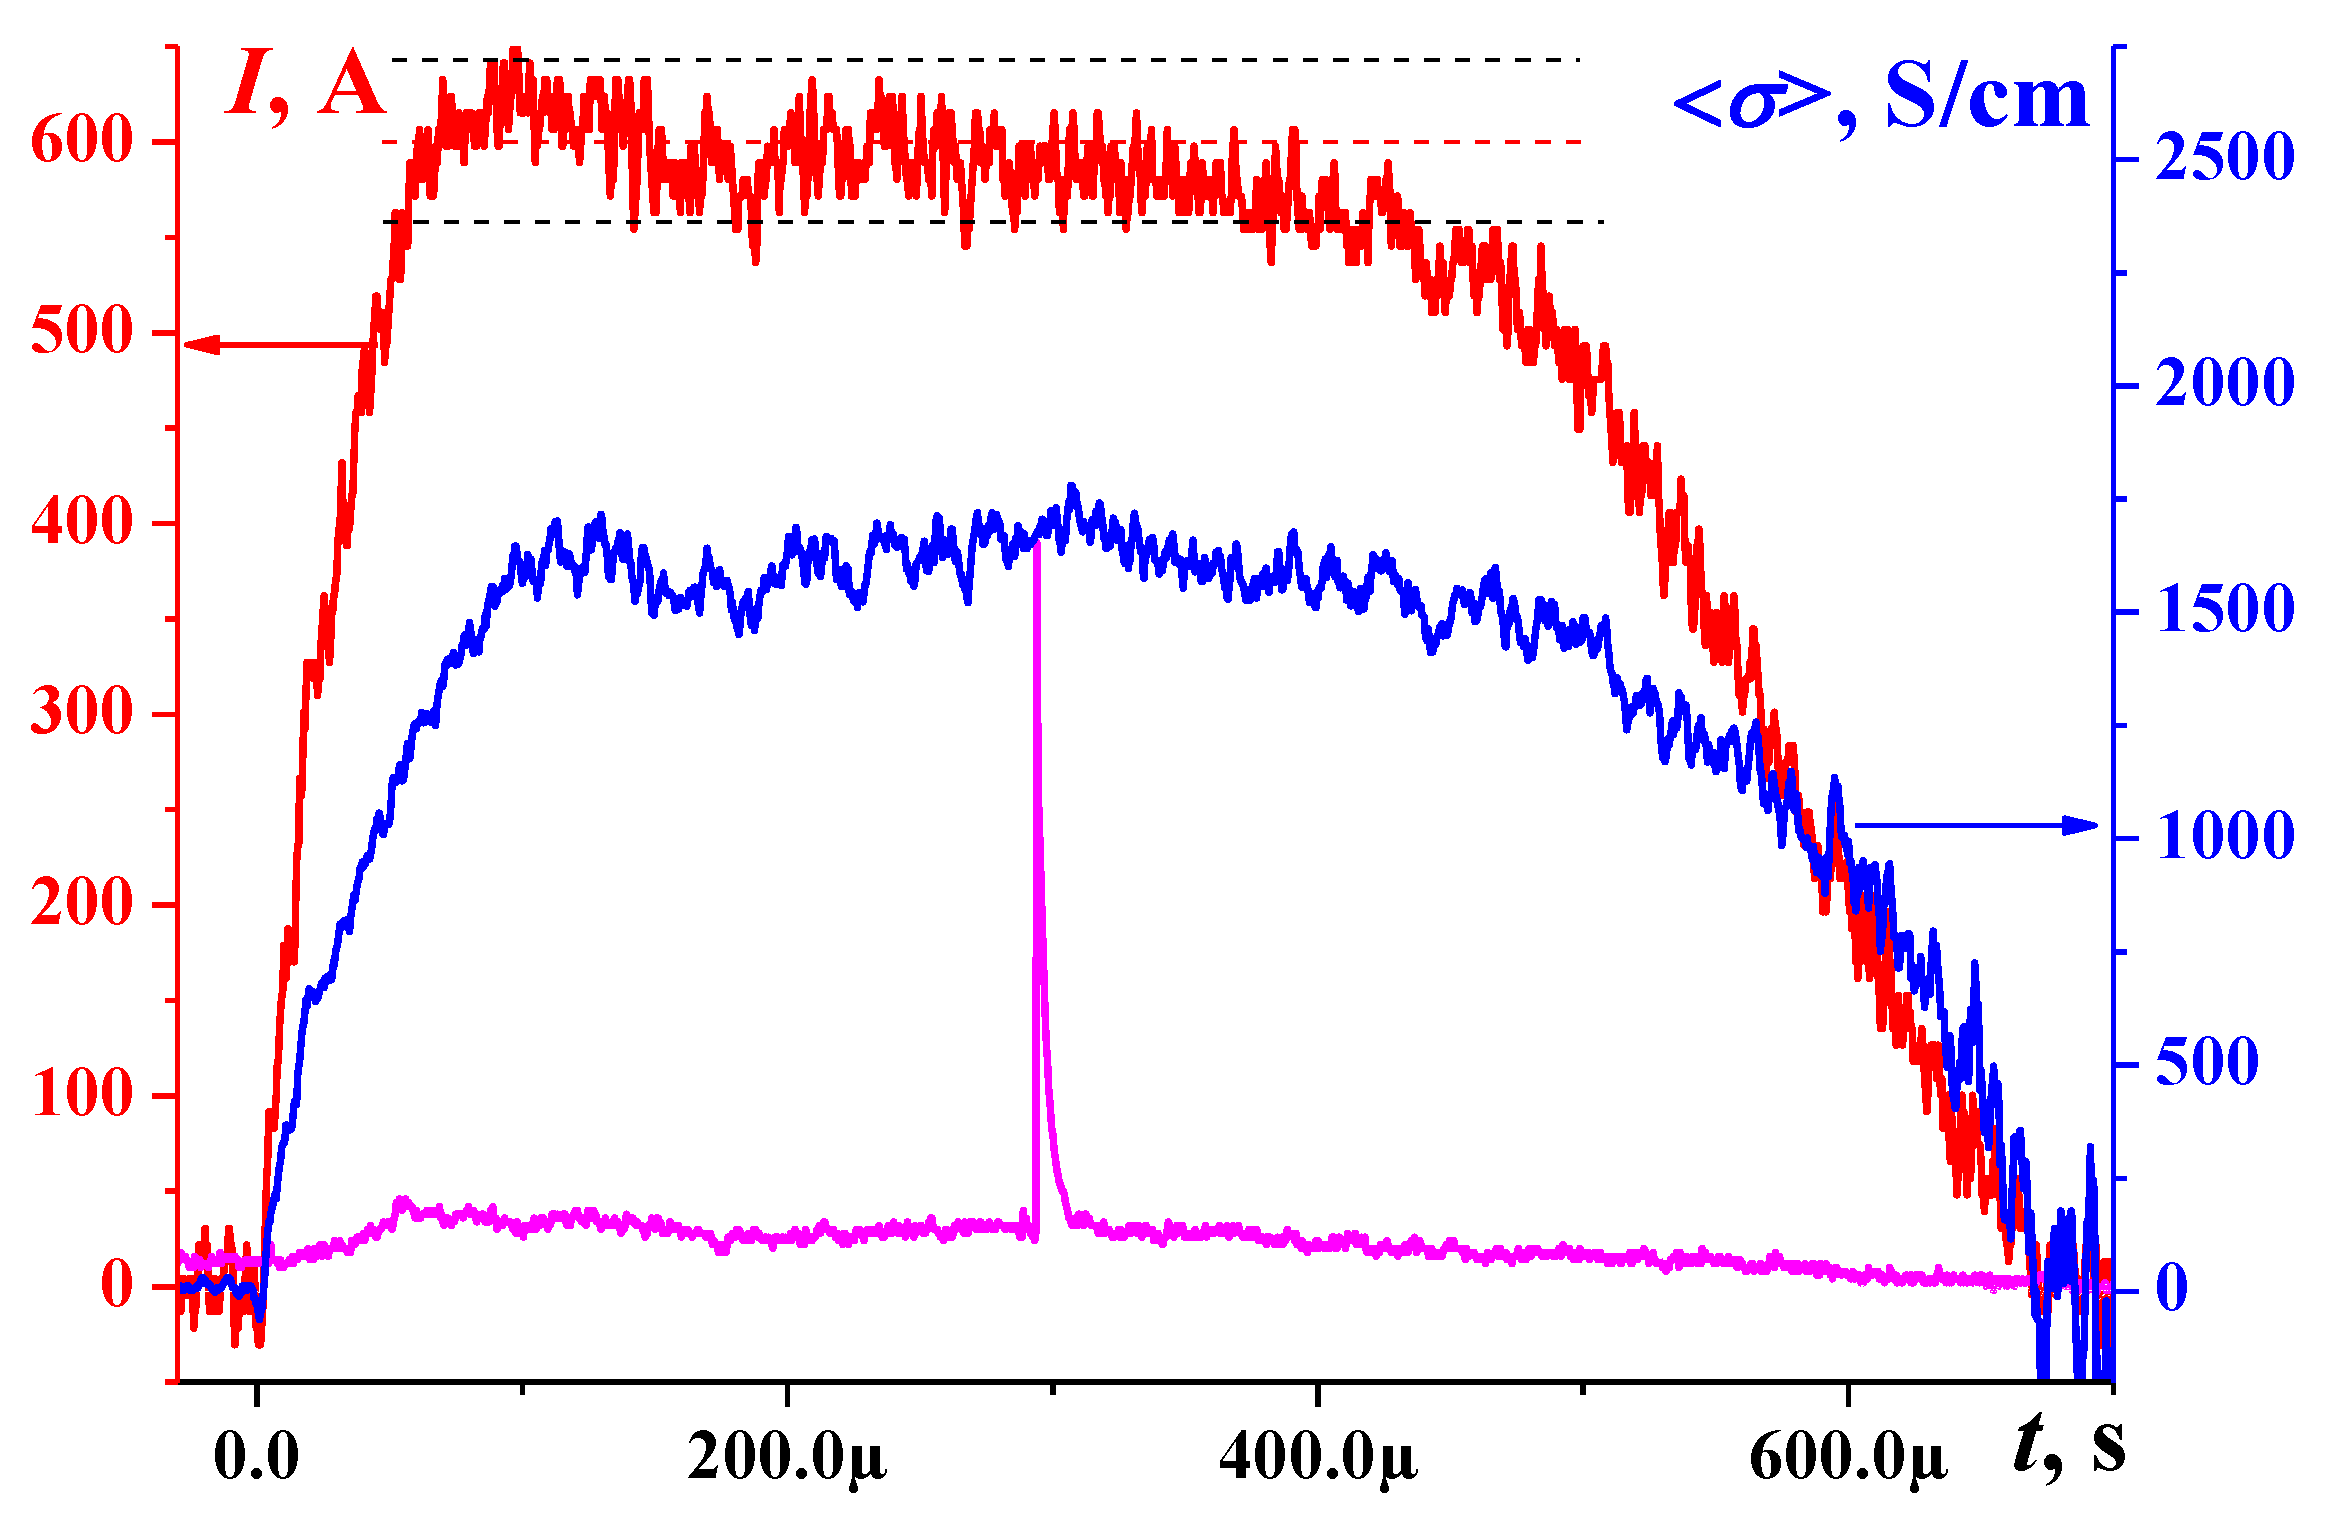
Oscillograms of gas discharge current and plasma conductivity in the area of the plasma impact (here t is the time counted from the moment of the flow reaching the front surface of the body).
Figure 6.
Oscillograms of gas discharge current and plasma conductivity in the area of the plasma impact (here t is the time counted from the moment of the flow reaching the front surface of the body).
Figure 7.
Change in the flow pattern with increasing discharge intensity for a surface discharge in xenon; a) I=370 A, P=35 kW; b) I=670 A, P=68 kW; c) I=915 A, P=124 kW.
Figure 7.
Change in the flow pattern with increasing discharge intensity for a surface discharge in xenon; a) I=370 A, P=35 kW; b) I=670 A, P=68 kW; c) I=915 A, P=124 kW.
Figure 8.
Plasma's own glow during surface discharge; a) I=0; b) I=370 A, P=35 kW; ; c) I=915 A, P=124 kW.
Figure 8.
Plasma's own glow during surface discharge; a) I=0; b) I=370 A, P=35 kW; ; c) I=915 A, P=124 kW.
Figure 9.
Distribution of the main flow parameters along the nozzle axis.
Figure 9.
Distribution of the main flow parameters along the nozzle axis.
Figure 10.
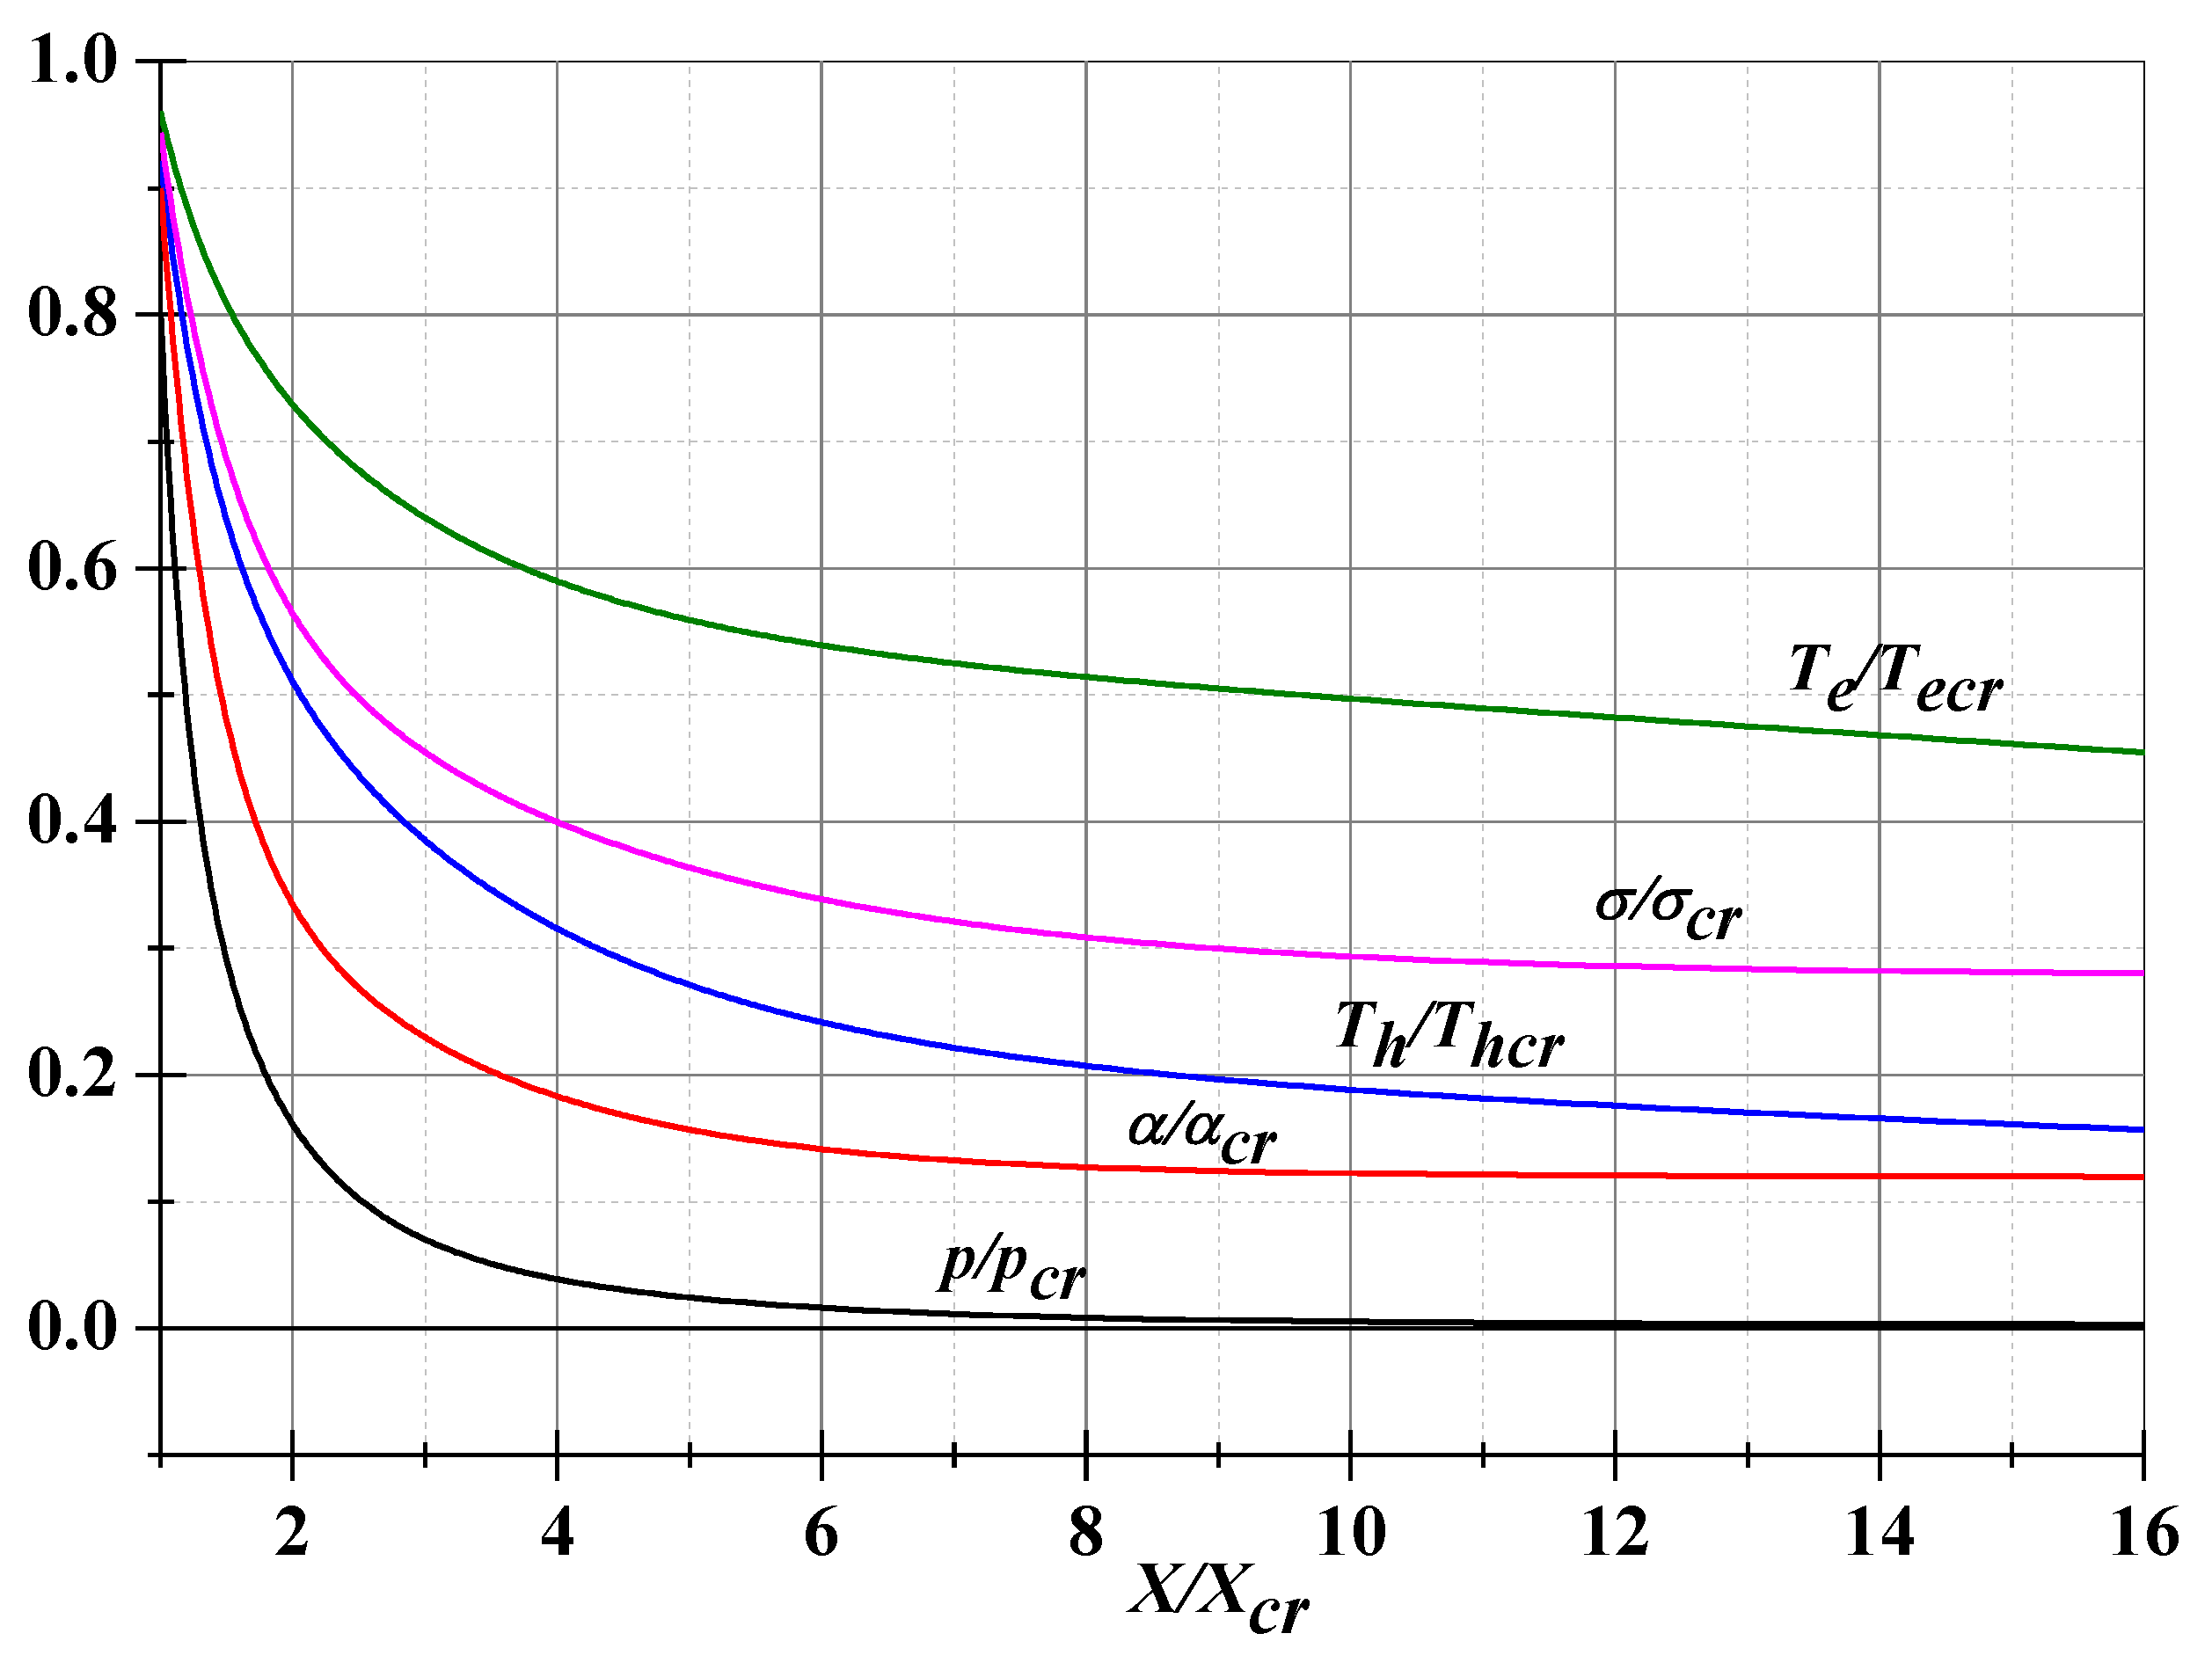
Dependence of the adiabatic index on the degree of nonequilibrium at Th=1200K and α=0.0018.
Figure 10.
Dependence of the adiabatic index on the degree of nonequilibrium at Th=1200K and α=0.0018.
Figure 11.
Statement of the problem (schematic).
Figure 11.
Statement of the problem (schematic).
Figure 12.
The position of a part of the front surface of the body on a computational grid (enlarged, every forth node is shown).
Figure 12.
The position of a part of the front surface of the body on a computational grid (enlarged, every forth node is shown).
Figure 13.
Density fields in isochores obtained on the three difference grids.
Figure 13.
Density fields in isochores obtained on the three difference grids.
Figure 14.
Dynamics of flow parameters during establishment of a steady-state flow regime, obtained on three difference grids: a), b) density and pressure at the central point of the cylindrical surface of the body; c) x-coordinate of the bow shock wave; d) drag force of the frontal surface of the body.
Figure 15.
A comparison between the experimental and numerical flow pictures, γ=1.217, γs=1.258, q=0.
Figure 15.
A comparison between the experimental and numerical flow pictures, γ=1.217, γs=1.258, q=0.
Figure 16.
Fields of density (a), pressure (b), temperature (c) and local Mach number (d) in the absence of a discharge, q=0, steady flow mode, t=2.0, γ =1.217, γs =1.258.
Figure 16.
Fields of density (a), pressure (b), temperature (c) and local Mach number (d) in the absence of a discharge, q=0, steady flow mode, t=2.0, γ =1.217, γs =1.258.
Figure 17.
a) Density fields in isochores for different values of specific power q; b) relative bow shock wave stand-off distance vs specific power; t=2.0, γ =1.217, γs =1.258.
Figure 17.
a) Density fields in isochores for different values of specific power q; b) relative bow shock wave stand-off distance vs specific power; t=2.0, γ =1.217, γs =1.258.
Figure 18.
Dynamics of density (a), pressure (b), temperature (c) at the stagnation point of the cylinder, relative drag force (d), end the x-coordinate of bow shock front for different values of q during the steady flow establishing (e); t=2.0, γ =1.217, γs =1.258.
Figure 18.
Dynamics of density (a), pressure (b), temperature (c) at the stagnation point of the cylinder, relative drag force (d), end the x-coordinate of bow shock front for different values of q during the steady flow establishing (e); t=2.0, γ =1.217, γs =1.258.
Figure 19.
Fields of density (a), pressure (b), temperature (c) and local Mach number (d) for q=200, γ∞ =1.217, γs =1.29 steady flow mode, t=2.0.
Figure 19.
Fields of density (a), pressure (b), temperature (c) and local Mach number (d) for q=200, γ∞ =1.217, γs =1.29 steady flow mode, t=2.0.
Figure 20.
Density fields in isochores for different values of adiabatic index in the xenon plasma area γs (a) (overlay of enlarged images) and relative bow shock wave stand-off vs γs (b); steady flow mode, t=2.0, q=100, γ=1.217.
Figure 20.
Density fields in isochores for different values of adiabatic index in the xenon plasma area γs (a) (overlay of enlarged images) and relative bow shock wave stand-off vs γs (b); steady flow mode, t=2.0, q=100, γ=1.217.
Figure 21.
Dependence of the relative value of the steady bow shock stand-off distance on the discharge power.
Figure 21.
Dependence of the relative value of the steady bow shock stand-off distance on the discharge power.
Figure 22.
Comparison of the numerical flow patterns with the schlieren images of the near-surface discharge action in xenon; a) I=370 A, P=35 kW; b) I=670 A, P=68 kW; c) I=915 A, P=124 kW.
Figure 22.
Comparison of the numerical flow patterns with the schlieren images of the near-surface discharge action in xenon; a) I=370 A, P=35 kW; b) I=670 A, P=68 kW; c) I=915 A, P=124 kW.
Figure 23.
Dependence of the adiabatic index on the degree of nonequilibrium in the impact zone for different values of the discharge current.
Figure 23.
Dependence of the adiabatic index on the degree of nonequilibrium in the impact zone for different values of the discharge current.
Figure 24.
Dependence of the adiabatic index on the degree of ionization in the impact zone for different values of the discharge current at thermodynamic equilibrium.
Figure 24.
Dependence of the adiabatic index on the degree of ionization in the impact zone for different values of the discharge current at thermodynamic equilibrium.
Figure 25.
Comparison of the values of the adiabatic index γ
s obtained in numerical simulation and calculated using the theory of K. Burm et al. [
24] in the dependence on the gas discharge current (a) and the specific power (b).
Figure 25.
Comparison of the values of the adiabatic index γ
s obtained in numerical simulation and calculated using the theory of K. Burm et al. [
24] in the dependence on the gas discharge current (a) and the specific power (b).
Table 1.
Grid convergence analysis*.
Table 1.
Grid convergence analysis*.
| Difference grid |
A number of working nodes in the grid |
The values of time steps hx, hy
|
Relative error, pt:abs(pt - pt theor)/ pt theor ×100% |
Relative error, ρt:abs(ρt - ρt theor)/ ρt theor ×100% |
| Grid 1 |
5.625×10⁶
|
hx=hy=0.001 |
0.091% |
1.080% |
| Grid 2 |
2.758×10⁶
|
hx=hy=0.0014286 |
1.011% |
5.798% |
| Grid 3 |
9.0×10⁵
|
hx=hy=0.0025 |
1.609% |
6.608% |
Table 2.
Defining parameters of the oncoming flow and normalizing coefficients.
Table 2.
Defining parameters of the oncoming flow and normalizing coefficients.
| Description |
Dimensional value |
Dimensionless value |
Normalizing coefficient |
| Freestream Mach number M∞ |
|
6.8 |
|
| Adiabatic index in freestream flow γ |
|
1.217 |
|
| Reynolds number Re |
|
4558.9 |
|
| Prandtl number Pr |
|
0.623 |
|
| Freestream gas pressure p∞ |
3.1·103 Pa |
1.0 |
pn= p∞
|
| Freestream gas density ρ∞ |
0.040793 kg/m3
|
1.0 |
ρn= ρ∞
|
| Freestream gas temperature T∞
|
1200 K |
1.0 |
Tn= T∞
|
| Adiabatic index in oncoming flow γ∞
|
|
1.217 |
|
| Specific power in the plasma region q
|
|
|
qn= pn/ (tn ρn)= =0.698299×10⁶ kW/kg |
| Body’s diameter D
|
3×10⁻² m |
1.0 |
ln=D=3×10⁻² m |
| Velocity u
|
2067.96 m/s |
7.502 |
un=(pn / ρn)0.5= 275.668 m/s |
| Time t
|
|
1.0 |
tn=ln/un=108.827 µs |
Table 3.
Correspondence between the discharge current I, the specific power q, and the adiabatic index γs.
Table 3.
Correspondence between the discharge current I, the specific power q, and the adiabatic index γs.
|
I, A |
0 |
373 |
604 |
673 |
800 |
915 |
| q |
0 |
52 |
82.5 |
119.5 |
147.2 |
213.3 |
|
qdim×10-6 kW/kg |
0 |
36.312 |
57.610 |
83.447 |
102.790 |
148.947 |
| γs
|
1.258 |
1.256 |
1.25 |
1.275 |
1.253 |
1.288 |
Table 4.
Correspondence between the discharge current
I, power
P, the average parameters in the plasma zone, the electron density n
e, the degree of ionization α, and the adiabatic index γ
s for Ɵ=1 (calculated using the theory of K. Burm et al. [
24]).
Table 4.
Correspondence between the discharge current
I, power
P, the average parameters in the plasma zone, the electron density n
e, the degree of ionization α, and the adiabatic index γ
s for Ɵ=1 (calculated using the theory of K. Burm et al. [
24]).
|
I, A |
P, W |
ρa, kg/m3 |
Ta, K |
pa, P |
ne*10-22
|
α |
γs for Ɵ=1 |
| 0 |
0 |
0.19180 |
7530.2 |
94900.9 |
1.65 |
0.01871 |
1.26 |
| 373 |
35099.2 |
0.17759 |
8507.3 |
95868.2 |
2.03 |
0.02486 |
1.262 |
| 604 |
54166.8 |
0.17275 |
9003.6 |
96546.7 |
2.70 |
0.03399 |
1.245 |
| 673 |
66345.3 |
0.146076 |
10905.1 |
96281.7 |
3.0 |
0.04467 |
1.269 |
| 800 |
86576.5 |
0.154749 |
10647.2 |
97396.8 |
3.57 |
0.05018 |
1.252 |
| 915 |
124693 |
0.125886 |
14064.2 |
98334.9 |
4.08 |
0.07049 |
1.295 |
