Preprint
Article

An Approach to Studying Emotional Responses to Sustainability Materials Taking Natural Wood and Artificial Boards as Examples

This version is not peer-reviewed.

Submitted:

15 October 2024

Posted:

16 October 2024

You are already at the latest version

Abstract
Natural wood is generally perceived as expensive, while wood-based boards are cheap, but re-search has yet to explain definitively why these two materials receive such disparate evaluations. This study aimed to uncover the reasons behind this phenomenon by proposing an emo-tion-driven approach to material research. We collected 10 types of natural wood and artificial boards as experimental samples and tested 20 subjects' subjective evaluation of the samples and physiological indicators (electroencephalography and electrodermal activity). Through data analysis, we identified the relationships between the subjective and physiological data and the impact of material composition on these data. Specifically, we observed significant correlations between subjective and physiological data; however, no correlation was found between subjective and physiological valence. We also discovered that the components of materials significantly influence participants' subjective and physiological emotions. For example, materials with a rough texture elicited higher positive affectivity than those with a smooth texture, materials with coarse and mixed textures elicited higher positive affectivity than those with fine textures, and the brighter materials evoke more positive emotions in participants. This study revealed how material components influence participants' emotions and, more importantly, analyzed the processing techniques behind these components, providing a theoretical basis for the future development of high-value-added products made from wood-based boards.
Keywords: 
Subject: 
Arts and Humanities  -   Art

1. Introduction

As one of Earth's most abundant biological resources, wood holds tremendous potential for providing green energy and supporting a sustainable future [1]. Due to its
unique beauty, durability, and natural feel, wood has long been used in interior furnishings and is even referred to as the "most human-friendly material" [2]. However, as resources become increasingly scarce and environmental awareness grows, the high cost of natural wood has led many consumers and designers to turn to artificial boards. Although artificial boards offer advantages in terms of price and sustainability, they are often perceived as cheap and lacking in texture [3,4]. This perceptual difference extends beyond functional comparisons to include the impact of material properties on consumers’ emotions and psychology. [5]
Wood can be classified as softwood or hardwood based on the species and texture. Softwoods, typically from coniferous trees such as pine and cedar, are lighter and have lower density. These trees generally grow faster and are more abundant, making them easier and cheaper to harvest in large quantities. Conversely, hardwoods come from deciduous trees like oak, walnut, and cherry, which are usually denser and more esthetically pleasing, thus commanding higher prices [6]. Hardwood species often have long growth cycles, taking decades or even centuries to mature, which makes them scarcer and, consequently, more expensive.
Despite the relative scarcity of wood resources in China, there has been a strong demand for wooden furniture in the Chinese market. This is due not only to solid wood furniture's durability and esthetic appeal, but also to the cultural connection with wooden furniture in Chinese tradition. To meet market demand and address the issue of limited wood resources, artificial boards have gradually emerged in the home furnishings market. Artificial boards typically comprise sustainable materials such as particleboard and medium-density fiberboard (MDF). These boards come from fast-growing, low-cost trees like poplar, eucalyptus, and pine. By processing these fast-growing woods into chips or fibers and then shaping them under high temperature and pressure, these wood-based board products exhibit excellent mechanical properties, such as high strength and stability [7].
Due to these excellent properties and the fact they are composed of sustainable raw materials, artificial boards have garnered significant attention in the fields of materials, engineering, and environmental science [8,9,10]. However, the market price and acceptance of artificial boards are generally lower than those of natural wood. For example, artificial boards are often made from wood chips or fibers, resulting in an irregular surface texture that contrasts sharply with the more uniform grain of natural wood. People prefer wood with regular grain patterns, making artificial board inferior and therefore cheap [3]. In recent years, researchers have sought to improve the raw material form of artificial boards, altering their mechanical properties and creating different visual effects [11,12]. For instance, oriented-strand board (OSB) has a distinct wood chip form and relatively uniform orientation, creating a unique natural and rugged esthetic [13], and is often used in decorations. For interior furniture, manufacturers apply wood grain-like decorative veneers to artificial board surfaces to make them more closely resemble natural wood [14]. This approach can mitigate some of the negative perceptions of artificial boards, and decorative veneers have gained wide acceptance. Current research on decorative veneers for artificial boards primarily focuses on the effects of impregnation resins on decorative paper and the performance of veneered artificial boards [15,16,17,18].
While veneers can mimic the look of various kinds of wood, they can feel and look monotonous compared to real natural wood. In addition, the repetitive nature of veneer patterns can make the decorative effect less unique than that of natural wood. Engaging in a deep understanding of the evaluative differences between natural wood and veneered artificial boards is particularly important as material processing technology and esthetic preferences evolve.
Scholars have noted that, beyond functional differences, the perception of material properties is a key factor influencing consumer evaluations [5]. The market success of new materials depends not only on their functionality but also on the sensations they evoke. The appreciation of a product partly stems from its material characteristics, which define its appearance and elicit emotional responses that influence purchasing behavior [19]. Recent studies indicate that the appeal of materials is determined by their semantic, expressive, sensory, and emotional attributes, which are considered crucial components of purchasing decisions [20]. As such, the sensory, expressive, and emotional dimensions of materials are becoming important factors affecting their practical applications.
Researchers have engaged in extensive discussions and conducted many experiments on the relationship between materials and human evaluations, focusing primarily on the psychological (subjective) and physiological levels. This article explores research methods for investigating these two levels and provides examples of their combined use.
For the psychological level, researchers employ psychological scales and surveys as powerful tools to investigate the relationship between materials and participants. These instruments, designed to capture participants' subjective emotional responses, play a pivotal role in understanding how materials influence subjective evaluations [21,22,23,24].
For example, the SAM scale, designed by Professors Bradley and Lang from the Center for Emotion and Attention at the University of Florida, is an emotion self-assessment rating system used to measure emotional responses. The SAM scale is based on the PAD (pleasure, arousal, dominance) emotional dimension model [25]. SAM employs a series of images to represent varying levels of each dimension, allowing participants to select the image that best represents their emotional state. Initially, SAM was used in human–computer interaction evaluations and was later adapted to a paper-and-pencil version for group and cluster screening.
Mainstream emotion theories posit that human emotions comprise two opposing dimensions: positive affect and negative affect [26]. The former includes emotional experiences such as enthusiasm, alertness, and liveliness, while the latter includes experiences such as distress, numbness, and quietness [27]. The PANAS scale, developed by Watson and colleagues in 1988, is the most widely used tool for measuring these two dimensions of affect worldwide [28].
The SAM and PANAS scales differ in both their measurement dimensions and methodologies. Specifically, in terms of measurement dimensions, the SAM scale evaluates emotions through three dimensions, pleasure, arousal, and dominance, although some researchers simplify it to focus on just pleasure and arousal [19]. In contrast, the PANAS scale assesses emotions using two dimensions: positive affect and negative affect. The SAM scale employs a pictorial self-assessment method that emphasizes immediate emotional responses. Participants choose the images that best represent their current emotional state. The PANAS scale, on the other hand, uses a questionnaire format where participants rate specific emotion-related words, emphasizing their emotional state over a specific period. By combining these two scales, researchers can capture participants’ immediate emotional reactions and overall emotional states within a defined timeframe, thus providing a more comprehensive emotional profile. The pictorial assessment of the SAM scale can capture subtle, instantaneous changes in emotion, while the lexical scoring of the PANAS scale offers a detailed description of emotional experiences. Together, they complement each other, enhancing the precision and reliability of the measurements.
Despite the potential for self-reports to introduce subjective bias (Participants may adjust their responses based on social or organizational expectations to meet others' expectations of them or to avoid negative evaluations), these methods provide crucial preliminary data and a theoretical foundation for understanding the emotional impact of materials.
On the physiological level, researchers reveal the impact of materials on people’s emotions by recording and analyzing physiological indicators [29,30]. Variations in physiological signals often accompany human emotional changes. Compared to facial expressions or vocal signals, physiological signals more accurately reflect actual emotional states because facial and vocal representations are less nuanced and can be easily disguised [31]. Thus, physiological signals are crucial inputs in affective computing. In the context of material emotion measurement, researchers have identified electroencephalography (EEG) and electrodermal activity (EDA) as essential sources of information on people’s emotional states [32,33,34,35].
Hwang et al. noted that EEG holds inherent advantages in measuring emotions [36]. EEG directly detects brainwaves, or neural activity, from the central nervous system, whereas other responses (such as EDA, heart rate, and blood volume pulse) originate from peripheral nervous system activity. The central nervous system is linked to various aspects of emotion (e.g., unpleasant, or pleasant, relaxed or excited). In contrast, peripheral nervous system activity only relates to arousal and relaxation. Therefore, EEG can provide richer information about emotional states than other methods [37,38].
EDA significantly aids in emotion recognition. It is one of the most sensitive emotional feedback mechanisms, originating from the autonomic activation of sweat glands in the skin. EDA is closely related to emotions, arousal, and attention, making it one of the most widely used indicators of physiological response [39]. Due to its high stability, ease of measurement, and high sensitivity, EDA is considered one of the most influential and sensitive physiological parameters for reflecting changes in sympathetic nervous system arousal. It is a reliable indicator for evaluating physiological arousal, cognitive load, effort, emotional response, and stress capacity.
Some researchers combine subjective evaluations with physiological measurements to obtain more comprehensive and objective emotional data [40]. The combined approach of assessing subjective emotions using emotional scales while simultaneously recording physiological data captures both participants' subjective emotional experiences and their physiological reactions, providing a more holistic emotional dataset. Through dual measurement, researchers can more accurately assess the impact of materials on people’s emotions, reducing the potential bias of a single-method approach. This methodology offers new perspectives on the complex relationship between materials and emotions and reveals new directions for future research on materials and their applications.
Combining psychological (subjective) assessments with physiological measurements to provide more comprehensive and objective data on emotional responses to materials has numerous advantages; Individual biases or social expectations may influence subjective assessments, while physiological measurements provide unconscious, non-verbal response data. Their combined use can correct or supplement biases in subjective reports and improve the accuracy of research. In addition, physiological measurements can capture instantaneous and dynamic changes in emotions, while subjective assessments usually reflect overall or retrospective emotions. Their combined use allows for a more fine-grained analysis of emotional responses. However, such studies still need to be conducted for wood. Supplementing research in this area can help us better understand how the characteristics of wood materials influence emotions.
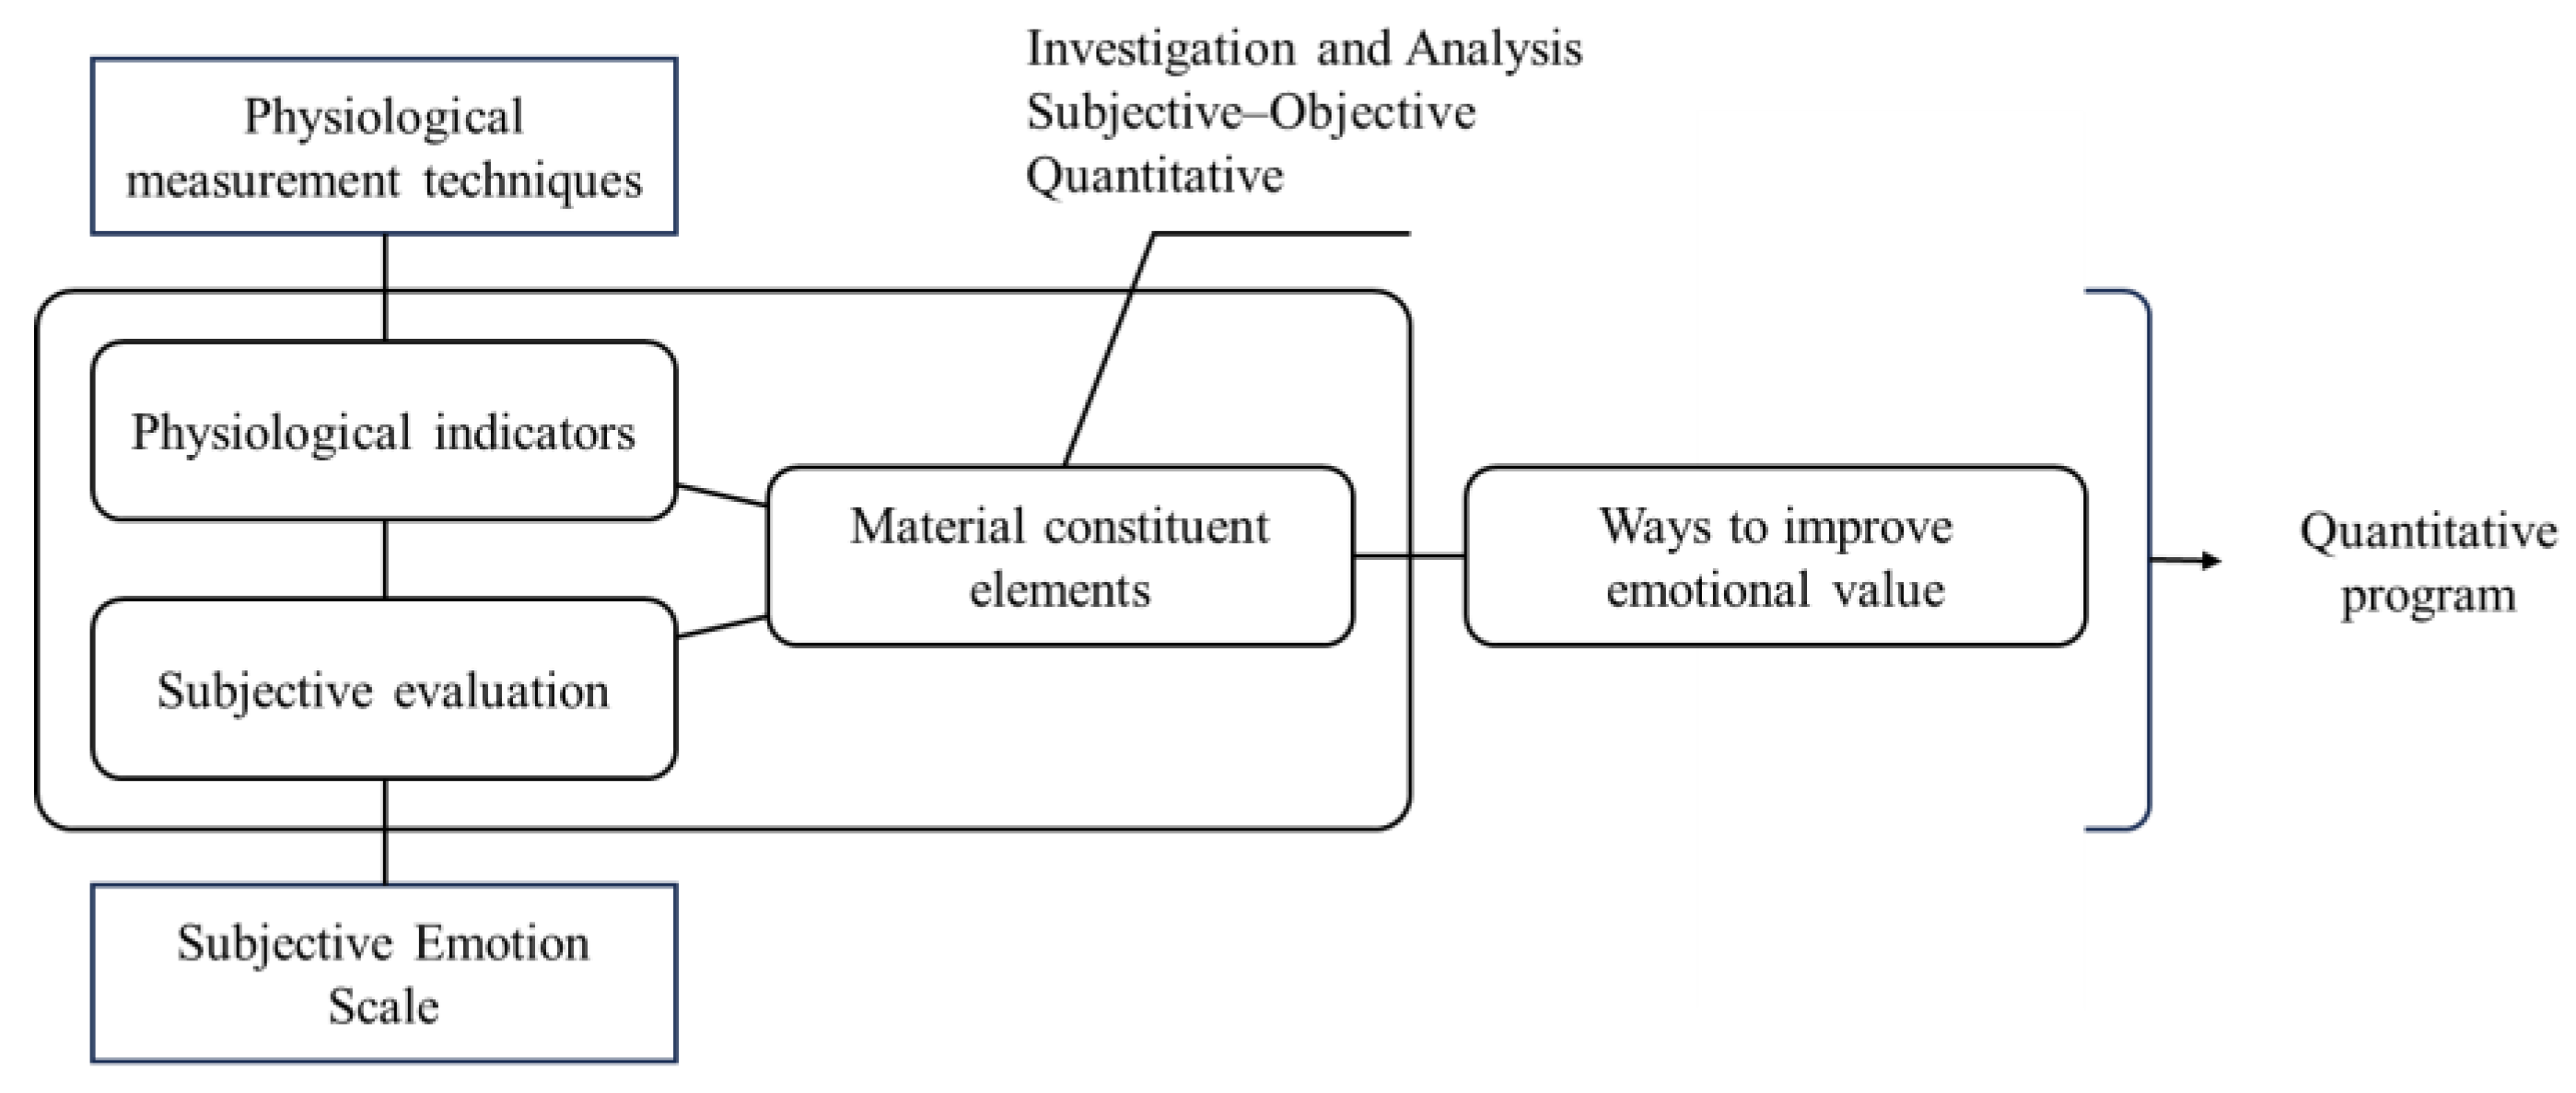
This research innovates by establishing a methodology to support the development of emotion-driven innovation in wood materials (Figure 1). By integrating research methods for studying both psychological and physiological levels, we conducted a comprehensive and multi-faceted analysis of the relationship between material characteristics and participants' emotions. We utilized emotional experience questionnaires to capture participants' subjective emotional responses while recording their physiological reactions using wearable physiological measurement devices, ensuring data synchronization and integration. We accounted for individual differences and strictly controlled the experimental environment. Our use of advanced data analysis techniques, coupled with our adherence to rigorous ethical standards, ensures the robustness of our results and provides new theoretical foundations and practical guidance for the design and application of wood materials.
The objectives of this study, listed below, are significant, as they will contribute to establishing a deeper understanding of people’s emotional responses to materials, a field that has not been extensively explored.
Analyze the relationship between subjective evaluations and physiological indicators: By quantitatively and qualitatively assessing participants' emotional responses when interacting with different materials, we aim to better understand the interplay between their individual emotional states and physiological reactions. This analysis will provide valuable insights into the complexity of emotional experiences.
Analyze differences in the subjective and physiological indicators of emotional responses to natural wood and artificial boards: We will compare the performance of these two types of materials from visual and tactile points of view to understand their impact on participants' emotions. Natural wood, with its natural texture and feel, may evoke more positive emotional responses, whereas artificial boards, due to their synthetic characteristics, might elicit different emotional experiences. Through this comparison, we can more comprehensively assess the potential emotional impact of different materials.
Analyze the impact of sample composition elements on subjective evaluations and physiological indicators: Through comprehensive sample analysis, we aim to identify critical factors influencing participants' emotional responses, thus providing a theoretical basis for further research on wood materials.
Through this study, we aim to quantitatively reveal the differences in emotional responses to natural wood and artificial boards. By identifying key elements within the materials’ composition that affect participants' emotional responses, we hope to significantly enrich our understanding of the relationship between emotions and materials, inspiring further research in this area.

2. Materials and Methods

This study involved showing participants different samples of natural wood and artificial boards and recording their physiological and subjective emotional responses to viewing each sample.

2.1. Participants

We referred to the sample sizes used in related studies from the past two years to choose the number of participants for our study [40,41,42]. Ultimately, we recruited a total of 24 university students. However, due to equipment malfunction (Some electrodes fell off during EEG data monitoring.) and abnormal participant data (Outliers caused by signal interference) during the experiment, the final valid sample size was 20 (including 15 undergraduates and 5 postgraduates, 10 males and 10 females) aged 18 to 25. All participants had normal or corrected-to-normal vision, no tactile impairment or history of neurological disorders, and normal olfactory function. To ensure the accuracy of data collection, we required all participants to abstain from drinking alcohol and coffee and staying up late within the 24 hours before the experiment. Each participant was informed about the procedures required for the experiment and provided written consent. This study was conducted in accordance with the Declaration of Helsinki and received approval from the Research Ethics Committee of Shantou University.

2.2. Experimental Sample Selection and Classification

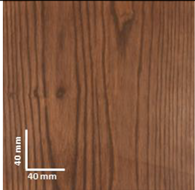
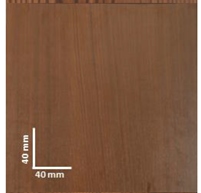
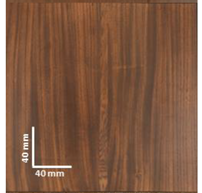
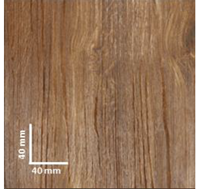
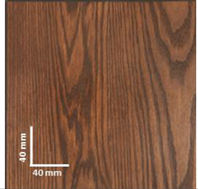
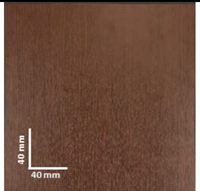
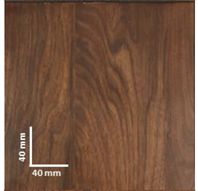
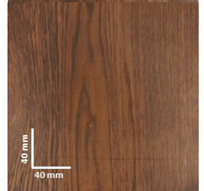
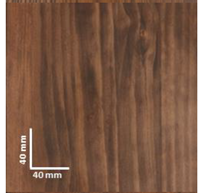
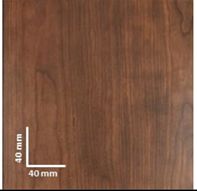
The experimental samples included ten wood-based materials, including both natural wood and artificial boards (7 natural and 3 artificial). Specifically, the natural wood samples selected were ash, elm, red oak, black walnut, white oak, pine, and cherry. The artificial boards consisted of three veneer-faced panels imitating North American black walnut, using particleboard as the base and different types of veneers for decoration, labeled Veneer A, Veneer B, and Veneer C. In this experiment, we deliberately selected materials with hues similar to those of the experimental samples. Color has been proven to be an important indicator that affects people's preference for wood [23]. This study hopes to analyze how other wood components with the same tones affect people's evaluation of it. We set the sample size based on Harumi et al.'s study on wood tactile properties [43], with each of the ten samples cut to a size of 30x30 cm and a thickness of 2 cm.
We collaborated with material suppliers and faculty members with wood research backgrounds to analyze the selected samples' constituent elements. Through extensive discussions with experts, we identified the categories that most strongly influence the sensory impact of materials in the visual and tactile dimensions: tactile sensation, texture, and brightness. The tactile dimension corresponds to the sense of touch; we classified the materials into three tactile categories: smooth, grainy, and rough. Texture and brightness primarily correspond to the sense of vision. For texture, we categorized the materials into three types based on the fineness and arrangement of the grain: fine texture, coarse texture, and mixed texture. Regarding brightness, we divided the materials into two categories: bright and dull.
The classification results of the experimental samples for this study are shown in Table 1.

2.3. Subjective Emotion Evaluation Items

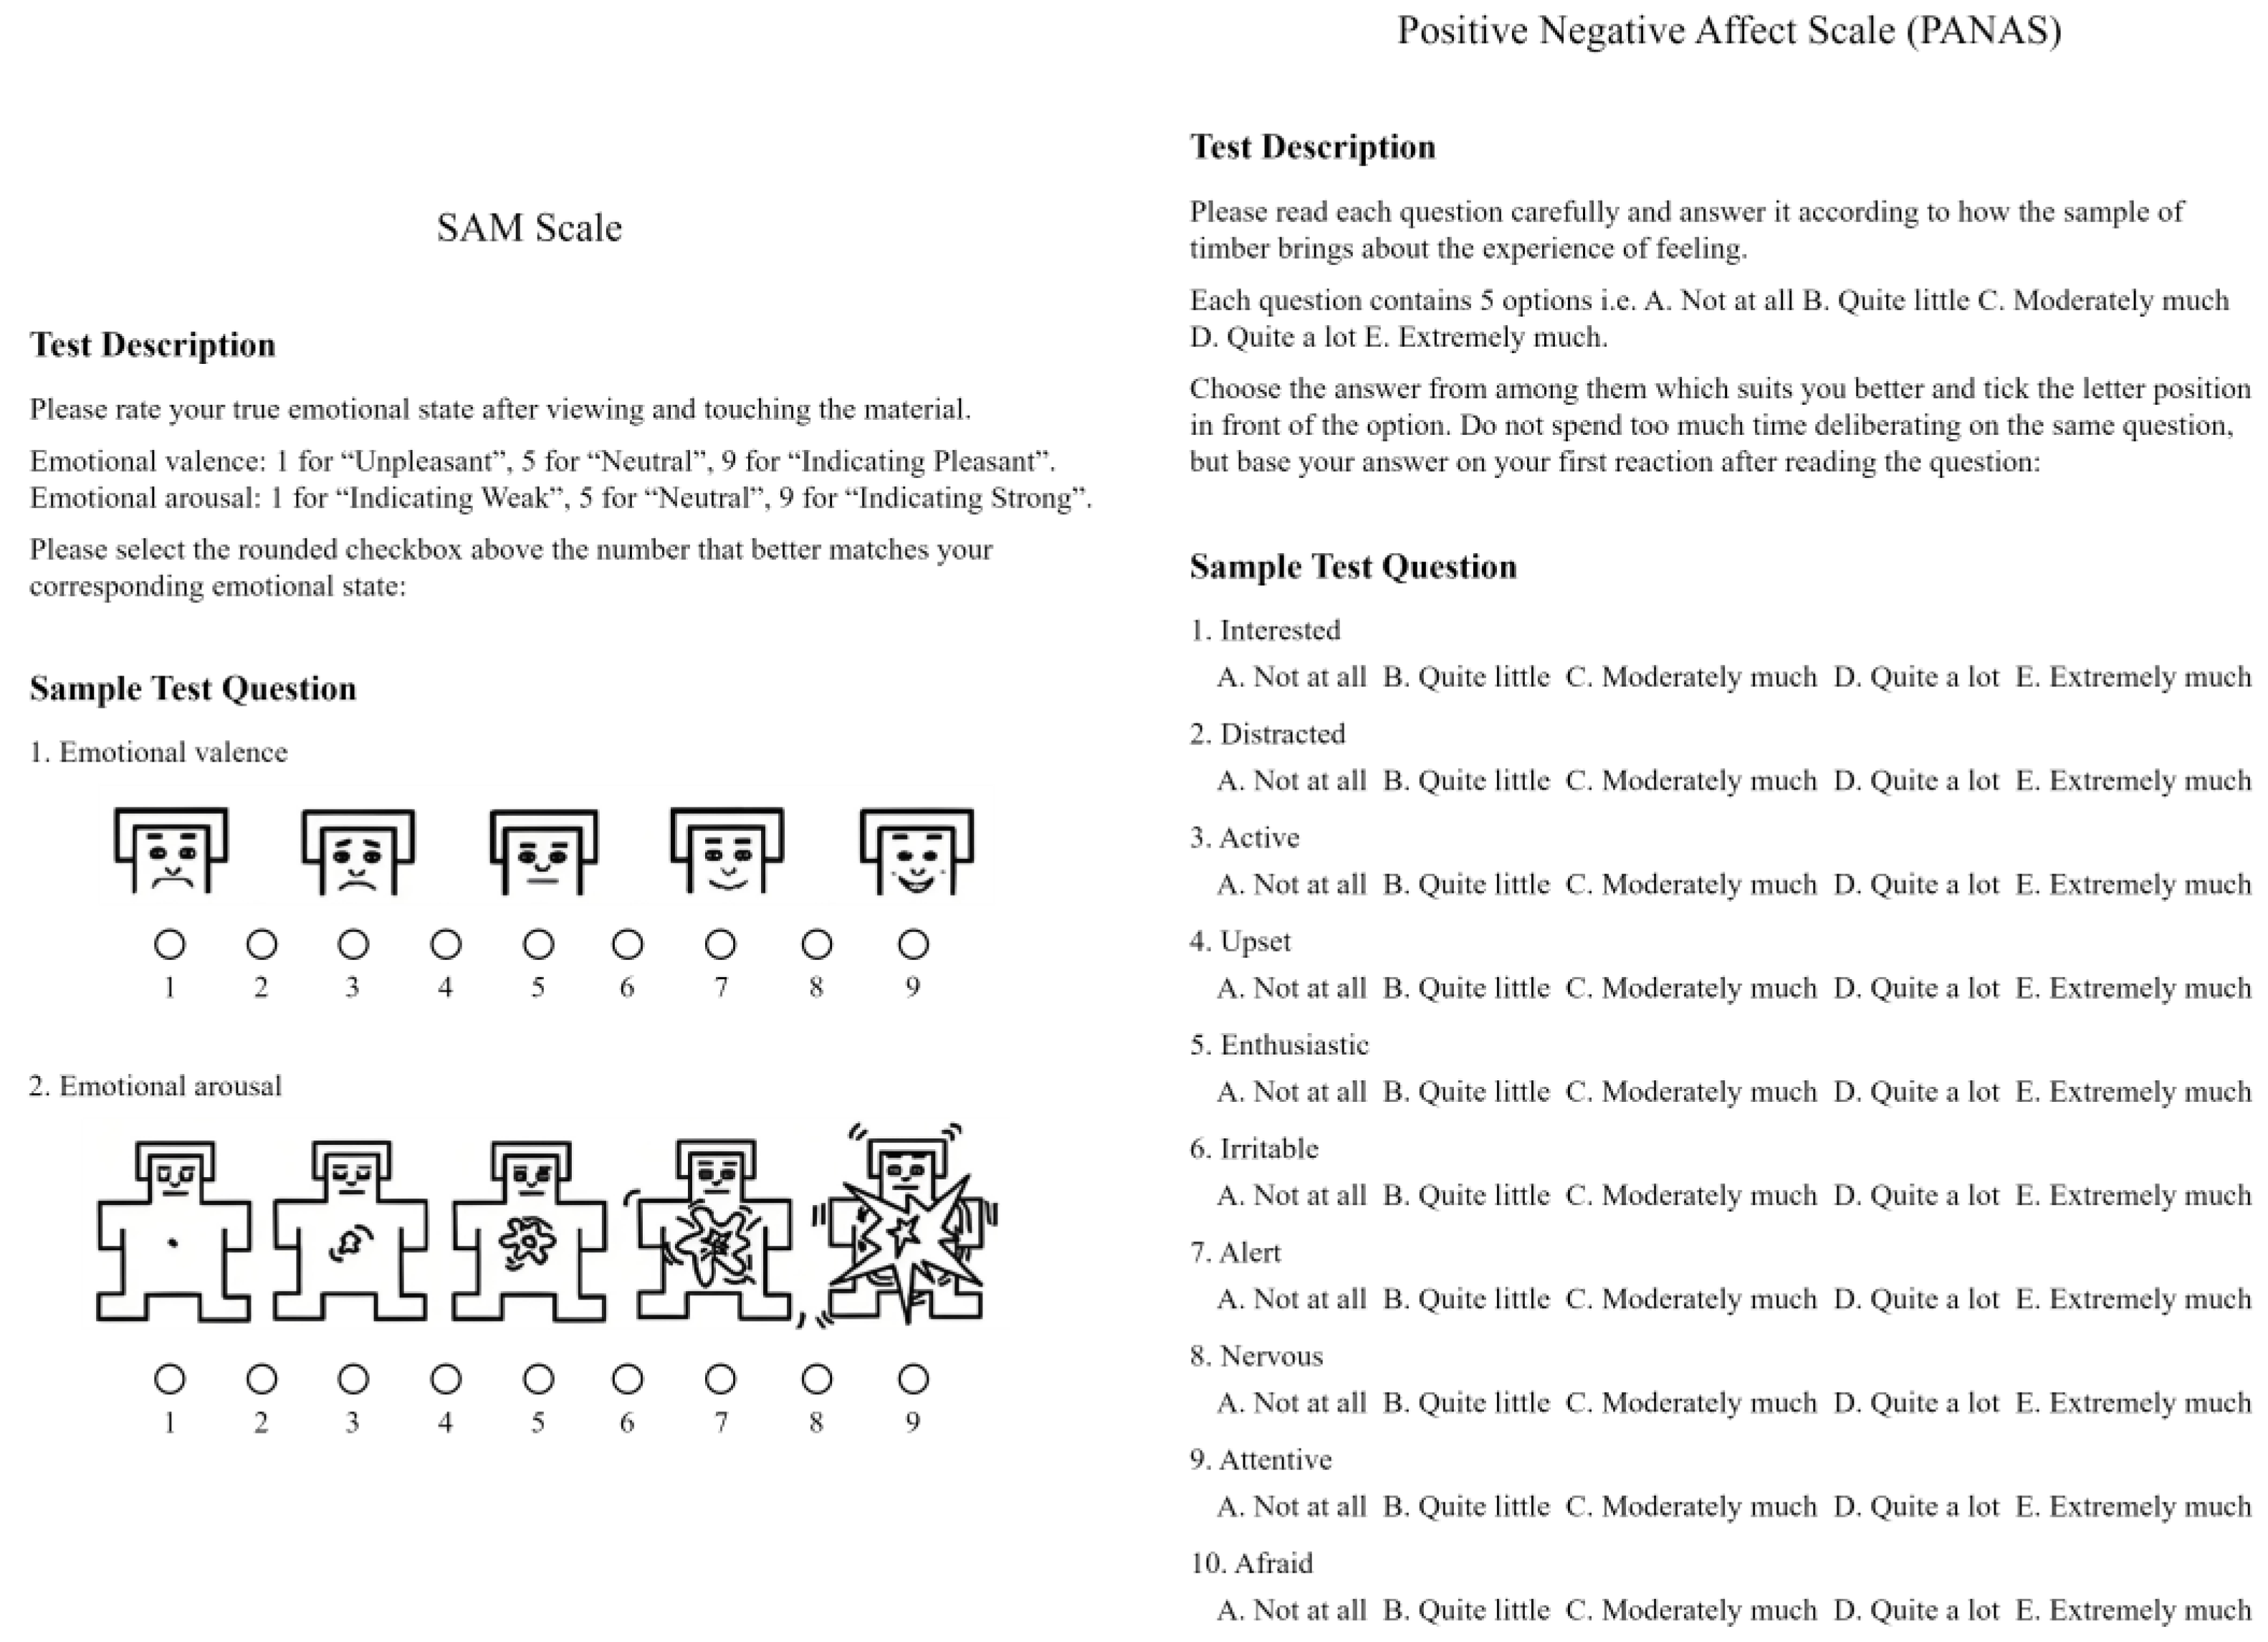
To enhance the accuracy and reliability of the subjective emotion measurement, we adopted a combined approach using two emotional assessment scales, as referenced in existing research [40]. These scales were the Self-Assessment Manikin (SAM) and the Positive and Negative Affect Schedule (PANAS).
Figure 2 illustrates the use of these scales in this experiment. We present the SAM scale in image form. For the valence assessment on a 9-point grid, one end displays a happy face, while the other shows a sad face (with 9 indicating pleasant, 5 neutral, and 1 unpleasant). For the arousal assessment, the 9-point grid features an explosion image at one end and a simple dot at the other, indicating the intensity of emotional feeling (with 9 indicating strong and 1 indicating weak).
This study used the abbreviated version of the PANAS scale, which consists of 10 items. Research by Carla and colleagues indicates that the results of the 20-item PANAS scale and the 10-item short form are broadly consistent [44]. We administered the PANAS scale in a written questionnaire format. We divided the items into two groups: positive affectivity (PA) and negative affectivity (NA). Each item offered five response options, ranging from "very slightly or not at all" to "extremely", scored from 1 to 5.

2.4. Physiological Emotion Measurement

Regarding EEG data, the theory of frontal EEG asymmetry has been effectively used to understand various emotional states [45]. This theory suggests that left frontal activity is associated with approach behaviors and positive emotions, while right frontal activity is linked to withdrawal behaviors and negative emotions. Based on this theory, researchers have developed methods to calculate emotions using EEG data [36,46,47]. Specifically, in terms of power, features such as power spectral density (PSD) have been widely used to classify emotional valence and arousal levels based on their correlation with the alpha (8-13 Hz) and beta (13-30 Hz) frequency ranges.
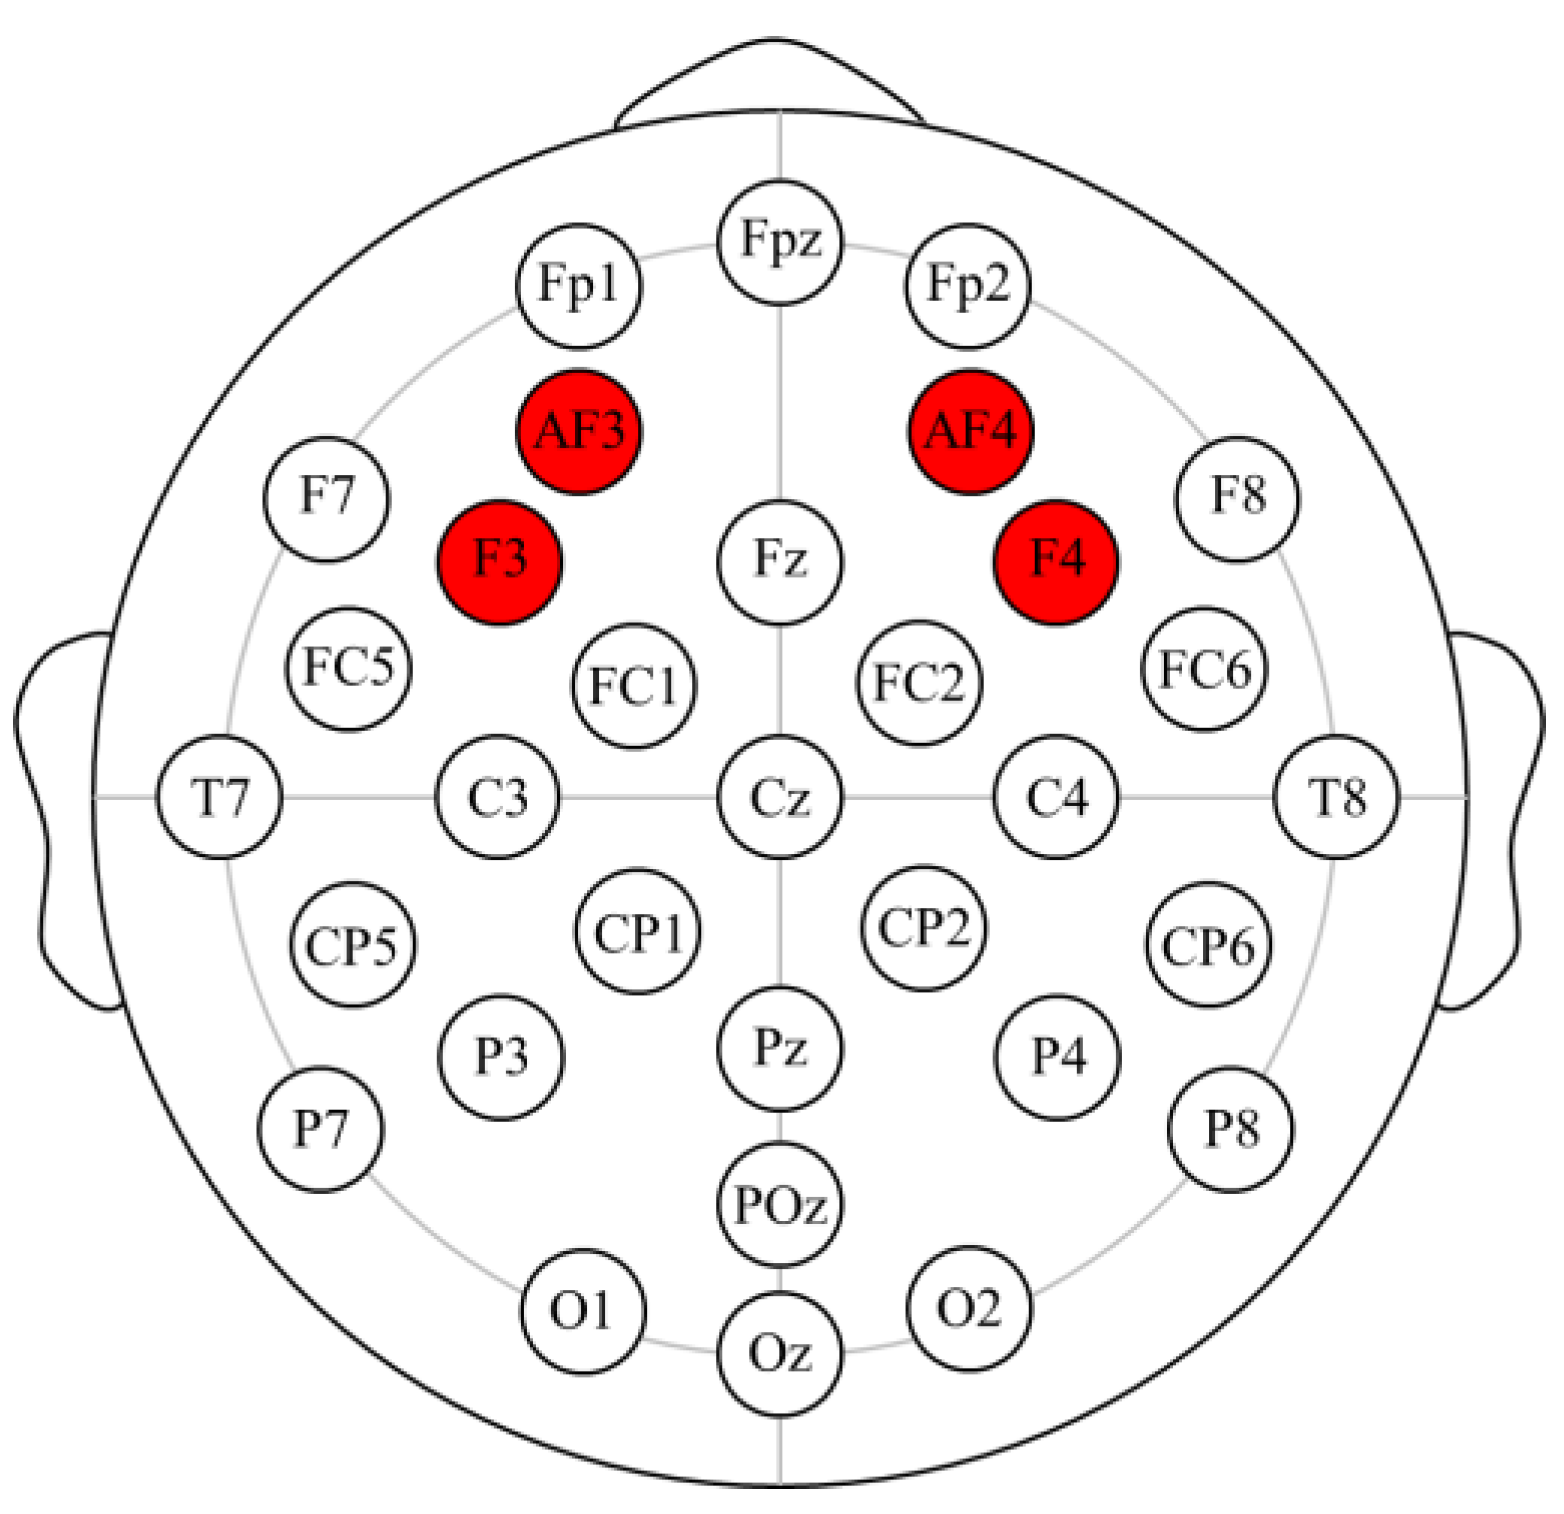
Regarding the electrodes used for emotion analysis, researchers commonly extract power in the alpha and beta bands from the AF3, F3, F4, and AF4 electrodes [47]. They calculate emotional valence by comparing the power in the alpha and beta bands between the F3 and F4 electrodes (Formula 1). To measure emotional arousal, they use Formula 2, which calculates the ratio of the sum of beta band power to the sum of alpha band power from the AF3, F3, F4, and AF4 electrodes. Similarly, this study employs Formulas 1 and 2 to calculate EEG valence and arousal.
V a l e n c e = α ( F 4 ) β ( F 4 ) α F 3 β F 3
A r o u s a l = β A F 3 + F 3 + F 4 + A F 4 α A F 3 + F 3 + F 4 + A F 4
Regarding EDA data, the skin conductance level (SCL) is the most used indicator of EDA. Applying a small constant voltage across two points on the skin makes it possible to measure the skin's ability to conduct electricity. Since the nervous system regulates EDA, the SCL is linearly correlated with arousal levels. Changes in the SCL can reflect emotional experiences over time (as emotions like happiness and sadness can lead to a higher SCL) [48]. In human–computer interaction, SCL is often used to study psychological load and emotional states. For instance, during the brief period when a user is about to score a goal in a computer game and immediately afterward, the user's SCL response peaks, indicating a high level of emotional excitement [48]. The mean SCL can also reflect the participant’s overall skin conductance level, with higher mean values potentially indicating higher physiological arousal or prolonged stress levels [49]. The skin conductance response (SCR) is an extremely sensitive indicator of emotional arousal. It is controlled by the sympathetic nervous system and manifests through the activation of sweat glands. Typically, changes in skin conductance (i.e., the difference between experimental values and baseline values) indicate the degree of somatic physiological activation [50]. The SCL part of the EDA complex represents the slower aspect of the EDA signal (subtle changes occur within tens of seconds to minutes), while the SCR part indicates more rapid changes (these data peaks occur 1-5 seconds after a specific time). Both are crucial arousal dimensions and are believed to depend on distinct neurological mechanisms [51].

2.5. Physiological Data Collection Equipment

This experiment used the ErgoLAB Human–Machine-Environment Synchronization Platform V3.0 (ErgoLAB 3.0) from Kingfar International Inc. It can simultaneously record subjective scale ratings, questionnaire and behavioral experiment paradigm results, and objective multi-channel data, including eye movements, electroencephalograms (EEGs), physiological signals, functional near-infrared spectroscopy (fNIRS), biomechanics, human–computer interactions, spatiotemporal trajectory, physical environment measurements, etc.
The platform also includes analysis modules for heart rate variability (HRV), electroencephalograms (EEGs), electrodermal activity (EDA), electromyograms (EMGs), behavior coding, motion capture, eye tracking, and spatial–temporal behaviors, as well as interaction behavior and sequence analysis. Meanwhile, it enables custom editing and design under various research conditions, including laboratory, virtual reality, mobile device-based testing, and real-world environments.
In this experiment, we used the design module of ErgoLAB 3.0, EDA and PPG sensors from a wearable physiological recording system (Kingfar International Inc.), and a 16-channel semi-dry EEG system (Kingfar International Inc.). The data were processed with ErgoLAB 3.0 data analysis modules, and the statistical tests were conducted with SPSS.

2.6. Experimental Process

The experiment assistant guides participants into the laboratory and seats them in the preparation area. First, participants are given a personal information form to fill out, which includes the following: basic information, including age, name, and gender; physical condition information, including physical health, mental health, vision status, and dominant hand (right or left); and an informed consent signature. Participants fill out the form, sign it, and return it upon completion. Next, the experiment assistant explains the procedure and requirements of the experiment in detail.
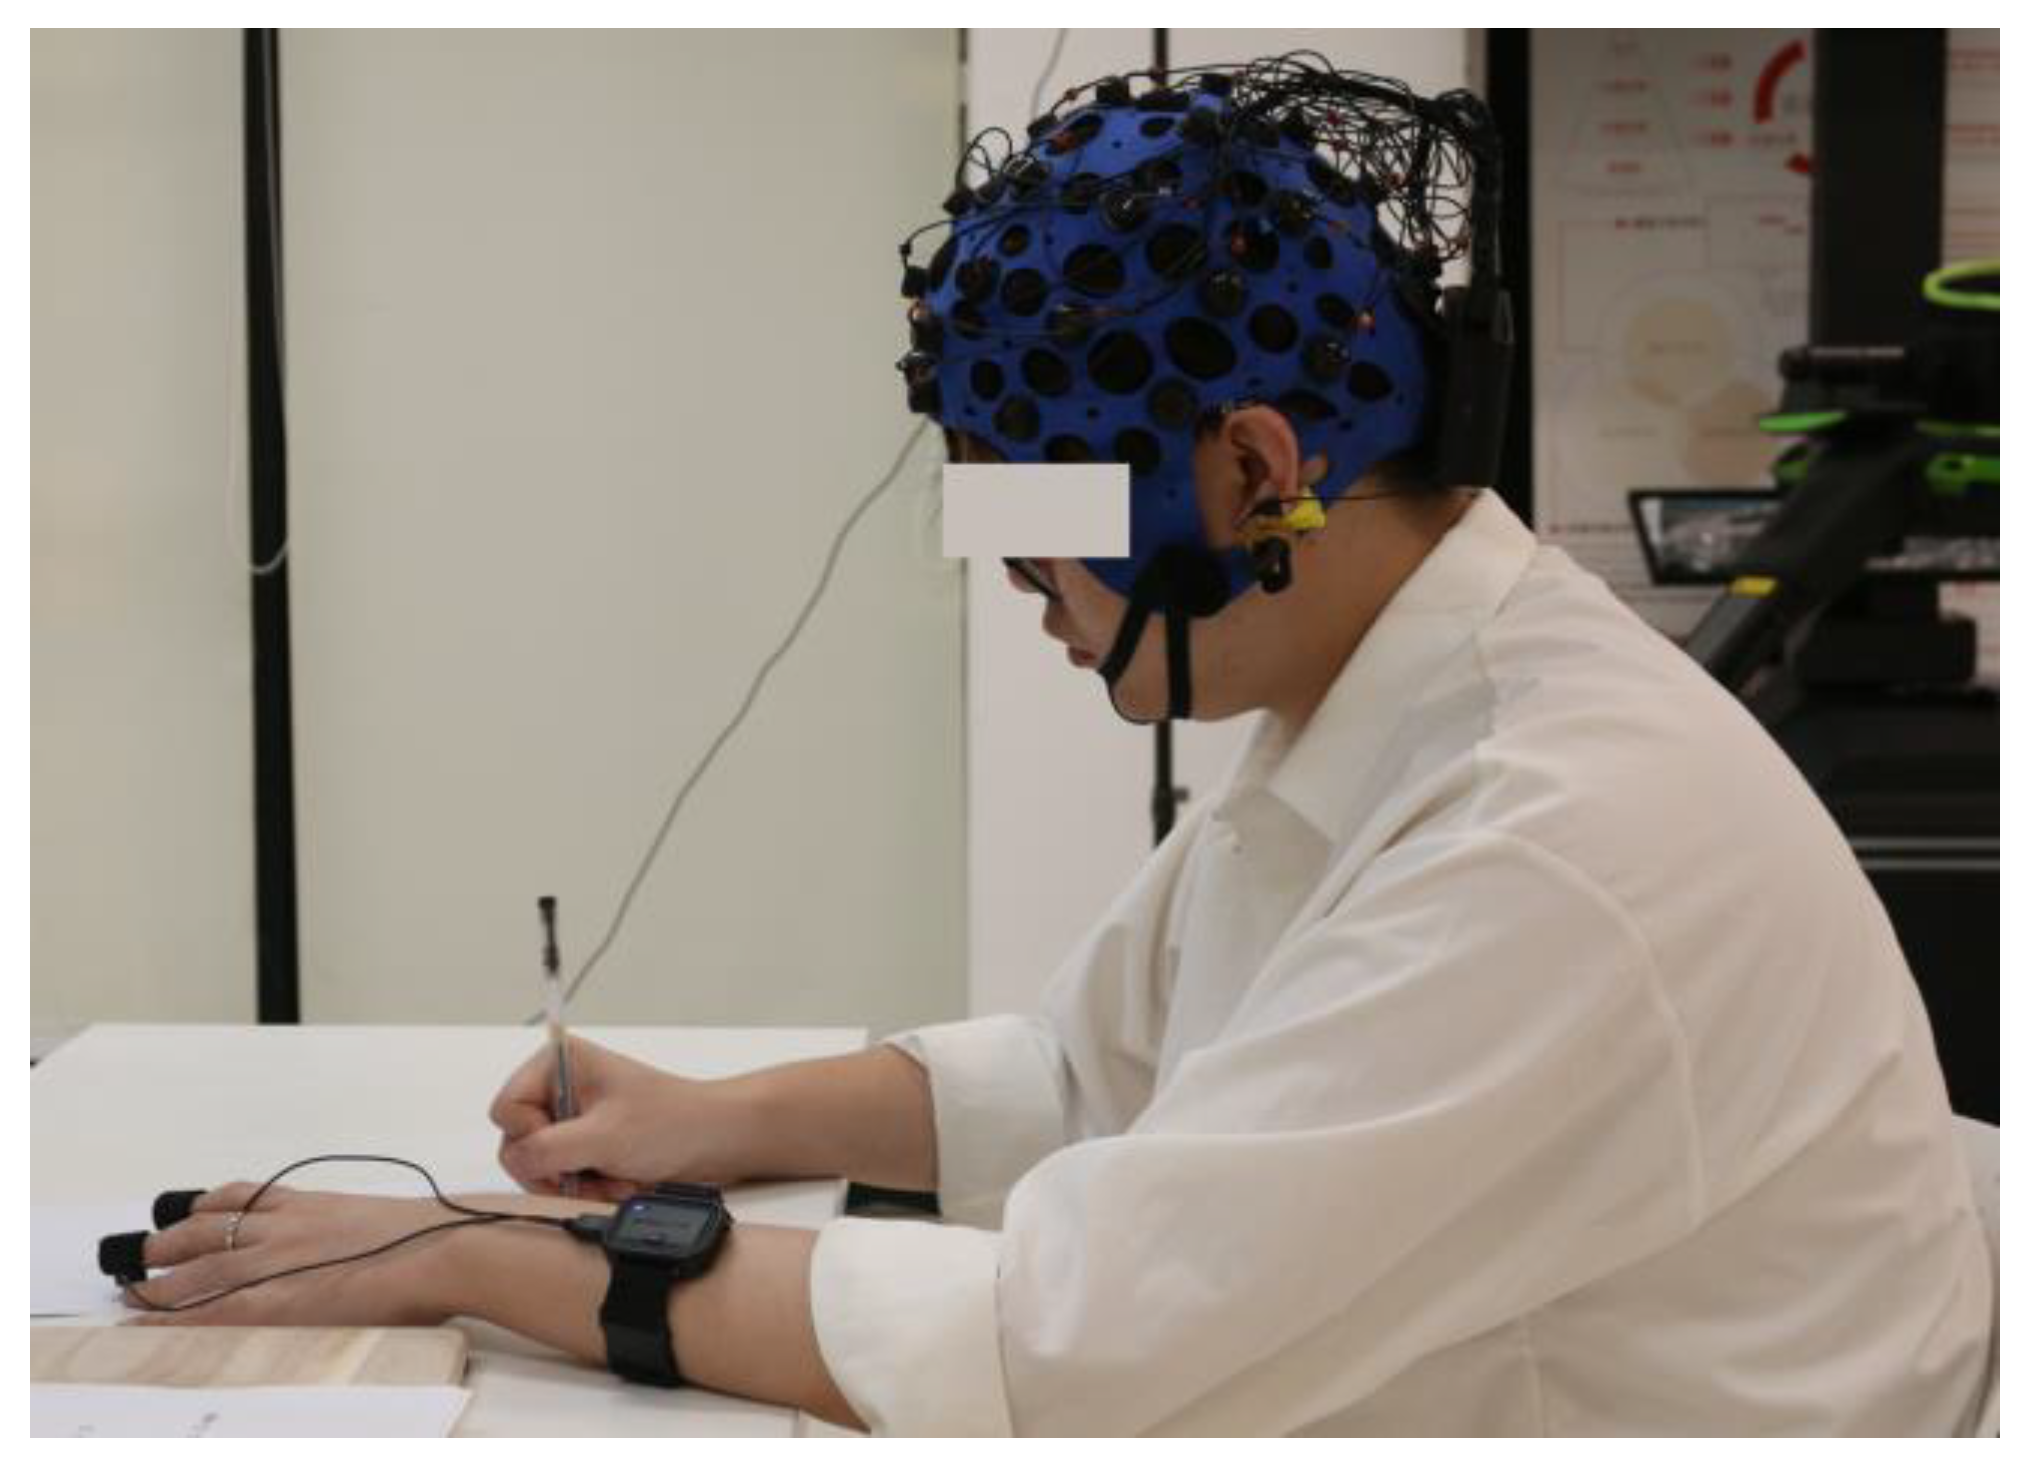
The assistant then equips the participant with the data collection devices (Figure 3). For the EEG setup, participants should wear their hair down, remove any hair clips and left-ear earrings, and wear the EEG device, which is adjusted until a stable EEG signal is achieved. For the EDA setup, the EDA device is placed on the non-dominant hand, and the signal is adjusted until it is stable. Once all the equipment is adjusted correctly, the formal experiment begins.
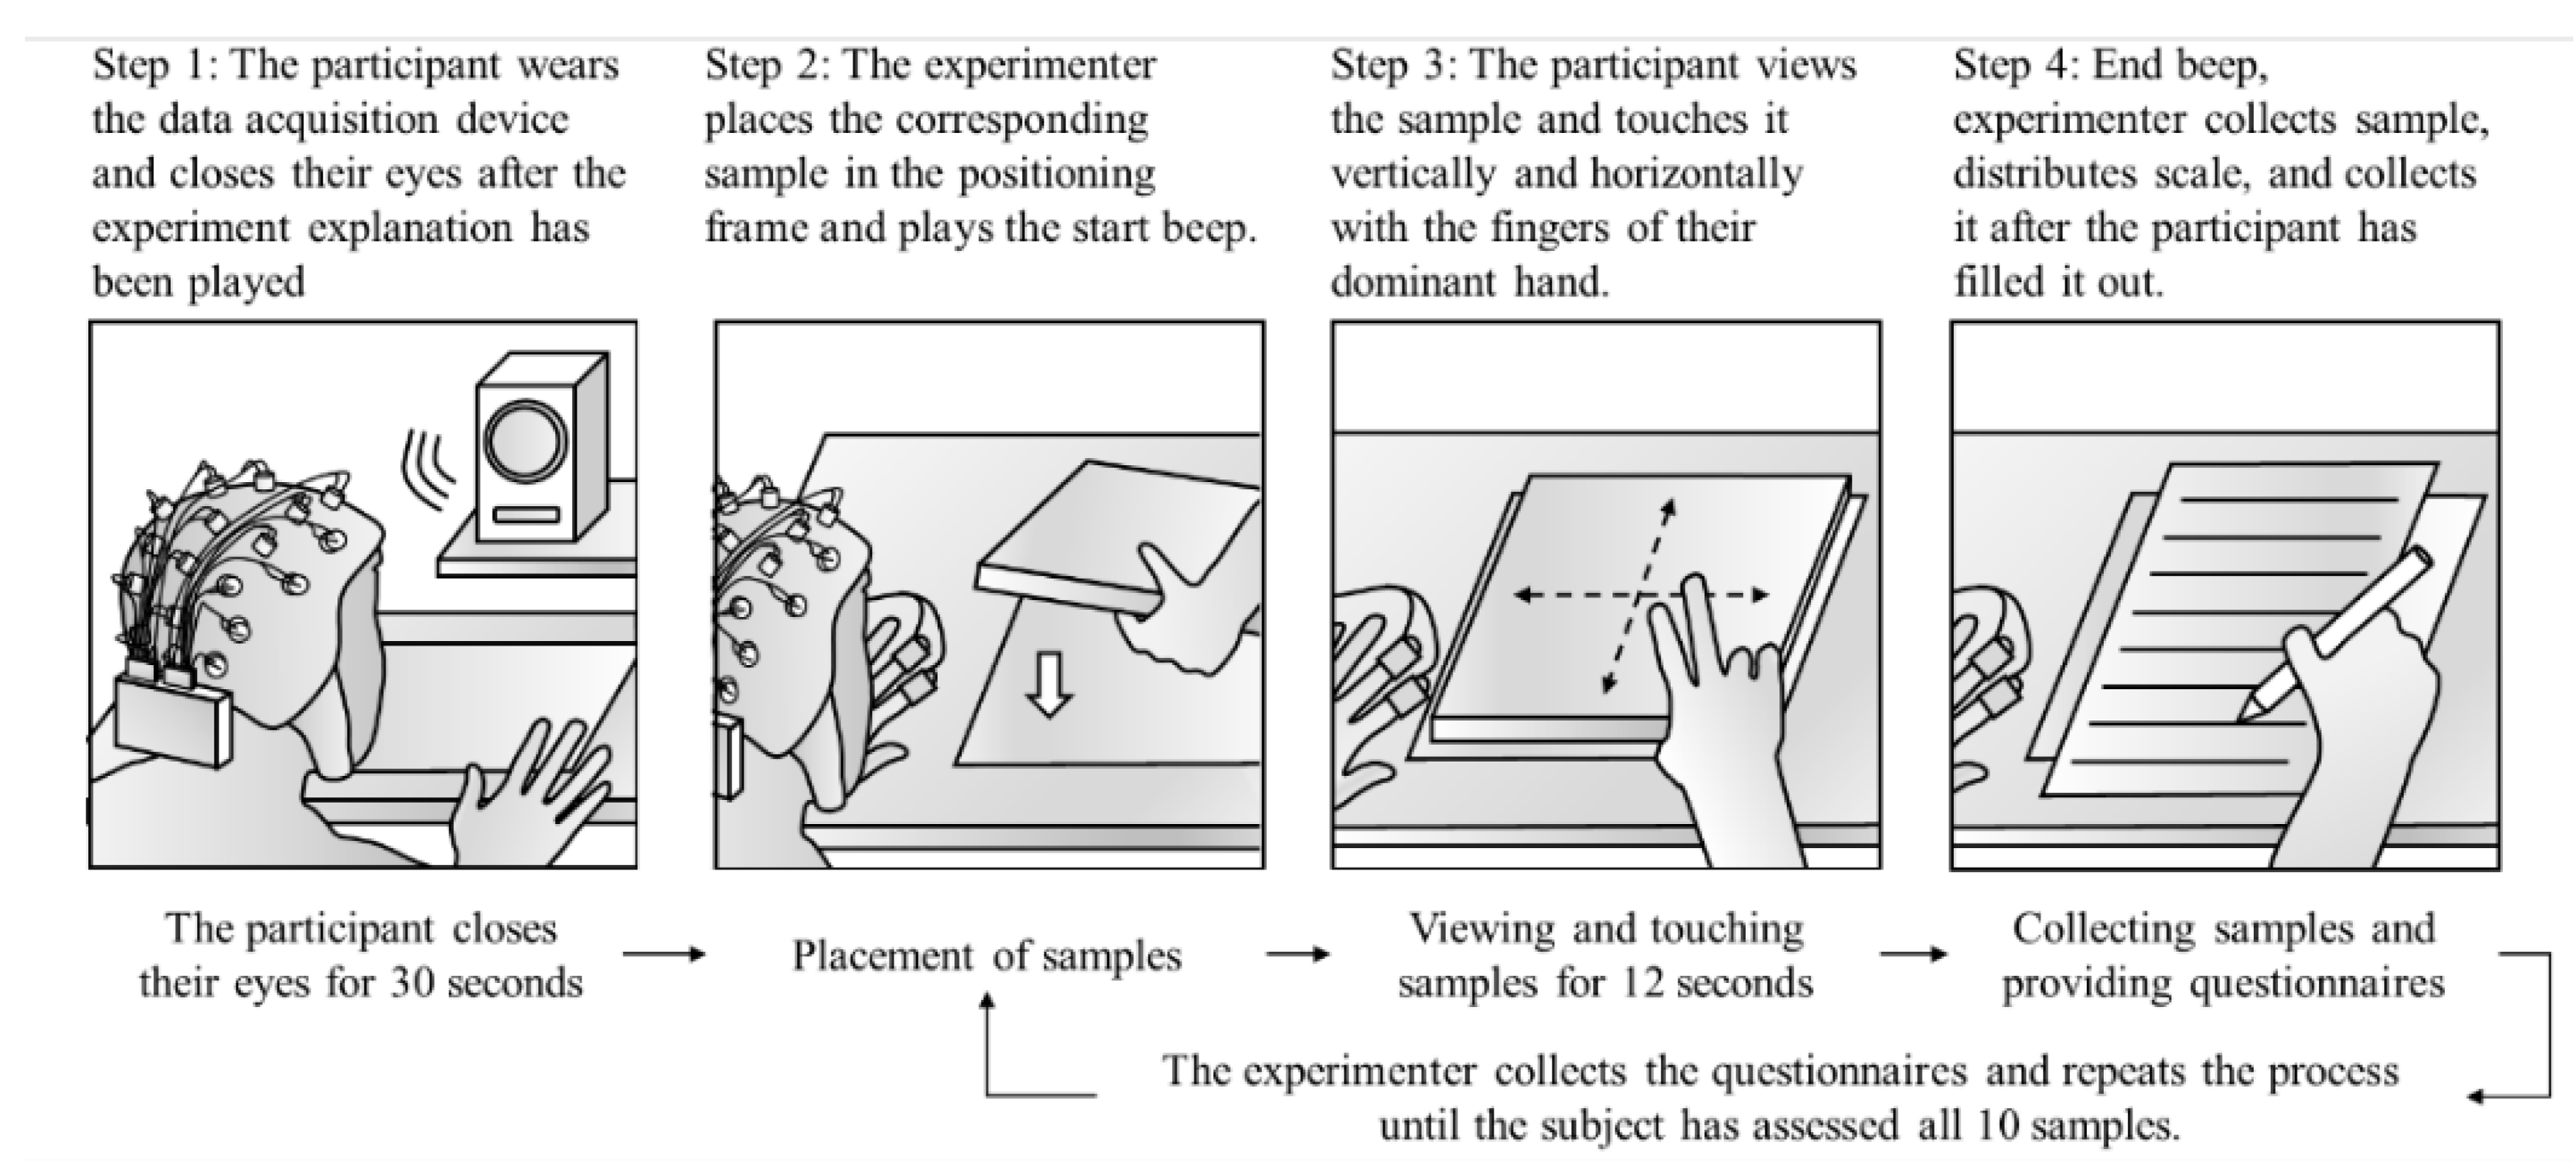
The formal experimental procedure is illustrated in Figure 4. During the experiment, to ensure consistency, the participant is guided entirely by pre-recorded voice prompts. The experiment assistant is responsible for changing the experimental materials (boards), controlling the playback of prompts, monitoring and recording physiological signals, and distributing and collecting the subjective scales.
The assistant activates the camera and computer recording switches to ensure adequate data recording, positioning the camera lens to capture the computer's time bar. This setup facilitates the later division of time segments and the calculation of any time discrepancies. The assistant plays a voice prompt to explain the experimental procedure again and instructs the participant to close their eyes and rest for 30 seconds. This step prevents excessive tension or excitement that might inflate the baseline physiological data.
After the rest period, participants open their eyes and begin evaluating the experimental samples. First, the experiment assistant places Sample 1 in the positioning frame in front of the participant. A prompt is played to signal the start of the viewing and touching phase; this prompt constitutes a "ding" sound, which indicates the start and end of this phase. The viewing and touching phase last 12 seconds, during which the participant visually examines the sample with their eyes and uses the fingertips of their dominant hand to touch the sample's surface horizontally and vertically until the 12 seconds have elapsed.
Upon the conclusion of the viewing and touching phase, the assistant retrieves Sample 1, distributes the subjective evaluation scales, and plays a voice prompt instructing the participant to fill out the scales based on their subjective experience of Sample 1. After the participant has completed the scales, the assistant collects them and places Sample 2 in the positioning frame. The experiment proceeds in the same manner for Samples 2 to 10, with the assistant guiding the participant through the same procedure for each sample until all 10 samples have been tested. The formal experimental phase lasts approximately 15 minutes. To ensure that participants have no subjective bias regarding the experimental samples, the names and sources of the materials (including whether they are artificial boards or natural wood) are not disclosed during the experiment.

2.7. Data Extraction and Analysis

For subjective data extraction, we utilized the SAM scale to record the valence and arousal levels during the experiment. The participants’ valence and arousal scores for each sample were entered into a table, and the average valence and arousal levels for each sample were calculated. Additionally, we used the PANAS scale to sum the scores from the five positive and five negative affectivity items, obtaining a total score. These established scales added scientific rigor to our research.
We reviewed the video recordings for the physiological data extraction to exclude unusable data (such as equipment power failure or external disturbances affecting participants). We then segmented the usable data, identifying the time markers for each segment. The video recordings were imported into editing software to compare the computer-recorded time with the camera's recording time. This resulted in 11 segments for each participant (one 30-second baseline segment and ten 12-second experimental segments). Using the ErgoLAB 3.0 data analysis modules (Kingfar International Inc.), we processed and extracted the physiological data for the 20 participants in the "Record Playback" module. This involved segmenting the data according to the identified time markers, ensuring precise analysis of each participant's physiological responses during the experiment.
The EEG data collected during the experiments were preprocessed in data playback using ErgoLAB 3.0 data analysis modules. This software was employed to filter out data from subjects with dislodged or incomplete recordings (using four electrodes in this study). We removed noise artifacts recorded during the experiment, and we extracted the average power data for the alpha (8-13Hz) and beta (13-30Hz) bands from each subject at electrode positions AF3, AF4, F3, and F4 (as shown in Figure 5). The software automatically converted these average power data to decibels (dB). The preprocessing steps were as follows: for α wave extraction, a high-pass filter at 8Hz, a low-pass filter at 13Hz, and a notch filter at 50Hz were applied; for β wave extraction, a high-pass filter at 13Hz, a low-pass filter at 30Hz, and a notch filter at 50Hz were employed. After filtering, electrode amplitude data showing excessively high voltage values were deemed unusable and excluded, and the remaining viable recordings were used in the following analysis phase.
Ultimately, for each of the 20 subjects, we extracted the average power (in dB) data for alpha (F3, F4, AF3, AF4) and beta (F3, F4, AF3, AF4) waves (totaling 8 values) obtained for the 10 different materials, resulting in a total of 1600 data points. Using Formulas 1 and 2, we calculated each subject's EEG emotional valence and EEG arousal when presented with each material.
In the data playback process, we first used ErgoLAB 3.0 data analysis modules to filter and exclude disconnected or incomplete records (specifically for SCL and SCR) for the collected EDA data. We then extracted the average SCL and SCR values (unit, μS) for each of the 20 subjects when presented with the 10 different materials, as well as the baseline SCL and SCR values during the 30-second resting state. By subtracting the baseline data from the raw data, we obtained 400 data points. These data were obtained to help assess the arousal levels elicited by the materials.
After the experiment, we obtained three different sets of data: categorical data from the experimental samples (including material source, tactile sensation, texture, and brightness) as well as subjective evaluation data (using the SAM and PANAS scales) and physiological data (EEG and EDA data) from the subjects. To analyze the impact of the material samples on the participants’ emotions, we used SPSS Statistics Version 19.0 for statistical analysis. First, we conducted a correlation analysis to explore the relationships between the subjects' subjective and physiological data. Subsequently, using the source of the experimental samples as a grouping variable, we analyzed whether there were differences in the subjective and physiological data between the natural wood and artificial board materials. Finally, we performed one-way ANOVA and independent samples t-tests, using sample composition as a factor and subjective and physiological data as dependent variables, to investigate the impact of sample differences on the subjects' subjective and physiological evaluations.

3. Results

3.1. Correlation Analysis between Subjective Evaluation and Physiological Indicators

In this section, we analyze the data from three perspectives: the internal relationships among the subjective evaluations, the internal relationships among the physiological indicators, and the relationships between the subjective and physiological data.

3.1.1. Internal Relationships among the Subjective Evaluations

Table 2 shows significant correlations among the subjective evaluations. Specifically, subjective valence and subjective arousal show a significant positive correlation (r = 0.310, p < 0.001), indicating that pleasant emotions are related to arousal levels.
Moreover, our data indicate that valence has a positive correlation with positive affectivity (PA) scores on the PANAS scale (r = 0.297, p < 0.001), and arousal also shows a positive correlation with PA (r = 0.457, p < 0.001). On the other hand, negative affectivity (NA) scores from the PANAS scale are negatively correlated with valence (r = -0.308, p < 0.001) and positively correlated with arousal (r = 0.258, p < 0.001).

3.1.2. Internal Relationship of Physiological Indicators

Table 3 shows a significant negative correlation among the physiological indicators between EEG valence and SCR (r = -0.213, p < 0.01). Regarding electrodermal signals, there is a significant correlation between SCL and SCR (r = 0.423, p < 0.01).

3.1.3. The Relationship between Subjectivity and Physiology

Table 4 presents the results of the correlation analysis between subjective emotions and physiological data. By examining the correlation coefficients and significance levels, it can be observed that there are correlations between some subjective and objective parameters. Specifically, subjective valence is not significantly correlated with other physiological indicators. Similarly, physiological valence is not correlated with other subjective emotions.
Moreover, there is a significant positive correlation between subjective SAM arousal and physiological arousal (r = 0.140, p < 0.05) and a significant positive correlation with SCR (r = 0.165, p < 0.05). Subjective positive emotions are significantly positively correlated with physiological arousal (r = 0.286, p < 0.01), and subjective negative emotions also show a significant positive correlation with physiological arousal (r = 0.183, p < 0.01).

3.2. Analysis of Differences in Emotional Responses to Material Sources

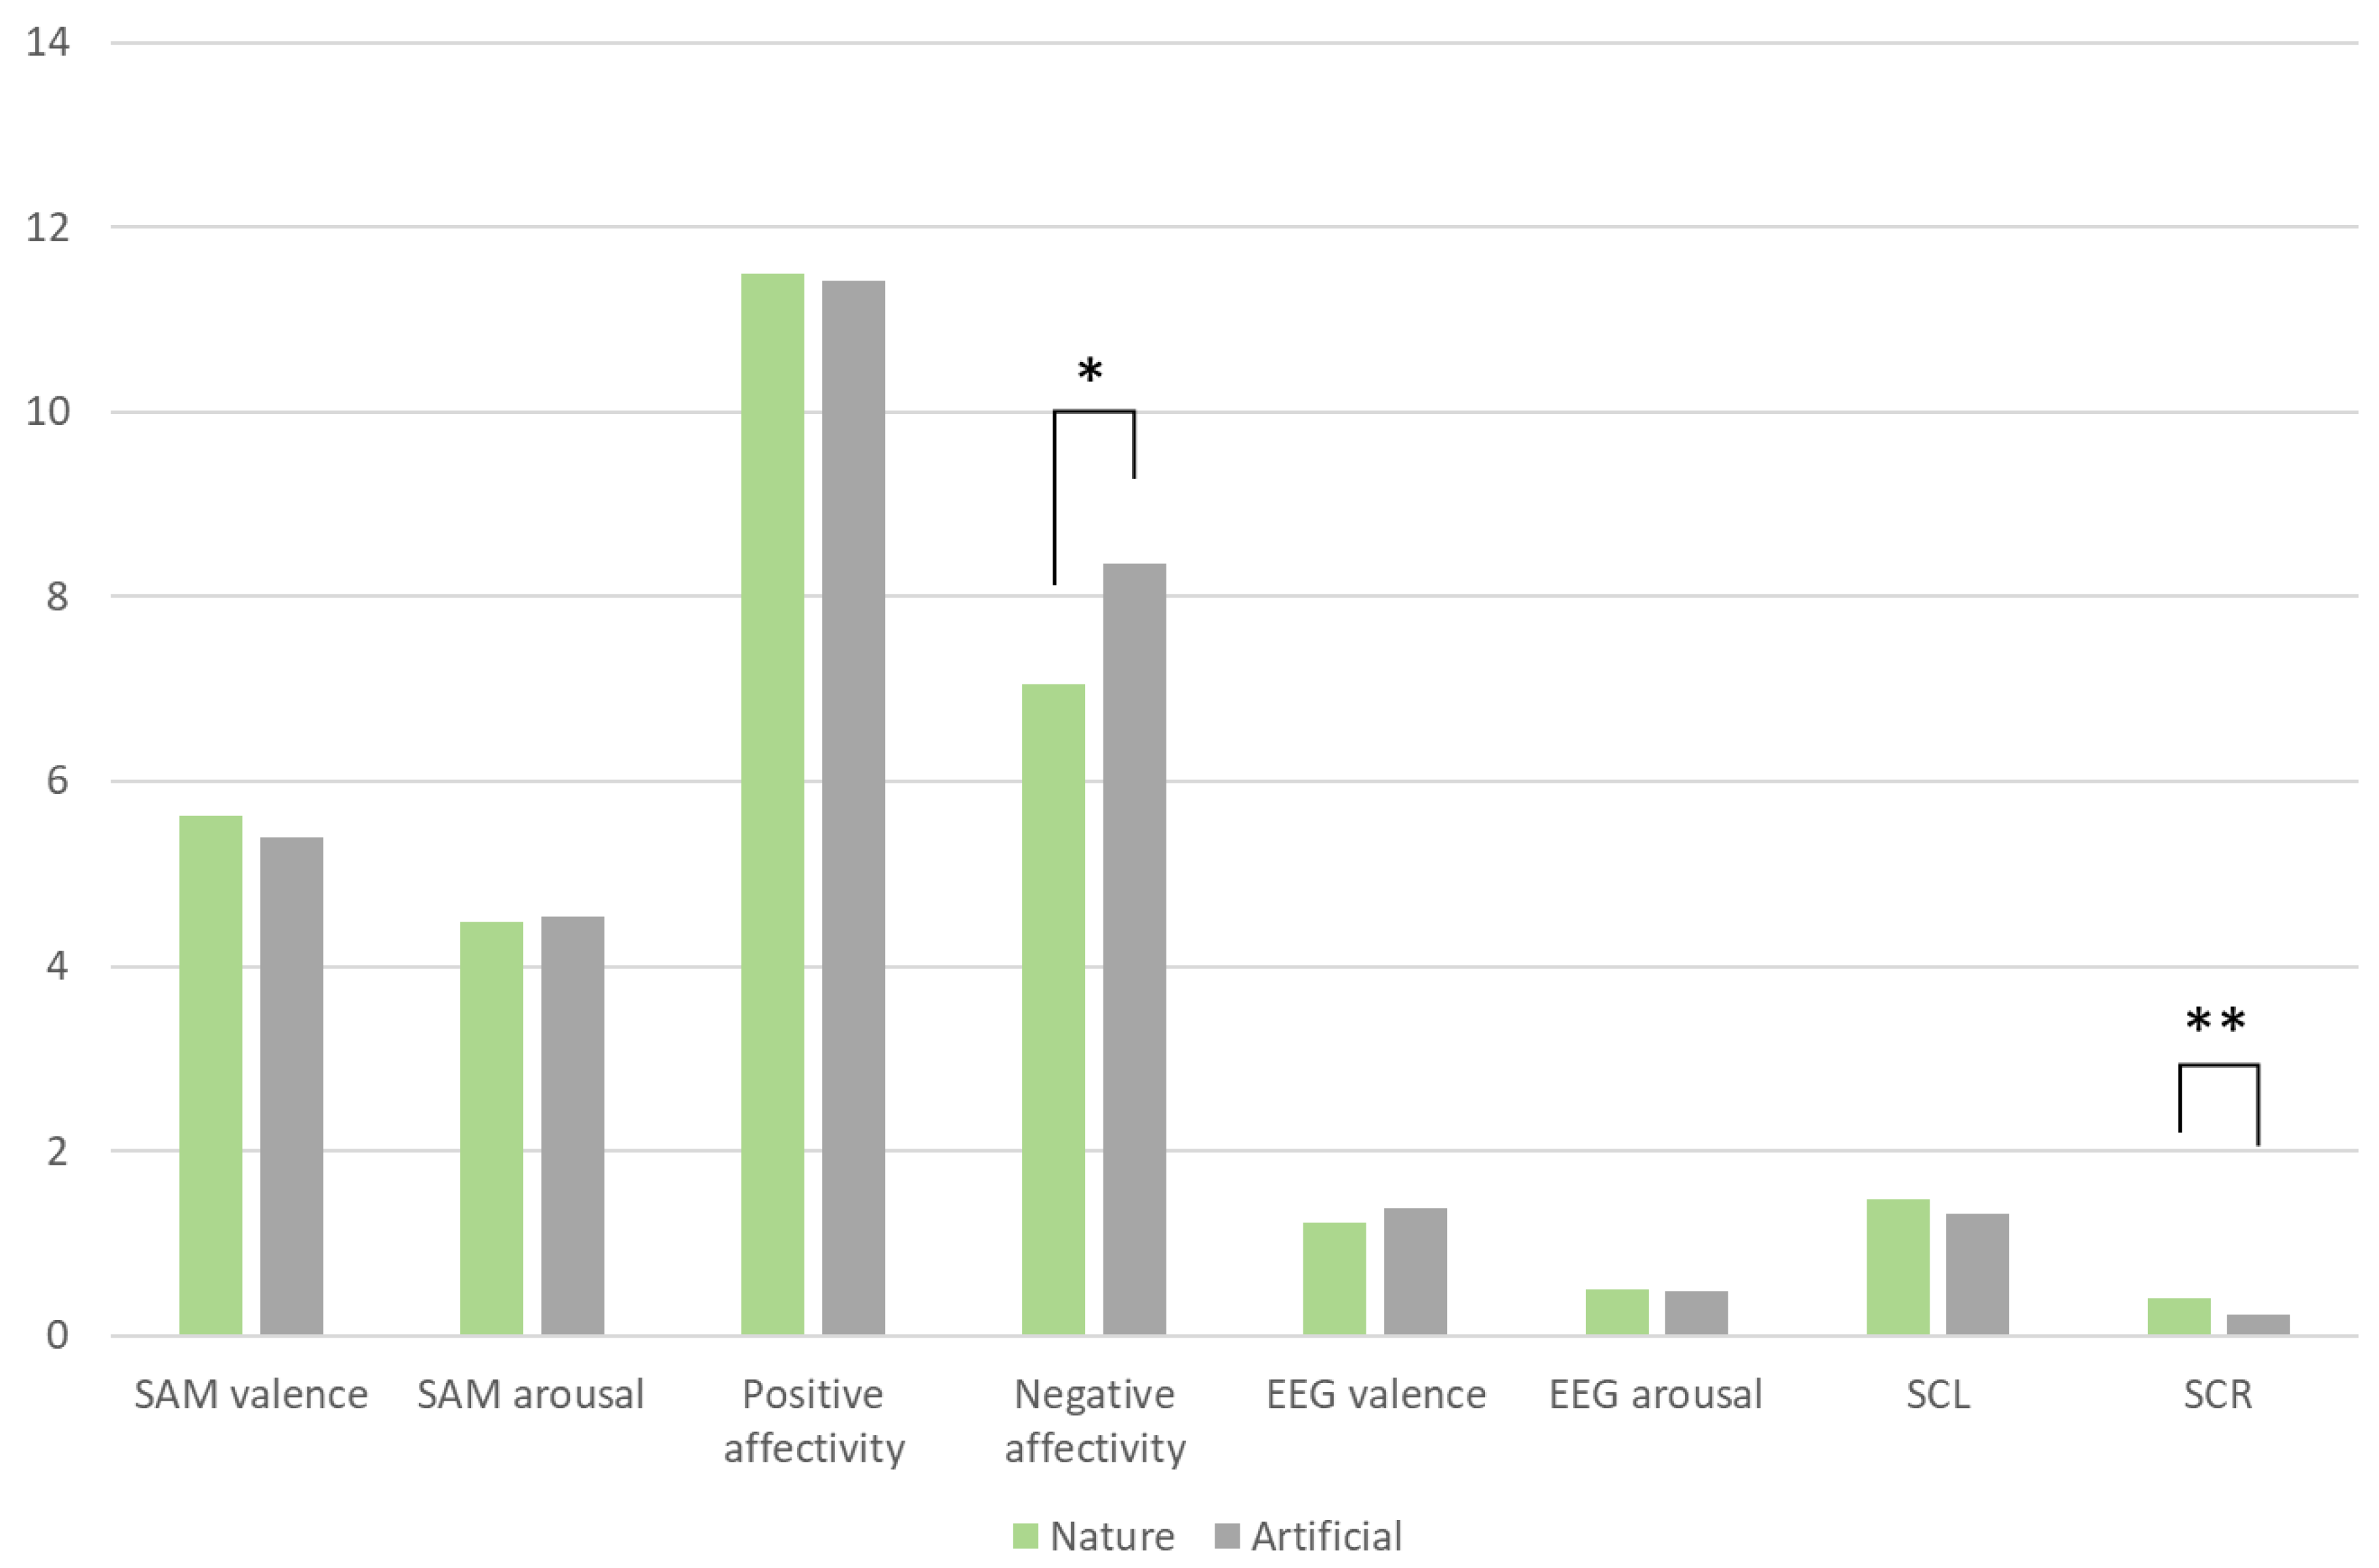
In our study, we used the source of the samples as a key grouping variable to compare natural wood and artificial boards, using subjective and physiological evaluation data as test variables. To conduct an in-depth analysis of the impact of the sample sources on various data, we employed an independent samples t-test. Figure 6 reveals the differences between natural wood and artificial boards regarding the subjective evaluations and physiological indicators. Specifically, there were no significant differences between natural wood and artificial boards in the subjective evaluations concerning subjective valence, arousal, and positive emotion scores. These results indicate that participants' emotional responses to the two materials were relatively consistent across these dimensions, showing no clear preference or aversion.
However, we observed a more pronounced difference in subjective negative emotion scores. The negative emotion scores for artificial boards were significantly higher than those for natural wood (p < 0.05). This result suggests that artificial boards can still evoke more negative emotions even when participants are not informed about the source of the material.
Regarding the differences in physiological indicators, there were no significant differences between natural wood and artificial boards across several physiological measures. Specifically, the EEG valence, arousal, and SCL scores were relatively consistent between the two materials, showing no statistically significant differences. However, regarding SCR scores, natural wood scored significantly higher than artificial boards (p < 0.01). This result suggests that natural wood elicits a higher physiological arousal level than artificial boards.

3.3. Analysis of Differences in Materials’ Tactile Sensations

The results of the one-way analysis of variance (ANOVA), with tactile sensation as the factor, are presented in Figure 7. The different tactile sensations of the material samples exhibited significant differences in PA (F (2,197) = 3.599, p < 0.05). Post hoc comparisons revealed that samples with a rough texture elicited higher PA than those with a smooth texture. Specifically, the experimental samples with rough textures included red oak and Veneer B. These two materials were derived from natural wood and artificial board, respectively. Veneer B, formed using a PVC film vacuum-molding process, has a surface texture with a rich three-dimensional feel. In contrast, red oak has a coarser and more prominent grain than white oak and other woods, resembling a wavy pattern. On the other hand, the samples with a smooth texture were white ash, pine, and cherry wood, all of which are natural woods.

3.4. Analysis of Differences in Emotional Responses to Material Texture

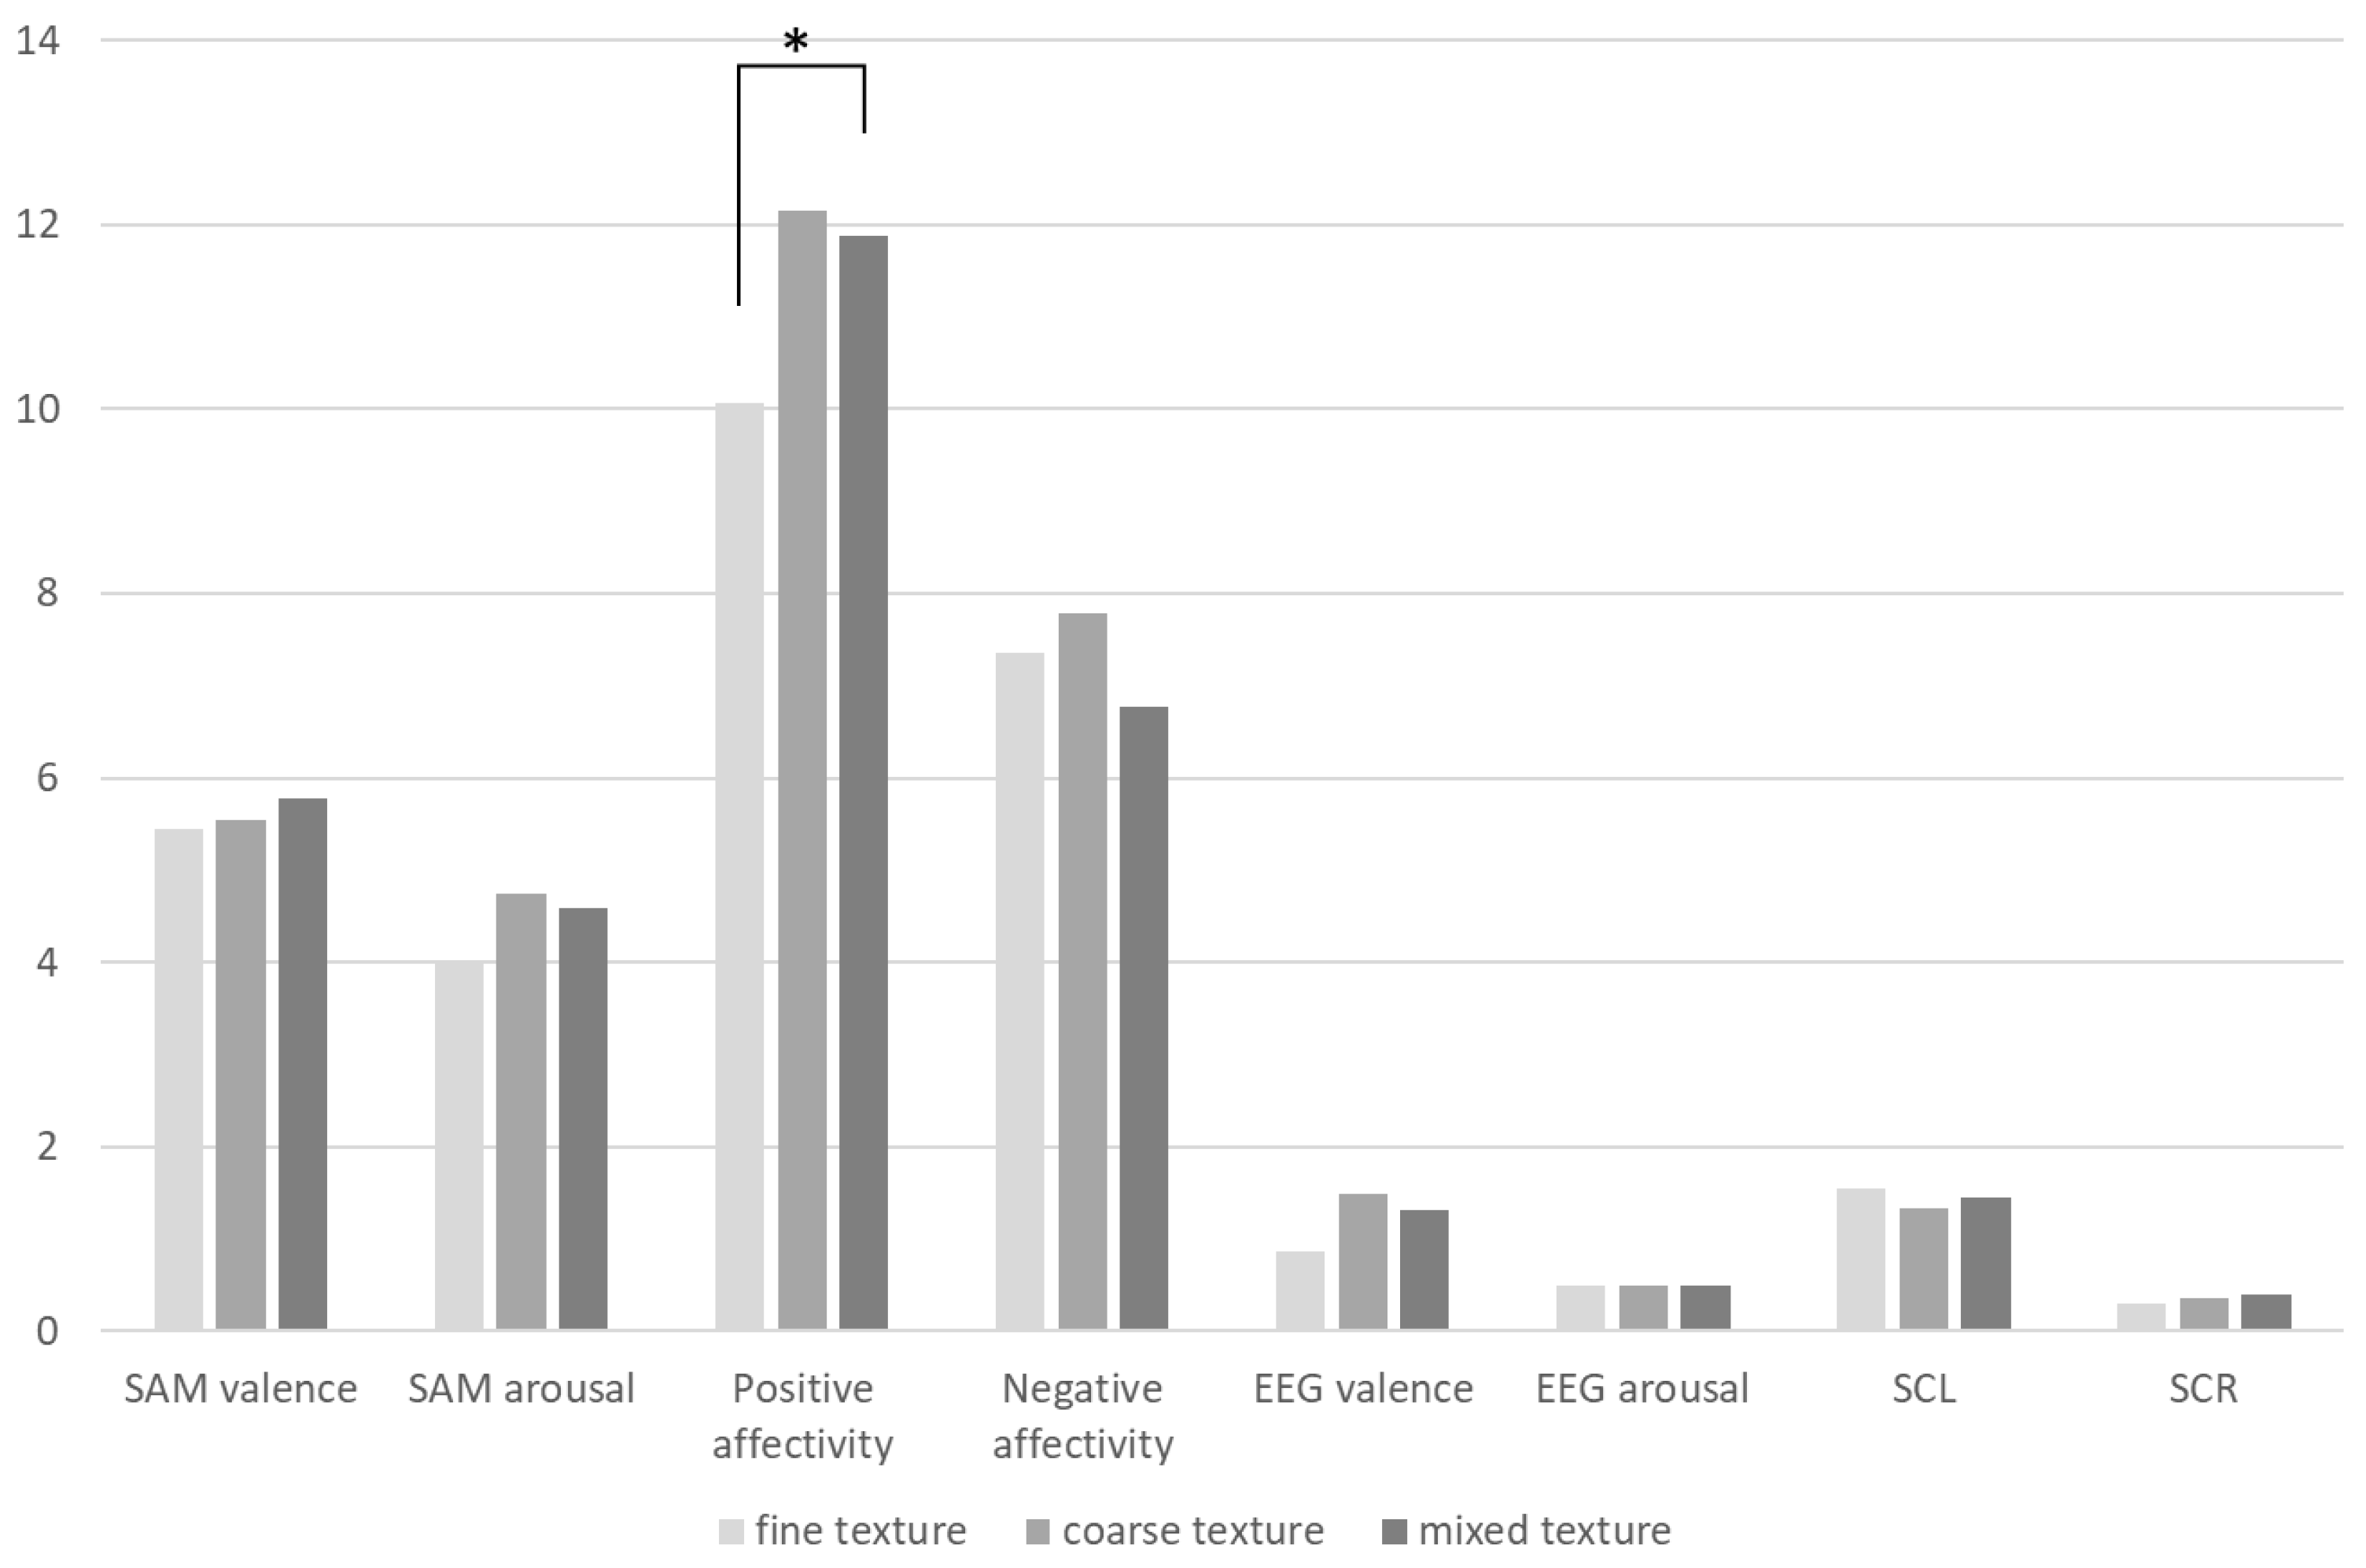
Figure 8 presents the results of the ANOVA with texture classification as the factor. The different textures of the material samples showed significant differences in PA (F(2,197) = 5.751, p < 0.01). Post hoc comparisons revealed that samples with coarse and mixed textures elicited higher PA than those with fine textures. Since there was no significant difference between coarse and mixed textures, but both differed significantly from fine textures, we focused on analyzing the lower-scoring fine-texture samples.

3.5. Analysis of Differences in Emotional Responses to Material Brightness

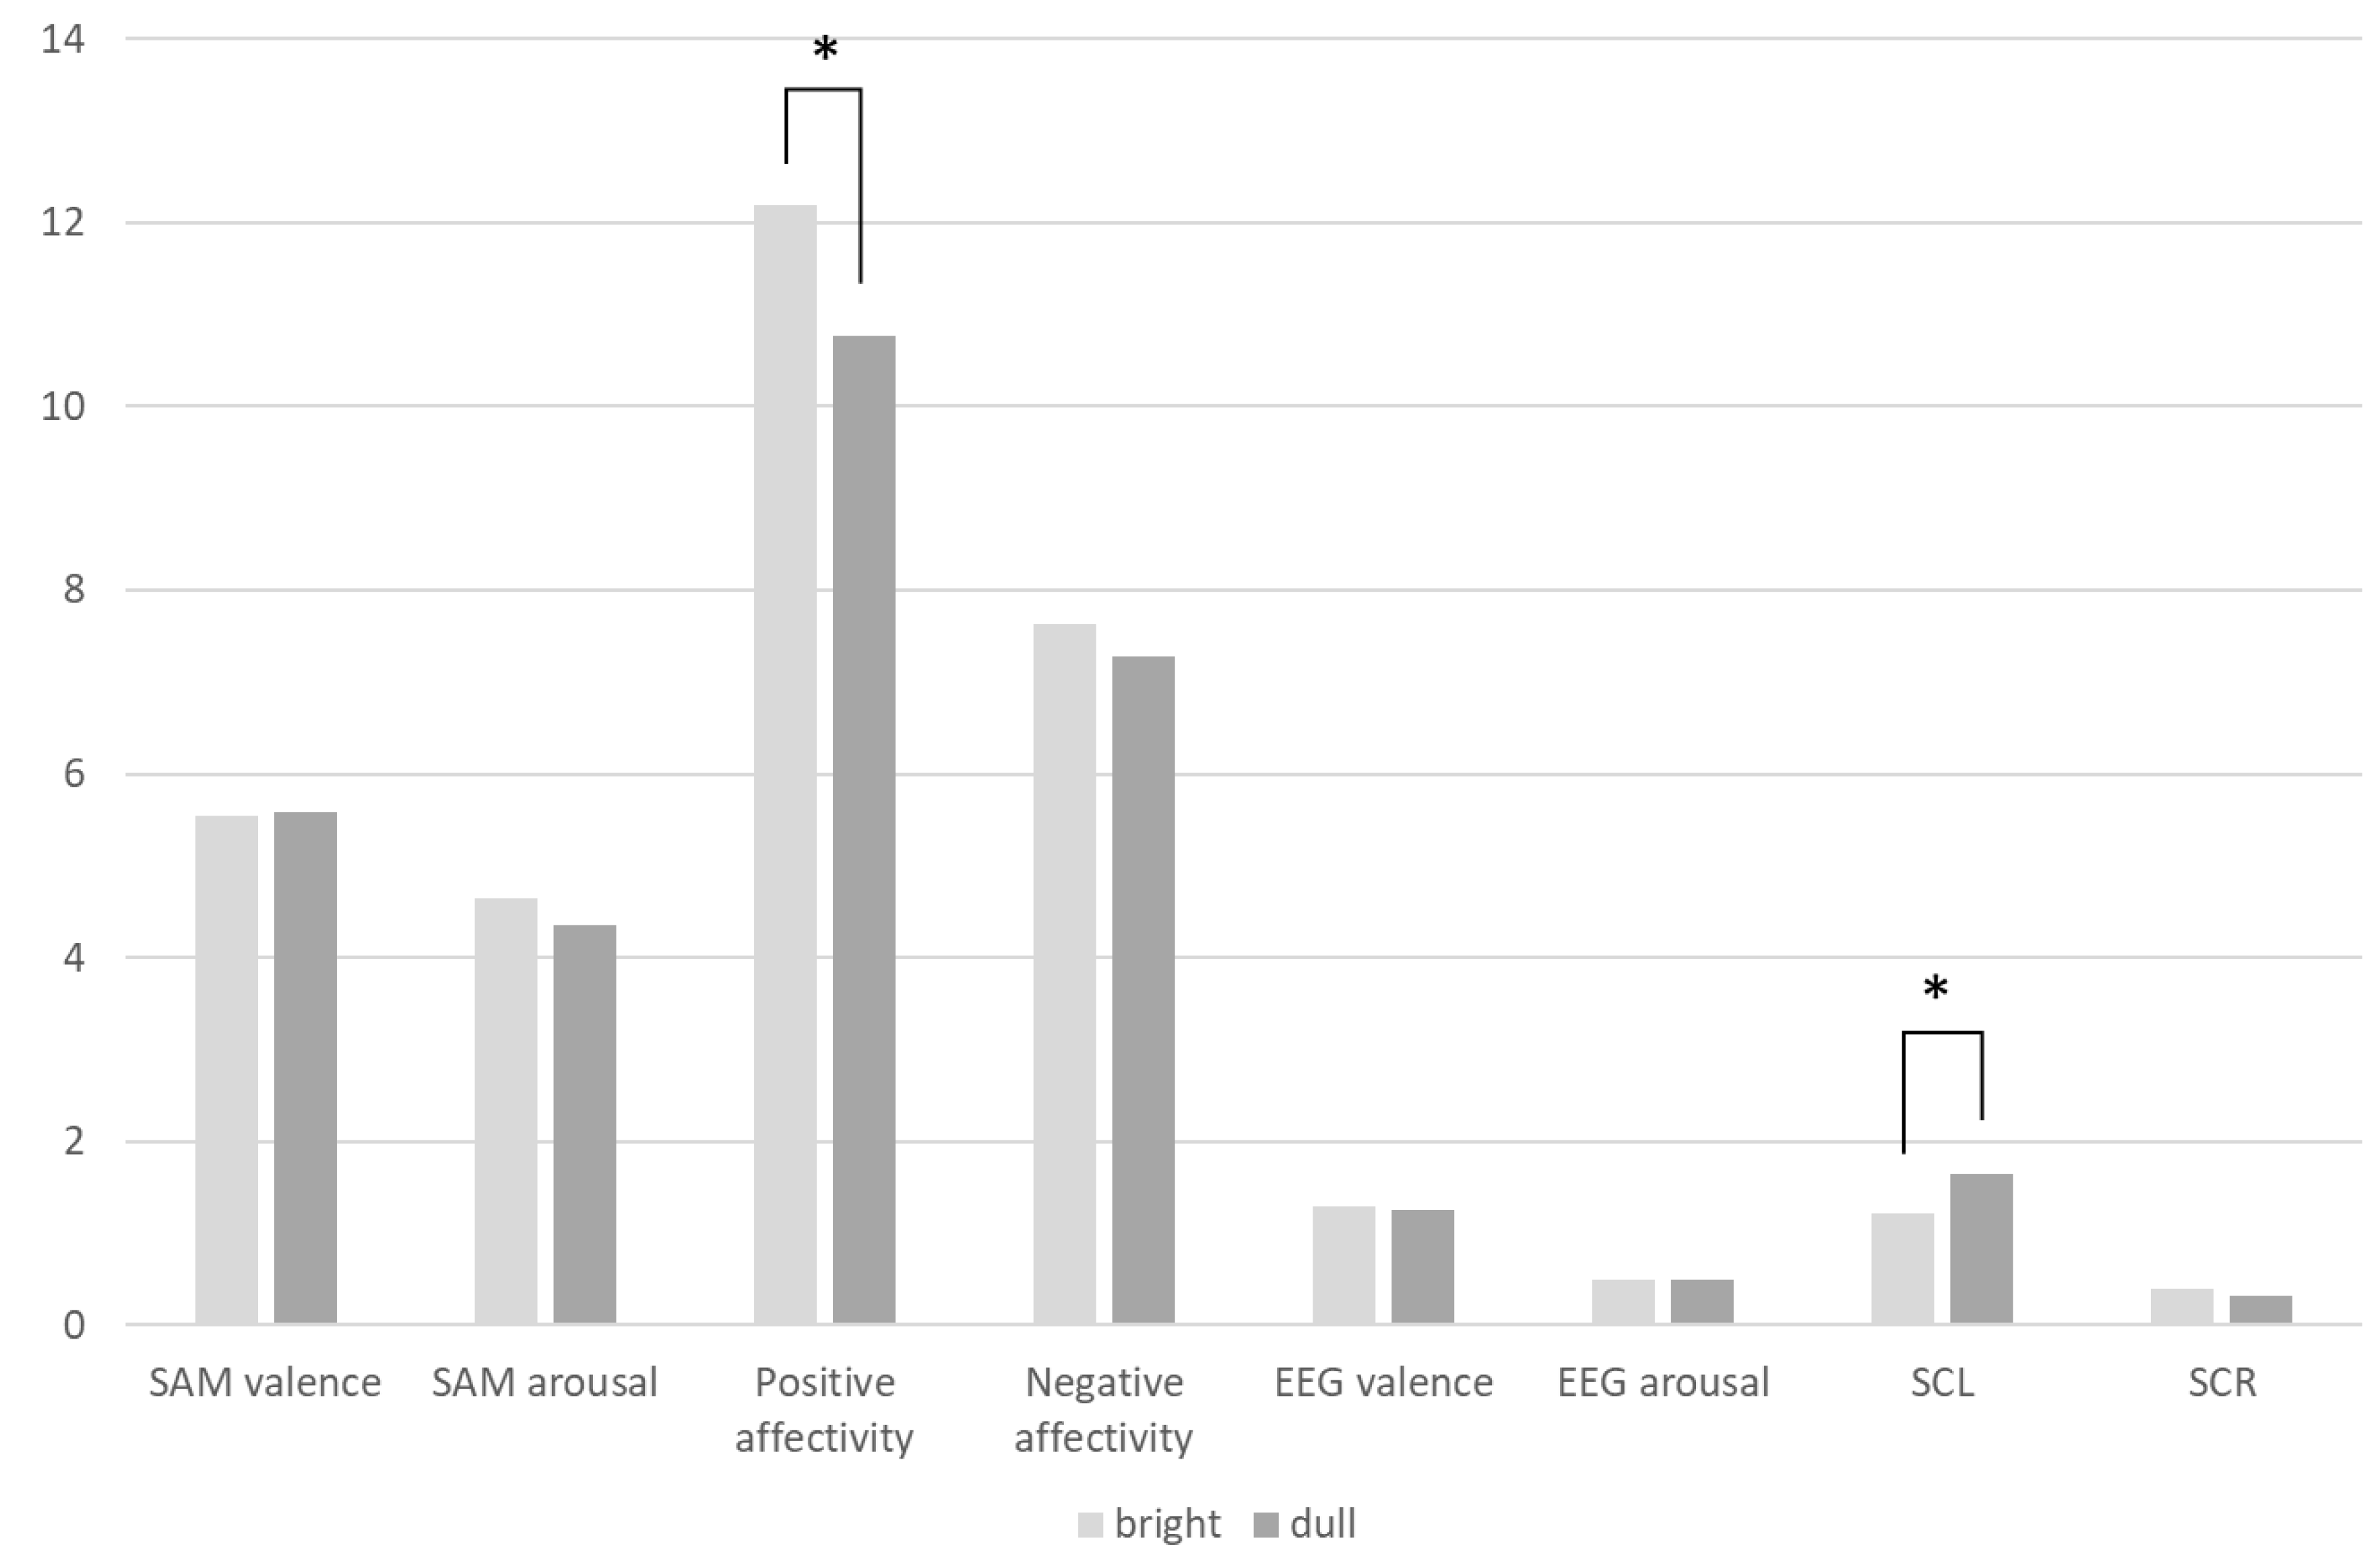
In this experiment, we used the brightness of materials as the grouping variable and conducted independent samples t-tests using various subjective and physiological data as test variables. The results are shown in Figure 9. The findings indicate that material brightness significantly differs between PA and SCL values (p < 0.01). Specifically, regarding PA, a comparison of the means reveals that brighter samples evoke more positive emotions in participants. This result suggests that participants generally exhibit more positive emotional responses when exposed to brighter materials.
Furthermore, we found that dull surfaces elicit higher SCL values. An increase in SCL is typically considered a marker of emotional arousal and implies increased stress [49].

4. Discussion

4.1. Correlation Analysis between Subjective Evaluation and Physiological Indicators

4.1.1. Internal Relationships among the Subjective Evaluations

Regarding the internal relationships of subjective evaluations, it is important to note that extensive research has demonstrated a quadratic relationship between subjective valence and arousal [52,53,54], where both pleasant and unpleasant feelings can result in higher subjective arousal scores. Yee found that the relationship between valence and arousal follows a U-shaped curve [55], meaning both low and high valence can induce high arousal.
Subjective PA and NA showed significant correlations with subjective valence and arousal. These findings, which align with the research of Hutchison et al. [56], shed light on the relationships among subjective evaluation metrics. They also suggest that enhancing subjective pleasurability regarding the experimental samples can boost PA and alleviate NA. However, it is important to note that the subjective arousal regarding the experimental samples lacks directionality, meaning that samples with high arousal may receive high scores in both positive and negative emotions.

4.1.2. Internal Relationship of Physiological Indicators

EEG valence is an effective measure for detecting emotions ranging from pleasant to unpleasant. Research has shown that EEG valence is closely related to stress, where low valence indicates high stress [57], which is consistent with the findings of this study. Therefore, the relationship between EEG valence and SCR values suggests that when the experimental sample puts the subjects in a low-SCR state, it may evoke more pleasant emotions. The low SCR values ​​of the subjects may be due to the characteristics of the experimental sample surface, such as texture or tactile sensation.
Research by Hot et al. [58] found that when subjects evaluated unpleasant images, their SCL and SCR values were positively correlated. Combined with the negative correlation between EEG valence and SCR observed in this study, it can be inferred this finding are consistent with theirs in terms of negative emotions and SCL/SCR.

4.1.3. The Relationship between Subjectivity and Physiology

The relationship between subjectivity and physiology results differs from some existing studies. For instance, Wang et al. found a significant positive correlation between subjective and physiological valence when studying facial creams [47]. The reasons for these differences are multifaceted. Compared to Wang et al.'s study, our experimental samples differed significantly in content and quantity. Additionally, to avoid overly complicating the experimental process, this study used only the visual and tactile dimensions for evaluation, excluding other dimensions such as olfactory and auditory. Due to the complexity of the subjective SAM valence assessment, including different dimensions could lead to varying evaluation results.
In addition, this experiment's results show a certain degree of correlation between subjective and physiological data, particularly in arousal. Research indicates increased arousal can signify positive and negative emotions [59,60]. Using the PANAS scale, this study demonstrates this point by showing the correlation between arousal and positive and negative directions.

4.2. Analysis of Differences in Emotional Responses to Material Sources

The experiment shows that the source of the material may subconsciously influence individuals' emotional experiences, thereby affecting their psychological state. Further analysis indicates that these negative emotions could be related to the characteristics of the artificial boards. Research has pointed out that non-wood materials are more likely to elicit negative emotions than wood [61]. Natural wood typically imparts a sense of nature and warmth, whereas artificial boards might cause users to feel a certain level of discomfort or aversion due to their synthetic nature. The artificial feel conveyed by artificial board veneers might also generate negative emotions.
Shiv et al. studied the effects of different surface treatments on wood and their impact on people’s emotions. Their research showed that maintaining the natural texture of the wood surface during treatment can enhance positive tactile experiences and avoid negative tactile experiences [62]. Therefore, understanding the impact of material sources on people’s emotional responses is significant for the design and selection of building materials and provides valuable insights for further research in the field of material-related emotions.
There is not yet a consensus among researchers regarding the relationship between SCR and emotion types. Douglas et al. used SCR values to indicate stress in participants and found that SCR is associated with subjective stress levels and subjective negative arousal [63]. Several studies have also indicated that negative emotions can increase SCR values [64,65]. However, some researchers argue that SCR varies with the intensity of emotions, with more intense reactions noted in unpleasant and pleasant environments, particularly in high-arousal situations [66]. In other words, SCR primarily reflects differences in emotional arousal rather than pleasure levels.
Based on the analysis of physiological indicators, our results indicate that natural materials elicit higher emotional arousal than artificial board materials. However, this finding does not directly suggest that natural materials induce positive emotions. Natural materials are often believed to evoke feelings of pleasure, and some studies have suggested that natural wood materials are more effective at reducing stress compared to other materials [61,62].
It is important to note that the materials selected for this study were similar, and participants were not informed of the material source during the experiment. Therefore, we hypothesize that the observed differences are not solely due to the material source but also involve various factors related to the characteristics of the materials. We will analyze and discuss these aspects in the following section.
This nuance is crucial, as it suggests that factors beyond just the material type, such as texture, appearance, and possibly even unconscious associations or expectations, play a role in how these materials affect emotional and physiological responses. Further research could explore these additional factors to provide a more comprehensive understanding of the emotional impacts of natural versus artificial materials.

4.3. The differences in materials’ tactile sensations

An intriguing result emerged from this experiment. It is often assumed that the natural texture of wood is more capable of evoking positive emotions and is considered more esthetically pleasing [61]. However, this study found that the three-dimensional surface texture created through artificial veneering techniques also stimulated positive emotions in terms of touch. Furthermore, the average scores indicated that Veneer B received the highest positive emotion score (14.20), surpassing the second highest-scoring material, elm, which scored 12.45. This result suggests that we can enhance positive emotional responses by manipulating the three-dimensional quality of a material’s surface through manufacturing techniques. This finding also provides a theoretical basis for developing high-value-added products in the artificial board industry.

4.4. The Differences in Emotional Responses to Material Texture

In this experiment, the samples classified as having fine textures were Veneer A and Veneer C, which were artificial materials. Notably, Veneer B, an artificial material, had a coarse texture and achieved the highest PA. As mentioned earlier, Veneer B's use of a PVC film vacuum molding process resulted in a three-dimensional surface texture, enhancing its tactile sensation and visual perception and providing a significant textural appearance. In contrast, Veneers A and C used digitally printed wood grain stickers that were adhered to the artificial boards’ surfaces, thus lacking a pronounced three-dimensional effect. Although the textures of these two boards were smooth, the clarity of the textures on Veneers A and C was far inferior to that of natural wood due to the limitations of the printing process. Finally, while no specific research links texture coarseness or fineness with perceived value, the repetitive nature of digitally printed fine-texture surfaces often conveys a sense of cheapness.

4.5. The Differences in Emotional Responses to Material Brightness

We identified two main reasons for the differences in the emotional responses to brightness. First, the brightness of printed decorative veneers on artificial boards is generally low, especially in Veneers A and C. Their lower brightness makes these veneers dull, affecting participants’ evaluations of these materials. Second, the variation in natural wood texture brightness also plays a crucial role. For example, the contrast in texture brightness of black walnut, cherry wood, and pine is less pronounced than that of white ash or red oak, making the visual impact of these woods weaker than the latter.
Our experimental results also indicate that the overall brightness of a material is an essential factor influencing participants ' evaluations. However, the contrast between light and dark areas in the same sample affected the participants. In a study on wood images, Akira et al. found that variations in wood texture brightness significantly influence participants' preferences [23]. Our experiment also confirmed this phenomenon, demonstrating that overall brightness and local contrast are crucial in visual evaluations.
In conclusion, our experiment revealed the significant impact of material brightness on participants' emotional and physiological responses. Bright materials stimulated positive emotional reactions, while dull materials increased emotional arousal and stress responses. Artificial and natural materials' texture and brightness had a similar influence on participants' evaluations. This result suggests that carefully considering these factors is essential in material design and selection to optimize the user experience. Future research could further explore the psychological and physiological effects of different materials and textures in practical applications, providing more resounding theoretical support and practical guidance for material science and design.

5. Conclusions

This study provides a new perspective on the emotional effects of wood materials by analyzing the impact of solid wood and artificial boards on consumers’ emotions. A combined approach of subjective evaluation and physiological measurement techniques was employed. We used SAM and PANAS for the subjective evaluation, and the physiological measurements primarily involved recording participants' EEG and EDA signals. Additionally, we calculated valence and arousal based on EEG data using specific formulas. We systematically evaluated different materials' subjective and physiological effects on participants' emotions from both visual and tactile dimensions. Through statistical analysis of the data, we obtained several important findings that are significant for understanding the mechanisms by which materials influence emotions and for guiding material design and selection.
Firstly, this study found significant correlations between specific subjective and physiological data. For example, a positive correlation exists between subjective and physiological arousal and SCR. Additionally, PA and NA positively correlate with physiological arousal. This result indicates consistency between the level of arousal participants subjectively experience and their physiological responses. However, the relationship between subjective and physiological measures of valence is more complex; in this experiment, no significant relationship was observed between subjective and physiological valence. From the positive correlations between some subjective and objective data, we can conclude that, although changing the composition of materials does not directly enhance overall subjective and physiological evaluations, increasing participants' arousal levels regarding the material can indirectly improve these evaluations.
Secondly, independent samples t-tests conducted on the sources of the experimental samples revealed significant differences between natural wood and artificial boards in terms of subjective NA and SCR. Artificial boards tend to elicit higher negative emotions, whereas natural materials can evoke a more robust arousal response in participants.
Finally, using the composition elements of the experimental samples as grouping variables, we tested for differences in subjective and objective data across different elements. We found significant differences in PA based on the tactile qualities of the samples; samples with more intense tactile sensations were more effective at eliciting positive emotions from participants. Additionally, there were significant differences in SAM arousal and PA concerning the texture of the samples. Coarser textures, due to their higher visual recognizability, led to greater emotional arousal, thereby generating positive emotions. In contrast, finer textures, which are less recognizable, tended to induce cognitive stress in participants, resulting in lower evaluations. The brightness of the samples also showed significant differences in PA and SCL; brighter samples were more effective in stimulating positive emotions, while dull samples were more likely to cause cognitive stress.
This experiment showed that the samples' tactile sensation, texture, and brightness primarily affected subjective positive emotions, subjective arousal, and SCL and SCR values. In contrast, their impact on pleasurable emotions (SAM and EEG valence) was relatively minor. This suggests that the visual and tactile characteristics of the materials primarily influenced participants' subjective and psychological arousal levels rather than directly affecting their sense of pleasure. Therefore, we can conclude that while altering the composition of materials may not directly enhance subjective and physiological valence, increasing participants' arousal levels or reducing the pressure levels indicated by skin conductance can indirectly improve these evaluations.
Although this study has revealed some significant findings, many unanswered questions still require further exploration. Future research could focus on the following areas:
Exploration of other sensory dimensions—smell and sound: In addition to visual and tactile sensations, smell and sound may also significantly influence emotions. Future research could investigate how these sensory dimensions impact the emotional effects of materials.
Other types of sustainable materials—bio-based materials: With increasing environmental awareness, bio-based materials are becoming more widespread. Future studies could explore their emotional impact to provide scientific support for their promotion.
Studies on different user groups— demographic differences: Users of different ages, genders, and cultural backgrounds may react differently to materials. Future research could segment the market by demographic to better understand the emotional needs of different user groups, offering more personalized design solutions.
By addressing these areas, future research could further enhance our understanding of how materials affect emotions, leading to more informed material choices and improved user experiences.
The conclusions of this study have practical applications in several areas. Firstly, regarding the design and promotion of wood materials, particularly artificial boards, this research provides scientific evidence that enhancing the visual characteristics of materials can improve consumers' emotional experiences, thereby increasing the market competitiveness of products. Secondly, our findings suggest that, in fields such as interior design and furniture manufacturing, paying attention to the visual characteristics of materials, such as color and texture, can effectively elevate users' emotional arousal, enhancing their overall experience.
Overall, this study reveals the different impacts of solid wood and artificial boards on people’s emotions through multidimensional analysis, offering valuable theoretical and practical references. Future research could further explore the emotional effects of other sensory dimensions, such as smell and sound, to improve our understanding of the complex relationship between materials and emotions.
Funding

This project is funded by the Guangdong Provincial Department of Science and Technology and Guangzhou Academy of Fine Arts Art and Technology Support Platform.

Institutional Review Board Statement

The study was conducted in accordance with the Declaration of Helsinki, and approved by the Research Ethics Committee of Shantou University (protocol code STU202406002).

References

  1. Mao, Y.; Hu, L.; Ren, Z.J. Engineered Wood for a Sustainable Future. Matter 2022, 5, 1326–1329. [Google Scholar] [CrossRef]
  2. He, R.; Xu, J. Research on the Application of Visual Semantics of Wood in the Design of Cultural and Creative Products. Furniture and interior decoration 2021, 5, 108–110. [Google Scholar] [CrossRef]
  3. Gao, P.; Zhang, Y.; Long, Z. Kansei Drives Sustainable Material Innovation—An Approach to Enhance the Added Value of Biomass Materials. Sustainability 2024, 16, 5546. [Google Scholar] [CrossRef]
  4. Gao, P.; Yang, L.I.; MING HUI, H.U.; Dai, X.D. BIO-BASED MATERIAL DESIGN: DEVELOPMENT OF A MODEL FOR ENHANCING THE PERCEPTUAL VALUE OF MATERIALS. Journal of environmental protection and ecology 2023, 24, 145–155. [Google Scholar]
  5. Sauerwein, M.; Karana, E.; Rognoli, V. Revived Beauty: Research into Aesthetic Appreciation of Materials to Valorise Materials from Waste. Sustainability 2017, 9, 529. [Google Scholar] [CrossRef]
  6. Houck, J.E.; Eagle, B.N. Hardwood or Softwood? Science & Technology 1998, 32, 13–22. [Google Scholar]
  7. Jones, D.; Brischke, C. Performance of Bio-Based Building Materials; Woodhead Publishing, 2017.
  8. Chen, B.; Mohrmann, S.; Li, H.; Gaff, M.; Lorenzo, R.; Corbi, I.; Corbi, O.; Fang, K.; Li, M. Research and Application Progress of Straw. Journal of Renewable Materials (JRM) 2022, 11, 599–623. [Google Scholar] [CrossRef]
  9. Deng, N.; Wang, J.; Li, J.; Sun, J. Straw Density Board vs. Conventional Density Board: Is Straw Density Board More Sustainable? Science of The Total Environment 2023, 888, 164020. [Google Scholar] [CrossRef]
  10. Li, Y.; Zhu, N.; Chen, J. Straw Characteristics and Mechanical Straw Building Materials: A Review. J Mater Sci 2023, 58, 2361–2380. [Google Scholar] [CrossRef]
  11. Febrianto, F.; Hidayat, W.; Samosir, T.P.; Lin, H.; Soong, H. Effect of Strand Combination on Dimensional Stability and Mechanical Properties of Oriented Strand Board Made from Tropical Fast Growing Tree Species. Journal of Biological Sciences 2010, 10, 267–272. [Google Scholar] [CrossRef]
  12. Nishimura, T. Chipboard, Oriented Strand Board (OSB) and Structural Composite Lumber. In Wood composites; Elsevier, 2015; pp. 103–121.
  13. Mu, T. Research on the Visual-Tactile Properties of Wood Doors with Oriented Strand Boards. PhD Thesis, Nanjing: Nanjing Forestry University, 2023.
  14. Wang, R.; Lv, B. China’s Wooden Home Surface Decoration Industry Development Status and Thinking. Chinese wood-based panel 2019, 26, 10–14, CNKI:SUN:CWBP.0.2019-12-003. [Google Scholar]
  15. Kandelbauer, A.; Teischinger, A. Dynamic Mechanical Properties of Decorative Papers Impregnated with Melamine Formaldehyde Resin. European Journal of wood and wood products 2009, 68, 179–187. [Google Scholar] [CrossRef]
  16. Amor, A.B.; Cloutier, A.; Beauregard, R. Determination of Physical and Mechanical Properties of Finishing Papers Used for Wood-Based Composite Products. Wood and Fiber Science 2009, 117–126. [Google Scholar] [CrossRef]
  17. Shen, C. Research on High Abrasion-Resistant Impregnated Paper and Its Production Process. Forestry science and technology development 2001, 15, 33–34. [Google Scholar] [CrossRef]
  18. Gu, Z.; Jiang, B.; Zhu, P.; Sun, X.; Lian, H. Preparation of Mg/Al-LDHs Nanoflame Retardants and Their Application in Veneered Artificial Boards. Journal of Forestry Engineering 2016, 1, 39–44. [Google Scholar] [CrossRef]
  19. Bertheaux, C.; Zimmermann, E.; Gazel, M.; Delanoy, J.; Raimbaud, P.; Lavoué, G. Effect of Material Properties on Emotion: A Virtual Reality Study. Frontiers in Human Neuroscience 2024, 17, 1301891. [Google Scholar] [CrossRef] [PubMed]
  20. D’Itria, E.; Colombi, C. Biobased Innovation as a Fashion and Textile Design Must: A European Perspective. Sustainability 2022, 14, 570. [Google Scholar] [CrossRef]
  21. Takashi, S.; Akiko, K.; Fumio, T.; Mitsunori, K. Texture Expression by Composite of Silicone Resin and Filler. Design Studies 2015, 61, 6_85–6_92. [Google Scholar] [CrossRef]
  22. Shen, D.; Takuro, I.; Koichiro, S.; Fumio, T.; Mitsunori, K. Investigation of Dyeing Method Focusing on the Structure of Bamboo and Evaluation of the Impression of Dyed Bamboo Wood. Design Studies 2017, 63, 6_65–6_72. [Google Scholar] [CrossRef]
  23. Satoshi, N.; Kei, M.; Shintaro, N. Evaluation of Visual Desirability of 50 Japanese Wood Species Using Digital Images. Journal of the Society of Wood Science and Technology 2016, 62, 301–310. [Google Scholar] [CrossRef]
  24. Gao, P.; Ogata, M. Research on the Visual Impression and Preference of Biomass Material “Tea Wood. ” Design 2020, 33, 60–63, CNKI:SUN:SJTY.0.2020-05-020. [Google Scholar]
  25. Lv, J.; Chen, D. Emotional Apparel Evaluation Based on Consumer Psychological Perception. Journal of Textiles 2015, 36, 100–107. [Google Scholar] [CrossRef]
  26. Wei, H.; Chen, W.; Wei, J.; Zhang, J. Reliability Test of the Children’s Version of the Positive-Negative Affect Scale in a Group of Middle School Students. Chinese Journal of Clinical Psychology 2017, 25, 105–110. [Google Scholar] [CrossRef]
  27. Ebesutani, C.; Regan, J.; Smith, A.; Reise, S.; Higa-McMillan, C.; Chorpita, B.F. The 10-Item Positive and Negative Affect Schedule for Children, Child and Parent Shortened Versions: Application of Item Response Theory for More Efficient Assessment. J Psychopathol Behav Assess 2012, 34, 191–203. [Google Scholar] [CrossRef]
  28. Watson, D.; Clark, L.A.; Tellegen, A. Development and Validation of Brief Measures of Positive and Negative Affect: The PANAS Scales. Journal of personality and social psychology 1988, 54, 1063. [Google Scholar] [CrossRef]
  29. Babiker, A.; Faye, I.; Malik, A. Pupillary Behavior in Positive and Negative Emotions. In Proceedings of the 2013 IEEE international conference on signal and image processing applications; IEEE; 2013; pp. 379–383. [Google Scholar]
  30. Francis, S.; Rolls, E.T.; Bowtell, R.; McGlone, F.; O’Doherty, J.; Browning, A.; Clare, S.; Smith, E. The Representation of Pleasant Touch in the Brain and Its Relationship with Taste and Olfactory Areas. Neuroreport 1999, 10, 453–459. [Google Scholar] [CrossRef]
  31. Quan, X.; Zeng, Z.; Jiang, J.; Zhang, Y.; Lv, B.; Wu, D. A Review of Research on Physiological Signal-Based Affective Computing. Journal of Automation 2021, 47, 1769–1784. [Google Scholar] [CrossRef]
  32. Hu, X.; Yu, J.; Song, M.; Yu, C.; Wang, F.; Sun, P.; Wang, D.; Zhang, D. EEG Correlates of Ten Positive Emotions. Frontiers in human neuroscience 2017, 11, 26. [Google Scholar] [CrossRef]
  33. Yasemin, M.; Sarıkaya, M.A.; Ince, G. Emotional State Estimation Using Sensor Fusion of EEG and EDA. In Proceedings of the 2019 41st Annual International Conference of the IEEE Engineering in Medicine and Biology Society (EMBC); IEEE; 2019; pp. 5609–5612. [Google Scholar]
  34. Gupta, K.; Zhang, Y.; Gunasekaran, T.S.; Krishna, N.; Pai, Y.S.; Billinghurst, M. CAEVR: Biosignals-Driven Context-Aware Empathy in Virtual Reality. IEEE Transactions on Visualization and Computer Graphics 2024, 30, 2671–2681. [Google Scholar] [CrossRef]
  35. Sargent, A.; Watson, J.; Ye, H.; Suri, R.; Ayaz, H. Neuroergonomic Assessment of Hot Beverage Preparation and Consumption: An EEG and EDA Study. Frontiers in human neuroscience 2020, 14, 175. [Google Scholar] [CrossRef]
  36. Hwang, S.; Jebelli, H.; Choi, B.; Choi, M.; Lee, S. Measuring Workers’ Emotional State during Construction Tasks Using Wearable EEG. J. Constr. Eng. Manage. 2018, 144, 04018050. [Google Scholar] [CrossRef]
  37. Zhai, J.; Barreto, A.B.; Chin, C.; Li, C. Realization of Stress Detection Using Psychophysiological Signals for Improvement of Human-Computer Interactions. In Proceedings of the Proceedings. IEEE SoutheastCon, 2005.; IEEE; 2005; pp. 415–420. [Google Scholar]
  38. Chanel, G.; Rebetez, C.; Bétrancourt, M.; Pun, T. Emotion Assessment from Physiological Signals for Adaptation of Game Difficulty. IEEE Transactions on Systems, Man, and Cybernetics-Part A: Systems and Humans 2011, 41, 1052–1063. [Google Scholar] [CrossRef]
  39. Caruelle, D.; Gustafsson, A.; Shams, P.; Lervik-Olsen, L. The Use of Electrodermal Activity (EDA) Measurement to Understand Consumer Emotions–A Literature Review and a Call for Action. Journal of Business Research 2019, 104, 146–160. [Google Scholar] [CrossRef]
  40. Marschallek, B.E.; Löw, A.; Jacobsen, T. You Can Touch This! Brain Correlates of Aesthetic Processing of Active Fingertip Exploration of Material Surfaces. Neuropsychologia 2023, 182, 108520. [Google Scholar] [CrossRef] [PubMed]
  41. Xie, X.; Cai, J.; Fang, H.; Wang, B.; He, H.; Zhou, Y.; Xiao, Y.; Yamanaka, T.; Li, X. Affective Impressions Recognition under Different Colored Lights Based on Physiological Signals and Subjective Evaluation Method. Sensors 2023, 23, 5322. [Google Scholar] [CrossRef]
  42. Wang, J.; Lu, J.; Xu, Z.; Wang, X. When Lights Can Breathe: Investigating the Influences of Breathing Lights on Users’ Emotion. International Journal of Environmental Research and Public Health 2022, 19, 13205. [Google Scholar] [CrossRef]
  43. Ikei, H.; Song, C.; Miyazaki, Y. Physiological Effects of Touching Wood. International journal of environmental research and public health 2017, 14, 801. [Google Scholar] [CrossRef]
  44. Kuesten, C.; Chopra, P.; Bi, J.; Meiselman, H.L. A Global Study Using PANAS (PA and NA) Scales to Measure Consumer Emotions Associated with Aromas of Phytonutrient Supplements. Food Quality and Preference 2014, 33, 86–97. [Google Scholar] [CrossRef]
  45. Palmiero, M.; Piccardi, L. Frontal EEG Asymmetry of Mood: A Mini-Review. Frontiers in Behavioral Neuroscience 2017, 11, 224. [Google Scholar] [CrossRef]
  46. Al-Nafjan, A.; Hosny, M.; Al-Wabil, A.; Al-Ohali, Y. Classification of Human Emotions from Electroencephalogram (EEG) Signal Using Deep Neural Network. Int. J. Adv. Comput. Sci. Appl 2017, 8, 419–425. [Google Scholar] [CrossRef]
  47. Wang, F.; Ma, X.; Cheng, D.; Gao, L.; Yao, C.; Lin, W. Electroencephalography as an Objective Method for Assessing Subjective Emotions during the Application of Cream. Skin Research and Technology 2024, 30, e13692. [Google Scholar] [CrossRef] [PubMed]
  48. Ge, Y.; Chen, Y.; Liu, Y.; Li, W.; Sun, X. Electrophysiological Measures Applied in User Experience Studies. Advances in Psychological Science 2014, 22, 959. [Google Scholar] [CrossRef]
  49. Sánchez-Reolid, R.; López de la Rosa, F.; Sánchez-Reolid, D.; López, M.T.; Fernández-Caballero, A. Machine Learning Techniques for Arousal Classification from Electrodermal Activity: A Systematic Review. Sensors 2022, 22, 8886. [Google Scholar] [CrossRef] [PubMed]
  50. Harley, J.M.; Jarrell, A.; Lajoie, S.P. Emotion Regulation Tendencies, Achievement Emotions, and Physiological Arousal in a Medical Diagnostic Reasoning Simulation. Instr Sci 2019, 47, 151–180. [Google Scholar] [CrossRef]
  51. Dawson, M.E.; Schell, A.M.; Filion, D.L. The Electrodermal System. In Handbook of Psychophysiology; Cambridge University Press: Cambridge, UK, 2007; Volume 2, pp. 159–181. [Google Scholar]
  52. Ho, S.M.; Mak, C.W.; Yeung, D.; Duan, W.; Tang, S.; Yeung, J.C.; Ching, R. Emotional Valence, Arousal, and Threat Ratings of 160 Chinese Words among Adolescents. PloS one 2015, 10, e0132294. [Google Scholar] [CrossRef]
  53. Xu, X.; Li, J.; Chen, H. Valence and Arousal Ratings for 11,310 Simplified Chinese Words. Behav Res 2022, 54, 26–41. [Google Scholar] [CrossRef]
  54. Chan, Y.-L.; Tse, C.-S. Decoding the Essence of Two-Character Chinese Words: Unveiling Valence, Arousal, Concreteness, Familiarity, and Imageability through Word Norming. Behav Res 2024. [Google Scholar] [CrossRef]
  55. Yee, L.T. Valence, Arousal, Familiarity, Concreteness, and Imageability Ratings for 292 Two-Character Chinese Nouns in Cantonese Speakers in Hong Kong. PloS one 2017, 12, e0174569. [Google Scholar] [CrossRef]
  56. Hutchison, K.E.; Trombley, R.P.; Collins Jr, F.L.; McNeil, D.W.; Turk, C.L.; Carter, L.E.; Ries, B.J.; Leftwich, M.J. A Comparison of Two Models of Emotion: Can Measurement of Emotion Based on One Model Be Used to Make Inferences about the Other? Personality and Individual Differences 1996, 21, 785–789. [Google Scholar] [CrossRef]
  57. Hou, X.; Liu, Y.; Sourina, O.; Mueller-Wittig, W. CogniMeter: EEG-Based Emotion, Mental Workload and Stress Visual Monitoring. In Proceedings of the 2015 International Conference on Cyberworlds (CW); IEEE; 2015; pp. 153–160. [Google Scholar]
  58. Hot, P.; Leconte, P.; Sequeira, H. Diurnal Autonomic Variations and Emotional Reactivity. Biological Psychology 2005, 69, 261–270. [Google Scholar] [CrossRef]
  59. Russell, J.A.; Weiss, A.; Mendelsohn, G.A. Affect Grid: A Single-Item Scale of Pleasure and Arousal. Journal of personality and social psychology 1989, 57, 493. [Google Scholar] [CrossRef]
  60. Burkhardt, F. Simulation of Emotional Speech with Speech Synthesis Methods; Shaker: Maastricht, Netherlands, 2001. [Google Scholar]
  61. Demattè, M.L.; Zucco, G.M.; Roncato, S.; Gatto, P.; Paulon, E.; Cavalli, R.; Zanetti, M. New Insights into the Psychological Dimension of Wood–Human Interaction. Eur. J. Wood Prod. 2018, 76, 1093–1100. [Google Scholar] [CrossRef]
  62. Bhatta, S.R.; Tiippana, K.; Vahtikari, K.; Hughes, M.; Kyttä, M. Sensory and Emotional Perception of Wooden Surfaces through Fingertip Touch. Frontiers in psychology 2017, 8, 367. [Google Scholar] [CrossRef] [PubMed]
  63. Douglas, I.P.; Murnane, E.L.; Bencharit, L.Z.; Altaf, B.; dos Reis Costa, J.M.; Yang, J.; Ackerson, M.; Srivastava, C.; Cooper, M.; Douglas, K. Physical Workplaces and Human Well-Being: A Mixed-Methods Study to Quantify the Effects of Materials, Windows, and Representation on Biobehavioral Outcomes. Building and environment 2022, 224, 109516. [Google Scholar] [CrossRef]
  64. Silva, C.; Ferreira, A.C.; Soares, I.; Esteves, F. Emotions Under the Skin: Autonomic Reactivity to Emotional Pictures in Insecure Attachment. Journal of Psychophysiology 2015, 29, 161–170. [Google Scholar] [CrossRef]
  65. Jindrová, M.; Kocourek, M.; Telenskỳ, P. Skin Conductance Rise Time and Amplitude Discern between Different Degrees of Emotional Arousal Induced by Affective Pictures Presented on a Computer Screen. BioRxiv 2020, 2020–05. [Google Scholar] [CrossRef]
  66. Gomez, P.; Zimmermann, P.; Guttormsen-Schär, S.; Danuser, B. Respiratory Responses Associated with Affective Processing of Film Stimuli. Biological psychology 2005, 68, 223–235. [Google Scholar] [CrossRef]
Figure 1. Research model structure diagram.
Preprints 121350 g001
Figure 2. The SAM and PANAS scales used in this study.
Preprints 121350 g002
Figure 3. Wearing physiological experimental equipment.
Preprints 121350 g003
Figure 4. Experimental flow chart.
Preprints 121350 g004
Figure 5. Electrode positions.
Preprints 121350 g005
Figure 6. Comparison of differences between subjective and physiological data under different sample source conditions.
Preprints 121350 g006
Figure 7. Differences in emotional responses to material texture.
Preprints 121350 g007
Figure 8. Differences in emotional responses to material texture.
Preprints 121350 g008
Figure 9. Comparison of differences in emotional responses to material brightness.
Preprints 121350 g009
Table 1. Classification of natural wood and artificial board samples.
Sample name Material source Tactile Sensation category Texture category Brightness category Sample image
Ash Nature Smooth Coarse texture Bright Preprints 121350 i001
Veneer A Artificial Grainy Fine texture Dull Preprints 121350 i002
Elm Nature Grainy Coarse texture Bright Preprints 121350 i003
Veneer B Artificial Rough Coarse texture Bright Preprints 121350 i004
Red oak Nature Rough Mixed texture Bright Preprints 121350 i005
Veneer C Artificial Grainy Fine texture Dull Preprints 121350 i006
Black walnut Nature Grainy Mixed texture Dull Preprints 121350 i007
White oak Nature Grainy Coarse texture Bright Preprints 121350 i008
Pine Nature Smooth Coarse texture Dull Preprints 121350 i009
Cherry Nature Smooth Fine texture Dull Preprints 121350 i010
Table 2. Correlation coefficients of various data within the subjective evaluation.
SAM valence SAM arousal Positive affectivity Negative affectivity
SAM valence 1 0310** 0.297** -0.308**
SAM arousal 0.310** 1 0.457** 0.258**
Positive affectivity 0.297** 0.457** 1 0.270**
Negative affectivity -0.308** 0.258** 0.270** 1
** Correlation is significant at the 0.01 level (2-tailed).
Table 3. Correlation coefficients of various data among physiological indicators.
EEG valence EEG arousal SCL SCR
EEG valence 1 -0.072 -0.065 -0.213**
EEG arousal -0.072 1 0.061 -0.008
SCL -0.065 0.061 1 0.423**
SCR -0.213** -0.008 0.423** 1
** Correlation is significant at the 0.01 level (2-tailed).
Table 4. Correlation coefficients between subjective evaluation and physiological index data.
SAM valence SAM arousal Positive
affectivity
Negative affectivity EEG
valence
EEG arousal SCL SCR
SAM
valence
1 0310** 0.297** -0.308** -0.133 -0.012 0.22 0.075
SAM arousal 0310** 1 0.457** 0.258** -0.132 0.140* 0.077 0.165*
Positive affectivity 0.297** 0.457** 1 0.270** 0.007 0.286** 0.068 0.023
Negative affectivity -0.308** 0.258** 0.270** 1 -0.102 0.183** 0.084 0.024
EEG
valence
-0.133 -0.132 0.007 -0.102 1 -0.072 -0.065 -0.213**
EEG arousal -0.012 0.140* 0.286** 0.183** -0.072 1 0.061 -0.008
SCL 0.22 0.077 0.068 0.084 -0.065 0.061 1 0.423**
SCR 0.075 0.165* 0.023 0.024 -0.213** -0.008 0.423** 1
** Correlation is significant at the 0.01 level (2-tailed). * Correlation is significant at the 0.05 level (2-tailed).
Disclaimer/Publisher’s Note: The statements, opinions and data contained in all publications are solely those of the individual author(s) and contributor(s) and not of MDPI and/or the editor(s). MDPI and/or the editor(s) disclaim responsibility for any injury to people or property resulting from any ideas, methods, instructions or products referred to in the content.
Copyright: This open access article is published under a Creative Commons CC BY 4.0 license, which permit the free download, distribution, and reuse, provided that the author and preprint are cited in any reuse.
Alerts
Prerpints.org logo

Preprints.org is a free preprint server supported by MDPI in Basel, Switzerland.

Subscribe

© 2025 MDPI (Basel, Switzerland) unless otherwise stated