Submitted:
17 October 2024
Posted:
17 October 2024
You are already at the latest version
Abstract
Keywords:
1. Introduction
2. Materials and Methods
2.1. Manufacturing of Cerium and Europium Fluorides and the NaCl–KCl Salt System
2.2. X-ray Diffraction Method
2.3. Spectroscopic Methods
2.3.1. IR Transmittance Spectroscopy
2.3.2. Diffuse Reflectance Spectroscopy
2.3.3. Luminescence Spectroscopy
2. Results and Discussion
3.1. X-ray Diffractogram
3.2. Results of Spectroscopic Studies
3.2.1. Results of IR Transmission Spectroscopy
3.2.2. Results of Diffuse Reflectance Spectroscopy
3.2.3. Results of Luminescence Spectroscopy
4. Conclusions
5. Patents
Supplementary Materials
Author Contributions
Funding
Data Availability Statement
Acknowledgments
Conflicts of Interest
References
- Hoerter, J. D.; Ward, C. S.; Bale, K. D.; Gizachew, A. N.; Graham, R.; Reynolds, J.; Ward, M. E.; Choi, C.; Kagabo, J.-L.; Sauer, M.; Kuipers, T.; Hotchkiss, T.; Banner, N.; Chellson, R. A.; Ohaeri, T.; Gant, L.; Vanderhill, L. Effect of UVA Fluence Rate on Indicators of Oxidative Stress in Human Dermal Fibroblasts. Int. J. Biol. Sci. 2008, 63–70. [Google Scholar] [CrossRef] [PubMed]
- Luff, B. J.; Townsend, P. D. High Sensitivity Thermoluminescence Spectrometer. Meas. Sci. Technol. 1993, 4, 65–71. [Google Scholar] [CrossRef]
- Zou, Y.; Zhang, Y.; Hu, Y.; Gu, H. Ultraviolet Detectors Based on Wide Bandgap Semiconductor Nanowire: A Review. Sensors 2018, 18, 2072. [Google Scholar] [CrossRef] [PubMed]
- Blasse, G.; Grabmaier, B. C. Luminescent Materials; Springer Berlin Heidelberg: Berlin, Heidelberg, 1994. [Google Scholar] [CrossRef]
- Van Krevel, J. W. H.; Hintzen, H. T.; Metselaar, R.; Meijerink, A. Long Wavelength Ce3+ Emission in Y–Si–O–N Materials. Journal of Alloys and Compounds 1998, 268, 272–277. [Google Scholar] [CrossRef]
- Xu, S.; Li, P.; Wang, Z.; Li, T.; Bai, Q.; Sun, J.; Yang, Z. Luminescence and Energy Transfer of Eu 2+ /Tb 3+ /Eu 3+ in LiBaBO 3 Phosphors with Tunable-Color Emission. J. Mater. Chem. C 2015, 3, 9112–9121. [Google Scholar] [CrossRef]
- Li, T.; Li, P.; Wang, Z.; Xu, S.; Bai, Q.; Yang, Z. Coexistence Phenomenon of Ce 3+ –Ce 4+ and Eu 2+ –Eu 3+ in Ce/Eu Co-Doped LiBaB 9 O 15 Phosphor: Luminescence and Energy Transfer. Phys. Chem. Chem. Phys. 2017, 19, 4131–4138. [Google Scholar] [CrossRef]
- Aguirre De Carcer, I.; Lifante, G.; Cussó, F.; Jaque, F.; Calderón, T. Europium-Doped Alkali Halides as a Selective Ultraviolet Dosimeter Material in the Actinic Region. Applied Physics Letters 1991, 58, 1825–1826. [Google Scholar] [CrossRef]
- Córdoba, C.; Muñoz, J. A.; Cachorro, V.; Cárcer, I. A. D.; Cussó, F.; Jaque, F. The Detection of Solar Ultraviolet-C Radiation Using KCl:Eu2+ Thermoluminescence Dosemeters. J. Phys. D: Appl. Phys. 1997, 30, 3024–3027. [Google Scholar] [CrossRef]
- De Cárcer, I. A.; Dántoni, H. L.; Barboza-Flores, M.; Correcher, V.; Jaque, F. KCl: Eu2+ as a Solar UV-C Radiation Dosimeter. Optically Stimulated Luminescence and Thermoluminescence Analyses. Journal of Rare Earths 2009, 27, 579–583. [Google Scholar] [CrossRef]
- Cordoba-Jabonero, C.; Aguirre De Carcer, I.; Barboza-Flores, M.; Jaque, F. Solar Ultraviolet-B Detectors Using Eu2+ Doped Alkali Halide Crystals. Journal of Alloys and Compounds 2001, 323–324, 847–850. [Google Scholar] [CrossRef]
- Bangaru, S.; Muralidharan, G. Luminescence Studies on Gamma Irradiated KCl: Ce3+ Crystals. Physica B: Condensed Matter 2012, 407, 2185–2189. [Google Scholar] [CrossRef]
- Krishnakumar, D. N.; Rajesh, N. P. Growth and Optical Characterization of Europium and Cerium Doped KCl Single Crystals by Czochralski Method for Dosimetric Applications. Journal of Elec Materi 2019, 48, 1629–1633. [Google Scholar] [CrossRef]
- Cheng, S.; Hunneke, R. E.; Tian, M.; Lukosi, E.; Zhuravleva, M.; Melcher, C. L.; Wu, Y. Self-Assembled nat LiCl–CeCl 3 Directionally Solidified Eutectics for Thermal Neutron Detection. CrystEngComm 2020, 22, 3269–3273. [Google Scholar] [CrossRef]
- Kuznetsov, S. A.; Gaune-Escard, M. Electronic Conductivity of NaCl-KCl Equimolar Melt Containing Eu(III) and Eu(II) Complexes by Electrochemical Impedance Spectroscopy. Zeitschrift für Naturforschung A 2006, 61, 486–490. [Google Scholar] [CrossRef]
- Fujii, T.; Nagai, T.; Sato, N.; Shirai, O.; Yamana, H. Electronic Absorption Spectra of Lanthanides in a Molten Chloride. Journal of Alloys and Compounds 2005, 393, L1–L5. [Google Scholar] [CrossRef]
- Zinchenko, V. F.; Volchak, G. V.; Ieriomin, O. G.; Stoyanova, I. V.; Chivirova, N. O.; Kuleshov, S. V; Doga, P. G. ; Spectral Properties of Ultrafine Systems LaF3 and EuF3 in a Frozen Melt NaCl-KCl. Surface. 2019, 11(26), 394–402. [Google Scholar] [CrossRef]
- Zinchenko, V.; Ieriomin, O.; Volchak, G.; Stoyanova, I. Spectroscopic Study of Stiffened Saline Melts of NaCl−KCl−LnF3 (Ln = La÷Lu) Systems. Visnyk Lviv Univ. Ser. Chem. 2020, 61, 394. [Google Scholar] [CrossRef]
- Zinchenko, V.; Ieriomin, O.; Antonovich, V.; Chivireva, N.; Stoianova, I.; Volchak, G.; Doga, P. SPECTROSCOPIC PROPERTIES OF SOLIDIFIED MELTS OF THE EuF3-CeF3-NaCl-KCl SYSTEM. Ukr. Chem. Journ. 2020, 86, 120–128. [Google Scholar] [CrossRef]
- Putz, H. Match! - Phase Analysis Using Powder Diffraction-Version 3. http://www.crystalimpact.com/download/match3/Manual.pdf (accessed 2024-10-09).
- Petříček, V.; Palatinus, L.; Plášil, J.; Dušek, M. Jana2020 – a New Version of the Crystallographic Computing System Jana. Zeitschrift für Kristallographie - Crystalline Materials 2023, 238, 271–282. [Google Scholar] [CrossRef]
- Vaitkus, A.; Merkys, A.; Sander, T.; Quirós, M.; Thiessen, P. A.; Bolton, E. E.; Gražulis, S. A Workflow for Deriving Chemical Entities from Crystallographic Data and Its Application to the Crystallography Open Database. J Cheminform 2023, 15(1), 123. [Google Scholar] [CrossRef]
- Dorenbos, P. Ce3+ 5d-Centroid Shift and Vacuum Referred 4f-Electron Binding Energies of All Lanthanide Impurities in 150 Different Compounds. Journal of Luminescence 2013, 135, 93–104 . [Google Scholar] [CrossRef]
- Dorenbos, P. Energy of the First 4f7→4f65d Transition of Eu2+ in Inorganic Compounds. Journal of Luminescence 2003, 104, 239–260. [Google Scholar] [CrossRef]
- Lizzo, S.; Velders, A. H.; Meijerink, A.; Dirksen, G. J.; Blasse, G. The Luminescence of Eu2+ in Magnesium Fluoride Crystals. Journal of Luminescence 1995, 65, 303–311. [Google Scholar] [CrossRef]
- Antonovich, V. P.; Stoyanova, I. V.; Chivireva, N. A.; Timukhin, E. V.; Zinchenko, V. F.; Efryushina, N. P. Identification and Quantitative Determination of Some Inorganic Lanthanide Compounds by Diffuse Reflectance Spectroscopy. J Anal Chem 2007, 62, 238–244. [Google Scholar] [CrossRef]
- Zinchenko, V. F.; Ieriomin, O. G.; Stoyanova, I. V.; Volchak, G. V.; Babenko, A. V. DIFFUSE REFLECTION SPECTRA OF FROZEN SALT MELTS OF THE CeF3-EuF3-NaCl-KCl SYSTEMS. Odesa National University Herald. Chemistry 2022, 27, 20–34. [Google Scholar] [CrossRef]
- M. Gaune-Escard, L. M. Gaune-Escard, L. Rycerz, E. Ingier-Stocka, S. Gadžurić, Systematics in the formation of lanthanide halide compounds, Proc. Ninth International Conference on Molten Slags, Fluxes and Salts (MOLTEN12), (2012), May 27th-30th, Beijing, China. P. 198. https://www.pyrometallurgy.co.za/MoltenSlags2012/W189.pdf.
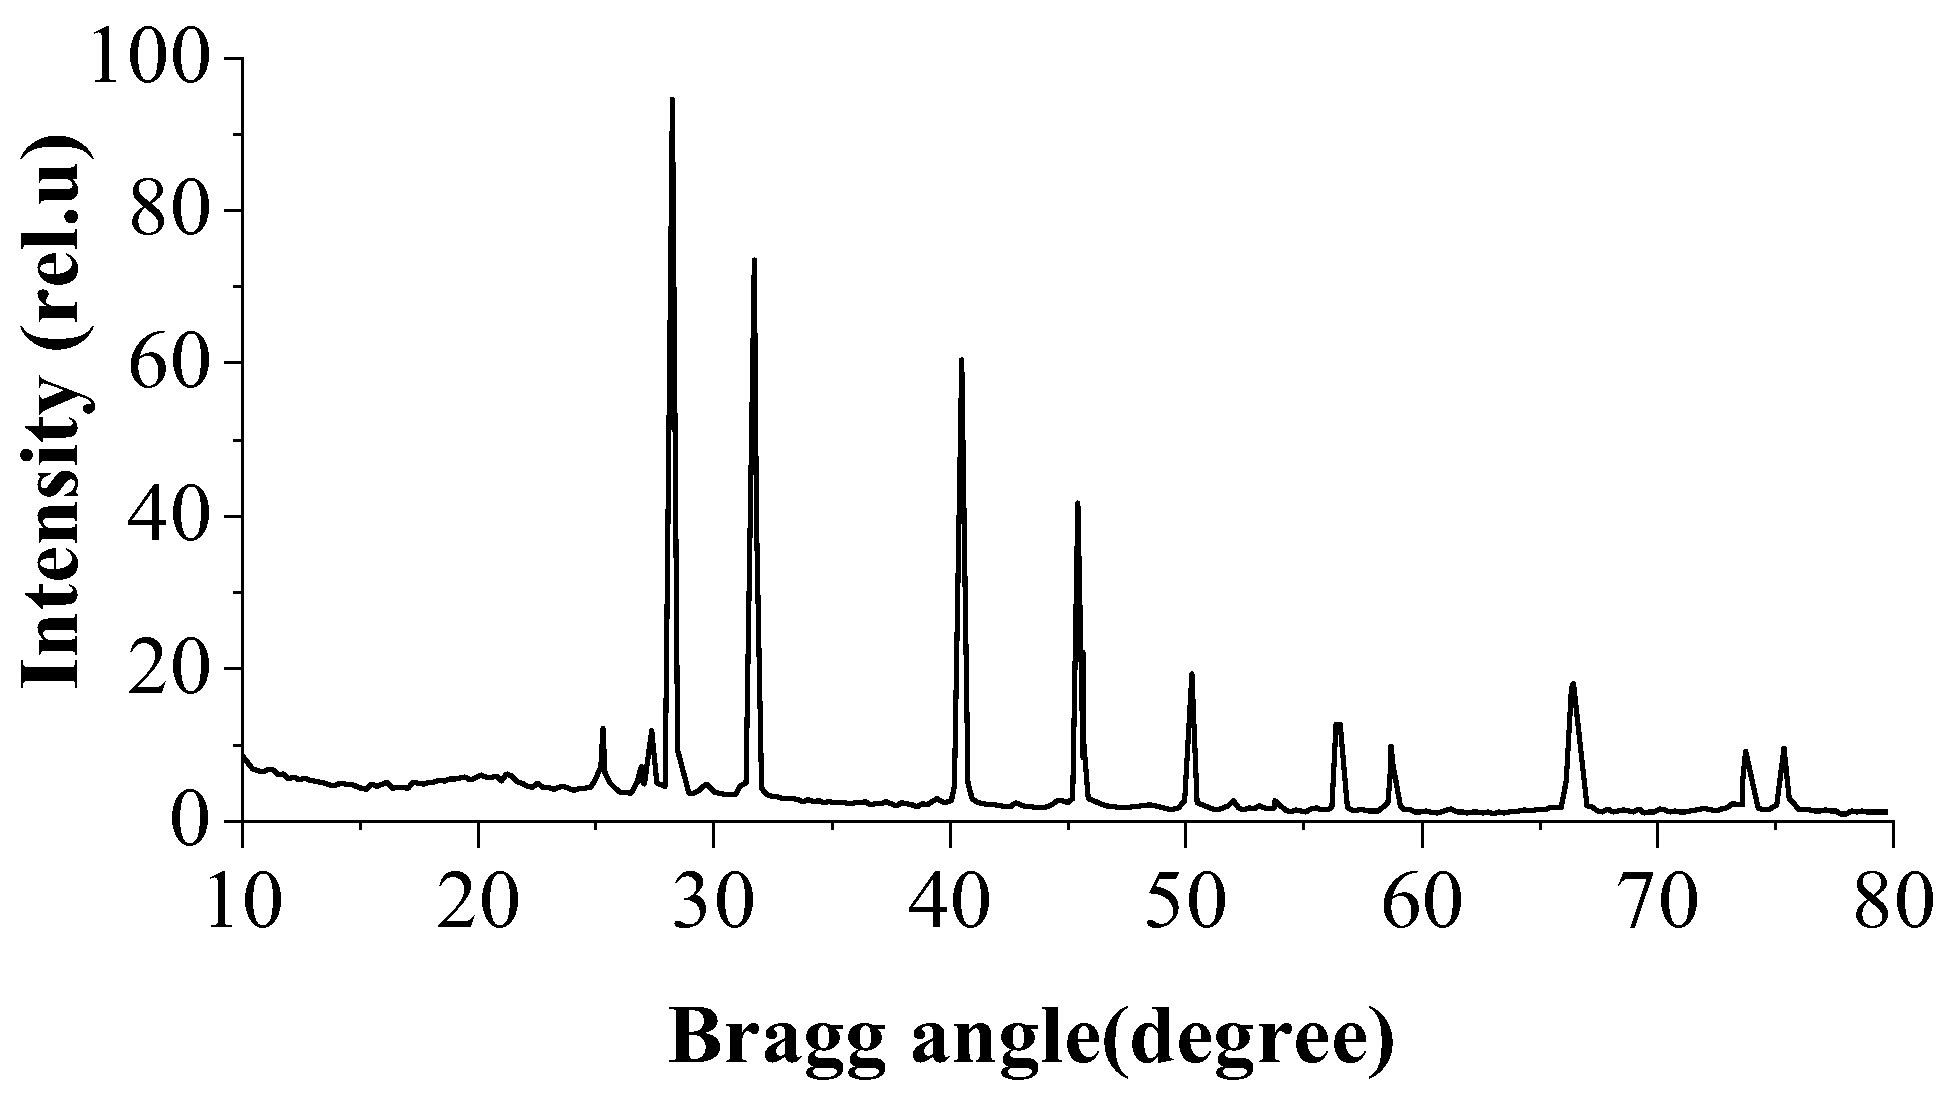
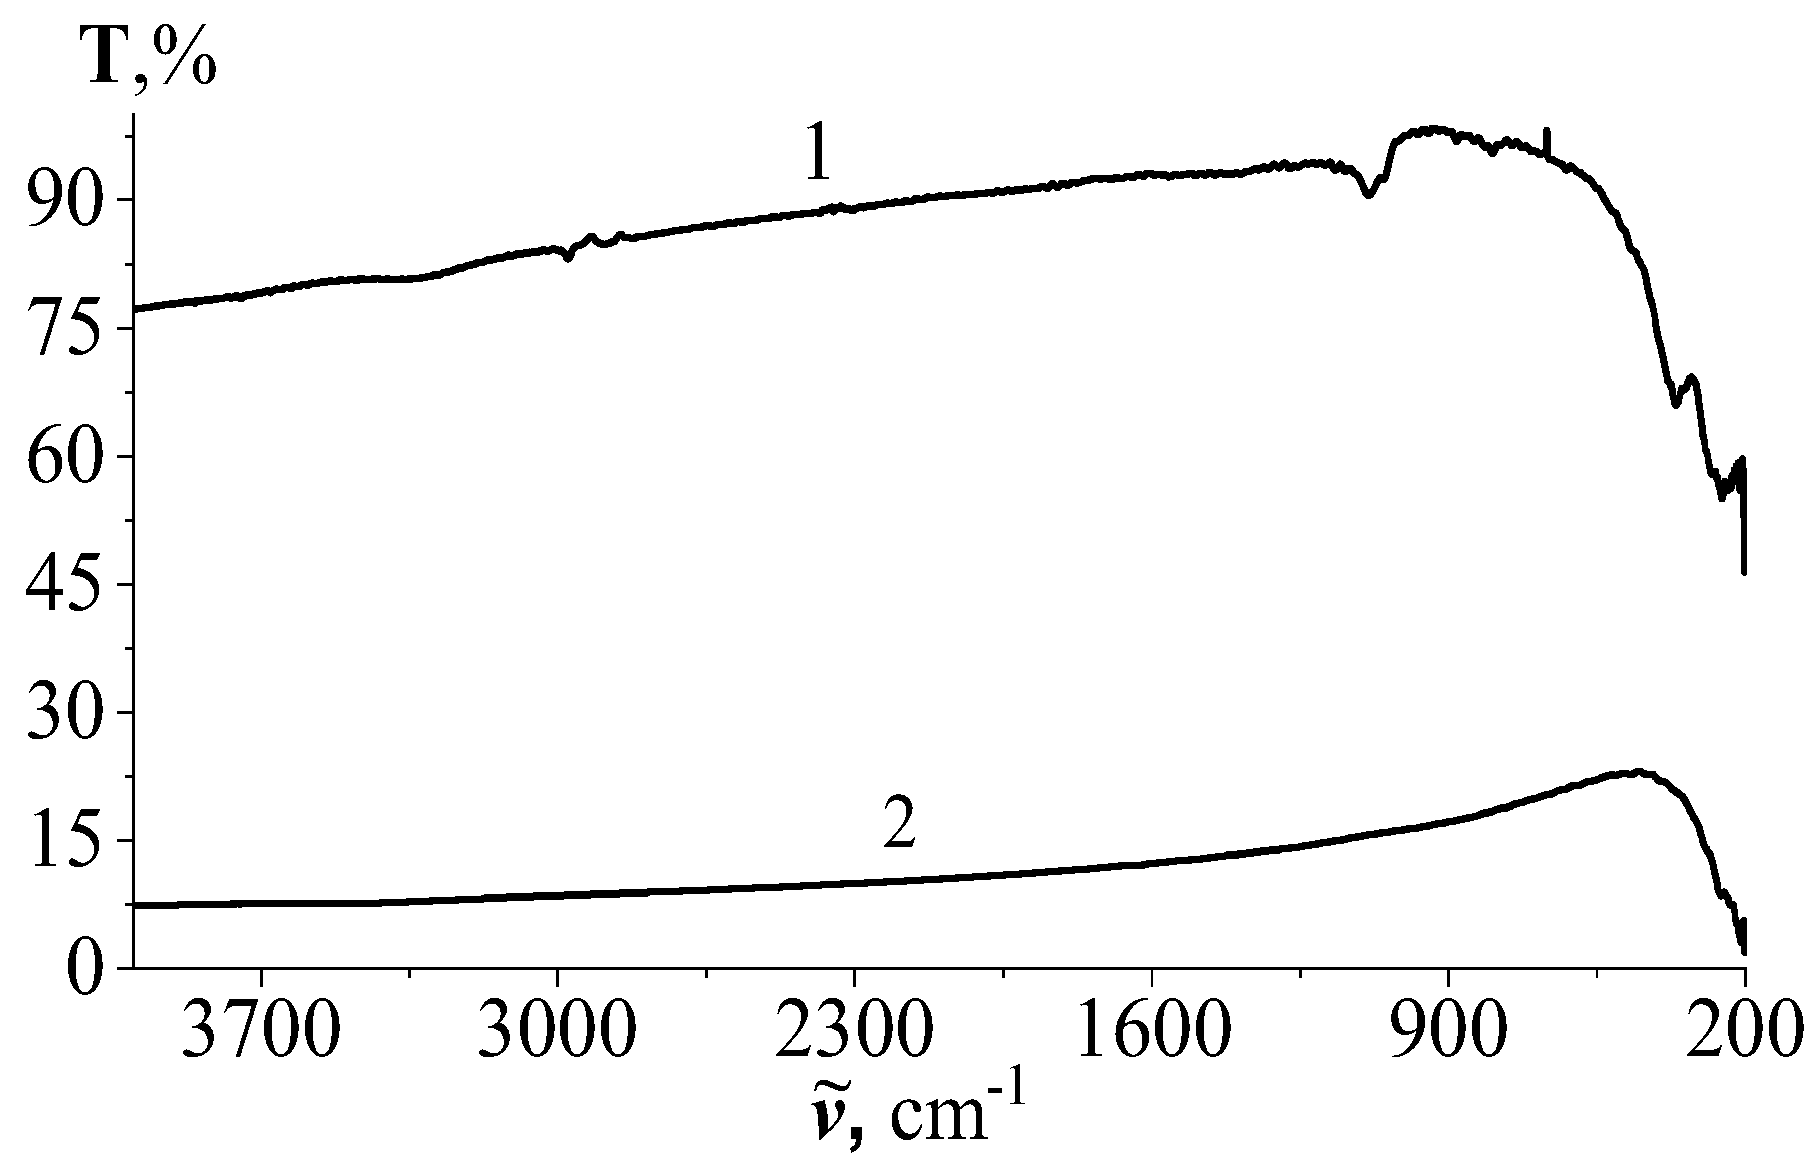
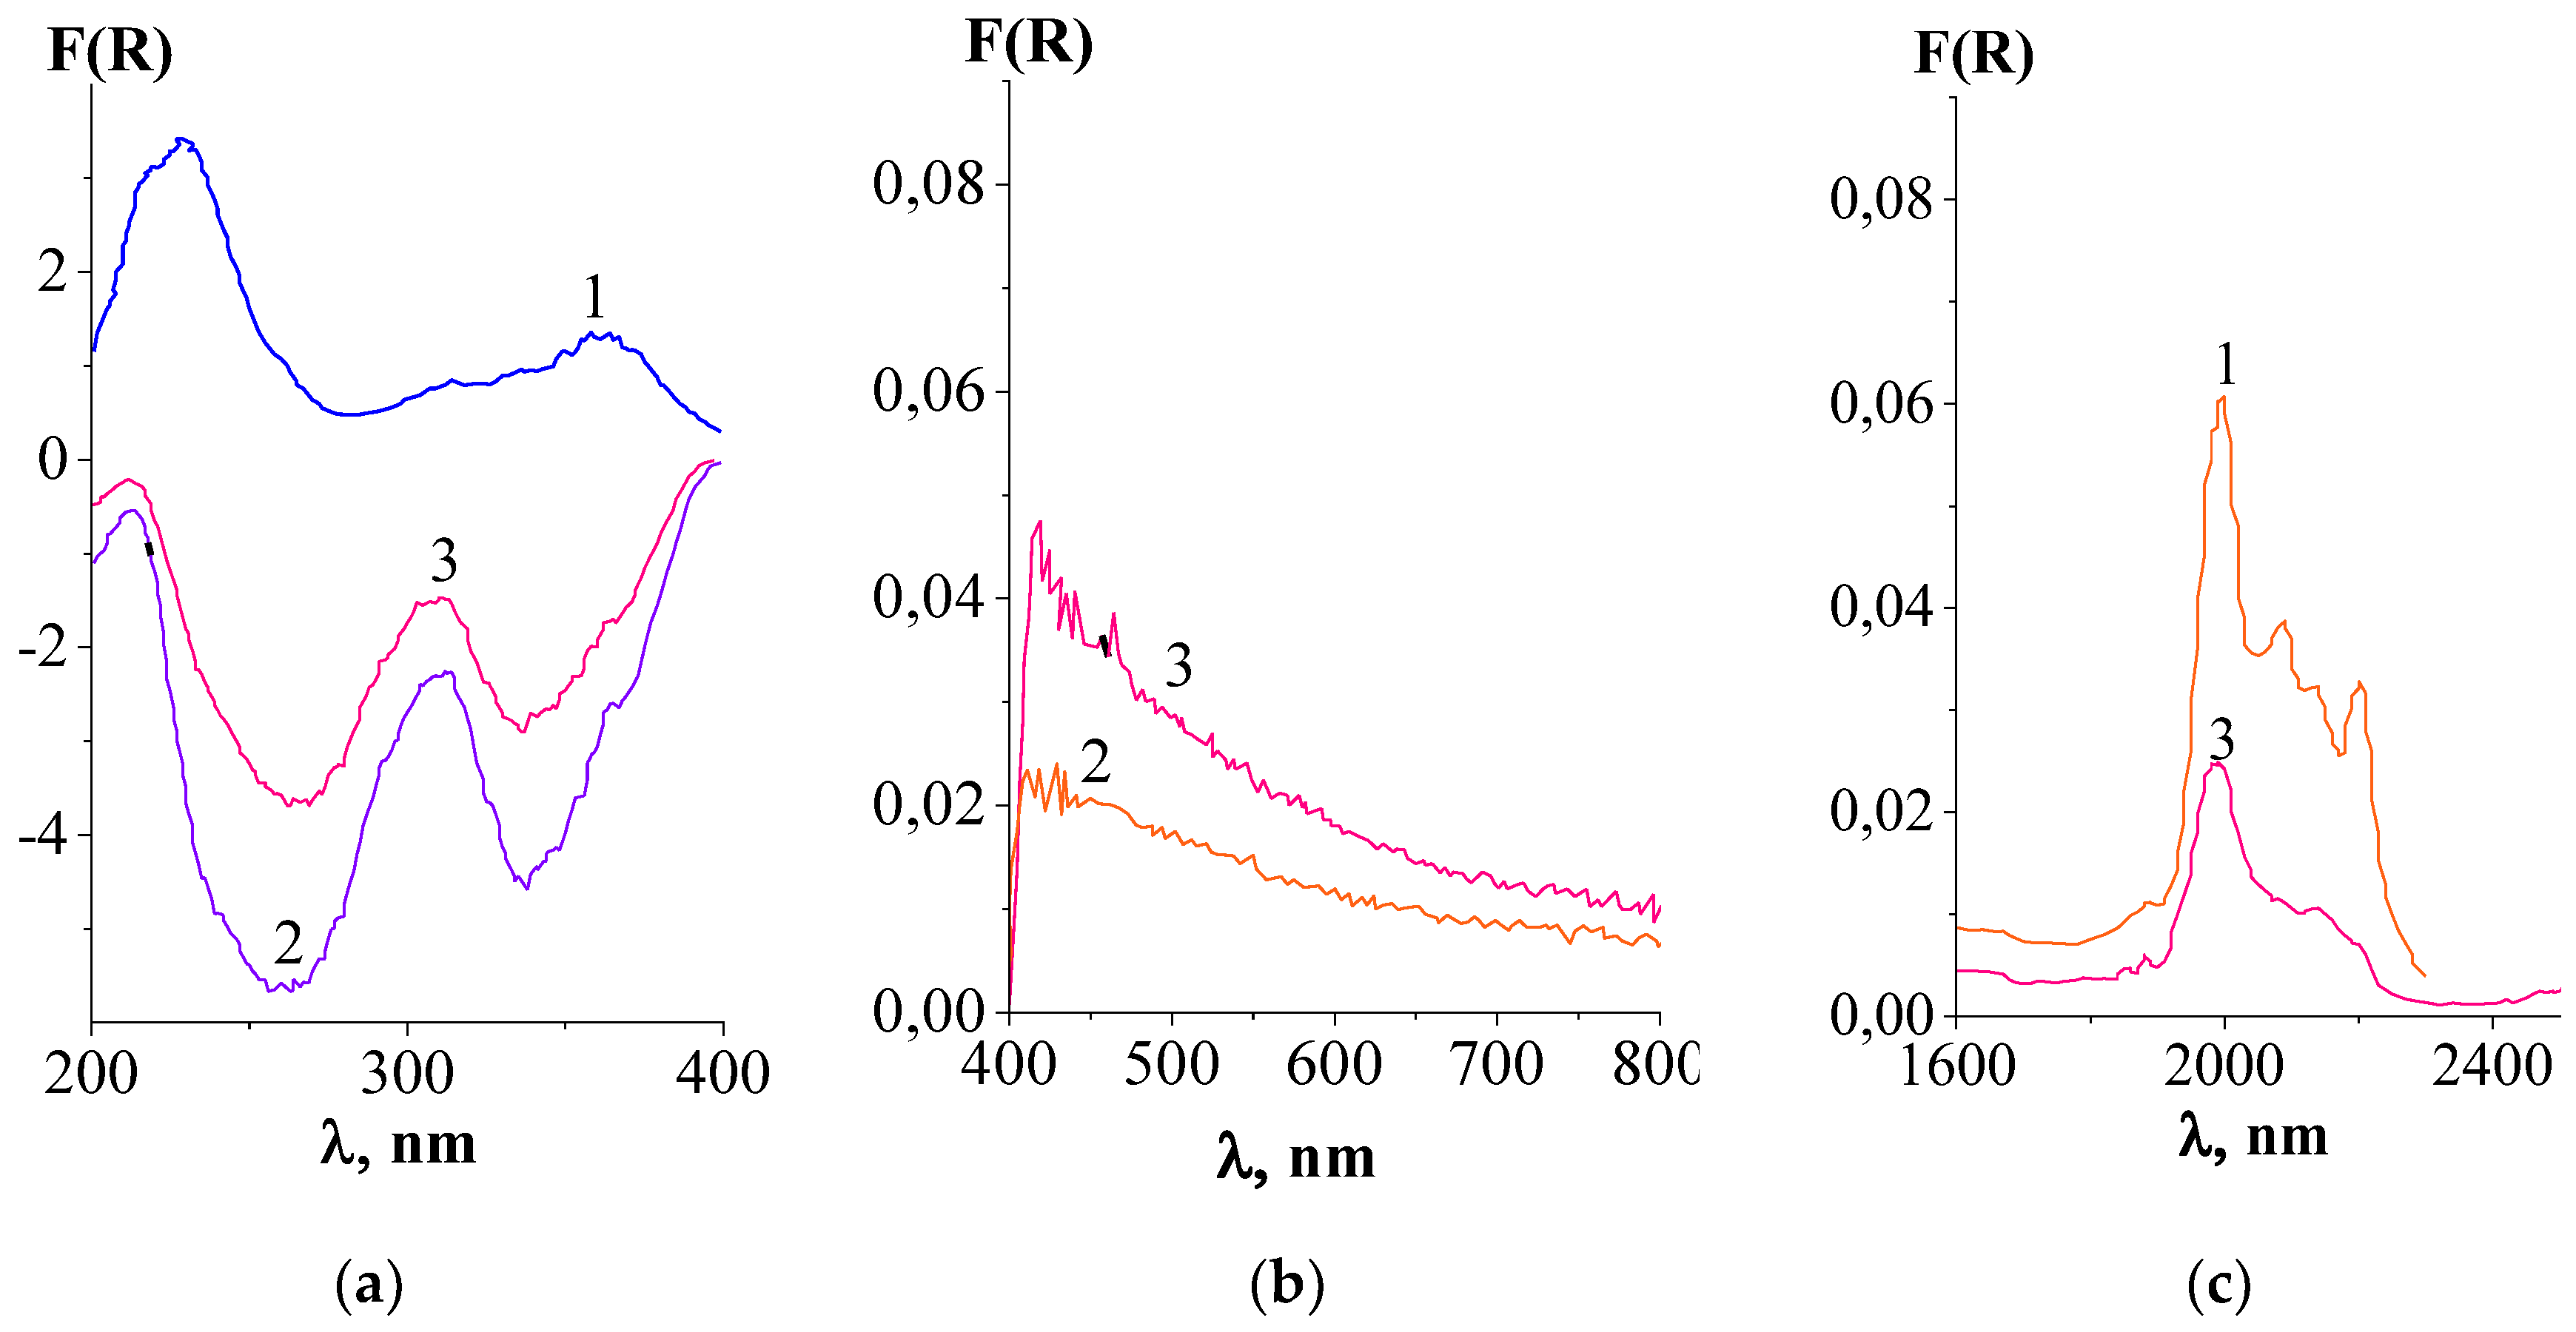
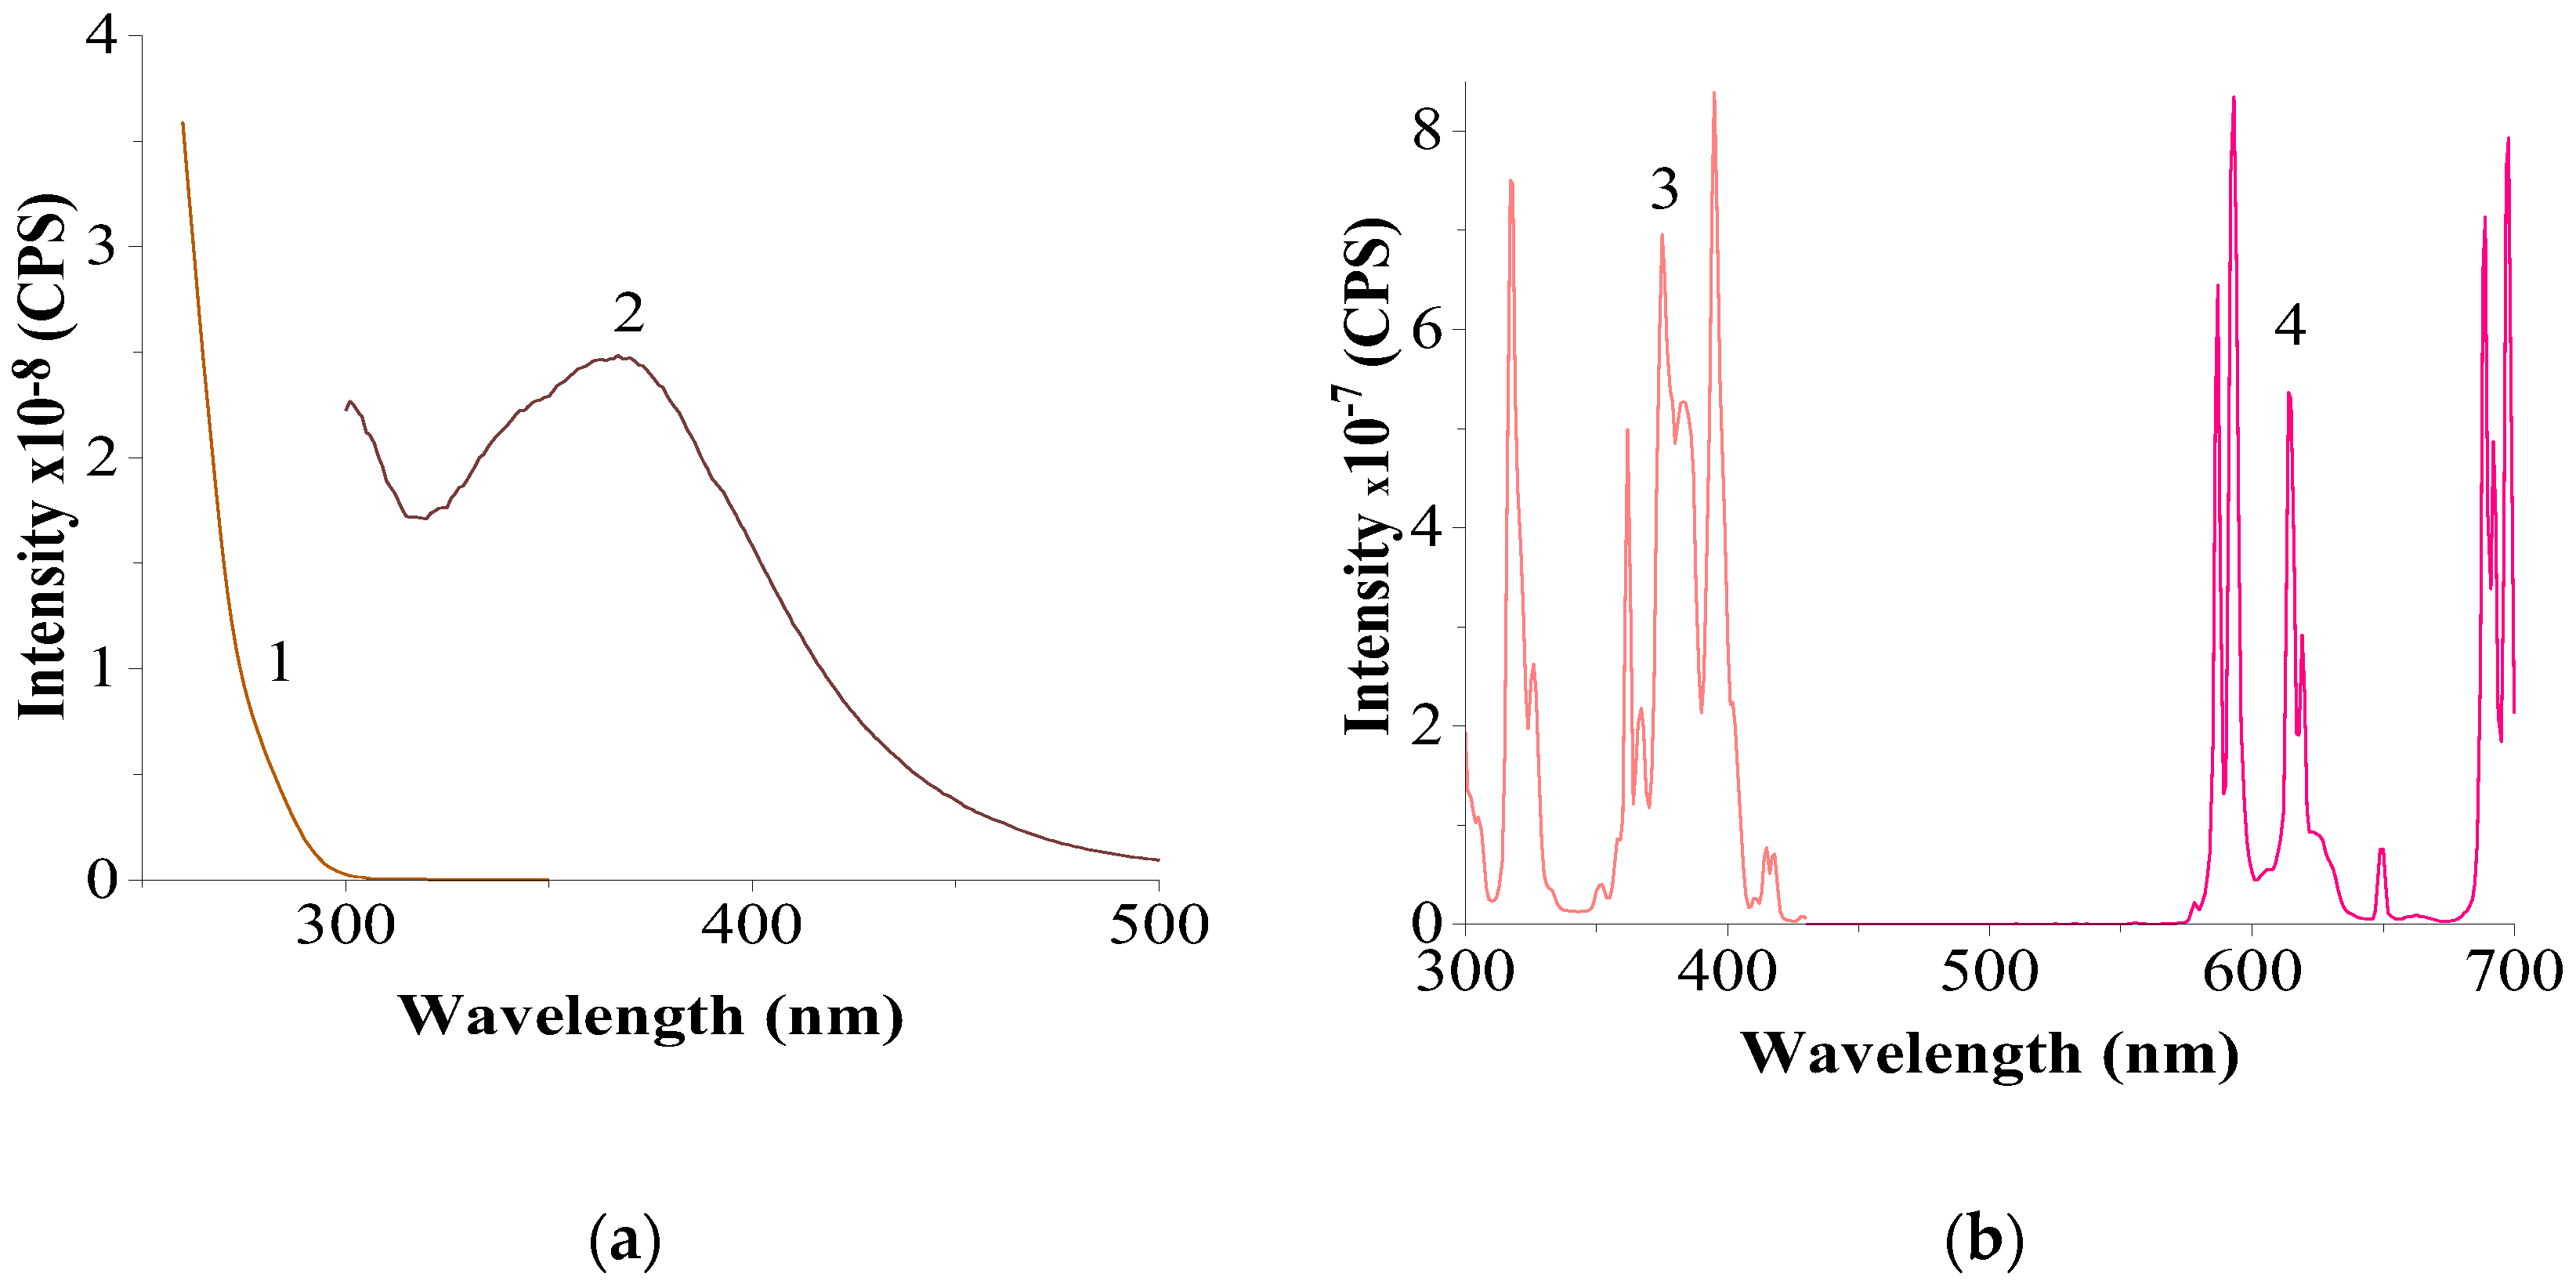
| no pos. |
Wavelength, nm | Intensity | ||
|---|---|---|---|---|
| λexc. | λmax. | Imax.×10–6, CPS | Iint.×10–7, rel. u. | |
| 1 | 261 | 431 | 4.53 | 14.30 |
| 2 | 300 | 432 | 1.66 | 6.19 |
| 3 | 310 | 432 | 1.55 | 5.44 |
| 4 | 317 | 430 | 2.20 | 7.85 |
| 5 | 330 | 429 | 7.31 | 22.79 |
| 6 | 340 | 430 | 11.7 | 34.91 |
| 7 | 350 | 430 | 11.1 | 32.74 |
| 8 | 362 | 430 | 8.95 | 26.98 |
| 9 | 375 | 430 | 9.04 | 26.42 |
| 10 | 387 | 430 | 5.57 | 16.20 |
| 11 | 397 | 430 | 3.87 | 10.48 |
| no pos. |
Sample | Eu2+ | Eu3+ | ||
|---|---|---|---|---|---|
| λmax, nm | τ, µs | λmax, nm | τ, µs | ||
| 1 | CeF3+EuF3(1:1) + NaCl–KCl (1:9) | 428* | 1.07 | 591 | 1301 |
| 2 | CeF3+EuF3(1:2) + NaCl–KCl (2:8) | 424* | 1.00 | 591 | 699** |
| 3 | CeF3+EuF3(2:1) + NaCl–KCl (2:8) | 428* | 1.02 | 591 | 975** |
Disclaimer/Publisher’s Note: The statements, opinions and data contained in all publications are solely those of the individual author(s) and contributor(s) and not of MDPI and/or the editor(s). MDPI and/or the editor(s) disclaim responsibility for any injury to people or property resulting from any ideas, methods, instructions or products referred to in the content. |
© 2024 by the authors. Licensee MDPI, Basel, Switzerland. This article is an open access article distributed under the terms and conditions of the Creative Commons Attribution (CC BY) license (http://creativecommons.org/licenses/by/4.0/).


