1. Introduction
A fresh perspective that has emerged in recent years suggests that improved materials will be crucial to the 21st century’s process of fundamental transformation. Advanced materials clearly drive innovation because approx. 70% of all technical innovations can be directly or indirectly attributed to progress in the field of material engineering [
1]. Therefore, their development will determine the future competitiveness of the European economy on the global market. Such a view was reflected in the Materials 2030 Manifesto, announced on 7 July 2022 [
2]. Satisfying the growing demand for new materials and products requires a double-green and digital transformation. The success of the transformation is to be ensured through the application of advanced material solutions in combination with pro-ecological activities, including re-use, re-purposing, dismantling, recycling and refining, as well as modern digital technologies, such as tracking & tracing as well as digital twins [
3,
4,
5]. In order to implement the assumptions of the Material Manifesto 2030, a pan-European Advanced Materials Initiative 2030 (AMI2030) was established [
6]. The result of the work of AMI2030 is the Materials 2030 Roadmap [
7], which juxtaposes advanced materials, including nanomaterials [
8,
9] and challenging, cross-cutting research and development technologies, with their significance for nine Materials Innovation Markets (MIMs). According to the concept adopted, the main opportunity to accelerate all aspects of material design and development is digitisation, and the key to success is to have reliable and easy access to the data. It is also necessary to increase the scalability of new materials, consisting of facilitating their spread to other sales markets and applications, through processes of optimisation, decarbonisation, mass customisation, zero defect production, improved multi-material manufacturing and new manufacturing technologies. Among the MIMs, apart from healthcare, construction, new energies, transport, home & personal care, packing, agriculture, and electronics, there are also textiles, to which the given article is devoted.
Modern textiles are materials made of high-tech fibres and fabrics produced using advanced technology and machines [
10]. Such a high-tech fibre is synthetic, functional and ecological [
11]. The expectations of demanding product users mean that both natural fibres (e.g., cotton, wool, hemp) [
12,
13] and synthetic fibres (e.g., polyamide, viscose) [
14] are not suitable for advanced applications. Functional fibres can have conductive [
15] or antibacterial [
16] properties. Avant-garde smart fibres allow for colour tuning [
17], harvesting [
18] and storing energy [
19] and heat [
20], and can also have shape memory [
21]. Smart textiles sense and react to environmental conditions or external stimuli (e.g., mechanical, thermal, magnetic, chemical, electrical) through the presence of sensors, actuators or controlling units [
22]. Smart textiles have applications in various sectors with promising expectations, such as cloth production, artificial intelligence, biotechnology, information, chaos theory and randomisations. For this reason, they are used in life clothing, medicine, health, ecology, environmental protection, military and aviation areas [
23].
Non-wovens in ISO standard 9092 [
24] and CEN EN 29092 [
25] are defined as an engineered fibrous assembly, primarily planar, which has been given a designed level of structural integrity by physical and/or chemical means, excluding weaving, knitting or paper making. They key functions include as following [
26]: absorbency, bacterial barrier, cushioning, filtering, flame retardancy, liquid repellence, resilience, softness, sterility, strength, stretch, and washability. The textile industry covers many areas related to processing textile raw materials. The last decade has brought an upward trend in the production of spunlace non-woven fabrics, which are ultimately soaked with surfactants in order to produce the final products used, such as washing and cleaning. The non-wovens are formed from mixtures of various fibres. These fibres, on an industrial scale, can be produced from natural polymers, synthetic polymers and inorganic materials. However, today, man-made materials completely dominate the production of non-wovens, accounting for as much as 99% of total production [
27] and marginalising the importance of natural non-wovens. Polypropylene (PP) is most commonly used to produce non-wovens, ahead of polyester, regenerated cellulose, acrylic, polyamide, cotton and other speciality fibres [
28].
The production of non-woven fabrics consists of the appropriate mixing of fibres and their bonding. Fibre bonding can take place, for example, in the water-needling process. The process that binds the fibres is carding, which is to form a continuous and homogeneous stream of fibre mixture called fleece to separate the bundles into individual fibres and agitate them intensively. Currently, the desired trend is to reduce the amount of raw material introduced while ensuring the required mechanical strength of the non-woven fabric. Manufacturers of carding machines are introducing new solutions in construction quite dynamically, primarily to increase the efficiency of the carding process and the quality of the non-wovens produced in terms of the homogeneity of fibre mixing and the strength of the non-wovens produced from them [
28]. The constructions of modern carding machines are very complex and controlling them requires specialist knowledge and experienced operators who are responsible for selecting the most advantageous process parameters adapted to the processed raw material. It is important for the indirect recipient to provide him with a suitable non-woven fabric that meets the requirements for further processing [
28,
29,
30].
In industrial settings, there are two main levels of quality control for fibre blending. The first level of quality control utilizes various image analysis tools and vision systems to detect inclusions (impurities) as well as the accumulation and thinning of fibres that occur during the non-woven fabrication process. The commonly used second level of quality control for fibre mixing occurs after the main non-woven fabric production process. Typical tests under industrial conditions are tests of the mechanical and physicochemical properties of non-woven samples, taken with the statistical precision indicated or according to the guidelines of the relevant industry’s quality standards. However, the results of quality control at the two levels indicated cannot be used as a basis for inferring the correctness of the mixing of the fibres in terms of their meeting the expected strength properties, which is a source of further scientific investigation [
31].
The state-of-the-art indicates that analyses of the carding process carried out in the last decade are mainly concerned with identifying and describing the basic processes that accompany the formation of the so-called fleece, composed of a mixture of different fibres. The most popular approach in the area is the classic take on the carding process, based on a single-cylinder model with a single fibre, collection and return system. A simple model of a single-drum carding machine, consisting of a main cylinder and a cooperating worker-stripper and doffer system, was described in [
32], and the principles of working, stripping and interaction between card rollers were determined. By contrast Albrecht. W et al. [
33] characterised the roller carding theory, giving the basic mathematical relationships for describing fibre flow in a model of a similar type of carding machine. Basic configurations of carding machines and different arrangements for randomising the web are presented in [
33,
34]. In a series of articles, Niedziela et al. [
28,
29,
30] analysed the operation of two structurally different, double-drum carding machines. Papers [
28] and [
29] present a model of the carding process on a two-drum carding machine with one intermediate drum located between the main cylinders. Niedziela et al. [
30] presented the results of the computer modelling of the operation of a two-drum carding machine in which, between the main cylinders, a system of four intermediate drums is located. For both kinds of carding machines, the dynamics of the fibre stream generation were examined, considering the uniformity of the created fleece’s density. The mass balance of the fibres is considered when describing the carding dynamics. As part of the work, numerical simulations regarding the buildup of fibre flow over time, in connection to the fibre collecting coefficient and the number of worker-stripper systems, were also run and discussed. Moreover, the paper [
30] developed a method for determining the fibre transfer coefficient, which enabled the derivation of relationships characterising the average lag time of fibres resulting from the circulation of fibres in the carding process.
The resulting carded non-woven fabrics were subjected to physicochemical and mechanical properties that are important for their further processing, such as weight, moisture content and strength. Santos. A. et al. [
35] and Ivars. L. et al. [
36], in the given aspect, studies of non-woven fabrics with added carbon fibres oriented towards determining their tensile and tear strength, taking into account the orientation and bond strength of the fibres, were conducted. Another aspect of non-woven testing was the study of the influence of the various setting parameters of the carding process on its final strength, as constituted by the water-needling process. In contrast, in the work by Roy et al. [
37], an attempt was made to change the fibre orientation by varying the carding parameters, such as feeder speed, cylinder speed and receiver speed, while keeping the surface density of the fabrics the same. In addition, attention was devoted to the filtration process and the study of its influence on the needle process in the context of shaping the strength of the non-woven fabric. Finally, the optimum technological settings for the process analysed were developed, ensuring that non-woven properties would be acceptable to the end customer. Research into determining the relationship between the final strength of a non-woven fabric and the way it is manufactured is the subject of an article published by Hu.S. et al. [
38]. It included an image analysis of the microstructure of the composite, composed of polyester and viscose fibres, to determine the effect of the carding process on the final strength of the material obtained after the drying process, i.e., the removal of excess water from the material.
Analysis of microscopic images of the non-woven fabric produced, mostly made using scanning electron microscopy (SEM), was used to assess the degree of the inter-correlation of its various parameters, such as pore size and orientation, machina and cross direction tensile strength, or the quality of the non-woven fabric, determined by the type of weaves and the number of inclusions, etc. For this purpose, it is possible to use artificial neural networks, as proposed by Hou.J. et al. in the work [
39], to effectively reconstruct the spatial structure of the fabricated non-woven fabric. A similar issue is also addressed in article [
40], in which Chen.Y. et al. propose to process microscopic images of high and low frequency in their multi-focus fusion process in order to determine the diameter of the fibres, as well as the orientation and porosity of the non-woven fabric. Similar problems were also raised in the manuscript developed by Kim.D. [
41]. Analysis of microscopic images of non-wovens can also be used to determine deformation and changes in fibre orientation. Stolyarov.O. and Ershov.S. [
42] determined the mechanical properties of the non-woven structure at three successive stages of deformation. In addition, the relationships between the change in fibre orientation, the angle of orientation, and the degree of material deformation were determined.
In light of the selected research areas outlined above, the article responds to the market’s reported expectations of absorbent wipes manufacturers based on non-woven polyester and viscose fabrics. The global wet wipes market is very broad and includes the following applications [
27]: personal care and hygiene, household care, medical and healthcare aa well as industrial ones. The research results can, therefore, directly transfer to applications in industrial enterprises, which, while fighting for a competitive position in a mutable sector, are vitally interested in improving production efficiency while maintaining a high quality of the final product. It is important to note that the porous structure of non-wovens is influenced by the structural design of the carding drum systems, which was proven as a result of a comparative analysis of two alternative modern carding machines. The structure of the resulting non-woven fabric, including the number, size and orientation of the pores in relation to the non-woven flow direction during the manufacturing process, determines the machine and cross-direction tensile strength of the composite material obtained as a result of carding. It is evidenced by the results of the experiments performed, including tensile strength tests presented in the paper. The mechanical test results obtained and the SEM observations, along with image analysis made were used to determine the relationship between the strength of the material and the porosity of its structure. The information can directly transfer into specific technical solutions used in enterprises producing wet wipes for consumer applications, such as personal and household care, and professional applications in industry or medical areas.
4. Discussion and Conclusions
The research carried out and described in the paper was aimed at analysing the effect of free spaces, i.e., pores occurring in the spunlace non-woven fabric between bound polyester and viscose fibres on the machine direction (MD) and cross direction (CD) tensile strength of these non-wovens. In addition, the analysis of non-woven images made it possible to compare the carding process on two structurally different carding machines [
47].
As part of the research, an analysis of non-woven fabric produced from raw materials characterized in
Section 2.1 was carried out in the studies described in
Section 3.1 due to the size and distribution of pores, and the strength of this non-woven fabric was experimentally determined, taking into account two different structural construction of carding machines. The number of pores formed is comparable for non-wovens produced with carding machine No. 1 and carding machine No. 2, and their number is 13,467 for carding machine No. 1 and 13,847 for carding machine No. 2, respectively. Differences were observed in pore size, orientation and shape, presented in detail with various aspects in Tables 2÷9.
When comparing the groups resulting from the division, in terms of the pore surface area (
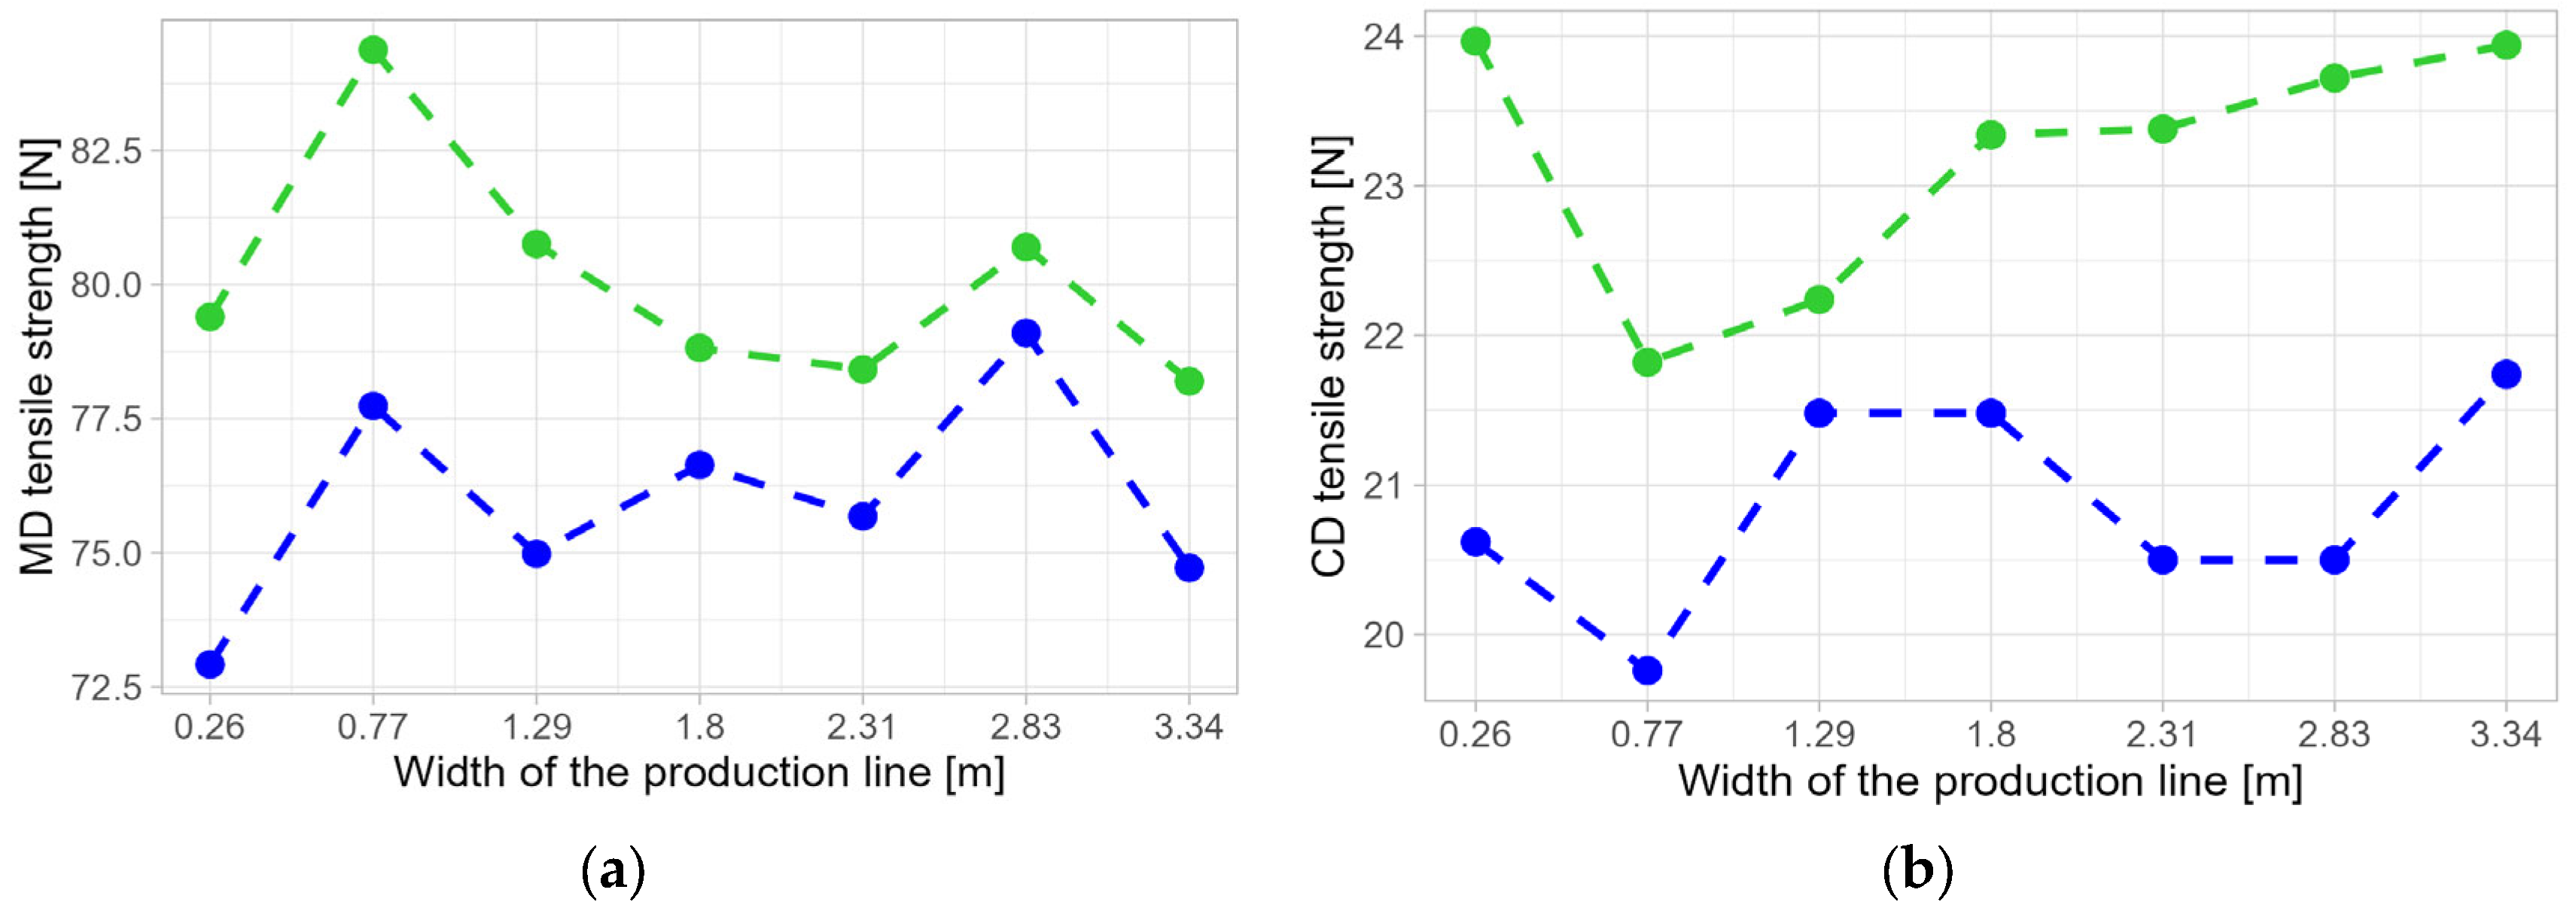
Table 5), the number of pores for groups A and B is comparable. In contrast, a significant difference in the number of smallest pores (group C) was noted, there being more of them in Test 2 than in Test 1. In addition, the average area of large areas is definitely larger in Test 2. It affects the strength of the non-woven fabrics tested, which is higher in both machine (MD) and cross directions (CD) for the non-woven fabric produced in carding machine No. 1.
The division in terms of orientation (
Table 6) shows that there are more vertical areas in Test 2, while there are significantly more horizontal areas in Test 1. Vertically oriented pores, especially those with a large surface area, affect the result of the cross-stretching test of the CD. In the non-woven fabrics tested, such areas definitely dominate in the non-woven fabric produced by carding machine No. 2, which is visible in its lower CD strength. The number of the largest areas oriented horizontally from the Ac group for carding machines No. 1 and No. 2 is identical.
Within each group resulting from classification in terms of pore surface area, most are vertical in orientation (groups Aa, Ba, Ca), while there are fewer with a diagonal orientation (Ab, Bb, Cb) and least with a horizontal orientation (Ac, Bc, Cc), which is related to the fact that most fibres are arranged according to the direction of production (
Table 7 and
Table 8). Regardless of size, vertically oriented pores are more stretched than horizontal-oriented pores, as indicated by the values of the
e and
f parameters (
Table 7 and
Table 8). The average size of the large, vertically oriented areas (Aa) is higher for the carding machine No. 2 than for the carding machine No. 1. On the other hand, for areas with horizontal orientation (Ac), this value is significantly higher for carding machine No. 1. In the case of medium and small areas, their size is comparable regardless of orientation (
Table 7 and
Table 8).
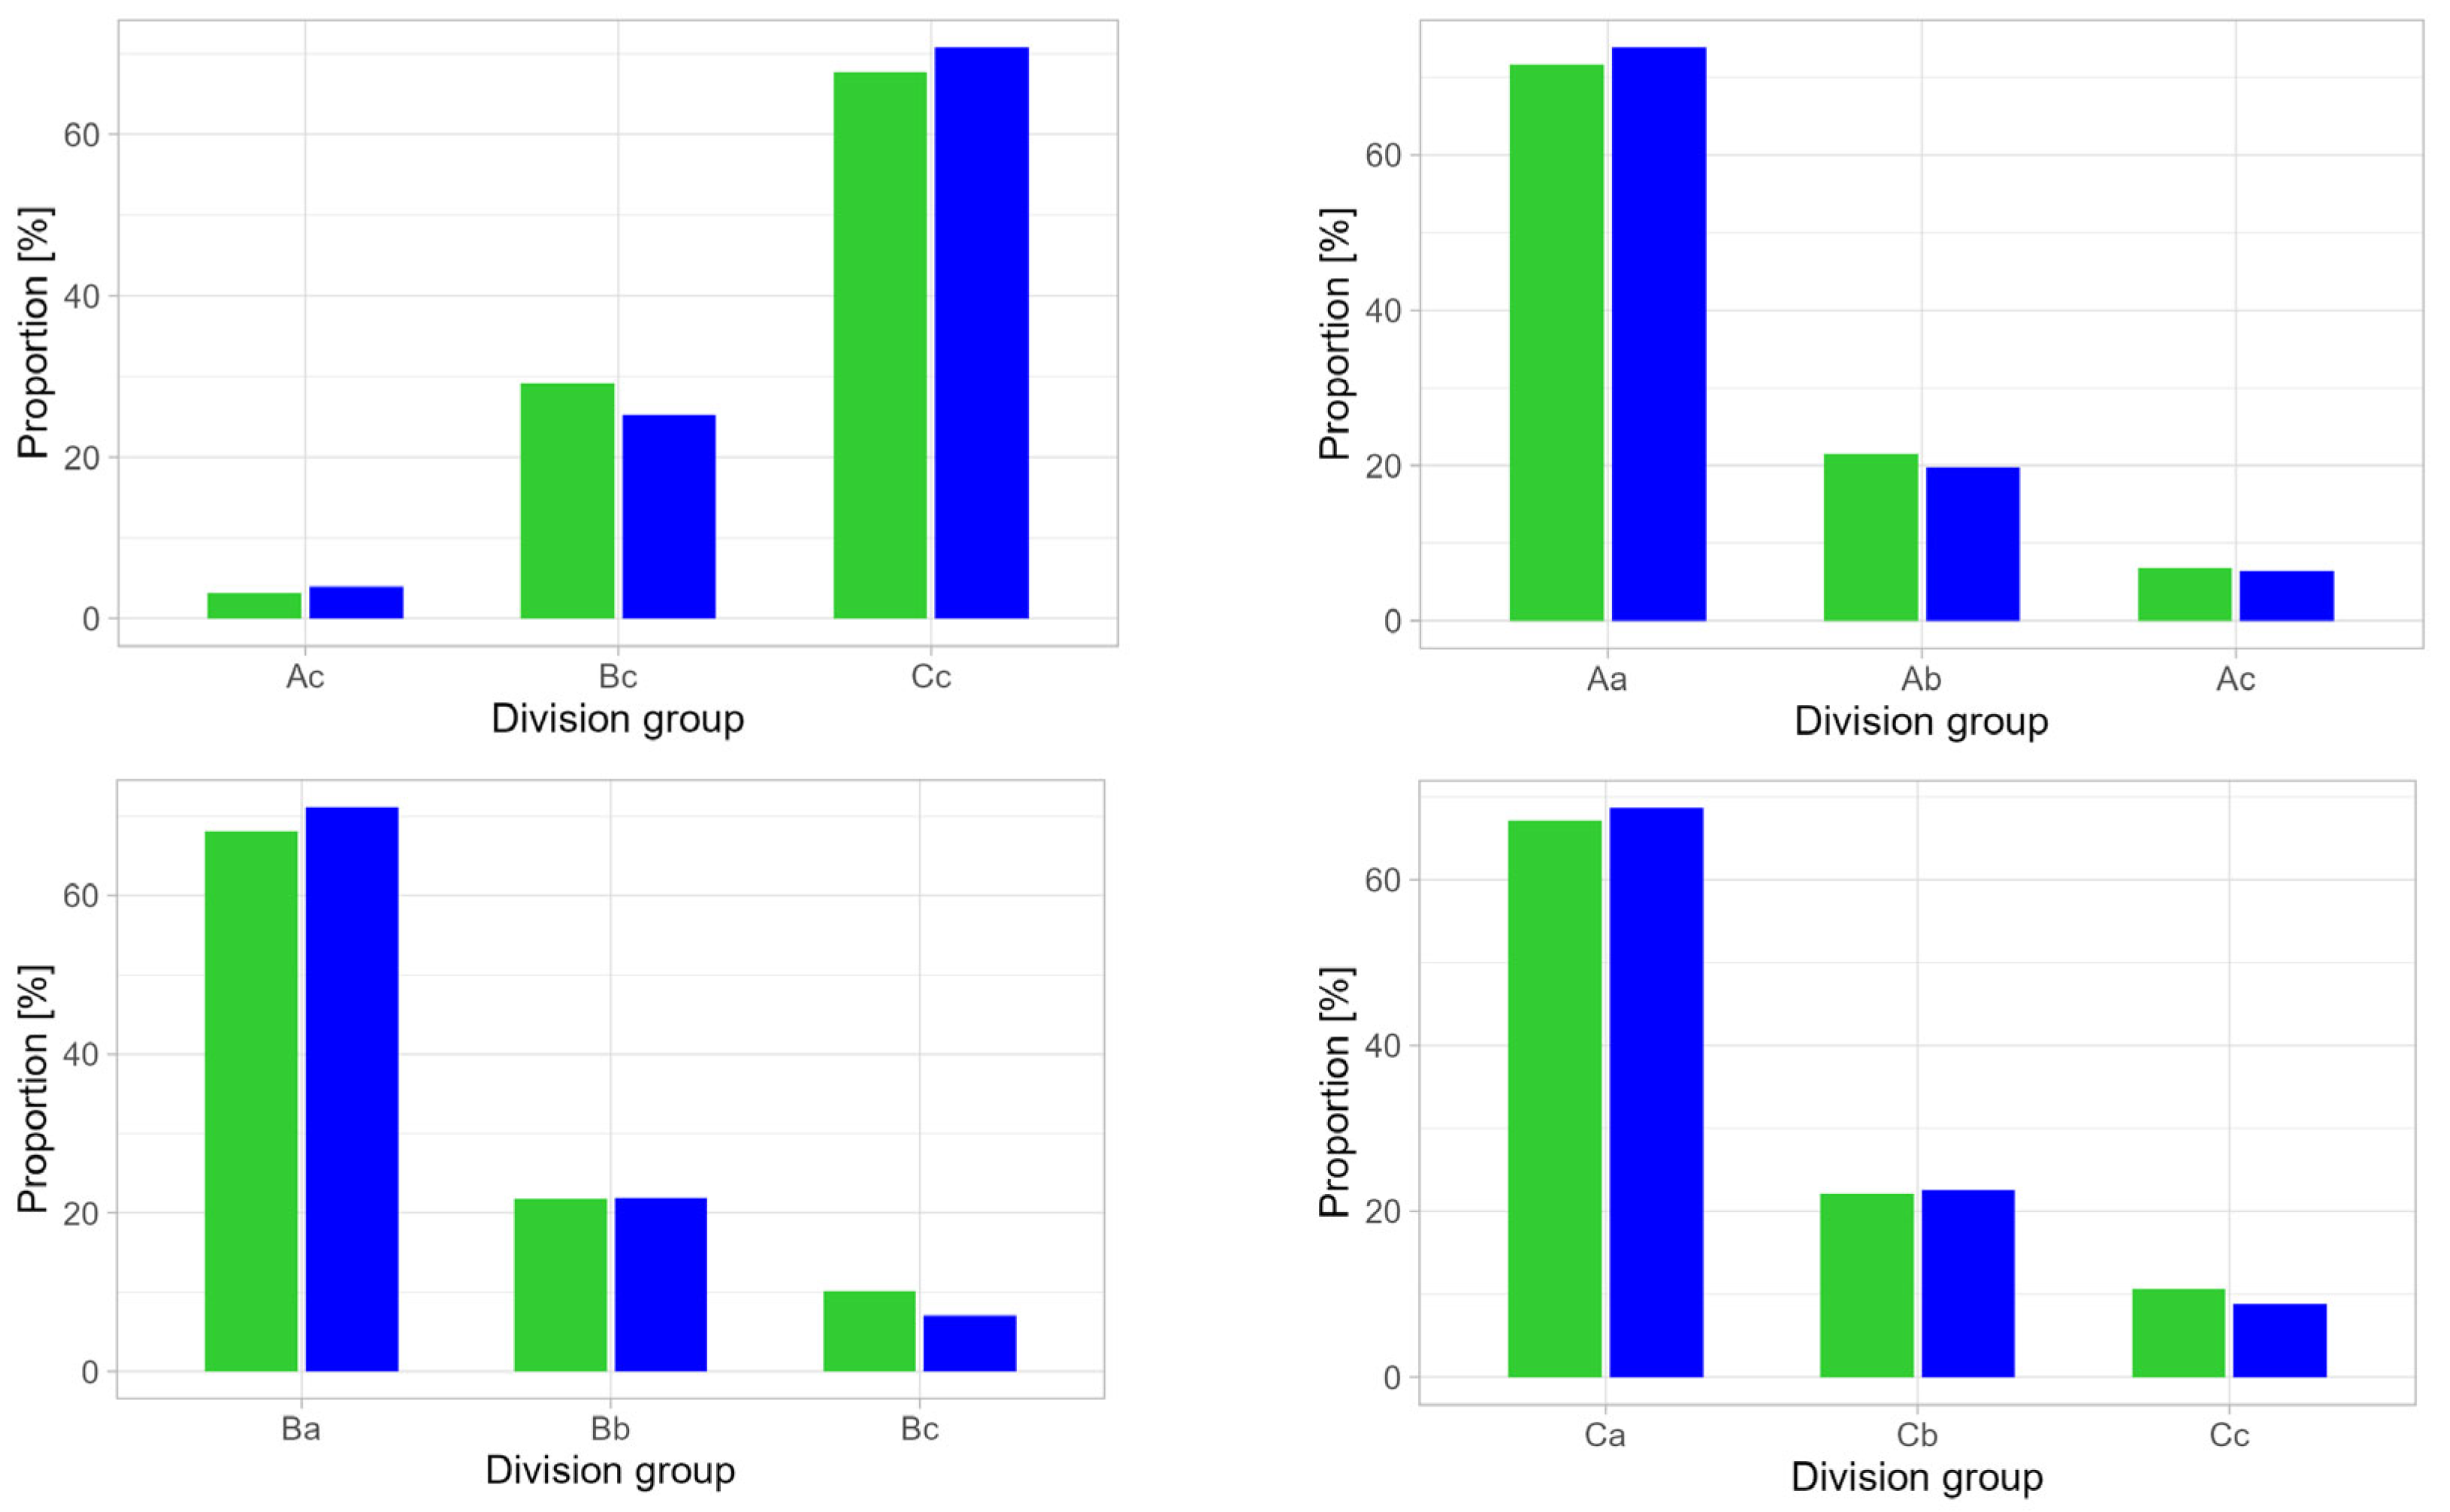
Analysing the percentage of the number of areas detected in each group against the size of the surface area and pore orientation for Tests 1 and 2 (
Table 9), it was observed that there were more obliquely oriented and less vertically oriented large areas (A) for Test 1 compared to Test 2. For the medium (B) and small (C) areas, there is apparently more horizontal and less vertical orientation in Test 1 than in Test 2. In the case of horizontal orientation (c) in Test 1, we have more areas of medium and fewer areas of small area size compared to the averaged results obtained in Test 2 (
Figure 7).
The non-woven fabrics tested show different pore characteristics. The distribution of the different pore groups analysed significantly impacts the strength of the non-wovens produced in carding Tests 1 and 2. It was observed that the number, orientation, size and shape of the non-woven fabrics produced with carding machine No. 1 influenced its better machine and cross direction tensile strength compared to the non-woven fabric obtained with carding machine No. 2. The tests carried out allowed carding machine No. 1, to be identified in which a better quality of mixing and a more favourable orientation of the polyester and viscose fibres in the manufacturing process was obtained.
The research carried out showed that the fibres mixing method based on different ways of the carding process is an important element in increasing the strength of non-woven fabric. Based on the tests carried out (Test 1 and Test 2), attention was drawn to the significance of how fibres of different lengths (polyester and viscose) are mixed, thus affecting the strength of the entire non-woven fabric (MD/CD ratio). Using carding machines of different structural construction, the relationship of the fibre mixing method to the strength of the non-woven fabric produced was investigated. It allowed attention to be drawn to a forward-looking trend in the design of modern carders. In view of the textile industry’s expectations, which are directed at increasing the efficiency of the process while at the same time increasing the strength of the non-wovens, it is possible to point to features that ensure a more complete fibre bond. Undoubtedly, they include design solutions that provide increased fibre bonding time through repeated blending. The best solution would be to build large-diameter main drum carders with many worker-stripper sub-assemblies. However, this is technically and economically unjustifiable or even impossible. As outlined above, it is important to find mutual dependencies between the method of mixing fibres, the number, size and direction of the resulting pores and the relationship between the method and the strength of the non-woven fabric. The dependencies are the basis for improving the manufacturing process in order to obtain satisfactory process conditions, ensuring the expected efficiency of non-woven fabric production with the expected strength properties at economically justified costs.
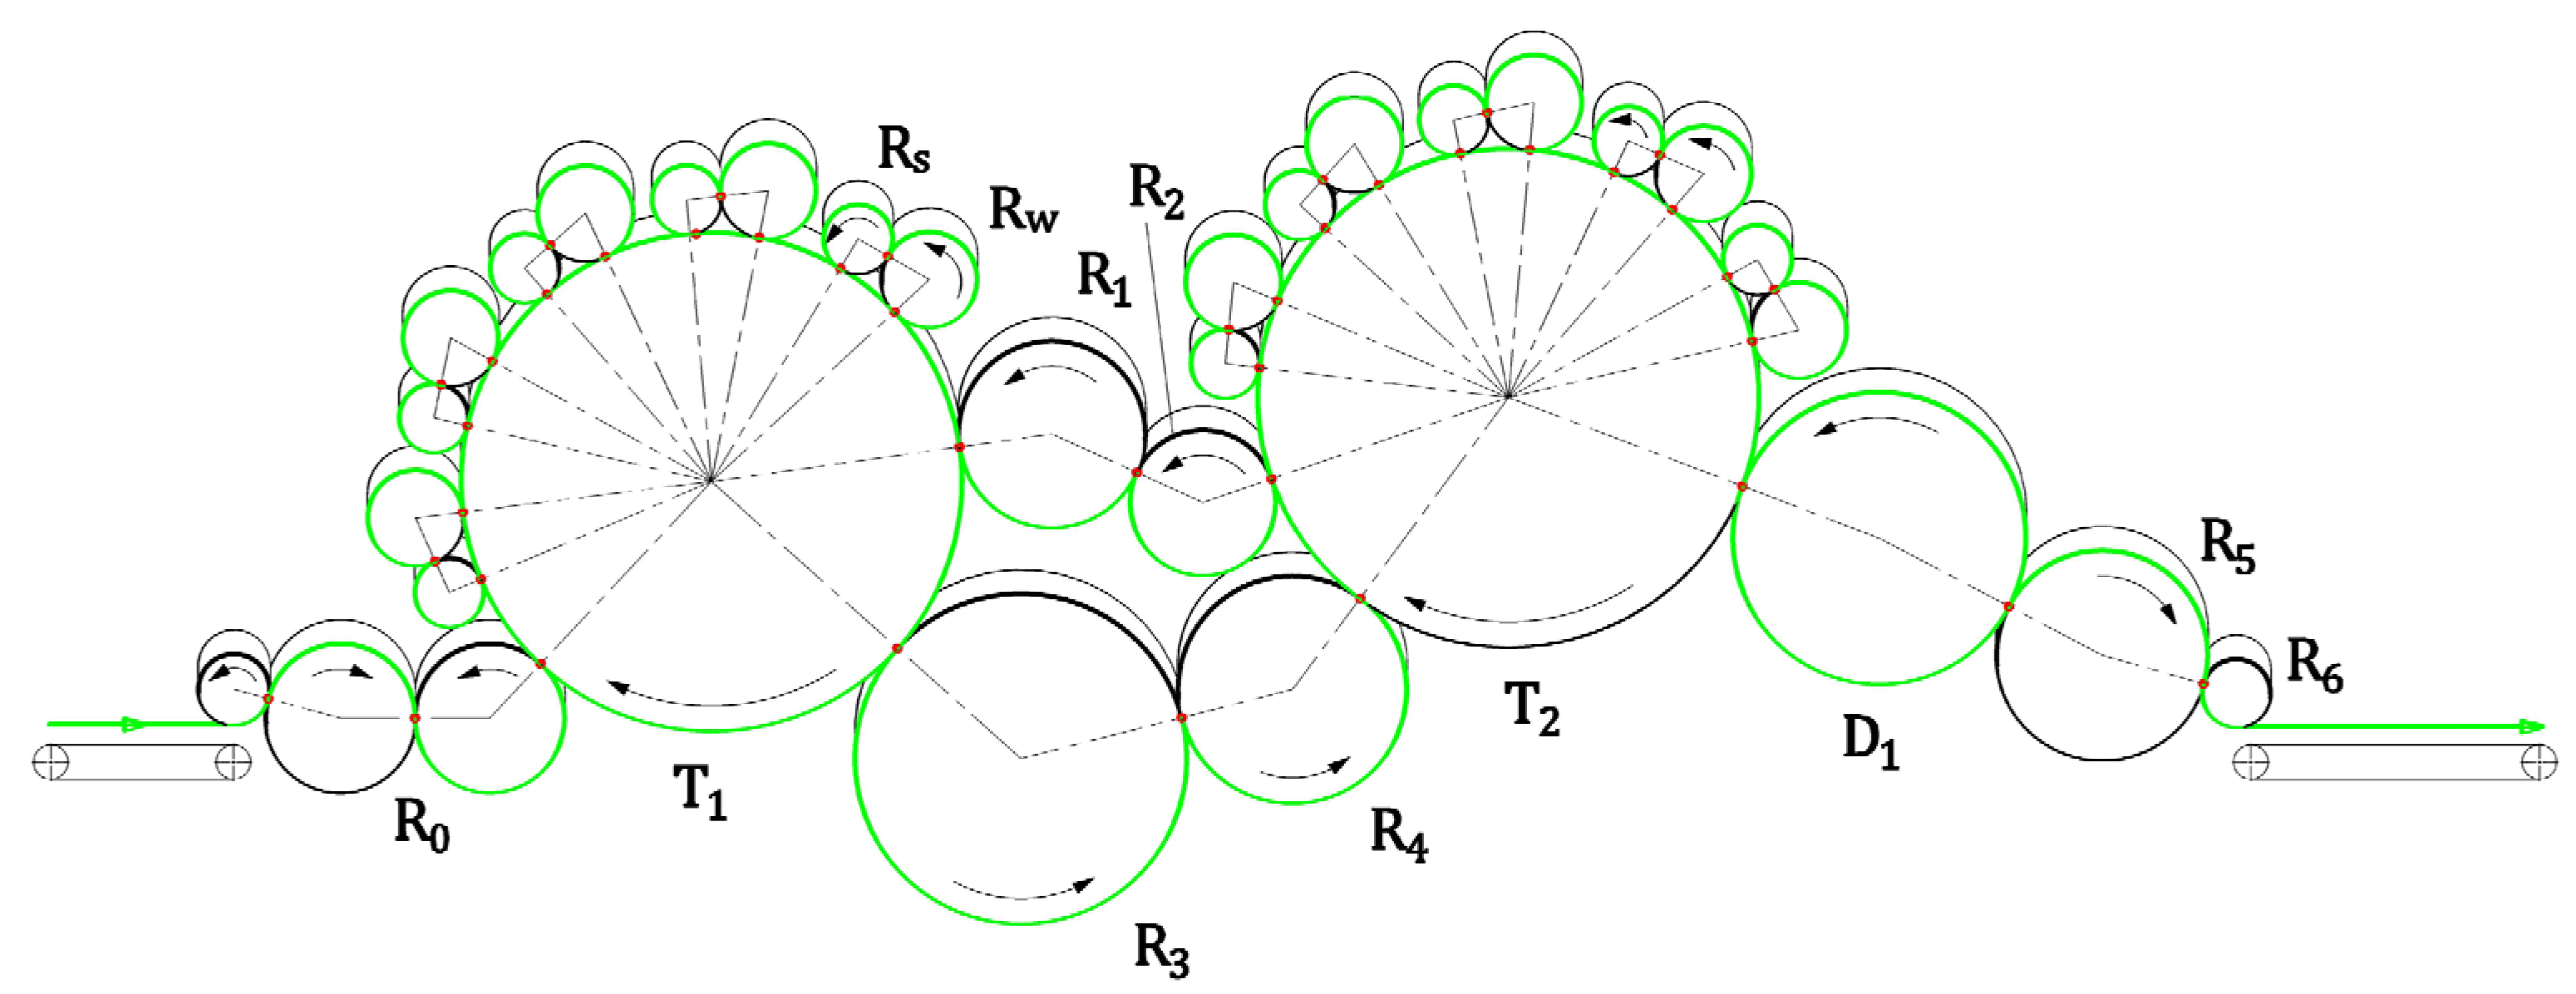
Figure 1.
Schematic image of carding machine No. 1.
Figure 1.
Schematic image of carding machine No. 1.
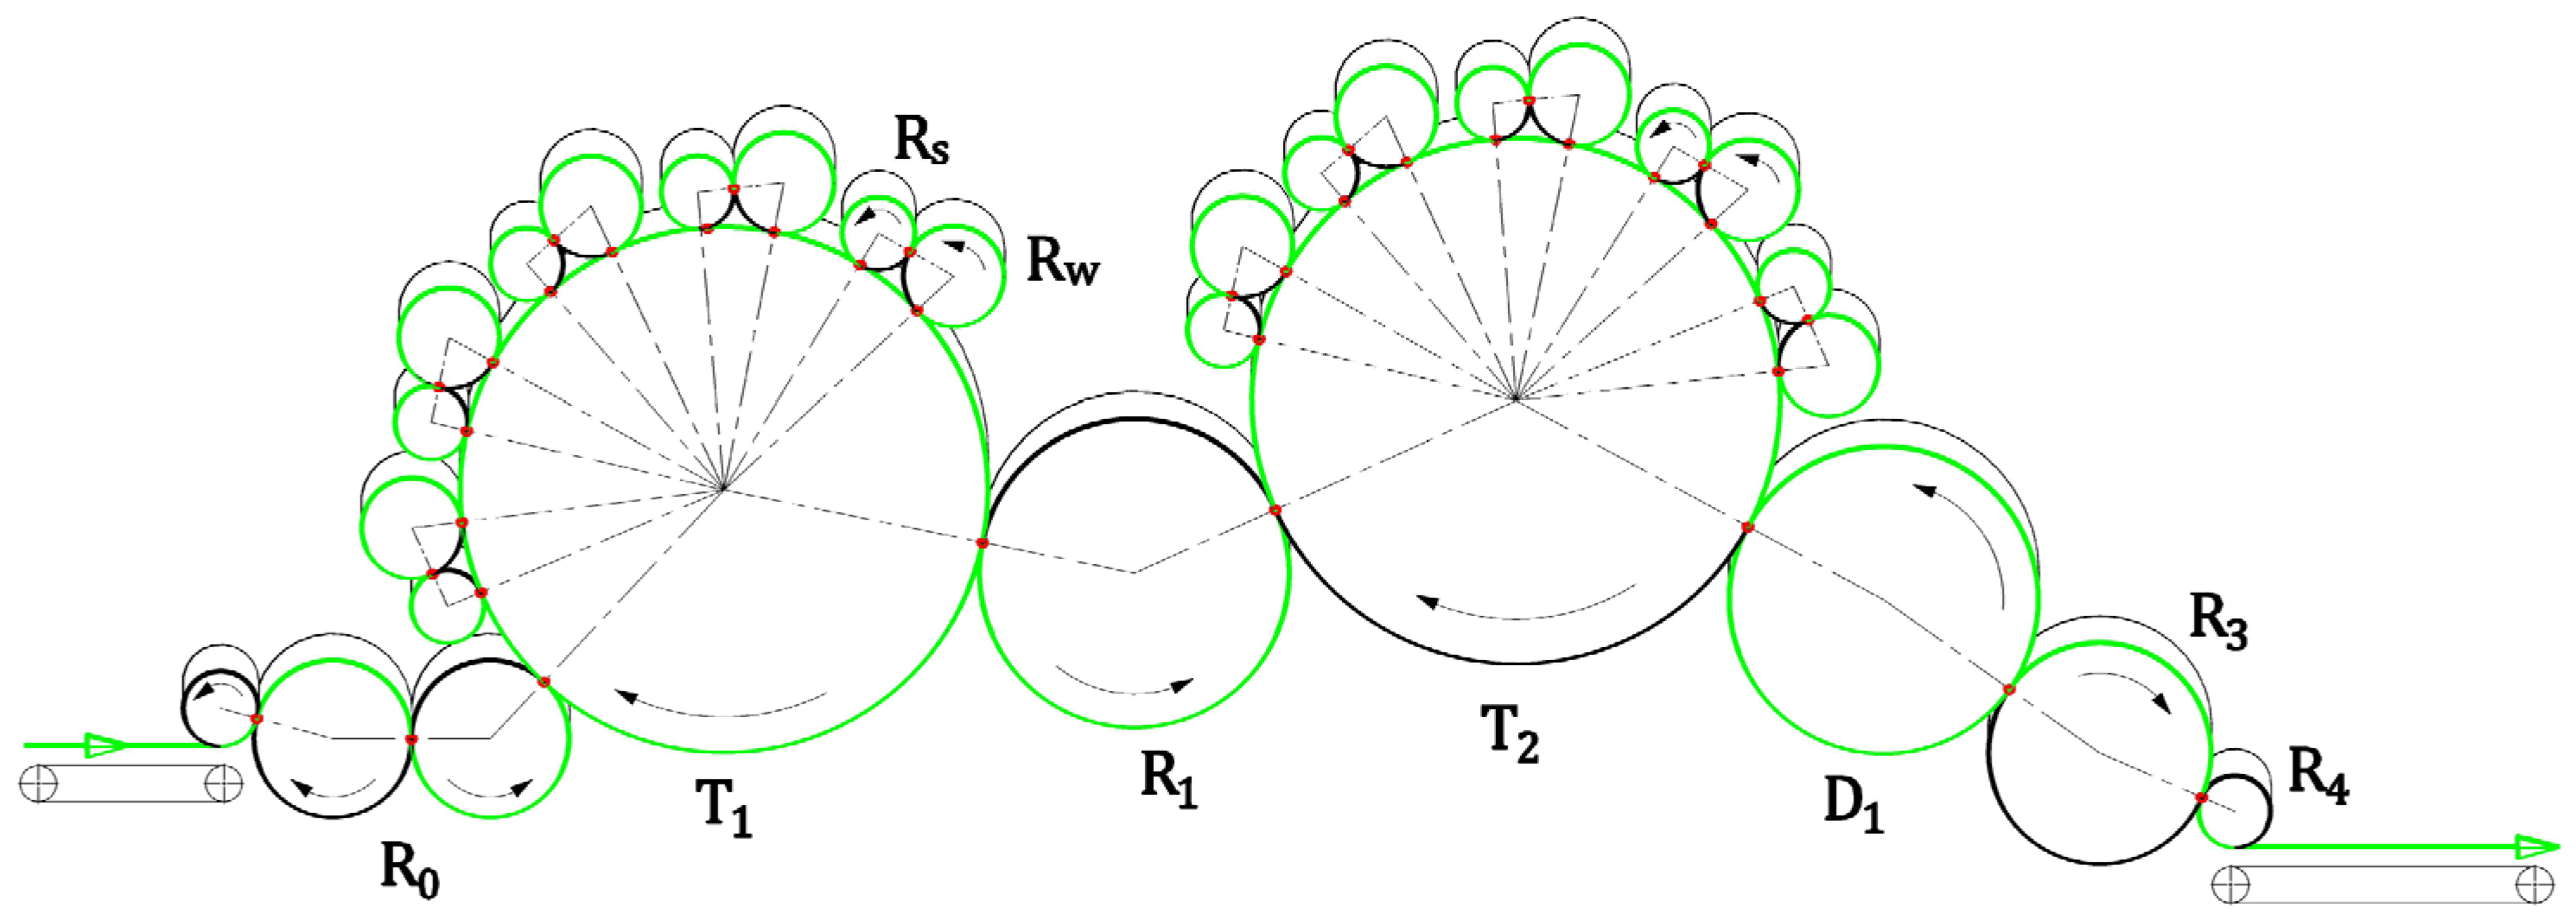
Figure 2.
Schematic image of carding machine No. 2.
Figure 2.
Schematic image of carding machine No. 2.
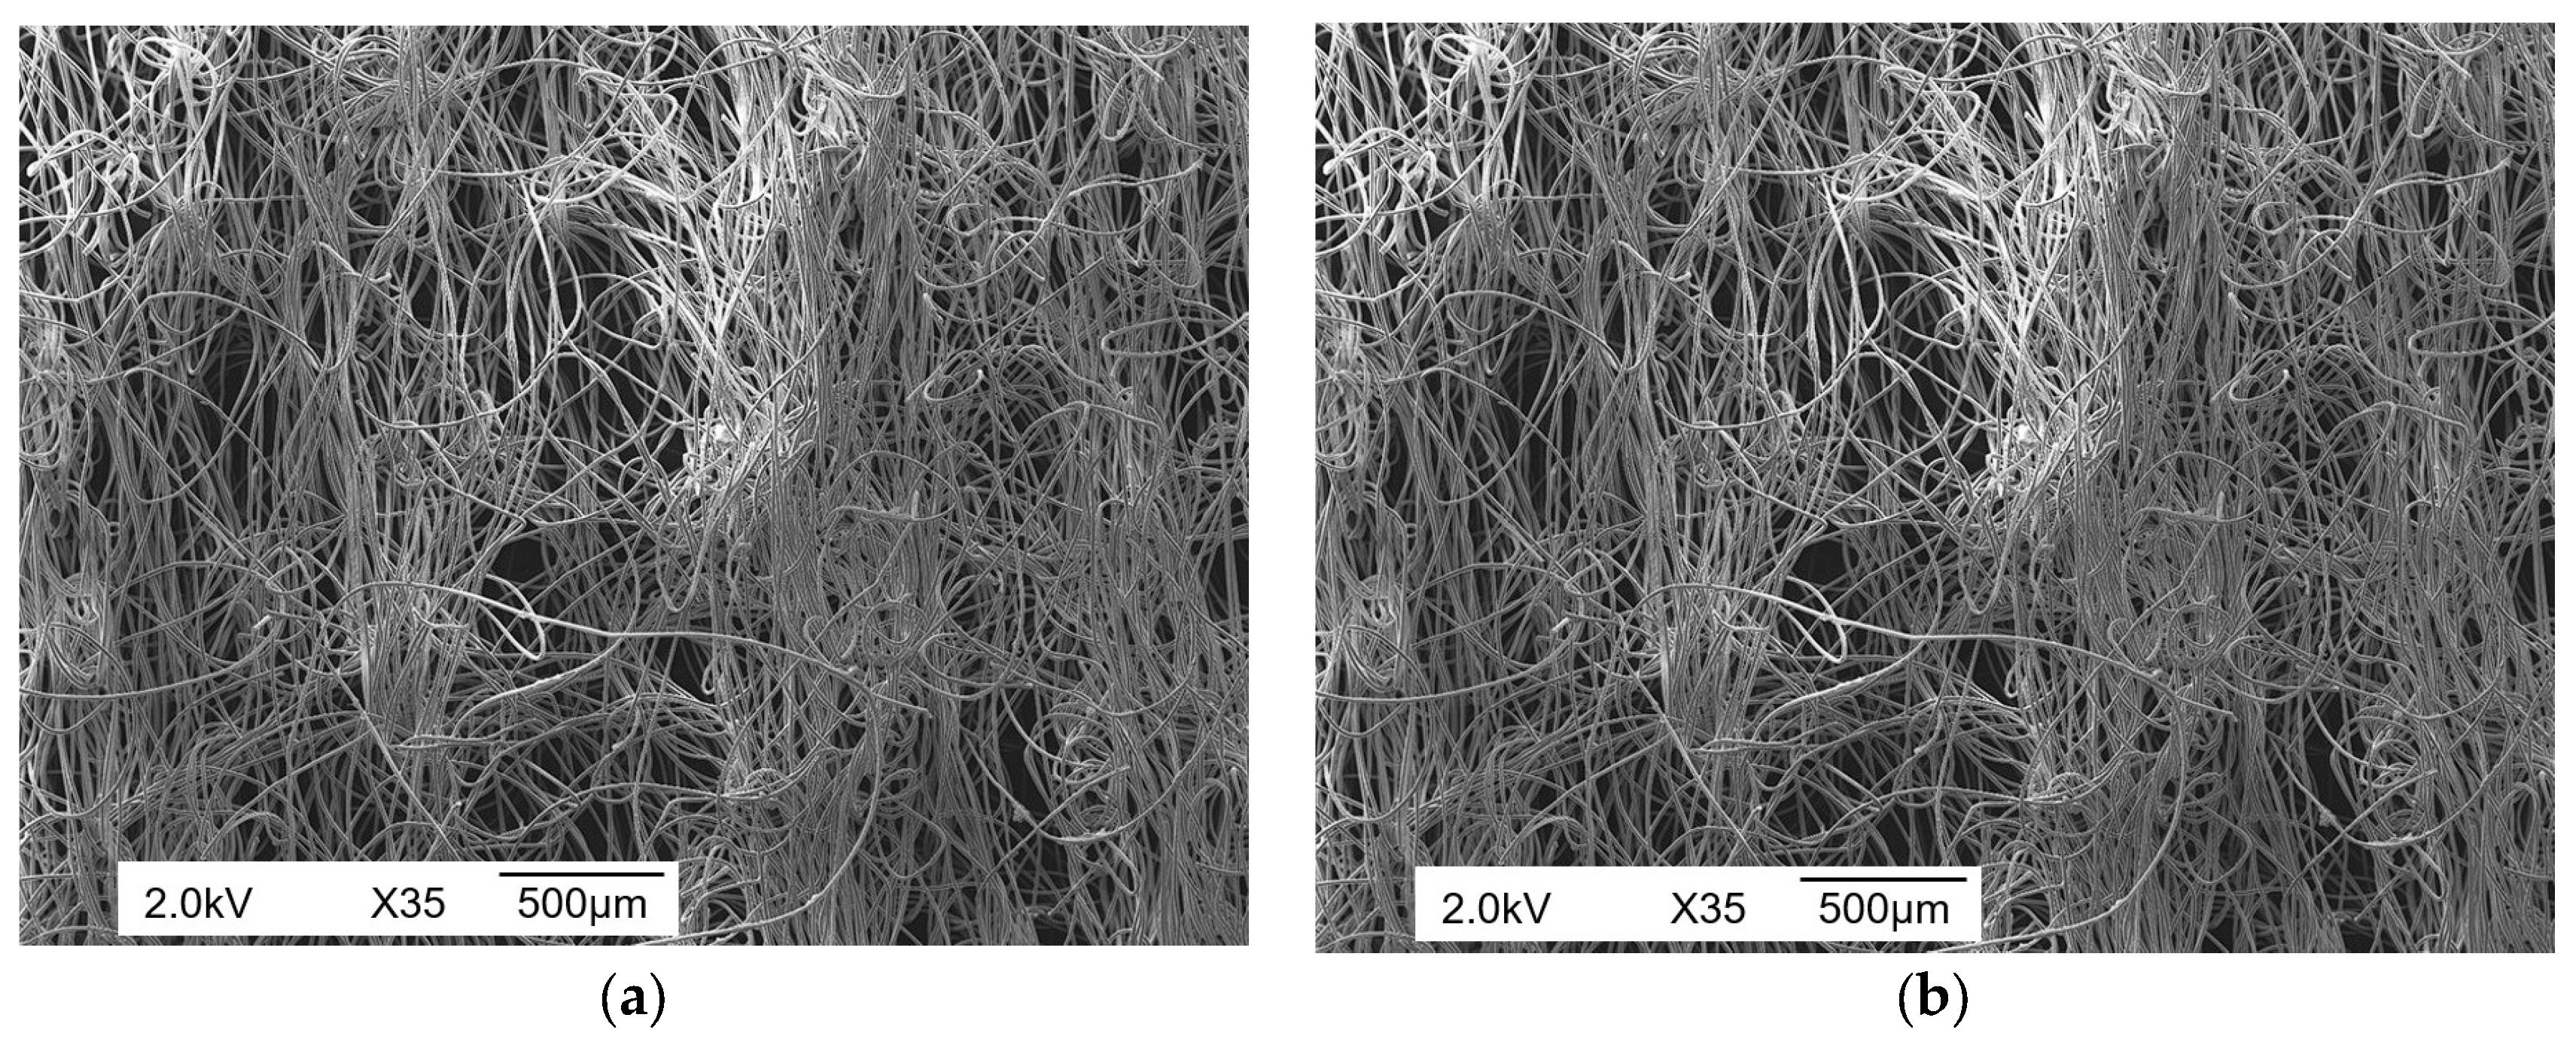
Figure 3.
Digital SEM image of the spunlace non-woven surface: (a) produced by carding machine No. 1; (b) produced by carding machine No. 2.
Figure 3.
Digital SEM image of the spunlace non-woven surface: (a) produced by carding machine No. 1; (b) produced by carding machine No. 2.
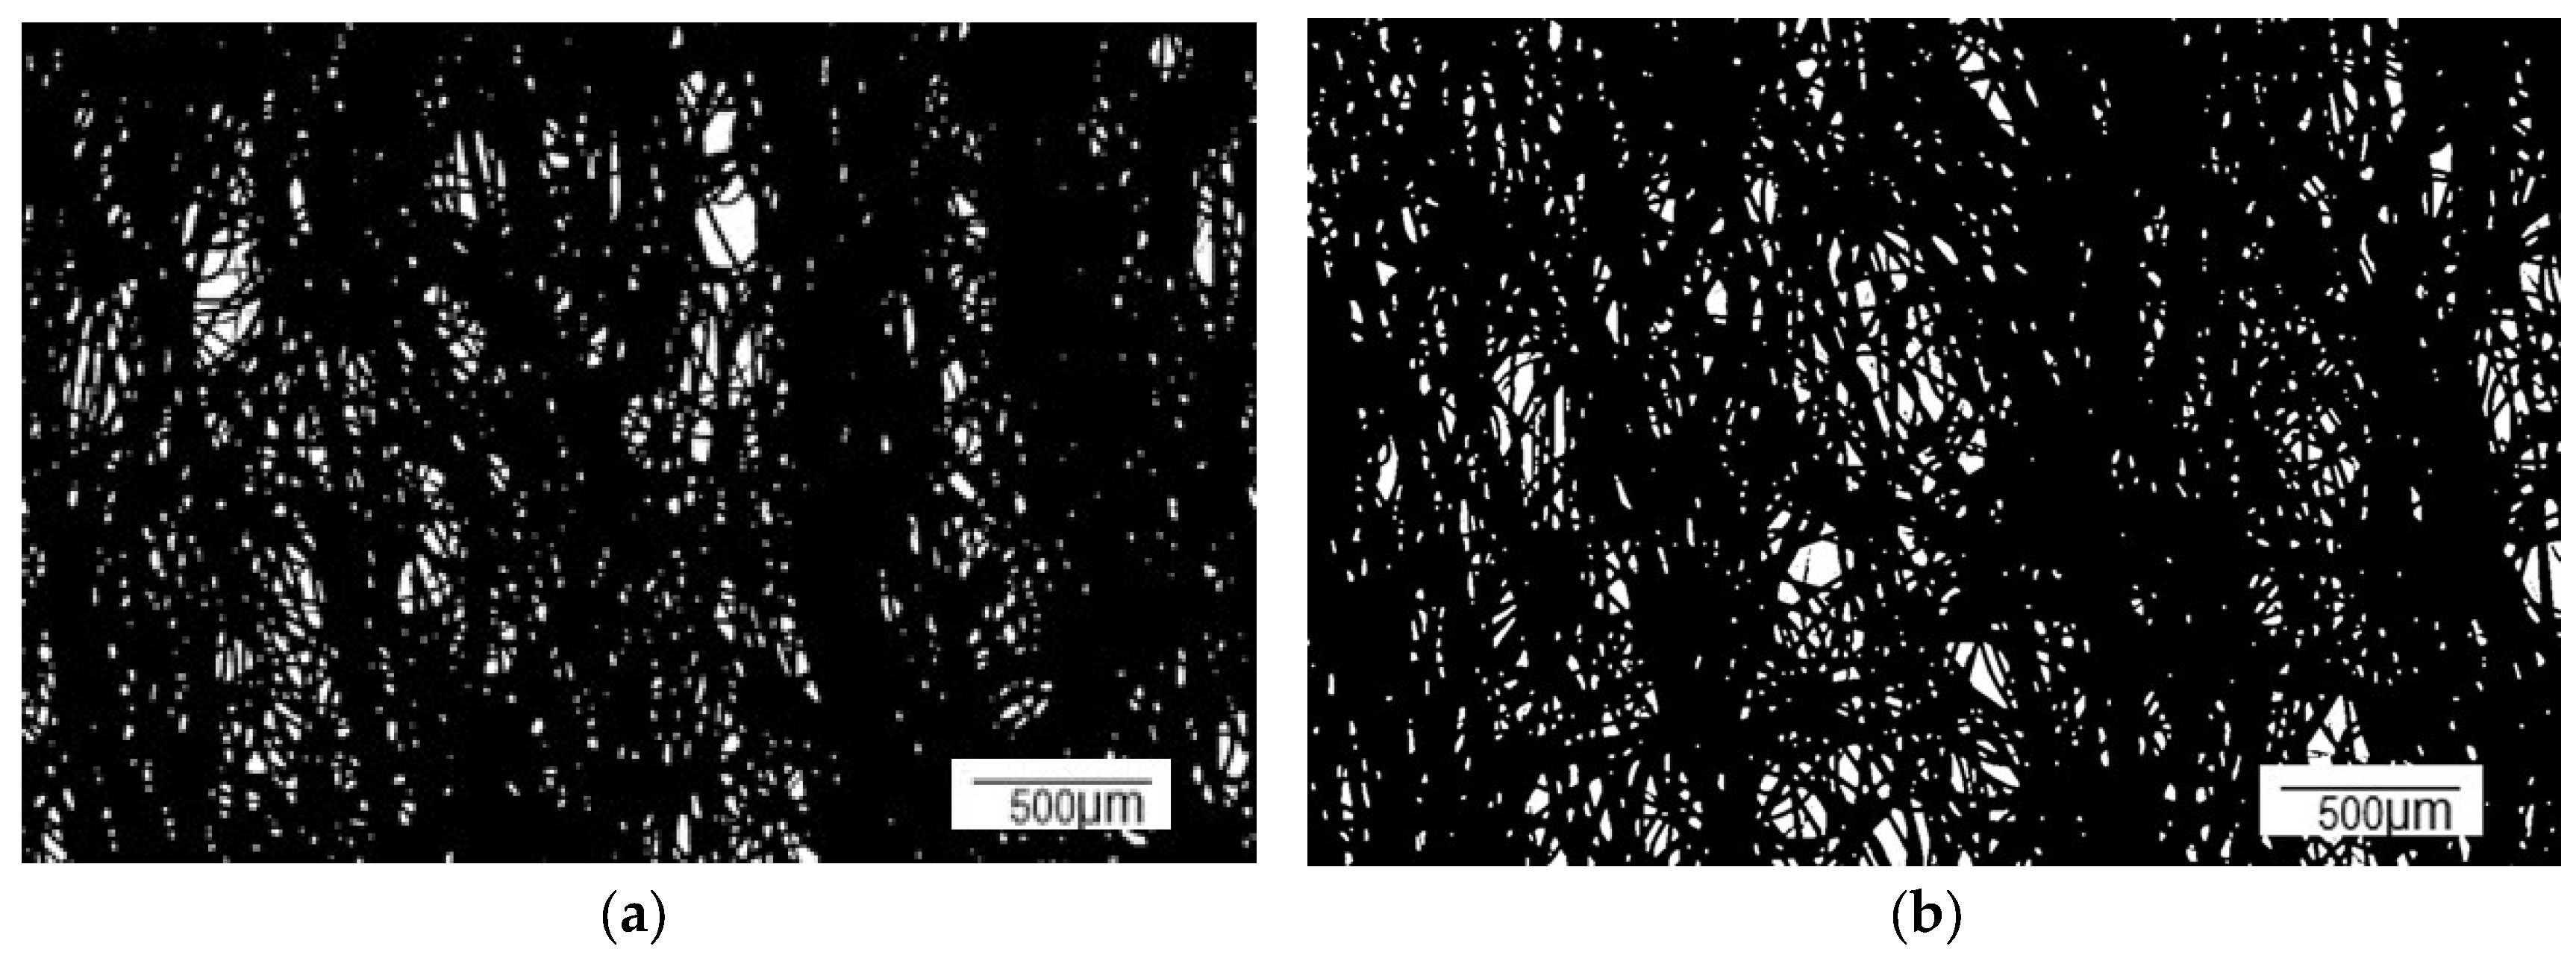
Figure 4.
Image modelling: monochrome image of a non-woven fabric: (a) produced by carding machine No. 1; (b) produced by carding machine No. 2.
Figure 4.
Image modelling: monochrome image of a non-woven fabric: (a) produced by carding machine No. 1; (b) produced by carding machine No. 2.
Figure 5.
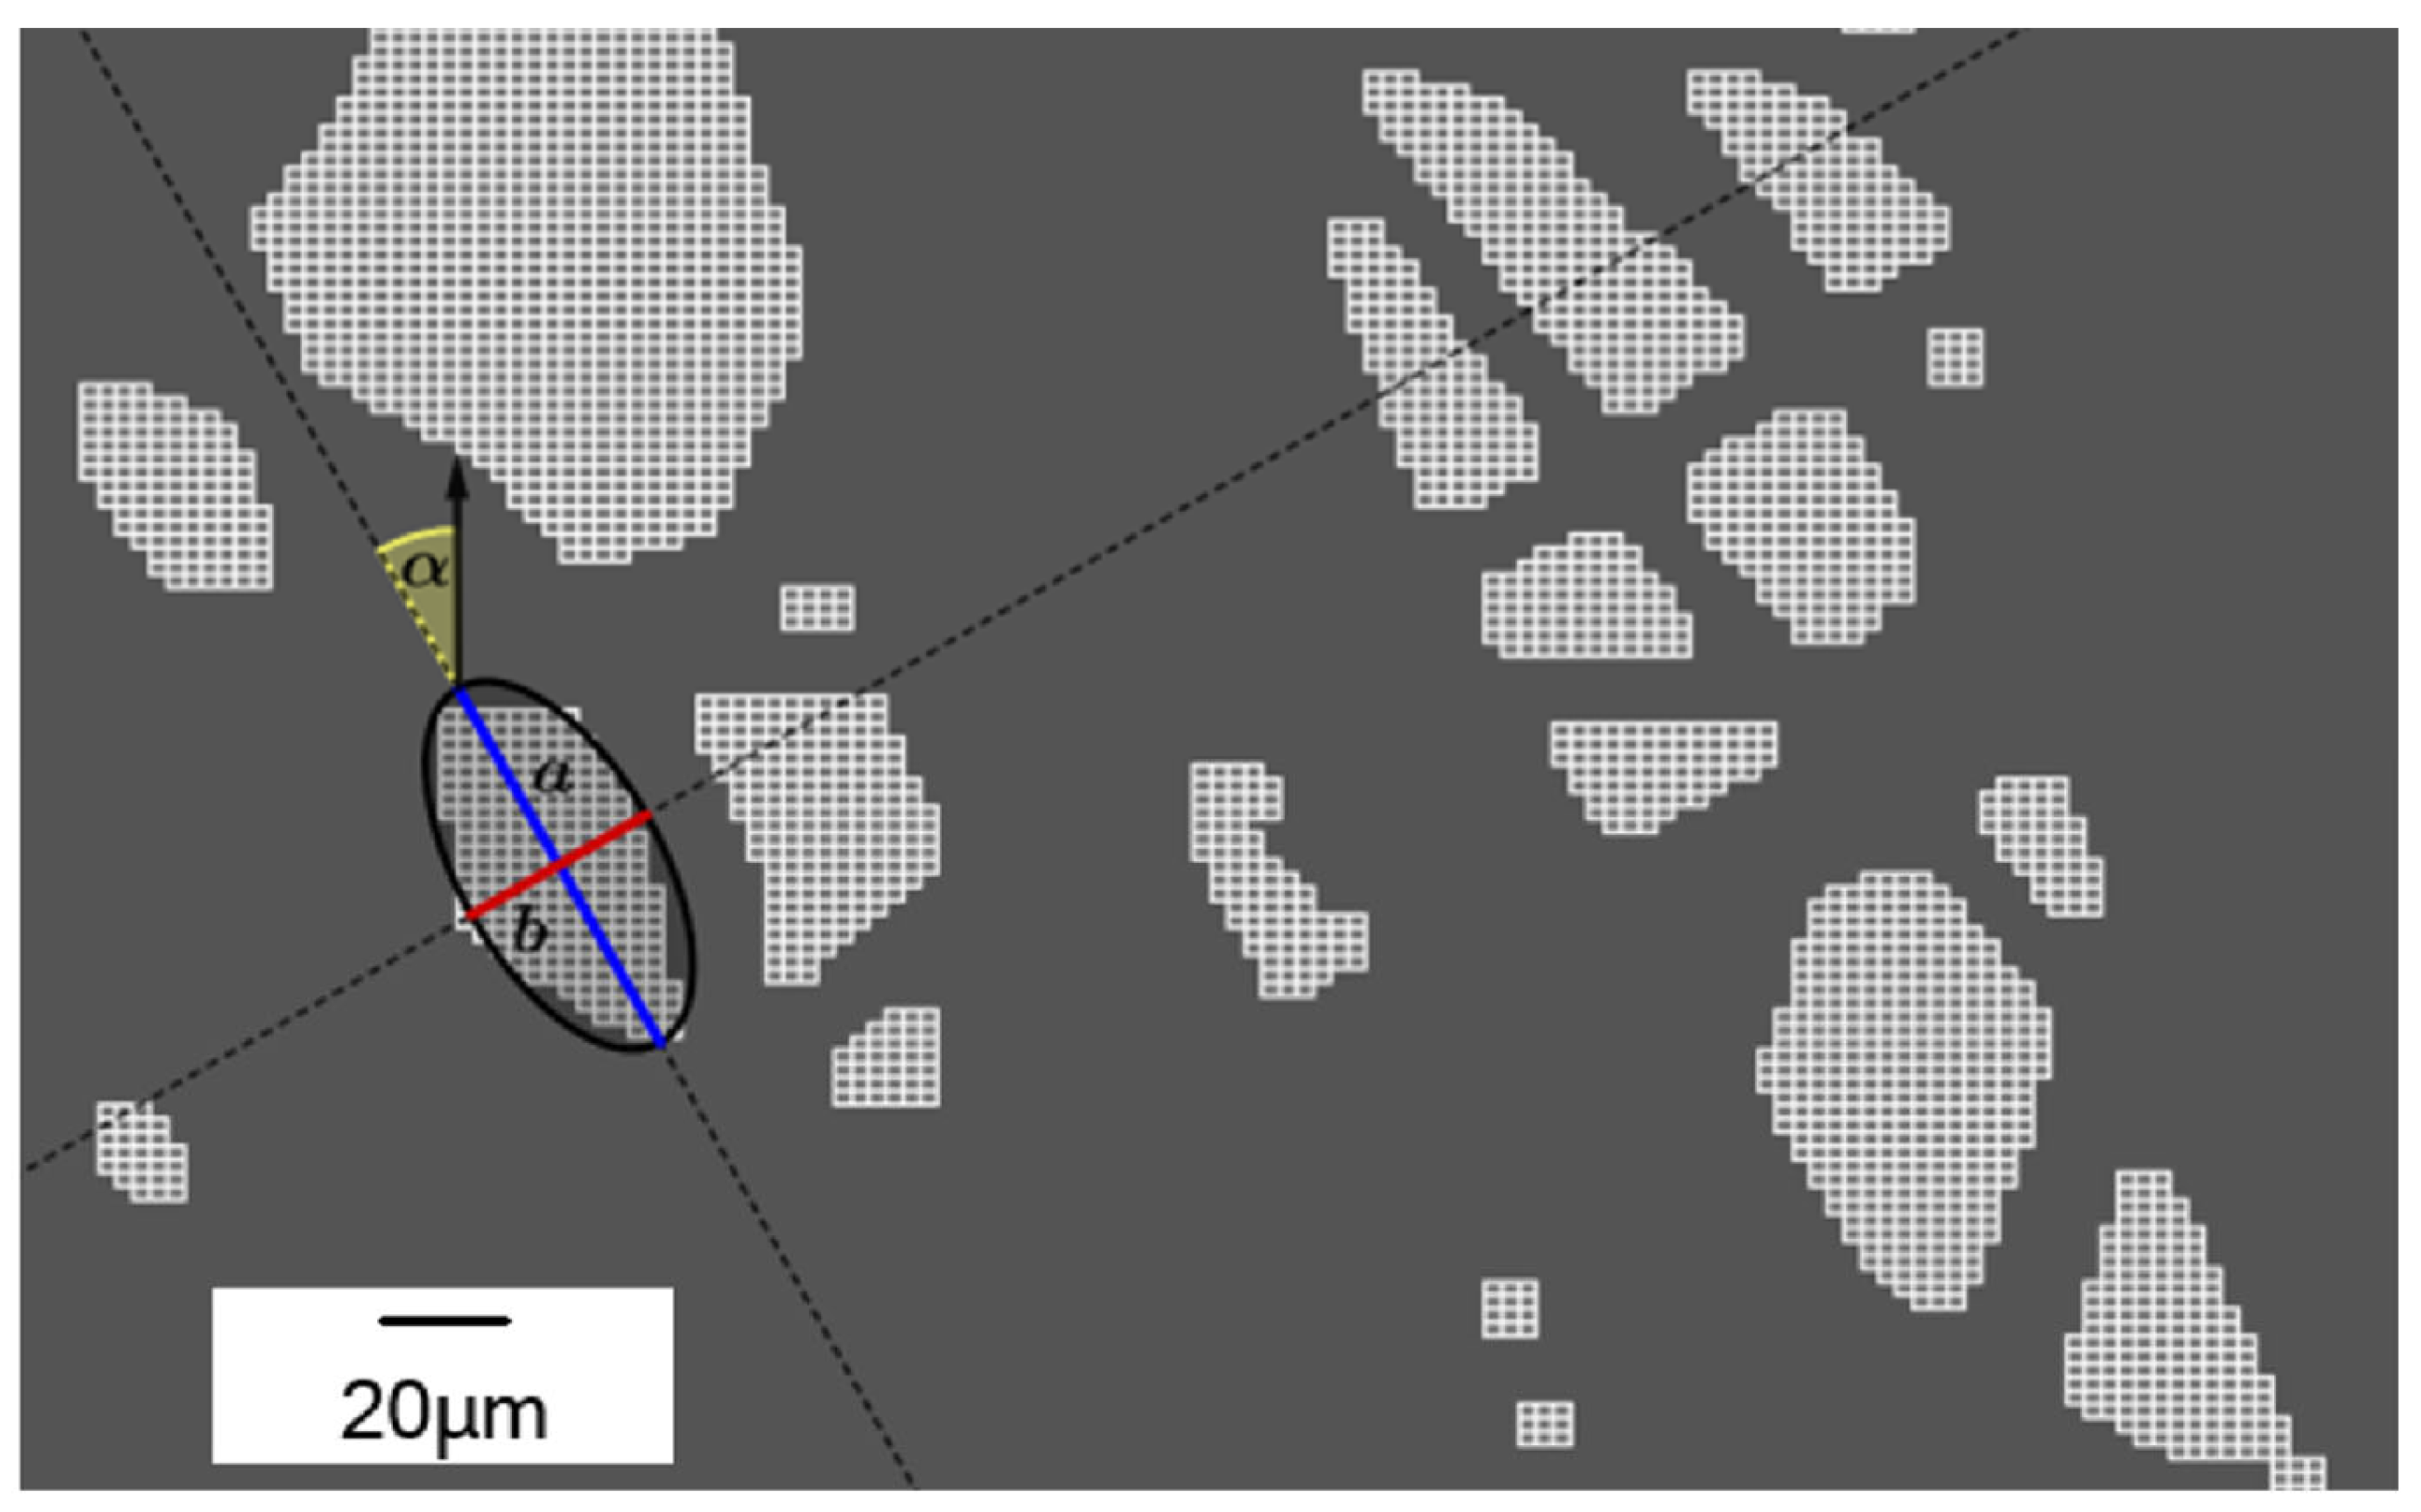
Image modelling: ellipse fitted to a set of pixels (white) with a 95% confidence interval (black). Callouts: blue—the a ellipse major axis; red—the b ellipse minor axis; pale yellow—the α angle of inclination of the ellipse relative to the axis of fibre flow direction in the production process.
Figure 6.
Average tensile strength values in machine direction (a) and cross direction (b) obtained in the spunlace non-woven tensile tests in Test 1 (green) and Test 2 (blue) relative to the width of the production line.
Figure 6.
Average tensile strength values in machine direction (a) and cross direction (b) obtained in the spunlace non-woven tensile tests in Test 1 (green) and Test 2 (blue) relative to the width of the production line.
Figure 7.
Significant differences in the percentage of the number of areas detected in each group in relation to area size and orientation pores for Test 1 (green) and Test 2 (blue).
Figure 7.
Significant differences in the percentage of the number of areas detected in each group in relation to area size and orientation pores for Test 1 (green) and Test 2 (blue).
Table 1.
Parameters of fibres from which the non-woven fabric was fabricated.
Table 1.
Parameters of fibres from which the non-woven fabric was fabricated.
| Fibre Parameter |
Polyester |
Viscose |
| Linear density [dtex] |
1.6 |
1.7 |
| Breaking tenacity [g/dtex] |
6.6 |
2.2 |
| Breaking elongation [%] |
25.0 |
19.5 |
| Cut length [mm] |
38 |
40 |
Table 2.
Groups of pores classified by surface area.
Table 2.
Groups of pores classified by surface area.
| Group Designation |
Pore Surface Area [μm2] |
Type of Area |
| A |
|
large area |
| B |
|
medium area |
| C |
|
small area |
Table 3.
Groups of pores classified according to pore angle.
Table 3.
Groups of pores classified according to pore angle.
| Group Designation |
Pore Angle [°] |
Orientation Type |
| a |
|
vertical orientation |
| b |
|
oblique orientation |
| c |
|
horizontal orientation |
Table 4.
Number of pores and total surface area of the areas detected for Tests 1 and 2.
Table 4.
Number of pores and total surface area of the areas detected for Tests 1 and 2.
| Test 1 |
Test 2 |
| Number of Pores |
|
Number of Pores |
|
| 13,467 |
28.64 |
13,847 |
29.86 |
Table 5.
Number of pores, percentage share, average and total pore surface area for groups A, B and C.
Table 5.
Number of pores, percentage share, average and total pore surface area for groups A, B and C.
| Variable |
Test 1 |
Test 2 |
| Group A |
Group B |
Group C |
Group A |
Group B |
Group C |
| Number of pores [u] |
649.00 |
3993.00 |
8825.00 |
706.00 |
4037.00 |
9104.00 |
| Share [%] |
4.82 |
29.65 |
65.53 |
5.10 |
29.15 |
65.75 |
| Average surface area [ |
7535.89 |
2887.03 |
1384.71 |
7809.93 |
2914.69 |
1381.72 |
| Total surface area |
4.89 |
11.53 |
12.22 |
5.51 |
11.77 |
12.58 |
Table 6.
Number of pores, percentage share, total surface area and average values of pore orientation, eccentricity and flattening for groups a, b and c.
Table 6.
Number of pores, percentage share, total surface area and average values of pore orientation, eccentricity and flattening for groups a, b and c.
| Variable |
Test 1 |
Test 2 |
| Group A |
Group B |
Group C |
Group A |
Group B |
Group C |
| Number of pores [u] |
9114.00 |
2966.00 |
1387.00 |
9640.00 |
3075.00 |
1132.00 |
| Share [%] |
67.68 |
22.02 |
10.30 |
69.62 |
22.21 |
8.18 |
| Total pore surface area |
19.60 |
6.25 |
2.79 |
21.20 |
6.45 |
2.21 |
| Average orientation value [°] |
12.84 |
42.51 |
73.81 |
13.05 |
42.04 |
73.90 |
| Average eccentricity [–] |
0.55 |
0.46 |
0.39 |
0.57 |
0.48 |
0.40 |
| Average flattening value [–] |
0.89 |
0.84 |
0.79 |
0.90 |
0.85 |
0.80 |
Table 7.
Number of pores, average pore surface area, and average values of pore orientation, eccentricity and flattening for groups Aa, Ab, Ac, Ba, Bb, Bc, Ca, Cb and Cc received in Test 1.
Table 7.
Number of pores, average pore surface area, and average values of pore orientation, eccentricity and flattening for groups Aa, Ab, Ac, Ba, Bb, Bc, Ca, Cb and Cc received in Test 1.
| Variable |
Group |
| Aa |
Ab |
Ac |
Ba |
Bb |
Bc |
Ca |
Cb |
Cc |
| Number of pores [u] |
465.00 |
140.00 |
44.00 |
2722.00 |
867.00 |
404.00 |
5927.00 |
1959.00 |
939.00 |
| Average pore surface area [μm2] |
7548.40 |
7494.97 |
7533.85 |
2894.31 |
2876.88 |
2859.70 |
1384.78 |
1381.63 |
1390.72 |
| Average orientation value [°] |
12.07 |
43.91 |
73.41 |
12.65 |
42.14 |
74.11 |
12.98 |
42.58 |
73.69 |
| Average eccentricity [–] |
0.55 |
0.43 |
0.32 |
0.55 |
0.45 |
0.38 |
0.55 |
0.46 |
0.40 |
| Average flattening value [–] |
0.89 |
0.82 |
0.73 |
0.90 |
0.84 |
0.78 |
0.89 |
0.84 |
0.80 |
Table 8.
Number of pores, average pore surface area, and average values of pore orientation, eccentricity and flattening for groups Aa, Ab, Ac, Ba, Bb, Bc, Ca, Cb and Cc received in Test 2.
Table 8.
Number of pores, average pore surface area, and average values of pore orientation, eccentricity and flattening for groups Aa, Ab, Ac, Ba, Bb, Bc, Ca, Cb and Cc received in Test 2.
| Variable |
Group |
| Aa |
Ab |
Ac |
Ba |
Bb |
Bc |
Ca |
Cb |
Cc |
| Number of pores [u] |
521.00 |
140.00 |
45.00 |
2870.00 |
881.00 |
286.00 |
6249.00 |
2054.00 |
801.00 |
| Average pore surface area [μm2] |
7971.13 |
7608.18 |
6571.24 |
2922.86 |
2900.38 |
2876.75 |
1385.22 |
1378.10 |
1363.71 |
| Average orientation value [°] |
13.42 |
41.08 |
74.40 |
12.95 |
41.82 |
73.71 |
13.06 |
42.21 |
73.93 |
| Average eccentricity [–] |
0.56 |
0.47 |
0.34 |
0.57 |
0.48 |
0.39 |
0.57 |
0.48 |
0.41 |
| Average flattening value [–] |
0.90 |
0.85 |
0.75 |
0.90 |
0.86 |
0.79 |
0.90 |
0.85 |
0.81 |
Table 9.
Percentage of the number of detected areas in each group in relation to area size (large, medium and small ones) and pore orientation (vertical, diagonal and horizontal ones).
Table 9.
Percentage of the number of detected areas in each group in relation to area size (large, medium and small ones) and pore orientation (vertical, diagonal and horizontal ones).
| Classification Criterium |
Test No |
Share of the Group [%] |
| Aa |
Ab |
Ac |
Ba |
Bb |
Bc |
Ca |
Cb |
Cc |
| Area size |
1 |
71.65 |
21.57 |
6.78 |
68.17 |
21.71 |
10.12 |
67.16 |
22.20 |
10.64 |
| 2 |
73.80 |
19.83 |
6.37 |
71.09 |
21.82 |
7.08 |
68.64 |
22.56 |
8.80 |
| Pore orientation |
1 |
5.10 |
4.72 |
3.17 |
29.87 |
29.23 |
29.13 |
65.03 |
66.05 |
67.70 |
| 2 |
5.40 |
4.55 |
3.98 |
29.77 |
28.65 |
25.27 |
64.82 |
66.80 |
70.76 |
